| Investment Company Act file number | 811-06623 |
| Registrant’s telephone number, including area code: | (312) 917-7700 |
| Date of fiscal year end: | February 29 |
| Date of reporting period: | February 29, 2024 |
| ITEM 1. | REPORTS TO STOCKHOLDERS. |
 | Closed-End Funds | February 29, 2024 |
| Nuveen Arizona Quality Municipal Income Fund | NAZ | |||
| Nuveen California Quality Municipal Income Fund | NAC | |||
| Nuveen California AMT-Free Quality Municipal Income Fund | NKX | |||
| Nuveen California Municipal Value Fund | NCA | |||
| Nuveen California Select Tax-Free Income Portfolio | NXC | |||

| Important Notices | 3 | |||
| Portfolio Managers’ Comments | 4 | |||
| Fund Leverage | 10 | |||
| Common Share Information | 11 | |||
| About the Funds’ Benchmarks | 13 | |||
| Performance Overview and Holding Summaries | 14 | |||
| Report of Independent Registered Public Accounting Firm | 25 | |||
| Portfolios of Investments | 27 | |||
| Statement of Assets and Liabilities | 72 | |||
| Statement of Operations | 73 | |||
| Statement of Changes in Net Assets | 74 | |||
| Statement of Cash Flows | 77 | |||
| Financial Highlights | 78 | |||
| Notes to Financial Statements | 83 | |||
| Shareholder Update | 97 | |||
| Important Tax Information | 126 | |||
| Shareholder Meeting Report | 127 | |||
| Additional Fund Information | 128 | |||
| Glossary of Terms Used in this Report | 129 | |||
| Board Members & Officers | 130 | |||
NAZ | NAC | NKX | NCA | NXC | ||||||||||||||||
Effective Leverage * | 37.54% | 39.80% | 40.48% | 0.00% | 0.00% | |||||||||||||||
Regulatory Leverage * | 37.54% | 38.92% | 38.54% | 0.00% | 0.00% | |||||||||||||||
| * | Effective Leverage is a Fund’s effective economic leverage, and includes both regulatory leverage and the leverage effects of certain derivative and other investments in a Fund’s portfolio that increase the Fund’s investment exposure. Currently, the leverage effects of Tender Option Bond (TOB) inverse floater holdings are included in effective leverage values, in addition to any regulatory leverage. Regulatory leverage consists of preferred shares issued or borrowings of a Fund. Both of these are part of a Fund’s capital structure. A Fund, however, may from time to time borrow on a typically transient basis in connection with its day-to-day |
Variable Rate Preferred* | Variable Rate Remarketed Preferred** | |||||||||||
Fund | Shares Issued at Liquidation Preference | Shares Issued at Liquidation Preference | Total | |||||||||
| NAZ | $88,300,000 | $ - | $88,300,000 | |||||||||
| NAC | $684,900,000 | $497,900,000 | $1,182,800,000 | |||||||||
| NKX | $ - | $397,100,000 | $397,100,000 | |||||||||
Per Common Share Amounts | ||||||||||||||||||||
Monthly Distributions (Ex-Dividend Date) | NAZ | NAC | NKX | NCA | NXC | |||||||||||||||
| March | $ | 0.0325 | $ | 0.0360 | $ | 0.0415 | $ | 0.0290 | $ | 0.0435 | ||||||||||
| April | 0.0325 | 0.0360 | 0.0415 | 0.0290 | 0.0435 | |||||||||||||||
| May | 0.0325 | 0.0360 | 0.0415 | 0.0290 | 0.0435 | |||||||||||||||
| June | 0.0325 | 0.0360 | 0.0415 | 0.0290 | 0.0435 | |||||||||||||||
| July | 0.0310 | 0.0360 | 0.0415 | 0.0290 | 0.0435 | |||||||||||||||
| August | 0.0310 | 0.0360 | 0.0415 | 0.0290 | 0.0435 | |||||||||||||||
| September | 0.0310 | 0.0360 | 0.0415 | 0.0290 | 0.0435 | |||||||||||||||
| October | 0.0310 | 0.0360 | 0.0415 | 0.0290 | 0.0435 | |||||||||||||||
| November | 0.0350 | 0.0435 | 0.0455 | 0.0290 | 0.0435 | |||||||||||||||
| December | 0.0350 | 0.0435 | 0.0455 | 0.0290 | 0.0455 | |||||||||||||||
| January | 0.0350 | 0.0435 | 0.0455 | 0.0290 | 0.0455 | |||||||||||||||
| February | 0.0350 | 0.0435 | 0.0455 | 0.0290 | 0.0455 | |||||||||||||||
Total Distributions from Net Investment Income | $ | 0.3940 | $ | 0.4620 | $ | 0.5140 | $ | 0.3480 | $ | 0.5280 | ||||||||||
Yields | NAZ | NAC | NKX | NCA | NXC | |||||||||||||||
Market Yield 1 | 3.88% | 4.76% | 4.76% | 3.97% | 4.16% | |||||||||||||||
Taxable-Equivalent Yield 1 | 6.84% | 10.33% | 10.36% | 8.63% | 9.06% | |||||||||||||||
| 1 | Market Yield is based on the Fund’s current annualized monthly distribution divided by the Fund’s current market price as of the end of the reporting period. Taxable-Equivalent Yield represents the yield that must be earned on a fully taxable investment in order to equal the yield of the Fund on an after-tax basis. It is based on a combined federal and state income tax rate of 43.3% for NAZ and 54.1% for NAC, NKX, NCA, and NXC, respectively. Your actual combined federal and state income tax rate may differ from the assumed rate. The Taxable-Equivalent Yield also takes into account the percentage of the Fund’s income generated and paid by the Fund (based on payments made during the previous calendar year) that was either exempt from federal income tax but not from state income tax (e.g., income from anout-of-state |
NXC* | ||||
| Maximum aggregate offering | 1,300,000 | |||
| * | Represents additional authorized shares for the period August 4, 2023 through February 29, 2024. |
NAZ | NAC | NKX | NCA | NXC | ||||||||||||||||
| Common shares repurchased and retired | 133,000 | 383,000 | 230,000 | - | - | |||||||||||||||
| Common shares authorized for repurchase | 1,155,000 | 14,470,000 | 4,750,000 | 3,310,000 | 635,000 | |||||||||||||||
NAZ | NAC | |||||||
| Common shares repurchased and retired | 5,500 | 13,000 | ||||||
| Weighted average price per common share repurchased and retired | $ 9.94 | $ 9.96 | ||||||
| Weighted average discount per common share repurchased and retired | (16.65)% | (16.91)% | ||||||
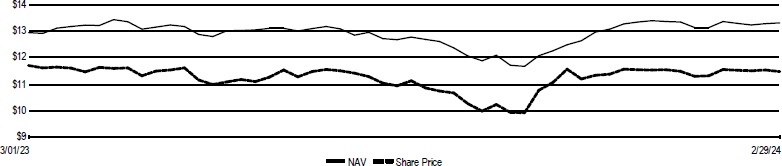
NAZ | NAC | NKX | NCA | NXC | ||||||||||||||||
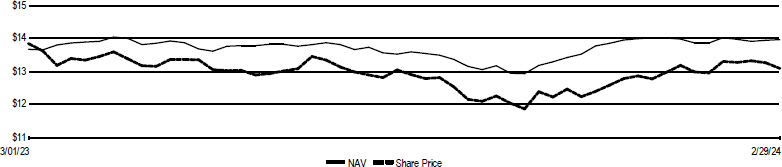
| Common share NAV | $12.68 | $12.83 | $13.33 | $9.40 | $13.98 | |||||||||||||||
| Common share price | $10.83 | $10.97 | $11.48 | $8.77 | $13.11 | |||||||||||||||
| Premium/(Discount) to NAV | (14.59)% | (14.50)% | (13.88)% | (6.70)% | (6.22)% | |||||||||||||||
| Average premium/(discount) to NAV | (14.37)% | (14.86)% | (13.24)% | (6.28)% | (5.61)% | |||||||||||||||
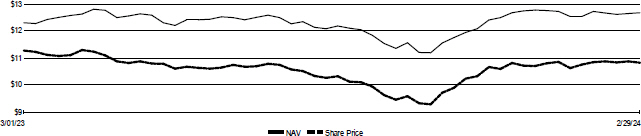
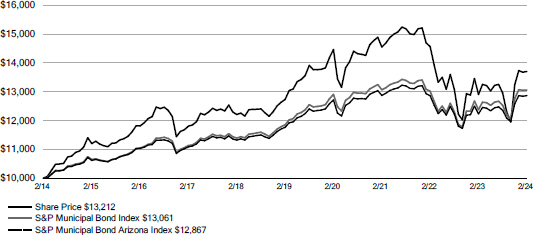
| NAZ | Nuveen Arizona Quality Municipal Income Fund Performance Overview and Holding Summaries as of February 29, 2024 |
Total Returns as of February 29, 2024 | ||||||||
Average Annual | ||||||||
Inception Date | 1-Year | 5-Year | 10-Year | |||||
| NAZ at Common Share NAV | 11/19/92 | 6.17% | 1.48% | 3.20% | ||||
| NAZ at Common Share Price | 11/19/92 | (0.56)% | 1.15% | 2.82% | ||||
| S&P Municipal Bond Index | – | 5.50% | 1.97% | 2.71% | ||||
| S&P Municipal Bond Arizona Index | – | 5.17% | 1.81% | 2.55% | ||||
Fund Allocation (% of net assets) | ||
| Municipal Bonds | 158.4% | |
| Other Assets & Liabilities, Net | 1.7% | |
| AMTP Shares, Net | (60.1)% | |
Net Assets | 100% | |
Portfolio Credit Quality (% of total investment exposure) | ||
| U.S. Guaranteed | 0.6% | |
| AAA | 9.1% | |
| AA | 54.2% | |
| A | 17.2% | |
| BBB | 2.4% | |
| BB or Lower | 5.7% | |
| N/R (not rated) | 10.8% | |
Total | 100% | |
Portfolio Composition 1 (% of total investments) | ||
| Tax Obligation/Limited | 26.9% | |
| Education and Civic Organizations | 21.1% | |
| Utilities | 16.1% | |
| Health Care | 12.7% | |
| Tax Obligation/General | 12.1% | |
| Transportation | 4.7% | |
| U.S. Guaranteed | 2.1% | |
| Long-Term Care | 2.0% | |
| Other | 2.3% | |
Total | 100% | |
States and Territories 2 (% of total municipal bonds) | ||
| Arizona | 94.2% | |
| Puerto Rico | 3.6% | |
| Guam | 1.9% | |
| Virgin Islands | 0.3% | |
Total | 100% | |
| 1 | See the Portfolio of Investments for the remaining industries/sectors comprising “Other” and not listed in the table above. |
| 2 | The Fund may invest up to 20% of its net assets in municipal bonds that are exempt from regular federal income tax, but not from Arizona personal income tax if, in the judgement of the Fund’s sub-adviser, such purchases are expected to enhance the Fund’safter-tax total return potential. |
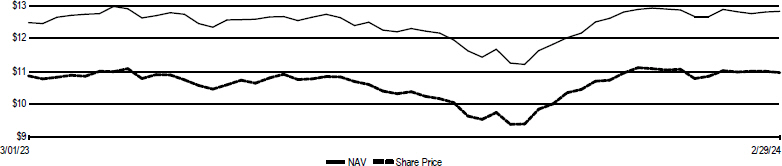
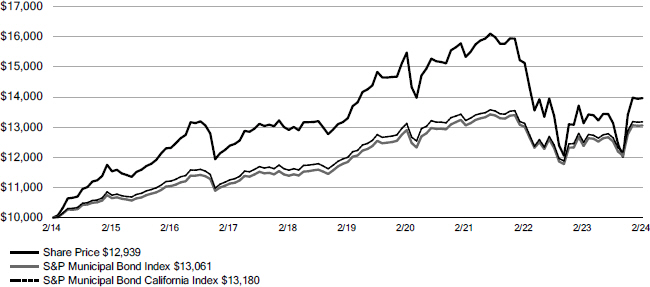
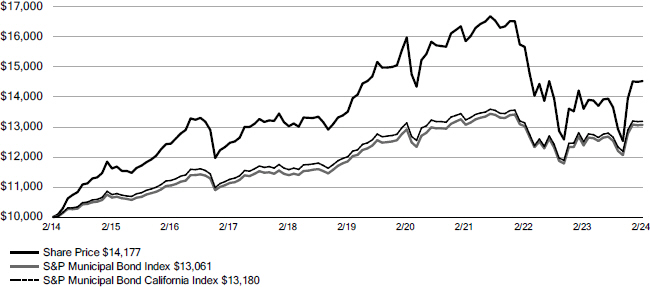
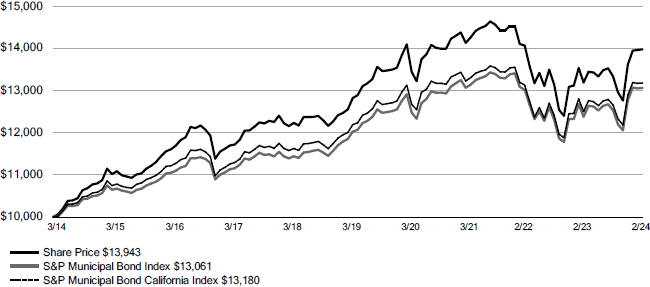
| NAC | Nuveen California Quality Municipal Income Fund | |
Performance Overview and Holding Summaries as of February 29, 2024 |
Total Returns as of February 29, 2024 | ||||||||||||||||
Average Annual | ||||||||||||||||
Inception Date | 1-Year | 5-Year | 10-Year | |||||||||||||
| NAC at Common Share NAV | 5/26/99 | 6.34% | 0.99% | 3.40% | ||||||||||||
| NAC at Common Share Price | 5/26/99 | 5.39% | 0.59% | 2.61% | ||||||||||||
| S&P Municipal Bond Index | – | 5.50% | 1.97% | 2.71% | ||||||||||||
| S&P Municipal Bond California Index | – | 5.41% | 1.89% | 2.80% | ||||||||||||
Fund Allocation (% of net assets) | ||||
| Municipal Bonds | 163.7% | |||
| Short-Term Municipal Bonds | 1.1% | |||
| Other Assets & Liabilities, Net | 1.2% | |||
| Floating Rate Obligations | (2.4)% | |||
| MFP Shares, Net | (14.8)% | |||
| VRDP Shares, Net | (48.8)% | |||
Net Assets | 100% | |||
Portfolio Credit Quality (% of total investment exposure) | ||||
| U.S. Guaranteed | 6.1% | |||
| AAA | 5.3% | |||
| AA | 39.4% | |||
| A | 23.9% | |||
| BBB | 7.5% | |||
| BB or Lower | 3.4% | |||
| N/R (not rated) | 14.4% | |||
Total | 100% | |||
Portfolio Composition 1 (% of total investments) | ||||
| Utilities | 18.1% | |||
| Tax Obligation/General | 16.6% | |||
| Transportation | 16.4% | |||
| Health Care | 15.7% | |||
| Tax Obligation/Limited | 10.7% | |||
| Housing/Multifamily | 10.4% | |||
| U.S. Guaranteed | 6.7% | |||
| Other | 5.4% | |||
Total | 100% | |||
States and Territories 2 (% of total municipal bonds) | ||||
| California | 95.2% | |||
| Puerto Rico | 4.1% | |||
| Guam | 0.7% | |||
| Virgin Islands | 0.0% | |||
Total | 100% | |||
| 1 | See the Portfolio of Investments for the remaining industries/sectors comprising “Other” and not listed in the table above. |
| 2 | The Fund may invest up to 20% of its net assets in municipal bonds that are exempt from regular federal income tax, but not from California personal income tax if, in the judgement of the Fund’s sub-adviser, such purchases are expected to enhance the Fund’safter-tax total return potential. |
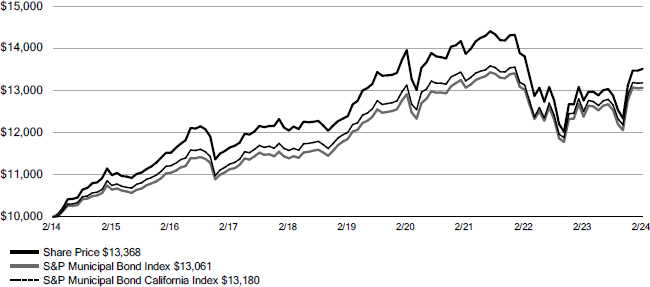
| NKX | Nuveen California AMT-Free Quality Municipal Income Fund | |
Performance Overview and Holding Summaries as of February 29, 2024 |
Total Returns as of February 29, 2024 | ||||||||||||||||
Average Annual | ||||||||||||||||
Inception Date | 1-Year | 5-Year | 10-Year | |||||||||||||
| NKX at Common Share NAV | 11/21/02 | 6.77% | 1.46% | 3.80% | ||||||||||||
| NKX at Common Share Price | 11/21/02 | 2.54% | 1.15% | 3.55% | ||||||||||||
| S&P Municipal Bond Index | – | 5.50% | 1.97% | 2.71% | ||||||||||||
| S&P Municipal Bond California Index | – | 5.41% | 1.89% | 2.80% | ||||||||||||
Fund Allocation (% of net assets) | ||||
| Municipal Bonds | 163.1% | |||
| Short-Term Municipal Bonds | 3.5% | |||
| Other Assets & Liabilities, Net | 1.2% | |||
| Floating Rate Obligations | (5.3)% | |||
| MFP Shares, Net | (22.1)% | |||
| VRDP Shares, Net | (40.4)% | |||
Net Assets | 100% | |||
Portfolio Credit Quality (% of total investment exposure) | ||||
| U.S. Guaranteed | 7.2% | |||
| AAA | 4.1% | |||
| AA | 42.1% | |||
| A | 18.2% | |||
| BBB | 8.6% | |||
| BB or Lower | 3.5% | |||
| N/R (not rated) | 16.3% | |||
Total | 100% | |||
Portfolio Composition 1 (% of total investments) | ||||
| Tax Obligation/General | 22.4% | |||
| Health Care | 19.6% | |||
| Utilities | 14.3% | |||
| Tax Obligation/Limited | 13.9% | |||
| Housing/Multifamily | 10.4% | |||
| Transportation | 8.1% | |||
| U.S. Guaranteed | 7.1% | |||
| Other | 4.2% | |||
Total | 100% | |||
States and Territories 2 (% of total municipal bonds) | ||||
| California | 92.6% | |||
| Puerto Rico | 5.8% | |||
| Guam | 1.1% | |||
| Virgin Islands | 0.4% | |||
| New York | 0.1% | |||
Total | 100% | |||
| 1 | See the Portfolio of Investments for the remaining industries/sectors comprising “Other” and not listed in the table above. |
| 2 | The Fund may invest up to 20% of its net assets in municipal bonds that are exempt from regular federal income tax, but not from California personal income tax if, in the judgement of the Fund’s sub-adviser, such purchases are expected to enhance the Fund’safter-tax total return potential. |
| NCA | Nuveen California Municipal Value Fund | |
Performance Overview and Holdings Summaries February 29, 2024 |
Total Returns as of February 29, 2024 | ||||||||||||||||
Average Annual | ||||||||||||||||
Inception Date | 1-Year | 5-Year | 10-Year | |||||||||||||
| NCA at Common Share NAV | 10/07/87 | 5.87% | 1.75% | 3.06% | ||||||||||||
| NCA at Common Share Price | 10/07/87 | 4.70% | 1.97% | 2.95% | ||||||||||||
| S&P Municipal Bond Index | – | 5.50% | 1.97% | 2.71% | ||||||||||||
| S&P Municipal Bond California Index | – | 5.41% | 1.89% | 2.80% | ||||||||||||

Fund Allocation (% of net assets) | ||||
| Municipal Bonds | 96.1% | |||
| Short-Term Municipal Bonds | 3.2% | |||
| Other Assets & Liabilities, Net | 0.7% | |||
Net Assets | 100% | |||
Portfolio Credit Quality (% of total investment exposure) | ||||
| U.S. Guaranteed | 1.1% | |||
| AAA | 7.6% | |||
| AA | 47.1% | |||
| A | 23.6% | |||
| BBB | 6.0% | |||
| BB or Lower | 2.7% | |||
| N/R (not rated) | 11.9% | |||
Total | 100% | |||
Portfolio Composition 1 (% of total investments) | ||||
| Tax Obligation/General | 24.6% | |||
| Utilities | 22.0% | |||
| Transportation | 18.2% | |||
| Health Care | 11.6% | |||
| Tax Obligation/Limited | 9.5% | |||
| Housing/Multifamily | 9.1% | |||
| Education and Civic Organizations | 3.2% | |||
| Other | 1.8% | |||
Total | 100% | |||
States and Territories 2 (% of total municipal bonds) | ||||
| California | 96.9% | |||
| Puerto Rico | 3.1% | |||
Total | 100% | |||
| 1 | See the Portfolio of Investments for the remaining industries/sectors comprising “Other” and not listed in the table above. |
| 2 | The Fund may invest up to 20% of its net assets in municipal bonds that are exempt from regular federal income tax, but not from California personal income tax if, in the judgement of the Fund’s sub-adviser, such purchases are expected to enhance the Fund’safter-tax total return potential. |
| NXC | Nuveen California Select Tax-Free Income Portfolio | |
Performance Overview and Holding Summaries as of February 29, 2024 |
Total Returns as of February 29, 2024 | ||||||||||||||||
Average Annual | ||||||||||||||||
Inception Date | 1-Year | 5-Year | 10-Year | |||||||||||||
| NXC at Common Share NAV | 6/19/92 | 5.96% | 2.17% | 3.41% | ||||||||||||
| NXC at Common Share Price | 6/19/92 | (1.69)% | 2.47% | 3.38% | ||||||||||||
| S&P Municipal Bond Index | – | 5.50% | 1.97% | 2.71% | ||||||||||||
| S&P Municipal Bond California Index | – | 5.41% | 1.89% | 2.80% | ||||||||||||
Fund Allocation (% of net assets) | ||||
| Municipal Bonds | 98.1% | |||
| Short-Term Municipal Bonds | 1.1% | |||
| Other Assets & Liabilities, Net | 0.8% | |||
Net Assets | 100% | |||
Portfolio Credit Quality (% of total investment exposure) | ||||
| U.S. Guaranteed | 7.1% | |||
| AAA | 7.3% | |||
| AA | 45.3% | |||
| A | 23.1% | |||
| BBB | 4.4% | |||
| BB or Lower | 2.0% | |||
| N/R (not rated) | 10.8% | |||
Total | 100% | |||
Portfolio Composition 1 (% of total investments) | ||||
| Tax Obligation/General | 25.5% | |||
| Utilities | 21.6% | |||
| Transportation | 13.0% | |||
| Health Care | 12.5% | |||
| Tax Obligation/Limited | 11.0% | |||
| Housing/Multifamily | 8.7% | |||
| U.S. Guaranteed | 7.0% | |||
| Other | 0.7% | |||
Total | 100% | |||
States and Territories 2 (% of total municipal bonds) | ||||
| California | 97.7 | % | ||
| Puerto Rico | 2.3 | % | ||
Total | 100 | % | ||
| 1 | See the Portfolio of Investments for the remaining industries/sectors comprising “Other” and not listed in the table above. |
| 2 | The Fund may invest up to 20% of its net assets in municipal bonds that are exempt from regular federal income tax, but not from California personal income tax if, in the judgement of the Fund’s sub-adviser, such purchases are expected to enhance the Fund’safter-tax total return potential. |
| NAZ | Nuveen Arizona Quality Municipal Income Fund Portfolio of Investments February 29, 2024 |
Principal Amount (000) | Description (a) | Optional Call Provisions (b) | Value | |||||||||
LONG-TERM INVESTMENTS - 158.4% (100.0% of Total Investments) | ||||||||||||
MUNICIPAL BONDS - 158.4% (100.0% of Total Investments) | ||||||||||||
Education and Civic Organizations - 33.4% (21.1% of Total Investments) | ||||||||||||
| $ | 2,175 | Arizona Board of Regents, Arizona State University System Revenue Bonds, Green Series 2016B, 5.000%, 7/01/47 | 7/26 at 100.00 | $ | 2,221,694 | |||||||
| 1,500 | Arizona Board of Regents, Arizona State University System Revenue Bonds, Refunding Green Series 2015A, 5.000%, 7/01/41 | 7/25 at 100.00 | 1,533,154 | |||||||||
| 1,500 | Arizona Board of Regents, Arizona State University System Revenue Bonds, Series 2015D, 5.000%, 7/01/41 | 7/25 at 100.00 | 1,530,803 | |||||||||
| 2,030 | Arizona Board of Regents, Arizona State University System Revenue Bonds, Series 2020B, 4.000%, 7/01/47 | 7/30 at 100.00 | 2,037,247 | |||||||||
| 2,515 | Arizona Board of Regents, University of Arizona, SPEED Revenue Bonds, Stimulus Plan for Economic and Educational Development, Series 2014, 5.000%, 8/01/44 | 8/24 at 100.00 | 2,524,175 | |||||||||
| 1,000 | Arizona Board of Regents, University of Arizona, System Revenue Bonds, Refunding Series 2021A, 5.000%, 6/01/42 | 6/31 at 100.00 | 1,113,234 | |||||||||
| 515 | Arizona Industrial Development Authority, Arizona, Education Facility Revenue Bonds, Basis Schools, Inc. Projects, Series 2017A, 5.125%, 7/01/37, 144A | 7/26 at 100.00 | 518,493 | |||||||||
| 525 | Arizona Industrial Development Authority, Arizona, Education Facility Revenue Bonds, Basis Schools, Inc. Projects, Series 2017C, 5.000%, 7/01/47 | 7/27 at 100.00 | 534,452 | |||||||||
| 250 | Arizona Industrial Development Authority, Arizona, Education Facility Revenue Bonds, Basis Schools, Inc. Projects, Series 2017D, 5.000%, 7/01/47, 144A | 7/27 at 100.00 | 238,718 | |||||||||
| Arizona Industrial Development Authority, Arizona, Education Facility Revenue Bonds, Basis Schools, Inc. Projects, Series 2017F: | ||||||||||||
| 1,700 | 5.000%, 7/01/37 | 7/27 at 100.00 | 1,765,002 | |||||||||
| 1,645 | 5.000%, 7/01/47 | 7/27 at 100.00 | 1,674,616 | |||||||||
| 380 | Arizona Industrial Development Authority, Arizona, Education Facility Revenue Bonds, Basis Schools, Inc. Projects, Series 2017G, 5.000%, 7/01/47, 144A | 7/27 at 100.00 | 362,851 | |||||||||
| 240 | Arizona Industrial Development Authority, Arizona, Education Facility Revenue Bonds, Montessori Academy Projects, Refunding Series 2017A, 6.250%, 11/01/50, 144A | 11/27 at 100.00 | 202,936 | |||||||||
| 420 | Arizona Industrial Development Authority, Arizona, Education Facility Revenue Bonds, Somerset Academy of Las Vegas Aliante and Skye Canyon Campus Projects, Series 2021A, 4.000%, 12/15/41, 144A | 12/29 at 100.00 | 356,302 | |||||||||
| 375 | Arizona Industrial Development Authority, Arizona, Education Revenue Bonds, Arizona Agribusiness and Equine Center, Inc. Project, Series 2017B, 5.000%, 3/01/48, 144A | 9/27 at 100.00 | 344,572 | |||||||||
| 190 | Arizona Industrial Development Authority, Arizona, Education Revenue Bonds, Academies of Math & Science Projects, Series 2017B, 4.250%, 7/01/27, 144A | No Opt. Call | 188,596 | |||||||||
| Arizona Industrial Development Authority, Arizona, Education Revenue Bonds, Academies of Math & Science Projects, Series 2018A: | ||||||||||||
| 615 | 5.000%, 7/01/38 | 1/28 at 100.00 | 634,430 | |||||||||
| 1,000 | 5.000%, 7/01/48 | 1/28 at 100.00 | 1,014,357 | |||||||||
| Arizona Industrial Development Authority, Arizona, Education Revenue Bonds, GreatHearts Arizona Projects, Series 2021A: | ||||||||||||
| 125 | 5.000%, 7/01/28 | No Opt. Call | 132,678 | |||||||||
| 125 | 5.000%, 7/01/29 | No Opt. Call | 134,372 | |||||||||
| 130 | 5.000%, 7/01/30 | No Opt. Call | 141,263 | |||||||||
| 125 | 5.000%, 7/01/31 | No Opt. Call | 137,017 | |||||||||
| 455 | Arizona Industrial Development Authority, Arizona, Education Revenue Bonds, Pinecrest Academy of Nevada Horizon, Inspirada and St. Rose Campus Projects, Series 2018A, 5.750%, 7/15/38, 144A | 7/26 at 100.00 | 463,503 | |||||||||
| 1,000 | Arizona Industrial Development Authority, Arizona, Education Revenue Bonds, Pinecrest Academy of Nevada Sloan Canyon Campus Project, Series 2020A-2, 6.000%, 9/15/38, 144A | 3/24 at 105.00 | 1,044,189 | |||||||||
| NAZ | Nuveen Arizona Quality Municipal Income Fund (continued) Portfolio of Investments February 29, 2024 |
Principal Amount (000) | Description (a) | Optional Call Provisions (b) | Value | |||||||||
Education and Civic Organizations | ||||||||||||
| $ | 140 | Arizona Industrial Development Authority, Arizona, Education Revenue Bonds, Social Bonds Pensar Academy Project, Series 2020, 4.000%, 7/01/30, 144A | 7/28 at 100.00 | $ | 131,106 | |||||||
| Arizona Industrial Development Authority, Arizona, Lease Revenue Bonds, | ||||||||||||
| University of Indianapolis - Health Pavilion Project, Series 2019A: | ||||||||||||
| 1,645 | 4.000%, 10/01/39 | 10/29 at 100.00 | 1,528,636 | |||||||||
| 1,080 | 4.000%, 10/01/49 | 10/29 at 100.00 | 922,450 | |||||||||
| 1,500 | Arizona Industrial Development Authority, Education Facility Revenue Bonds, Caurus Academy Project, Series 2018A, 6.375%, 6/01/39, 144A | 6/28 at 100.00 | 1,566,748 | |||||||||
| Industrial Development Authority, Pima County, Arizona, Education Revenue Bonds, Center for Academic Success Project, Refunding Series 2019: | ||||||||||||
| 360 | 4.000%, 7/01/31 | 7/29 at 100.00 | 355,485 | |||||||||
| 340 | 4.000%, 7/01/33 | 7/29 at 100.00 | 334,050 | |||||||||
| 780 | Maricopa County Industrial Development Authority, Arizona, Education Revenue Bonds, Arizona Autism Charter Schools Project, Series 2020A, 5.000%, 7/01/50, 144A | 7/29 at 100.00 | 725,006 | |||||||||
| 195 | Maricopa County Industrial Development Authority, Arizona, Education Revenue Bonds, Arizona Autism Charter Schools Project, Social Series 2021A, 4.000%, 7/01/51, 144A | 7/29 at 100.00 | 150,914 | |||||||||
| 355 | Maricopa County Industrial Development Authority, Arizona, Education Revenue Bonds, Great Hearts Academies Projects, Series 2017A, 5.000%, 7/01/37 | 7/27 at 100.00 | 367,003 | |||||||||
| 490 | Maricopa County Industrial Development Authority, Arizona, Education Revenue Bonds, Great Hearts Academies Projects, Series 2017C, 5.000%, 7/01/48 | 7/27 at 100.00 | 497,538 | |||||||||
| 1,715 | Maricopa County Industrial Development Authority, Arizona, Education Revenue Bonds, Highland Prep Project, Series 2019, 5.000%, 1/01/50 | 1/30 at 100.00 | 1,759,569 | |||||||||
| 700 | Maricopa County Industrial Development Authority, Arizona, Education Revenue Bonds, Legacy Traditional Schools Projects, Series 2021A, 4.000%, 7/01/41, 144A | 7/31 at 100.00 | 613,544 | |||||||||
| 870 | Maricopa County Industrial Development Authority, Arizona, Education Revenue Bonds, Paradise Schools Projects, Series 2016, 5.000%, 7/01/47, 144A | 7/26 at 100.00 | 850,028 | |||||||||
| Maricopa County Industrial Development Authority, Arizona, Education Revenue Bonds, Reid Traditional School Projects, Series 2016: | ||||||||||||
| 520 | 5.000%, 7/01/36 | 7/26 at 100.00 | 529,433 | |||||||||
| 300 | 5.000%, 7/01/47 | 7/26 at 100.00 | 301,155 | |||||||||
| 2,500 | Maricopa County Industrial Development Authority, Arizona, Educational Facilities Revenue Bonds, Creighton University Projects, Series 2020, 5.000%, 7/01/47 | 1/30 at 100.00 | 2,637,731 | |||||||||
| McAllister Academic Village LLC, Arizona, Revenue Bonds, Arizona State University Hassayampa Academic Village Project, Refunding Series 2016: | ||||||||||||
| 775 | 5.000%, 7/01/37 | 7/26 at 100.00 | 800,632 | |||||||||
| 1,000 | 5.000%, 7/01/38 | 7/26 at 100.00 | 1,029,611 | |||||||||
| Northern Arizona University, System Revenue Bonds, Refunding Series 2014: | ||||||||||||
| 1,155 | 5.000%, 6/01/40 | 6/24 at 100.00 | 1,155,887 | |||||||||
| 1,000 | Northern Arizona University, System Revenue Bonds, Refunding Series 2020B, 5.000%, 6/01/39 - BAM Insured | 6/30 at 100.00 | 1,090,600 | |||||||||
| 70 | Phoenix Industrial Development Authority, Arizona, Education Facility Revenue Bonds, Basis Schools, Inc. Projects, Series 2016A, 5.000%, 7/01/46, 144A | 7/25 at 100.00 | 67,346 | |||||||||
| 800 | Phoenix Industrial Development Authority, Arizona, Education Facility Revenue Bonds, Great Hearts Academies Project, Series 2016A, 5.000%, 7/01/41 | 7/25 at 100.00 | 799,379 | |||||||||
| 500 | Phoenix Industrial Development Authority, Arizona, Education Facility Revenue Bonds, Legacy Traditional Schools Project, Series 2014A, 6.750%, 7/01/44, 144A | 7/24 at 100.00 | 502,834 | |||||||||
| Phoenix Industrial Development Authority, Arizona, Education Facility Revenue Bonds, Legacy Traditional Schools Projects, Series 2015: | ||||||||||||
| 315 | 5.000%, 7/01/35, 144A | 7/25 at 100.00 | 317,182 | |||||||||
| 300 | 5.000%, 7/01/45, 144A | 7/25 at 100.00 | 294,191 | |||||||||
Principal Amount (000) | Description (a) | Optional Call Provisions (b) | Value | |||||||||
Education and Civic Organizations | ||||||||||||
| $ | 650 | Phoenix Industrial Development Authority, Arizona, Education Facility Revenue Bonds, Legacy Traditional Schools Projects, Series 2016A, 5.000%, 7/01/41, 144A | 7/26 at 100.00 | $ | 650,237 | |||||||
| 1,110 | Phoenix Industrial Development Authority, Arizona, Education Facility Revenue Bonds, Northwest Christian School Project, Series 2020A, 5.000%, 9/01/45, 144A | 9/30 at 100.00 | 1,000,436 | |||||||||
| Phoenix Industrial Development Authority, Arizona, Education Facility Revenue Bonds, Villa Montessori, Inc. Projects, Series 2015: | ||||||||||||
| 110 | 3.250%, 7/01/25 | No Opt. Call | 107,953 | |||||||||
| 400 | 5.000%, 7/01/35 | 7/25 at 100.00 | 403,648 | |||||||||
| 900 | Phoenix Industrial Development Authority, Arizona, Education Facility Revenue Bonds, Vista College Preparatory Project, Series 2018A, 4.125%, 7/01/38 | 7/28 at 100.00 | 893,935 | |||||||||
| 1,995 | Phoenix Industrial Development Authority, Arizona, Lease Revenue Bonds, Eastern Kentucky University Project, Series 2016, 5.000%, 10/01/36 | 10/26 at 100.00 | 2,069,792 | |||||||||
| 500 | Pima County Community College District, Arizona, Revenue Bonds, Series 2019, 5.000%, 7/01/36 | 7/28 at 100.00 | 541,301 | |||||||||
| 200 | Pima County Industrial Development Authority, Arizona, Charter School Revenue Bonds, Desert Heights Charter School, Series 2014, 7.250%, 5/01/44 | 5/24 at 100.00 | 200,574 | |||||||||
| Pima County Industrial Development Authority, Arizona, Education Facility Revenue Bonds, Champion Schools Project, Series 2017: | ||||||||||||
| 120 | 6.000%, 6/15/37, 144A | 6/26 at 100.00 | 114,190 | |||||||||
| 680 | 6.125%, 6/15/47, 144A | 6/26 at 100.00 | 612,761 | |||||||||
| 200 | Pima County Industrial Development Authority, Arizona, Education Facility Revenue Bonds, Edkey Charter Schools Project, Series 2016, 5.250%, 7/01/36 | 7/26 at 100.00 | 200,569 | |||||||||
| 115 | Pima County Industrial Development Authority, Arizona, Education Facility Revenue Bonds, San Tan Montessori School Project, Series 2017, 6.750%, 2/01/50, 144A | 2/28 at 100.00 | 118,118 | |||||||||
| 500 | Pima County Industrial Development Authority, Arizona, Education Revenue Bonds, Noah Webster Schools Mesa Project, Series 2015A, 5.000%, 12/15/34, 144A | 6/25 at 100.00 | 496,263 | |||||||||
| 730 | Pinal County Community College District, Arizona, Revenue Bonds, Central Arizona College, Series 2017, 5.000%, 7/01/35 - BAM Insured | 7/26 at 100.00 | 757,174 | |||||||||
| 780 | Student and Academic Services LLC, Arizona, Lease Revenue Bonds, Northern Arizona University Project, Series 2014, 5.000%, 6/01/39 - BAM Insured | 6/24 at 100.00 | 781,242 | |||||||||
| Total Education and Civic Organizations | 49,124,905 | |||||||||||
Health Care - 20.2% (12.7% of Total Investments) | ||||||||||||
| Arizona Health Facilities Authority, Revenue Bonds, Scottsdale Lincoln Hospitals Project, Refunding Series 2014A: | ||||||||||||
| 3,005 | 5.000%, 12/01/39 | 12/24 at 100.00 | 3,018,789 | |||||||||
| 2,370 | 5.000%, 12/01/42 | 12/24 at 100.00 | 2,374,779 | |||||||||
| Arizona Industrial Development Authority, Arizona, Lease Revenue Bonds, Children’s National Prince County Regional Medical Center, Series 2020A: | ||||||||||||
| 890 | 4.000%, 9/01/38 | 9/30 at 100.00 | 885,969 | |||||||||
| 110 | 4.000%, 9/01/40 | 9/30 at 100.00 | 107,814 | |||||||||
| 4,975 | Arizona Industrial Development Authority, Hospital Revenue Bonds, Phoenix Children’s Hospital, Series 2020A, 4.000%, 2/01/50 | 2/30 at 100.00 | 4,724,782 | |||||||||
| 1,250 | Maricopa County Industrial Development Authority, Arizona, Hospital Revenue Bonds, HonorHealth, Series 2019A, 5.000%, 9/01/42 | 9/28 at 100.00 | 1,304,376 | |||||||||
| 3,275 | Maricopa County Industrial Development Authority, Arizona, Hospital Revenue Bonds, HonorHealth, Series 2021A, 4.000%, 9/01/51 Maricopa County Industrial Development Authority, Arizona, Revenue Bonds, Banner Health, Refunding Series 2016A: | 3/31 at 100.00 | 3,027,972 | |||||||||
| 1,250 | 5.000%, 1/01/32 | 1/27 at 100.00 | 1,315,442 | |||||||||
| 1,000 | 5.000%, 1/01/35 | 1/27 at 100.00 | 1,049,175 | |||||||||
| 2,000 | 5.000%, 1/01/38 | 1/27 at 100.00 | 2,078,224 | |||||||||
| 2,000 | Maricopa County Industrial Development Authority, Arizona, Revenue Bonds, Banner Health, Series 2017A, 5.000%, 1/01/41 | 1/28 at 100.00 | 2,080,609 | |||||||||
| 2,000 | Maricopa County Industrial Development Authority, Arizona, Revenue Bonds, | 7/29 at 100.00 | 1,983,635 | |||||||||
| Banner Health, Series 2019A, 4.000%, 1/01/44 | ||||||||||||
| NAZ | Nuveen Arizona Quality Municipal Income Fund (continued) Portfolio of Investments February 29, 2024 |
Principal Amount (000) | Description (a) | Optional Call Provisions (b) | Value | |||||||||
Health Care | ||||||||||||
| $ | 2,250 | Pima County Industrial Development Authority, Arizona, Revenue Bonds, Tucson Medical Center, Series 2021A, 3.000%, 4/01/51 | 4/31 at 100.00 | $ | 1,609,755 | |||||||
| 1,025 | Yavapai County Industrial Development Authority, Arizona, Hospital Revenue Bonds, Yavapai Regional Medical Center, Refunding Series 2016, 5.000%, 8/01/36 | 8/26 at 100.00 | 1,059,469 | |||||||||
| 2,100 | Yavapai County Industrial Development Authority, Arizona, Hospital Revenue Bonds, Yavapai Regional Medical Center, Series 2019, 4.000%, 8/01/43 | 8/29 at 100.00 | 2,004,967 | |||||||||
| 1,000 | Yuma Industrial Development Authority, Arizona, Hospital Revenue Bonds, Yuma Regional Medical Center, Series 2014A, 5.250%, 8/01/32 | 8/24 at 100.00 | 1,007,170 | |||||||||
| Total Health Care | 29,632,927 | |||||||||||
Housing/Multifamily - 1.3% (0.8% of Total Investments) | ||||||||||||
| 1,250 | Arizona Industrial Development Authority, Student Housing Revenue Bonds, Provident Group - NCCU Properties LLC- North Carolina Central University, Series 2019A, 4.000%, 6/01/44 - BAM Insured | 6/29 at 100.00 | 1,220,793 | |||||||||
| 250 | Sierra Vista Industrial Development Authority, Arizona, Economic Development Revenue Bonds, Convertible Capital Appreciation Revenue Bonds, Series 2021A, 5.375%, 10/01/56 | 10/29 at 103.00 | 192,598 | |||||||||
| 500 | Sierra Vista Industrial Development Authority, Arizona, Economic Development Revenue Bonds, Convertible Capital Appreciation Revenue Bonds, Series 2022A, 7.000%, 10/01/56 | 10/29 at 103.00 | 463,330 | |||||||||
| Total Housing/Multifamily | 1,876,721 | |||||||||||
Housing/Single Family - 2.0% (1.3% of Total Investments) | ||||||||||||
| 1,000 | Phoenix and Maricopa County Industrial Development Authority, Arizona, Single Family Mortgage Revenue Bonds, Series 2023A, 5.450%, 9/01/48 | 9/32 at 100.00 | 1,065,367 | |||||||||
| 750 | Tucson and Pima County Industrial Development Authority, Arizona, Joint Single Family Mortgage Revenue Bonds, Series 2023A, 4.850%, 7/01/48 | 7/32 at 103.31 | 769,267 | |||||||||
| 1,130 | Tucson and Pima County Industrial Development Authority, Arizona, Joint Single Family Mortgage Revenue Bonds, Series 2024A, 4.800%, 7/01/54 , (WI/DD) | 7/33 at 100.00 | 1,135,421 | |||||||||
| Total Housing/Single Family | 2,970,055 | |||||||||||
Information Technology - 0.3% (0.2% of Total Investments) | ||||||||||||
| 410 | Chandler Industrial Development Authority, Arizona, Industrial Development Revenue Bonds, Intel Corporation Project, Series 2007, 4.100%, 12/01/37, (AMT), (Mandatory Put 6/15/28) | 2/28 at 100.00 | 414,132 | |||||||||
| Total Information Technology | 414,132 | |||||||||||
Long-Term Care - 3.2% (2.0% of Total Investments) | ||||||||||||
| 585 | Arizona Industrial Development Authority, Multifamily Housing Revenue Bonds, Bridgewater Avondale Project, Series 2017, 5.375%, 1/01/38 | 7/25 at 101.00 | 444,951 | |||||||||
| 1,000 | Glendale Industrial Development Authority, Arizona, Senior Living Revenue Bonds, Royal Oaks Royal Oaks - Inspirata Pointe Project, Series 2020A, 5.000%, 5/15/41 | 5/26 at 103.00 | 930,043 | |||||||||
| 1,795 | Phoenix Industrial Development Authority, Arizona, Multi-Family Housing Revenue Bonds, 3rd and Indian Road Assisted Living Project, Series 2016, 5.400%, 10/01/36 | 10/25 at 101.00 | 1,427,841 | |||||||||
| 1,435 | Tempe Industrial Development Authority, Arizona, Revenue Bonds, Friendship Village of Tempe Project, Refunding Series 2021A, 4.000%, 12/01/38 | 12/29 at 102.00 | 1,240,397 | |||||||||
| 1,080 | Tempe Industrial Development Authority, Arizona, Revenue Bonds, Mirabella at ASU Project, Series 2017A, 6.125%, 10/01/47, 144A | 10/27 at 100.00 | 675,220 | |||||||||
| Total Long-Term Care | 4,718,452 | |||||||||||
Tax Obligation/General - 19.2% (12.1% of Total Investments) | ||||||||||||
| 575 | Buckeye Union High School District 201, Maricopa County, Arizona, General Obligation Bonds, School Improvement Project, Refunding Series 2017, 5.000%, 7/01/35 - BAM Insured | 7/27 at 100.00 | 608,332 | |||||||||
| 2,105 | Golder Ranch Fire District, Pima and Pinal Counties, Arizona, General Obligation Bonds, Series 2021, 4.000%, 7/01/45 | 7/30 at 100.00 | 2,099,872 | |||||||||
| 1,045 | Maricopa County School District 14 Creighton Elementary, Arizona, General Obligation Bonds, School Improvement Series 2021C, 4.000%, 7/01/34 | 7/31 at 100.00 | 1,125,035 | |||||||||
Principal Amount (000) | Description (a) | Optional Call Provisions (b) | Value | |||||||||
Tax Obligation/General | ||||||||||||
| $ | 2,315 | Maricopa County School District 214 Tolleson Union High, Arizona, General Obligation Bonds, School Improvement Project 1990, Series 1990A, 5.000%, 7/01/38 | 7/28 at 100.00 | $ | 2,485,095 | |||||||
| 630 | Maricopa County School District 214 Tolleson Union High, Arizona, General Obligation Bonds, School Improvement Project 2017, Series 2018A, 5.000%, 7/01/37 | 7/27 at 100.00 | 664,754 | |||||||||
| 1,500 | Maricopa County Special Health Care District, Arizona, General Obligation Bonds, Series 2018C, 5.000%, 7/01/36 | 7/28 at 100.00 | 1,606,265 | |||||||||
| 1,350 | Maricopa County Unified School District 95 Queen Creek, Arizona, General Obligation Bonds, School Improvement Series 2018, 5.000%, 7/01/36 | 7/25 at 102.00 | 1,404,442 | |||||||||
| 1,275 | Maricopa County Union High School District 210 Phoenix, Arizona, General Obligation Bonds, School Improvement & Project of 2011 Series 2017E, 5.000%, 7/01/33 | 7/27 at 100.00 | 1,360,128 | |||||||||
| 1,295 | Maricopa County Union High School District 216 Agua Fria, Arizona, General Obligation Bonds, School Improvement, Project of 2023, Series 2024A, 5.000%, 7/01/43 | 7/33 at 100.00 | 1,466,404 | |||||||||
| Mohave County Union High School District 2 Colorado River, Arizona, General Obligation Bonds, School Improvement Series 2017: | ||||||||||||
| 1,000 | 5.000%, 7/01/34 | 7/27 at 100.00 | 1,059,156 | |||||||||
| 1,000 | 5.000%, 7/01/36 | 7/27 at 100.00 | 1,057,210 | |||||||||
| 690 | Northwest Fire District of Pima County, Arizona, General Obligation Bonds, Series 2017, 5.000%, 7/01/36 | 7/27 at 100.00 | 729,327 | |||||||||
| 2,000 | Paradise Valley Unified School District No. 69, Maricopa County, Arizona, General Obligation Bonds, School Improvement Project of 2019, Series 2022D, 4.000%, 7/01/41 | 7/32 at 100.00 | 2,035,188 | |||||||||
| 2,895 | Pima County Unified School District 12 Sunnyside, Arizona, General Obligation Bonds, School Improvement Project 2011, Series 2014D, 5.000%, 7/01/34 - AGM Insured | 7/24 at 100.00 | 2,907,195 | |||||||||
| 1,500 | Pima County Unified School District 6 Marana, Arizona, General Obligation Bonds, School Improvement Project of 2014, Series 2017C, 5.000%, 7/01/36 - BAM Insured | 7/27 at 100.00 | 1,585,495 | |||||||||
| Pinal County School District 4 Casa Grande Elementary, Arizona, General Obligation Bonds, School improvement Project 2016, Series 2017A: | ||||||||||||
| 620 | 5.000%, 7/01/34 - BAM Insured | 7/27 at 100.00 | 654,937 | |||||||||
| 1,000 | 5.000%, 7/01/35 - BAM Insured | 7/27 at 100.00 | 1,055,055 | |||||||||
| 2,000 | Puerto Rico, General Obligation Bonds, Restructured Series 2022A-1, 4.000%, 7/01/46 | 7/31 at 103.00 | 1,807,608 | |||||||||
| 950 | Tempe, Arizona, General Obligation Bonds, Series 2021, 5.000%, 7/01/39 Western Maricopa Education Center District 402, Maricopa County, Arizona, General Obligation Bonds, School Improvement Project 2012, Series2014B: | 7/31 at 100.00 | 1,062,041 | |||||||||
| 715 | 4.500%, 7/01/33 | 7/24 at 100.00 | 715,805 | |||||||||
| 665 | 4.500%, 7/01/34 | 7/24 at 100.00 | 665,383 | |||||||||
| Total Tax Obligation/General | 28,154,727 | |||||||||||
Tax Obligation/Limited - 42.6% (26.9% of Total Investments) | ||||||||||||
| 100 | Arizona Industrial Development Authority, Arizona, Economic Development Revenue Bonds, Linder Village Project in Meridian, Ada County, Idaho, Series 2020, 5.000%, 6/01/31, 144A | No Opt. Call | 101,683 | |||||||||
| 1,250 | Arizona State Transportation Board, Highway Revenue Bonds, Refunding Series 2016, 5.000%, 7/01/35 | 7/26 at 100.00 | 1,302,799 | |||||||||
| 275 | Buckeye, Arizona, Excise Tax Revenue Obligations, Refunding Series 2016, 4.000%, 7/01/36 | 7/26 at 100.00 | 279,034 | |||||||||
| 1,000 | Buckeye, Arizona, Excise Tax Revenue Obligations, Series 2015, 5.000%, 7/01/37 | 7/25 at 100.00 | 1,017,930 | |||||||||
| 1,215 | Cadence Community Facilities District, Mesa, Arizona, Special Assessment Revenue Bonds, Assessment District 3, Series 2020, 4.000%, 7/01/45 | 7/30 at 100.00 | 1,080,085 | |||||||||
| 123 | (c) | Cahava Springs Revitalization District, Cave Creek, Arizona, Special Assessment Bonds, Series 2017A, 7.000%, 7/01/41, 144A | 7/27 at 100.00 | 94,597 | ||||||||
| 1,210 | Eastmark Community Facilities District 1, Mesa, Arizona, General Obligation Bonds, Series 2015, 5.000%, 7/15/39, 144A | 7/25 at 100.00 | 1,213,519 | |||||||||
| 1,810 | Eastmark Community Facilities District 1, Mesa, Arizona, General Obligation Bonds, Series 2017, 5.000%, 7/15/42 - AGM Insured | 7/27 at 100.00 | 1,904,219 | |||||||||
| NAZ | Nuveen Arizona Quality Municipal Income Fund (continued) Portfolio of Investments February 29, 2024 |
Principal Amount (000) | Description (a) | Optional Call Provisions (b) | Value | |||||||||||
Tax Obligation/Limited (continued) | ||||||||||||||
| $ | 2,445 | Eastmark Community Facilities District 1, Mesa, Arizona, General Obligation Bonds, Series 2018, 4.375%, 7/15/43 - BAM Insured | 7/27 at 100.00 | $ | 2,459,606 | |||||||||
| 650 | Eastmark Community Facilities District 1, Mesa, Arizona, General Obligation Bonds, Series 2021, 4.000%, 7/15/41 - BAM Insured | 7/31 at 100.00 | 646,397 | |||||||||||
| 484 | Eastmark Community Facilities District 1, Mesa, Arizona, Special Assessment Revenue Bonds, Assessment District 1, Series 2013, 5.250%, 7/01/38 | 4/24 at 100.00 | 483,913 | |||||||||||
| 697 | Eastmark Community Facilities District 1, Mesa, Arizona, Special Assessment Revenue Bonds, Assessment District 1, Series 2019, 5.200%, 7/01/43 | 7/27 at 100.00 | 655,420 | |||||||||||
| 2,280 | Eastmark Community Facilities District 1, Mesa, Arizona, Special Assessment Revenue Bonds, Assessment District 12, Series 2021, 3.750%, 7/01/45 | 7/30 at 100.00 | 1,757,450 | |||||||||||
| 1,035 | Eastmark Community Facilities District 2, Mesa, Arizona, General Obligation Bonds, Series 2020, 3.500%, 7/15/44 | 7/30 at 100.00 | 752,870 | |||||||||||
| Estrella Mountain Ranch Community Facilities District, Goodyear, Arizona, General Obligation Bonds, Refunding Series 2017: | ||||||||||||||
| 105 | 5.000%, 7/15/32 - AGM Insured | 7/27 at 100.00 | 111,267 | |||||||||||
| 1,145 | Estrella Mountain Ranch Community Facilities District, Goodyear, Arizona, Special Assessment Revenue Bonds, Lucero Assessment District 2, Series 2023, 5.750%, 7/01/46 | 7/32 at 100.00 | 1,156,469 | |||||||||||
| Festival Ranch Community Facilities District, Buckeye, Arizona, General Obligation Bonds, Series 2012: | ||||||||||||||
| 345 | 5.000%, 7/15/27 - BAM Insured | 4/24 at 100.00 | 345,370 | |||||||||||
| 1,085 | 5.000%, 7/15/31 | 4/24 at 100.00 | 1,085,997 | |||||||||||
| 500 | Festival Ranch Community Facilities District, Buckeye, Arizona, General Obligation Bonds, Series 2016, 4.000%, 7/15/36 - BAM Insured | 7/26 at 100.00 | 502,296 | |||||||||||
| 1,000 | Festival Ranch Community Facilities District, Buckeye, Arizona, General Obligation Bonds, Series 2017, 5.000%, 7/15/37 - BAM Insured | 7/27 at 100.00 | 1,041,403 | |||||||||||
| 590 | Festival Ranch Community Facilities District, Buckeye, Arizona, General Obligation Bonds, Series 2018, 5.000%, 7/15/38 - BAM Insured | 7/27 at 100.00 | 612,304 | |||||||||||
| 1,000 | Festival Ranch Community Facilities District, Buckeye, Arizona, General Obligation Bonds, Series 2020, 4.000%, 7/15/40 - BAM Insured | 7/30 at 100.00 | 990,709 | |||||||||||
| 2,000 | Festival Ranch Community Facilities District, Buckeye, Arizona, General Obligation Bonds, Series 2022, 5.000%, 7/15/42 - AGM Insured | 7/32 at 100.00 | 2,131,616 | |||||||||||
| 322 | Festival Ranch Community Facilities District, Buckeye, Arizona, Special Assessment Revenue Bonds, Assessment District 11, Series 2017, 5.200%, 7/01/37 | 7/27 at 100.00 | 314,295 | |||||||||||
| Goodyear Community Facilities Utilities District 1, Arizona, General Obligation Bonds, Refunding Series 2016: | ||||||||||||||
| 545 | 4.000%, 7/15/32 | 7/26 at 100.00 | 555,848 | |||||||||||
| 1,500 | Government of Guam, Business Privilege Tax Bonds, Refunding Series 2015D, 5.000%, 11/15/39 | 11/25 at 100.00 | 1,516,602 | |||||||||||
| 1,250 | Guam Government, Limited Obligation Section 30 Revenue Bonds, Series 2016A, 5.000%, 12/01/46 | 12/26 at 100.00 | 1,229,920 | |||||||||||
| 1,425 | Marana, Arizona, Pledged Excise Tax Revenue Bonds, Refunding Series 2013, 5.000%, 7/01/33 | 5/24 at 100.00 | 1,429,365 | |||||||||||
| 615 | Matching Fund Special Purpose Securitization Corporation, Virgin Islands, Revenue Bonds, Series 2022A, 5.000%, 10/01/39 | 10/32 at 100.00 | 643,323 | |||||||||||
| 200 | Merrill Ranch Community Facilities District 2, Florence, Arizona, General Obligation Bonds, Series 2016, 5.000%, 7/15/31 | 7/26 at 100.00 | 207,598 | |||||||||||
| 385 | Merrill Ranch Community Facilities District 2, Florence, Arizona, General Obligation Bonds, Series 2017, 5.000%, 7/15/42 - BAM Insured | 7/27 at 100.00 | 401,426 | |||||||||||
| 400 | Parkway Community Facilities District 1, Prescott Valley, Arizona, General Obligation Bonds, Series 2006, 5.350%, 7/15/31 | 4/24 at 100.00 | 323,515 | |||||||||||
| 1,625 | Phoenix Civic Improvement Corporation, Arizona, Excise Tax Revenue Bonds, Subordinate Lien Series 2020A, 4.000%, 7/01/45 | 7/30 at 100.00 | 1,615,645 | |||||||||||
| 580 | Phoenix Mesa Gateway Airport Authority, Arizona, Special Facility Revenue Bonds, Mesa Project, Series 2012, 5.000%, 7/01/38, (AMT) | 4/24 at 100.00 | 580,044 | |||||||||||
| 1,000 | Pinal County, Arizona, Pledged Revenue Obligations, Series 2014, 5.000%, 8/01/33 | 8/24 at 100.00 | 1,005,636 | |||||||||||
| 1,500 | Pinal County, Arizona, Pledged Revenue Obligations, Series 2019, 4.000%, 8/01/38 | 8/28 at 100.00 | 1,522,198 | |||||||||||
| 9,520 | Puerto Rico Sales Tax Financing Corporation, Sales Tax Revenue Bonds, Restructured 2018A-1, 0.000%, 7/01/46 | 7/28 at 41.38 | 3,099,392 | |||||||||||
Principal Amount (000) | Description (a) | Optional Call Provisions (b) | Value | |||||||||
Tax Obligation/Limited | ||||||||||||
| $ | 2,440 | Puerto Rico Sales Tax Financing Corporation, Sales Tax Revenue Bonds, Taxable Restructured Cofina Project Series 2019A-2, 4.784%, 7/01/58 | 7/28 at 100.00 | $ | 2,433,905 | |||||||
| Queen Creek, Arizona, Excise Tax & State Shared Revenue Obligation Bonds, Refunding Series 2016: | ||||||||||||
| 540 | 4.000%, 8/01/34 | 8/26 at 100.00 | 552,512 | |||||||||
| 545 | 4.000%, 8/01/36 | 8/26 at 100.00 | 555,146 | |||||||||
| 1,740 | Queen Creek, Arizona, Excise Tax & State Shared Revenue Obligation Bonds, Series 2018A, 5.000%, 8/01/42 | 8/28 at 100.00 | 1,856,502 | |||||||||
| 2,500 | Queen Creek, Arizona, Excise Tax & State Shared Revenue Obligation Bonds, | 8/30 at 100.00 | 2,492,920 | |||||||||
| Series 2020, 4.000%, 8/01/45 | ||||||||||||
| San Luis, Arizona, Pledged Excise Tax Revenue Bonds, Refunding Series2014A: | ||||||||||||
| 1,400 | 5.000%, 7/01/34 - BAM Insured | 7/24 at 100.00 | 1,405,670 | |||||||||
| 2,100 | 5.000%, 7/01/38 - BAM Insured | 7/24 at 100.00 | 2,107,685 | |||||||||
| 3,000 | Scottsdale Municipal Property Corporation, Arizona, Excise Tax Revenue Bonds, Refunding Series 2006, 5.000%, 7/01/24 | No Opt. Call | 3,017,623 | |||||||||
| 1,650 | Sundance Community Facilities District, Buckeye, Arizona, General Obligation Bonds, Refunding Series 2018, 5.000%, 7/15/39 - BAM Insured | 7/28 at 100.00 | 1,773,563 | |||||||||
| 694 | Superstition Vistas Community Facilities District 1, Apache Junction, Arizona, Special Assessment Revenue Bonds, Series 2023, 6.000%, 7/01/47 | 7/33 at 100.00 | 666,897 | |||||||||
| 3,000 | Town of Queen Creek, Arizona, Excise Tax and State Shared Revenue Obligation Bonds, Series 2022, 5.000%, 8/01/47 | 8/32 at 100.00 | 3,293,467 | |||||||||
| 500 | Verrado District 1 Community Faciliites District, Buckeye, Arizona, General Obligation Bonds, Series 2023, 4.125%, 7/15/41 - BAM Insured | 7/33 at 100.00 | 512,837 | |||||||||
| 325 | Vistancia West Community Facilities District, Peoria, Arizona, General Obligation Bonds, Series 2016, 3.250%, 7/15/25, 144A | 4/24 at 100.00 | 325,001 | |||||||||
| 4,240 | Yavapai County Jail District, Arizona, Pledged Revenue Obligation Bonds, Series 2020, 4.000%, 7/01/40 - BAM Insured | 7/29 at 100.00 | 4,279,349 | |||||||||
| 1,160 | Yuma County, Arizona, Pledge Revenue Obligations, Series 2022, 4.250%, 7/15/42 - BAM Insured | 7/32 at 100.00 | 1,183,429 | |||||||||
| Total Tax Obligation/Limited | 62,628,266 | |||||||||||
Transportation - 7.5% (4.7% of Total Investments) | ||||||||||||
| Phoenix Civic Improvement Corporation, Arizona, Airport Revenue Bonds, Junior Lien Series 2015A: | ||||||||||||
| 910 | 5.000%, 7/01/40 | 7/25 at 100.00 | 923,829 | |||||||||
| 2,185 | 5.000%, 7/01/45 | 7/25 at 100.00 | 2,210,393 | |||||||||
| 2,000 | Phoenix Civic Improvement Corporation, Arizona, Airport Revenue Bonds, Junior Lien Series 2019B, 5.000%, 7/01/49, (AMT) | 7/29 at 100.00 | 2,062,163 | |||||||||
| Phoenix Civic Improvement Corporation, Arizona, Airport Revenue Bonds, Senior Lien Series 2017A: | ||||||||||||
| 1,000 | 5.000%, 7/01/37, (AMT) | 7/27 at 100.00 | 1,036,970 | |||||||||
| 1,000 | 5.000%, 7/01/42, (AMT) | 7/27 at 100.00 | 1,029,486 | |||||||||
| 1,500 | Phoenix Civic Improvement Corporation, Arizona, Airport Revenue Bonds, Senior Lien Series 2018, 5.000%, 7/01/43, (AMT) | 7/28 at 100.00 | 1,553,758 | |||||||||
| Phoenix Civic Improvement Corporation, Arizona, Rental Car Facility Charge Revenue Bonds, Series 2019A: | ||||||||||||
| 1,045 | 5.000%, 7/01/35 | 7/29 at 100.00 | 1,132,821 | |||||||||
| 1,000 | 5.000%, 7/01/38 | 7/29 at 100.00 | 1,068,860 | |||||||||
| Total Transportation | 11,018,280 | |||||||||||
U.S. Guaranteed - 3.3% (2.1% of Total Investments) (d) | ||||||||||||
| Estrella Mountain Ranch Community Facilities District, Goodyear, Arizona, General Obligation Bonds, Refunding Series 2017: | ||||||||||||
| 550 | 5.000%, 7/15/32, (Pre-refunded 7/15/27) - AGM Insured | 7/27 at 100.00 | 591,131 | |||||||||
| Goodyear Community Facilities Utilities District 1, Arizona, General Obligation Bonds, Refunding Series 2016: | ||||||||||||
| 55 | 4.000%, 7/15/32, (Pre-refunded 7/15/26) | 7/26 at 100.00 | 56,422 | |||||||||
| Northern Arizona University, System Revenue Bonds, Refunding Series 2014: | ||||||||||||
| 720 | 5.000%, 6/01/40, (Pre-refunded 6/01/24) | 6/24 at 100.00 | 723,003 | |||||||||
| 2,000 | Phoenix Civic Improvement Corporation, Arizona, Water System Revenue Bonds, Junior Lien Series 2014A, 5.000%, 7/01/39, (Pre-refunded 7/01/24) | 7/24 at 100.00 | 2,010,118 | |||||||||
| NAZ | Nuveen Arizona Quality Municipal Income Fund (continued) Portfolio of Investments February 29, 2024 |
Principal Amount (000) | Description (a) | Optional Call Provisions (b) | Value | |||||||||
U.S. Guaranteed (d) | ||||||||||||
| $ 1,320 | Scottsdale Municipal Property Corporation, Arizona, Excise Tax Revenue Bonds, Refunding Series 2017, 5.000%, 7/01/36, (Pre-refunded 7/01/27) | 7/27 at 100.00 | $ | 1,419,797 | ||||||||
| Total U.S. Guaranteed | 4,800,471 | |||||||||||
Utilities - 25.4% (16.1% of Total Investments) | ||||||||||||
| Carefree Utilities Community Facilities District, Arizona, Water System Revenue Bonds, Series 2021: | ||||||||||||
| 30 | 4.000%, 7/01/41 | 7/31 at 100.00 | 30,249 | |||||||||
| 650 | 4.000%, 7/01/46 | 7/31 at 100.00 | 638,053 | |||||||||
| 655 | Central Arizona Water Conservation District, Arizona, Water Delivery O&M Revenue Bonds, Series 2016, 5.000%, 1/01/36 | 1/26 at 100.00 | 672,856 | |||||||||
| 2,615 | City of Mesa, Arizona, Utility System Revenue Bonds, Series 2022C, 5.000%, 7/01/36 | No Opt. Call | 3,111,596 | |||||||||
| 1,250 | Gilbert Water Resource Municipal Property Corporation, Arizona, Utility System Revenue Bonds, Senior Lien Green Series 2022, 4.000%, 7/15/47 | 7/32 at 100.00 | 1,243,766 | |||||||||
| 785 | Goodyear, Arizona, Water and Sewer Revenue Obligations, Refunding Subordinate Lien Series 2016, 5.000%, 7/01/45 - AGM Insured | 7/26 at 100.00 | 806,948 | |||||||||
| 875 | Goodyear, Arizona, Water and Sewer Revenue Obligations, Subordinate Lien Series 2020, 4.000%, 7/01/49 - AGM Insured | 7/29 at 100.00 | 835,808 | |||||||||
| 665 | Guam Government Waterworks Authority, Water and Wastewater System Revenue Bonds, Refunding Series 2017, 5.000%, 7/01/36 | 7/27 at 100.00 | 691,768 | |||||||||
| 1,100 | Guam Power Authority, Revenue Bonds, Series 2014A, 5.000%, 10/01/39 | 10/24 at 100.00 | 1,107,388 | |||||||||
| 1,125 | Lake Havasu City, Arizona, Wastewater System Revenue Bonds, Refunding Senior Lien Series 2015A, 5.000%, 7/01/36 - AGM Insured | 7/25 at 100.00 | 1,147,955 | |||||||||
| 1,840 | Phoenix Civic Improvement Corporation, Arizona, Wastewater System Revenue Bonds, Junior Lien Series 2023, 5.250%, 7/01/47 | 7/33 at 100.00 | 2,078,600 | |||||||||
| 1,135 | Phoenix Civic Improvement Corporation, Arizona, Wastewater System Revenue Bonds, Refunding Junior Lien Series 2014, 5.000%, 7/01/29 | 7/24 at 100.00 | 1,140,705 | |||||||||
| 1,000 | Phoenix Civic Improvement Corporation, Arizona, Water System Revenue Bonds, Junior Lien Series 2021A, 4.000%, 7/01/42 | 7/31 at 100.00 | 1,017,773 | |||||||||
| 695 | Pinal County Electrical District 3, Arizona, Electric System Revenue Bonds, Refunding Series 2016, 5.000%, 7/01/35 | 7/26 at 100.00 | 724,620 | |||||||||
| 1,000 | Puerto Rico Aqueduct and Sewerage Authority, Revenue Bonds, Refunding Senior Lien Series 2021B, 5.000%, 7/01/37, 144A | 7/31 at 100.00 | 1,030,197 | |||||||||
| 1,500 | Salt River Project Agricultural Improvement and Power District, Arizona, Electric System Revenue Bonds, Refunding Series 2015A, 5.000%, 12/01/36 | 6/25 at 100.00 | 1,530,073 | |||||||||
| 2,500 | Salt River Project Agricultural Improvement and Power District, Arizona, Electric System Revenue Bonds, Series 2023A, 5.000%, 1/01/47 | 1/33 at 100.00 | 2,762,171 | |||||||||
| 1,155 | Salt River Project Agricultural Improvement and Power District, Arizona, Electric System Revenue Bonds, Series 2023B, 5.000%, 1/01/48 | 1/34 at 100.00 | 1,282,243 | |||||||||
| Salt Verde Financial Corporation, Arizona, Senior Gas Revenue Bonds, Citigroup Energy Inc Prepay Contract Obligations, Series 2007: | ||||||||||||
| 4,500 | 5.500%, 12/01/29 | No Opt. Call | 4,834,402 | |||||||||
| 5,665 | 5.000%, 12/01/37 | No Opt. Call | 6,220,217 | |||||||||
| Surprise, Arizona, Utility System Revenue Bonds, Refunding Senior Lien Series 2018: | ||||||||||||
| 500 | 5.000%, 7/01/35 | 7/28 at 100.00 | 549,558 | |||||||||
| 805 | 5.000%, 7/01/36 | 7/28 at 100.00 | 881,429 | |||||||||
| 3,000 | Yuma, Arizona, Utilities System Revenue Bonds, Series 2021, 4.000%, 7/01/40 - BAM Insured | 7/31 at 100.00 | 3,042,081 | |||||||||
| Total Utilities | 37,380,456 | |||||||||||
Total Municipal Bonds (cost $234,469,877) | 232,719,392 | |||||||||||
Total Long-Term Investments (cost $234,469,877) | 232,719,392 | |||||||||||
AMTP Shares, Net - (60.1)% (e) | (88,258,681 | ) | ||||||||||
Other Assets & Liabilities, Net - 1.7% | 2,466,984 | |||||||||||
Net Assets Applicable to Common Shares - 100% | $ | 146,927,695 | ||||||||||
| (a) | All percentages shown in the Portfolio of Investments are based on net assets applicable to common shares unless otherwise noted. |
| (b) | Optional Call Provisions: Dates (month and year) and prices of the earliest optional call or redemption. There may be other call provisions at varying prices at later dates. Certain mortgage-backed securities may be subject to periodic principal paydowns. Optional Call Provisions are not covered by the report of independent registered public accounting firm. |
| (c) | Defaulted security. A security whose issuer has failed to fully pay principal and/or interest when due, or is under the protection of bankruptcy. |
| (d) | Backed by an escrow or trust containing sufficient U.S. Government or U.S. Government agency securities, which ensure the timely payment of principal and interest. |
| (e) | AMTP Shares, Net as a percentage of Total Investments is 37.9%. |
| 144A | Investment is exempt from registration under Rule 144A of the Securities Act of 1933, as amended. These investments may only be resold in transactions exempt from registration, which are normally those transactions with qualified institutional buyers. |
| AMT | Alternative Minimum Tax |
| WI/DD | When-issued or delayed delivery security. |
| NAC | Nuveen California Quality Municipal Income Fund Portfolio of Investments February 29, 2024 |
Principal Amount (000) | Description (a) | Optional Call Provisions (b) | Value | |||||||||||
LONG-TERM INVESTMENTS - 163.7% (99.3% of Total Investments) | ||||||||||||||
MUNICIPAL BONDS - 163.7% (99.3% of Total Investments) | ||||||||||||||
Consumer Staples - 1.2% (0.7% of Total Investments) | ||||||||||||||
| $ | 1,000 | California County Tobacco Securitization Agency, Tobacco Settlement Asset- Backed Bonds, Golden Gate Tobacco Funding Corporation, Turbo, Series 2007A, 5.000%, 6/01/47 | 3/24 at 100.00 | $ | 965,277 | |||||||||
| 2,575 | California County Tobacco Securitization Agency, Tobacco Settlement Asset- Backed Bonds, Los Angeles County Securitization Corporation, Series 2020A, 4.000%, 6/01/49 | 6/30 at 100.00 | 2,510,860 | |||||||||||
| 2,110 | California County Tobacco Securitization Agency, Tobacco Settlement Asset- Backed Bonds, Los Angeles County Securitization Corporation, Series 2020B-1, 5.000%, 6/01/49 | 6/30 at 100.00 | 2,185,292 | |||||||||||
| 25,000 | California Statewide Financing Authority, Tobacco Settlement Asset-Backed Bonds, Pooled Tobacco Securitization Program, Series 2006A, 0.000%, 6/01/46 | 3/24 at 25.50 | 6,360,562 | |||||||||||
| 44,035 | Golden State Tobacco Securitization Corporation, California, Tobacco Settlement Asset-Backed Bonds, Capital Appreciation Series 2021B-2, 0.000%, 6/01/66 | 12/31 at 27.75 | 5,012,623 | |||||||||||
| 19,000 | Silicon Valley Tobacco Securitization Authority, California, Tobacco Settlement Asset-Backed Bonds, Santa Clara County Tobacco Securitization Corporation, Series 2007B, 0.000%, 6/01/47 | 4/24 at 26.29 | 4,974,512 | |||||||||||
| Total Consumer Staples | 22,009,126 | |||||||||||||
Education and Civic Organizations - 7.3% (4.4% of Total Investments) | ||||||||||||||
| 6,995 | California Educational Facilities Authority, Revenue Bonds, Chapman University, Series 2017B, 4.000%, 4/01/47 | 4/27 at 100.00 | 6,829,903 | |||||||||||
| 5,725 | California Educational Facilities Authority, Revenue Bonds, Stanford University Series 2016U-7, 5.000%, 6/01/46 | No Opt. Call | 7,034,326 | |||||||||||
| 4,385 | California Educational Facilities Authority, Revenue Bonds, University of the Pacific, Series 2023, 5.000%, 11/01/53 | 11/33 at 100.00 | 4,749,633 | |||||||||||
| 650 | California Enterprise Development Authority, Charter School Revenue Bonds, Academy for Academic Excellence Project, Series 2020A, 5.000%, 7/01/55, 144A | 7/27 at 100.00 | 618,402 | |||||||||||
| California Municipal Finance Authority, Revenue Bonds, Creative Center of Los Altos Project Pinewood & Oakwood Schools, Series 2016B: | ||||||||||||||
| 800 | 4.000%, 11/01/36, 144A | 11/26 at 100.00 | 719,314 | |||||||||||
| 1,000 | 4.500%, 11/01/46, 144A | 11/26 at 100.00 | 860,851 | |||||||||||
| California Municipal Finance Authority, Charter School Revenue Bonds, John Adams Academies, Inc. - Lincoln Project, Taxable Series 2019B: | ||||||||||||||
| 1,210 | 5.000%, 10/01/39, 144A | 10/27 at 100.00 | 1,202,186 | |||||||||||
| 2,980 | 5.000%, 10/01/57, 144A | 10/27 at 100.00 | 2,727,332 | |||||||||||
| 1,000 | California Municipal Finance Authority, Charter School Revenue Bonds, Palmdale Aerospace Academy Project, Series 2016A, 5.000%, 7/01/46, 144A | 7/26 at 100.00 | 949,638 | |||||||||||
| California Municipal Finance Authority, Revenue Bonds, Linxs APM Project, Senior Lien Series 2018A: | ||||||||||||||
| 3,500 | 5.000%, 12/31/43, (AMT) | 6/28 at 100.00 | 3,500,278 | |||||||||||
| 1,650 | 4.000%, 12/31/47, (AMT) | 6/28 at 100.00 | 1,468,056 | |||||||||||
| 4,000 | 5.000%, 12/31/47, (AMT) | 6/28 at 100.00 | 3,999,730 | |||||||||||
| 1,000 | California Municipal Finance Authority, Revenue Bonds, The Master’s University & Seminary, Series 2019, 5.000%, 8/01/48 | 8/29 at 100.00 | 1,013,440 | |||||||||||
| 750 | California School Finance Authority, Charter School Revenue Bonds, Aspire Public School - Obligated Group,Issue No.6, Series 2020A, 5.000%, 8/01/42, 144A | 8/28 at 100.00 | 762,069 | |||||||||||
| 1,550 | California School Finance Authority, Charter School Revenue Bonds, Camino Nuevo Charter Academy Sustainability Series 2023A, 5.250%, 6/01/53, 144A | 6/31 at 100.00 | 1,546,395 | |||||||||||
| 300 | California School Finance Authority, Charter School Revenue Bonds, Kepler Neighborhood School, Series 2017A, 5.000%, 5/01/27, 144A | No Opt. Call | 300,026 | |||||||||||
| 1,100 | California School Finance Authority, Charter School Revenue Bonds, Stem Preparatory Schools Obligated Group, Series 2023A, 5.375%, 5/01/63, 144A | 6/31 at 100.00 | 1,101,871 | |||||||||||
Principal Amount (000) | Description (a) | Optional Call Provisions (b) | Value | |||||||||
Education and Civic Organizations | ||||||||||||
| $ | 1,615 | California School Finance Authority, School Facility Revenue Bonds, Alliance for College-Ready Public Schools Project, Series 2015A, 5.000%, 7/01/45, 144A | 7/25 at 100.00 | $ | 1,616,208 | |||||||
| 2,150 | California School Finance Authority, School Facility Revenue Bonds, Alliance for College-Ready Public Schools Project, Series 2016A, 5.000%, 7/01/46, 144A | 7/25 at 100.00 | 2,150,401 | |||||||||
| California School Finance Authority, School Facility Revenue Bonds, Alliance for College-Ready Public Schools Project, Series 2016C: | ||||||||||||
| 5,995 | 5.000%, 7/01/46, 144A | 7/25 at 101.00 | 5,997,211 | |||||||||
| 8,340 | 5.250%, 7/01/52, 144A | 7/25 at 101.00 | 8,366,448 | |||||||||
| 800 | California School Finance Authority, School Facility Revenue Bonds, Value Schools, Series 2016A, 6.000%, 7/01/51, 144A | 7/26 at 100.00 | 820,297 | |||||||||
| 3,430 | California State University, Systemwide Revenue Bonds, Refunding Series 2015A, 5.000%, 11/01/43 | 11/25 at 100.00 | 3,520,218 | |||||||||
| 10,440 | California State University, Systemwide Revenue Bonds, Series 2018A, 5.000%, 11/01/43 | 11/28 at 100.00 | 11,287,559 | |||||||||
| 2,935 | University of California, General Revenue Bonds, Limited Project Series 2017M, 5.000%, 5/15/52 | 5/27 at 100.00 | 3,083,247 | |||||||||
| University of California, General Revenue Bonds, Limited Project Series 2018O: | ||||||||||||
| 8,500 | 5.000%, 5/15/43 | 5/28 at 100.00 | 9,128,532 | |||||||||
| 10,390 | 4.000%, 5/15/48 | 5/28 at 100.00 | 10,294,560 | |||||||||
| 14,215 | 5.000%, 5/15/48 | 5/28 at 100.00 | 15,140,118 | |||||||||
| University of California, General Revenue Bonds, Series 2018AZ: | ||||||||||||
| 3,930 | 5.000%, 5/15/38 | 5/28 at 100.00 | 4,281,834 | |||||||||
| 6,775 | 5.000%, 5/15/48 | 5/28 at 100.00 | 7,226,868 | |||||||||
| 12,810 | University of California, General Revenue Bonds, Series 2020BE, 4.000%, 5/15/47 | 5/30 at 100.00 | 12,816,910 | |||||||||
| Total Education and Civic Organizations | 135,113,861 | |||||||||||
Financials - 0.0% (0.0% of Total Investments) | ||||||||||||
| 1,305 | (c) | Cofina Class 2 Trust Tax-Exempt Class 2054, Puerto Rico. Unit Exchanged From Cusip 74529JAP0, 0.000%, 8/01/54 | No Opt. Call | 277,180 | ||||||||
| Total Financials | 277,180 | |||||||||||
Health Care - 24.6% (15.0% of Total Investments) | ||||||||||||
| California Health Facilities Financing Authority, California, Revenue Bonds, Sutter Health, Refunding Series 2016B: | ||||||||||||
| 6,365 | 4.000%, 11/15/41 | 11/26 at 100.00 | 6,371,915 | |||||||||
| 19,795 | 5.000%, 11/15/46 | 11/26 at 100.00 | 20,256,894 | |||||||||
| California Health Facilities Financing Authority, California, Revenue Bonds, Sutter Health, Refunding Series 2017A: | ||||||||||||
| 20,215 | 4.000%, 11/15/48 | 11/27 at 100.00 | 19,479,317 | |||||||||
| 13,110 | 5.000%, 11/15/48 | 11/27 at 100.00 | 13,560,768 | |||||||||
| 5,890 | California Health Facilities Financing Authority, California, Revenue Bonds, Sutter Health, Series 2018A, 5.000%, 11/15/38 | 11/27 at 100.00 | 6,208,534 | |||||||||
| 7,960 | California Health Facilities Financing Authority, Revenue Bonds, Adventist Health System/West, Refunding Series 2016A, 4.000%, 3/01/39 | 3/26 at 100.00 | 7,977,690 | |||||||||
| 7,810 | California Health Facilities Financing Authority, Revenue Bonds, Adventist Health System/West, Series 2013A, 4.000%, 3/01/43 | 3/24 at 100.00 | 7,424,064 | |||||||||
| 15,000 | California Health Facilities Financing Authority, Revenue Bonds, Cedars-Sinai Medical Center, Refunding Series 2016B, 4.000%, 8/15/39 | 8/26 at 100.00 | 15,051,244 | |||||||||
| 7,400 | California Health Facilities Financing Authority, Revenue Bonds, Children’s Hospital Los Angeles, Series 2017A, 5.000%, 8/15/47 | 8/27 at 100.00 | 7,500,254 | |||||||||
| California Health Facilities Financing Authority, Revenue Bonds, City of Hope National Medical Center, Series 2019: | ||||||||||||
| 16,625 | 4.000%, 11/15/45 | 11/29 at 100.00 | 16,138,143 | |||||||||
| 30,630 | 5.000%, 11/15/49 | 11/26 at 100.00 | 31,271,469 | |||||||||
| California Health Facilities Financing Authority, Revenue Bonds, CommonSpirit Health, Series 2020A: | ||||||||||||
| 31,810 | 4.000%, 4/01/44 | 4/30 at 100.00 | 30,989,712 | |||||||||
| 10,855 | 4.000%, 4/01/45 | 4/30 at 100.00 | 10,539,506 | |||||||||
| 2,815 | 4.000%, 4/01/49 | 4/30 at 100.00 | 2,706,603 | |||||||||
| NAC | Nuveen California Quality Municipal Income Fund (continued) Portfolio of Investments February 29, 2024 |
Principal Amount (000) | Description (a) | Optional Call Provisions (b) | Value | |||||||||||
Health Care | ||||||||||||||
| $ | 24,625 | California Health Facilities Financing Authority, Revenue Bonds, Lucile Salter Packard Children’s Hospital at Stanford, Refunding Forward Delivery Series 2022A, 4.000%, 5/15/51 | 5/32 at 100.00 | $ | 24,128,324 | |||||||||
| 2,230 | California Health Facilities Financing Authority, Revenue Bonds, Providence Health & Services, Refunding Series 2014A, 5.000%, 10/01/38 | 10/24 at 100.00 | 2,243,187 | |||||||||||
| 16,375 | California Health Facilities Financing Authority, Revenue Bonds, Providence Health & Services, Series 2014B, 5.000%, 10/01/44 | 10/24 at 100.00 | 16,440,222 | |||||||||||
| 26,330 | California Health Facilities Financing Authority, Revenue Bonds, Providence Saint Joseph Health, Refunding Series 2016A, 4.000%, 10/01/47 | 10/26 at 100.00 | 24,940,874 | |||||||||||
| 16,185 | California Municipal Finance Authority, Revenue Bonds, Community Health System, Series 2021A, 4.000%, 2/01/51 - AGM Insured | 2/32 at 100.00 | 15,445,587 | |||||||||||
| California Municipal Finance Authority, Revenue Bonds, Eisenhower Medical Center, Refunding Series 2017A: | ||||||||||||||
| 3,095 | 5.000%, 7/01/42 | 7/27 at 100.00 | 3,157,282 | |||||||||||
| 685 | 5.000%, 7/01/47 | 7/27 at 100.00 | 692,475 | |||||||||||
| California Municipal Finance Authority, Revenue Bonds, NorthBay Healthcare Group, Series 2017A: | ||||||||||||||
| 11,830 | 5.250%, 11/01/36 | 11/26 at 100.00 | 11,950,789 | |||||||||||
| 1,420 | 5.250%, 11/01/41 | 11/26 at 100.00 | 1,427,719 | |||||||||||
| 9,335 | 5.000%, 11/01/47 | 11/26 at 100.00 | 8,709,184 | |||||||||||
| 6,770 | 5.250%, 11/01/47 | 11/26 at 100.00 | 6,706,213 | |||||||||||
| 5,330 | California Municipal Financing Authority, Certificates of Participation, Palomar Health, Series 2022A, 5.250%, 11/01/52 - AGM Insured | 11/32 at 100.00 | 5,978,906 | |||||||||||
| 12,485 | California Public Finance Authority, Revenue Bonds, Henry Mayo Newhall Hospital, Series 2017, 5.000%, 10/15/47 | 10/26 at 100.00 | 12,511,611 | |||||||||||
| 14,550 | California Public Finance Authority, Revenue Bonds, Hoag Memorial Hospital Presbyterian, Fixed Period Series 2022A, 4.000%, 7/15/51 | 7/32 at 100.00 | 14,532,082 | |||||||||||
| 5,310 | California Statewide Communities Development Authority, California, Redlands Community Hospital, Revenue Bonds, Series 2016, 5.000%, 10/01/46 | 10/26 at 100.00 | 5,413,910 | |||||||||||
| California Statewide Communities Development Authority, California, Revenue Bonds, Loma Linda University Medical Center, Series 2014A: | ||||||||||||||
| 1,000 | 5.250%, 12/01/34 | 12/24 at 100.00 | 1,005,178 | |||||||||||
| 1,200 | 5.250%, 12/01/44 | 12/24 at 100.00 | 1,197,374 | |||||||||||
| 2,375 | 5.500%, 12/01/54 | 12/24 at 100.00 | 2,345,321 | |||||||||||
| 13,235 | California Statewide Communities Development Authority, California, Revenue Bonds, Loma Linda University Medical Center, Series 2016A, 5.250%, 12/01/56, 144A | 6/26 at 100.00 | 13,296,353 | |||||||||||
| 46,490 | California Statewide Communities Development Authority, California, Revenue Bonds, Loma Linda University Medical Center, Series 2018A, 5.500%, 12/01/58, 144A | 6/28 at 100.00 | 47,284,988 | |||||||||||
| California Statewide Communities Development Authority, Revenue Bonds, Adventist Health System/West, Series 2015A: | ||||||||||||||
| 2,345 | 5.000%, 3/01/35 | 3/26 at 100.00 | 2,411,581 | |||||||||||
| 3,000 | 5.000%, 3/01/45 | 3/26 at 100.00 | 3,043,355 | |||||||||||
| 6,465 | California Statewide Communities Development Authority, Revenue Bonds, John Muir Health, Series 2016A, 4.000%, 8/15/51 | 8/26 at 100.00 | 6,185,336 | |||||||||||
| 2,475 | California Statewide Community Development Authority, Health Revenue Bonds, Enloe Medical Center, Refunding Series 2022A, 5.250%, 8/15/52 - AGM Insured | 8/32 at 100.00 | 2,709,687 | |||||||||||
| California Statewide Community Development Authority, Revenue Bonds, Daughters of Charity Health System, Series 2005A: | ||||||||||||||
| 109 | (d),(e) | 5.750%, 7/01/24 | 4/24 at 100.00 | 109,350 | ||||||||||
| 119 | (d),(e) | 5.750%, 7/01/30 | 4/24 at 100.00 | 119,296 | ||||||||||
| 84 | (d),(e) | 5.750%, 7/01/35 | 4/24 at 100.00 | 83,513 | ||||||||||
| 113 | (d),(e) | 5.500%, 7/01/39 | 4/24 at 100.00 | 112,594 | ||||||||||
| 6,200 | Madera County, California, Certificates of Participation, Valley Children’s Hospital Project, Series 1995, 5.750%, 3/15/28 - NPFG Insured | 4/24 at 100.00 | 6,393,022 | |||||||||||
| Palomar Pomerado Health System, California, Revenue Bonds, Refunding Series 2016: | ||||||||||||||
| 6,250 | 5.000%, 11/01/36 | 11/26 at 100.00 | 6,332,833 | |||||||||||
| 4,500 | 4.000%, 11/01/39 | 11/26 at 100.00 | 4,189,928 | |||||||||||
Principal Amount (000) | Description (a) | Optional Call Provisions (b) | Value | |||||||||||
Health Care (continued) | ||||||||||||||
| $ | 9,000 | University of California Regents, Medical Center Pooled Revenue Bonds, Series 2022P, 5.000%, 5/15/47 | 5/32 at 100.00 | $ | 9,995,538 | |||||||||
| 755 | Washington Township Health Care District, California, Revenue Bonds, Series 2023A, 5.750%, 7/01/53 | 7/33 at 100.00 | 816,903 | |||||||||||
| Total Health Care | 457,386,628 | |||||||||||||
Housing/Multifamily - 17.1% (10.4% of Total Investments) | ||||||||||||||
| 23,285 | California Community Housing Agency, California, Essential Housing Revenue Bonds, Creekwood, Series 2021A, 4.000%, 2/01/56, 144A | 8/31 at 100.00 | 15,582,939 | |||||||||||
| 22,070 | California Community Housing Agency, California, Essential Housing Revenue Bonds, Glendale Properties, Junior Series 2021A-2, 4.000%, 8/01/47, 144A | 8/31 at 100.00 | 18,016,412 | |||||||||||
| 4,300 | California Community Housing Agency, California, Essential Housing Revenue Bonds, Glendale Properties, Senior Series 2021A-1, 4.000%, 2/01/56, 144A | 8/31 at 100.00 | 3,587,854 | |||||||||||
| 23,610 | California Community Housing Agency, California, Essential Housing Revenue Bonds, Serenity at Larkspur Apartments, Series 2020A, 5.000%, 2/01/50, 144A | 2/30 at 100.00 | 18,020,344 | |||||||||||
| 6,960 | California Community Housing Agency, California, Essential Housing Revenue Bonds, Stoneridge Apartments, Series 2021A, 4.000%, 2/01/56, 144A | 2/31 at 100.00 | 5,389,023 | |||||||||||
| 660 | California Community Housing Agency, California, Essential Housing Revenue Bonds, Summit at Sausalito Apartments, Series 2021A-2, 4.000%, 2/01/50, 144A | 8/32 at 100.00 | 486,837 | |||||||||||
| 2,090 | California Community Housing Agency, California, Essential Housing Revenue Bonds, The Arbors, Series 2020A, 5.000%, 8/01/50, 144A | 8/30 at 100.00 | 1,981,424 | |||||||||||
| 1,385 | California Community Housing Agency, California, Essential Housing Revenue Bonds, Verdant at Green Valley Apartments, Series 2019A, 5.000%, 8/01/49, 144A | 8/29 at 100.00 | 1,319,843 | |||||||||||
| 7,575 | California Community Housing Agency, Workforce Housing Revenue Bonds, Annadel Apartments, Series 2019A, 5.000%, 4/01/49, 144A | 4/29 at 100.00 | 6,300,067 | |||||||||||
| 22,288 | California Housing Finance Agency, Municipal Certificate Revenue Bonds, Class A Series 2019-2, 4.000%, 3/20/33 | No Opt. Call | 22,335,046 | |||||||||||
| 13,507 | California Housing Finance Agency, Municipal Certificate Revenue Bonds, Class A Series 2021-1, 3.500%, 11/20/35 | No Opt. Call | 12,763,115 | |||||||||||
| 5,053 | California Housing Finance Agency, Municipal Certificate Revenue Bonds, Class A Series 2021-3, 3.250%, 8/20/36 | No Opt. Call | 4,636,128 | |||||||||||
| 3,313 | California Housing Finance Agency, Municipal Certificate Revenue Bonds, Class A Series2019-1, 4.250%, 1/15/35 | No Opt. Call | 3,305,870 | |||||||||||
| 17,747 | California Housing Finance Agency, Municipal Certificate Revenue Bonds, Class A Social Certificates Series 2023-1, 4.375%, 9/20/36 | No Opt. Call | 17,574,719 | |||||||||||
| California Municipal Finance Authority, Mobile Home Park Revenue Bonds, Caritas Affordable Housing Inc Projects, Senior Series 2014A: | ||||||||||||||
| 1,680 | 5.250%, 8/15/39 | 8/24 at 100.00 | 1,689,422 | |||||||||||
| 2,150 | 5.250%, 8/15/49 | 8/24 at 100.00 | 2,157,438 | |||||||||||
| California Public Finance Authority, University Housing Revenue Bonds, National Campus Community Development - Claremont Properties LLC Claremont Colleges Project, Refunding Series 2023A: | ||||||||||||||
| 1,465 | 5.500%, 7/01/50, 144A | 7/33 at 105.00 | 1,495,509 | |||||||||||
| 1,000 | 6.000%, 7/01/53, 144A | 7/33 at 105.00 | 1,044,984 | |||||||||||
| 23,750 | CMFA Special Finance Agency I, California, Essential Housing Revenue Bonds, The Mix at Center City, Series 2021A-2, 4.000%, 4/01/56, 144A | 4/31 at 100.00 | 17,242,718 | |||||||||||
| 8,060 | CMFA Special Finance Agency, California, Essential Housing Revenue Bonds, Enclave Apartments, Senior Series 2022A-1, 4.000%, 8/01/58, 144A | 2/32 at 100.00 | 6,283,349 | |||||||||||
| 3,265 | CSCDA Community Improvement Authority, California, Essential Housing Revenue Bonds, 777 Place-Pomona, Senior Lien Series 2021A-1, 3.600%, 5/01/47, 144A | 5/32 at 100.00 | 2,704,718 | |||||||||||
| 11,510 | CSCDA Community Improvement Authority, California, Essential Housing Revenue Bonds, 777 Place-Pomona, Senior Lien Series 2021A-2, 3.250%, 5/01/57, 144A | 5/32 at 100.00 | 7,993,879 | |||||||||||
| 1,720 | CSCDA Community Improvement Authority, California, Essential Housing Revenue Bonds, Acacia on Santa Rosa Creek, Mezzanine Lien Series 2021B, 4.000%, 10/01/46, 144A | 10/31 at 100.00 | 1,338,405 | |||||||||||
| NAC | Nuveen California Quality Municipal Income Fund (continued) Portfolio of Investments February 29, 2024 |
Principal Amount (000) | Description (a) | Optional Call Provisions (b) | Value | |||||||||||
Housing/Multifamily | ||||||||||||||
| $ | 12,910 | CSCDA Community Improvement Authority, California, Essential Housing Revenue Bonds, Acacia on Santa Rosa Creek, Senior Lien Series 2021A, 4.000%, 10/01/56, 144A | 10/31 at 100.00 | $ | 11,084,366 | |||||||||
| 1,950 | CSCDA Community Improvement Authority, California, Essential Housing Revenue Bonds, Altana Glendale, Series 2021A-1, 3.500%, 10/01/46, 144A | 10/31 at 100.00 | 1,563,593 | |||||||||||
| 20,500 | CSCDA Community Improvement Authority, California, Essential Housing Revenue Bonds, Altana Glendale, Series 2021A-2, 4.000%, 10/01/56, 144A | 10/31 at 100.00 | 15,888,681 | |||||||||||
| 23,610 | CSCDA Community Improvement Authority, California, Essential Housing Revenue Bonds, Center City Anaheim, Series 2020A, 5.000%, 1/01/54, 144A | 1/31 at 100.00 | 19,062,435 | |||||||||||
| 4,940 | CSCDA Community Improvement Authority, California, Essential Housing Revenue Bonds, Jefferson-Anaheim Series 2021A-1, 2.875%, 8/01/41, 144A | 8/31 at 100.00 | 4,408,496 | |||||||||||
| 7,030 | CSCDA Community Improvement Authority, California, Essential Housing Revenue Bonds, Jefferson-Anaheim Series 2021A-2, 3.125%, 8/01/56, 144A | 8/31 at 100.00 | 5,031,336 | |||||||||||
| 3,750 | CSCDA Community Improvement Authority, California, Essential Housing Revenue Bonds, Millennium South Bay-Hawthorne, Series2021A-1 andA-2, 3.250%, 7/01/56, 144A | 7/32 at 100.00 | 2,584,356 | |||||||||||
| 3,565 | CSCDA Community Improvement Authority, California, Essential Housing Revenue Bonds, Moda at Monrovia Station, Social Series 2021A-1, 3.400%, 10/01/46, 144A | 10/31 at 100.00 | 2,877,249 | |||||||||||
| 21,695 | CSCDA Community Improvement Authority, California, Essential Housing Revenue Bonds, Moda at Monrovia Station, Social Series 2021A-2, 4.000%, 10/01/56, 144A | 10/31 at 100.00 | 15,956,738 | |||||||||||
| CSCDA Community Improvement Authority, California, Essential Housing Revenue Bonds, Monterrey Station Apartments, Senior Lien Series 2021A-1: | ||||||||||||||
| 2,215 | 3.000%, 7/01/43, 144A | 7/32 at 100.00 | 1,737,805 | |||||||||||
| 9,645 | 3.125%, 7/01/56, 144A | 7/32 at 100.00 | 6,505,441 | |||||||||||
| 7,345 | CSCDA Community Improvement Authority, California, Essential Housing Revenue Bonds, Oceanaire-Long Beach, Social Series 2021A-2, 4.000%, 9/01/56, 144A | 9/31 at 100.00 | 5,577,318 | |||||||||||
| 450 | CSCDA Community Improvement Authority, California, Essential Housing Revenue Bonds, Orange City Portfolio, Mezzanine Lien Series 2021B, 4.000%, 3/01/57, 144A | 3/32 at 100.00 | 329,959 | |||||||||||
| 11,325 | CSCDA Community Improvement Authority, California, Essential Housing Revenue Bonds, Parallel-Anaheim Series 2021A, 4.000%, 8/01/56, 144A | 8/31 at 100.00 | 9,453,329 | |||||||||||
| 4,020 | CSCDA Community Improvement Authority, California, Essential Housing Revenue Bonds, Pasadena Portfolio Social Bond, Mezzanine Senior Series 2021B, 4.000%, 12/01/56, 144A | 12/31 at 100.00 | 2,968,686 | |||||||||||
| 8,025 | CSCDA Community Improvement Authority, California, Essential Housing Revenue Bonds, Union South Bay, Series 2021A-2, 4.000%, 7/01/56, 144A | 7/31 at 100.00 | 6,145,544 | |||||||||||
| 2,010 | CSCDA Community Improvement Authority, California, Essential Housing Revenue Bonds, Waterscape Apartments, Mezzanine Lien Series 2021B, 4.000%, 9/01/46, 144A | 9/31 at 100.00 | 1,652,909 | |||||||||||
| 5,700 | CSCDA Community Improvement Authority, California, Essential Housing Revenue Bonds, Westgate Phase 1-Pasadena Apartments, Senior Lien Series2021A-1, 3.000%, 6/01/47, 144A | 6/31 at 100.00 | 4,174,973 | |||||||||||
| 20,760 | CSCDA Community Improvement Authority, California, Essential Housing Revenue Bonds, Westgate Phase 1-Pasadena Apartments, Senior Lien Series2021A-2, 3.125%, 6/01/57, 144A | 6/31 at 100.00 | 13,158,111 | |||||||||||
| 21,185 | CSCDA Community Improvement Authority, California, Essential Housing Revenue Bonds, Wood Creek Apartments, Senior Lien Series 2021A-1, 3.000%, 12/01/49 | 6/32 at 100.00 | 14,473,393 | |||||||||||
| Total Housing/Multifamily | 317,884,761 | |||||||||||||
Long-Term Care - 0.5% (0.3% of Total Investments) | ||||||||||||||
| 6,120 | California Municipal Finance Authority, Revenue Bonds, HumanGood California Obligated Group, Refunding Series 2019, 4.000%, 10/01/37 | 10/26 at 100.00 | 6,164,163 | |||||||||||
| California Statewide Communities Development Authority, Revenue Bonds, Odd Fellows Home of California Project, Insured Refunding Series 2023A: | ||||||||||||||
| 1,900 | 4.000%, 4/01/43 | 4/30 at 100.00 | 1,922,510 | |||||||||||
| 1,000 | 4.125%, 4/01/53 | 4/30 at 100.00 | 1,004,152 | |||||||||||
| Total Long-Term Care | 9,090,825 | |||||||||||||
Principal Amount (000) | Description (a) | Optional Call Provisions (b) | Value | |||||||||
Tax Obligation/General - 27.4% (16.6% of Total Investments) | ||||||||||||
| $ | 4,125 | Alameda Unified School District, Alameda County, California, General Obligation Bonds, Series 2004A, 0.000%, 8/01/25 - AGM Insured | No Opt. Call | $ | 3,938,013 | |||||||
| 4,420 | Butte-Glenn Community College District, Butte and Glenn Counties, California, General Obligation Bonds, Election 2016 Series 2017A, 5.250%, 8/01/46 | 8/27 at 100.00 | 4,684,592 | |||||||||
| 2,500 | California State, General Obligation Bonds, Refunding Various Purpose Bid Group C Series 2016, 5.000%, 9/01/32 | 9/26 at 100.00 | 2,630,816 | |||||||||
| California State, General Obligation Bonds, Refunding Various Purpose Series 2016: | ||||||||||||
| 2,100 | 5.000%, 8/01/33 | 8/26 at 100.00 | 2,204,850 | |||||||||
| 4,000 | 5.000%, 9/01/35 | 9/26 at 100.00 | 4,191,232 | |||||||||
| 3,570 | California State, General Obligation Bonds, Refunding Various Purpose Series 2021. Forward Delivery, 5.000%, 9/01/41 | 9/31 at 100.00 | 4,026,432 | |||||||||
| 50 | California State, General Obligation Bonds, Series 2013, 5.000%, 2/01/29 | 4/24 at 100.00 | 50,068 | |||||||||
| 3,075 | California State, General Obligation Bonds, Series 2014, 5.000%, 12/01/43 | 4/24 at 100.00 | 3,077,051 | |||||||||
| 1,000 | California State, General Obligation Bonds, Various Purpose Refunding Series 2016, 5.000%, 9/01/34 | 9/26 at 100.00 | 1,049,554 | |||||||||
| California State, General Obligation Bonds, Various Purpose Series 2014: | ||||||||||||
| 24,970 | 5.000%, 5/01/32 | 5/24 at 100.00 | 25,039,851 | |||||||||
| 10,620 | 5.000%, 10/01/44 | 10/24 at 100.00 | 10,678,071 | |||||||||
| 14,780 | California State, General Obligation Bonds, Various Purpose Series 2017, 5.000%, 11/01/47 | 11/27 at 100.00 | 15,628,159 | |||||||||
| 5,000 | California State, General Obligation Bonds, Various Purpose Series 2018. Bid Group A/B, 5.000%, 10/01/48 | 10/28 at 100.00 | 5,348,294 | |||||||||
| 1,770 | California State, General Obligation Bonds, Various Purpose Series 2020, 4.000%, 11/01/45 | 11/25 at 100.00 | 1,770,894 | |||||||||
| 1,860 | Centinela Valley Union High School District, Los Angeles County, California, General Obligation Bonds, Series 2002A, 5.250%, 2/01/26 - NPFG Insured | No Opt. Call | 1,915,270 | |||||||||
| 5,400 | Central Unified School District, Fresno County, California, General Obligation Bonds, 2016 Election Series 2018B., 4.000%, 8/01/48 | 8/26 at 100.00 | 5,375,734 | |||||||||
| 7,860 | Corona-Norco Unified School District, Riverside County, California, General Obligation Bonds, Election 2014, Series 2019C, 3.000%, 8/01/44 - BAM Insured | 8/28 at 100.00 | 6,733,182 | |||||||||
| 15,285 | Desert Community College District, Riverside County, California, General Obligation Bonds, Election of 2016 Series 2024, 4.000%, 8/01/51 | 8/33 at 100.00 | 15,286,799 | |||||||||
| 5,000 | Elk Grove Unified School District, Sacramento County, California, General Obligation Bonds, Election of 2016, Series 2017, 4.000%, 8/01/46 | 8/26 at 100.00 | 4,940,994 | |||||||||
| 12,500 | Glendale Community College District, Los Angeles County, California, General Obligation Bonds, Election 2016 Taxable Refunding Series 2020B, 4.000%, 8/01/50 | 8/29 at 100.00 | 12,532,090 | |||||||||
| 18,500 | Grossmont Healthcare District, California, General Obligation Bonds, Refunding Series 2015D, 4.000%, 7/15/40 | 7/25 at 100.00 | 18,505,548 | |||||||||
| 6,185 | Grossmont-Cuyamaca Community College District, California, General Obligation Bonds, Refunding Series 2018, 4.000%, 8/01/47 | 8/28 at 100.00 | 6,187,634 | |||||||||
| 5,150 | Hacienda La Puente Unified School District Facilities Financing Authority, California, General Obligation Revenue Bonds, Program Series 2007, 5.000%, 8/01/26 - AGM Insured | No Opt. Call | 5,450,881 | |||||||||
| 3,000 | Hacienda La Puente Unified School District, Los Angeles County, California, General Obligation Bonds, 2016 Election, Series 2017A, 4.000%, 8/01/47 | 8/27 at 100.00 | 3,000,988 | |||||||||
| 5,585 | Lake Elsinore Unified School District, Riverside County, California, General Obligation Bonds, 2016 Election Series B, 4.000%, 8/01/49 - BAM Insured | 8/27 at 100.00 | 5,580,738 | |||||||||
| 5,630 | (f) | Lake Tahoe Unified School District, El Dorado County, California, General Obligation Bonds, Series 2010, 0.000%, 8/01/45 - AGM Insured | No Opt. Call | 4,672,158 | ||||||||
| 4,140 | Los Angeles Community College District, California, General Obligation Bonds, 2008 Election Series 2017J, 4.000%, 8/01/41 | 8/27 at 100.00 | 4,162,479 | |||||||||
| 1,285 | Los Angeles Unified School District, Los Angeles County, California, General Obligation Bonds, Measure Q Series 2020C, 4.000%, 7/01/40 | 7/30 at 100.00 | 1,327,394 | |||||||||
| 3,100 | Manteca Unified School District, San Joaquin County, California, General Obligation Bonds, Election 2014 Series 2017B, 4.000%, 8/01/42 | 8/27 at 100.00 | 3,113,945 | |||||||||
| Marin Healthcare District, Marin County, California, General Obligation Bonds, 2013 Election, Series 2015A: | ||||||||||||
| 10,000 | 4.000%, 8/01/40 | 8/25 at 100.00 | 9,931,753 | |||||||||
| 7,500 | 4.000%, 8/01/45 | 8/25 at 100.00 | 7,410,544 | |||||||||
| NAC | Nuveen California Quality Municipal Income Fund (continued) Portfolio of Investments February 29, 2024 |
Principal Amount (000) | Description (a) | Optional Call Provisions (b) | Value | |||||||||
Tax Obligation/General | ||||||||||||
| $ | 4,100 | Monrovia Unified School District, Los Angeles County, California, General Obligation Bonds, Series 2001B, 0.000%, 8/01/27 - FGIC Insured | No Opt. Call | $ | 3,680,954 | |||||||
| 4,650 | Monterey Peninsula Community College District, Monterey County, California, General Obligation Bonds, Election of 2020 Series 2024B, 4.000%, 8/01/51 | 8/33 at 100.00 | 4,620,649 | |||||||||
| 6,950 | Morgan Hill Unified School District, Santa Clara County, California, General Obligation Bonds, Election 2012 Series 2017B, 4.000%, 8/01/47 | 8/27 at 100.00 | 6,974,285 | |||||||||
| 10,765 | North Orange County Community College District, California, General Obligation Bonds, Election of 2002 Series 2003B, 0.000%, 8/01/27 - FGIC Insured | No Opt. Call | 9,664,748 | |||||||||
| 5,000 | Oakland Unified School District, Alameda County, California, General Obligation Bonds, Election 2020, Series 2023A, 5.250%, 8/01/48 - AGM Insured | 8/33 at 100.00 | 5,731,125 | |||||||||
| 1,815 | Orland Joint Unified School District, Glenn and Tehama Counties, California, General Obligation Bonds, 2008 Election, Series 2012B, 6.000%, 8/01/51 | 8/37 at 100.00 | 1,355,149 | |||||||||
| 10,330 | Palomar Pomerado Health, California, General Obligation Bonds, Convertible Capital Appreciation, Election 2004 Series 2010A, 0.000%, 8/01/35 | No Opt. Call | 6,724,222 | |||||||||
| 5,000 | Paramount Unified School District, Los Angeles County, California, General Obligation Bonds, Election 2006 Series 2011, 6.375%, 8/01/45 | 2/33 at 100.00 | 6,102,312 | |||||||||
| 7,350 | Pleasant Valley School District, Ventura County, California, General Obligation Bonds, Refunding Series B, 4.000%, 8/01/46 | 8/29 at 100.00 | 7,395,782 | |||||||||
| 16,736 | Puerto Rico, General Obligation Bonds, Restructured Series 2022A-1, 4.000%, 7/01/41 | 7/31 at 103.00 | 15,544,962 | |||||||||
| 28,000 | San Bernardino Community College District, California, General Obligation Bonds, Election of 2008 Series 2009B, 0.000%, 8/01/44 | No Opt. Call | 11,521,101 | |||||||||
| 7,500 | San Francisco Bay Area Rapid Transit District, California, General Obligation Bonds, Election of 2016, Green Series 2022D-1, 4.250%, 8/01/52 | 2/32 at 100.00 | 7,625,506 | |||||||||
| 9,760 | San Francisco Community College District, California, General Obligation Bonds, Election 2020 Series 2020A, 4.000%, 6/15/45 | 6/30 at 100.00 | 9,808,915 | |||||||||
| 21,000 | San Marcos Unified School District, San Diego County, California, General Obligation Bonds, 2010 Election, Series 2012B, 0.000%, 8/01/51 | No Opt. Call | 6,240,679 | |||||||||
| 1,220 | (f) | San Mateo Union High School District, San Mateo County, California, General Obligation Bonds, Election 2010 Series 2011A, 0.000%, 7/01/51 | 9/41 at 100.00 | 915,782 | ||||||||
| 4,970 | San Rafael City High School District, Marin County, California, General Obligation Bonds, Series 2004B, 0.000%, 8/01/27 - FGIC Insured | No Opt. Call | 4,441,133 | |||||||||
| 810 | Santa Maria Joint Union High School District, Santa Barbara and San Luis Obispo Counties, California, General Obligation Bonds, Series 2003B, 5.625%, 8/01/24 - AGM Insured | No Opt. Call | 818,114 | |||||||||
| 4,175 | Southwestern Community College District, San Diego County, California, General Obligation Bonds, Election of 2002, Series 2004, 0.000%, 8/01/25 - FGIC Insured | No Opt. Call | 3,987,955 | |||||||||
| 5,530 | (f) | Stockton Unified School District, San Joaquin County, California, General Obligation Bonds, Election 2008 Series 2011D, 0.000%, 8/01/50 - AGM Insured | 8/37 at 100.00 | 6,189,710 | ||||||||
| 26,000 | (f) | Sylvan Union School District, Stanislaus County, California, General Obligation Bonds, Election of 2006, Series 2010, 0.000%, 8/01/49 - AGM Insured | No Opt. Call | 22,469,322 | ||||||||
| Washington Township Health Care District, Alameda County, California, General Obligation Bonds, 2004 Election Series 2013B: | ||||||||||||
| 4,740 | 5.500%, 8/01/38 | 8/24 at 100.00 | 4,768,206 | |||||||||
| 4,830 | 5.500%, 8/01/40 | 8/24 at 100.00 | 4,856,111 | |||||||||
| 20,510 | 5.000%, 8/01/43 | 8/24 at 100.00 | 20,576,516 | |||||||||
| Washington Township Health Care District, Alameda County, California, General Obligation Bonds, 2012 Election Series 2013A: | ||||||||||||
| 4,355 | 5.500%, 8/01/38 | 8/24 at 100.00 | 4,380,915 | |||||||||
| 3,500 | 5.500%, 8/01/40 | 8/24 at 100.00 | 3,518,921 | |||||||||
| 8,410 | Washington Township Health Care District, Alameda County, California, General Obligation Bonds, 2012 Election Series 2015B, 4.000%, 8/01/45 | 8/25 at 100.00 | 8,262,526 | |||||||||
| Washington Township Health Care District, California, General Obligation Bonds, 2020 Election Series 2023B: | ||||||||||||
| 750 | 4.250%, 8/01/45 - AGM Insured | 8/33 at 100.00 | 769,064 | |||||||||
| 2,575 | 5.250%, 8/01/48 | 8/33 at 100.00 | 2,894,193 | |||||||||
Principal Amount (000) | Description (a) | Optional Call Provisions (b) | Value | |||||||||
Tax Obligation/General | ||||||||||||
| $ | 140,160 | (f) | Yosemite Community College District, California, General Obligation Bonds, Capital Appreciation, Election 2004, Series 2010D, 0.000%, 8/01/42 | No Opt. Call | $ | 116,614,059 | ||||||
| Total Tax Obligation/General | 508,898,924 | |||||||||||
Tax Obligation/Limited - 17.6% (10.7% of Total Investments) | ||||||||||||
| 1,675 | Beaumont Financing Authority, California, Local Agency Revenue Bonds, Improvement Area 19A, Series 2015B, 5.000%, 9/01/35 | 9/25 at 100.00 | 1,711,096 | |||||||||
| 1,655 | Bell Community Housing Authority, California, Lease Revenue Bonds, Series 2005, 5.000%, 10/01/36 - AMBAC Insured | 4/24 at 100.00 | 1,661,092 | |||||||||
| 615 | Brentwood Infrastructure Financing Authority, California, Infrastructure Revenue Bonds, Refunding Subordinated Series 2014B, 5.000%, 9/02/36 | 9/24 at 100.00 | 618,300 | |||||||||
| 1,200 | California Infrastructure and Economic Development Bank, Lease Revenue Bonds, California State Teachers Retirement System Headquarters Expansion, Green Bond-Climate Bond Certified Series 2019, 5.000%, 8/01/44 | 8/29 at 100.00 | 1,293,904 | |||||||||
| 10,525 | California State Public Works Board, Lease Revenue Bonds, Department of Corrections & Rehabilitation, Various Correctional Facilities Series 2014A, 5.000%, 9/01/39 | 9/24 at 100.00 | 10,583,665 | |||||||||
| 17,395 | California State Public Works Board, Lease Revenue Bonds, Judicial Council of California, New Stockton Courthouse, Series 2014B, 5.000%, 10/01/39 | 10/24 at 100.00 | 17,508,859 | |||||||||
| 13,520 | California State Public Works Board, Lease Revenue Bonds, Various Capital Projects, Series 2014E, 5.000%, 9/01/39 | 9/24 at 100.00 | 13,595,359 | |||||||||
| 2,550 | California Statewide Communities Development Authority, Statewide Community Infrastructure Program Revenue Bonds, Series 2017C, 5.000%, 9/02/47 | 9/27 at 100.00 | 2,604,028 | |||||||||
| 2,000 | California Statewide Communities Development Authority, Statewide Community Infrastructure Program Revenue Bonds, Series 2018A, 5.000%, 9/02/47 | 9/28 at 100.00 | 2,049,275 | |||||||||
| 545 | Golden State Tobacco Securitization Corporation, California, Tobacco Settlement Asset-Backed Revenue Bonds, Series 2022A-1, 5.000%, 6/01/51 | 12/31 at 100.00 | 572,050 | |||||||||
| Government of Guam, Business Privilege Tax Bonds, Refunding Series 2015D: | ||||||||||||
| 9,000 | 5.000%, 11/15/32 | 11/25 at 100.00 | 9,188,421 | |||||||||
| 11,000 | 5.000%, 11/15/39 | 11/25 at 100.00 | 11,121,749 | |||||||||
| Jurupa Public Financing Authority, California, Special Tax Revenue Bonds, Series 2014A: | ||||||||||||
| 530 | 5.000%, 9/01/29 | 9/24 at 100.00 | 534,995 | |||||||||
| 1,900 | 5.000%, 9/01/30 | 9/24 at 100.00 | 1,917,536 | |||||||||
| 1,220 | 5.000%, 9/01/31 | 9/24 at 100.00 | 1,230,961 | |||||||||
| 1,955 | Jurupa Public Financing Authority, California, Special Tax Revenue Bonds, Series 2015A, 5.000%, 9/01/43 | 9/25 at 100.00 | 2,000,503 | |||||||||
| 810 | Lake Elsinore Public Financing Authority, California, Local Agency Revenue Bonds, Refunding Series 2015, 5.000%, 9/01/40 | 9/25 at 100.00 | 820,222 | |||||||||
| 1,000 | Lathrop, California, Limited Obligation Improvement Bonds, Crossroads Assessment District, Series 2015, 5.000%, 9/02/40 | 9/25 at 100.00 | 1,007,738 | |||||||||
| 11,170 | Los Angeles County Metropolitan Transportation Authority, California, Measure R Sales Tax Revenue Bonds, Refunding Junior Subordinate Green Series 2020A, 5.000%, 6/01/24 | No Opt. Call | 11,220,406 | |||||||||
| Los Angeles County Metropolitan Transportation Authority, California, Measure R Sales Tax Revenue Bonds, Senior Series 2016A: | ||||||||||||
| 5,125 | 5.000%, 6/01/36 | 6/26 at 100.00 | 5,362,428 | |||||||||
| 5,620 | 5.000%, 6/01/37 | 6/26 at 100.00 | 5,865,143 | |||||||||
| 10,455 | 5.000%, 6/01/38 | 6/26 at 100.00 | 10,876,710 | |||||||||
| Los Angeles County Metropolitan Transportation Authority, California, Proposition C Sales Tax Revenue Bonds, Green Senior Lien Series 2019A: | ||||||||||||
| 5,000 | 5.000%, 7/01/39 | 7/28 at 100.00 | 5,433,976 | |||||||||
| 20,735 | 5.000%, 7/01/44 | 7/28 at 100.00 | 22,271,038 | |||||||||
| 3,995 | Los Angeles County Metropolitan Transportation Authority, California, Proposition C Sales Tax Revenue Bonds, Senior Lien Series 2017A, 5.000%, 7/01/42 | 7/27 at 100.00 | 4,229,043 | |||||||||
| 2,000 | Los Angeles County Public Works Financing Authority, California, Lease Revenue Bonds, Series 2019E-1, 5.000%, 12/01/49 | 12/29 at 100.00 | 2,161,488 | |||||||||
| 1,835 | Modesto, California, Speical Tax Bonds, Community Faclities District 2004-1 Village One 2, Refunding Series 2014, 5.000%, 9/01/31 | 9/24 at 100.00 | 1,852,218 | |||||||||
| NAC | Nuveen California Quality Municipal Income Fund (continued) Portfolio of Investments February 29, 2024 |
Principal Amount (000) | Description (a) | Optional Call Provisions (b) | Value | |||||||||||
Tax Obligation/Limited | ||||||||||||||
| $ | 1,000 | Norco Redevelopment Agency, California, Tax Allocation Bonds, Project Area 1, Series 2009, 7.000%, 3/01/34 | 4/24 at 100.00 | $ | 1,003,378 | |||||||||
| 6,815 | Ontario Redevelopment Financing Authority, San Bernardino County, California, Revenue Bonds, Redevelopment Project 1, Refunding Series 1995, 7.400%, 8/01/25 - NPFG Insured | No Opt. Call | 6,972,608 | |||||||||||
| 6,055 | Orange County Local Transportation Authority, California, Measure M2 Sales Tax Revenue Bonds, Limited Tax Series 2019, 5.000%, 2/15/41 | 2/29 at 100.00 | 6,633,019 | |||||||||||
| Puerto Rico Sales Tax Financing Corporation, Sales Tax Revenue Bonds, Restructured 2018A-1: | ||||||||||||||
| 14,741 | 0.000%, 7/01/51 | 7/28 at 30.01 | 3,561,197 | |||||||||||
| 85,962 | 5.000%, 7/01/58 | 7/28 at 100.00 | 86,606,543 | |||||||||||
| Puerto Rico Sales Tax Financing Corporation, Sales Tax Revenue Bonds, Taxable Restructured Cofina Project Series 2019A-2: | ||||||||||||||
| 5,500 | 4.329%, 7/01/40 | 7/28 at 100.00 | 5,474,855 | |||||||||||
| 43 | 4.536%, 7/01/53 | 7/28 at 100.00 | 41,655 | |||||||||||
| 8,185 | 4.784%, 7/01/58 | 7/28 at 100.00 | 8,164,556 | |||||||||||
| 3,500 | Rancho Cucamonga Redevelopment Agency Successor Agency, California, Tax Allocation Bonds, Rancho Redevelopment Project, Series 2014, 5.000%, 9/01/30 | 9/24 at 100.00 | 3,530,072 | |||||||||||
| 815 | River Islands Public Financing Authority, California, Special Tax Bonds, Community Facilities District 2003-1 Improvement Area 1, Refunding Series2022A-1, 4.250%, 9/01/47 - AGM Insured | 9/29 at 103.00 | 825,302 | |||||||||||
| 5,000 | Riverside County Transportation Commission, California, Sales Tax Revenue Bonds, Refunding Limited Tax Series 2017B, 5.000%, 6/01/38 | 12/27 at 100.00 | 5,360,242 | |||||||||||
| Riverside County, California, Special Tax Bonds, Community Facilities District 04-2 Lake Hill Crest, Series 2012: | ||||||||||||||
| 990 | 5.000%, 9/01/29 | 9/24 at 100.00 | 998,321 | |||||||||||
| 2,615 | 5.000%, 9/01/35 | 9/24 at 100.00 | 2,634,650 | |||||||||||
| Riverside County, California, Special Tax Bonds, Community Facilities District 05-8 Scott Road, Series 2013: | ||||||||||||||
| 555 | 5.000%, 9/01/30 | 4/24 at 100.00 | 555,663 | |||||||||||
| 3,120 | 5.000%, 9/01/42 | 4/24 at 100.00 | 3,121,797 | |||||||||||
| Roseville, California, Special Tax Bonds, Community Facilities District 1 Westpark, Refunding Series 2015: | ||||||||||||||
| 385 | 5.000%, 9/01/31 | 9/25 at 100.00 | 392,975 | |||||||||||
| 575 | 5.000%, 9/01/37 | 9/25 at 100.00 | 584,719 | |||||||||||
| 4,250 | Sacramento City Financing Authority, California, Tax Allocation Revenue Bonds, Merged Downtown Sacramento and Oak Park Projects, Series 2005A, 0.000%, 12/01/31 - FGIC Insured | No Opt. Call | 3,248,678 | |||||||||||
| San Buenaventura Redevelopment Agency, California, Tax Allocation Bonds, Merged Project Areas, Series 2008: | ||||||||||||||
| 840 | 7.750%, 8/01/28 | 4/24 at 100.00 | 843,163 | |||||||||||
| 1,325 | 8.000%, 8/01/38 | 4/24 at 100.00 | 1,330,253 | |||||||||||
| 1,725 | San Francisco City and County Redevelopment Agency Successor Agency, California, Special Tax Bonds, Community Facilities District 7, Hunters Point Shipyard Phase One Improvements, Refunding Series 2014, 5.000%, 8/01/39 | 8/24 at 100.00 | 1,731,924 | |||||||||||
| 5,000 | San Francisco City and County Redevelopment Agency Successor Agency, California, Tax Allocation Bonds, Mission Bay North Redevelopment Project, Refunding Series 2016A, 5.000%, 8/01/41 - NPFG Insured | 8/26 at 100.00 | 5,186,459 | |||||||||||
| 785 | Signal Hill Redevelopment Agency, California, Project 1 Tax Allocation Bonds, Series 2011, 7.000%, 10/01/26 | 4/24 at 100.00 | 787,089 | |||||||||||
| 2,500 | Stockton Public Financing Authority, California, Revenue Bonds, Arch Road East Community Facility District 99-02, Series 2018A, 5.000%, 9/01/37 | 9/25 at 103.00 | 2,615,383 | |||||||||||
| Temecula Public Financing Authority, California, Special Tax Bonds, Community Facilities District 16-01, Series 2017: | ||||||||||||||
| 960 | 5.500%, 9/01/27, 144A | No Opt. Call | 1,001,748 | |||||||||||
| 1,435 | 5.750%, 9/01/32, 144A | 9/27 at 100.00 | 1,541,683 | |||||||||||
| 5,520 | 6.250%, 9/01/47, 144A | 9/27 at 100.00 | 5,787,139 | |||||||||||
| 1,350 | Temecula Valley Unified School District, Riverside County, California, Special Tax Bonds, Community Facilities District 2002-1 Improvement Area 1, Series 2012, 5.000%, 9/01/33 | 4/24 at 100.00 | 1,351,563 | |||||||||||
| 1,700 | Tracy, California, Special Tax Bonds, Community Facilities District 2016-1 Tracy Hills, Improvement Area 2, Series 2023, 5.750%, 9/01/48 | 9/29 at 103.00 | 1,808,538 | |||||||||||
Principal Amount (000) | Description (a) | Optional Call Provisions (b) | Value | |||||||||||
Tax Obligation/Limited | ||||||||||||||
| Transbay Joint Powers Authority, California, Tax Allocation Bonds, Senior Green Series 2020A: | ||||||||||||||
| $ | 4,315 | 5.000%, 10/01/45 | 4/30 at 100.00 | $ | 4,438,688 | |||||||||
| 7,285 | 5.000%, 10/01/49 | 4/30 at 100.00 | 7,434,285 | |||||||||||
| 1,535 | Virgin Islands Public Finance Authority, Gross Receipts Taxes Loan Note, Refunding Series 2012A, 5.000%, 10/01/32 - AGM Insured | 4/24 at 100.00 | 1,544,967 | |||||||||||
| Total Tax Obligation/Limited | 326,405,315 | |||||||||||||
Transportation - 27.1% (16.4% of Total Investments) | ||||||||||||||
| 10,000 | Bay Area Toll Authority, California, Revenue Bonds, San Francisco Bay Area Toll Bridge, Subordinate Fixed Rate Series 2017S-7, 4.000%, 4/01/37 | 4/27 at 100.00 | 10,165,549 | |||||||||||
| 7,775 | California Municipal Finance Authority, Special Facility Revenue Bonds, United Airlines, Inc. Los Angeles International Airport Project, Series 2019, 4.000%, 7/15/29, (AMT) | No Opt. Call | 7,673,235 | |||||||||||
| 7,979 | Foothill/Eastern Transportation Corridor Agency, California, Toll Road Revenue Bonds, Refunding Senior Lien Series 2021A, 4.000%, 1/15/46 | 1/31 at 100.00 | 7,763,233 | |||||||||||
| 1,200 | Long Beach, California, Harbor Revenue Bonds, Series 2015D, 5.000%, 5/15/42 | 5/25 at 100.00 | 1,219,946 | |||||||||||
| 7,500 | Long Beach, California, Harbor Revenue Bonds, Series 2019A, 5.000%, 5/15/49 | 5/29 at 100.00 | 8,068,145 | |||||||||||
| Los Angeles Department of Airports, California, Revenue Bonds, Los Angeles International Airport, Refunding & Subordinate Series 2022C: | ||||||||||||||
| 3,730 | 4.000%, 5/15/41, (AMT) | 5/32 at 100.00 | 3,699,513 | |||||||||||
| 4,000 | 3.250%, 5/15/49, (AMT) | 5/32 at 100.00 | 3,206,321 | |||||||||||
| Los Angeles Department of Airports, California, Revenue Bonds, Los Angeles International Airport, Refunding Subordinate Lien Private Activity Series 2021A: | ||||||||||||||
| 4,160 | 5.000%, 5/15/46, (AMT) | 5/31 at 100.00 | 4,385,815 | |||||||||||
| 20,895 | 5.000%, 5/15/51, (AMT) | 5/31 at 100.00 | 21,870,525 | |||||||||||
| Los Angeles Department of Airports, California, Revenue Bonds, Los Angeles International Airport, Senior Lien Series 2015D: | ||||||||||||||
| 2,000 | 5.000%, 5/15/36, (AMT) | 5/25 at 100.00 | 2,026,680 | |||||||||||
| 24,920 | 5.000%, 5/15/41, (AMT) | 5/25 at 100.00 | 25,120,992 | |||||||||||
| Los Angeles Department of Airports, California, Revenue Bonds, Los Angeles International Airport, Senior Series 2022H: | ||||||||||||||
| 4,850 | 5.000%, 5/15/42, (AMT) | 11/31 at 100.00 | 5,211,033 | |||||||||||
| 5,080 | 5.000%, 5/15/52, (AMT) | 11/31 at 100.00 | 5,324,133 | |||||||||||
| 24,405 | Los Angeles Department of Airports, California, Revenue Bonds, Los Angeles International Airport, Subordinate Lien Series 2016B, 5.000%, 5/15/46, (AMT) | 5/26 at 100.00 | 24,722,343 | |||||||||||
| 3,310 | Los Angeles Department of Airports, California, Revenue Bonds, Los Angeles International Airport, Subordinate Lien Series 2018C, 5.000%, 5/15/44, (AMT) | 11/27 at 100.00 | 3,405,684 | |||||||||||
| 5,000 | Los Angeles Department of Airports, California, Revenue Bonds, Los Angeles International Airport, Subordinate Lien Series 2018D, 5.000%, 5/15/48, (AMT) | 5/29 at 100.00 | 5,176,541 | |||||||||||
| 5,485 | Los Angeles Department of Airports, California, Revenue Bonds, Los Angeles International Airport, Subordinate Lien Series 2019E, 5.000%, 5/15/44 | 11/28 at 100.00 | 5,927,880 | |||||||||||
| Los Angeles Department of Airports, California, Revenue Bonds, Los Angeles International Airport, Subordinate Lien Series 2021D: | ||||||||||||||
| 945 | 5.000%, 5/15/37, (AMT) | 11/31 at 100.00 | 1,033,894 | |||||||||||
| 22,230 | 5.000%, 5/15/46, (AMT) | 11/31 at 100.00 | 23,508,178 | |||||||||||
| 3,750 | Los Angeles Department of Airports, California, Revenue Bonds, Los Angeles International Airport, Subordinate Lien Series 2022A, 5.000%, 5/15/45, (AMT) | 5/32 at 100.00 | 3,989,302 | |||||||||||
| 4,780 | Riverside County Transportation Commission, California, Toll Revenue Second Lien Bonds, RCTC 91 Express Lanes, Refunding Series 2021C, 4.000%, 6/01/47 | 6/31 at 100.00 | 4,618,146 | |||||||||||
| 7,750 | Riverside County Transportation Commission, California, Toll Revenue Senior Lien Bonds, RCTC 91 Express Lanes, Refunding Series 2021B-1, 4.000%, 6/01/46 | 6/31 at 100.00 | 7,582,077 | |||||||||||
| San Diego County Regional Airport Authority, California, Airport Revenue Bonds, International Senior Series 2023B: | ||||||||||||||
| 23,740 | 5.000%, 7/01/53, (AMT) | 7/33 at 100.00 | 24,846,021 | |||||||||||
| 20,000 | 5.250%, 7/01/58, (AMT) | 7/33 at 100.00 | 21,358,780 | |||||||||||
| NAC | Nuveen California Quality Municipal Income Fund (continued) Portfolio of Investments February 29, 2024 |
Principal Amount (000) | Description (a) | Optional Call Provisions (b) | Value | |||||||||
Transportation | ||||||||||||
| San Diego County Regional Airport Authority, California, Airport Revenue Bonds, Refunding Subordinate Series 2019A: | ||||||||||||
| $ | 3,600 | 5.000%, 7/01/34 | 7/29 at 100.00 | $ | 4,067,564 | |||||||
| 1,250 | 5.000%, 7/01/36 | 7/29 at 100.00 | 1,399,524 | |||||||||
| 6,000 | San Diego County Regional Airport Authority, California, Airport Revenue Bonds, Subordinate Series 2021A, 4.000%, 7/01/51 | 7/31 at 100.00 | 5,892,445 | |||||||||
| San Francisco Airport Commission, California, Revenue Bonds, San Francisco International Airport, Refunding Second Series 2023C: | ||||||||||||
| 16,410 | 5.500%, 5/01/42, (AMT) | 5/33 at 100.00 | 18,534,220 | |||||||||
| 11,000 | 5.500%, 5/01/43, (AMT) | 5/33 at 100.00 | 12,365,469 | |||||||||
| 1,845 | 5.750%, 5/01/48, (AMT) | 5/33 at 100.00 | 2,076,185 | |||||||||
| 14,500 | (g) | San Francisco Airport Commission, California, Revenue Bonds, San Francisco International Airport, Second Series 2022A, 5.000%, 5/01/52, (AMT), (UB) | 5/32 at 100.00 | 15,130,361 | ||||||||
| 34,270 | San Francisco Airports Commission, California, Revenue Bonds, San Francisco International Airport, Governmental Purpose Second Series 2017B, 5.000%, 5/01/47 | 5/27 at 100.00 | 35,657,548 | |||||||||
| San Francisco Airports Commission, California, Revenue Bonds, San Francisco International Airport, Refunding Second Series 2019A: | ||||||||||||
| 3,040 | 5.000%, 5/01/38, (AMT) | 5/29 at 100.00 | 3,224,805 | |||||||||
| 43,180 | 5.000%, 5/01/44, (AMT) | 5/29 at 100.00 | 45,015,370 | |||||||||
| 25,885 | 5.000%, 5/01/49, (AMT) | 5/29 at 100.00 | 26,727,469 | |||||||||
| 22,835 | San Francisco Airports Commission, California, Revenue Bonds, San Francisco International Airport, Second Series 2016B, 5.000%, 5/01/46, (AMT) | 5/26 at 100.00 | 23,127,028 | |||||||||
| 10,910 | San Francisco Airports Commission, California, Revenue Bonds, San Francisco International Airport, Second Series 2017A, 5.000%, 5/01/42, (AMT) | 5/27 at 100.00 | 11,216,564 | |||||||||
| San Francisco Airports Commission, California, Revenue Bonds, San Francisco International Airport, Second Series 2018D: | ||||||||||||
| 3,780 | 5.000%, 5/01/48, (AMT) | 5/28 at 100.00 | 3,878,887 | |||||||||
| 24,820 | 5.250%, 5/01/48, (AMT) | 5/28 at 100.00 | 25,722,319 | |||||||||
| 4,900 | San Francisco Airports Commission, California, Revenue Bonds, San Francisco International Airport, Second Series 2019E, 5.000%, 5/01/40, (AMT) | 5/29 at 100.00 | 5,161,390 | |||||||||
| 7,510 | San Francisco Airports Commission, California, Revenue Bonds, San Francisco International Airport, Second Series 2019F, 5.000%, 5/01/50 | 5/29 at 100.00 | 8,012,686 | |||||||||
| 16,936 | San Joaquin Hills Transportation Corridor Agency, Orange County, California, Refunding Senior Lien Toll Road Revenue Bonds, Series 2021A, 4.000%, 1/15/50 | 1/32 at 100.00 | 16,808,909 | |||||||||
| 6,250 | San Jose, California, Airport Revenue Bonds, Refunding Series 2017A, 5.000%, 3/01/47, (AMT) | 3/27 at 100.00 | 6,350,535 | |||||||||
| Total Transportation | 502,273,244 | |||||||||||
U.S. Guaranteed - 11.1% (6.7% of Total Investments) (h) | ||||||||||||
| 18,400 | Antelope Valley Community College District, Los Angeles County, California, General Obligation Bonds, Election 2016 Series 2017A, 5.250%, 8/01/42, (Pre-refunded 2/15/27) | 2/27 at 100.00 | 19,881,899 | |||||||||
| 1,285 | California Health Facilities Financing Authority, California, Revenue Bonds, Sutter Health, Refunding Series 2015A, 5.000%, 8/15/43, (Pre-refunded 8/15/25) | 8/25 at 100.00 | 1,322,142 | |||||||||
| California Health Facilities Financing Authority, California, Revenue Bonds, Sutter Health, Refunding Series 2016B: | ||||||||||||
| 12,880 | 5.000%, 11/15/46, (Pre-refunded 11/15/26) | 11/26 at 100.00 | 13,645,600 | |||||||||
| 16,250 | California Health Facilities Financing Authority, California, Revenue Bonds, Sutter Health, Series 2016A, 5.000%, 11/15/46, (Pre-refunded 11/15/25) | 11/25 at 100.00 | 16,853,928 | |||||||||
| 18,250 | California Municipal Finance Authority, Revenue Bonds, Pomona College, Series 2017, 5.000%, 1/01/48, (Pre-refunded 1/01/28) | 1/28 at 100.00 | 19,988,814 | |||||||||
| 14,400 | California State University, Systemwide Revenue Bonds, Series 2014A, 5.000%, 11/01/32, (Pre-refunded 11/01/24) | 11/24 at 100.00 | 14,584,510 | |||||||||
| 5,500 | California Statewide Communities Development Authority, Revenue Bonds, Buck Institute for Research on Aging, Series 2014, 5.000%, 11/15/44, (Pre-refunded 11/15/24) - AGM Insured | 11/24 at 100.00 | 5,574,582 | |||||||||
| 2,670 | California Statewide Communities Development Authority, Revenue Bonds, Huntington Memorial Hospital, Refunding Series 2014B, 5.000%, 7/01/44, (Pre-refunded 7/01/24) | 7/24 at 100.00 | 2,685,685 | |||||||||
Principal Amount (000) | Description (a) | Optional Call Provisions (b) | Value | |||||||||||
U.S. Guaranteed (h) | ||||||||||||||
| $ | 7,500 | Desert Community College District, Riverside County, California, General Obligation Bonds, Refunding Series 2016, 5.000%, 8/01/37, (Pre-refunded 2/01/26) | 2/26 at 100.00 | $ | 7,820,146 | |||||||||
| Golden State Tobacco Securitization Corporation, California, Enhanced Tobacco Settlement Asset-Backed Revenue Bonds, Refunding Series 2015A: | ||||||||||||||
| 1,790 | 5.000%, 6/01/40, (Pre-refunded 6/01/25) | 6/25 at 100.00 | 1,837,894 | |||||||||||
| 1,460 | 5.000%, 6/01/40, (Pre-refunded 6/01/25) | 6/25 at 100.00 | 1,499,064 | |||||||||||
| 86,320 | 5.000%, 6/01/45, (Pre-refunded 6/01/25) | 6/25 at 100.00 | 88,629,604 | |||||||||||
| Los Angeles Department of Airports, California, Revenue Bonds, Los Angeles International Airport, Subordinate Lien Series 2021D: | ||||||||||||||
| 55 | 5.000%, 5/15/37, (Pre-refunded 11/15/31), (AMT) | 11/31 at 100.00 | 62,011 | |||||||||||
| 70 | 5.000%, 5/15/46, (Pre-refunded 11/15/31), (AMT) | 11/31 at 100.00 | 78,924 | |||||||||||
| 5,840 | Orange County Water District, California, Revenue Certificates of Participation, Series 1999A, 5.375%, 8/15/29, (ETM) | No Opt. Call | 6,460,985 | |||||||||||
| 905 | Orange County Water District, California, Revenue Certificates of Participation, Series 2003B, 5.000%, 8/15/34, (Pre-refunded 8/15/32) - NPFG Insured | 8/32 at 100.00 | 1,077,832 | |||||||||||
| 2,000 | Puerto Rico Public Finance Corporation, Commonwealth Appropriation Bonds, Series 2002E, 6.000%, 8/01/26, (ETM) | No Opt. Call | 2,146,307 | |||||||||||
| 1,460 | Rohnert Park Community Development Commission, California, Tax Allocation Bonds, Redevelopment Project Series 2007R, 5.000%, 8/01/37 - FGIC Insured, (ETM) | 4/24 at 100.00 | 1,524,662 | |||||||||||
| Total U.S. Guaranteed | 205,674,589 | |||||||||||||
Utilities - 29.8% (18.1% of Total Investments) | ||||||||||||||
| 44,950 | (g | ) | California Community Choice Financing Authority, Clean Energy Project Revenue Bonds, Green Series 2023G, 5.250%, 11/01/54, (Mandatory Put 4/01/30), (UB) | 1/30 at 100.19 | 47,992,319 | |||||||||
| 29,560 | California Community Choice Financing Authority, Clean Energy Project Revenue Bonds, Green Series 2024A, 5.000%, 5/01/54, (Mandatory Put 4/01/32) | 1/32 at 100.21 | 31,747,626 | |||||||||||
| California Pollution Control Financing Authority, Water Furnishing Revenue Bonds, Poseidon Resources Channelside LP Desalination Project, Series 2012: | ||||||||||||||
| 3,925 | 5.000%, 7/01/37, (AMT), 144A | 7/24 at 100.00 | 3,928,760 | |||||||||||
| 69,535 | 5.000%, 11/21/45, (AMT), 144A | 7/24 at 100.00 | 69,572,403 | |||||||||||
| 85 | California Statewide Community Development Authority, Water and Wastewater Revenue Bonds, Pooled Financing Program, Series 2004A, 5.250%, 10/01/24 - AGM Insured | 4/24 at 100.00 | 85,148 | |||||||||||
| 2,200 | East Bay Municipal Utility District, Alameda and Contra Costa Counties, California, Water System Revenue Bonds, Green Series 2017A, 5.000%, 6/01/45 | 6/27 at 100.00 | 2,321,331 | |||||||||||
| 5,000 | East Bay Municipal Utility District, Alameda and Contra Costa Counties, California, Water System Revenue Bonds, Green Series 2019A, 5.000%, 6/01/49 | 6/29 at 100.00 | 5,394,408 | |||||||||||
| 10,000 | East Bay Municipal Utility District, Alameda and Contra Costa Counties, California, Water System Revenue Bonds, Series 2014C, 5.000%, 6/01/44 | 6/24 at 100.00 | 10,042,930 | |||||||||||
| Long Beach Bond Finance Authority, California, Natural Gas Purchase Revenue Bonds, Series 2007A: | ||||||||||||||
| 14,140 | 5.000%, 11/15/35 | No Opt. Call | 15,599,649 | |||||||||||
| 7,610 | 5.500%, 11/15/37 | No Opt. Call | 8,728,913 | |||||||||||
| 24,070 | Los Angeles Department of Water and Power, California, Power System Revenue Bonds, Series 2015E, 5.000%, 7/01/44 | 7/24 at 100.00 | 24,140,893 | |||||||||||
| 47,705 | Los Angeles Department of Water and Power, California, Power System Revenue Bonds, Series 2017A, 5.000%, 7/01/47 | 1/27 at 100.00 | 49,585,617 | |||||||||||
| 12,870 | Los Angeles Department of Water and Power, California, Power System Revenue Bonds, Series 2018A, 5.000%, 7/01/38 | 1/28 at 100.00 | 13,890,950 | |||||||||||
| 8,980 | Los Angeles Department of Water and Power, California, Power System Revenue Bonds, Series 2019A, 5.000%, 7/01/45 | 1/29 at 100.00 | 9,686,341 | |||||||||||
| Los Angeles Department of Water and Power, California, Power System Revenue Bonds, Series 2020B: | ||||||||||||||
| 8,960 | 5.000%, 7/01/40 | 7/30 at 100.00 | 10,029,527 | |||||||||||
| 5,105 | 5.000%, 7/01/45 | 7/30 at 100.00 | 5,622,395 | |||||||||||
| 26,625 | 5.000%, 7/01/50 | 7/30 at 100.00 | 28,987,471 | |||||||||||
| NAC | Nuveen California Quality Municipal Income Fund (continued) Portfolio of Investments February 29, 2024 |
Principal Amount (000) | Description (a) | Optional Call Provisions (b) | Value | |||||||||||
Utilities | ||||||||||||||
| Los Angeles Department of Water and Power, California, Power System Revenue Bonds, Series 2022B: | ||||||||||||||
| $ | 4,000 | 5.000%, 7/01/47 | 7/32 at 100.00 | $ | 4,482,046 | |||||||||
| 6,500 | 5.000%, 7/01/52 | 7/32 at 100.00 | 7,213,343 | |||||||||||
| Los Angeles Department of Water and Power, California, Power System Revenue Bonds, Series 2022C: | ||||||||||||||
| 3,000 | 5.000%, 7/01/39 | 1/32 at 100.00 | 3,457,882 | |||||||||||
| 2,325 | 5.000%, 7/01/41 | 1/32 at 100.00 | 2,642,533 | |||||||||||
| 3,500 | Los Angeles Department of Water and Power, California, Water System Revenue Bonds, Series 2022B, 5.000%, 7/01/52 | 1/32 at 100.00 | 3,874,114 | |||||||||||
| 2,875 | Los Angeles Department of Water and Power, California, Water System Revenue Bonds, Series 2023A, 5.000%, 7/01/49 | 7/33 at 100.00 | 3,249,964 | |||||||||||
| 10,000 | Los Angeles Department of Water and Power, California, Waterworks Revenue Bonds, Series 2016A, 5.000%, 7/01/46 | 1/26 at 100.00 | 10,275,015 | |||||||||||
| 50,385 | Los Angeles Department of Water and Power, California, Waterworks Revenue Bonds, Series 2017A, 5.000%, 7/01/44 | 1/27 at 100.00 | 52,651,771 | |||||||||||
| Los Angeles Department of Water and Power, California, Waterworks Revenue Bonds, Series 2020C: | ||||||||||||||
| 2,000 | 5.000%, 7/01/36 | 7/30 at 100.00 | 2,297,004 | |||||||||||
| 3,000 | 5.000%, 7/01/38 | 7/30 at 100.00 | 3,399,069 | |||||||||||
| 5,000 | Los Angeles, California, Wastewater System Revenue Bonds, Green Subordinate Series 2018A, 5.000%, 6/01/43 | 6/28 at 100.00 | 5,350,750 | |||||||||||
| Los Angeles, California, Wastewater System Revenue Bonds, Refunding Subordinate Lien Series 2013A: | ||||||||||||||
| 1,245 | 5.000%, 6/01/34 | 3/24 at 100.00 | 1,247,372 | |||||||||||
| 6,840 | 5.000%, 6/01/35 | 3/24 at 100.00 | 6,853,029 | |||||||||||
| 5,025 | Metropolitan Water District of Southern California, Water Revenue Bonds, Refunding Series 2020C, 5.000%, 7/01/38 | 7/30 at 100.00 | 5,699,693 | |||||||||||
| 6,500 | Metropolitan Water District of Southern California, Water Revenue Bonds, Refunding Series 2023A, 5.000%, 4/01/53 | 4/33 at 100.00 | 7,303,320 | |||||||||||
| 7,525 | Moulton Niguel Water District, California, Certificates of Participation, Series 2019, 3.000%, 9/01/44 | 3/29 at 100.00 | 6,433,916 | |||||||||||
| 2,820 | Orange County Sanitation District, California, Wastewater Revenue Bonds, Refunding Series 2016A, 5.000%, 2/01/35 | 2/26 at 100.00 | 2,930,813 | |||||||||||
| 4,415 | Puerto Rico Aqueduct and Sewerage Authority, Revenue Bonds, Refunding Senior Lien Series 2020A, 5.000%, 7/01/47, 144A | 7/30 at 100.00 | 4,457,587 | |||||||||||
| 2,950 | Sacramento County Sanitation Districts Financing Authority, California, Revenue Bonds, Sacramento Regional County Sanitation District, Series 2020A, 5.000%, 12/01/50 | 12/30 at 100.00 | 3,248,182 | |||||||||||
| 16,670 | Sacramento Municipal Utility District, California, Electric Revenue Bonds, Climate Certified Green Series 2023K, 5.000%, 8/15/53 | 8/33 at 100.00 | 18,545,700 | |||||||||||
| 1,510 | Sacramento Municipal Utility District, California, Electric Revenue Bonds, Series 2020H, 5.000%, 8/15/50 | 8/30 at 100.00 | 1,643,582 | |||||||||||
| 7,000 | Sacremento Municipal Utility District, California, Electric Revenue Bonds, Series 2019G, 5.000%, 8/15/41 | 8/29 at 100.00 | 7,722,289 | |||||||||||
| 4,000 | San Diego Public Facilities Financing Authority, California, Water Revenue Bonds, Senior Series 2023A, 4.000%, 8/01/52 | 8/33 at 100.00 | 3,999,474 | |||||||||||
| 1,180 | San Diego Public Facilities Financing Authority, California, Water Utility Revenue Bonds, Refunding Subordinate Lien Series 2016B, 5.000%, 8/01/37 | 8/26 at 100.00 | 1,239,075 | |||||||||||
| 2,555 | Santa Clara Valley Water District, California, Water System Revenue Bonds, Refunding Series 2020A, 5.000%, 6/01/50 | 6/30 at 100.00 | 2,781,169 | |||||||||||
| Southern California Public Power Authority, California, Revenue Bonds, Apex Power Project Series 2014A: | ||||||||||||||
| 1,565 | 5.000%, 7/01/35 | 7/24 at 100.00 | 1,570,270 | |||||||||||
| 1,500 | 5.000%, 7/01/38 | 7/24 at 100.00 | 1,503,396 | |||||||||||
| 4,000 | Southern California Public Power Authority, Natural Gas Project 1 Revenue Bonds, Series 2007A, 5.000%, 11/01/33 | No Opt. Call | 4,316,973 | |||||||||||
Principal Amount (000) | Description (a) | Optional Call Provisions (b) | Value | |||||||||||
Utilities | ||||||||||||||
| $ | 31,970 | Southern California Public Power Authority, Southern Transmission System Renewal Project Revenue Bonds, Series 2023-1A, 5.000%, 7/01/48 | 7/33 at 100.00 | $ | 36,232,883 | |||||||||
| Total Utilities | 553,978,895 | |||||||||||||
Total Municipal Bonds (cost $2,990,272,606) | 3,038,993,348 | |||||||||||||
Total Long-Term Investments (cost $2,990,272,606) | 3,038,993,348 | |||||||||||||
Principal Amount (000) | Description (a) | Optional Call Provisions (b) | Value | |||||||||||
SHORT-TERM INVESTMENTS - 1.1% (0.7% of Total Investments) | ||||||||||||||
MUNICIPAL BONDS - 1.1% (0.7% of Total Investments) | ||||||||||||||
Health Care - 1.1% (0.7% of Total Investments) | ||||||||||||||
| $ | 20,200 | (i | ) | California Health Facilities Financing Authority, Revenue Bonds, Scripps Health, Variable Rate Series 2010B, 2.300%, 10/01/40, (Mandatory Put 3/07/24) | 5/24 at 100.00 | $ | 20,200,000 | |||||||
| Total Health Care | 20,200,000 | |||||||||||||
Total Municipal Bonds (cost $20,200,000) | 20,200,000 | |||||||||||||
Total Short-Term Investments (cost $20,200,000) | 20,200,000 | |||||||||||||
Total Investments (cost $3,010,472,606) - 164.8% | 3,059,193,348 | |||||||||||||
Floating Rate Obligations - (2.4)% | (44,585,000 | ) | ||||||||||||
MFP Shares, Net - (14.8)% (j) | (274,903,925 | ) | ||||||||||||
VRDP Shares, Net - (48.8)% (k) | (905,400,499 | ) | ||||||||||||
Other Assets & Liabilities, Net - 1.2% | 21,846,755 | |||||||||||||
Net Assets Applicable to Common Shares - 100% | $ | 1,856,150,679 | ||||||||||||
| (a) | All percentages shown in the Portfolio of Investments are based on net assets applicable to common shares unless otherwise noted. |
| (b) | Optional Call Provisions: Dates (month and year) and prices of the earliest optional call or redemption. There may be other call provisions at varying prices at later dates. Certain mortgage-backed securities may be subject to periodic principal paydowns. Optional Call Provisions are not covered by the report of independent registered public accounting firm. |
| (c) | Effective February 12, 2019, the par value of the original bonds was replaced with taxable and tax exempt Puerto Rico Sales Tax Financing Corporation (commonly known as COFINA) bond units that are collateralized by a bundle of zero and coupon paying bonds. The quantity shown represents units in a trust, which were assigned according to the original bond’s accreted value. These securities do not have a stated coupon interest rate and income will be recognized through accretion of the discount associated with the trust units. The factor at which these units accrete can also decrease, primarily for principal payments generated from coupon payments received or dispositions of the underlying bond collateral. The quantity of units will not change as a result of these principal payments. |
| (d) | Defaulted security. A security whose issuer has failed to fully pay principal and/or interest when due, or is under the protection of bankruptcy. |
| (e) | For fair value measurement disclosure purposes, investment classified as Level 3. |
| (f) | Step-up coupon bond, a bond with a coupon that increases (“steps up”), usually at regular intervals, while the bond is outstanding. The rate shown is the coupon as of the end of the reporting period. |
| (g) | Investment, or portion of investment, has been pledged to collateralize the net payment obligations for investments in inverse floating rate transactions. |
| (h) | Backed by an escrow or trust containing sufficient U.S. Government or U.S. Government agency securities, which ensure the timely payment of principal and interest. |
| (i) | Investment has a maturity of greater than one year, but has variable rate and/or demand features which qualify it as a short-term investment. The rate disclosed, as well as the reference rate and spread, where applicable, is that in effect as of the end of the reporting period. This rate changes periodically based on market conditions or a specified market index. |
| (j) | MFP Shares, Net as a percentage of Total Investments is 9.0%. |
| (k) | VRDP Shares, Net as a percentage of Total Investments is 29.6%. |
| 144A | Investment is exempt from registration under Rule 144A of the Securities Act of 1933, as amended. These investments may only be resold in transactions exempt from registration, which are normally those transactions with qualified institutional buyers. |
| AMT | Alternative Minimum Tax |
| ETM | Escrowed to maturity |
| UB | Underlying bond of an inverse floating rate trust reflected as a financing transaction. |
| NKX | Nuveen California AMT-Free Quality Municipal Income Fund Portfolio of Investments February 29, 2024 |
Principal Amount (000) | Description (a) | Optional Call Provisions (b) | Value | |||||||||||
LONG-TERM INVESTMENTS - 163.1% (97.9% of Total Investments) | ||||||||||||||
MUNICIPAL BONDS - 163.1% (97.9% of Total Investments) | ||||||||||||||
Consumer Staples - 0.3% (0.2% of Total Investments) | ||||||||||||||
| $ | 235 | California County Tobacco Securitization Agency, Tobacco Settlement Asset- Backed Bonds, Los Angeles County Securitization Corporation, Series 2020A, 4.000%, 6/01/49 | 6/30 at 100.00 | $ | 229,146 | |||||||||
| 14,700 | Golden State Tobacco Securitization Corporation, California, Tobacco Settlement Asset-Backed Bonds, Capital Appreciation Series 2021B-2, 0.000%, 6/01/66 | 12/31 at 27.75 | 1,673,341 | |||||||||||
| Total Consumer Staples | 1,902,487 | |||||||||||||
Education and Civic Organizations - 6.4% (3.8% of Total Investments) | ||||||||||||||
| 1,515 | California Educational Facilities Authority, Revenue Bonds, University of the Pacific, Series 2023, 5.000%, 11/01/53 | 11/33 at 100.00 | 1,640,979 | |||||||||||
| 700 | California Enterprise Development Authority, Charter School Revenue Bonds, Academy for Academic Excellence Project, Series 2020A, 5.000%, 7/01/50, 144A | 7/27 at 100.00 | 675,134 | |||||||||||
| 6,760 | California Infrastructure and Economic Development Bank, Revenue Bonds, Los Angeles County Museum of Natural History Foundation, Series 2020, 4.000%, 7/01/50 | 7/30 at 100.00 | 6,551,501 | |||||||||||
| 1,000 | California Municipal Finance Authority, Charter School Revenue Bonds, John Adams Academies, Inc. - Lincoln Project, Taxable Series 2019B, 5.000%, 10/01/39, 144A | 10/27 at 100.00 | 993,542 | |||||||||||
| 995 | California Municipal Finance Authority, Charter School Revenue Bonds, Palmdale Aerospace Academy Project, Series 2016A, 5.000%, 7/01/46, 144A | 7/26 at 100.00 | 944,890 | |||||||||||
| 1,560 | California Municipal Finance Authority, Revenue Bonds, Goodwill Industries of Sacramento Valley & Northern Nevada Project, Series 2012A, 6.875%, 1/01/42, 144A | 4/24 at 100.00 | 1,490,137 | |||||||||||
| 1,000 | California Municipal Finance Authority, Revenue Bonds, The Master’s University & Seminary, Series 2019, 5.000%, 8/01/48 | 8/29 at 100.00 | 1,013,440 | |||||||||||
| 250 | California School Finance Authority, Charter School Revenue Bonds, Aspire Public School - Obligated Group,Issue No.6, Series 2020A, 5.000%, 8/01/42, 144A | 8/28 at 100.00 | 254,023 | |||||||||||
| 1,000 | California School Finance Authority, Charter School Revenue Bonds, Camino Nuevo Charter Academy Sustainability Series 2023A, 5.000%, 6/01/43, 144A | 6/31 at 100.00 | 1,000,759 | |||||||||||
| 555 | California School Finance Authority, Charter School Revenue Bonds, Stem Preparatory Schools Obligated Group, Series 2023A, 5.125%, 6/01/53, 144A | 6/31 at 100.00 | 549,961 | |||||||||||
| 635 | California School Finance Authority, School Facility Revenue Bonds, Alliance for College-Ready Public Schools Project, Series 2015A, 5.000%, 7/01/45, 144A | 7/25 at 100.00 | 635,475 | |||||||||||
| 750 | California School Finance Authority, School Facility Revenue Bonds, Alliance for College-Ready Public Schools Project, Series 2016A, 5.000%, 7/01/46, 144A | 7/25 at 100.00 | 750,140 | |||||||||||
| 4,925 | California School Finance Authority, School Facility Revenue Bonds, Alliance for College-Ready Public Schools Project, Series 2016C, 5.000%, 7/01/46, 144A | 7/25 at 101.00 | 4,926,817 | |||||||||||
| 280 | California School Finance Authority, School Facility Revenue Bonds, Value Schools, Series 2016A, 5.750%, 7/01/41, 144A | 7/26 at 100.00 | 287,898 | |||||||||||
| 7,710 | University of California, General Revenue Bonds, Limited Project Series 2017M, 5.000%, 5/15/47 | 5/27 at 100.00 | 8,133,055 | |||||||||||
| 10,000 | University of California, General Revenue Bonds, Limited Project Series 2018O, 5.000%, 5/15/43 | 5/28 at 100.00 | 10,739,450 | |||||||||||
| Total Education and Civic Organizations | 40,587,201 | |||||||||||||
Health Care - 30.8% (18.5% of Total Investments) | ||||||||||||||
| California Health Facilities Financing Authority, California, Revenue Bonds, Sutter Health, Refunding Series 2016B: | ||||||||||||||
| 13,295 | 4.000%, 11/15/41 | 11/26 at 100.00 | 13,309,444 | |||||||||||
| 15,875 | 5.000%, 11/15/46 | 11/26 at 100.00 | 16,245,425 | |||||||||||
Principal Amount (000) | Description (a) | Optional Call Provisions (b) | Value | |||||||||||
Health Care | ||||||||||||||
| $ | 10,000 | California Health Facilities Financing Authority, California, Revenue Bonds, Sutter Health, Refunding Series 2017A, 4.000%, 11/15/48 | 11/27 at 100.00 | $ | 9,636,071 | |||||||||
| 5,375 | California Health Facilities Financing Authority, Revenue Bonds, Adventist Health System/West, Refunding Series 2016A, 4.000%, 3/01/39 | 3/26 at 100.00 | 5,386,945 | |||||||||||
| 7,760 | California Health Facilities Financing Authority, Revenue Bonds, Cedars-Sinai Health System, Series 2021A, 4.000%, 8/15/48 California Health Facilities Financing Authority, Revenue Bonds, Children’s Hospital Los Angeles, Series 2017A: | 8/31 at 100.00 | 7,664,062 | |||||||||||
| 7,900 | 5.000%, 8/15/42 | 8/27 at 100.00 | 8,064,696 | |||||||||||
| 4,265 | 5.000%, 8/15/47 | 8/27 at 100.00 | 4,322,782 | |||||||||||
| 1,000 | California Health Facilities Financing Authority, Revenue Bonds, City of Hope National Medical Center, Series 2012A, 5.000%, 11/15/35 | 4/24 at 100.00 | 1,000,614 | |||||||||||
| 2,930 | California Health Facilities Financing Authority, Revenue Bonds, City of Hope National Medical Center, Series 2019, 4.000%, 11/15/45 California Health Facilities Financing Authority, Revenue Bonds, CommonSpirit Health, Series 2020A: | 11/29 at 100.00 | 2,844,196 | |||||||||||
| 3,390 | 4.000%, 4/01/44 | 4/30 at 100.00 | 3,302,582 | |||||||||||
| 1,055 | 4.000%, 4/01/49 | 4/30 at 100.00 | 1,014,375 | |||||||||||
| California Health Facilities Financing Authority, Revenue Bonds, Lucile Salter Packard Children’s Hospital at Stanford, Refunding Forward Delivery Series 2022A: | ||||||||||||||
| 7,500 | 4.000%, 5/15/46 | 5/32 at 100.00 | 7,609,691 | |||||||||||
| 5,235 | 4.000%, 5/15/51 | 5/32 at 100.00 | 5,129,412 | |||||||||||
| 795 | California Health Facilities Financing Authority, Revenue Bonds, Providence Health & Services, Refunding Series 2014A: 5.000%, 10/01/38 | 10/24 at 100.00 | 799,701 | |||||||||||
| 6,760 | California Health Facilities Financing Authority, Revenue Bonds, Providence Health & Services, Series 2014B, 5.000%, 10/01/44 | 10/24 at 100.00 | 6,786,925 | |||||||||||
| 15,660 | California Health Facilities Financing Authority, Revenue Bonds, Providence Saint Joseph Health, Refunding Series 2016A, 4.000%, 10/01/47 | 10/26 at 100.00 | 14,833,805 | |||||||||||
| 9,450 | California Health Facilities Financing Authority, Revenue Bonds, Stanford Health Care, Series 2020A, 4.000%, 8/15/50 | 8/30 at 100.00 | 9,332,521 | |||||||||||
| California Municipal Finance Authority, Revenue Bonds, Community Health System, Series 2021A: | ||||||||||||||
| 5,495 | 4.000%, 2/01/51 - AGM Insured | 2/32 at 100.00 | 5,243,960 | |||||||||||
| 4,615 | 4.000%, 2/01/51 | 2/32 at 100.00 | 4,113,047 | |||||||||||
| California Municipal Finance Authority, Revenue Bonds, Eisenhower Medical Center, Refunding Series 2017A: | ||||||||||||||
| 2,000 | 5.000%, 7/01/42 | 7/27 at 100.00 | 2,040,247 | |||||||||||
| 250 | 5.000%, 7/01/47 | 7/27 at 100.00 | 252,728 | |||||||||||
| California Municipal Finance Authority, Revenue Bonds, NorthBay Healthcare Group, Series 2015: | ||||||||||||||
| 1,635 | 5.000%, 11/01/35 | 11/24 at 100.00 | 1,636,897 | |||||||||||
| 1,000 | 5.000%, 11/01/40 | 11/24 at 100.00 | 975,778 | |||||||||||
| 3,000 | 5.000%, 11/01/44 | 11/24 at 100.00 | 2,859,808 | |||||||||||
| California Municipal Finance Authority, Revenue Bonds, NorthBay Healthcare Group, Series 2017A: | ||||||||||||||
| 2,690 | 5.250%, 11/01/36 | 11/26 at 100.00 | 2,717,466 | |||||||||||
| 2,585 | 5.250%, 11/01/41 | 11/26 at 100.00 | 2,599,051 | |||||||||||
| 1,000 | 5.000%, 11/01/47 | 11/26 at 100.00 | 932,960 | |||||||||||
| 3,200 | 5.250%, 11/01/47 | 11/26 at 100.00 | 3,169,850 | |||||||||||
| 1,855 | California Municipal Financing Authority, Certificates of Participation, Palomar Health, Series 2022A, 5.250%, 11/01/52 - AGM Insured | 11/32 at 100.00 | 2,080,839 | |||||||||||
| California Public Finance Authority, Revenue Bonds, Henry Mayo Newhall Hospital, Series 2017: | ||||||||||||||
| 500 | 5.000%, 10/15/37 | 10/26 at 100.00 | 506,479 | |||||||||||
| 13,615 | 5.000%, 10/15/47 | 10/26 at 100.00 | 13,644,019 | |||||||||||
| 1,100 | California Statewide Communities Development Authority, California, Redlands Community Hospital, Revenue Bonds, Series 2016, 5.000%, 10/01/46 | 10/26 at 100.00 | 1,121,526 | |||||||||||
| NKX | Nuveen California AMT-Free Quality Municipal Income Fund (continued) Portfolio of Investments February 29, 2024 |
Principal Amount (000) | Description (a) | Optional Call Provisions (b) | Value | |||||||||||
Health Care | ||||||||||||||
| California Statewide Communities Development Authority, California, Revenue Bonds, Loma Linda University Medical Center, Series 2014A: | ||||||||||||||
| $ | 1,200 | 5.250%, 12/01/44 | 12/24 at 100.00 | $ | 1,197,374 | |||||||||
| 4,000 | 5.500%, 12/01/54 | 12/24 at 100.00 | 3,950,014 | |||||||||||
| 1,535 | California Statewide Communities Development Authority, California, Revenue Bonds, Loma Linda University Medical Center, Series 2016A, 5.250%, 12/01/56, 144A | 6/26 at 100.00 | 1,542,116 | |||||||||||
| 15,205 | California Statewide Communities Development Authority, California, Revenue Bonds, Loma Linda University Medical Center, Series 2018A, 5.500%, 12/01/58, 144A | 6/28 at 100.00 | 15,465,009 | |||||||||||
| 1,940 | California Statewide Communities Development Authority, Revenue Bonds, Marin General Hospital, Green Series 2018A, 4.000%, 8/01/45 | 3/24 at 100.00 | 1,754,087 | |||||||||||
| 845 | California Statewide Community Development Authority, Health Revenue Bonds, Enloe Medical Center, Refunding Series 2022A, 5.250%, 8/15/52 - AGM Insured | 8/32 at 100.00 | 925,125 | |||||||||||
| California Statewide Community Development Authority, Revenue Bonds, Daughters of Charity Health System, Series 2005A: | ||||||||||||||
| 8 | (c),(d) | 5.750%, 7/01/24 | 4/24 at 100.00 | 7,568 | ||||||||||
| 46 | (c),(d) | 5.750%, 7/01/30 | 4/24 at 100.00 | 45,837 | ||||||||||
| 1 | (c),(d) | 5.750%, 7/01/35 | 4/24 at 100.00 | 1,135 | ||||||||||
| 8,895 | Palomar Pomerado Health System, California, Revenue Bonds, Refunding Series 2016, 4.000%, 11/01/39 | 11/26 at 100.00 | 8,282,091 | |||||||||||
| 520 | Washington Township Health Care District, California, Revenue Bonds, Series 2023A, 5.750%, 7/01/48 | 7/33 at 100.00 | 577,191 | |||||||||||
| Total Health Care | 194,925,449 | |||||||||||||
Housing/Multifamily - 17.4% (10.4% of Total Investments) | ||||||||||||||
| 8,680 | California Community Housing Agency, California, Essential Housing Revenue Bonds, Creekwood, Series 2021A, 4.000%, 2/01/56, 144A | 8/31 at 100.00 | 5,808,886 | |||||||||||
| 7,570 | California Community Housing Agency, California, Essential Housing Revenue Bonds, Glendale Properties, Junior Series 2021A-2, 4.000%, 8/01/47, 144A | 8/31 at 100.00 | 6,179,621 | |||||||||||
| 1,000 | California Community Housing Agency, California, Essential Housing Revenue Bonds, Glendale Properties, Senior Series 2021A-1, 4.000%, 2/01/56, 144A | 8/31 at 100.00 | 834,385 | |||||||||||
| 3,590 | California Community Housing Agency, California, Essential Housing Revenue Bonds, Serenity at Larkspur Apartments, Series 2020A, 5.000%, 2/01/50, 144A | 2/30 at 100.00 | 2,740,069 | |||||||||||
| 4,720 | California Community Housing Agency, California, Essential Housing Revenue Bonds, Stoneridge Apartments, Series 2021A, 4.000%, 2/01/56, 144A | 2/31 at 100.00 | 3,654,625 | |||||||||||
| 230 | California Community Housing Agency, California, Essential Housing Revenue Bonds, Summit at Sausalito Apartments, Series 2021A-2, 4.000%, 2/01/50, 144A | 8/32 at 100.00 | 169,655 | |||||||||||
| 1,700 | California Community Housing Agency, California, Essential Housing Revenue Bonds, The Arbors, Series 2020A, 5.000%, 8/01/50, 144A | 8/30 at 100.00 | 1,611,685 | |||||||||||
| 500 | California Community Housing Agency, California, Essential Housing Revenue Bonds, Verdant at Green Valley Apartments, Series 2019A, 5.000%, 8/01/49, 144A | 8/29 at 100.00 | 476,478 | |||||||||||
| 4,750 | California Community Housing Agency, Workforce Housing Revenue Bonds, Annadel Apartments, Series 2019A, 5.000%, 4/01/49, 144A | 4/29 at 100.00 | 3,950,537 | |||||||||||
| 7,591 | California Housing Finance Agency, Municipal Certificate Revenue Bonds, Class A Series 2019-2, 4.000%, 3/20/33 | No Opt. Call | 7,606,898 | |||||||||||
| 6,287 | California Housing Finance Agency, Municipal Certificate Revenue Bonds, Class A Series 2021-1, 3.500%, 11/20/35 | No Opt. Call | 5,941,061 | |||||||||||
| 1,131 | California Housing Finance Agency, Municipal Certificate Revenue Bonds, Class A Series2019-1, 4.250%, 1/15/35 | No Opt. Call | 1,128,267 | |||||||||||
| 6,075 | California Housing Finance Agency, Municipal Certificate Revenue Bonds, Class A Social Certificates Series 2023-1, 4.375%, 9/20/36 | No Opt. Call | 6,015,905 | |||||||||||
| California Municipal Finance Authority, Mobile Home Park Revenue Bonds, Caritas Affordable Housing Inc Projects, Senior Series 2014A: | ||||||||||||||
| 260 | 5.250%, 8/15/39 | 8/24 at 100.00 | 261,458 | |||||||||||
| 705 | 5.250%, 8/15/49 | 8/24 at 100.00 | 707,439 | |||||||||||
Principal Amount (000) | Description (a) | Optional Call Provisions (b) | Value | |||||||||||
Housing/Multifamily | ||||||||||||||
| $ | 160 | California Public Finance Authority, University Housing Revenue Bonds, National Campus Community Development - Claremont Properties LLC Claremont Colleges Project, Refunding Series 2023A, 5.250%, 7/01/40, 144A | 7/33 at 105.00 | $ | 163,223 | |||||||||
| 8,205 | CMFA Special Finance Agency I, California, Essential Housing Revenue Bonds, The Mix at Center City, Series 2021A-2, 4.000%, 4/01/56, 144A | 4/31 at 100.00 | 5,956,905 | |||||||||||
| 2,740 | CMFA Special Finance Agency, California, Essential Housing Revenue Bonds, Enclave Apartments, Senior Series 2022A-1, 4.000%, 8/01/58, 144A | 2/32 at 100.00 | 2,136,027 | |||||||||||
| 1,440 | CSCDA Community Improvement Authority, California, Essential Housing Revenue Bonds, 777 Place-Pomona, Senior Lien Series 2021A-1, 3.600%, 5/01/47, 144A | 5/32 at 100.00 | 1,192,892 | |||||||||||
| 3,980 | CSCDA Community Improvement Authority, California, Essential Housing Revenue Bonds, 777 Place-Pomona, Senior Lien Series 2021A-2, 3.250%, 5/01/57, 144A | 5/32 at 100.00 | 2,764,174 | |||||||||||
| 595 | CSCDA Community Improvement Authority, California, Essential Housing Revenue Bonds, Acacia on Santa Rosa Creek, Mezzanine Lien Series 2021B, 4.000%, 10/01/46, 144A | 10/31 at 100.00 | 462,995 | |||||||||||
| 6,135 | CSCDA Community Improvement Authority, California, Essential Housing Revenue Bonds, Acacia on Santa Rosa Creek, Senior Lien Series 2021A, 4.000%, 10/01/56, 144A | 10/31 at 100.00 | 5,267,435 | |||||||||||
| 250 | CSCDA Community Improvement Authority, California, Essential Housing Revenue Bonds, Altana Glendale, Series 2021A-1, 3.500%, 10/01/46, 144A | 10/31 at 100.00 | 200,461 | |||||||||||
| 7,065 | CSCDA Community Improvement Authority, California, Essential Housing Revenue Bonds, Altana Glendale, Series 2021A-2, 4.000%, 10/01/56, 144A | 10/31 at 100.00 | 5,475,782 | |||||||||||
| 8,125 | CSCDA Community Improvement Authority, California, Essential Housing Revenue Bonds, Center City Anaheim, Series 2020A, 5.000%, 1/01/54, 144A | 1/31 at 100.00 | 6,560,029 | |||||||||||
| 1,275 | CSCDA Community Improvement Authority, California, Essential Housing Revenue Bonds, Millennium South Bay-Hawthorne, Series2021A-1 andA-2, 3.250%, 7/01/56, 144A | 7/32 at 100.00 | 878,681 | |||||||||||
| 6,820 | CSCDA Community Improvement Authority, California, Essential Housing Revenue Bonds, Moda at Monrovia Station, Social Series 2021A-2, 4.000%, 10/01/56, 144A | 10/31 at 100.00 | 5,016,130 | |||||||||||
CSCDA Community Improvement Authority, California, Essential Housing Revenue Bonds, Monterrey Station Apartments, Senior Lien Series 2021A-1: | ||||||||||||||
| 770 | 3.000%, 7/01/43, 144A | 7/32 at 100.00 | 604,113 | |||||||||||
| 3,340 | 3.125%, 7/01/56, 144A | 7/32 at 100.00 | 2,252,791 | |||||||||||
| 2,485 | CSCDA Community Improvement Authority, California, Essential Housing Revenue Bonds, Oceanaire-Long Beach, Social Series 2021A-2, 4.000%, 9/01/56, 144A | 9/31 at 100.00 | 1,886,948 | |||||||||||
| 155 | CSCDA Community Improvement Authority, California, Essential Housing Revenue Bonds, Orange City Portfolio, Mezzanine Lien Series 2021B, 4.000%, 3/01/57, 144A | 3/32 at 100.00 | 113,653 | |||||||||||
| 3,840 | CSCDA Community Improvement Authority, California, Essential Housing Revenue Bonds, Parallel-Anaheim Series 2021A, 4.000%, 8/01/56, 144A | 8/31 at 100.00 | 3,205,367 | |||||||||||
| 1,360 | CSCDA Community Improvement Authority, California, Essential Housing Revenue Bonds, Pasadena Portfolio Social Bond, Mezzanine Senior Series 2021B, 4.000%, 12/01/56, 144A | 12/31 at 100.00 | 1,004,332 | |||||||||||
| 555 | CSCDA Community Improvement Authority, California, Essential Housing Revenue Bonds, Pasadena Portfolio Social Bond, Series 2021A-2, 3.000%, 12/01/56 | 12/31 at 100.00 | 389,473 | |||||||||||
| 2,720 | CSCDA Community Improvement Authority, California, Essential Housing Revenue Bonds, Union South Bay, Series 2021A-2, 4.000%, 7/01/56, 144A | 7/31 at 100.00 | 2,082,976 | |||||||||||
| 1,975 | CSCDA Community Improvement Authority, California, Essential Housing Revenue Bonds, Westgate Phase 1-Pasadena Apartments, Senior Lien Series2021A-1, 3.000%, 6/01/47, 144A | 6/31 at 100.00 | 1,446,591 | |||||||||||
| 7,200 | CSCDA Community Improvement Authority, California, Essential Housing Revenue Bonds, Westgate Phase 1-Pasadena Apartments, Senior Lien Series2021A-2, 3.125%, 6/01/57, 144A | 6/31 at 100.00 | 4,563,507 | |||||||||||
| 7,285 | CSCDA Community Improvement Authority, California, Essential Housing Revenue Bonds, Wood Creek Apartments, Senior Lien Series 2021A-1, 3.000%, 12/01/49 | 6/32 at 100.00 | 4,977,043 | |||||||||||
| 3,285 | Independent Cities Finance Authority, California, Mobile Home Park Revenue Bonds, Rancho Vallecitos Mobile Home Park, Series 2013, 5.000%, 4/15/38 | 4/24 at 100.00 | 3,288,326 | |||||||||||
| NKX | Nuveen California AMT-Free Quality Municipal Income Fund (continued) Portfolio of Investments February 29, 2024 |
Principal Amount (000) | Description (a) | Optional Call Provisions (b) | Value | |||||||||||
Housing/Multifamily | ||||||||||||||
| La Verne, California, Mobile Home Park Revenue Bonds, Copacabana Mobile Home Park, Refunding Series 2014: | ||||||||||||||
| $ | 670 | 5.000%, 6/15/44 | 6/24 at 100.00 | $ | 671,765 | |||||||||
| 185 | 5.000%, 6/15/49 | 6/24 at 100.00 | 185,387 | |||||||||||
| Total Housing/Multifamily | 109,833,975 | |||||||||||||
Long-Term Care - 0.4% (0.2% of Total Investments) | ||||||||||||||
| 1,225 | California Health Facilities Financing Authority, Insured Revenue Bonds, Community Program for Persons with Developmental Disabilities, Series 2011A, 6.250%, 2/01/26 | 4/24 at 100.00 | 1,228,200 | |||||||||||
| 1,275 | California Health Facilities Financing Authority, Revenue Bonds, Northern California Presbyterian Homes & Services Inc., Refunding Series 2015, 5.000%, 7/01/44 | 7/25 at 100.00 | 1,298,053 | |||||||||||
| Total Long-Term Care | 2,526,253 | |||||||||||||
Tax Obligation/General - 37.4% (22.4% of Total Investments) | ||||||||||||||
| 2,210 | Butte-Glenn Community College District, Butte and Glenn Counties, California, General Obligation Bonds, Election 2016 Series 2017A, 5.250%, 8/01/46 | 8/27 at 100.00 | 2,342,296 | |||||||||||
| 1,600 | California State, General Obligation Bonds, Refunding Various Purpose Bid Group C Series 2016, 5.000%, 9/01/32 | 9/26 at 100.00 | 1,683,723 | |||||||||||
| 13,000 | California State, General Obligation Bonds, Refunding Various Purpose Series 2018. Bid Group C, 5.000%, 8/01/37 | 8/28 at 100.00 | 14,142,209 | |||||||||||
| 2,700 | California State, General Obligation Bonds, Series 2014, 5.000%, 12/01/43 | 4/24 at 100.00 | 2,701,801 | |||||||||||
| 10,750 | California State, General Obligation Bonds, Various Purpose Series 2014, 5.000%, 10/01/44 | 10/24 at 100.00 | 10,808,782 | |||||||||||
| 5,390 | California State, General Obligation Bonds, Various Purpose Series 2015, 5.000%, 8/01/45 | 8/25 at 100.00 | 5,491,389 | |||||||||||
| 3,000 | California State, General Obligation Bonds, Various Purpose Series 2017, 5.000%, 11/01/47 | 11/27 at 100.00 | 3,172,157 | |||||||||||
| 5,000 | California State, General Obligation Bonds, Various Purpose Series 2018. Bid Group A/B, 5.000%, 10/01/48 | 10/28 at 100.00 | 5,348,294 | |||||||||||
| 2,000 | California State, General Obligation Bonds, Various Purpose Series 2020, 5.000%, 11/01/36 | 11/30 at 100.00 | 2,283,344 | |||||||||||
| 2,000 | Chaffey Community College District, San Bernardino County, California, General Obligation Bonds, Taxable Refunding Series 2019, 4.000%, 6/01/43 | 6/28 at 100.00 | 2,027,480 | |||||||||||
| 2,000 | Chino Valley Unified School District, San Bernardino County, California, General Obligation Bonds, 2016 Election Series 2020B, 5.000%, 8/01/55 | 8/30 at 100.00 | 2,154,771 | |||||||||||
| 20,750 | Coachella Valley Unified School District, Riverside County, California, General Obligation Bonds, Election 2005 Series 2010C, 0.000%, 8/01/43 - AGM Insured | No Opt. Call | 8,976,720 | |||||||||||
| 4,500 | Corona-Norco Unified School District, Riverside County, California, General Obligation Bonds, Election 2014, Series 2018B, 4.000%, 8/01/43 | 8/28 at 100.00 | 4,508,330 | |||||||||||
| 13,475 | Desert Community College District, Riverside County, California, General Obligation Bonds, Election of 2016 Series 2024, 4.000%, 8/01/51 | 8/33 at 100.00 | 13,476,586 | |||||||||||
| 9,790 | Glendale Community College District, Los Angeles County, California, General Obligation Bonds, Election 2016 Taxable Refunding Series 2020B, 4.000%, 8/01/50 | 8/29 at 100.00 | 9,815,133 | |||||||||||
| 1,725 | Los Angeles Community College District, California, General Obligation Bonds, 2008 Election Series 2017J, 4.000%, 8/01/41 | 8/27 at 100.00 | 1,734,366 | |||||||||||
| 1,500 | Marin Healthcare District, Marin County, California, General Obligation Bonds, 2013 Election, Series 2015A, 4.000%, 8/01/45 | 8/25 at 100.00 | 1,482,109 | |||||||||||
| 1,150 | Monterey Peninsula Community College District, Monterey County, California, General Obligation Bonds, Election of 2020 Series 2024B, 4.000%, 8/01/51 | 8/33 at 100.00 | 1,142,741 | |||||||||||
| 4,500 | Mount Diablo Unified School District, Contra Costa County, California, General Obligation Bonds, Series 2010A, 5.500%, 8/01/30 - AGM Insured | 8/25 at 100.00 | 4,659,478 | |||||||||||
| 16,744 | Puerto Rico, General Obligation Bonds, Restructured Series 2022A-1, 4.000%, 7/01/41 | 7/31 at 103.00 | 15,552,393 | |||||||||||
| 11,980 | San Diego Unified School District, San Diego County, California, General Obligation Bonds, Refunding Series 2012R-1, 0.000%, 7/01/31 | No Opt. Call | 9,496,857 | |||||||||||
| 3,400 | San Francisco Community College District, California, General Obligation Bonds, Election 2020 Series 2020A, 4.000%, 6/15/45 | 6/30 at 100.00 | 3,417,040 | |||||||||||
Principal Amount (000) | Description (a) | Optional Call Provisions (b) | Value | |||||||||||
Tax Obligation/General | ||||||||||||||
| $ | 2,670 | (e) | San Mateo Union High School District, San Mateo County, California, General Obligation Bonds, Capital Appreciation, Election 2010, Refunding Series 2011A, 0.000%, 9/01/33 | No Opt. Call | $ | 2,616,377 | ||||||||
| 1,580 | Santa Ana College Improvement District 1, Orange County, California, General Obligation Bonds, Rancho Santiago Community College District, Election of 2012, Series 2019C, 3.000%, 8/01/39 | 8/26 at 100.00 | 1,418,591 | |||||||||||
| 10,000 | Southwestern Community College District, San Diego County, California, General Obligation Bonds, Election of 2008, Series 2011C, 0.000%, 8/01/41 Stockton Unified School District, San Joaquin County, California, General Obligation Bonds, Election 2008 Series 2011D: | No Opt. Call | 5,020,225 | |||||||||||
| 23,280 | (e) | 0.000%, 8/01/47 - AGC Insured | 8/37 at 100.00 | 26,107,135 | ||||||||||
| 38,845 | (e) | 0.000%, 8/01/50 - AGM Insured | 8/37 at 100.00 | 43,479,072 | ||||||||||
| 15,780 | (e) | Sylvan Union School District, Stanislaus County, California, General Obligation Bonds, Election of 2006, Series 2010, 0.000%, 8/01/49 - AGM Insured | No Opt. Call | 13,637,150 | ||||||||||
| 8,625 | Walnut Creek School District, Contra Costa County, California, General Obligation Bonds, Election 2022 Series 2023A, 4.000%, 9/01/52 | 9/32 at 100.00 | 8,577,493 | |||||||||||
| 2,500 | Washington Township Health Care District, California, General Obligation Bonds, 2020 Election Series 2023B, 4.500%, 8/01/53 - AGM Insured | 8/33 at 100.00 | 2,568,797 | |||||||||||
| 8,345 | (e) | Yosemite Community College District, California, General Obligation Bonds, Capital Appreciation, Election 2004, Series 2010D, 0.000%, 8/01/42 | No Opt. Call | 6,943,096 | ||||||||||
| Total Tax Obligation/General | 236,785,935 | |||||||||||||
Tax Obligation/Limited - 23.1% (13.9% of Total Investments) | ||||||||||||||
| 1,000 | Bell Community Redevelopment Agency, California, Tax Allocation Bonds, Bell Project Area, Series 2003, 5.625%, 10/01/33 - RAAI Insured | 4/24 at 100.00 | 1,003,347 | |||||||||||
| 3,605 | Brea and Olinda Unified School District, Orange County, California, Certificates of Participation Refunding, Series 2002A, 5.125%, 8/01/26 - AGM Insured | 4/24 at 100.00 | 3,608,315 | |||||||||||
| 210 | Brentwood Infrastructure Financing Authority, California, Infrastructure Revenue Bonds, Refunding Subordinated Series 2014B, 5.000%, 9/02/36 | 9/24 at 100.00 | 211,127 | |||||||||||
| 1,865 | California Infrastructure and Economic Development Bank, Revenue Bonds, North County Center for Self-Sufficiency Corporation, Series 2004, 5.000%, 12/01/24 - AMBAC Insured | 4/24 at 100.00 | 1,867,670 | |||||||||||
| 2,065 | California State Public Works Board, Lease Revenue Bonds, Department of Education, Riverside Campus Project, Series 2012H, 5.000%, 4/01/31 | 4/24 at 100.00 | 2,067,246 | |||||||||||
| 20,330 | California State Public Works Board, Lease Revenue Bonds, Judicial Council of California, New Stockton Courthouse, Series 2014B, 5.000%, 10/01/39 | 10/24 at 100.00 | 20,463,070 | |||||||||||
| 1,000 | California Statewide Communities Development Authority, Statewide Community Infrastructure Program Revenue Bonds, Series 2017C, 5.000%, 9/02/47 | 9/27 at 100.00 | 1,021,187 | |||||||||||
| 745 | California Statewide Communities Development Authority, Statewide Community Infrastructure Program Revenue Bonds, Series 2018A, 5.000%, 9/02/47 | 9/28 at 100.00 | 763,355 | |||||||||||
| 4,120 | El Monte, California, Senior Lien Certificates of Participation, Department of Public Services Facility Phase II, Series 2001, 5.250%, 1/01/34 - AMBAC Insured, 144A | 4/24 at 100.00 | 4,128,271 | |||||||||||
| 185 | Golden State Tobacco Securitization Corporation, California, Tobacco Settlement Asset-Backed Revenue Bonds, Series 2022A-1, 5.000%, 6/01/51 Government of Guam, Business Privilege Tax Bonds, Refunding Series 2015D: | 12/31 at 100.00 | 194,182 | |||||||||||
| 7,930 | 5.000%, 11/15/31 | 11/25 at 100.00 | 8,098,481 | |||||||||||
| 4,000 | 5.000%, 11/15/39 | 11/25 at 100.00 | 4,044,272 | |||||||||||
| 1,110 | Lake Elsinore Public Financing Authority, California, Local Agency Revenue Bonds, Refunding Series 2015, 5.000%, 9/01/40 | 9/25 at 100.00 | 1,124,007 | |||||||||||
| 1,000 | Lathrop, California, Limited Obligation Improvement Bonds, Crossroads Assessment District, Series 2015, 5.000%, 9/02/40 | 9/25 at 100.00 | 1,007,738 | |||||||||||
| 2,760 | Los Angeles County Facilities Inc, California, Lease Revenue Bonds, Vermont Corridor County Administration Building, Series 2018A, 5.000%, 12/01/51 | 12/28 at 100.00 | 2,913,961 | |||||||||||
| 15,000 | Los Angeles County Metropolitan Transportation Authority, California, Measure R Sales Tax Revenue Bonds, Senior Series 2016A, 5.000%, 6/01/38 | 6/26 at 100.00 | 15,605,036 | |||||||||||
| 3,220 | Los Angeles County Metropolitan Transportation Authority, California, Proposition C Sales Tax Revenue Bonds, Green Senior Lien Series 2019A, 5.000%, 7/01/44 | 7/28 at 100.00 | 3,458,536 | |||||||||||
| NKX | Nuveen California AMT-Free Quality Municipal Income Fund (continued) Portfolio of Investments February 29, 2024 |
Principal Amount (000) | Description (a) | Optional Call Provisions (b) | Value | |||||||||||
Tax Obligation/Limited (continued) | ||||||||||||||
| $ | 1,095 | Los Angeles County Public Works Financing Authority, California, Lease Revenue Bonds, Series 2019E-1, 5.000%, 12/01/49 | 12/29 at 100.00 | $ | 1,183,415 | |||||||||
| 1,750 | Peninsula Corridor Joint Powers Board, California, Measure RR Sales Tax Revenue Bonds, Green Bonds-Climate Bond Certified, Series 2022A, 5.000%, 6/01/51 | 6/31 at 100.00 | 1,903,161 | |||||||||||
| 1,900 | Perris Joint Powers Authority, California, Local Agency Revenue Bonds, Community Facilities District 2001-1 May Farms Improvement Area 1,2 and 3, Refunding Series 2014A, 5.375%, 9/01/33 Puerto Rico Sales Tax Financing Corporation, Sales Tax Revenue Bonds, Restructured2018A-1: | 4/24 at 100.00 | 1,902,667 | |||||||||||
| 4,000 | 0.000%, 7/01/46 | 7/28 at 41.38 | 1,302,266 | |||||||||||
| 32,445 | 0.000%, 7/01/51 | 7/28 at 30.01 | 7,838,209 | |||||||||||
| 21,539 | 5.000%, 7/01/58 | 7/28 at 100.00 | 21,700,499 | |||||||||||
Puerto Rico Sales Tax Financing Corporation, Sales Tax Revenue Bonds, Taxable Restructured Cofina Project Series 2019A-2: | ||||||||||||||
| 1,000 | 4.329%, 7/01/40 | 7/28 at 100.00 | 995,428 | |||||||||||
| 1,482 | 4.536%, 7/01/53 | 7/28 at 100.00 | 1,435,644 | |||||||||||
| 3,175 | 4.784%, 7/01/58 | 7/28 at 100.00 | 3,167,070 | |||||||||||
| 2,160 | River Islands Public Financing Authority, California, Special Tax Bonds, Community Facilities District 2003-1 Improvement Area 1, Refunding Series2022A-1, 5.250%, 9/01/52 - AGM Insured Riverside County, California, Special Tax Bonds, Community Facilities District05-8 Scott Road, Series 2013: | 9/29 at 103.00 | 2,357,265 | |||||||||||
| 660 | 5.000%, 9/01/32 | 4/24 at 100.00 | 660,769 | |||||||||||
| 2,775 | 5.000%, 9/01/42 | 4/24 at 100.00 | 2,776,599 | |||||||||||
| 400 | Roseville, California, Special Tax Bonds, Community Facilities District 1 Westpark, Refunding Series 2015, 5.000%, 9/01/33 | 9/25 at 100.00 | 408,410 | |||||||||||
| 6,230 | Sacramento Area Flood Control Agency, California, Consolidated Capital Assessment District 2 Bonds, Series 2016A, 5.000%, 10/01/47 | 10/26 at 100.00 | 6,441,548 | |||||||||||
| 935 | San Diego Redevelopment Agency, California, Subordinate Lien Tax Increment and Parking Revenue Bonds, Centre City Project, Series 2003B, 5.250%, 9/01/26 | 4/24 at 100.00 | 936,354 | |||||||||||
| 575 | San Francisco City and County Redevelopment Agency Successor Agency, California, Special Tax Bonds, Community Facilities District 7, Hunters Point Shipyard Phase One Improvements, Refunding Series 2014, 5.000%, 8/01/39 | 8/24 at 100.00 | 577,308 | |||||||||||
| 2,700 | San Francisco City and County Redevelopment Financing Authority, California, Tax Allocation Revenue Bonds, San Francisco Redevelopment Projects, Series 1998D, 0.000%, 8/01/24 - NPFG Insured | No Opt. Call | 2,663,576 | |||||||||||
| 30 | Signal Hill Redevelopment Agency, California, Project 1 Tax Allocation Bonds, Series 2011, 7.000%, 10/01/26 | 4/24 at 100.00 | 30,080 | |||||||||||
| 3,600 | Stockton Public Financing Authority, California, Revenue Bonds, Arch Road East Community Facility District 99-02, Series 2018A, 5.000%, 9/01/33 Temecula Public Financing Authority, California, Special Tax Bonds, Community Facilities District16-01, Series 2017: | 9/25 at 103.00 | 3,780,891 | |||||||||||
| 2,145 | 6.125%, 9/01/37, 144A | 9/27 at 100.00 | 2,285,462 | |||||||||||
| 990 | 6.250%, 9/01/47, 144A | 9/27 at 100.00 | 1,037,911 | |||||||||||
| 600 | Tracy, California, Special Tax Bonds, Community Facilities District 2016-1 | 9/29 at 103.00 | 642,333 | |||||||||||
| Tracy Hills, Improvement Area 2, Series 2023, 5.250%, 9/01/38 | ||||||||||||||
| Transbay Joint Powers Authority, California, Tax Allocation Bonds, Senior | ||||||||||||||
| Green Series 2020A: | ||||||||||||||
| 635 | 5.000%, 10/01/45 | 4/30 at 100.00 | 653,202 | |||||||||||
| 2,540 | 5.000%, 10/01/49 | 4/30 at 100.00 | 2,592,050 | |||||||||||
| 4,260 | Virgin Islands Public Finance Authority, Gross Receipts Taxes Loan Note, Refunding Series 2012A, 5.000%, 10/01/32 - AGM Insured | 4/24 at 100.00 | 4,287,660 | |||||||||||
West Patterson Financing Authority, California, Special Tax Bonds, Community Facilities District 2015-1 Arambel-KDN, Refunding Series 2015: | ||||||||||||||
| 350 | 5.250%, 9/01/35 | 9/25 at 100.00 | 359,214 | |||||||||||
| 790 | 5.250%, 9/01/45 | 9/25 at 100.00 | 801,578 | |||||||||||
| Total Tax Obligation/Limited | 146,300,370 | |||||||||||||
Principal Amount (000) | Description (a) | Optional Call Provisions (b) | Value | |||||||||||
Transportation - 13.4% (8.1% of Total Investments) | ||||||||||||||
| $ | 150 | Los Angeles Department of Airports, California, Revenue Bonds, Los Angeles International Airport, Senior Lien Series 2015E, 5.000%, 5/15/31 | 5/25 at 100.00 | $ | 153,962 | |||||||||
| 4,000 | Los Angeles Department of Airports, California, Revenue Bonds, Los Angeles International Airport, Subordinate Lien Series 2019E, 5.000%, 5/15/49 | 11/28 at 100.00 | 4,268,555 | |||||||||||
| 3,000 | San Diego County Regional Airport Authority, California, Airport Revenue Bonds, Senior Series 2023A, 5.000%, 7/01/53 | 7/33 at 100.00 | 3,311,258 | |||||||||||
| San Diego County Regional Airport Authority, California, Airport Revenue Bonds, Subordinate Series 2021A: | ||||||||||||||
| 3,000 | 4.000%, 7/01/51 | 7/31 at 100.00 | 2,946,222 | |||||||||||
| 4,230 | 4.000%, 7/01/56 | 7/31 at 100.00 | 4,084,650 | |||||||||||
| 5,770 | 5.000%, 7/01/56 | 7/31 at 100.00 | 6,218,410 | |||||||||||
| 9,500 | San Francisco Airport Commission, California, Revenue Bonds, San Francisco International Airport, Refunding Second Series 2023D, 5.250%, 5/01/48 | 5/33 at 100.00 | 10,788,919 | |||||||||||
| 4,535 | San Francisco Airports Commission, California, Revenue Bonds, San Francisco International Airport, Governmental Purpose Second Series 2017B, 5.000%, 5/01/47 | 5/27 at 100.00 | 4,718,616 | |||||||||||
| 44,650 | (f) | San Francisco Airports Commission, California, Revenue Bonds, San Francisco International Airport, Governmental Purpose Second Series 2017B, 5.000%, 5/01/47, (UB) | 5/27 at 100.00 | 46,457,821 | ||||||||||
| 2,025 | San Joaquin Hills Transportation Corridor Agency, Orange County, California, | 1/32 at 100.00 | 2,009,804 | |||||||||||
| Refunding Senior Lien Toll Road Revenue Bonds, Series 2021A, 4.000%, 1/15/50 | ||||||||||||||
| Total Transportation | 84,958,217 | |||||||||||||
U.S. Guaranteed - 11.8% (7.1% of Total Investments) (g) | ||||||||||||||
| 430 | California Health Facilities Financing Authority, California, Revenue Bonds, Sutter Health, Refunding Series 2015A, 5.000%, 8/15/43, (Pre-refunded 8/15/25) | 8/25 at 100.00 | 442,429 | |||||||||||
| California Health Facilities Financing Authority, California, Revenue Bonds, Sutter Health, Refunding Series 2016B: | ||||||||||||||
| 2,040 | 5.000%, 11/15/46, (Pre-refunded 11/15/26) | 11/26 at 100.00 | 2,161,260 | |||||||||||
| 18,430 | California Health Facilities Financing Authority, California, Revenue Bonds, Sutter Health, Series 2016A, 5.000%, 11/15/41, (Pre-refunded 11/15/25) | 11/25 at 100.00 | 19,114,947 | |||||||||||
| California Health Facilities Financing Authority, Revenue Bonds, Providence Health & Services, Refunding Series 2014A: | ||||||||||||||
| 610 | 5.000%, 10/01/38, (Pre-refunded 10/01/24) | 10/24 at 100.00 | 616,775 | |||||||||||
| 2,250 | California Infrastructure and Economic Development Bank, First Lien Revenue Bonds, San Francisco Bay Area Toll Bridge, Series 2003A, 5.000%, 7/01/36, (Pre-refunded 1/01/28) - AMBAC Insured | 1/28 at 100.00 | 2,473,895 | |||||||||||
| 45,825 | Golden State Tobacco Securitization Corporation, California, Enhanced Tobacco Settlement Asset-Backed Revenue Bonds, Refunding Series 2015A, 5.000%, 6/01/45, (Pre-refunded 6/01/25) | 6/25 at 100.00 | 47,051,107 | |||||||||||
| 2,870 | Sanger Unified School District, Fresno County, California, General Obligation Bonds, Election 2012, Series 2014B, 5.000%, 8/01/39, (Pre-refunded 8/01/24) - AGM Insured | 8/24 at 100.00 | 2,892,126 | |||||||||||
| Total U.S. Guaranteed | 74,752,539 | |||||||||||||
Utilities - 22.1% (13.3% of Total Investments) | ||||||||||||||
| 6,665 | California Community Choice Financing Authority, Clean Energy Project Revenue Bonds, Green Series 2023F, 5.500%, 10/01/54, (Mandatory Put 11/01/30) | 8/30 at 100.12 | 7,305,523 | |||||||||||
| 10,045 | California Community Choice Financing Authority, Clean Energy Project Revenue Bonds, Green Series 2024A, 5.000%, 5/01/54, (Mandatory Put 4/01/32) | 1/32 at 100.21 | 10,788,393 | |||||||||||
| 4,000 | California Pollution Control Financing Authority, Water Furnishing Revenue Bonds, San Diego County Water Authoriity Desalination Project Pipeline, Refunding Series 2019, 5.000%, 7/01/39, 144A | 1/29 at 100.00 | 4,138,218 | |||||||||||
| 6,190 | East Bay Municipal Utility District, Alameda and Contra Costa Counties, California, Water System Revenue Bonds, Green Series 2019A, 5.000%, 6/01/49 | 6/29 at 100.00 | 6,678,278 | |||||||||||
| NKX | Nuveen California AMT-Free Quality Municipal Income Fund (continued) Portfolio of Investments February 29, 2024 |
Principal Amount (000) | Description (a) | Optional Call Provisions (b) | Value | |||||||||||
Utilities | ||||||||||||||
| Long Beach Bond Finance Authority, California, Natural Gas Purchase Revenue Bonds, Series 2007A: | ||||||||||||||
| $ | 2,490 | 5.000%, 11/15/35 | No Opt. Call | $ | 2,747,039 | |||||||||
| 1,835 | 5.500%, 11/15/37 | No Opt. Call | 2,104,803 | |||||||||||
| 7,960 | Los Angeles Department of Water and Power, California, Power System Revenue Bonds, Series 2015E, 5.000%, 7/01/44 | 7/24 at 100.00 | 7,983,445 | |||||||||||
| 6,015 | Los Angeles Department of Water and Power, California, Power System Revenue Bonds, Series 2017A, 5.000%, 7/01/47 | 1/27 at 100.00 | 6,252,122 | |||||||||||
| 3,575 | Los Angeles Department of Water and Power, California, Power System Revenue Bonds, Series 2019A, 5.000%, 7/01/45 | 1/29 at 100.00 | 3,856,199 | |||||||||||
| 5,190 | Los Angeles Department of Water and Power, California, Power System Revenue Bonds, Series 2020B, 5.000%, 7/01/50 | 7/30 at 100.00 | 5,650,515 | |||||||||||
| 3,000 | Los Angeles Department of Water and Power, California, Power System Revenue Bonds, Series 2022B, 5.000%, 7/01/47 | 7/32 at 100.00 | 3,361,535 | |||||||||||
| 1,145 | Los Angeles Department of Water and Power, California, Waterworks Revenue Bonds, Refunding Series 2016B, 5.000%, 7/01/42 | 1/26 at 100.00 | 1,180,350 | |||||||||||
| 5,000 | Los Angeles Department of Water and Power, California, Waterworks Revenue Bonds, Series 2018B, 5.000%, 7/01/48 | 7/28 at 100.00 | 5,355,459 | |||||||||||
| 8,250 | Los Angeles Department of Water and Power, California, Waterworks Revenue Bonds, Series 2020C, 5.000%, 7/01/38 | 7/30 at 100.00 | 9,347,440 | |||||||||||
| 9,500 | Los Angeles, California, Wastewater System Revenue Bonds, Green Series 2015C, 5.000%, 6/01/45 | 6/25 at 100.00 | 9,679,700 | |||||||||||
| 5,000 | Los Angeles, California, Wastewater System Revenue Bonds, Green Subordinate Series 2018A, 5.000%, 6/01/43 | 6/28 at 100.00 | 5,350,750 | |||||||||||
| Los Angeles, California, Wastewater System Revenue Bonds, Refunding Subordinate Lien Series 2013A: | ||||||||||||||
| 2,000 | 5.000%, 6/01/34 | 3/24 at 100.00 | 2,003,810 | |||||||||||
| 3,500 | 5.000%, 6/01/35 | 3/24 at 100.00 | 3,506,667 | |||||||||||
| 3,500 | Metropolitan Water District of Southern California, Water Revenue Bonds, Refunding Series 2023A, 5.000%, 4/01/53 | 4/33 at 100.00 | 3,932,557 | |||||||||||
| 1,000 | New York State Environmental Facilities Corporation, State Clean Water and Drinking Water Revolving Funds Revenue Bonds, New York City Municipal Water Finance Authority Projects-Second Resolution Bonds, Subordinated SRF Series 2017A, 5.000%, 6/15/46 | 6/27 at 100.00 | 1,050,815 | |||||||||||
| 2,000 | Orange County Sanitation District, California, Wastewater Revenue Bonds, Refunding Series 2016A, 5.000%, 2/01/35 | 2/26 at 100.00 | 2,078,591 | |||||||||||
| 8,660 | Puerto Rico Aqueduct and Sewerage Authority, Revenue Bonds, Refunding Senior Lien Series 2020A, 5.000%, 7/01/47, 144A | 7/30 at 100.00 | 8,743,533 | |||||||||||
| 2,000 | San Diego Public Facilities Financing Authority, California, Water Utility Revenue Bonds, Refunding Subordinate Lien Series 2016B, 5.000%, 8/01/37 | 8/26 at 100.00 | 2,100,128 | |||||||||||
| 5,000 | South Coast Water District Financing Authority, California, Revenue Bonds, Series 2019A, 5.000%, 2/01/44 | 2/29 at 100.00 | 5,426,116 | |||||||||||
| 2,975 | Southern California Public Power Authority, California, Revenue Bonds, Apex Power Project Series 2014A, 5.000%, 7/01/37 | 7/24 at 100.00 | 2,983,279 | |||||||||||
| 14,530 | Southern California Public Power Authority, Southern Transmission System Renewal Project Revenue Bonds, Series 2023-1A, 5.000%, 7/01/48 | 7/33 at 100.00 | 16,467,432 | |||||||||||
| Total Utilities | 140,072,697 | |||||||||||||
Total Municipal Bonds (cost $1,002,677,463) | 1,032,645,123 | |||||||||||||
Total Long-Term Investments (cost $1,002,677,463) | 1,032,645,123 | |||||||||||||
Principal Amount (000) | Description (a) | Optional Call Provisions (b) | Value | |||||||||||
SHORT-TERM INVESTMENTS - 3.5% (2.1% of Total Investments) | ||||||||||||||
MUNICIPAL BONDS - 3.5% (2.1% of Total Investments) | ||||||||||||||
Health Care - 1.9% (1.1% of Total Investments) | ||||||||||||||
| $ | 12,000 | (h) | California Health Facilities Financing Authority, California, Revenue Bonds, Scripps Health, Weekly Mode Series 2024C-1, 2.350%, 11/15/63, (Mandatory Put 3/07/24) | 2/24 at 100.00 | $ | 12,000,000 | ||||||||
| Total Health Care | 12,000,000 | |||||||||||||
Principal Amount (000) | Description (a) | Optional Call Provisions (b) | Value | |||||||||||
Utilities - 1.6% (1.0% of Total Investments) | ||||||||||||||
| $ 10,000 | (h) | Los Angeles Department of Water and Power, California, Power System Revenue Bonds, Variable Rate Demand Obligations Series 2001B-6, 3.300%, 7/01/34, (Mandatory Put 2/29/24) | 3/24 at 100.00 | $ | 10,000,000 | |||||||||
| Total Utilities | 10,000,000 | |||||||||||||
Total Municipal Bonds (cost $22,000,000) | 22,000,000 | |||||||||||||
Total Short-Term Investments (cost $22,000,000) | 22,000,000 | |||||||||||||
Total Investments (cost $1,024,677,463) - 166.6% | 1,054,645,123 | |||||||||||||
Floating Rate Obligations - (5.3)% | (33,485,000 | ) | ||||||||||||
MFP Shares, Net - (22.1)% (i) | (140,039,979 | ) | ||||||||||||
VRDP Shares, Net - (40.4)% (j) | (255,688,536 | ) | ||||||||||||
Other Assets & Liabilities, Net - 1.2% | 7,788,539 | |||||||||||||
Net Assets Applicable to Common Shares - 100% | $ | 633,220,147 | ||||||||||||
| (a) | All percentages shown in the Portfolio of Investments are based on net assets applicable to common shares unless otherwise noted. |
| (b) | Optional Call Provisions: Dates (month and year) and prices of the earliest optional call or redemption. There may be other call provisions at varying prices at later dates. Certain mortgage-backed securities may be subject to periodic principal paydowns. Optional Call Provisions are not covered by the report of independent registered public accounting firm. |
| (c) | Defaulted security. A security whose issuer has failed to fully pay principal and/or interest when due, or is under the protection of bankruptcy. |
| (d) | For fair value measurement disclosure purposes, investment classified as Level 3. |
| (e) | Step-up coupon bond, a bond with a coupon that increases (“steps up”), usually at regular intervals, while the bond is outstanding. The rate shown is the coupon as of the end of the reporting period. |
| (f) | Investment, or portion of investment, has been pledged to collateralize the net payment obligations for investments in inverse floating rate transactions. |
| (g) | Backed by an escrow or trust containing sufficient U.S. Government or U.S. Government agency securities, which ensure the timely payment of principal and interest. |
| (h) | Investment has a maturity of greater than one year, but has variable rate and/or demand features which qualify it as a short-term investment. The rate disclosed, as well as the reference rate and spread, where applicable, is that in effect as of the end of the reporting period. This rate changes periodically based on market conditions or a specified market index. |
| (i) | MFP Shares, Net as a percentage of Total Investments is 13.3%. |
| (j) | VRDP Shares, Net as a percentage of Total Investments is 24.2%. |
| 144A | Investment is exempt from registration under Rule 144A of the Securities Act of 1933, as amended. These investments may only be resold in transactions exempt from registration, which are normally those transactions with qualified institutional buyers. |
| UB | Underlying bond of an inverse floating rate trust reflected as a financing transaction. |
| NCA | Nuveen California Municipal Value Fund Portfolio of Investments February 29, 2024 |
Principal Amount (000) | Description (a) | Optional Call Provisions (b) | Value | |||||||||||
LONG-TERM INVESTMENTS - 96.1% (96.8% of Total Investments) | ||||||||||||||
MUNICIPAL BONDS - 96.1% (96.8% of Total Investments) | ||||||||||||||
Consumer Staples - 0.6% (0.6% of Total Investments) | ||||||||||||||
| $ | 70 | California County Tobacco Securitization Agency, Tobacco Settlement Asset- Backed Bonds, Los Angeles County Securitization Corporation, Series 2020A, 4.000%, 6/01/49 | 6/30 at 100.00 | $ | 68,257 | |||||||||
| 4,895 | Silicon Valley Tobacco Securitization Authority, California, Tobacco Settlement Asset-Backed Bonds, Santa Clara County Tobacco Securitization Corporation, Series 2007A, 0.000%, 6/01/41 | 4/24 at 38.23 | 1,863,702 | |||||||||||
| Total Consumer Staples | 1,931,959 | |||||||||||||
Education and Civic Organizations - 3.1% (3.2% of Total Investments) | ||||||||||||||
| 2,000 | California Infrastructure and Economic Development Bank, Revenue Bonds, Los Angeles County Museum of Natural History Foundation, Series 2020, 4.000%, 7/01/50 | 7/30 at 100.00 | 1,938,314 | |||||||||||
| 1,000 | California Municipal Finance Authority, Revenue Bonds, Linxs APM Project, Senior Lien Series 2018A, 5.000%, 12/31/43, (AMT) | 6/28 at 100.00 | 1,000,079 | |||||||||||
| 220 | California School Finance Authority, School Facility Revenue Bonds, Alliance for College-Ready Public Schools Project, Series 2016A, 5.000%, 7/01/46, 144A | 7/25 at 100.00 | 220,041 | |||||||||||
| 1,425 | California School Finance Authority, School Facility Revenue Bonds, Alliance for College-Ready Public Schools Project, Series 2016C, 5.250%, 7/01/52, 144A | 7/25 at 101.00 | 1,429,519 | |||||||||||
| 3,780 | University of California, General Revenue Bonds, Limited Project Series 2017M, 5.000%, 5/15/47 | 5/27 at 100.00 | 3,987,412 | |||||||||||
| 1,070 | University of California, General Revenue Bonds, Series 2018AZ, 5.000%, 5/15/38 | 5/28 at 100.00 | 1,165,792 | |||||||||||
| Total Education and Civic Organizations | 9,741,157 | |||||||||||||
Health Care - 9.6% (9.7% of Total Investments) | ||||||||||||||
| California Health Facilities Financing Authority, California, Revenue Bonds, Sutter Health, Refunding Series 2016B: | ||||||||||||||
| 4,105 | 5.000%, 11/15/46 | 11/26 at 100.00 | 4,200,786 | |||||||||||
| 1,000 | California Health Facilities Financing Authority, California, Revenue Bonds, Sutter Health, Series 2018A, 5.000%, 11/15/36 | 11/27 at 100.00 | 1,064,192 | |||||||||||
| 2,045 | California Health Facilities Financing Authority, Revenue Bonds, City of Hope National Medical Center, Series 2019, 4.000%, 11/15/45 | 11/29 at 100.00 | 1,985,113 | |||||||||||
| California Health Facilities Financing Authority, Revenue Bonds, CommonSpirit Health, Series 2020A: | ||||||||||||||
| 1,815 | 4.000%, 4/01/44 | 4/30 at 100.00 | 1,768,196 | |||||||||||
| 3,830 | 4.000%, 4/01/49 | 4/30 at 100.00 | 3,682,518 | |||||||||||
| California Health Facilities Financing Authority, Revenue Bonds, Providence Health & Services, Refunding Series 2014A: | ||||||||||||||
| 240 | 5.000%, 10/01/38 | 10/24 at 100.00 | 241,419 | |||||||||||
| 840 | California Health Facilities Financing Authority, Revenue Bonds, Providence Health & Services, Series 2014B, 5.000%, 10/01/44 | 10/24 at 100.00 | 843,346 | |||||||||||
| 1,600 | California Municipal Finance Authority, Revenue Bonds, Community Health System, Series 2021A, 4.000%, 2/01/51 - AGM Insured California Municipal Finance Authority, Revenue Bonds, Eisenhower Medical Center, Refunding Series 2017A: | 2/32 at 100.00 | 1,526,904 | |||||||||||
| 2,000 | 4.000%, 7/01/47 | 7/27 at 100.00 | 1,774,260 | |||||||||||
| 120 | 5.000%, 7/01/47 | 7/27 at 100.00 | 121,309 | |||||||||||
| California Municipal Finance Authority, Revenue Bonds, NorthBay Healthcare Group, Series 2017A: | ||||||||||||||
| 100 | 5.250%, 11/01/41 | 11/26 at 100.00 | 100,543 | |||||||||||
| 1,090 | 5.000%, 11/01/47 | 11/26 at 100.00 | 1,016,927 | |||||||||||
| 400 | 5.250%, 11/01/47 | 11/26 at 100.00 | 396,231 | |||||||||||
| 520 | California Municipal Financing Authority, Certificates of Participation, Palomar 11/32 at 100.00 Health, Series 2022A, 5.250%, 11/01/52 - AGM Insured | 583,308 | ||||||||||||
Principal Amount (000) | Description (a) | Optional Call Provisions (b) | Value | |||||||||
Health Care | ||||||||||||
| $ | 1,000 | California Statewide Communities Development Authority, California, Redlands Community Hospital, Revenue Bonds, Series 2016, 5.000%, 10/01/46 | 10/26 at 100.00 | $ | 1,019,569 | |||||||
| 150 | California Statewide Communities Development Authority, California, Revenue Bonds, Loma Linda University Medical Center, Series 2014A, 5.250%, 12/01/34 | 12/24 at 100.00 | 150,777 | |||||||||
| 5,800 | California Statewide Communities Development Authority, California, Revenue Bonds, Loma Linda University Medical Center, Series 2016A, 5.250%, 12/01/56, 144A | 6/26 at 100.00 | 5,826,887 | |||||||||
| 1,000 | California Statewide Communities Development Authority, California, Revenue Bonds, Loma Linda University Medical Center, Series 2018A, 5.500%, 12/01/58, 144A | 6/28 at 100.00 | 1,017,100 | |||||||||
| 245 | California Statewide Community Development Authority, Health Revenue Bonds, Enloe Medical Center, Refunding Series 2022A, 5.250%, 8/15/52 - AGM Insured | 8/32 at 100.00 | 268,232 | |||||||||
| 2,000 | University of California Regents, Medical Center Pooled Revenue Bonds, Series 2022P, 5.000%, 5/15/47 | 5/32 at 100.00 | 2,221,230 | |||||||||
| Total Health Care | 29,808,847 | |||||||||||
Housing/Multifamily - 9.1% (9.1% of Total Investments) | ||||||||||||
| 2,175 | California Community Housing Agency, California, Essential Housing Revenue Bonds, Creekwood, Series 2021A, 4.000%, 2/01/56, 144A | 8/31 at 100.00 | 1,455,568 | |||||||||
| 2,190 | California Community Housing Agency, California, Essential Housing Revenue Bonds, Glendale Properties, Junior Series 2021A-2, 4.000%, 8/01/47, 144A | 8/31 at 100.00 | 1,787,764 | |||||||||
| 1,420 | California Community Housing Agency, California, Essential Housing Revenue Bonds, Serenity at Larkspur Apartments, Series 2020A, 5.000%, 2/01/50, 144A | 2/30 at 100.00 | 1,083,816 | |||||||||
| 800 | California Community Housing Agency, California, Essential Housing Revenue Bonds, Stoneridge Apartments, Series 2021A, 4.000%, 2/01/56, 144A | 2/31 at 100.00 | 619,428 | |||||||||
| 1,115 | California Community Housing Agency, Workforce Housing Revenue Bonds, Annadel Apartments, Series 2019A, 5.000%, 4/01/49, 144A | 4/29 at 100.00 | 927,337 | |||||||||
| 2,162 | California Housing Finance Agency, Municipal Certificate Revenue Bonds, Class A Series 2019-2, 4.000%, 3/20/33 | No Opt. Call | 2,166,728 | |||||||||
| 1,826 | California Housing Finance Agency, Municipal Certificate Revenue Bonds, Class A Series 2021-1, 3.500%, 11/20/35 | No Opt. Call | 1,725,844 | |||||||||
| 321 | California Housing Finance Agency, Municipal Certificate Revenue Bonds, Class A Series2019-1, 4.250%, 1/15/35 | No Opt. Call | 320,372 | |||||||||
| 1,781 | California Housing Finance Agency, Municipal Certificate Revenue Bonds, Class A Social Certificates Series 2023-1, 4.375%, 9/20/36 | No Opt. Call | 1,763,877 | |||||||||
| California Municipal Finance Authority, Mobile Home Park Revenue Bonds, Caritas Affordable Housing Inc Projects, Senior Series 2014A: | ||||||||||||
| 80 | 5.250%, 8/15/39 | 8/24 at 100.00 | 80,448 | |||||||||
| 215 | 5.250%, 8/15/49 | 8/24 at 100.00 | 215,744 | |||||||||
| 2,320 | CMFA Special Finance Agency I, California, Essential Housing Revenue Bonds, The Mix at Center City, Series 2021A-2, 4.000%, 4/01/56, 144A | 4/31 at 100.00 | 1,684,341 | |||||||||
| 800 | CMFA Special Finance Agency, California, Essential Housing Revenue Bonds, Enclave Apartments, Senior Series 2022A-1, 4.000%, 8/01/58, 144A | 2/32 at 100.00 | 623,657 | |||||||||
| 125 | CSCDA Community Improvement Authority, California, Essential Housing Revenue Bonds, 777 Place-Pomona, Senior Lien Series 2021A-1, 3.600%, 5/01/47, 144A | 5/32 at 100.00 | 103,550 | |||||||||
| 1,130 | CSCDA Community Improvement Authority, California, Essential Housing Revenue Bonds, 777 Place-Pomona, Senior Lien Series 2021A-2, 3.250%, 5/01/57, 144A | 5/32 at 100.00 | 784,803 | |||||||||
| 175 | CSCDA Community Improvement Authority, California, Essential Housing Revenue Bonds, Acacia on Santa Rosa Creek, Mezzanine Lien Series 2021B, 4.000%, 10/01/46, 144A | 10/31 at 100.00 | 136,175 | |||||||||
| 1,465 | CSCDA Community Improvement Authority, California, Essential Housing Revenue Bonds, Acacia on Santa Rosa Creek, Senior Lien Series 2021A, 4.000%, 10/01/56, 144A | 10/31 at 100.00 | 1,257,831 | |||||||||
| 2,005 | CSCDA Community Improvement Authority, California, Essential Housing Revenue Bonds, Altana Glendale, Series 2021A-2, 4.000%, 10/01/56, 144A | 10/31 at 100.00 | 1,553,990 | |||||||||
| NCA | Nuveen California Municipal Value Fund (continued) Portfolio of Investments February 29, 2024 |
Principal Amount (000) | Description (a) | Optional Call Provisions (b) | Value | |||||||||
Housing/Multifamily | ||||||||||||
| $ | 2,310 | CSCDA Community Improvement Authority, California, Essential Housing Revenue Bonds, Center City Anaheim, Series 2020A, 5.000%, 1/01/54, 144A | 1/31 at 100.00 | $ | 1,865,067 | |||||||
| 370 | CSCDA Community Improvement Authority, California, Essential Housing Revenue Bonds, Millennium South Bay-Hawthorne, Series2021A-1 andA-2, 3.250%, 7/01/56, 144A | 7/32 at 100.00 | 254,990 | |||||||||
| 1,925 | CSCDA Community Improvement Authority, California, Essential Housing Revenue Bonds, Moda at Monrovia Station, Social Series 2021A-2, 4.000%, 10/01/56, 144A | 10/31 at 100.00 | 1,415,843 | |||||||||
| CSCDA Community Improvement Authority, California, Essential Housing Revenue Bonds, Monterrey Station Apartments, Senior Lien Series 2021A-1: | ||||||||||||
| 220 | 3.000%, 7/01/43, 144A | 7/32 at 100.00 | 172,604 | |||||||||
| 950 | 3.125%, 7/01/56, 144A | 7/32 at 100.00 | 640,764 | |||||||||
| 405 | CSCDA Community Improvement Authority, California, Essential Housing Revenue Bonds, Oceanaire-Long Beach, Social Series 2021A-2, 4.000%, 9/01/56, 144A | 9/31 at 100.00 | 307,531 | |||||||||
| 875 | CSCDA Community Improvement Authority, California, Essential Housing Revenue Bonds, Parallel-Anaheim Series 2021A, 4.000%, 8/01/56, 144A | 8/31 at 100.00 | 730,390 | |||||||||
| 530 | CSCDA Community Improvement Authority, California, Essential Housing Revenue Bonds, Pasadena Portfolio Social Bond, Mezzanine Senior Series 2021B, 4.000%, 12/01/56, 144A | 12/31 at 100.00 | 391,394 | |||||||||
| 555 | CSCDA Community Improvement Authority, California, Essential Housing Revenue Bonds, Pasadena Portfolio Social Bond, Series 2021A-2, 3.000%, 12/01/56 | 12/31 at 100.00 | 389,473 | |||||||||
| 795 | CSCDA Community Improvement Authority, California, Essential Housing Revenue Bonds, Union South Bay, Series 2021A-2, 4.000%, 7/01/56, 144A | 7/31 at 100.00 | 608,811 | |||||||||
| 560 | CSCDA Community Improvement Authority, California, Essential Housing Revenue Bonds, Westgate Phase 1-Pasadena Apartments, Senior Lien Series2021A-1, 3.000%, 6/01/47, 144A | 6/31 at 100.00 | 410,173 | |||||||||
| 2,035 | CSCDA Community Improvement Authority, California, Essential Housing Revenue Bonds, Westgate Phase 1-Pasadena Apartments, Senior Lien Series2021A-2, 3.125%, 6/01/57, 144A | 6/31 at 100.00 | 1,289,824 | |||||||||
| 2,080 | CSCDA Community Improvement Authority, California, Essential Housing Revenue Bonds, Wood Creek Apartments, Senior Lien Series 2021A-1, 3.000%, 12/01/49 | 6/32 at 100.00 | 1,421,036 | |||||||||
| Total Housing/Multifamily | 28,189,173 | |||||||||||
Long-Term Care - 0.2% (0.2% of Total Investments) | ||||||||||||
| 545 | California Health Facilities Financing Authority, Insured Revenue Bonds, Community Program for Persons with Developmental Disabilities, Series 2011A, 6.250%, 2/01/26 | 4/24 at 100.00 | 546,424 | |||||||||
| Total Long-Term Care | 546,424 | |||||||||||
Tax Obligation/General - 24.5% (24.6% of Total Investments) | ||||||||||||
| 4,000 | Anaheim Union High School District, Orange County, California, General Obligation Bonds, 2014 Election Series 2019, 3.000%, 8/01/40 - BAM Insured | 8/27 at 100.00 | 3,573,549 | |||||||||
| 375 | Butte-Glenn Community College District, Butte and Glenn Counties, California, General Obligation Bonds, Election 2016 Series 2017A, 5.250%, 8/01/46 | 8/27 at 100.00 | 397,448 | |||||||||
| 5 | California State, General Obligation Bonds, Series 2013, 5.000%, 2/01/29 | 4/24 at 100.00 | 5,007 | |||||||||
| 3,000 | California State, General Obligation Bonds, Various Purpose Refunding Series 2015, 5.000%, 8/01/34 | 8/25 at 100.00 | 3,076,604 | |||||||||
| California State, General Obligation Bonds, Various Purpose Series 2014: | ||||||||||||
| 5,000 | 5.000%, 5/01/32 | 5/24 at 100.00 | 5,013,987 | |||||||||
| 1,970 | 5.000%, 10/01/44 | 10/24 at 100.00 | 1,980,772 | |||||||||
| 2,000 | California State, General Obligation Bonds, Various Purpose Series 2018. Bid Group A/B, 5.000%, 10/01/48 | 10/28 at 100.00 | 2,139,317 | |||||||||
| 5,000 | California State, General Obligation Bonds, Various Purpose Series 2023, 5.000%, 9/01/26 | No Opt. Call | 5,279,097 | |||||||||
| 2,100 | Carlsbad Unified School District, San Diego County, California, General Obligation Bonds, Series 2009B, 6.000%, 5/01/34 | 5/24 at 100.00 | 2,108,131 | |||||||||
| 3,000 | Chaffey Community College District, San Bernardino County, California, General Obligation Bonds, Taxable Refunding Series 2019, 4.000%, 6/01/43 | 6/28 at 100.00 | 3,041,219 | |||||||||
Principal Amount (000) | Description (a) | Optional Call Provisions (b) | Value | |||||||||||
Tax Obligation/General | ||||||||||||||
| $ | 1,000 | Chaffey Joint Union High School District, San Bernardino County, California, General Obligation Bonds, Election 2012 Series 2017C, 5.250%, 8/01/47 | 2/27 at 100.00 | $ | 1,047,433 | |||||||||
| 5,000 | Chino Valley Unified School District, San Bernardino County, California, General Obligation Bonds, 2016 Election Series 2020B, 5.000%, 8/01/55 | 8/30 at 100.00 | 5,386,927 | |||||||||||
| 4,200 | Corona-Norco Unified School District, Riverside County, California, General Obligation Bonds, Election 2014, Series 2019C, 4.000%, 8/01/49 | 8/28 at 100.00 | 4,196,795 | |||||||||||
| 5,725 | Desert Community College District, Riverside County, California, General Obligation Bonds, Election of 2016 Series 2024, 4.000%, 8/01/51 | 8/33 at 100.00 | 5,725,674 | |||||||||||
| 690 | Los Angeles Community College District, California, General Obligation Bonds, 2008 Election Series 2017J, 4.000%, 8/01/41 | 8/27 at 100.00 | 693,746 | |||||||||||
| 2,000 | Marin Healthcare District, Marin County, California, General Obligation Bonds, 2013 Election, Series 2015A, 4.000%, 8/01/40 | 8/25 at 100.00 | 1,986,351 | |||||||||||
| 519 | Puerto Rico, General Obligation Bonds, Restructured Series 2022A-1, 4.000%, 7/01/41 | 7/31 at 103.00 | 482,065 | |||||||||||
| 840 | San Benito High School District, San Benito and Santa Clara Counties, California, General Obligation Bonds, 2016 Election Series 2017, 5.250%, 8/01/46 | 8/27 at 100.00 | 889,729 | |||||||||||
| 11,875 | (c) | San Mateo Union High School District, San Mateo County, California, General Obligation Bonds, Election 2010 Series 2011A, 0.000%, 9/01/41 | 9/36 at 100.00 | 12,472,130 | ||||||||||
| 19,860 | (c) | Yosemite Community College District, California, General Obligation Bonds, Capital Appreciation, Election 2004, Series 2010D, 0.000%, 8/01/42 | No Opt. Call | 16,523,653 | ||||||||||
| Total Tax Obligation/General | 76,019,634 | |||||||||||||
Tax Obligation/Limited - 9.4% (9.5% of Total Investments) | ||||||||||||||
| 1,000 | Bell Community Redevelopment Agency, California, Tax Allocation Bonds, Bell Project Area, Series 2003, 5.625%, 10/01/33 - RAAI Insured | 4/24 at 100.00 | 1,003,347 | |||||||||||
| 70 | Brentwood Infrastructure Financing Authority, California, Infrastructure Revenue Bonds, Refunding Subordinated Series 2014B, 5.000%, 9/02/36 | 9/24 at 100.00 | 70,376 | |||||||||||
| 1,000 | California Infrastructure and Economic Development Bank, Lease Revenue Bonds, California State Teachers Retirement System Headquarters Expansion, Green Bond-Climate Bond Certified Series 2019, 5.000%, 8/01/44 | 8/29 at 100.00 | 1,078,253 | |||||||||||
| 1,250 | California State Public Works Board, Lease Revenue Bonds, Department of Corrections & Rehabilitation, Various Correctional Facilities Series 2014A, 5.000%, 9/01/39 | 9/24 at 100.00 | 1,256,967 | |||||||||||
| 55 | Golden State Tobacco Securitization Corporation, California, Tobacco Settlement Asset-Backed Revenue Bonds, Series 2022A-1, 5.000%, 6/01/51 | 12/31 at 100.00 | 57,730 | |||||||||||
| 1,000 | Los Angeles County Facilities Inc, California, Lease Revenue Bonds, Vermont Corridor County Administration Building, Series 2018A, 5.000%, 12/01/51 | 12/28 at 100.00 | 1,055,783 | |||||||||||
| 4,000 | Los Angeles County Metropolitan Transportation Authority, California, Measure R Sales Tax Revenue Bonds, Senior Series 2016A, 5.000%, 6/01/39 | 6/26 at 100.00 | 4,155,957 | |||||||||||
| 2,300 | Los Angeles County Metropolitan Transportation Authority, California, Proposition C Sales Tax Revenue Bonds, Senior Lien Series 2017A, 5.000%, 7/01/42 | 7/27 at 100.00 | 2,434,743 | |||||||||||
| 700 | Los Angeles Unified School District, California, Certificates of Participation, Sustainability Green Series 2023A, 5.000%, 10/01/24 | No Opt. Call | 707,213 | |||||||||||
| 4,923 | Puerto Rico Sales Tax Financing Corporation, Sales Tax Revenue Bonds, Restructured 2018A-1, 5.000%, 7/01/58 | 7/28 at 100.00 | 4,959,913 | |||||||||||
| Puerto Rico Sales Tax Financing Corporation, Sales Tax Revenue Bonds, Taxable Restructured Cofina Project Series 2019A-2: | ||||||||||||||
| 29 | 4.329%, 7/01/40 | 7/28 at 100.00 | 28,868 | |||||||||||
| 2,095 | 4.784%, 7/01/58 | 7/28 at 100.00 | 2,089,767 | |||||||||||
| 625 | River Islands Public Financing Authority, California, Special Tax Bonds, Community Facilities District 2003-1 Improvement Area 1, Refunding Series2022A-1, 5.250%, 9/01/52 - AGM Insured | 9/29 at 103.00 | 682,079 | |||||||||||
| 145 | San Francisco City and County Redevelopment Agency Successor Agency, California, Special Tax Bonds, Community Facilities District 7, Hunters Point Shipyard Phase One Improvements, Refunding Series 2014, 5.000%, 8/01/39 | 8/24 at 100.00 | 145,582 | |||||||||||
| 5,000 | San Francisco City and County Redevelopment Agency Successor Agency, California, Tax Allocation Bonds, Mission Bay North Redevelopment Project, Refunding Series 2016A, 5.000%, 8/01/41 - NPFG Insured | 8/26 at 100.00 | 5,186,459 | |||||||||||
| 80 | Signal Hill Redevelopment Agency, California, Project 1 Tax Allocation Bonds, Series 2011, 7.000%, 10/01/26 | 4/24 at 100.00 | 80,213 | |||||||||||
| NCA | Nuveen California Municipal Value Fund (continued) Portfolio of Investments February 29, 2024 |
Principal Amount (000) | Description (a) | Optional Call Provisions (b) | Value | |||||||||
Tax Obligation/Limited | ||||||||||||
| Stockton Public Financing Authority, California, Revenue Bonds, Arch Road East Community Facility District 99-02, Series 2018A: | ||||||||||||
| $ | 1,000 | 5.000%, 9/01/33 | 9/25 at 103.00 | $ | 1,050,248 | |||||||
| 765 | 5.000%, 9/01/43 | 9/25 at 103.00 | 787,726 | |||||||||
| 195 | Temecula Public Financing Authority, California, Special Tax Bonds, Community Facilities District 16-01, Series 2017, 5.750%, 9/01/32, 144A | 9/27 at 100.00 | 209,497 | |||||||||
| 2,185 | Transbay Joint Powers Authority, California, Tax Allocation Bonds, Senior Green Series 2020A, 5.000%, 10/01/45 | 4/30 at 100.00 | 2,247,632 | |||||||||
| Total Tax Obligation/Limited | 29,288,353 | |||||||||||
Transportation - 18.1% (18.2% of Total Investments) | ||||||||||||
| 225 | California Municipal Finance Authority, Special Facility Revenue Bonds, United Airlines, Inc. Los Angeles International Airport Project, Series 2019, 4.000%, 7/15/29, (AMT) | No Opt. Call | 222,055 | |||||||||
| 10,415 | Los Angeles Department of Airports, California, Revenue Bonds, Los Angeles International Airport, Subordinate Lien Series 2018C, 5.000%, 5/15/44, (AMT) | 11/27 at 100.00 | 10,716,074 | |||||||||
| 2,670 | Los Angeles Department of Airports, California, Revenue Bonds, Los Angeles International Airport, Subordinate Lien Series 2019D, 5.000%, 5/15/33, (AMT) | 11/28 at 100.00 | 2,859,029 | |||||||||
| 1,480 | Los Angeles Department of Airports, California, Revenue Bonds, Los Angeles International Airport, Subordinate Lien Series 2022A, 5.000%, 5/15/45, (AMT) | 5/32 at 100.00 | 1,574,445 | |||||||||
| 2,345 | San Diego County Regional Airport Authority, California, Airport Revenue Bonds, International Senior Series 2023B, 5.250%, 7/01/58, (AMT) | 7/33 at 100.00 | 2,504,317 | |||||||||
| 3,075 | San Diego County Regional Airport Authority, California, Airport Revenue Bonds, Subordinate Series 2021A, 4.000%, 7/01/51 | 7/31 at 100.00 | 3,019,878 | |||||||||
| 5,000 | San Diego County Regional Airport Authority, California, Airport Revenue Bonds, Subordinate Series 2021B, 4.000%, 7/01/51, (AMT) | 7/31 at 100.00 | 4,683,961 | |||||||||
| 4,200 | San Francisco Airport Commission, California, Revenue Bonds, San Francisco International Airport, Refunding Second Series 2023C, 5.500%, 5/01/40, (AMT) | 5/33 at 100.00 | 4,786,439 | |||||||||
| 16,295 | San Francisco Airports Commission, California, Revenue Bonds, San Francisco International Airport, Governmental Purpose Second Series 2017B, 5.000%, 5/01/47 | 5/27 at 100.00 | 16,954,763 | |||||||||
| 3,740 | San Francisco Airports Commission, California, Revenue Bonds, San Francisco International Airport, Second Governmental Purpose Series 2016C, 5.000%, 5/01/46 | 5/26 at 100.00 | 3,840,586 | |||||||||
| 4,160 | San Francisco Airports Commission, California, Revenue Bonds, San Francisco International Airport, Second Series 2018D, 5.000%, 5/01/43, (AMT) | 5/28 at 100.00 | 4,300,602 | |||||||||
| 665 | San Joaquin Hills Transportation Corridor Agency, Orange County, California, Refunding Senior Lien Toll Road Revenue Bonds, Series 2021A, 4.000%, 1/15/50 | 1/32 at 100.00 | 660,010 | |||||||||
| 250 | San Joaquin Hills Transportation Corridor Agency, Orange County, California, Toll Road Revenue Bonds, Refunding Junior Lien Series 2014B, 5.250%, 1/15/44 | 1/25 at 100.00 | 252,940 | |||||||||
| Total Transportation | 56,375,099 | |||||||||||
U.S. Guaranteed - 1.0% (1.0% of Total Investments) (d) | ||||||||||||
| 1,500 | Bay Area Toll Authority, California, Revenue Bonds, San Francisco Bay Area Toll Bridge, Subordinate Series 2019S-H, 5.000%, 4/01/44,(Pre-refunded 4/01/29) | 4/29 at 100.00 | 1,693,556 | |||||||||
| 285 | California Health Facilities Financing Authority, California, Revenue Bonds, Sutter Health, Refunding Series 2015A, 5.000%, 8/15/43, (Pre-refunded 8/15/25) | 8/25 at 100.00 | 293,238 | |||||||||
| California Health Facilities Financing Authority, California, Revenue Bonds, Sutter Health, Refunding Series 2016B: | ||||||||||||
| 795 | 5.000%, 11/15/46, (Pre-refunded 11/15/26) | 11/26 at 100.00 | 842,256 | |||||||||
| California Health Facilities Financing Authority, Revenue Bonds, Providence Health & Services, Refunding Series 2014A: | ||||||||||||
| 185 | 5.000%, 10/01/38, (Pre-refunded 10/01/24) | 10/24 at 100.00 | 187,054 | |||||||||
| Golden State Tobacco Securitization Corporation, California, Enhanced Tobacco Settlement Asset-Backed Revenue Bonds, Refunding Series 2015A: | ||||||||||||
| 80 | 5.000%, 6/01/40, (Pre-refunded 6/01/25) | 6/25 at 100.00 | 82,140 | |||||||||
| 100 | 5.000%, 6/01/40, (Pre-refunded 6/01/25) | 6/25 at 100.00 | 102,676 | |||||||||
| Total U.S. Guaranteed | 3,200,920 | |||||||||||
Principal Amount (000) | Description (a) | Optional Call Provisions (b) | Value | |||||||||
Utilities - 20.5% (20.7% of Total Investments) | ||||||||||||
| $ | 2,935 | California Community Choice Financing Authority, Clean Energy Project Revenue Bonds, Green Series 2024A, 5.000%, 5/01/54, (Mandatory Put 4/01/32) | 1/32 at 100.21 | $ | 3,152,208 | |||||||
| 850 | California Infrastructure and Economic Development Bank. Clean Water State Revolving Fund Revenue Bonds, Green Series 2018, 5.000%, 10/01/43 | 4/28 at 100.00 | 911,896 | |||||||||
| California Pollution Control Financing Authority, Water Furnishing Revenue Bonds, Poseidon Resources Channelside LP Desalination Project, Series 2012: | ||||||||||||
| 1,375 | 5.000%, 7/01/37, (AMT), 144A | 7/24 at 100.00 | 1,376,317 | |||||||||
| 3,750 | 5.000%, 11/21/45, (AMT), 144A | 7/24 at 100.00 | 3,752,017 | |||||||||
| 1,500 | California Pollution Control Financing Authority, Water Furnishing Revenue Bonds, San Diego County Water Authoriity Desalination Project Pipeline, Refunding Series 2019, 5.000%, 7/01/39, 144A | 1/29 at 100.00 | 1,551,832 | |||||||||
| 2,000 | Irvine Ranch Water District, California, Certificates of Participation, Irvine Ranch Water District Series 2016, 5.000%, 3/01/41 | 9/26 at 100.00 | 2,085,260 | |||||||||
| 1,800 | Long Beach Bond Finance Authority, California, Natural Gas Purchase Revenue Bonds, Series 2007A, 5.500%, 11/15/37 | No Opt. Call | 2,064,657 | |||||||||
| 835 | Los Angeles Department of Water and Power, California, Power System Revenue Bonds, Series 2016B, 5.000%, 7/01/37 | 1/26 at 100.00 | 864,197 | |||||||||
| 2,425 | Los Angeles Department of Water and Power, California, Power System Revenue Bonds, Series 2018D, 5.000%, 7/01/48 | 7/28 at 100.00 | 2,593,353 | |||||||||
| Los Angeles Department of Water and Power, California, Power System Revenue Bonds, Series 2020B: | ||||||||||||
| 1,890 | 5.000%, 7/01/40 | 7/30 at 100.00 | 2,115,603 | |||||||||
| 3,395 | 5.000%, 7/01/45 | 7/30 at 100.00 | 3,739,086 | |||||||||
| 3,795 | Los Angeles Department of Water and Power, California, Power System Revenue Bonds, Series 2022A, 5.000%, 7/01/51 | 7/31 at 100.00 | 4,172,826 | |||||||||
| 4,150 | Los Angeles Department of Water and Power, California, Water System Revenue Bonds, Series 2022B, 5.000%, 7/01/47 | 1/32 at 100.00 | 4,635,918 | |||||||||
| 1,500 | Los Angeles Department of Water and Power, California, Waterworks Revenue Bonds, Series 2018B, 5.000%, 7/01/38 Los Angeles Department of Water and Power, California, Waterworks Revenue Bonds, Series 2020C: | 7/28 at 100.00 | 1,636,196 | |||||||||
| 2,500 | 5.000%, 7/01/36 | 7/30 at 100.00 | 2,871,255 | |||||||||
| 6,000 | 5.000%, 7/01/38 | 7/30 at 100.00 | 6,798,138 | |||||||||
| 1,400 | Los Angeles, California, Wastewater System Revenue Bonds, Green Subordinate Series 2018A, 5.000%, 6/01/38 | 6/28 at 100.00 | 1,519,356 | |||||||||
| 1,000 | M-S-R | No Opt. Call | 1,285,671 | |||||||||
| 2,000 | Puerto Rico Aqueduct and Sewerage Authority, Revenue Bonds, Refunding Senior Lien Series 2020A, 5.000%, 7/01/47, 144A | 7/30 at 100.00 | 2,019,292 | |||||||||
| 5,775 | Riverside, California, Sewer Revenue Bonds, Refunding Series 2018A, 5.000%, 8/01/39 | 8/28 at 100.00 | 6,285,032 | |||||||||
| San Diego Public Facilities Financing Authority, California, Water Utility Revenue Bonds, Refunding Subordinate Lien Series 2016B: | ||||||||||||
| 2,670 | 5.000%, 8/01/32 | 8/26 at 100.00 | 2,831,818 | |||||||||
| 3,000 | 5.000%, 8/01/37 | 8/26 at 100.00 | 3,150,192 | |||||||||
| 2,400 | Southern California Public Power Authority, Natural Gas Project 1 Revenue Bonds, Series 2007A, 5.250%, 11/01/24 | No Opt. Call | 2,418,646 | |||||||||
| Total Utilities | 63,830,766 | |||||||||||
Total Municipal Bonds (cost $290,823,620) | 298,932,332 | |||||||||||
Total Long-Term Investments (cost $290,823,620) | 298,932,332 | |||||||||||
| NCA | Nuveen California Municipal Value Fund (continued) Portfolio of Investments February 29, 2024 |
Principal Amount (000) | Description (a) | Optional Call Provisions (b) | Value | |||||||||
SHORT-TERM INVESTMENTS - 3.2% (3.2% of Total Investments) | ||||||||||||
MUNICIPAL BONDS - 3.2% (3.2% of Total Investments) | ||||||||||||
Health Care - 1.9% (1.9% of Total Investments) | ||||||||||||
| $ | 6,000 | (e) | California Health Facilities Financing Authority, California, Revenue Bonds, Scripps Health, Weekly Mode Series 2024C-1, 2.350%, 11/15/63, (Mandatory Put 3/07/24) | 2/24 at 100.00 | $ | 6,000,000 | ||||||
| Total Health Care | 6,000,000 | |||||||||||
Utilities - 1.3% (1.3% of Total Investments) | ||||||||||||
| 4,000 | (e) | Eastern Municipal Water District, California, Water and Wastewater Revenue Bonds, Refunding Series 2018A, 3.250%, 7/01/46, (Mandatory Put 2/29/24) | 2/24 at 100.00 | 4,000,000 | ||||||||
| Total Utilities | 4,000,000 | |||||||||||
Total Municipal Bonds (cost $10,000,000) | 10,000,000 | |||||||||||
Total Short-Term Investments (cost $10,000,000) | 10,000,000 | |||||||||||
Total Investments (cost $300,823,620) - 99.3% | 308,932,332 | |||||||||||
Other Assets & Liabilities, Net - 0.7% | 2,223,777 | |||||||||||
Net Assets Applicable to Common Shares - 100% | $ | 311,156,109 | ||||||||||
| (a) | All percentages shown in the Portfolio of Investments are based on net assets applicable to common shares unless otherwise noted. |
| (b) | Optional Call Provisions: Dates (month and year) and prices of the earliest optional call or redemption. There may be other call provisions at varying prices at later dates. Certain mortgage-backed securities may be subject to periodic principal paydowns. Optional Call Provisions are not covered by the report of independent registered public accounting firm. |
| (c) | Step-up coupon bond, a bond with a coupon that increases (“steps up”), usually at regular intervals, while the bond is outstanding. The rate shown is the coupon as of the end of the reporting period. |
| (d) | Backed by an escrow or trust containing sufficient U.S. Government or U.S. Government agency securities, which ensure the timely payment of principal and interest. |
| (e) | Investment has a maturity of greater than one year, but has variable rate and/or demand features which qualify it as a short-term investment. The rate disclosed, as well as the reference rate and spread, where applicable, is that in effect as of the end of the reporting period. This rate changes periodically based on market conditions or a specified market index. |
| 144A | Investment is exempt from registration under Rule 144A of the Securities Act of 1933, as amended. These investments may only be resold in transactions exempt from registration, which are normally those transactions with qualified institutional buyers. |
| AMT | Alternative Minimum Tax |
| NXC | Nuveen California Select Tax-Free Income PortfolioPortfolio of Investments February 29, 2024 |
Principal Amount (000) | Description (a) | Optional Call Provisions (b) | Value | |||||||||||
LONG-TERM INVESTMENTS - 98.1% (98.9% of Total Investments) | ||||||||||||||
MUNICIPAL BONDS - 98.1% (98.9% of Total Investments) | ||||||||||||||
Consumer Staples - 0.2% (0.2% of Total Investments) | ||||||||||||||
| $ | 20 | California County Tobacco Securitization Agency, Tobacco Settlement Asset- Backed Bonds, Los Angeles County Securitization Corporation, Series 2020A, 4.000%, 6/01/49 | 6/30 at 100.00 | $ | 19,502 | |||||||||
| 1,265 | Golden State Tobacco Securitization Corporation, California, Tobacco Settlement Asset-Backed Bonds, Capital Appreciation Series 2021B-2, 0.000%, 6/01/66 | 12/31 at 27.75 | 143,998 | |||||||||||
| Total Consumer Staples | 163,500 | |||||||||||||
Education and Civic Organizations - 0.5% (0.5% of Total Investments) | ||||||||||||||
| 60 | California School Finance Authority, School Facility Revenue Bonds, Alliance for College-Ready Public Schools Project, Series 2016A, 5.000%, 7/01/46, 144A | 7/25 at 100.00 | 60,011 | |||||||||||
| 385 | California School Finance Authority, School Facility Revenue Bonds, Alliance for College-Ready Public Schools Project, Series 2016C, 5.000%, 7/01/46, 144A | 7/25 at 101.00 | 385,142 | |||||||||||
| Total Education and Civic Organizations | 445,153 | |||||||||||||
Health Care - 11.3% (11.4% of Total Investments) | ||||||||||||||
| 2,590 | California Health Facilities Financing Authority, California, Revenue Bonds, Sutter Health, Refunding Series 2016B: 5.000%, 11/15/46 | 11/26 at 100.00 | 2,650,435 | |||||||||||
| 1,000 | California Health Facilities Financing Authority, Revenue Bonds, Adventist Health System/West, Refunding Series 2016A, 4.000%, 3/01/39 | 3/26 at 100.00 | 1,002,222 | |||||||||||
| 1,240 | California Health Facilities Financing Authority, Revenue Bonds, City of Hope National Medical Center, Series 2019, 4.000%, 11/15/45 | 11/29 at 100.00 | 1,203,687 | |||||||||||
| 1,000 | California Health Facilities Financing Authority, Revenue Bonds, CommonSpirit Health, Series 2020A, 4.000%, 4/01/49 | 4/30 at 100.00 | 961,493 | |||||||||||
| 1,365 | California Health Facilities Financing Authority, Revenue Bonds, Kaiser Permanente System, Series 2017A-2, 4.000%, 11/01/44 California Health Facilities Financing Authority, Revenue Bonds, Providence Health & Services, Refunding Series 2014A: | 11/27 at 100.00 | 1,356,188 | |||||||||||
| 70 | 5.000%, 10/01/38 | 10/24 at 100.00 | 70,414 | |||||||||||
| 255 | California Health Facilities Financing Authority, Revenue Bonds, Providence Health & Services, Series 2014B, 5.000%, 10/01/44 | 10/24 at 100.00 | 256,016 | |||||||||||
| 450 | California Municipal Finance Authority, Revenue Bonds, Community Health System, Series 2021A, 4.000%, 2/01/51 - AGM Insured | 2/32 at 100.00 | 429,442 | |||||||||||
| 35 | California Municipal Finance Authority, Revenue Bonds, Eisenhower Medical Center, Refunding Series 2017A, 5.000%, 7/01/47 | 7/27 at 100.00 | 35,382 | |||||||||||
| 130 | California Municipal Finance Authority, Revenue Bonds, NorthBay Healthcare Group, Series 2017A, 5.250%, 11/01/41 | 11/26 at 100.00 | 130,707 | |||||||||||
| 150 | California Municipal Financing Authority, Certificates of Participation, Palomar 11/32 at 100.00 Health, Series 2022A, 5.250%, 11/01/52 - AGM Insured | 168,262 | ||||||||||||
| 350 | California Statewide Communities Development Authority, California, Revenue Bonds, Loma Linda University Medical Center, Series 2014A, 5.250%, 12/01/34 | 12/24 at 100.00 | 351,812 | |||||||||||
| 1,365 | California Statewide Communities Development Authority, California, Revenue Bonds, Loma Linda University Medical Center, Series 2016A, 5.250%, 12/01/56, 144A | 6/26 at 100.00 | 1,371,328 | |||||||||||
| 70 | California Statewide Community Development Authority, Health Revenue Bonds, Enloe Medical Center, Refunding Series 2022A, 5.250%, 8/15/52 - AGM Insured | 8/32 at 100.00 | 76,637 | |||||||||||
| Total Health Care | 10,064,025 | |||||||||||||
| NXC | Nuveen California Select Tax-Free Income Portfolio(continued) Portfolio of Investments February 29, 2024 |
Principal Amount (000) | Description (a) | Optional Call Provisions (b) | Value | |||||||||
Housing/Multifamily - 8.6% (8.7% of Total Investments) | ||||||||||||
| $ | 615 | California Community Housing Agency, California, Essential Housing Revenue Bonds, Creekwood, Series 2021A, 4.000%, 2/01/56, 144A | 8/31 at 100.00 | $ | 411,574 | |||||||
| 590 | California Community Housing Agency, California, Essential Housing Revenue Bonds, Glendale Properties, Junior Series 2021A-2, 4.000%, 8/01/47, 144A | 8/31 at 100.00 | 481,635 | |||||||||
| 800 | California Community Housing Agency, California, Essential Housing Revenue Bonds, Serenity at Larkspur Apartments, Series 2020A, 5.000%, 2/01/50, 144A | 2/30 at 100.00 | 610,600 | |||||||||
| 200 | California Community Housing Agency, California, Essential Housing Revenue Bonds, Stoneridge Apartments, Series 2021A, 4.000%, 2/01/56, 144A | 2/31 at 100.00 | 154,857 | |||||||||
| 606 | California Housing Finance Agency, Municipal Certificate Revenue Bonds, Class A Series 2019-2, 4.000%, 3/20/33 | No Opt. Call | 607,058 | |||||||||
| 516 | California Housing Finance Agency, Municipal Certificate Revenue Bonds, Class A Series 2021-1, 3.500%, 11/20/35 | No Opt. Call | 487,935 | |||||||||
| 88 | California Housing Finance Agency, Municipal Certificate Revenue Bonds, Class A Series2019-1, 4.250%, 1/15/35 | No Opt. Call | 88,219 | |||||||||
| 512 | California Housing Finance Agency, Municipal Certificate Revenue Bonds, Class A Social Certificates Series 2023-1, 4.375%, 9/20/36 California Municipal Finance Authority, Mobile Home Park Revenue Bonds, | No Opt. Call | 507,484 | |||||||||
| Caritas Affordable Housing Inc Projects, Senior Series 2014A: | ||||||||||||
| 25 | 5.250%, 8/15/39 | 8/24 at 100.00 | 25,140 | |||||||||
| 65 | 5.250%, 8/15/49 | 8/24 at 100.00 | 65,225 | |||||||||
| 660 | CMFA Special Finance Agency I, California, Essential Housing Revenue Bonds, The Mix at Center City, Series 2021A-2, 4.000%, 4/01/56, 144A | 4/31 at 100.00 | 479,166 | |||||||||
| 225 | CMFA Special Finance Agency, California, Essential Housing Revenue Bonds, Enclave Apartments, Senior Series 2022A-1, 4.000%, 8/01/58, 144A | 2/32 at 100.00 | 175,404 | |||||||||
| 320 | CSCDA Community Improvement Authority, California, Essential Housing Revenue Bonds, 777 Place-Pomona, Senior Lien Series 2021A-2, 3.250%, 5/01/57, 144A | 5/32 at 100.00 | 222,245 | |||||||||
| 425 | CSCDA Community Improvement Authority, California, Essential Housing Revenue Bonds, Acacia on Santa Rosa Creek, Senior Lien Series 2021A, 4.000%, 10/01/56, 144A | 10/31 at 100.00 | 364,900 | |||||||||
| 560 | CSCDA Community Improvement Authority, California, Essential Housing Revenue Bonds, Altana Glendale, Series 2021A-2, 4.000%, 10/01/56, 144A | 10/31 at 100.00 | 434,032 | |||||||||
| 650 | CSCDA Community Improvement Authority, California, Essential Housing Revenue Bonds, Center City Anaheim, Series 2020A, 5.000%, 1/01/54, 144A | 1/31 at 100.00 | 524,802 | |||||||||
| 540 | CSCDA Community Improvement Authority, California, Essential Housing Revenue Bonds, Moda at Monrovia Station, Social Series 2021A-2, 4.000%, 10/01/56, 144A | 10/31 at 100.00 | 397,172 | |||||||||
| 265 | CSCDA Community Improvement Authority, California, Essential Housing Revenue Bonds, Monterrey Station Apartments, Senior Lien Series 2021A-1, 3.125%, 7/01/56, 144A | 7/32 at 100.00 | 178,740 | |||||||||
| 115 | CSCDA Community Improvement Authority, California, Essential Housing Revenue Bonds, Oceanaire-Long Beach, Social Series 2021A-2, 4.000%, 9/01/56, 144A | 9/31 at 100.00 | 87,324 | |||||||||
| 250 | CSCDA Community Improvement Authority, California, Essential Housing Revenue Bonds, Parallel-Anaheim Series 2021A, 4.000%, 8/01/56, 144A | 8/31 at 100.00 | 208,683 | |||||||||
| 50 | CSCDA Community Improvement Authority, California, Essential Housing Revenue Bonds, Pasadena Portfolio Social Bond, Mezzanine Senior Series 2021B, 4.000%, 12/01/56, 144A | 12/31 at 100.00 | 36,924 | |||||||||
| 100 | CSCDA Community Improvement Authority, California, Essential Housing Revenue Bonds, Pasadena Portfolio Social Bond, Series 2021A-2, 3.000%, 12/01/56 | 12/31 at 100.00 | 70,175 | |||||||||
| 185 | CSCDA Community Improvement Authority, California, Essential Housing Revenue Bonds, Union South Bay, Series 2021A-2, 4.000%, 7/01/56, 144A | 7/31 at 100.00 | 141,673 | |||||||||
| 160 | CSCDA Community Improvement Authority, California, Essential Housing Revenue Bonds, Westgate Phase 1-Pasadena Apartments, Senior Lien Series2021A-1, 3.000%, 6/01/47, 144A | 6/31 at 100.00 | 117,192 | |||||||||
| 585 | CSCDA Community Improvement Authority, California, Essential Housing Revenue Bonds, Westgate Phase 1-Pasadena Apartments, Senior Lien Series2021A-2, 3.125%, 6/01/57, 144A | 6/31 at 100.00 | 370,785 | |||||||||
Principal Amount (000) | Description (a) | Optional Call Provisions (b) | Value | |||||||||
Housing/Multifamily | ||||||||||||
| $ 600 | CSCDA Community Improvement Authority, California, Essential Housing Revenue Bonds, Wood Creek Apartments, Senior Lien Series 2021A-1, 3.000%, 12/01/49 | 6/32 at 100.00 | $ | 409,914 | ||||||||
| Total Housing/Multifamily | 7,658,858 | |||||||||||
Tax Obligation/General - 25.3% (25.5% of Total Investments) | ||||||||||||
| 620 | Butte-Glenn Community College District, Butte and Glenn Counties, California, General Obligation Bonds, Election 2016 Series 2017A, 5.250%, 8/01/46 | 8/27 at 100.00 | 657,115 | |||||||||
| 1,000 | California State, General Obligation Bonds, Various Purpose Refunding Series 2015, 5.000%, 8/01/34 | 8/25 at 100.00 | 1,025,535 | |||||||||
| 1,000 | Chaffey Joint Union High School District, San Bernardino County, California, General Obligation Bonds, Election 2012 Series 2017C, 5.250%, 8/01/47 | 2/27 at 100.00 | 1,047,434 | |||||||||
| 4,205 | Desert Community College District, Riverside County, California, General Obligation Bonds, Election of 2016 Series 2024, 4.000%, 8/01/51 | 8/33 at 100.00 | 4,205,495 | |||||||||
| 1,000 | Marin Healthcare District, Marin County, California, General Obligation Bonds, 2013 Election, Series 2015A, 4.000%, 8/01/45 | 8/25 at 100.00 | 988,072 | |||||||||
| 2,790 | Natomas Unified School District, Sacramento County, California, General Obligation Bonds, Election of 2018, Series 2020A, 4.000%, 8/01/49 - AGM Insured | 8/26 at 100.00 | 2,763,369 | |||||||||
| 7,575 | Palomar Pomerado Health, California, General Obligation Bonds, Convertible Capital Appreciation, Election 2004 Series 2010A, 0.000%, 8/01/34 | No Opt. Call | 5,167,105 | |||||||||
| 65 | Puerto Rico, General Obligation Bonds, Restructured Series 2022A-1, 4.000%, 7/01/41 | 7/31 at 103.00 | 60,374 | |||||||||
| 1,000 | San Benito High School District, San Benito and Santa Clara Counties, California, General Obligation Bonds, 2016 Election Series 2017, 5.250%, 8/01/46 | 8/27 at 100.00 | 1,059,201 | |||||||||
| 8,075 | San Bernardino Community College District, California, General Obligation Bonds, Election of 2008 Series 2009B, 0.000%, 8/01/44 | No Opt. Call | 3,322,603 | |||||||||
| 2,000 | (c) | West Hills Community College District, California, General Obligation Bonds, School Facilities Improvement District 3, 2008 Election Series 2011, 0.000%, 8/01/38 - AGM Insured | 8/31 at 100.00 | 2,194,438 | ||||||||
| Total Tax Obligation/General | 22,490,741 | |||||||||||
Tax Obligation/Limited - 10.9% (11.0% of Total Investments) | ||||||||||||
| 1,000 | Bell Community Redevelopment Agency, California, Tax Allocation Bonds, Bell Project Area, Series 2003, 5.625%, 10/01/33 - RAAI Insured | 4/24 at 100.00 | 1,003,347 | |||||||||
| 20 | Brentwood Infrastructure Financing Authority, California, Infrastructure Revenue Bonds, Refunding Subordinated Series 2014B, 5.000%, 9/02/36 | 9/24 at 100.00 | 20,107 | |||||||||
| 15 | Golden State Tobacco Securitization Corporation, California, Tobacco Settlement Asset-Backed Revenue Bonds, Series 2022A-1, 5.000%, 6/01/51 | 12/31 at 100.00 | 15,745 | |||||||||
| 1,000 | Los Angeles County Metropolitan Transportation Authority, California, Measure R Sales Tax Revenue Bonds, Senior Series 2016A, 5.000%, 6/01/39 | 6/26 at 100.00 | 1,038,989 | |||||||||
| 3,000 | Los Angeles County Metropolitan Transportation Authority, California, Proposition C Sales Tax Revenue Bonds, Green Senior Lien Series 2019A, 5.000%, 7/01/44 | 7/28 at 100.00 | 3,222,239 | |||||||||
| 1,000 | Norco Redevelopment Agency, California, Tax Allocation Bonds, Project Area 1, Series 2009, 7.000%, 3/01/34 | 4/24 at 100.00 | 1,003,378 | |||||||||
| 1,118 | Puerto Rico Sales Tax Financing Corporation, Sales Tax Revenue Bonds, Restructured 2018A-1, 5.000%, 7/01/58 | 7/28 at 100.00 | 1,126,383 | |||||||||
| 550 | Puerto Rico Sales Tax Financing Corporation, Sales Tax Revenue Bonds, Taxable Restructured Cofina Project Series 2019A-2, 4.784%, 7/01/58 | 7/28 at 100.00 | 548,626 | |||||||||
| 180 | River Islands Public Financing Authority, California, Special Tax Bonds, Community Facilities District 2003-1 Improvement Area 1, Refunding Series2022A-1, 5.250%, 9/01/52 - AGM Insured | 9/29 at 103.00 | 196,439 | |||||||||
| 60 | San Francisco City and County Redevelopment Agency Successor Agency, California, Special Tax Bonds, Community Facilities District 7, Hunters Point Shipyard Phase One Improvements, Refunding Series 2014, 5.000%, 8/01/39 | 8/24 at 100.00 | 60,241 | |||||||||
| 20 | Signal Hill Redevelopment Agency, California, Project 1 Tax Allocation Bonds, Series 2011, 7.000%, 10/01/26 | 4/24 at 100.00 | 20,053 | |||||||||
| 1,285 | Stockton Public Financing Authority, California, Revenue Bonds, Arch Road East Community Facility District 99-02, Series 2018A, 5.000%, 9/01/28 | 9/25 at 103.00 | 1,352,882 | |||||||||
| NXC | Nuveen California Select Tax-Free Income Portfolio(continued) Portfolio of Investments February 29, 2024 |
Principal Amount (000) | Description (a) | Optional Call Provisions (b) | Value | |||||||||
Tax Obligation/Limited | ||||||||||||
| $ 60 | Transbay Joint Powers Authority, California, Tax Allocation Bonds, Senior Green Series 2020A, 5.000%, 10/01/45 | 4/30 at 100.00 | $ | 61,720 | ||||||||
| Total Tax Obligation/Limited | 9,670,149 | |||||||||||
Transportation - 12.9% (13.0% of Total Investments) | ||||||||||||
| 60 | California Municipal Finance Authority, Special Facility Revenue Bonds, United Airlines, Inc. Los Angeles International Airport Project, Series 2019, 4.000%, 7/15/29, (AMT) | No Opt. Call | 59,215 | |||||||||
| 800 | Long Beach, California, Harbor Revenue Bonds, Series 2015D, 5.000%, 5/15/42 | 5/25 at 100.00 | 813,297 | |||||||||
| 1,860 | Los Angeles Department of Airports, California, Revenue Bonds, Los Angeles International Airport, Refunding & Subordinate Series 2022C, 4.000%, 5/15/40, (AMT) | 5/32 at 100.00 | 1,855,778 | |||||||||
| 1,525 | Los Angeles Department of Airports, California, Revenue Bonds, Los Angeles International Airport, Subordinate Lien Series 2022A, 5.000%, 5/15/45, (AMT) | 5/32 at 100.00 | 1,622,316 | |||||||||
| 3,250 | Riverside County Transportation Commission, California, Toll Revenue Senior Lien Bonds, RCTC 91 Express Lanes, Refunding Series 2021B-1, 4.000%, 6/01/39 | 6/31 at 100.00 | 3,308,651 | |||||||||
| 305 | San Diego County Regional Airport Authority, California, Airport Revenue Bonds, International Senior Series 2023B, 5.000%, 7/01/53, (AMT) | 7/33 at 100.00 | 319,210 | |||||||||
| 1,000 | San Diego County Regional Airport Authority, California, Airport Revenue Bonds, Subordinate Series 2021B, 5.000%, 7/01/46, (AMT) | 7/31 at 100.00 | 1,048,666 | |||||||||
| 1,400 | San Francisco Airport Commission, California, Revenue Bonds, San Francisco International Airport, Refunding Second Series 2023C, 5.500%, 5/01/40, (AMT) | 5/33 at 100.00 | 1,595,480 | |||||||||
| 90 | San Joaquin Hills Transportation Corridor Agency, Orange County, California, Refunding Senior Lien Toll Road Revenue Bonds, Series 2021A, 4.000%, 1/15/50 | 1/32 at 100.00 | 89,325 | |||||||||
| 750 | San Joaquin Hills Transportation Corridor Agency, Orange County, California, Toll Road Revenue Bonds, Refunding Junior Lien Series 2014B, 5.250%, 1/15/44 | 1/25 at 100.00 | 758,821 | |||||||||
| Total Transportation | 11,470,759 | |||||||||||
U.S. Guaranteed - 6.9% (7.0% of Total Investments) (d) | ||||||||||||
| 410 | California Health Facilities Financing Authority, California, Revenue Bonds, Sutter Health, Refunding Series 2016B: 5.000%, 11/15/46, (Pre-refunded 11/15/26) | 11/26 at 100.00 | 434,371 | |||||||||
| 2,500 | California Health Facilities Financing Authority, California, Revenue Bonds, Sutter Health, Series 2016A, 5.000%, 11/15/41, (Pre-refunded 11/15/25) California Health Facilities Financing Authority, Revenue Bonds, Providence Health & Services, Refunding Series 2014A: | 11/25 at 100.00 | 2,592,912 | |||||||||
| 55 | 5.000%, 10/01/38, (Pre-refunded 10/01/24) | 10/24 at 100.00 | 55,611 | |||||||||
| Golden State Tobacco Securitization Corporation, California, Enhanced Tobacco Settlement Asset-Backed Revenue Bonds, Refunding Series 2015A: | ||||||||||||
| 1,350 | 5.000%, 6/01/40, (Pre-refunded 6/01/25) | 6/25 at 100.00 | 1,386,121 | |||||||||
| 1,650 | 5.000%, 6/01/40, (Pre-refunded 6/01/25) | 6/25 at 100.00 | 1,694,148 | |||||||||
| Total U.S. Guaranteed | 6,163,163 | |||||||||||
Utilities - 21.5% (21.6% of Total Investments) | ||||||||||||
| 840 | California Community Choice Financing Authority, Clean Energy Project Revenue Bonds, Green Series 2024A, 5.000%, 5/01/54, (Mandatory Put 4/01/32) | 1/32 at 100.21 | 902,165 | |||||||||
| California Pollution Control Financing Authority, Water Furnishing Revenue Bonds, Poseidon Resources Channelside LP Desalination Project, Series 2012: | ||||||||||||
| 375 | 5.000%, 7/01/37, (AMT), 144A | 7/24 at 100.00 | 375,359 | |||||||||
| 1,160 | 5.000%, 11/21/45, (AMT), 144A | 7/24 at 100.00 | 1,160,624 | |||||||||
| 2,000 | Irvine Ranch Water District, California, Certificates of Participation, Irvine Ranch Water District Series 2016, 5.000%, 3/01/41 | 9/26 at 100.00 | 2,085,260 | |||||||||
| 645 | Long Beach Bond Finance Authority, California, Natural Gas Purchase Revenue Bonds, Series 2007A, 5.500%, 11/15/37 | No Opt. Call | 739,836 | |||||||||
| 1,970 | Los Angeles Department of Water and Power, California, Power System Revenue Bonds, Series 2015E, 5.000%, 7/01/44 | 7/24 at 100.00 | 1,975,802 | |||||||||
Principal Amount (000) | Description (a) | Optional Call Provisions (b) | Value | |||||||||
Utilities | ||||||||||||
| $ | 2,000 | Los Angeles Department of Water and Power, California, Power System Revenue Bonds, Series 2020B, 5.000%, 7/01/40 Los Angeles Department of Water and Power, California, Waterworks Revenue Bonds, Series 2017A: | 7/30 at 100.00 | $ | 2,238,734 | |||||||
| 3,000 | 5.000%, 7/01/44 | 1/27 at 100.00 | 3,134,967 | |||||||||
| 2,900 | 4.000%, 7/01/47 | 1/27 at 100.00 | 2,878,154 | |||||||||
| 1,000 | Los Angeles Department of Water and Power, California, Waterworks Revenue Bonds, Series 2018B, 5.000%, 7/01/38 | 7/28 at 100.00 | 1,090,798 | |||||||||
| 250 | Puerto Rico Aqueduct and Sewerage Authority, Revenue Bonds, Refunding Senior Lien Series 2020A, 5.000%, 7/01/47, 144A | 7/30 at 100.00 | 252,411 | |||||||||
| 2,050 | Sacramento County Sanitation Districts Financing Authority, California, Revenue Bonds, Sacramento Regional County Sanitation District, Series 2020A, 5.000%, 12/01/50 | 12/30 at 100.00 | 2,257,211 | |||||||||
| Total Utilities | 19,091,321 | |||||||||||
Total Municipal Bonds (cost $84,888,880) | 87,217,669 | |||||||||||
Total Long-Term Investments (cost $84,888,880) | 87,217,669 | |||||||||||
Principal Amount (000) | Description (a) | Optional Call Provisions (b) | Value | |||||||||
SHORT-TERM INVESTMENTS - 1.1% (1.1% of Total Investments) | ||||||||||||
MUNICIPAL BONDS - 1.1% (1.1% of Total Investments) | ||||||||||||
Health Care - 1.1% (1.1% of Total Investments) | ||||||||||||
| $ | 1,000 | (e) | California Health Facilities Financing Authority, California, Revenue Bonds, Scripps Health, Weekly Mode Series 2024C-1, 2.350%, 11/15/63, (Mandatory Put 3/07/24) | 2/24 at 100.00 | $ | 1,000,000 | ||||||
| Total Health Care | 1,000,000 | |||||||||||
Total Municipal Bonds (cost $1,000,000) | 1,000,000 | |||||||||||
Total Short-Term Investments (cost $1,000,000) | 1,000,000 | |||||||||||
Total Investments (cost $85,888,880) - 99.2% | 88,217,669 | |||||||||||
Other Assets & Liabilities, Net - 0.8% | 751,185 | |||||||||||
Net Assets Applicable to Common Shares - 100% | $ | 88,968,854 | ||||||||||
| (a) | All percentages shown in the Portfolio of Investments are based on net assets applicable to common shares unless otherwise noted. |
| (b) | Optional Call Provisions: Dates (month and year) and prices of the earliest optional call or redemption. There may be other call provisions at varying prices at later dates. Certain mortgage-backed securities may be subject to periodic principal paydowns. Optional Call Provisions are not covered by the report of independent registered public accounting firm. |
| (c) | Step-up coupon bond, a bond with a coupon that increases (“steps up”), usually at regular intervals, while the bond is outstanding. The rate shown is the coupon as of the end of the reporting period. |
| (d) | Backed by an escrow or trust containing sufficient U.S. Government or U.S. Government agency securities, which ensure the timely payment of principal and interest. |
| (e) | Investment has a maturity of greater than one year, but has variable rate and/or demand features which qualify it as a short-term investment. The rate disclosed, as well as the reference rate and spread, where applicable, is that in effect as of the end of the reporting period. This rate changes periodically based on market conditions or a specified market index. |
| 144A | Investment is exempt from registration under Rule 144A of the Securities Act of 1933, as amended. These investments may only be resold in transactions exempt from registration, which are normally those transactions with qualified institutional buyers. |
| AMT | Alternative Minimum Tax |
February 29, 2024 | NAZ | NAC | NKX | NCA | NXC | |||||||||||||||
ASSETS | ||||||||||||||||||||
Long-term investments, at value † | $ | 232,719,392 | $ | 3,038,993,348 | $ | 1,032,645,123 | $ | 298,932,332 | $ | 87,217,669 | ||||||||||
Short-term investments, at value ¸ | - | 20,200,000 | 22,000,000 | 10,000,000 | 1,000,000 | |||||||||||||||
| Cash | 1,063,484 | - | 90,708 | 342,811 | 118,749 | |||||||||||||||
| Receivables: | ||||||||||||||||||||
| Interest | 2,100,349 | 31,832,077 | 10,656,632 | 2,992,403 | 812,813 | |||||||||||||||
| Investments sold | 1,007,146 | - | 25,000 | - | - | |||||||||||||||
| Deferred offering costs | - | - | - | - | 164,014 | |||||||||||||||
| Other | 2,092 | 1,155,214 | 342,274 | 58,878 | 30,849 | |||||||||||||||
Total assets | 236,892,463 | 3,092,180,639 | 1,065,759,737 | 312,326,424 | 89,344,094 | |||||||||||||||
LIABILITIES | ||||||||||||||||||||
| Cash overdraft | - | 2,239,772 | - | - | - | |||||||||||||||
| Floating rate obligations | - | 44,585,000 | 33,485,000 | - | - | |||||||||||||||
AMTP Shares, Net * | 88,258,681 | - | - | - | - | |||||||||||||||
MFP Shares, Net ** | - | 274,903,925 | 140,039,979 | - | - | |||||||||||||||
VRDP Shares, Net *** | - | 905,400,499 | 255,688,536 | - | - | |||||||||||||||
| Payables: | ||||||||||||||||||||
| Management fees | 112,396 | 1,376,693 | 489,615 | 119,905 | 18,274 | |||||||||||||||
| Dividends | 391,326 | 6,117,078 | 2,067,557 | 917,338 | 278,809 | |||||||||||||||
| Interest | 51 | 320,480 | 425,526 | 109 | 31 | |||||||||||||||
| Investments purchased - when-issued/delayed-delivery settlement | 1,130,000 | - | - | - | - | |||||||||||||||
| Accrued expenses: | ||||||||||||||||||||
| Custodian fees | 19,623 | 161,178 | 64,038 | 23,555 | 10,299 | |||||||||||||||
| Investor relations | 2,980 | 37,532 | 13,227 | 4,474 | 801 | |||||||||||||||
| Trustees fees | 4,996 | 813,162 | 210,893 | 62,241 | 33,073 | |||||||||||||||
| Professional fees | 35,074 | 46,845 | 36,578 | 35,448 | 30,386 | |||||||||||||||
| Shareholder reporting expenses | 2,804 | 22,444 | 9,212 | 6,137 | 3,111 | |||||||||||||||
| Shareholder servicing agent fees | 1,213 | 1,864 | 613 | 659 | 153 | |||||||||||||||
| Other | 5,624 | 3,488 | 8,816 | 449 | 303 | |||||||||||||||
Total liabilities | 89,964,768 | 1,236,029,960 | 432,539,590 | 1,170,315 | 375,240 | |||||||||||||||
Commitments and contingencies (1) | ||||||||||||||||||||
Net assets applicable to common shares | $ | 146,927,695 | $ | 1,856,150,679 | $ | 633,220,147 | $ | 311,156,109 | $ | 88,968,854 | ||||||||||
| Common shares outstanding | 11,590,366 | 144,722,059 | 47,520,333 | 33,108,196 | 6,362,276 | |||||||||||||||
| Net asset value (“NAV”) per common share outstanding | $ | 12.68 | $ | 12.83 | $ | 13.33 | $ | 9.40 | $ | 13.98 | ||||||||||
NET ASSETS APPLICABLE TO COMMON SHARES CONSIST OF: | ||||||||||||||||||||
| Common shares, $0.01 par value per share | $ | 115,904 | $ | 1,447,221 | $ | 475,203 | $ | 331,082 | $ | 63,623 | ||||||||||
Paid-in capital | 156,425,033 | 1,962,294,517 | 635,736,094 | 312,875,798 | 88,550,088 | |||||||||||||||
| Total distributable earnings (loss) | (9,613,242 | ) | (107,591,059 | ) | (2,991,150 | ) | (2,050,771 | ) | 355,143 | |||||||||||
| Net assets applicable to common shares | $ | 146,927,695 | $ | 1,856,150,679 | $ | 633,220,147 | $ | 311,156,109 | $ | 88,968,854 | ||||||||||
| Authorized shares: | ||||||||||||||||||||
| Common | Unlimited | Unlimited | Unlimited | Unlimited | Unlimited | |||||||||||||||
| Preferred | Unlimited | Unlimited | Unlimited | – | – | |||||||||||||||
† | $ | 234,469,877 | $ | 2,990,272,606 | $ | 1,002,677,463 | $ | 290,823,620 | $ | 84,888,880 | ||||||||||
¸ | $ | – | $ | 20,200,000 | $ | 22,000,000 | $ | 10,000,000 | $ | 1,000,000 | ||||||||||
* AMTP Shares, liquidation preference | 88,300,000 | – | – | – | – | |||||||||||||||
** MFP Shares, liquidation preference | – | 275,000,000 | 140,400,000 | – | – | |||||||||||||||
*** VRDP Shares, liquidation preference | – | 907,800,000 | 256,700,000 | – | – | |||||||||||||||
(1) As disclosed in Notes to Financial Statements. | ||||||||||||||||||||
Year Ended February 29, 2024 | NAZ | NAC | NKX | NCA | NXC | |||||||||||||||
INVESTMENT INCOME | ||||||||||||||||||||
| Interest | $ | 9,489,571 | $ | 135,365,263 | $ | 46,541,076 | $ | 13,178,868 | $ | 3,695,673 | ||||||||||
| Total investment income | 9,489,571 | 135,365,263 | 46,541,076 | 13,178,868 | 3,695,673 | |||||||||||||||
EXPENSES | ||||||||||||||||||||
| Management fees | 1,420,644 | 17,008,998 | 6,065,972 | 1,484,881 | 226,924 | |||||||||||||||
| Shareholder servicing agent fees | 14,626 | 24,341 | 6,994 | 8,559 | 1,963 | |||||||||||||||
| Interest expense and amortization of offering costs | 3,915,093 | 50,375,275 | 15,661,228 | 4,999 | 1,796 | |||||||||||||||
| Trustees fees | 8,587 | 112,533 | 37,546 | 11,318 | 3,242 | |||||||||||||||
| Custodian expenses, net | 12,336 | 32,604 | 45,797 | 8,680 | 5,446 | |||||||||||||||
| Investor relations expenses | 11,775 | 136,992 | 46,265 | 14,718 | 4,142 | |||||||||||||||
| Liquidity fees | – | 3,856,036 | 2,002,535 | – | – | |||||||||||||||
| Professional fees | 52,545 | 323,828 | 83,688 | 57,714 | 41,510 | |||||||||||||||
| Remarketing fees | – | 506,198 | 667,493 | – | – | |||||||||||||||
| Shareholder reporting expenses | 15,138 | 62,273 | 32,000 | 23,526 | 12,229 | |||||||||||||||
| Stock exchange listing fees | 7,402 | 43,930 | 14,422 | 7,212 | 7,403 | |||||||||||||||
| Other | 37,006 | 160,661 | 106,343 | 11,207 | 13,066 | |||||||||||||||
| Total expenses | 5,495,152 | 72,643,669 | 24,770,283 | 1,632,814 | 317,721 | |||||||||||||||
Net investment income (loss) | 3,994,419 | 62,721,594 | 21,770,793 | 11,546,054 | 3,377,952 | |||||||||||||||
REALIZED AND UNREALIZED GAIN (LOSS) | ||||||||||||||||||||
| Realized gain (loss) from: | ||||||||||||||||||||
| Investments | (2,511,548 | ) | (16,440,501 | ) | (4,411,470 | ) | (1,746,380 | ) | (415,351 | ) | ||||||||||
| Net realized gain (loss) | (2,511,548 | ) | (16,440,501 | ) | (4,411,470 | ) | (1,746,380 | ) | (415,351 | ) | ||||||||||
| Change in unrealized appreciation (depreciation) on: | ||||||||||||||||||||
| Investments | 7,054,001 | 65,112,604 | 23,058,438 | 7,735,274 | 2,135,308 | |||||||||||||||
| Net change in unrealized appreciation (depreciation) | 7,054,001 | 65,112,604 | 23,058,438 | 7,735,274 | 2,135,308 | |||||||||||||||
| Net realized and unrealized gain (loss) | 4,542,453 | 48,672,103 | 18,646,968 | 5,988,894 | 1,719,957 | |||||||||||||||
Net increase (decrease) in net assets applicable to common shares from operations | $ | 8,536,872 | $ | 111,393,697 | $ | 40,417,761 | $ | 17,534,948 | $ | 5,097,909 | ||||||||||
NAZ | NAC | |||||||||||||||||||
Year Ended 2/29/24 | Year Ended 2/28/23 | Year Ended 2/29/24 | Year Ended 2/28/23 | |||||||||||||||||
OPERATIONS | ||||||||||||||||||||
| Net investment income (loss) | $ | 3,994,419 | $ | 5,425,472 | $ | 62,721,594 | $ | 79,191,067 | ||||||||||||
| Net realized gain (loss) | (2,511,548 | ) | (3,063,982 | ) | (16,440,501 | ) | (112,184,494 | ) | ||||||||||||
| Net change in unrealized appreciation (depreciation) | 7,054,001 | (21,339,972 | ) | 65,112,604 | (253,974,571 | ) | ||||||||||||||
| Net increase (decrease) in net assets applicable to common shares from operations | 8,536,872 | (18,978,482 | ) | 111,393,697 | (286,967,998 | ) | ||||||||||||||
DISTRIBUTIONS TO COMMON SHAREHOLDERS | ||||||||||||||||||||
| Dividends | (4,405,935 | ) | (6,080,179 | ) | (64,709,406 | ) | (82,354,248 | ) | ||||||||||||
| Return of Capital | (161,896 | ) | - | (2,155,459 | ) | - | ||||||||||||||
| Total distributions | (4,567,831 | ) | (6,080,179 | ) | (66,864,865 | ) | (82,354,248 | ) | ||||||||||||
CAPITAL SHARE TRANSACTIONS | ||||||||||||||||||||
| Reinvestments of distributions | – | 99,790 | – | – | ||||||||||||||||
| Cost of shares repurchased and retired | (54,777 | ) | - | (129,790 | ) | - | ||||||||||||||
| Net increase (decrease) applicable to common shares from capital share transactions | (54,777 | ) | 99,790 | (129,790 | ) | – | ||||||||||||||
| Net increase (decrease) in net assets applicable to common shares | 3,914,264 | (24,958,871 | ) | 44,399,042 | (369,322,246 | ) | ||||||||||||||
| Net assets applicable to common shares at the beginning of the period | 143,013,431 | 167,972,302 | 1,811,751,637 | 2,181,073,883 | ||||||||||||||||
Net assets applicable to common shares at the end of the period | $ | 146,927,695 | $ | 143,013,431 | $ | 1,856,150,679 | $ | 1,811,751,637 | ||||||||||||
NKX | NCA | |||||||||||||||||||
Year Ended 2/29/24 | Year Ended 2/28/23 | Year Ended 2/29/24 | Year Ended 2/28/23 | |||||||||||||||||
OPERATIONS | ||||||||||||||||||||
| Net investment income (loss) | $ | 21,770,793 | $ | 26,790,986 | $ | 11,546,054 | $ | 10,979,386 | ||||||||||||
| Net realized gain (loss) | (4,411,470 | ) | (25,699,597 | ) | (1,746,380 | ) | (7,463,877 | ) | ||||||||||||
| Net change in unrealized appreciation (depreciation) | 23,058,438 | (98,059,693 | ) | 7,735,274 | (29,648,083 | ) | ||||||||||||||
| Net increase (decrease) in net assets applicable to common shares from operations | 40,417,761 | (96,968,304 | ) | 17,534,948 | (26,132,574 | ) | ||||||||||||||
DISTRIBUTIONS TO COMMON SHAREHOLDERS | ||||||||||||||||||||
| Dividends | (24,425,453 | ) | (28,797,322 | ) | (11,521,653 | ) | (10,528,407 | ) | ||||||||||||
| Total distributions | (24,425,453 | ) | (28,797,322 | ) | (11,521,653 | ) | (10,528,407 | ) | ||||||||||||
CAPITAL SHARE TRANSACTIONS | ||||||||||||||||||||
| Net increase (decrease) in net assets applicable to common shares | 15,992,308 | (125,765,626 | ) | 6,013,295 | (36,660,981 | ) | ||||||||||||||
| Net assets applicable to common shares at the beginning of the period | 617,227,839 | 742,993,465 | 305,142,814 | 341,803,795 | ||||||||||||||||
Net assets applicable to common shares at the end of the period | $ | 633,220,147 | $ | 617,227,839 | $ | 311,156,109 | $ | 305,142,814 | ||||||||||||
Statement of Changes in Net Assets (continued) | ||
NXC | ||||||||||
Year Ended 2/29/24 | Year Ended 2/28/23 | |||||||||
OPERATIONS | ||||||||||
| Net investment income (loss) | $ | 3,377,952 | $ | 3,228,096 | ||||||
| Net realized gain (loss) | (415,351 | ) | (1,704,954 | ) | ||||||
| Net change in unrealized appreciation (depreciation) | 2,135,308 | (7,514,728 | ) | |||||||
| Net increase (decrease) in net assets applicable to common shares from operations | 5,097,909 | (5,991,586 | ) | |||||||
DISTRIBUTIONS TO COMMON SHAREHOLDERS | ||||||||||
| Dividends | (3,359,282 | ) | (3,149,970 | ) | ||||||
| Total distributions | (3,359,282 | ) | (3,149,970 | ) | ||||||
CAPITAL SHARE TRANSACTIONS | ||||||||||
| Reinvestments of distributions | 6,412 | 12,887 | ||||||||
| Net increase (decrease) applicable to common shares from capital share transactions | 6,412 | 12,887 | ||||||||
| Net increase (decrease) in net assets applicable to common shares | 1,745,039 | (9,128,669 | ) | |||||||
| Net assets applicable to common shares at the beginning of the period | 87,223,815 | 96,352,484 | ||||||||
Net assets applicable to common shares at the end of the period | $ | 88,968,854 | $ | 87,223,815 | ||||||
Year Ended February 29, 2024 | NAZ | NAC | NKX | |||||||||
CASH FLOWS FROM OPERATING ACTIVITIES | ||||||||||||
Net Increase (Decrease) in Net Assets Applicable to Common Shares from Operations | $ | 8,536,872 | $ | 111,393,697 | $ | 40,417,761 | ||||||
| Adjustments to reconcile the net increase (decrease) in net assets applicable to common shares from operations to net cash provided by (used in) operating activities: | ||||||||||||
| Purchases of investments | (26,568,946 | ) | (745,531,666 | ) | (265,074,109 | ) | ||||||
| Proceeds from sale and maturities of investments | 33,230,136 | 767,700,945 | 288,940,311 | |||||||||
| Proceeds from (Purchase of) short-term investments, net | – | (20,200,000 | ) | (22,000,000 | ) | |||||||
| Taxes paid | (291 | ) | (16,876 | ) | (750 | ) | ||||||
| Amortization (Accretion) of premiums and discounts, net | 1,498,802 | 634,955 | (2,285,924 | ) | ||||||||
| Amortization of deferred offering costs | 8,715 | 184,320 | 71,846 | |||||||||
| (Increase) Decrease in: | ||||||||||||
| Receivable for interest | 49,229 | 1,531,692 | 1,187,948 | |||||||||
| Receivable for investments sold | 869,151 | 20,000 | 4,121,200 | |||||||||
| Other assets | 9,232 | (57,443 | ) | 65,451 | ||||||||
| Increase (Decrease) in: | ||||||||||||
| Payable for interest | (61,708 | ) | 317,689 | (136,206 | ) | |||||||
| Payable for investments purchased - when-issued/delayed-delivery settlement | 1,130,000 | – | – | |||||||||
| Payable for management fees | 691 | 54,566 | 15,715 | |||||||||
| Accrued custodian fees | (5,332 | ) | (87,033 | ) | (25,089 | ) | ||||||
| Accrued investor relations fees | (1,138 | ) | (13,785 | ) | (4,355 | ) | ||||||
| Accrued Trustees fees | 1,884 | 88,169 | 23,750 | |||||||||
| Accrued professional fees | 3,120 | (1,105 | ) | 2,137 | ||||||||
| Accrued shareholder reporting expenses | (3,244 | ) | (22,291 | ) | (8,297 | ) | ||||||
| Accrued shareholder servicing agent fees | (1,220 | ) | (2,336 | ) | (593 | ) | ||||||
| Accrued other expenses | 468 | (40,524 | ) | (15,342 | ) | |||||||
| Net realized (gain) loss from investments | 2,511,548 | 16,440,501 | 4,411,470 | |||||||||
| Net realized (gain) loss from paydowns | – | 23,604 | 26,408 | |||||||||
| Net change in unrealized (appreciation) depreciation of investments | (7,054,001 | ) | (65,112,604 | ) | (23,058,438 | ) | ||||||
| Net cash provided by (used in) operating activities | 14,153,968 | 67,304,475 | 26,674,894 | |||||||||
CASH FLOWS FROM FINANCING ACTIVITIES | ||||||||||||
| Proceeds from borrowings | 2,174,054 | 117,956,564 | 4,921,762 | |||||||||
| (Repayments) of borrowings | (2,174,054 | ) | (117,956,564 | ) | (4,921,762 | ) | ||||||
| Proceeds from floating rate obligations | – | 44,585,000 | – | |||||||||
| (Repayments of) floating rate obligations | (7,000,000 | ) | – | – | ||||||||
| (Repayments for) MFP Shares redeemed, at liquidation preference | – | (45,000,000 | ) | – | ||||||||
| Increase (Decrease) in: | ||||||||||||
| Cash overdraft | (1,495,653 | ) | (961,658 | ) | (2,348,642 | ) | ||||||
| Cash distributions paid to common shareholders | (4,540,054 | ) | (65,798,027 | ) | (24,235,544 | ) | ||||||
| Cost of common shares repurchased and retired | (54,777 | ) | (129,790 | ) | – | |||||||
| Net cash provided by (used in) financing activities | (13,090,484 | ) | (67,304,475 | ) | (26,584,186 | ) | ||||||
Net increase (decrease) in Cash | 1,063,484 | – | 90,708 | |||||||||
| Cash at the beginning of period | – | – | – | |||||||||
| Cash at the end of period | $ | 1,063,484 | $ | – | $ | 90,708 | ||||||
SUPPLEMENTAL DISCLOSURE OF CASH FLOW INFORMATION | NAZ | NAC | NKX | |||||||||
| Cash paid for interest | $ | 3,960,465 | $ | 49,780,609 | $ | 15,703,347 | ||||||
Less Distributions to | ||||||||||||||||||||||||||||||||||||||||||||
Investment Operations | Common Shareholders | Common Share | ||||||||||||||||||||||||||||||||||||||||||
Common | ||||||||||||||||||||||||||||||||||||||||||||
Share | Discount | |||||||||||||||||||||||||||||||||||||||||||
Net Asset | Net | Net | Per | Net Asset | Share | |||||||||||||||||||||||||||||||||||||||
Value, | Investment | Realized/ | From Net | Share | Value, | Price, | ||||||||||||||||||||||||||||||||||||||
Beginning | Income (NII) | Unrealized | From | Realized | Return of | Repurchased | End of | End of | ||||||||||||||||||||||||||||||||||||
of Period | (Loss)(a) | Gain (Loss) | Total | NII | Gains | Capital | Total | and Retired | Period | Period | ||||||||||||||||||||||||||||||||||
NAZ | ||||||||||||||||||||||||||||||||||||||||||||
| 2/29/24 | $12.33 | $0.34 | $0.40 | $0.74 | $(0.38) | $– | $(0.01) | $(0.39) | $–(d) | $12.68 | $10.83 | |||||||||||||||||||||||||||||||||
| 2/28/23 | 14.50 | 0.47 | (2.12) | (1.65) | (0.52) | – | – | (0.52) | – | 12.33 | 11.30 | |||||||||||||||||||||||||||||||||
| 2/28/22 | 15.07 | 0.61 | (0.58) | 0.03 | (0.60) | – | – | (0.60) | – | 14.50 | 13.78 | |||||||||||||||||||||||||||||||||
| 2/28/21 | 15.56 | 0.61 | (0.53) | 0.08 | (0.57) | – | – | (0.57) | – | 15.07 | 15.17 | |||||||||||||||||||||||||||||||||
| 2/29/20 | 14.18 | 0.56 | 1.34 | 1.90 | (0.52) | – | – | (0.52) | – | 15.56 | 13.89 | |||||||||||||||||||||||||||||||||
NAC | ||||||||||||||||||||||||||||||||||||||||||||
| 2/29/24 | 12.52 | 0.43 | 0.34 | 0.77 | (0.45) | – | (0.01) | (0.46) | –(d) | 12.83 | 10.97 | |||||||||||||||||||||||||||||||||
| 2/28/23 | 15.07 | 0.55 | (2.53) | (1.98) | (0.57) | – | – | (0.57) | – | 12.52 | 10.87 | |||||||||||||||||||||||||||||||||
| 2/28/22 | 15.91 | 0.66 | (0.85) | (0.19) | (0.65) | – | – | (0.65) | – | 15.07 | 13.71 | |||||||||||||||||||||||||||||||||
| 2/28/21 | 16.71 | 0.64 | (0.80) | (0.16) | (0.64) | – | – | (0.64) | – | 15.91 | 14.57 | |||||||||||||||||||||||||||||||||
| 2/29/20 | 14.95 | 0.65 | 1.76 | 2.41 | (0.65) | – | – | (0.65) | – | 16.71 | 15.09 | |||||||||||||||||||||||||||||||||
NKX | ||||||||||||||||||||||||||||||||||||||||||||
| 2/29/24 | 12.99 | 0.46 | 0.39 | 0.85 | (0.51) | – | – | (0.51) | – | 13.33 | 11.48 | |||||||||||||||||||||||||||||||||
| 2/28/23 | 15.64 | 0.56 | (2.60) | (2.04) | (0.61) | – | – | (0.61) | – | 12.99 | 11.72 | |||||||||||||||||||||||||||||||||
| 2/28/22 | 16.48 | 0.68 | (0.85) | (0.17) | (0.67) | – | – | (0.67) | – | 15.64 | 14.15 | |||||||||||||||||||||||||||||||||
| 2/28/21 | 17.27 | 0.66 | (0.80) | (0.14) | (0.65) | – | – | (0.65) | – | 16.48 | 15.13 | |||||||||||||||||||||||||||||||||
| 2/29/20 | 15.17 | 0.63 | 2.09 | 2.72 | (0.62) | – | – | (0.62) | – | 17.27 | 15.53 | |||||||||||||||||||||||||||||||||
| (a) | Based on average shares outstanding. |
| (b) | Total Return Based on Common Share NAV is the combination of changes in common share NAV, reinvested dividend income at Common Share NAV and reinvested capital gains distributions at NAV, if any. The last dividend declared in the period, which is typically paid on the first business day of the following month, is assumed to be reinvested at the ending NAV. The actual reinvest price for the last dividend declared in the period may often be based on the Fund’s market price (and not its NAV), and therefore may be different from the price used in the calculation. Total returns are not annualized. |
| Total Return Based on Common Share Price is the combination of changes in the market price per share and the effect of reinvested dividend income and reinvested capital gains distributions, if any, at the average price paid per share at the time of reinvestment. The last dividend declared in the period, which is typically paid on the first business day of the following month, is assumed to be reinvested at the ending market price. The actual reinvestment for the last dividend declared in the period may take place over several days, and in some instances may not be based on the market price, so the actual reinvestment price may be different from the price used in the calculation. Total returns are not annualized. |
Common Share Supplemental Data/ Ratios Applicable to Common Shares | ||||||||||||||||||||||
Common Share Total Returns | Ratios to Average Net Assets | |||||||||||||||||||||
Based | Based | Net | Net | |||||||||||||||||||
on | on | Assets, | Investment | Portfolio | ||||||||||||||||||
Net Asset | Share | End of | Income | Turnover | ||||||||||||||||||
Value(b) | Price(b) | Period (000) | Expenses(c) | (Loss)(c) | Rate | |||||||||||||||||
| 6.17% | (0.56)% | $146,928 | 3.85% | 2.80% | 11% | |||||||||||||||||
| (11.40) | (14.48) | 143,013 | 2.68 | 3.65 | 25 | |||||||||||||||||
| 0.09 | (5.49) | 167,972 | 1.52 | 3.98 | 7 | |||||||||||||||||
| 0.62 | 13.67 | 174,401 | 1.75 | 4.06 | 13 | |||||||||||||||||
| 13.60 | 15.89 | 180,024 | 2.32 | 3.76 | 6 | |||||||||||||||||
| 6.34 | 5.39 | 1,856,151 | 4.03 | 3.48 | 25 | |||||||||||||||||
| (13.20) | (16.78) | 1,811,752 | 2.72 | 4.19 | 69 | |||||||||||||||||
| (1.33) | (1.81) | 2,181,074 | 1.46 | 4.14 | 12 | |||||||||||||||||
| (0.90) | 0.88 | 2,302,711 | 1.67 | 4.00 | 17 | |||||||||||||||||
| 16.37 | 18.54 | 2,418,423 | 2.26 | 4.11 | 11 | |||||||||||||||||
| 6.77 | 2.54 | 633,220 | 4.02 | 3.57 | 26 | |||||||||||||||||
| (13.14) | (13.15) | 617,228 | 2.82 | 4.15 | 58 | |||||||||||||||||
| (1.19) | (2.44) | 742,993 | 1.51 | 4.10 | 9 | |||||||||||||||||
| (0.77) | 1.67 | 783,202 | 1.72 | 4.03 | 8 | |||||||||||||||||
| 18.23 | 19.88 | 820,662 | 2.27 | 3.91 | 11 | |||||||||||||||||
| (c) | • Net Investment Income (Loss) ratios reflect income earned and expenses incurred on assets attributable to preferred shares issued by the Fund, where applicable. |
| • The expense ratios reflect, among other things, all interest expenses and other costs related to preferred shares (as described in Notes to Financial Statements) and/or the interest expense deemed to have been paid by the Fund on the floating rate certificates issued by the special purpose trusts for the self-deposited inverse floaters held by the Fund (as described in Notes to Financial Statements), where applicable, as follows: |
Ratios of Interest | ||||||
Expense | ||||||
to Average Net | ||||||
Assets Applicable | ||||||
to Common Shares | ||||||
NAZ | ||||||
| 2/29/24 | 2.74% | |||||
| 2/28/23 | 1.57 | |||||
| 2/28/22 | 0.48 | |||||
| 2/28/21 | 0.68 | |||||
| 2/29/20 | 1.25 | |||||
NAC | ||||||
| 2/29/24 | 3.04 | |||||
| 2/28/23 | 1.73 | |||||
| 2/28/22 | 0.55 | |||||
| 2/28/21 | 0.74 | |||||
| 2/29/20 | 1.33 | |||||
NKX | ||||||
| 2/29/24 | 2.99 | |||||
| 2/28/23 | 1.76 | |||||
| 2/28/22 | 0.49 | |||||
| 2/28/21 | 0.74 | |||||
| 2/29/20 | 1.28 |
| (d) | Value rounded to zero. |
Less Distributions to | ||||||||||||||||||||||||||||||||||||||||
Investment Operations | Common Shareholders | Common Share | ||||||||||||||||||||||||||||||||||||||
Common | ||||||||||||||||||||||||||||||||||||||||
Share | ||||||||||||||||||||||||||||||||||||||||
Net Asset | Net | Net | Net Asset | Share | ||||||||||||||||||||||||||||||||||||
Value, | Investment | Realized/ | From Net | Shelf | Value, | Price, | ||||||||||||||||||||||||||||||||||
Beginning | Income (NII) | Unrealized | From | Realized | Offering | End of | End of | |||||||||||||||||||||||||||||||||
of Period | (Loss)(a) | Gain (Loss) | Total | NII | Gains | Total | Costs | Period | Period | |||||||||||||||||||||||||||||||
NCA | ||||||||||||||||||||||||||||||||||||||||
| 2/29/24 | $9.22 | $0.35 | $0.18 | $0.53 | $(0.35) | $– | $(0.35) | $– | $9.40 | $8.77 | ||||||||||||||||||||||||||||||
| 2/28/23 | 10.32 | 0.33 | (1.11) | (0.78) | (0.32) | – | (0.32) | – | 9.22 | 8.72 | ||||||||||||||||||||||||||||||
| 2/28/22 | 10.66 | 0.31 | (0.35) | (0.04) | (0.30) | – | (0.30) | – | 10.32 | 9.53 | ||||||||||||||||||||||||||||||
| 2/28/21 | 11.05 | 0.32 | (0.39) | (0.07) | (0.32) | – | (0.32) | – | 10.66 | 10.21 | ||||||||||||||||||||||||||||||
| 2/29/20 | 10.13 | 0.34 | 0.92 | 1.26 | (0.34) | – | (0.34) | – | 11.05 | 10.45 | ||||||||||||||||||||||||||||||
NXC | ||||||||||||||||||||||||||||||||||||||||
| 2/29/24 | 13.71 | 0.53 | 0.27 | 0.80 | (0.53) | – | (0.53) | – | 13.98 | 13.11 | ||||||||||||||||||||||||||||||
| 2/28/23 | 15.15 | 0.51 | (1.46) | (0.95) | (0.49) | –(d) | (0.49) | – | 13.71 | 13.89 | ||||||||||||||||||||||||||||||
| 2/28/22(e) | 15.83 | 0.45 | (0.65) | (0.20) | (0.44) | (0.04) | (0.48) | – | 15.15 | 14.81 | ||||||||||||||||||||||||||||||
| 3/31/21 | 15.43 | 0.51 | 0.41 | 0.92 | (0.52) | – | (0.52) | – | 15.83 | 16.29 | ||||||||||||||||||||||||||||||
| 3/31/20 | 15.21 | 0.53 | 0.21 | 0.74 | (0.52) | – | (0.52) | – | 15.43 | 14.50 | ||||||||||||||||||||||||||||||
| 3/31/19 | 15.02 | 0.50 | 0.19 | 0.69 | (0.52) | – | (0.52) | 0.02 | 15.21 | 14.12 | ||||||||||||||||||||||||||||||
| (a) | Based on average shares outstanding. |
| (b) | Total Return Based on Common Share NAV is the combination of changes in common share NAV, reinvested dividend income at Common Share NAV and reinvested capital gains distributions at NAV, if any. The last dividend declared in the period, which is typically paid on the first business day of the following month, is assumed to be reinvested at the ending NAV. The actual reinvest price for the last dividend declared in the period may often be based on the Fund’s market price (and not its NAV), and therefore may be different from the price used in the calculation. Total returns are not annualized. |
| Total Return Based on Common Share Price is the combination of changes in the market price per share and the effect of reinvested dividend income and reinvested capital gains distributions, if any, at the average price paid per share at the time of reinvestment. The last dividend declared in the period, which is typically paid on the first business day of the following month, is assumed to be reinvested at the ending market price. The actual reinvestment for the last dividend declared in the period may take place over several days, and in some instances may not be based on the market price, so the actual reinvestment price may be different from the price used in the calculation. Total returns are not annualized. |
Common Share Supplemental Data/ Ratios Applicable to Common Shares | ||||||||||||||||||||||
Common Share Total Returns | Ratios to Average Net Assets | |||||||||||||||||||||
Based | Based | Net | Net | |||||||||||||||||||
on | on | Assets, | Investment | Portfolio | ||||||||||||||||||
Net Asset | Share | End of | Income | Turnover | ||||||||||||||||||
Value(b) | Price(b) | Period (000) | Expenses(c) | (Loss)(c) | Rate | |||||||||||||||||
| 5.87% | 4.70% | $311,156 | 0.54% | 3.79% | 20% | |||||||||||||||||
| (7.58) | (5.13) | 305,143 | 0.53 | 3.52 | 58 | |||||||||||||||||
| (0.43) | (3.89) | 341,804 | 0.56 | 2.85 | 6 | |||||||||||||||||
| (0.62) | 0.73 | 299,625 | 0.60 | 2.94 | 9 | |||||||||||||||||
| 12.63 | 14.67 | 310,278 | 0.52 | 3.22 | 8 | |||||||||||||||||
| 5.96 | (1.69) | 88,969 | 0.36 | 3.87 | 17 | |||||||||||||||||
| (6.23) | (2.77) | 87,224 | 0.36 | 3.63 | 43 | |||||||||||||||||
| (1.34) | (6.27) | 96,352 | 0.35 (f) | 3.14 (f) | 9 | |||||||||||||||||
| (6.05) | 16.13 | 100,600 | 0.35 | 3.26 | 5 | |||||||||||||||||
| 4.86 | 6.26 | 98,013 | 0.36 | 3.41 | 10 | |||||||||||||||||
| 4.82 | 5.44 | 96,573 | 0.55 | 3.38 | 23 | |||||||||||||||||
| (c) | • Net Investment Income (Loss) ratios reflect income earned and expenses incurred on assets attributable to preferred shares issued by the Fund, where applicable. |
| • The expense ratios reflect, among other things, all interest expenses and other costs related to preferred shares (as described in Notes to Financial Statements) and/or the interest expense deemed to have been paid by the Fund on the floating rate certificates issued by the special purpose trusts for the self-deposited inverse floaters held by the Fund (as described in Notes to Financial Statements), where applicable, as follows: |
Ratios of Interest | ||||||
Expense | ||||||
to Average Net | ||||||
Assets Applicable | ||||||
to Common Shares | ||||||
NCA | ||||||
| 2/29/24 | –% | |||||
| 2/28/23 | – | |||||
| 2/28/22 | – | |||||
| 2/28/21 | – | |||||
| 2/29/20 | – | |||||
NXC | ||||||
| 2/29/24 | – | |||||
| 2/28/23 | – | |||||
| 2/28/22 | – | |||||
| 3/31/21 | – | |||||
| 3/31/20 | – | |||||
| 3/31/19 | – |
| (d) | Value rounded to zero. |
| (e) | For the eleven months ended February 28, 2022 |
| (f) | Annualized. |
AMTP Shares | MFP Shares | VRDP Shares | ||||||||||||||||||||||||||
Asset | Asset | Asset | Asset | |||||||||||||||||||||||||
Aggregate | Coverage | Aggregate | Coverage | Aggregate | Coverage | Coverage | ||||||||||||||||||||||
Amount | Per | Amount | Per | Amount | Per | Per $1 | ||||||||||||||||||||||
Outstanding | $100,000 | Outstanding | $100,000 | Outstanding | $100,000 | Liquidation | ||||||||||||||||||||||
(000)(a) | Share(b) | (000)(a) | Share(b) | (000)(a) | Share(b) | Preference(c) | ||||||||||||||||||||||
NAZ | ||||||||||||||||||||||||||||
| 2/29/24 | $88,300 | $266,396 | $– | $– | $– | $– | $– | |||||||||||||||||||||
| 2/28/23 | 88,300 | 261,963 | – | – | – | – | – | |||||||||||||||||||||
| 2/28/22 | 88,300 | 290,229 | – | – | – | – | – | |||||||||||||||||||||
| 2/28/21 | 88,300 | 297,509 | – | – | – | – | – | |||||||||||||||||||||
| 2/29/20 | 88,300 | 303,878 | – | – | – | – | – | |||||||||||||||||||||
NAC | ||||||||||||||||||||||||||||
| 2/29/24 | – | – | 275,000 | 256,929 | 907,800 | 256,929 | 2.57 | |||||||||||||||||||||
| 2/28/23 | – | – | 320,000 | 247,561 | 907,800 | 247,561 | 2.48 | |||||||||||||||||||||
| 2/28/22 | – | – | 320,000 | 270,716 | 957,600 | 270,716 | 2.71 | |||||||||||||||||||||
| 2/28/21 | – | – | 320,000 | 280,237 | 957,600 | 280,237 | 2.80 | |||||||||||||||||||||
| 2/29/20 | – | – | 320,000 | 289,294 | 957,600 | 289,294 | 2.89 | |||||||||||||||||||||
NKX | ||||||||||||||||||||||||||||
| 2/29/24 | – | – | 140,400 | 259,461 | 256,700 | 259,461 | 2.59 | |||||||||||||||||||||
| 2/28/23 | – | – | 140,400 | 255,434 | 256,700 | 255,434 | 2.55 | |||||||||||||||||||||
| 2/28/22 | – | – | 140,400 | 271,751 | 292,200 | 271,751 | 2.72 | |||||||||||||||||||||
| 2/28/21 | – | – | 140,400 | 281,045 | 292,200 | 281,045 | 2.81 | |||||||||||||||||||||
| 2/29/20 | – | – | 140,400 | 289,705 | 292,200 | 289,705 | 2.90 | |||||||||||||||||||||
| (a) | Aggregate Amount Outstanding: Aggregate amount outstanding represents the liquidation preference as of the end of the relevant fiscal year. |
| (b) | Asset Coverage Per $100,000: Asset coverage per $100,000 is calculated by subtracting the Fund’s liabilities and indebtedness not represented by senior securities from the Fund’s total assets, dividing the result by the aggregate amount of the Fund’s senior securities representing indebtedness then outstanding (if applicable,) plus the aggregate of the involuntary liquidation preference of the outstanding preferred shares, if applicable, and multiplying the result by 100,000. |
| (c) | Includes all preferred shares presented for the Fund. |
1. | General Information |
2. | Significant Accounting Policies |
Fund | Gross Custodian Fee Credits | |||
NAZ | $ | 17,682 | ||
NAC | 164,611 | |||
NKX | 28,822 | |||
NCA | 21,628 | |||
NXC | 9,110 | |||
3. | Investment Valuation and Fair Value Measurements |
| Level 1 – | Inputs are unadjusted and prices are determined using quoted prices in active markets for identical securities. |
| Level 2 – | Prices are determined using other significant observable inputs (including quoted prices for similar securities, interest rates, credit spreads, etc.). |
| Level 3 – | Prices are determined using significant unobservable inputs (including management’s assumptions in determining the fair value of investments). |
NAZ | Level 1 | Level 2 | Level 3 | Total | ||||||||||||
| Long-Term Investments: | ||||||||||||||||
| Municipal Bonds | $ | - | $ | 232,719,392 | $ | - | $ | 232,719,392 | ||||||||
| Total | $ | - | $ | 232,719,392 | $ | - | $ | 232,719,392 | ||||||||
NAC | Level 1 | Level 2 | Level 3 | Total | ||||||||||||
| Long-Term Investments: | ||||||||||||||||
| Municipal Bonds | $ | - | $ | 3,038,568,595 | $ | 424,753 | $ | 3,038,993,348 | ||||||||
| Short-Term Investments: | ||||||||||||||||
| Municipal Bonds | - | 20,200,000 | - | 20,200,000 | ||||||||||||
| Total | $ | - | $ | 3,058,768,595 | $ | 424,753 | $ | 3,059,193,348 | ||||||||
NKX | Level 1 | Level 2 | Level 3 | Total | ||||||||||||
| Long-Term Investments: | ||||||||||||||||
| Municipal Bonds | $ | - | $ | 1,032,590,583 | $ | 54,540 | $ | 1,032,645,123 | ||||||||
| Short-Term Investments: | ||||||||||||||||
| Municipal Bonds | - | 22,000,000 | - | 22,000,000 | ||||||||||||
| Total | $ | - | $ | 1,054,590,583 | $ | 54,540 | $ | 1,054,645,123 | ||||||||
NCA | Level 1 | Level 2 | Level 3 | Total | ||||||||||||
| Long-Term Investments: | ||||||||||||||||
| Municipal Bonds | $ | - | $ | 298,932,332 | $ | - | $ | 298,932,332 | ||||||||
| Short-Term Investments: | ||||||||||||||||
| Municipal Bonds | - | 10,000,000 | - | 10,000,000 | ||||||||||||
| Total | $ | - | $ | 308,932,332 | $ | - | $ | 308,932,332 | ||||||||
NXC | Level 1 | Level 2 | Level 3 | Total | ||||||||||||
| Long-Term Investments: | ||||||||||||||||
| Municipal Bonds | $ | - | $ | 87,217,669 | $ | - | $ | 87,217,669 | ||||||||
| Short-Term Investments: | ||||||||||||||||
| Municipal Bonds | - | 1,000,000 | - | 1,000,000 | ||||||||||||
| Total | $ | - | $ | 88,217,669 | $ | - | $ | 88,217,669 | ||||||||
4. | Portfolio Securities |
Fund | Floating Rate Obligations: Self- Deposited Inverse Floaters | Floating Rate Obligations: Externally-Deposited Inverse Floaters | Total | |||||||||
NAZ | $ | — | $ | — | $ | — | ||||||
NAC | 44,585,000 | — | 44,585,000 | |||||||||
NKX | 33,485,000 | — | 33,485,000 | |||||||||
NCA | — | — | — | |||||||||
NXC | — | — | — | |||||||||
Fund | Average Floating Rate Obligations Outstanding | Average Annual Interest Rate And Fees | ||||||
NAZ | $ | 4,065,753 | 3.81 | % | ||||
NAC | 8,452,178 | 3.93 | ||||||
NKX | 33,485,000 | 3.85 | ||||||
NCA | — | — | ||||||
NXC | — | — | ||||||
Fund | Maximum Exposure to Recourse Trusts: Self-Deposited Inverse Floaters | Maximum Exposure to Recourse Trusts: Externally-Deposited Inverse Floaters | Total | |||||||||
NAZ | $ | — | $ | — | $ | — | ||||||
NAC | 44,585,000 | — | 44,585,000 | |||||||||
NKX | 33,485,000 | — | 33,485,000 | |||||||||
NCA | — | — | — | |||||||||
NXC | — | — | — | |||||||||
Fund | Non-U.S. Government Purchases | Non-U.S. Government Sales and Maturities | ||||||
NAZ | $ | 26,568,946 | $ | 33,230,136 | ||||
NAC | 745,531,666 | 767,700,945 | ||||||
NKX | 265,074,109 | 288,940,311 | ||||||
NCA | 58,898,411 | 67,415,653 | ||||||
NXC | 14,101,031 | 14,360,741 | ||||||
5. | Derivative Investments |
6. | Fund Shares |
NXC | ||||||||
Year Ended 2/29/24* | Year Ended 2/28/23 | |||||||
| Additional authorized common shares | 1,300,000 | - | ||||||
| Common shares sold | - | - | ||||||
| Offering proceeds, net of offering costs | - | - | ||||||
| * | Represents additional authorized shares for the period August 4, 2023 through February 29, 2024. |
NAZ | NAC | |||||||||||||||||||
Year Ended 2/29/24 | Year Ended 2/28/23 | Year Ended 2/29/24 | Year Ended 2/28/23 | |||||||||||||||||
| Common Shares: | ||||||||||||||||||||
| Issued to shareholders due to reinvestment of distributions | – | 7,827 | – | – | ||||||||||||||||
| Repurchased and retired | (5,500 | ) | – | (13,000 | ) | – | ||||||||||||||
| Total | (5,500 | ) | 7,827 | (13,000 | ) | – | ||||||||||||||
| Weighted average common share: | ||||||||||||||||||||
| Price per share repurchased and retired | $9.94 | $– | $9.96 | $– | ||||||||||||||||
| Discount per share repurchased and retired | (16.65 | )% | –% | (16.91 | )% | –% | ||||||||||||||
NXC | ||||||||
Year Ended 2/29/24 | Year Ended 2/28/23 | |||||||
| Common Shares: | ||||||||
| Issued to shareholders due to reinvestment of distributions | 468 | 925 | ||||||
| Total | 468 | 925 | ||||||
Fund | Series | Shares Outstanding | Liquidation Preference | Liquidation Preference, net of deferred offering costs | ||||||||||||
NAZ | 2028 | 883 | $ | 88,300,000 | $ | 88,258,681 | ||||||||||
Fund | Notice Period | Series | Term Redemption Date | Premium Expiration Date | ||||||||||||
NAZ | 540-day | 2028 | December 1, 2028 | * | February 13, 2019 | |||||||||||
| * | Subject to early termination by either the Fund or the holder. |
Fund | Average Liquidation Preference of AMTP Shares Outstanding | Annualized Dividend Rate | ||||||
NAZ | $ | 88,300,000 | 4.23 | % | ||||
Fund | Series | Shares Outstanding | Remarketing Fees* | Liquidation Preference | Special Rate Period Expiration | Maturity | ||||||||||||||||||
NAC | 1 | 1,362 | 0.10% | $136,200,000 | N/A | June 1, 2041 | ||||||||||||||||||
| 2 | 910 | N/A** | $91,000,000 | February 5, 2025 | December 1, 2040 | |||||||||||||||||||
| 4 | 1,056 | 0.10% | $105,600,000 | N/A | December 1, 2042 | |||||||||||||||||||
| 5 | 1,589 | N/A** | $158,900,000 | September 2, 2026 | August 1, 2040 | |||||||||||||||||||
| 6 | 1,581 | 0.10% | $158,100,000 | N/A | August 1, 2040 | |||||||||||||||||||
| 7 | 980 | 0.10% | $98,000,000 | N/A | August 3, 2043 | |||||||||||||||||||
| 8 | 1,600 | N/A** | $160,000,000 | November 6, 2026 | November 6, 2026 | |||||||||||||||||||
NKX | 3 | 427 | 0.05% | $42,700,000 | N/A | March 1, 2040 | ||||||||||||||||||
| 4 | 1,090 | 0.10% | $109,000,000 | N/A | December 1, 2040 | |||||||||||||||||||
| 6 | 1,050 | 0.10% | $105,000,000 | N/A | June 1, 2046 | |||||||||||||||||||
| * | Remarketing fees as a percentage of the aggregate principal amount of all VRDP Shares outstanding for each series. |
| ** | Not applicable. Series is considered to be Special Rate VRDP and therefore does not pay a remarketing fee. |
Fund | Average Liquidation Preference of VRDP Shares Outstanding | Annualized Dividend Rate | ||||||
NAC | $ | 907,800,000 | 3.86% | |||||
NKX | 256,700,000 | 3.45 | ||||||
Fund | Series | Shares Outstanding | Liquidation Preference | Liquidation Preference, net of deferred offering costs | Term Redemption Date | Mode | Mode Termination Date | |||||||||||||||||||||
NAC | A | 2,750 | $ | 275,000,000 | $ | 274,903,925 | January 3, 2028 | VRM | January 3, 2028 | * | ||||||||||||||||||
NKX | A | 1,404 | $ | 140,400,000 | $ | 140,039,979 | October 1, 2047 | VRRM | N/A | |||||||||||||||||||
| * | Subject to earlier termination by either the Fund or the holder. |
Fund | Average Liquidation Preference of MFP Shares Outstanding | Annualized Dividend Rate | ||||||
NAC | $ | 318,893,443 | 4.56% | |||||
NKX | 140,400,000 | 3.85 | ||||||
Year Ended February 29, 2024 | ||||||||||||
NAC | Series | Shares | Amount | |||||||||
| MFP Shares redeemed | A | (450 | ) | $ | (45,000,000 | ) | ||||||
Year Ended February 28, 2023 | ||||||||||||
NAC | Series | Shares | Amount | |||||||||
| VRDP Shares redeemed | 3 | (498 | ) | $ | (49,800,000 | ) | ||||||
NKX | Series | Shares | Amount | |||||||||
| VRDP Shares redeemed | 2 | (355 | ) | $ | (35,500,000 | ) | ||||||
Fund | Tax Cost | Gross Unrealized Appreciation | Gross Unrealized (Depreciation) | Net Unrealized Appreciation (Depreciation) | ||||||||||||
NAZ | $ | 234,350,392 | $ | 3,998,213 | $ | (5,629,213 | ) | $ | (1,631,000 | ) | ||||||
NAC | 2,966,700,097 | 131,351,084 | (83,442,833 | ) | 47,908,251 | |||||||||||
NKX | 990,760,481 | 56,899,839 | (26,500,197 | ) | 30,399,642 | |||||||||||
NCA | 300,306,455 | 16,760,926 | (8,135,049 | ) | 8,625,877 | |||||||||||
NXC | 85,848,537 | 4,452,021 | (2,082,889 | ) | 2,369,132 | |||||||||||
Fund | Undistributed Tax-Exempt Income 1 | Undistributed Ordinary Income | Undistributed Long-Term Capital Gains | Unrealized Appreciation (Depreciation) | Capital Loss Carryforwards | Late-Year Loss Deferrals | Other Book-to-Tax Differences | Total | ||||||||||||||||||||||||
NAZ | $ | – | $ | – | $ | – | $ | (1,631,000 | ) | $ | (7,576,579 | ) | $ | – | $ | (405,663 | ) | $ | (9,613,242 | ) | ||||||||||||
NAC | – | 139,367 | – | 47,908,251 | (149,343,267 | ) | – | (6,295,410 | ) | (107,591,059 | ) | |||||||||||||||||||||
NKX | 14,528 | 229 | – | 30,399,642 | (31,243,374 | ) | – | (2,162,175 | ) | (2,991,150 | ) | |||||||||||||||||||||
NCA | 1,439,149 | – | – | 8,625,877 | (11,155,659 | ) | – | (960,138 | ) | (2,050,771 | ) | |||||||||||||||||||||
NXC | 400,036 | – | – | 2,369,132 | (2,124,541 | ) | – | (289,484 | ) | 355,143 | ||||||||||||||||||||||
| 1 | Undistributed tax-exempt income (on a tax basis) has not been reduced for the dividend declared on February 1, 2024 and paid on March 1, 2024. |
2/29/24 | 2/28/23 | |||||||||||||||||||||||||||||||||
Fund | Tax-Exempt Income 1 | Ordinary Income | Long-Term Capital Gains | Return of Capital | Tax-Exempt Income | Ordinary Income | Long-Term Capital Gains | Return of Capital | ||||||||||||||||||||||||||
NAZ | $ | 4,405,935 | $ | – | $ | – | $ | 161,896 | $ | 6,012,110 | $ | 68,069 | $ | – | $ | – | ||||||||||||||||||
NAC | 64,294,441 | 414,965 | – | 2,155,459 | 82,119,918 | 234,330 | – | – | ||||||||||||||||||||||||||
NKX | 24,422,742 | 2,711 | – | – | 28,776,323 | 20,999 | – | – | ||||||||||||||||||||||||||
NCA | 11,486,078 | 35,575 | – | – | 10,528,407 | – | – | – | ||||||||||||||||||||||||||
NXC | 3,348,122 | 11,160 | – | – | 3,136,161 | – | 13,809 | – | ||||||||||||||||||||||||||
| 1 | Each Fund designates these amounts paid during the period as Exempt Interest Dividends. |
Fund | Short-Term | Long-Term | Total | |||||||||
NAZ | $ | 3,047,069 | $ | 4,529,510 | $ | 7,576,579 | ||||||
NAC | 86,348,391 | 62,994,876 | 149,343,267 | |||||||||
NKX | 13,365,633 | 17,877,741 | 31,243,374 | |||||||||
NCA | 4,689,301 | 6,466,358 | 11,155,659 | |||||||||
NXC | 462,152 | 1,662,389 | 2,124,541 | |||||||||
Average Daily Managed Assets* | NAZ Fund-Level Fee Rate | NAC Fund-Level Fee Rate | NKX Fund-Level Fee Rate | |||||||||
| For the first $125 million | 0.4500 | % | 0.4500 | % | 0.4500 | % | ||||||
| For the next $125 million | 0.4375 | 0.4375 | 0.4375 | |||||||||
| For the next $250 million | 0.4250 | 0.4250 | 0.4250 | |||||||||
| For the next $500 million | 0.4125 | 0.4125 | 0.4125 | |||||||||
| For the next $1 billion | 0.4000 | 0.4000 | 0.4000 | |||||||||
| For the next $3 billion | 0.3750 | 0.3750 | 0.3750 | |||||||||
| For managed assets over $5 billion | 0.3625 | 0.3625 | 0.3625 | |||||||||
Average Daily Net Assets* | NXC Fund-Level Fee Rate | |||
| For the first $125 million | 0.1000 | % | ||
| For the next $125 million | 0.0875 | |||
| For the next $250 million | 0.0750 | |||
| For the next $500 million | 0.0625 | |||
| For the next $1 billion | 0.0500 | |||
| For the next $3 billion | 0.0250 | |||
| For managed assets over $5 billion | 0.0125 | |||
Complex-Level Eligible Asset Breakpoint Level* | Effective Complex-Level Fee Rate at Breakpoint Level | |||
| $55 billion | 0.2000 | % | ||
| $56 billion | 0.1996 | |||
| $57 billion | 0.1989 | |||
| $60 billion | 0.1961 | |||
| $63 billion | 0.1931 | |||
| $66 billion | 0.1900 | |||
| $71 billion | 0.1851 | |||
| $76 billion | 0.1806 | |||
| $80 billion | 0.1773 | |||
| $91 billion | 0.1691 | |||
| $125 billion | 0.1599 | |||
| $200 billion | 0.1505 | |||
| $250 billion | 0.1469 | |||
| $300 billion | 0.1445 | |||
| * | For the complex-level fees, managed assets include closed-end fund assets managed by the Adviser that are attributable to certain types of leverage. For these purposes, leverage includes the funds’ use of preferred stock and borrowings and certain investments in the residual interest certificates (also called inverse floating rate securities) in tender option bond (TOB) trusts, including the portion of assets held by a TOB trust that has been effectively financed by the trust’s issuance of floating rate securities, subject to an agreement by the Adviser as to certain funds to limit the amount of such assets for determining managed assets in certain circumstances. The complex-level fee is calculated based upon the aggregate daily managed assets of all Nuveenopen-end andclosed-end funds that constitute ‘’eligible assets.” Eligible assets do not include assets attributable to investments in other Nuveen funds or assets in excess of a |
Fund | Complex-Level Fee | |||
NAZ | 0.1601 | % | ||
NAC | 0.1601 | % | ||
NKX | 0.1601 | % | ||
NCA | 0.1601 | % | ||
NXC | 0.1601 | % | ||
Fund | Purchases | Sales | Realized Gain (Loss) | |||||||||
NAZ | $ | 7,169,425 | $ | 2,650,925 | $ | (92,314 | ) | |||||
NAC | 18,357,585 | 6,181,098 | (176,387 | ) | ||||||||
NKX | 11,758,828 | 1,563,929 | (33,670 | ) | ||||||||
NCA | 121,577 | 122,330 | (4,012 | ) | ||||||||
NXC | 159,835 | 35,680 | (1,170 | ) | ||||||||
Fund | Maximum Outstanding Balance | |||
NAZ | $ | 1,451,261 | ||
NAC | 28,400,000 | |||
NKX | 2,916,834 | |||
NCA | 272,150 | |||
NXC | 254,763 | |||
Fund | Utilization Period (Days Outstanding) | Average Daily Balance Outstanding | Average Annual Interest Rate | |||||||||
NAZ | 7 | $ | 1,139,060 | 6.42 | % | |||||||
NAC | 69 | 19,006,616 | 6.29 | |||||||||
NKX | 10 | 1,768,212 | 6.38 | |||||||||
NCA | 4 | 272,150 | 6.53 | |||||||||
NXC | 4 | 254,763 | 6.53 | |||||||||
| • | The Fund will invest at least 80% of its Managed Assets in investment grade securities that, at the time of investment, are rated within the four highest grades (Baa or BBB or better) by at least one nationally recognized statistical rating organization (“NRSRO”) or are unrated but judged to be of comparable quality by the Fund’s sub-adviser. |
| • | The Fund may invest up to 20% of its Managed Assets in municipal securities that at the time of investment are rated below investment grade or are unrated but judged to be of comparable quality by the Fund’s sub-adviser. |
| • | No more than 10% of the Fund’s Managed Assets may be invested in municipal securities rated below B3/B- or that are unrated but judged to be of comparable quality by the Fund’ssub-adviser. |
| • | The Fund may invest up to 20% of its Managed Assets in municipal securities that pay interest that is taxable under the federal alternative minimum tax. |
| • | The Fund may invest up to 15% of its Managed Assets in inverse floating rate securities. |
| • | The Fund may invest up to 10% of its Managed Assets in securities of other open- or closed-end investment companies (including exchange-traded funds (“ETFs”)) that invest primarily in municipal securities of the types in which the Fund may invest directly. |
| • | The Fund will generally maintain an investment portfolio with an overall weighted average maturity of greater than 10 years. |
| • | The Fund will invest at least 80% of its Managed Assets in investment grade securities that, at the time of investment, are rated within the four highest grades (Baa or BBB or better) by at least one nationally recognized statistical rating organization (an “NRSRO”) or are unrated but judged to be of comparable quality by the Fund’s investment adviser and/or the Fund’s sub-adviser. |
| • | The Fund may invest up to 20% of its Managed Assets in municipal securities that at the time of investment are rated below investment grade or are unrated but judged to be of comparable quality by the Fund’s investment adviser and/or the Fund’s sub-adviser. |
| • | No more than 10% of the Fund’s Managed Assets may be invested in municipal securities rated below B3/B- or that are unrated but judged to be of comparable quality by the Fund’s investment adviser and/or the Fund’ssub-adviser. |
| • | The Fund may invest up to 20% of its Managed Assets in municipal securities that pay interest that is taxable under the federal alternative minimum tax. |
| • | The Fund may invest up to 15% of its Managed Assets in inverse floating rate securities |
| • | The Fund may invest 25% or more of its total assets in municipal securities in the same economic sector. |
| • | The Fund may invest up to 10% of its total assets in securities of other open- or closed-end investment companies (including exchange-traded funds (“ETFs”)) that invest primarily in municipal securities of the types in which the Fund may invest directly. |
| • | The Fund may invest in distressed securities but may not invest in the securities of an issuer which, at the time of investment, is in default on its obligations to pay principal or interest thereon when due or that is involved in a bankruptcy proceeding (i.e., rated below C-, at the time of investment); provided, however, that the Fund’s investment adviser and/or the Fund’ssub-adviser may determine that it is in the best interest of shareholders in pursuing a workout arrangement with issuers of defaulted securities to make loans to the defaulted issuer or another party, or purchase a debt, equity or other interest from the defaulted issuer or another party, or take other related or similar steps involving the investment of additional monies, but only if that issuer’s securities are already held by the Fund. |
| • | The Fund will generally maintain an investment portfolio with an overall weighted average maturity of greater than 10 years. |
| • | The Fund will invest at least 80% of its Assets in municipal securities and other related investments the income from which is exempt from the federal alternative minimum tax applicable to individuals at the time of purchase. |
| • | The Fund will invest at least 80% of its Managed Assets in investment grade municipal securities that, at the time of investment, are rated within the four highest grades (Baa or BBB or better) by at least one NRSRO or are unrated but judged to be of comparable quality by the Fund’s investment adviser and/or the Fund’s sub-adviser. |
| • | The Fund may invest up to 20% of its Managed Assets in municipal securities that at the time of investment are rated below investment grade (Ba or BB or lower) or are unrated but judged to be of comparable quality by the Fund’s investment adviser and/or the Fund’s sub-adviser. |
| • | The Fund may invest up to 10% of its Managed Assets in municipal securities rated below B3/B- or that are unrated but judged to be of comparable quality by the Fund’s investment adviser and/or the Fund’ssub-adviser. |
| • | The Fund may invest in distressed securities but may not invest in the securities of an issuer which, at the time of investment, is in default on its obligations to pay principal or interest thereon when due or that is involved in a bankruptcy proceeding (i.e., rated below C-, at the time of investment); provided, however, that the Fund’ssub-adviser may determine that it is in the best interest of shareholders in pursuing a workout arrangement with issuers of defaulted securities to make loans to the defaulted issuer or another party, or purchase a debt, equity or other interest from the defaulted issuer or another party, or take other related or similar steps involving the investment of additional monies, but only if that issuer’s securities are already held by the Fund. |
| • | The Fund may invest up to 10% of its total assets in securities of other open-or closed-end investment companies (including ETFs) that invest primarily in municipal securities of the types in which the Fund may invest directly. |
| • | The Fund may invest up to 15% of its Managed Assets in inverse floating rate securities. |
| • | The Fund will generally maintain an investment portfolio with an overall weighted average maturity of greater than 10 years. |
| • | The Fund will invest at least 80% of its Managed Assets in municipal securities that, at the time of investment, are rated within the four highest grades (Baa or BBB or better) by at least one NRSRO or are unrated but judged to be of comparable quality by the Fund’s investment adviser and/or the Fund’s sub-adviser. Investment grade securities may include securities that, at the time of investment, are rated below investment grade, so long as at least one NRSRO rates such securities within the four highest grades (such securities are commonly referred to as split-rated securities). |
| • | The Fund may invest up to 20% of its Managed Assets in municipal securities that at the time of investment are rated below investment grade or are unrated but judged to be of comparable quality by the Fund’s investment adviser and/or the Fund’s sub-adviser. |
| • | No more than 10% of the Fund’s Managed Assets may be invested in municipal securities rated below B3/B- by all NRSROs that rate the security or that are unrated but judged to be of comparable quality by the Fund’s investment adviser and/or the Fund’ssub-adviser. |
| • | The Fund may invest up to 20% of its Managed Assets in municipal securities that pay interest that is taxable under the federal alternative minimum tax applicable to individuals. |
| • | The Fund may invest up to 15% of its Managed Assets in inverse floating rate securities. |
| • | The Fund will not invest more than 25% of its total assets in municipal securities in any one industry. |
| • | The Fund may invest up to 10% of its Managed Assets in securities of other open- or closed-end investment companies (including ETFs) that invest primarily in municipal securities of the types in which the Fund may invest directly. |
| • | The Fund may invest in distressed securities but may not invest in the securities of an issuer which, at the time of investment, is in default on its obligations to pay principal or interest thereon when due or that is involved in a bankruptcy proceeding (i.e., rated below C-, at the time of investment); provided, however, that the Fund’s investment adviser and/or the Fund’ssub-adviser may determine that it is in the best interest of shareholders in pursuing a workout arrangement with issuers of defaulted securities to make loans to the defaulted issuer or another party, or purchase a debt, equity or other interest from the defaulted issuer or another party, or take other related or similar steps involving the investment of additional monies, but only if that issuer’s securities are already held by the Fund. |
| • | The Fund will generally maintain an investment portfolio with an overall weighted average maturity of greater than 10 years. |
| • | The Fund will invest at least 80% of its Managed Assets in investment grade securities that, at the time of investment, are rated within the four highest grades (Baa or BBB or better) by at least one NRSRO or are unrated but judged to be of comparable quality by the Fund’s sub-adviser. A security is considered investment grade if it is rated within the four highest letter grades by at least one NRSRO that rate such securities (even if rated lower by another), or if it is unrated but judged to be of comparable quality by the Fund’ssub-adviser. |
| • | The Fund may invest up to 20% of its Managed Assets in municipal securities that at the time of investment are rated below investment grade or are unrated but judged to be of comparable quality by the Fund’s investment adviser and/or the Fund’s sub-adviser. |
| • | No more than 10% of the Fund’s Managed Assets may be invested in municipal securities rated below B3/B- by all NRSROs that rate the security or that are unrated but judged to be of comparable quality by the Fund’ssub-adviser. |
| • | The Fund may invest up to 15% of its Managed Assets in inverse floating rate securities. |
| • | The Fund may invest up to 10% of its net assets in securities of other open- or closed-end investment companies (including ETFs) that invest primarily in municipal securities of the types in which the Fund may invest directly. |
| • | The Fund will not invest more than 25% of its total assets in municipal securities in any one industry. |
| • | The Fund will generally maintain an investment portfolio with an overall weighted average maturity of greater than 10 years. |
Risk | NAZ | NAC | NKX | NCA | NXC | |||||
Portfolio Level Risks | ||||||||||
| Alternative Minimum Tax Risk | X | X | - | X | X | |||||
| Below Investment Grade Risk | X | X | X | X | X | |||||
| Call Risk | X | X | X | X | X | |||||
| Credit Risk | X | X | X | X | X | |||||
| Credit Spread Risk | X | X | X | X | X | |||||
| Deflation Risk | X | X | X | X | X | |||||
| Derivatives Risk | X | X | X | X | X | |||||
| Distressed or Defaulted Securities Risk | X | X | X | X | - | |||||
| Duration Risk | X | X | X | X | X | |||||
| Economic Sector Risk | X | X | X | X | X | |||||
| Financial Futures and Options Transactions Risk | X | X | X | X | X | |||||
| Hedging Risk | X | X | X | X | X | |||||
| Illiquid Investments Risk | X | X | X | X | X | |||||
| Income Risk | X | X | X | X | X | |||||
| Inflation Risk | X | X | X | X | X | |||||
| Insurance Risk | X | X | X | X | X | |||||
| Interest Rate Risk | X | X | X | X | X | |||||
| Inverse Floating Rate Securities Risk | X | X | X | X | X | |||||
| Municipal Securities Market Liquidity Risk | X | X | X | X | X | |||||
| Municipal Securities Market Risk | X | X | X | X | X | |||||
| Other Investment Companies Risk | X | X | X | X | X | |||||
| Puerto Rico Municipal Securities Market Risk | X | X | X | X | X | |||||
| Reinvestment Risk | X | X | X | X | X | |||||
| Special Considerations Related to Single State Concentration Risk | X | X | X | X | X | |||||
| Special Risks Related to Certain Municipal Obligations | X | X | X | X | X | |||||
| Swap Transactions Risk | X | X | X | X | X | |||||
| Tax Risk | X | X | X | X | X | |||||
| Taxability Risk | X | X | X | X | X | |||||
| Tobacco Settlement Bond Risk | X | X | X | X | X | |||||
| Unrated Securities Risk | X | X | X | X | X | |||||
| Valuation Risk | X | X | X | X | X | |||||
| Zero Coupon Bonds Risk | X | X | X | X | X | |||||
Risk | NAZ | NAC | NKX | NCA | NXC | |||||
Fund Level and Other Risks | ||||||||||
| Anti-Takeover Provisions | X | X | X | X | X | |||||
| Counterparty Risk | X | X | X | X | X | |||||
| Cybersecurity Risk | X | X | X | X | X | |||||
| Economic and Political Events Risk | X | X | X | X | X | |||||
Risk | NAZ | NAC | NKX | NCA | NXC | |||||
Fund Level and Other Risks | ||||||||||
| Fund Tax Risk | X | X | X | X | X | |||||
| Global Economic Risk | X | X | X | X | X | |||||
| Investment and Market Risk | X | X | X | X | X | |||||
| Legislation and Regulatory Risk | X | X | X | X | X | |||||
| Leverage Risk | X | X | X | - | - | |||||
| Market Discount from Net Asset Value | X | X | X | X | X | |||||
| Recent Market Conditions | X | X | X | X | X | |||||
| Reverse Repurchase Agreement Risk | X | X | X | X | - | |||||
| • | If the Fund has a need for cash and the securities in a special purpose trust are not actively trading due to adverse market conditions; |
| • | If special purpose trust sponsors (as a collective group or individually) experience financial hardship and consequently seek to terminate their respective outstanding special purpose trusts; and |
| • | If the value of an underlying security declines significantly and if additional collateral has not been posted by the Fund. |
NAZ | NAC | NKX | ||||
| Estimated Leverage as a Percentage of Managed Assets (Including Assets Attributable to Leverage) | 37.54 % | 39.80 % | 40.48 % | |||
| Estimated Annual Effective Leverage Expense Rate Payable by Fund on Leverage | 4.23 % | 4.41 % | 4.25 % | |||
| Annual Return Fund Portfolio Must Experience (net of expenses) to Cover Estimated Annual Effective Interest Expense Rate on Leverage | 1.59 % | 1.75 % | 1.72 % | |||
| Common Share Total Return for (10.00)% Assumed Portfolio Total Return | (18.55 )% | (19.52 )% | (19.69 )% | |||
| Common Share Total Return for (5.00)% Assumed Portfolio Total Return | (10.55 )% | (11.22 )% | (11.29 )% | |||
| Common Share Total Return for 0.00% Assumed Portfolio Total Return | (2.54 )% | (2.91 )% | (2.89 )% | |||
| Common Share Total Return for 5.00% Assumed Portfolio Total Return | 5.46 % | 5.39 % | 5.51 % | |||
| Common Share Total Return for 10.00% Assumed Portfolio Total Return | 13.47 % | 13.70 % | 13.91 % | |||
Shareholder Transaction Expenses | ||||
Maximum Sales Charge ( as a percentage of offering price) | 4.00% (1) | |||
| Dividend Reinvestment Plan Fees (2) | $2.50 | |||
| (1) | The maximum sales charge for offerings made at-the-market at-the-market, |
| (2) | You will be charged a $2.50 service charge and pay brokerage charges if you direct Computershare Inc. and Computershare Trust Company, N.A., as agent for the common shareholders, to sell your Common Shares held in a dividend reinvestment account. |
Annual Expenses (As a Percentage of Net Assets Attributable to Common Shares) (1) | ||||
| Management Fees | 0.26% | |||
| Acquired Fund Fees and Expenses | 0.00% (2) | |||
| Other Expenses (3) | 0.10% | |||
| Total Annual Expenses | 0.36% | |||
| (1) | Stated as percentages of average net assets attributable to Common Shares for the fiscal year ended February 29, 2024. |
| (2) | Expenses attributable to the Fund’s investments, if any, in other investment companies are currently estimated not to exceed 0.01%. |
| (3) | Other Expenses are based on estimated amounts for the current fiscal year. |
1 Year | 3 Years | 5 Years | 10 Years | |||||
| $14 | $21 | $30 | $55 |
Market Price | NAV | Premium/(Discount)to NAV | ||||||||||||||||||||||||||||||
Fiscal Quarter End | High | Low | High | Low | High | Low | ||||||||||||||||||||||||||
| February 2024 | $ | 13.35 | $ | 12.41 | $ | 14.07 | $ | 13.78 | (4.24)% | (10.01)% | ||||||||||||||||||||||
| November 2023 | $ | 12.97 | $ | 11.87 | $ | 13.75 | $ | 12.93 | (3.85)% | (10.40)% | ||||||||||||||||||||||
| August 2023 | $ | 13.52 | $ | 12.72 | $ | 13.89 | $ | 13.52 | (1.91)% | (6.80)% | ||||||||||||||||||||||
| May 2023 | $ | 13.86 | $ | 13.00 | $ | 14.10 | $ | 13.61 | 1.21% | (5.55)% | ||||||||||||||||||||||
| February 2023 | $ | 15.19 | $ | 13.10 | $ | 14.17 | $ | 13.70 | 7.89% | (5.42)% | ||||||||||||||||||||||
| November 2022 | $ | 13.98 | $ | 12.44 | $ | 13.83 | $ | 13.01 | 3.63% | (5.03)% | ||||||||||||||||||||||
| August 2022 | $ | 14.98 | $ | 12.95 | $ | 14.39 | $ | 13.71 | 5.05% | (6.09)% | ||||||||||||||||||||||
| May 2022 | $ | 16.00 | $ | 13.30 | $ | 15.19 | $ | 13.70 | 8.04% | (6.43)% | ||||||||||||||||||||||
February 29, 2024 | ||||
| NAV per Common Share | $ 13.98 | |||
| Market Price | $ 13.11 | |||
| Percentage of Premium/(Discount) to NAV per Common Share | (6.22)% | |||
| Net Assets Attributable to Common Shares | $ 88,968,854 | |||
Fund | Net Long-Term Capital Gains | |||
NAZ | $– | |||
NAC | – | |||
NKX | – | |||
NCA | – | |||
NXC | – | |||
NAZ | NAC | NKX | NCA | |||||||||||||||||||||||||||||
| Common and Preferred shares voting together as a class | Preferred shares | Common and Preferred shares voting together as a class | Preferred shares | Common and Preferred shares voting together as a class | Preferred shares | Common and Preferred shares voting together as a class | Preferred shares | |||||||||||||||||||||||||
Approval of the Board Members was reached as follows: | ||||||||||||||||||||||||||||||||
| Amy B.R. Lancellotta | ||||||||||||||||||||||||||||||||
| For | 7,908,417 | – | 85,504,922 | – | 30,051,022 | – | 21,719,238 | – | ||||||||||||||||||||||||
| Withhold | 517,750 | – | 14,224,413 | – | 1,240,343 | – | 546.963 | – | ||||||||||||||||||||||||
| Total | 8,426,167 | – | 99,729,335 | – | 31,291,365 | – | 22,266,201 | – | ||||||||||||||||||||||||
| John K. Nelson | ||||||||||||||||||||||||||||||||
| For | 7,909,909 | – | 85,468,067 | – | 29,969,491 | – | 21,702,492 | – | ||||||||||||||||||||||||
| Withhold | 516,258 | – | 14,261,268 | – | 1,321,874 | – | 563,709 | – | ||||||||||||||||||||||||
| Total | 8,426,167 | – | 99,729,335 | – | 31,291,365 | – | 22,266,201 | – | ||||||||||||||||||||||||
| Terence J. Toth | ||||||||||||||||||||||||||||||||
| For | 7,905,504 | – | 85,455,481 | – | 29,954,807 | – | 21,705,512 | – | ||||||||||||||||||||||||
| Withhold | 520,663 | – | 14,273,854 | – | 1,336,558 | – | 560,689 | – | ||||||||||||||||||||||||
| Total | 8,426,167 | – | 99,729,335 | – | 31,291,365 | – | 22,266,201 | – | ||||||||||||||||||||||||
| Robert L. Young | ||||||||||||||||||||||||||||||||
| For | 7,917,828 | – | 85,502,078 | – | 30,010,323 | – | 21,714,483 | – | ||||||||||||||||||||||||
| Withhold | 508,339 | – | 14,227,257 | – | 1,281,042 | – | 551,718 | – | ||||||||||||||||||||||||
| Total | 8,426,167 | – | 99,729,335 | – | 31,291,365 | – | 22,266,201 | – | ||||||||||||||||||||||||
| Albin F. Moschner | ||||||||||||||||||||||||||||||||
| For | – | 883 | – | 11,366 | – | 3,956 | – | – | ||||||||||||||||||||||||
| Withhold | – | – | – | – | – | – | – | – | ||||||||||||||||||||||||
| Total | – | 883 | – | 11,366 | – | 3,956 | – | – | ||||||||||||||||||||||||
| Margaret L. Wolff | ||||||||||||||||||||||||||||||||
| For | – | 883 | – | 11,366 | – | 3,956 | – | – | ||||||||||||||||||||||||
| Withhold | – | – | – | – | – | – | – | – | ||||||||||||||||||||||||
| Total | – | 883 | – | 11,366 | – | 3,956 | – | – | ||||||||||||||||||||||||
| Joseph A. Boateng | Michael A. Forrester | Thomas J. Kenny | Amy B.R. Lancellotta | Joanne T. Medero | Albin F. Moschner | John K. Nelson | ||||||
| Loren M. Starr | Matthew Thornton III | Terence J. Toth | Margaret L. Wolff | Robert L. Young |
Investment Adviser | Custodian | Legal Counsel | Independent Registered | Transfer Agent and | ||||
Nuveen Fund Advisors, LLC 333 West Wacker Drive Chicago, IL 60606 | State Street Bank & Trust Company One Congress Street Suite 1 Boston, MA 02114-2016 | Chapman and Cutler LLP Chicago, IL 60603 | Public Accounting Firm KPMG LLP 200 East Randolph Street Chicago, IL 60601 | Shareholder Services 150 Royall Street Canton, MA 02021 (800) 257-8787 |
NAZ | NAC | NKX | NCA | NXC | ||||||||||||||||
Common Shares Repurchased | 5,500 | 13,000 | 0 | 0 | 0 | |||||||||||||||
Name, Year of Birth & Address | Position(s) Held with the Funds | Year First Elected or Appointed and Term (1) | Principal Occupation(s) Including other Directorships During Past 5 Years | Number of Portfolios in Fund Complex Overseen By Board Member | ||||||
| Independent Trustees: | ||||||||||
Terence J. Toth 1959 333 W. Wacker Drive Chicago, IL 60606 | Co-Chair andBoard Member | | 2008 Class II | | Formerly, a Co-Founding Partner, Promus Capital (investment advisory firm) (2008-2017); formerly, Director, Quality Control Corporation (manufacturing) (2012-2021); Chair and Member of the Board of Directors (since 2021), Kehrein Center for the Arts (philanthropy); Member of the Board of Directors (since 2008), Catalyst Schools of Chicago (philanthropy); Member of the Board of Directors (since 2012), formerly, Investment Committee Chair (2017-2022), Mather Foundation Board (philanthropy); formerly, Member (2005-2016), Chicago Fellowship Board (philanthropy); formerly, Director, Fulcrum IT Services LLC (information technology services firm to government entities) (2010-2019); formerly, Director, LogicMark LLC (health services) (2012-2016); formerly, Director, Legal & General Investment Management America, Inc. (asset management) (2008-2013); formerly, CEO and President, Northern Trust Global Investments (financial services) (2004-2007); Executive Vice President, Quantitative Management & Securities Lending (2000-2004); prior thereto, various positions with Northern Trust Company (financial services) (since 1994); formerly, Member, Northern Trust Mutual Funds Board (2005-2007), Northern Trust Global Investments Board (2004-2007), Northern Trust Japan Board (2004-2007), Northern Trust Securities Inc. Board (2003- 2007) and Northern Trust Hong Kong Board (1997-2004). | 216 | ||||
Joseph A. Boateng 1963 730 Third Avenue New York, NY 10017 | Board Member | | 2024 Class II | | Chief Investment Officer, Casey Family Programs (since 2007); formerly, Director of U.S. Pension Plans, Johnson & Johnson (2002-2006); Board Member, Lumina Foundation (since 2019) and Waterside School (since 2021); Board Member (2012-2019) and Emeritus Board Member (since 2020), Year-Up Puget Sound; Investment Advisory Committee Member and Former Chair (since 2007), Seattle City Employees’ Retirement System; Investment Committee Member (since 2019), The Seattle Foundation; Trustee (2018-2023), the College Retirement Equities Fund; Manager (2019-2023), TIAA Separate AccountVA-1. | 195 | ||||
Michael A. Forrester 1967 730 Third Avenue New York, NY 10017 | Board Member | | 2024 Class I | | Formerly, Chief Executive Officer (2014-2021) and Chief Operating Officer (2007-2014), Copper Rock Capital Partners, LLC; Trustee, Dexter Southfield School (since 2019); Member (since 2020), Governing Council of the Independent Directors Council (IDC); Trustee, the College Retirement Equities Fund and Manager, TIAA Separate Account VA-1 (2007-2023). | 195 | ||||
Name, Year of Birth & Address | Position(s) Held with the Funds | Year First Elected or Appointed and Term (1) | Principal Occupation(s) Including other Directorships During Past 5 Years | Number of Portfolios in Fund Complex Overseen By Board Member | ||||||
Thomas J. Kenny 1963 730 Third Avenue New York, NY 10017 | Co-Chair andBoard Member | | 2024 Class I | | Formerly, Advisory Director (2010-2011), Partner (2004-2010), Managing Director (1999-2004) and Co-Head of Global Cash and Fixed Income Portfolio Management Team (2002-2010), Goldman Sachs Asset Management; Director (since 2015) and Chair of the Finance and Investment Committee (since 2018), Aflac Incorporated; Director (since 2018), ParentSquare; formerly, Director (2021-2022) and Finance Committee Chair (2016-2022), Sansum Clinic; formerly, Advisory Board Member (2017-2019), B’Box; formerly, Member (2011-2012), the University of California at Santa Barbara Arts and Lectures Advisory Council; formerly, Investment Committee Member (2012-2020), Cottage Health System; formerly, Board member (2009-2019) and President of the Board (2014-2018), Crane Country Day School; Trustee (2011- 2023) and Chairman (2017-2023), the College Retirement Equities Fund; Manager (2011-2023) and Chairman (2017–2023), TIAA Separate AccountVA-1. | 216 | ||||
Amy B. R. Lancellotta 1959 333 W. Wacker Drive Chicago, IL 60606 | Board Member | | 2021 Class II | | Formerly, Managing Director, IDC (supports the fund independent director community and is part of the Investment Company Institute (ICI), which represents regulated investment companies) (2006-2019); formerly, various positions with ICI (1989-2006); President (since 2023) and Member (since 2020) of the Board of Directors, Jewish Coalition Against Domestic Abuse (JCADA). | 216 | ||||
Joanne T. Medero 1954 333 W. Wacker Drive Chicago, IL 60606 | Board Member | | 2021 Class III | | Formerly, Managing Director, Government Relations and Public Policy (2009-2020) and Senior Advisor to the Vice Chairman (2018- 2020), BlackRock, Inc. (global investment management firm); formerly, Managing Director, Global Head of Government Relations and Public Policy, Barclays Group (IBIM) (investment banking, investment management and wealth management businesses) (2006-2009); formerly, Managing Director, Global General Counsel and Corporate Secretary, Barclays Global Investors (global investment management firm) (1996-2006); formerly, Partner, Orrick, Herrington & Sutcliffe LLP (law firm) (1993-1995); formerly, General Counsel, Commodity Futures Trading Commission (government agency overseeing U.S. derivatives markets) (1989-1993); formerly, Deputy Associate Director/Associate Director for Legal and Financial Affairs, Office of Presidential Personnel, The White House (1986-1989); Member of the Board of Directors, Baltic-American Freedom Foundation (seeks to provide opportunities for citizens of the Baltic states to gain education and professional development through exchanges in the U.S.) (since 2019). | 216 | ||||
Albin F. Moschner 1952 333 W. Wacker Drive Chicago, IL 60606 | Board Member | | 2016 Class III | | Founder and Chief Executive Officer, Northcroft Partners, LLC, (management consulting) (since 2012); formerly, Chairman (2019), and Director (2012-2019), USA Technologies, Inc., (provider of solutions and services to facilitate electronic payment transactions); formerly, Director, Wintrust Financial Corporation (1996-2016); previously, held positions at Leap Wireless International, Inc. (consumer wireless services), including Consultant (2011-2012), Chief Operating Officer (2008-2011), and Chief Marketing Officer (2004-2008); formerly, President, Verizon Card Services division of Verizon Communications, Inc. (2000-2003); formerly, President, One Point Services at One Point Communications (telecommunication services) (1999-2000); formerly, Vice Chairman of the Board, Diba, Incorporated (internet technology provider) (1996-1997); formerly, various executive positions (1991-1996) including Chief Executive Officer (1995-1996) of Zenith Electronics Corporation (consumer electronics). | 216 | ||||
Name, Year of Birth & Address | Position(s) Held with the Funds | Year First Elected or Appointed and Term (1) | Principal Occupation(s) Including other Directorships During Past 5 Years | Number of Portfolios in Fund Complex Overseen By Board Member | ||||||
John K. Nelson 1962 333 W. Wacker Drive Chicago, IL 60606 | Board Member | | 2013 Class II | | Formerly, Member of Board of Directors of Core12 LLC (2008-2023) (private firm which develops branding, marketing and communications strategies for clients); formerly, Member of The President’s Council of Fordham University (2010-2019); formerly, Director of the Curran Center for Catholic American Studies (2009-2018); formerly, senior external advisor to the Financial Services practice of Deloitte Consulting LLP. (2012-2014); former Chair of the Board of Trustees of Marian University (2010-2014 as trustee, 2011-2014 as Chair); formerly Chief Executive Officer of ABN AMRO Bank N.V., North America, and Global Head of the Financial Markets Division (2007-2008), with various executive leadership roles in ABN AMRO Bank N.V. between 1996 and 2007. | 216 | ||||
Loren M. Starr 1961 730 Third Avenue New York, NY 10017 | Board Member | | 2024 Class III | | Independent Consultant/Advisor (since 2021); formerly, Vice Chair, Senior Managing Director (2020-2021), Chief Financial Officer, Senior Managing Director (2005-2020), Invesco Ltd.; Director (since 2023) and Audit Committee member (since 2024), AMG; formerly, Chair and Member of the Board of Directors (2014-2021), Georgia Leadership Institute for School Improvement (GLISI); formerly, Chair and Member of the Board of Trustees (2014-2018), Georgia Council on Economic Education (GCEE); Trustee, the College Retirement Equities Fund and Manager, TIAA Separate Account VA-1 (2022-2023). | 215 | ||||
Matthew Thornton III 1958 333 W. Wacker Drive Chicago, IL 60606 | Board Member | | 2020 Class III | | Formerly, Executive Vice President and Chief Operating Officer (2018-2019), FedEx Freight Corporation, a subsidiary of FedEx Corporation (FedEx) (provider of transportation, e-commerce and business services through its portfolio of companies); formerly, Senior Vice President, U.S. Operations (2006-2018), Federal Express Corporation, a subsidiary of FedEx; formerly Member of the Board of Directors (2012-2018), Safe Kids Worldwide® (anon-profit organization dedicated to preventing childhood injuries). Member of the Board of Directors (since 2014), The Sherwin-Williams Company (develops, manufactures, distributes and sells paints, coatings and related products); Director (since 2020), Crown Castle International (provider of communications infrastructure). | 216 | ||||
Margaret L. Wolff 1955 333 W. Wacker Drive Chicago, IL 60606 | Board Member | | 2016 Class I | | Formerly, member of the Board of Directors (2013-2017) of Travelers Insurance Company of Canada and The Dominion of Canada General Insurance Company (each, a part of Travelers Canada, the Canadian operation of The Travelers Companies, Inc.); formerly, Of Counsel, Skadden, Arps, Slate, Meagher & Flom LLP (Mergers & Acquisitions Group) (legal services) (2005- 2014); Member of the Board of Trustees of New York-Presbyterian Hospital (since 2005); Member of the Board of Trustees (since 2004) formerly, Chair (2015-2022) of The John A. Hartford Foundation (a philanthropy dedicated to improving the care of older adults); formerly, Member (2005-2015) and Vice Chair (2011- 2015) of the Board of Trustees of Mt. Holyoke College. | 216 | ||||
Robert L. Young 1963 333 W. Wacker Drive Chicago, IL 60606 | Board Member | | 2017 Class I | | Formerly, Chief Operating Officer and Director, J.P. Morgan Investment Management Inc. (financial services) (2010-2016); formerly, President and Principal Executive Officer (2013-2016), and Senior Vice President and Chief Operating Officer (2005-2010), of J.P. Morgan Funds; formerly, Director and various officer positions for J.P. Morgan Investment Management Inc. (formerly, JPMorgan Funds Management, Inc. and formerly, One Group Administrative Services) and JPMorgan Distribution Services, Inc. (financial services) (formerly, One Group Dealer Services, Inc.) (1999-2017). | 216 | ||||
Name, Year of Birth & Address | Position(s) Held with the Funds | Year First Elected or Appointed (2) | Principal Occupation(s) Including other Directorships During Past 5 Years | |||||
| Officers of the Funds: | ||||||||
David J. Lamb 1963 333 W. Wacker Drive Chicago, IL 60606 | Chief Administrative Officer | 2015 | Managing Director of Nuveen Fund Advisors, LLC; Senior Managing Director of Nuveen Securities, LLC; Senior Managing Director of Nuveen; has previously held various positions with Nuveen. | |||||
Brett E. Black 1972 333 W. Wacker Drive Chicago, IL 60606 | Vice President and Chief Compliance Officer | 2022 | Managing Director, Chief Compliance Officer of Nuveen; formerly, Vice President (2014-2022), Chief Compliance Officer and Anti-Money Laundering Compliance Officer (2017-2022) of BMO Funds, Inc. | |||||
Mark J. Czarniecki 1979 901 Marquette Avenue Minneapolis, MN 55402 | Vice President and Assistant Secretary | 2013 | Managing Director and Assistant Secretary of Nuveen Securities, LLC and Nuveen Fund Advisors, LLC; Managing Director and Associate General Counsel of Nuveen; Managing Director Assistant Secretary and Associate General Counsel of Nuveen Asset Management, LLC; has previously held various positions with Nuveen; Managing Director, Associate General Counsel and Assistant Secretary of Teachers Advisors, LLC and TIAA-CREF Investment Management, LLC. | |||||
Jeremy D. Franklin 1983 8500 Andrew Carnegie Blvd. Charlotte, NC 28262 | Vice President and Assistant Secretary | 2024 | Managing Director and Assistant Secretary, Nuveen Fund Advisors, LLC; Vice President Associate General Counsel and Assistant Secretary, Nuveen Asset Management, LLC, Teachers Advisors, LLC and TIAA-CREF Investment Management, LLC; Vice President and Associate General Counsel, Teachers Insurance and Annuity Association of America; Vice President and Assistant Secretary, TIAA-CREF Funds and TIAA-CREF Life Funds; Vice President, Associate General Counsel, and Assistant Secretary, TIAA Separate Account VA-1 and College Retirement Equities Fund. | |||||
Diana R. Gonzalez 1978 8500 Andrew Carnegie Blvd. Charlotte, NC 28262 | Vice President and Assistant Secretary | 2017 | Vice President and Assistant Secretary of Nuveen Fund Advisors, LLC; Vice President, Associate General Counsel and Assistant Secretary of Nuveen Asset Management, LLC, Teachers Advisors, LLC and TIAA-CREF Investment Management, LLC; Vice President and Associate General Counsel of Nuveen. | |||||
Nathaniel T. Jones 1979 333 W. Wacker Drive Chicago, IL 60606 | Vice President and Treasurer | 2016 | Senior Managing Director of Nuveen; Senior Managing Director of Nuveen Fund Advisors, LLC; has previously held various positions with Nuveen; Chartered Financial Analyst. | |||||
Brian H. Lawrence 1982 8500 Andrew Carnegie Blvd. Charlotte, NC 28262 | Vice President and Assistant Secretary | 2023 | Vice President and Associate General Counsel of Nuveen; Vice President, Associate General Counsel and Assistant Secretary of Teachers Advisors, LLC and TIAA-CREF Investment Management, LLC; formerly Corporate Counsel of Franklin Templeton (2018-2022). | |||||
Tina M. Lazar 1961 333 W. Wacker Drive Chicago, IL 60606 | Vice President | 2002 | Managing Director of Nuveen Securities, LLC. | |||||
Brian J. Lockhart 1974 333 W. Wacker Drive Chicago, IL 60606 | Vice President | 2019 | Senior Managing Director and Head of Investment Oversight of Nuveen; Senior Managing Director of Nuveen Fund Advisors, LLC; has previously held various positions with Nuveen; Chartered Financial Analyst and Certified Financial Risk Manager. | |||||
John M. McCann 1975 8500 Andrew Carnegie Blvd. Charlotte, NC 28262 | Vice President and Assistant Secretary | 2022 | Managing Director, General Counsel and Secretary of Nuveen Fund Advisors, LLC; Managing Director, Associate General Counsel and Assistant Secretary of Nuveen Asset Management, LLC; Managing Director and Assistant Secretary of TIAA SMA Strategies LLC; Managing Director, Associate General Counsel and Assistant Secretary of College Retirement Equities Fund, TIAA Separate Account VA-1, TIAA- CREF Funds, TIAA-CREF Life Funds, Teachers Insurance and Annuity Association of America, Teacher Advisors LLC, TIAA-CREF Investment Management, LLC, and Nuveen Alternative Advisors LLC; has previously held various positions with Nuveen/TIAA. | |||||
Name, Year of Birth & Address | Position(s) Held with the Funds | Year First Elected or Appointed (2) | Principal Occupation(s) Including other Directorships During Past 5 Years | |||||
Kevin J. McCarthy 1966 333 W. Wacker Drive Chicago, IL 60606 | Vice President and Assistant Secretary | 2007 | Executive Vice President, Secretary and General Counsel of Nuveen Investments, Inc.; Executive Vice President and Assistant Secretary of Nuveen Securities, LLC and Nuveen Fund Advisors, LLC; Executive Vice President and Secretary of Nuveen Asset Management, LLC; Executive Vice President, General Counsel and Secretary of Teachers Advisors, LLC, TIAA-CREF Investment Management, LLC and Nuveen Alternative Investments, LLC; Executive Vice President, Associate General Counsel and Assistant Secretary of TIAA-CREF Funds and TIAA-CREF Life Funds; has previously held various positions with Nuveen; Vice President and Secretary of Winslow Capital Management, LLC; formerly, Vice President (2007-2021) and Secretary (2016-2021) of NWQ Investment Management Company, LLC and Santa Barbara Asset Management, LLC. | |||||
Jon Scott Meissner 1973 8500 Andrew Carnegie Blvd. Charlotte, NC 28262 | Vice President and Assistant Secretary | 2019 | Managing Director, Mutual Fund Tax and Expense Administration of Nuveen, TIAA- CREF Funds, TIAA-CREF Life Funds, TIAA Separate Account VA-1 and the CREF Accounts; Managing Director of Nuveen Fund Advisors, LLC, Teachers Advisors, LLC and TIAA-CREF Investment Management, LLC; has previously held various positions with TIAA. | |||||
James Nelson III 1976 730 Third Avenue New York, NY 10017 | Vice President | 2024 | Senior Managing Director, Global Head of Product, Publics, Nuveen; formerly, Head of North American Product Management & Pricing, Invesco (2018-2023). | |||||
Mary Beth Ramsay 1965 8500 Andrew Carnegie Blvd. Charlotte, NC 28262 | Vice President | 2024 | Chief Risk Officer, Nuveen and TIAA Financial Risk; Head of Nuveen Risk & Compliance; Executive Vice President, Teachers Insurance and Annuity Association of America; Executive Vice President, Risk, TIAA Separate Account VA-1 and the College Retirement Equities Fund; formerly, Senior Vice President, Head of Sales and Client Solutions (2019-2022) and U.S. Chief Pricing Actuary (2016-2019), SCOR Global Life Americas; Member of the Board of Directors of Society of Actuaries. | |||||
William A. Siffermann 1975 333 W. Wacker Drive Chicago, IL 60606 | Vice President | 2017 | Managing Director of Nuveen. | |||||
E. Scott Wickerham 1973 8500 Andrew Carnegie Blvd. Charlotte, NC 28262 | Vice President and Controller | 2019 | Senior Managing Director, Head of Public Investment Finance of Nuveen; Senior Managing Director of Nuveen Fund Advisors, LLC and Nuveen Asset Management, LLC; Principal Financial Officer, Principal Accounting Officer and Treasurer of the TIAA-CREF Funds, the TIAA-CREF Life Funds, the TIAA Separate Account VA-1 and the CREF Accounts; has previously held various positions with TIAA. | |||||
Mark L. Winget 1968 333 W. Wacker Drive Chicago, IL 60606 | Vice President and Secretary | 2008 | Vice President and Assistant Secretary of Nuveen Securities, LLC and Nuveen Fund Advisors, LLC; Vice President, Associate General Counsel and Assistant Secretary of Teachers Advisors, LLC and TIAA-CREF Investment Management, LLC and Nuveen Asset Management, LLC; Vice President and Associate General Counsel of Nuveen. | |||||
Rachael Zufall 1973 8500 Andrew Carnegie Blvd. Charlotte, NC 28262 | Vice President and Assistant Secretary | 2022 | Managing Director and Assistant Secretary of Nuveen Fund Advisors, LLC; Managing Director, Associate General Counsel and Assistant Secretary of the CREF Accounts, TIAA Separate Account VA-1, TIAA-CREF Funds and TIAA-CREF Life Funds; Managing Director, Associate General Counsel and Assistant Secretary of Teacher Advisors, LLC and TIAA-CREF Investment Management, LLC; Managing Director of Nuveen, LLC and of TIAA. | |||||
| (1) | The Board of Trustees is divided into three classes, Class I, Class II, and Class III, with each being elected to serve until the third succeeding annual shareholders’ meeting subsequent to its election or thereafter in each case when its respective successors are duly elected or appointed, except two board members are elected by the holders of Preferred Shares, when applicable, to serve until the next annual shareholders’ meeting subsequent to its election or thereafter in each case when its respective successors are duly elected or appointed. The year first elected or appointed represents the year in which the board member was first elected or appointed to any fund in the Nuveen complex. |
| (2) | Officers serve indefinite terms until their successor has been duly elected and qualified, their death or their resignation or removal. The year first elected or appointed represents the year in which the Officer was first elected or appointed to any fund in the Nuveen Complex. |
Nuveen Securities, LLC, member FINRA and SIPC | 333 West Wacker Drive | Chicago, IL 60606 | www.nuveen.com | EAN-A-0224P | 3479086-INV-Y-04/25 |
| ITEM 2. | CODE OF ETHICS. |
As of the end of the period covered by this report, the registrant has adopted a code of ethics that applies to the registrant’s principal executive officer, principal financial officer, principal accounting officer or controller, or persons performing similar functions. There were no amendments to or waivers from the Code during the period covered by this report. The registrant has posted the code of ethics on its website at www.nuveen.com/fund-governance. (To view the code, click on Code of Conduct.)
| ITEM 3. | AUDIT COMMITTEE FINANCIAL EXPERT. |
As of the end of the period covered by this report, the registrant’s Board of Directors or Trustees (“Board”) determined that the registrant has at least one “audit committee financial expert” (as defined in Item 3 of Form N-CSR) serving on its Audit Committee. The registrant’s audit committee financial experts are Joseph A. Boateng, Albin F. Moschner, John K. Nelson, Loren M. Starr and Robert L. Young, who are “independent” for purposes of Item 3 of Form N-CSR.
Mr. Boateng has served as the Chief Investment Officer for Casey Family Programs since 2007. He was previously Director of U.S. Pension Plans for Johnson & Johnson from 2002-2006. Mr. Boateng is a board member of the Lumina Foundation and Waterside School, an emeritus board member of Year Up Puget Sound, member of the Investment Advisory Committee and former Chair for the Seattle City Employees’ Retirement System, and an Investment Committee Member for The Seattle Foundation. Mr. Boateng previously served on the Board of Trustees for the College Retirement Equities Fund (2018-2023) and on the Management Committee for TIAA Separate Account VA-1 (2019-2023).
Mr. Moschner is a consultant in the wireless industry and, in July 2012, founded Northcroft Partners, LLC, a management consulting firm that provides operational, management and governance solutions. Prior to founding Northcroft Partners, LLC, Mr. Moschner held various positions at Leap Wireless International, Inc., a provider of wireless services, where he was as a consultant from February 2011 to July 2012, Chief Operating Officer from July 2008 to February 2011, and Chief Marketing Officer from August 2004 to June 2008. Before he joined Leap Wireless International, Inc., Mr. Moschner was President of the Verizon Card Services division of Verizon Communications, Inc. from 2000 to 2003, and President of One Point Services at One Point Communications from 1999 to 2000. Mr. Moschner also served at Zenith Electronics Corporation as Director, President and Chief Executive Officer from 1995 to 1996, and as Director, President and Chief Operating Officer from 1994 to 1995.
Mr. Nelson formerly served on the Board of Directors of Core12, LLC from 2008 to 2023, a private firm which develops branding, marketing, and communications strategies for clients. Mr. Nelson has extensive experience in global banking and markets, having served in several senior executive positions with ABN AMRO Holdings N.V. and its affiliated entities and predecessors, including LaSalle Bank Corporation from 1996 to 2008, ultimately serving as Chief Executive Officer of ABN AMRO N.V. North America. During his tenure at the bank, he also served as Global Head of its Financial Markets Division, which encompassed the bank’s Currency, Commodity, Fixed Income, Emerging Markets, and Derivatives businesses. He was a member of the Foreign Exchange Committee of the Federal Reserve Bank of the United States and during his tenure with ABN AMRO served as the bank’s representative on various committees of The Bank of Canada, European Central Bank, and The Bank of England. Mr. Nelson previously served as a senior, external advisor to the financial services practice of Deloitte Consulting LLP. (2012-2014).
Mr. Starr was Vice Chair, Senior Managing Director from 2020 to 2021, and Chief Financial Officer, Senior Managing Director from 2005 to 2020, for Invesco Ltd. Mr. Starr is also a Director and member of the Audit Committee for AMG. He is former Chair and member of the Board of Directors, Georgia Leadership Institute for School Improvement (GLISI); former Chair and member of the Board of Trustees, Georgia Council on Economic Education (GCEE). Mr. Starr previously served on the Board of Trustees for the College Retirement Equities Fund and on the Management Committee for TIAA Separate Account VA-1 (2022-2023).
Mr. Young has more than 30 years of experience in the investment management industry. From 1997 to 2017, he held various positions with J.P. Morgan Investment Management Inc. (“J.P. Morgan Investment”) and its affiliates (collectively, “J.P. Morgan”). Most recently, he served as Chief Operating Officer and Director of J.P. Morgan Investment (from 2010 to 2016) and as President and Principal Executive Officer of the J.P. Morgan Funds (from 2013 to 2016). As Chief Operating Officer of J.P. Morgan Investment, Mr. Young led service, administration and business platform support activities for J.P. Morgan’s domestic retail mutual fund and institutional commingled and separate account businesses, and co-led these activities for J.P. Morgan’s global retail and institutional investment management businesses. As President of the J.P. Morgan Funds, Mr. Young interacted with various service providers to these funds, facilitated the relationship between such funds and their boards, and was directly involved in establishing board agendas, addressing regulatory matters, and establishing policies and procedures. Before joining J.P. Morgan, Mr. Young, a former Certified Public Accountant (CPA), was a Senior Manager (Audit) with Deloitte & Touche LLP (formerly, Touche Ross LLP), where he was employed from 1985 to 1996. During his tenure there, he actively participated in creating, and ultimately led, the firm’s midwestern mutual fund practice.
| ITEM 4. | PRINCIPAL ACCOUNTANT FEES AND SERVICES. |
Nuveen California Select Tax-Free Income Portfolio
The following tables show the amount of fees that KPMG LLP, the Fund’s auditor, billed to the Fund during the Fund’s last two full fiscal years. For engagements with KPMG LLP the Audit Committee approved in advance all audit services and non-audit services that KPMG LLP provided to the Fund, except for those non-audit services that were subject to the pre-approval exception under Rule 2-01 of Regulation S-X (the “pre-approval exception”). The pre-approval exception for services provided directly to the Fund waives the pre-approval requirement for services other than audit, review or attest services if: (A) the aggregate amount of all such services provided constitutes no more than 5% of the total amount of revenues paid by the Fund to its accountant during the fiscal year in which the services are provided; (B) the Fund did not recognize the services as non-audit services at the time of the engagement; and (C) the services are promptly brought to the Audit Committee’s attention, and the Committee (or its delegate) approves the services before the audit is completed.
The Audit Committee has delegated certain pre-approval responsibilities to its Chair (or, in his absence, any other member of the Audit Committee).
SERVICES THAT THE FUND’S AUDITOR BILLED TO THE FUND
Fiscal Year Ended | Audit Fees Billed to Fund 1 | Audit-Related Fees Billed to Fund 2 | Tax Fees Billed to Fund 3 | All Other Fees Billed to Fund 4 | ||||||||||||
February 29, 2024 | $ | 26,600 | $ | 9,000 | $ | 0 | $ | 0 | ||||||||
|
|
|
|
|
|
|
| |||||||||
Percentage approved pursuant to pre-approval exception | 0 | % | 0 | % | 0 | % | 0 | % | ||||||||
|
|
|
|
|
|
|
| |||||||||
February 28, 2023 | $ | 28,000 | $ | 0 | $ | 0 | $ | 0 | ||||||||
|
|
|
|
|
|
|
| |||||||||
Percentage approved pursuant to pre-approval exception | 0 | % | 0 | % | 0 | % | 0 | % | ||||||||
|
|
|
|
|
|
|
| |||||||||
1 “Audit Fees” are the aggregate fees billed for professional services for the audit of the Fund’s annual financial statements and services provided in connection with statutory and regulatory filings or engagements.
2 “Audit Related Fees” are the aggregate fees billed for assurance and related services reasonably related to the performance of the audit or review of financial statements that are not reported under “Audit Fees”. These fees include offerings related to the Fund’s common shares and leverage.
3 “Tax Fees” are the aggregate fees billed for professional services for tax advice, tax compliance, and tax planning. These fees include: all global withholding tax services; excise and state tax reviews; capital gain, tax equalization and taxable basis calculation performed by the principal accountant.
4 “All Other Fees” are the aggregate fees billed for products and services other than “Audit Fees”, “Audit-Related Fees” and “Tax Fees”. These fees represent all “Agreed-Upon Procedures” engagements pertaining to the Fund’s use of leverage.
SERVICES THAT THE FUND’S AUDITOR BILLED TO THE
ADVISER AND AFFILIATED FUND SERVICE PROVIDERS
Fiscal Year Ended | Audit-Related Fees Billed to Adviser and Affiliated Fund Service Providers | Tax Fees Billed to Adviser and Affiliated Fund Service Providers | All Other Fees Billed to Adviser and Affiliated Fund Service Providers | |||||||||
February 29, 2024 | $ | 0 | $ | 0 | $ | 0 | ||||||
|
|
|
|
|
| |||||||
Percentage approved pursuant to pre-approval exception | 0 | % | 0 | % | 0 | % | ||||||
|
|
|
|
|
| |||||||
February 28, 2023 | $ | 0 | $ | 0 | $ | 0 | ||||||
|
|
|
|
|
| |||||||
Percentage approved pursuant to pre-approval exception | 0 | % | 0 | % | 0 | % | ||||||
|
|
|
|
|
| |||||||
Fiscal Year Ended | Total Non-Audit Fees Billed to Fund | Total Non-Audit Fees billed to Adviser and Affiliated Fund Service Providers (engagements related directly to the operations and financial reporting of the Fund) | Total Non-Audit Fees billed to Adviser and Affiliated Fund Service Providers (all other engagements) | Total | ||||||||||||
February 29, 2024 | $ | 0 | $ | 0 | $ | 0 | $ | 0 | ||||||||
February 28, 2023 | $ | 0 | $ | 0 | $ | 0 | $ | 0 | ||||||||
“Non-Audit Fees billed to Fund” for both fiscal year ends represent “Tax Fees” and “All Other Fees” billed to Fund in their respective amounts from the previous table.
Less than 50 percent of the hours expended on the principal accountant’s engagement to audit the registrant’s financial statements for the most recent fiscal year were attributed to work performed by persons other than the principal accountant’s full-time, permanent employees.
Audit Committee Pre-Approval Policies and Procedures. Generally, the Audit Committee must approve (i) all non-audit services to be performed for the Fund by the Fund’s independent accountants and (ii) all audit and non-audit services to be performed by the Fund’s independent accountants for the Affiliated Fund Service Providers with respect to operations and financial reporting of the Fund. Regarding tax and research projects conducted by the independent accountants for the Fund and Affiliated Fund Service Providers (with respect to operations and financial reports of the Fund) such engagements will be (i) pre-approved by the Audit Committee if they are expected to be for amounts greater than $10,000; (ii) reported to the Audit Committee chair for his verbal approval prior to engagement if they are expected to be for amounts under $10,000 but greater than $5,000; and (iii) reported to the Audit Committee at the next Audit Committee meeting if they are expected to be for an amount under $5,000.
Item 4(i) and Item 4(j) are not applicable to the registrant.
| ITEM 5. | AUDIT COMMITTEE OF LISTED REGISTRANTS. |
The registrant’s Board has a separately designated Audit Committee established in accordance with Section 3(a)(58)(A) of the Securities Exchange Act of 1934, as amended (15 U.S.C. 78c(a)(58)(A)). The members of the audit committee are Joseph A. Boateng, Albin F. Moschner, John K. Nelson, Chair, Loren M. Starr, Margaret L. Wolff and Robert L. Young.
| ITEM 6. | SCHEDULE OF INVESTMENTS. |
| a) | See Portfolio of Investments in Item 1. |
| b) | Not applicable. |
| ITEM 7. | DISCLOSURE OF PROXY VOTING POLICIES AND PROCEDURES FOR CLOSED-END MANAGEMENT INVESTMENT COMPANIES. |
| ITEM 8. | PORTFOLIO MANAGERS OF CLOSED-END MANAGEMENT INVESTMENT COMPANIES. |
Nuveen Fund Advisors, LLC is the registrant’s investment adviser (also referred to as the “Adviser”). The Adviser is responsible for the selection and on-going monitoring of the Fund’s investment portfolio, managing the Fund’s business affairs and providing certain clerical, bookkeeping and administrative services. The Adviser has engaged Nuveen Asset Management, LLC (“Nuveen Asset Management” or “Sub-Adviser”) as Sub-Adviser to provide discretionary investment advisory services. The following section provides information on the portfolio managers at the Sub-Adviser:
| ITEM 8(a)(1). | PORTFOLIO MANAGER BIOGRAPHIES |
As of the date of filing this report, the following individuals at the Sub-Adviser (the “Portfolio Managers”) have primary responsibility for the day-to-day implementation of the registrant’s investment strategies:
Scott R. Romans, PhD, Managing Director of Nuveen Asset Management, responsible for managing several state-specific, tax-exempt portfolios, including the California Municipal Bond and the New York Municipal Bond strategies. He also serves as portfolio manager for a number of closed-end funds. Before moving to his portfolio management role in 2003, he was a senior research analyst in the firm’s tax-exempt fixed income department, specializing in the education sector. He holds an undergraduate degree from the University of Pennsylvania, an M.S.F. from the Illinois Institute of Technology Stuart School of Business, and an MA and PhD from the University of Chicago.
Kristen M. DeJong, CFA, Managing Director at Nuveen Asset Management, is a portfolio manager responsible for managing taxable municipal fixed income strategies for customized institutional portfolios and closed-end funds. She began her career in the investment industry in 2005 and joined Nuveen Asset Management in 2008. Prior to her current role, she served as senior research analyst for Nuveen Asset Management’s municipal fixed income team, responsible for conducting credit analysis and providing trade recommendations for separately managed accounts. Previously, she worked as a research associate at Nuveen in the wealth management services area, where she provided research and developed reports on various topics involving retirement, tax and investment planning. Before joining Nuveen, she was a financial advisor at Ameriprise Financial. She received her B.S. in Business from Miami University. Ms. DeJong holds the Chartered Financial Analyst designation and is a member of the CFA Institute and the CFA Society of Chicago.
| ITEM 8(a)(2). | OTHER ACCOUNTS MANAGED BY PORTFOLIO MANAGERS |
Other Accounts Managed. In addition to managing the registrant, the Portfolio Managers are also primarily responsible for the day-to-day portfolio management of the following accounts:
Portfolio Manager | Type of Account Managed | Number of Accounts | Assets* | |||||||
Scott R. Romans | Registered Investment Company | 17 | $ | 17.35 billion | ||||||
| Other Pooled Investment Vehicles | 0 | $ | 0 | |||||||
| Other Accounts | 3 | $ | 5 million | |||||||
Kristen M. DeJong | Registered Investment Company | 19 | $ | 19.31 billion | ||||||
| Other Pooled Investment Vehicles | 1 | $ | 72.49 million | |||||||
| Other Accounts | 30 | $ | 6.96 billion | |||||||
* Assets are as of February 29, 2024. None of the assets in these accounts are subject to an advisory fee based on performance.
POTENTIAL MATERIAL CONFLICTS OF INTEREST
Actual or apparent conflicts of interest may arise when a portfolio manager has day-to-day management responsibilities with respect to more than one account. More specifically, portfolio managers who manage multiple accounts are presented a number of potential conflicts, including, among others, those discussed below.
The management of multiple accounts may result in a portfolio manager devoting unequal time and attention to the management of each account. Nuveen Asset Management seeks to manage such competing interests for the time and attention of portfolio managers by having portfolio managers focus on a particular investment discipline. Most accounts managed by a portfolio manager in a particular investment strategy are managed using the same investment models.
If a portfolio manager identifies a limited investment opportunity which may be suitable for more than one account, an account may not be able to take full advantage of that opportunity due to an allocation of filled purchase or sale orders across all eligible accounts. To deal with these situations, Nuveen Asset Management has adopted procedures for allocating limited opportunities across multiple accounts.
With respect to many of its clients’ accounts, Nuveen Asset Management determines which broker to use to execute transaction orders, consistent with its duty to seek best execution of the transaction. However, with respect to certain other accounts, Nuveen Asset Management may be limited by the client with respect to the selection of brokers or may be instructed to direct trades through a particular broker. In these cases, Nuveen Asset Management may place separate, non-simultaneous, transactions for a Fund and other accounts which may temporarily affect the market price of the security or the execution of the transaction, or both, to the detriment of the Fund or the other accounts.
Some clients are subject to different regulations. As a consequence of this difference in regulatory requirements, some clients may not be permitted to engage in all the investment techniques or transactions or to engage in these transactions to the same extent as the other accounts managed by a portfolio manager. Finally, the appearance of a conflict of interest may arise where Nuveen Asset Management has an incentive, such as a performance-based management fee, which relates to the management of some accounts, with respect to which a portfolio manager has day-to-day management responsibilities.
Conflicts of interest may also arise when the Sub-Adviser invests one or more of its client accounts in different or multiple parts of the same issuer’s capital structure, including investments in public versus private securities, debt versus equity, or senior versus junior/subordinated debt, or otherwise where there are different or inconsistent rights or benefits. Decisions or actions such as investing, trading, proxy voting, exercising, waiving or amending rights or covenants, workout activity, or serving on a board, committee or other involvement in governance may result in conflicts of interest between clients holding different securities or investments. Generally, individual portfolio managers will seek to act in a manner that they believe serves the best interest of the accounts they manage. In cases where a portfolio manager or team faces a conflict among its client accounts, it will seek to act in a manner that it believes best reflects its overall fiduciary duty, which may result in relative advantages or disadvantages for particular accounts.
Nuveen Asset Management has adopted certain compliance procedures which are designed to address these types of conflicts common among investment managers. However, there is no guarantee that such procedures will detect each and every situation in which a conflict arises.
Nuveen Asset Management or its affiliates, including TIAA, sponsor an array of financial products for retirement and other investment goals, and provide services worldwide to a diverse customer base. Accordingly, from time to time, a Fund may be restricted from purchasing or selling securities, or from engaging in other investment activities because of regulatory, legal or contractual restrictions that arise due to another client account’s investments and/or the internal policies of Nuveen Asset Management, TIAA or its affiliates designed to comply with such restrictions. As a result, there may be periods, for example, when Nuveen Asset Management will not initiate or recommend certain types of transactions in certain securities or instruments with respect to which investment limits have been reached.
The investment activities of Nuveen Asset Management or its affiliates may also limit the investment strategies and rights of the Funds. For example, in certain circumstances where the Funds invest in securities issued by companies that operate in certain regulated industries, in certain emerging or international markets, or are subject to corporate or regulatory ownership definitions, or invest in certain futures and derivative transactions, there may be limits on the aggregate amount invested by Nuveen Asset Management or its affiliates for the Funds and other client accounts that may not be exceeded without the grant of a license or other regulatory or corporate consent. If certain aggregate ownership thresholds are reached or certain transactions undertaken, the ability of Nuveen Asset Management, on behalf of the Funds or other client accounts, to purchase or dispose of investments or exercise rights or undertake business transactions may be restricted by regulation or otherwise impaired. As a result, Nuveen Asset Management, on behalf of the Funds or other client accounts, may limit purchases, sell existing investments, or otherwise restrict or limit the exercise of rights (including voting rights) when Nuveen Asset Management, in its sole discretion, deems it appropriate in light of potential regulatory or other restrictions on ownership or other consequences resulting from reaching investment thresholds.
| ITEM 8(a)(3). | FUND MANAGER COMPENSATION |
As of the most recently completed fiscal year end, the primary Portfolio Managers’ compensation is as follows:
Portfolio manager compensation consists primarily of base salary and variable components consisting of (i) a cash bonus; (ii) a long-term performance award; and (iii) participation in a profits interest plan.
Base salary. A portfolio manager’s base salary is determined based upon an analysis of the portfolio manager’s general performance, experience and market levels of base pay for such position.
Cash bonus. A portfolio manager is eligible to receive an annual cash bonus that is based on three variables: risk-adjusted investment performance relative to benchmark generally measured over the most recent one, three and five year periods (unless the portfolio manager’s tenure is shorter), ranking versus Morningstar peer funds generally measured over the most recent one, three and five year periods (unless the portfolio manager’s tenure is shorter), and management and peer reviews.
Long-term performance award. A portfolio manager is eligible to receive a long-term performance award that vests after three years. The amount of the award when granted is based on the same factors used in determining the cash bonus. The value of the award at the completion of the three-year vesting period is adjusted based on the risk-adjusted investment performance of Fund(s) managed by the portfolio manager during the vesting period and the performance of the TIAA organization as a whole.
Profits interest plan. Portfolio managers are eligible to receive profits interests in Nuveen Asset Management and its affiliate, Teachers Advisors, LLC, which vest over time and entitle their holders to a percentage of the firms’ annual profits. Profits interests are allocated to each portfolio manager based on such person’s overall contribution to the firms.
There are generally no differences between the methods used to determine compensation with respect to the Fund and the Other Accounts shown in the table above.
| ITEM 8(a)(4). | OWNERSHIP OF NXC SECURITIES AS OF FEBRUARY 29, 2024 |
Name of Portfolio Manager | None | $1 - $10,000 | $10,001- $50,000 | $50,001- $100,000 | $100,001- $500,000 | $500,001- $1,000,000 | Over $1,000,000 | |||||||
Scott R. Romans | X | |||||||||||||
Kristen M. DeJong | X |
| ITEM 9. | PURCHASES OF EQUITY SECURITIES BY CLOSED-END MANAGEMENT INVESTMENT COMPANY AND AFFILIATED PURCHASERS. |
Not applicable.
| ITEM 10. | SUBMISSION OF MATTERS TO A VOTE OF SECURITY HOLDERS. |
There have been no material changes to the procedures by which shareholders may recommend nominees to the registrant’s Board implemented after the registrant last provided disclosure in response to this Item.
| ITEM 11. | CONTROLS AND PROCEDURES. |
| (a) | The registrant’s principal executive and principal financial officers, or persons performing similar functions, have concluded that the registrant’s disclosure controls and procedures (as defined in Rule 30a-3(c) under the Investment Company Act of 1940, as amended (the “1940 Act”) (17 CFR 270.30a-3(c))) are effective, as of a date within 90 days of the filing date of this report that includes the disclosure required by this paragraph, based on their evaluation of the controls and procedures required by Rule 30a-3(b) under the 1940 Act (17 CFR 270.30a-3(b)) and Rules 13a-15(b) or 15d-15(b) under the Securities Exchange Act of 1934, as amended (the “Exchange Act”) (17 CFR 240.13a-15(b) or 240.15d-15(b)). |
| (b) | There were no changes in the registrant’s internal control over financial reporting (as defined in Rule 30a-3(d) under the 1940 Act (17 CFR 270.30a-3(d)) that occurred during the period covered by this report that has materially affected, or is reasonably likely to materially affect, the registrant’s internal control over financial reporting. |
| ITEM 12. | DISCLOSURE OF SECURITIES LENDING ACTIVITIES FOR CLOSED-END MANAGEMENT INVESTMENT COMPANIES. |
Not applicable.
| ITEM 13. | EXHIBITS. |
File the exhibits listed below as part of this Form.
(a)(1) Any code of ethics, or amendment thereto, that is the subject of the disclosure required by Item 2, to the extent that the registrant intends to satisfy the Item 2 requirements through filing of an exhibit: Not applicable because the code is posted on registrant’s website at www.nuveen.com/fund-governance and there were no amendments during the period covered by this report. (To view the code, click on Code of Conduct.)
(a)(3) Any written solicitation to purchase securities under Rule 23c-1 under the 1940 Act (17 CFR 270.23c-1) sent or given during the period covered by the report by or on behalf of the registrant to 10 or more persons. Not applicable.
(a)(4) Change in the registrant’s independent public accountant. Not applicable.
(c) Consent of Independent Registered Public Accounting Firm.
SIGNATURES
Pursuant to the requirements of the Securities Exchange Act of 1934 and the Investment Company Act of 1940, the registrant has duly caused this report to be signed on its behalf by the undersigned, thereunto duly authorized.
(Registrant) Nuveen California Select Tax-Free Income Portfolio
| By (Signature and Title) | /s/ David J. Lamb | |
| David J. Lamb | ||
| Chief Administrative Officer |
Date: May 3, 2024
Pursuant to the requirements of the Securities Exchange Act of 1934 and the Investment Company Act of 1940, this report has been signed below by the following persons on behalf of the registrant and in the capacities and on the dates indicated.
| By (Signature and Title) | /s/ David J. Lamb | |
| David J. Lamb | ||
| Chief Administrative Officer | ||
| (principal executive officer) |
Date: May 3, 2024
| By (Signature and Title) | /s/ E. Scott Wickerham | |
| E. Scott Wickerham | ||
| Vice President and Controller | ||
| (principal financial officer) |
Date: May 3, 2024