Life is Complex.
Nuveen makes things e-simple.
It only takes a minute to sign up for e-Reports. Once enrolled, you’ll receive an e-mail as soon as your Nuveen Fund information is ready—no more waiting for delivery by regular mail. Just click on the link within the e-mail to see the report and save it on your computer if you wish.
Free e-Reports
right to your e-mail!
www.investordelivery.com
If you receive your Nuveen Fund
dividends and statements from your
financial advisor or brokerage account.
or
www.nuveen.com/client-access
If you receive your Nuveen Fund
dividends and statements directly from
Nuveen.
NOT FDIC INSURED MAY LOSE
VALUE NO BANK GUARANTEE
3
Chair’s Letterto Shareholders Dear Shareholders,
The COVID-19 crisis is taking an unprecedented toll on our health, societies, economies and financial markets. Our thoughts are with all whose lives have been affected by the disease and its economic fallout. The extreme “social distancing” efforts needed to contain the coronavirus are causing a severe contraction in economic activity and amplifying market volatility, as global supply chains and consumer and business demand have been significantly disrupted. With some regions of the world having appeared to “flatten the curve” of infections, governments and public health officials face the extraordinary challenge of balancing the resumption of economic activity with public safety, in a way that minimizes the potential for a second wave of outbreaks. The spike in market volatility during March and the strong rally that followed in April may be indicative of the large swings in both directions that are likely to continue as markets digest new information and seek more clarity.
While we do not want to understate the dampening effect on the global economy, it is important to differentiate short-term interruptions from the longer-lasting implications to the economy. Some areas of the global economy were already on the mend prior to the coronavirus epidemic. Momentum could pick up again as factories come back online and consumer demand resumes once the virus is under control and temporary bans on movement and travel are lifted. Central banks and governments around the world have announced economic stimulus measures. In the U.S., the Federal Reserve has cut its benchmark interest rate to near zero and introduced programs that helped revive the U.S. economy after the 2008 financial crisis. The U.S. Government has approved three relief packages, including a $2 trillion-dollar package directly supporting businesses and individuals. The Coronavirus Aid, Relief and Economic Security Act, called the CARES Act, provides direct payments and expanded unemployment benefits to individuals, loans and grants to small businesses, loans and other money to large corporations and funding for hospitals, public health, education and state and local governments. Additional aid will likely be approved in the months ahead.
In the meantime, patience and a long-term perspective are key for investors. When market fluctuations are the leading headlines day after day, it’s tempting to “do something.” However, your long-term goals can’t be met with short-term thinking. We encourage you to talk to your financial advisor, who can review your time horizon, risk tolerance and investment goals. On behalf of the other members of the Nuveen Fund Board, we look forward to continuing to earn your trust in the months and years ahead.
Sincerely,
Terence J. Toth
Chair of the Board
May 22, 2020
4
Portfolio Managers’ CommentsNuveen Select Tax-Free Income Portfolio (NXP)Nuveen Select Tax-Free Income Portfolio 2 (NXQ)Nuveen Select Tax-Free Income Portfolio 3 (NXR)Nuveen California Select Tax-Free Income Portfolio (NXC)Nuveen New York Select Tax-Free Income Portfolio (NXN) These Funds feature portfolio management by Nuveen Asset Management, LLC (NAM), an affiliate of Nuveen Fund Advisors, LLC, the Funds’ investment adviser. Portfolio managers Michael S. Hamilton and Scott R. Romans, PhD, discuss U.S. economic and municipal market conditions, key investment strategies and the twelve-month performance of the Nuveen Select Portfolios (the “Funds”). Michael has managed the three national Funds since 2016, while Scott has managed NXC since 2003 and NXN since 2011.
What factors affected the U.S. economy and the national municipal market during the twelve-month reporting period ended March 31, 2020?
The longest economic expansion in U.S. history came to an abrupt halt in early 2020 amid the coronavirus pandemic. To slow the spread of the virus, large portions of the economy were shut down, with companies closing either temporarily or permanently and most of the U.S. population under stay-at-home orders (as of the end of March 2020). The disruption has been swift and severe, and is expected to tip the economy into recession, a several months’ long contraction across the broad economy. For the first quarter of 2020, the Bureau of Economic Analysis reported that annualized gross domestic product (GDP) shrank 4.8%, according to its “advance” estimate. GDP measures the value of goods and services produced by the nation’s economy less the value of the goods and services used up in production, adjusted for price changes. Previously, the economy had been expanding at a moderate clip. GDP grew at an annualized rate of 2.1% in the fourth quarter of 2019 and grew 2.3% in 2019 overall.
Consumer spending, the largest driver of the economy, was well supported earlier in this reporting period by low unemployment, wage gains and tax cuts. However, the coronavirus containment measures drove a significant drop in consumer spending and a sharp rise in unemployment in the final month of the quarter. The Bureau of Labor Statistics said the unemployment rate rose to 4.4% in March 2020 from 3.8% in March 2019 and job gains averaged around 118,000 per month for the past twelve months, as the
This material is not intended to be a recommendation or investment advice, does not constitute a solicitation to buy, sell or hold a security or an investment strategy and is not provided in a fiduciary capacity. The information provided does not take into account the specific objectives or circumstances of any particular investor, or suggest any specific course of action. Investment decisions should be made based on an investor’s objectives and circumstances and in consultation with his or her advisors.
Certain statements in this report are forward-looking statements. Discussions of specific investments are for illustration only and are not intended as recommendations of individual investments. The forward-looking statements and other views expressed herein are those of the portfolio managers as of the date of this report. Actual future results or occurrences may differ significantly from those anticipated in any forward-looking statements, and the views expressed herein are subject to change at any time, due to numerous market and other factors. The Funds disclaim any obligation to update publicly or revise any forward-looking statements or views expressed herein.
For financial reporting purposes, the ratings disclosed are the highest rating given by one of the following national rating agencies: Standard & Poor’s Group (S&P), Moody’s Investors Service, Inc. (Moody’s) or Fitch, Inc. (Fitch). This treatment of split-rated securities may differ from that used for other purposes, such as for Fund investment policies. Credit ratings are subject to change. AAA, AA, A and BBB are investment grade ratings, while BB, B, CCC, CC, C and D are below investment grade ratings. Holdings designated N/R are not rated by these national rating agencies.
Bond insurance guarantees only the payment of principal and interest on the bond when due, and not the value of the bonds themselves, which will fluctuate with the bond market and the financial success of the issuer and the insurer. Insurance relates specifically to the bonds in the portfolio and not to the share prices of a Fund. No representation is made as to the insurers’ ability to meet their commitments.
Refer to the Glossary of Terms Used in this Report for further definition of the terms used within this section.
5
Portfolio Managers’ Comments (continued)
economy lost 701,000 jobs in March 2020. Average hourly earnings grew at an annualized rate of 3.1% in March 2020. However, the overall trend of inflation remained subdued, and registered a notably slower rate in March 2020 due to falling gasoline prices. The Bureau of Labor Statistics said the Consumer Price Index (CPI) increased 1.5% over the twelve-month reporting period ended March 31, 2020 before seasonal adjustment.
Low mortgage rates and low inventory drove home prices moderately higher in this reporting period, although the most recent data do not yet reflect the shutdown. The S&P CoreLogic Case-Shiller U.S. National Home Price Index, which covers all nine U.S. census divisions, was up 4.2% year-over-year in February 2020 (most recent data available at the time this report was prepared). The 10-City and 20-City Composites reported year-over-year increases of 2.9% and 3.5%, respectively.
With economic momentum slowing in 2019 from 2018’s stronger pace, the U.S. Federal Reserve (Fed) left rates unchanged throughout the first half of 2019 then cut rates by 0.25% at each of the July 2019, September 2019 and October 2019 policy committee meetings. Markets registered disappointment with the Fed’s explanation that the rate cuts were a “mid-cycle adjustment,” rather than a prolonged easing period, and its signal that there would be no additional rate cuts in 2019. Also in the latter half of 2019, the Fed announced it would stop shrinking its bond portfolio sooner than scheduled, as well as began buying short-term Treasury bills to help money markets operate smoothly and maintain short-term borrowing rates at low levels. Fed Chairman Powell emphasized that the Treasury bill purchases were not a form of quantitative easing. The Fed continued its Treasury bill buying in January 2020, as well as left its benchmark interest rate unchanged, while noting the emerging coronavirus risks. As the outbreak spread to the U.S. and significant restrictions on social and economic activity were imposed starting in March 2020, the Fed enacted an array of emergency measures to stabilize the financial system and support the markets, including cutting its main interest rate to near zero, offering lending programs to aid small and large companies and allowing unlimited bond purchases, known as quantitative easing. Meanwhile, the U.S. government approved three aid packages, totaling more than $100 billion in funding to health agencies and employers offering paid leave and $2 trillion allocated across direct payments to Americans, an expansion of unemployment insurance, loans to large and small businesses, funding to hospitals and health agencies and support to state and local governments.
While trade and tariff policy drove market sentiment for most of the twelve-month reporting period, the outbreak of the novel coronavirus and its associated disease COVID-19 rapidly dwarfed all other market concerns as the reporting period was closing. Equity and commodity markets sold-off and safe-haven assets rallied as China, other countries and then the United States initiated quarantines, restricted travel and shuttered factories and businesses. The potential economic shock was particularly difficult to assess, which amplified market volatility.
Prior to the virus outbreak, global markets had become more bullish on the outlook for 2020 as trade policy and Brexit appeared to make progress at the end of 2019. The U.S. and China agreed on a partial trade deal, which included rolling back some tariffs, increasing China’s purchases of U.S. agriculture products and the consideration of intellectual property, technology and financial services rights. The “phase one” deal was signed on January 15, 2020. While much of the focus remained on the U.S.-China relationship, trade spats between the U.S. and Mexico, the European Union (EU), Brazil and Argentina also arose throughout the
6
reporting period. In January 2020, the U.S. Congress fully approved the U.S., Mexico and Canada Agreement (USMCA), which replaces the North American Free Trade Agreement. With more clarity on trade deals, the trade-related deterioration in global manufacturing and export data was expected to improve. However, the COVID-19 crisis has since upended those assumptions.
Investors also remained watchful of local political dynamics around the world. In the U.K., the Conservative Party won a large majority in the December 2019 general election and Parliament passed the Brexit Bill days later, facilitating the U.K.’s exit from the EU at the end of January 2020. In Italy, the prime minister unexpectedly resigned in August 2019, and the newly formed coalition government appeared to take a less antagonistic stance towards the EU. Europe’s traditional centrist parties lost seats in the May 2019 Parliamentary elections and populist parties saw marginal gains. Europe also contended with the “yellow vest” protests in France, immigration policy concerns, Russian sanctions and political risk in Turkey. Anti-government protests erupted across Latin America, Hong Kong and Lebanon during 2019. Venezuela’s economic and political crisis deepened. Argentina surprised the market with the return of a less market-friendly administration. Brazil’s Bolsonaro administration achieved a legislative win on pension reform and kept the economy on a path of modest growth. The ruling parties in India and South Africa maintained their majorities, where slower economic growth could complicate their respective reform mandates.
Despite the severe sell-off in March 2020, municipal bonds managed positive performance over the twelve-month reporting period. For most of the reporting period, a significant decline in interest rates drove municipal bond prices higher, with positive technical and fundamental conditions also supporting credit spread tightening. Prior to the emergence of the novel coronavirus, interest rates had been pressured lower by signs that the economy’s momentum was slowing, a more dovish central bank policy, geopolitical tensions (especially regarding trade) and bouts of equity market volatility. Then, from late February through March 2020, coronavirus risks permeated the markets, sending U.S. Treasury yields to historic lows. Rate volatility increased sharply in that six-week period. As liquidity became stressed, investors began to liquidate any asset possible, including municipal bonds. Municipal bond prices declined rapidly, amid rampant selling across both the high grade and high yield segments that was exacerbated in some cases by exchange-traded fund and closed-end fund selling. Credit spreads widened significantly during the March 2020 sell-off, ending the month above their long-term average. In the final weeks of the reporting period, monetary and fiscal interventions from the Fed and U.S. government helped the market stabilize, although prices remained meaningfully off their pre-crisis levels. The U.S. Treasury yield curve flattened overall, with a portion of the curve temporarily inverting (i.e. longer rates were lower than shorter rates, the opposite of normal) from late August 2019 to late September 2019. The municipal yield curve also flattened overall during the reporting period, as yields on longer maturities fell more than those of shorter maturities.
Prior to the market turmoil in March 2020, municipal bond gross issuance nationwide had been robust. The overall low level of interest rates encouraged issuers to continue to actively refund their outstanding debt. In these transactions the issuers are issuing new bonds and taking the bond proceeds and redeeming (calling) old bonds. These refunding transactions have ranged from 30% to 60% of total issuance over the past few years. Thus, the net issuance (all bonds issued less bonds redeemed) is actually much lower than the gross issuance. So, while gross issuance volume has been adequate, the net has not and this was an overall positive technical factor on municipal bond investment performance in recent years. Notably, taxable municipal bond issuance increased
7
Portfolio Managers’ Comments (continued)
meaningfully in 2019. The Tax Cut and Jobs Act of 2017 prohibits municipal issuers from issuing new tax-exempt bonds to pre-refund existing tax-exempt bonds. However, municipalities have taken advantage of the low interest rate environment and the strong demand for yield to issue taxable municipal debt, enabling them to save on net interest costs.
Demand for municipal bonds was strong for most of this reporting period. Municipal bonds took in consistently positive cash flows in calendar year 2019 and the first two months of 2020. However, fund flows turned more volatile in March 2020, as markets began to digest the coronavirus impact. Low interest rates in the U.S. and globally have continued to drive investors toward higher after-tax yielding assets, including U.S. municipal bonds. Additionally, as tax payers have begun to assess the impact of the 2017 tax law, which caps the state and local tax (SALT) deduction for individuals, there has been increased demand for tax-exempt municipal bonds in 2019 to date, especially in states with high income taxes and/or property taxes.
How were the economic and market environments in California and New York during the twelve-month reporting period ended March 31, 2020?
California’s $2.7 trillion economy is the largest in the United States and ranks fifth in the world, according to the International Monetary Fund. California job growth continues to outpace the national average, but at a slower pace as the economy enters late stage expansion. California’s economy is driven by high technology, international trade and tourism but is also supplemented by better residential construction and real estate conditions. The state’s unemployment rate was 5.3% as of March 2020, up from 4.2% the year prior, and the gap between California and the nation’s 4.4% unemployment rate increased. According to the S&P CoreLogic Case-Shiller Index, home prices in San Diego, Los Angeles and San Francisco rose 4.6%, 3.7% and 3.4%, respectively, over the twelve months ended February 2020 (most recent data available at the time this report was prepared), compared with an average increase of 4.2% nationally. The enacted Fiscal Year 2020 (Fiscal Year end is June 30, 2020) general fund budget totals $147.8 billion, which is 3.6% higher than the revised Fiscal Year 2019 budget and 69% higher than the 2010 budget. Strong revenue growth due to a strengthening economy and stock market have enhanced the state’s fiscal position. The budget pays down budgetary debts, makes supplemental payments to pay down unfunded retiree liabilities and funds new affordable housing efforts and education. It also transfers $2.2 billion to the rainy day fund, increasing it to $16.5 billion (or 10% of general fund revenues) for Fiscal Year 2020. Due to the COVID-19 crisis, the state’s budget will be impacted to a varying degree as tax receipts are reduced and the expense to fight the virus increases (subsequent to the end of the reporting period, California announced a $54 billion budget deficit). As of February 2020, Standard & Poor’s affirmed its AA-/Stable rating and outlook on California general obligation (GO) debt and Moody’s Investors Service affirmed its state GO rating of Aa2 with a stable outlook. Moody’s upgraded the State’s GO on October 14, 2019 to Aa2, citing its “continued expansion of the state's massive, diverse and dynamic economy and corresponding growth in revenue. The action also recognizes the state government's disciplined approach to managing revenue growth indicated by its use of surplus funds to build reserves and pay down long-term liabilities.”
New York State’s $1.7 trillion economy represents 8.0% of U.S. gross domestic product and, according to the International Monetary Fund, would be the eleventh largest economy in the world on a stand-alone basis. As of March 2020, the state’s unemployment rate registered 4.5%, slightly above the national average of 4.4% for the same period. Prior to the COVID-19 crisis, New York State’s financial profile had generally improved over the past decade, though Fiscal Year 2019 did post a General Fund deficit. On a significant positive note, New York State has collected approximately $12.7 billion in various settlements and assessments from the financial industry for alleged past misconduct. Proceeds from those settlements have been used to bolster reserves, foster economic development upstate and provide funds for the replacement of the Tappan Zee Bridge. On April 2, 2020 (subsequent to the close of
8
this reporting period), the State adopted a $177 billion budget for Fiscal Year 2021, which is 0.9% larger than the adopted budget for Fiscal Year 2020 (New York State Fiscal Year End was March 31, 2020). The Fiscal Year 2021 budget contains appropriations for all State debt service, no new taxes and holds school funding basically level. In response to the uncertainty surrounding the impact of the COVID-19 crisis, the budget legislation authorizes up to $11 billion of borrowing if necessary and also authorizes the State Budget Director to make spending reductions should they be required. While revenue shortfalls and expenditure reductions seem likely, the extent of these is unknown at this time and will be influenced by such variables as the length of the crisis and the amount of federal aid received. New York is a high-income state, with per-capita income at 126% of the U.S. average, third-highest among the 50 states. New York is a heavily indebted state. According to Moody’s, New York ranked 5th in the nation in debt per capita in 2018 (NY: $3,247; median: $1,068), 8th in debt per capita as a percentage of personal income (NY: 5.0%; median: 2.2%) and 9th in debt to gross state domestic product (NY: 3.9%; median: 2.1%). The state’s pensions have traditionally been well funded, with a combined funding ratio of 98.6% in Fiscal Year 2019. On April 9, 2020 (subsequent to the close of this reporting period), Moody’s affirmed its “Aa1” rating on New York State, but changed its outlook to negative citing the uncertainty surrounding the revenue impacts of the COVID-19 crisis. S&P confirmed its “AA+” rating and stable outlook for New York State on April 17, 2020 (subsequent to the close of this reporting period), citing the State’s strong financial management. Due to the COVID-19 crisis, the state’s budget will be impacted to a varying degree as tax receipts are reduced and the expense to fight the virus increases.
What key strategies were used to manage the Funds during the twelve-month reporting period ended March 31, 2020?
Each Fund seeks to provide current income and stable dividends, exempt from regular federal and designated state income taxes, where applicable, consistent with the preservation of capital by investing primarily in a portfolio of municipal obligations. Under normal market conditions, NXC and NXN invests at least 80% of the sum of its net assets and the amount of any borrowings for investment purposes in municipal bonds that pay interest that is exempt from regular federal personal income tax and a single state’s personal income tax. The Funds may invest up to 20% in municipal securities that are exempt from regular federal income tax, but not from that single state’s income tax if, in the Portfolio Manager’s judgement, such purchases are expected to enhance the Fund’s after-tax total return potential. To the extent that the Funds invest in bonds of municipal issuers located in other states, each Fund may have income that is not exempt from state personal income tax.
For most of the reporting period, a favorable macroeconomic backdrop, strong demand, narrowing credit spreads and falling interest rates supported municipal bond performance. However, the coronavirus pandemic and the shutdown of the economy introduced significant uncertainty about the future of economic growth and impact to municipal credit fundamentals. As the nearer-term impacts began to materialize, we looked for relative value and income enhancement opportunities among credits we believe may demonstrate resilience over the long term.
The three national Funds bought a mix of both long (22 years and longer) and short (5 years and shorter) duration bonds, as we were comfortable with the overall portfolio duration. We also tactically purchased variable rate demand notes (VRDNs) in March 2020, when short-term yields for VRDNs temporarily spiked. To fund our buying in the reporting period, we used the proceeds from maturing and called bonds, as well as from the sale of very short maturity (less than one year) paper. While we did not make major changes to the three Funds’ overall positioning, we would note that the Funds’ tobacco exposure declined during the reporting period. The state of Ohio called its legacy Buckeye Tobacco settlement bonds, which NXP, NXQ and NXR owned, and while we purchased some of the replacement bonds it was at a lower allocation than the original position.
9
Portfolio Managers’ Comments (continued)
In addition, NXP, NXQ and NXR now hold Energy Harbor common stock, after FirstEnergy Solutions successfully emerged from bankruptcy and the restructured company was renamed Energy Harbor. The Fund received Energy Harbor stock when its holding of bonds issued by FirstEnergy Solutions was converted into Energy Harbor equity as part of its debt reorganization and emergence from bankruptcy protection, which was completed in February 2020. Over time, we expect to sell these shares and reinvest the proceeds into municipal bonds.
The two state Funds’ overall positioning remained stable throughout the reporting period. Marginal changes included rotating some of NXC’s and NXN’s exposure out of their respective state’s tobacco settlement bonds and into Puerto Rico bonds, which offered a relatively more favorable long-term credit outlook. Although we continued to emphasize 5% coupon bonds, the California municipal market provided opportunities for NXC to add 3% to 4% coupon structures in this reporting period. Before the health crisis, NXC added some relative value opportunities in lower rated housing, airline facilities and airports. Called and maturing bonds provided most of the proceeds to buy new bonds. NXC also sold some state general obligation (GO) bonds that were overvalued. When the market came under stress toward the end of the reporting period, we took advantage of price dislocations to sell high grade, lower yielding paper and buy lower rated, higher yielding multi-family housing, charter school and toll road bonds. Market conditions in March 2020 were also favorable for one-for-one bond exchanges, where we sold depreciated bonds to buy similarly structured bonds offering higher yields and capture tax advantages for the Fund. We used this exchanging strategy principally in NXC’s Puerto Rico holdings.
Trading in NXN was less active compared to NXC, due to differences in the two states’ market opportunities. Like the California Fund, the New York Fund also rotated some of its tobacco exposure into Puerto Rico bonds earlier in the reporting period. Pre-crisis, we purchased lower rated, higher yielding real estate-backed bonds in New York City and some education credits, funded mainly from the proceeds of called and maturing bonds. In the market sell-off, we also sold LaGuardia airport bonds backed by airlines’ leases at a loss and bought the same names offering higher yields, to support the Fund’s income earnings capability and capture tax efficiencies for the portfolio.
As of March 31, 2020, NXN continued to use inverse floating rate securities, while NXP and NXQ unwound the use of inverse floating rate securities during the reporting period. We employ inverse floaters for a variety of reasons, including duration management, income enhancement and total return enhancement.
How did the Funds perform during the twelve-month reporting period ended March 31, 2020?
The tables in the Funds’ Performance Overview and Holding Summaries section of this report provide the Funds’ total return for the one-year, five-year and ten-year periods ended March 31, 2020. The Funds’ total returns on common share net asset value (NAV) are compared with the performance of corresponding market indexes.
For the twelve months ended March 31, 2020, the total returns on common share NAV for NXC outperformed the national S&P Municipal Bond Index’s return and the California state index’s returns, and NXN underperformed the national S&P Municipal Bond Index’s return and the New York state index’s returns. The three national Funds, NXP, NXQ and NXR, outperformed the national S&P Municipal Bond Index during the twelve-month period reporting period.
10
The factors affecting performance in this reporting period included duration and yield curve positioning, credit ratings allocations and sector positioning. In addition, the use of leverage through inverse floating rate securities affected the performance of NXP, NXQ and NXN. NXR and NXC did not use leverage in this reporting period.
Duration and yield curve positioning was favorable for the three national Funds. In all three Funds, an underweight allocation to 8 years and shorter durations and an overweight allocation to the longest durations added value. NXC also benefited from its positioning emphasizing longer durations, as the longer duration bonds outperformed. For NXN, duration and yield curve positioning was a less meaningful positive contributor. NXN also emphasized longer duration bonds, but in New York’s municipal market, the intermediate range (6 to 10 years) performed best, followed by 10 years and longer, while shorter durations were the weakest performing segment.
Credit quality allocation contributed marginally to NXP’s relative performance but detracted from the relative performance of NXQ and NXR. NXP’s holdings in longer duration AA and BBB rated bonds were well positioned for the prevailing market conditions, which helped offset the drag from credit spread widening. For NXQ, NXR, NXC and NXN, their allocations to lower rated, higher yielding bonds were hurt by the significant credit spread widening in March 2020, which offset the benefit of the prior 11 months of spread narrowing. NXQ and NXR had particularly unfavorable results from bonds rated BBB and lower, while NXC and NXN were most affected by bonds rated single A and lower. Timing issues also explain some of NXQ and NXR’s lagging performance, i.e., bonds bought in February 2020 were among the weaker performers.
Sector allocation was the strongest positive contributor to the three national Funds in this reporting period. NXP and NXR benefited from holdings in the tax supported sector, especially dedicated tax and incremental tax bonds. The two Funds were overweight in both the dedicated tax and incremental tax subsectors, as well as held longer duration bonds within those sectors, and this positioning was advantageous to performance. Likewise, NXQ was aided by an overweight in the dedicated tax subsector and the long duration bonds held within the subsector. The local GO sector also helped NXQ’s relative performance, as an underweight to this lagging sector was beneficial, as were our holdings of longer duration local GO bonds that outperformed. NXC had favorable results from the tax supported and health care sectors, and NXN’s allocations to the utilities, tax supported and multi-family housing sectors added value.
11
COMMON SHARE DISTRIBUTION INFORMATION
The following information regarding the Funds’ distributions is current as of March 31, 2020. Each Fund’s distribution levels may vary over time based on each Fund’s investment activity and portfolio investment value changes.
During the current reporting period, each Fund’s distributions to common shareholders were as shown in the accompanying table.
| | | | | | | | | | | | | | | | |
| | | Per Common Share Amounts
| |
| Monthly Distributions (Ex-Dividend Date) | | NXP | | | NXQ | | | NXR | | | NXC | | | NXN | |
April 2019 | | $ | 0.0455 | | | $ | 0.0420 | | | $ | 0.0435 | | | $ | 0.0410 | | | $ | 0.0395 | |
May | | | 0.0455 | | | | 0.0420 | | | | 0.0435 | | | | 0.0410 | | | | 0.0395 | |
June | | | 0.0455 | | | | 0.0420 | | | | 0.0435 | | | | 0.0437 | | | | 0.0395 | |
July | | | 0.0455 | | | | 0.0420 | | | | 0.0435 | | | | 0.0437 | | | | 0.0395 | |
August | | | 0.0455 | | | | 0.0420 | | | | 0.0435 | | | | 0.0437 | | | | 0.0395 | |
September | | | 0.0455 | | | | 0.0420 | | | | 0.0435 | | | | 0.0437 | | | | 0.0395 | |
October | | | 0.0455 | | | | 0.0420 | | | | 0.0435 | | | | 0.0437 | | | | 0.0395 | |
November | | | 0.0455 | | | | 0.0420 | | | | 0.0435 | | | | 0.0437 | | | | 0.0395 | |
December | | | 0.0455 | | | | 0.0420 | | | | 0.0435 | | | | 0.0437 | | | | 0.0395 | |
January | | | 0.0455 | | | | 0.0420 | | | | 0.0435 | | | | 0.0437 | | | | 0.0395 | |
February | | | 0.0455 | | | | 0.0420 | | | | 0.0435 | | | | 0.0437 | | | | 0.0395 | |
March 2020 | | | 0.0455 | | | | 0.0420 | | | | 0.0435 | | | | 0.0437 | | | | 0.0395 | |
| Total Distributions from Net Investment Income | | $ | 0.5460 | | | $ | 0.5040 | | | $ | 0.5220 | | | $ | 0.5190 | | | $ | 0.4740 | |
| | |
| Yields | | | | | | | | | | | | | | | | | | | | |
Market Yield* | | | 3.65 | % | | | 3.55 | % | | | 3.39 | % | | | 3.62 | % | | | 3.75 | % |
Taxable-Equivalent Yield* | | | 6.11 | % | | | 5.91 | % | | | 5.70 | % | | | 7.88 | % | | | 7.42 | % |
| |
| * Market Yield is based on the Fund’s current annualized monthly dividend divided by the Fund’s current market price as of the end of the reporting period. Taxable-Equivalent Yield represents the yield that must be earned on a fully taxable investment in order to equal the yield of the Fund on an after-tax basis. It is based on a combined federal and state income tax rate of 40.8%, 40.8%, 40.8%, 54.1% and 49.6% for NXP, NXQ, NXR, NXC and NXN, respectively. Your actual combined federal and state income tax rate may differ from the assumed rate. The Taxable-Equivalent Yield also takes into account the percentage of the Fund’s income generated and paid by the Fund (based on payments made during the previous calendar year) that was either exempt from federal income tax but not from state income tax (e.g., income from an out-of-state municipal bond), or was exempt from neither federal nor state income tax. Separately, if the comparison were instead to investments that generate qualified dividend income, which is taxable at a rate lower than an individual’s ordinary graduated tax rate, the fund’s Taxable-Equivalent Yield would be lower. |
Each Fund seeks to pay regular monthly dividends out of its net investment income at a rate that reflects its past and projected net income performance. To permit each Fund to maintain a more stable monthly dividend, the Fund may pay dividends at a rate that may be more or less than the amount of net income actually earned by the Fund during the period. Distributions to common shareholders are determined on a tax basis, which may differ from amounts recorded in the accounting records. In instances where the monthly dividend exceeds the earned net investment income, the Fund would report a negative undistributed net ordinary income. Refer to Note 6 – Income Tax Information for additional information regarding the amounts of undistributed net ordinary income and undistributed net long-term capital gains and the character of the actual distributions paid by the Fund during the period.
12
All monthly dividends paid by each Fund during the current reporting period were paid from net investment income. If a portion of the Fund’s monthly distributions is sourced or comprised of elements other than net investment income, including capital gains and/or a return of capital, common shareholders will be notified of those sources. For financial reporting purposes, the per share amounts of the Fund’s distributions for the reporting period are presented in this report’s Financial Highlights. For income tax purposes, distribution information for each Fund as of its most recent tax year end is presented in Note 6 – Income Tax Information within the Notes to Financial Statements of this report.
CHANGE IN METHOD OF PUBLISHING NUVEEN CLOSED-END FUND DISTRIBUTION AMOUNTS
During November 2019, the Nuveen Closed-End Funds discontinued the practice of announcing Fund distribution amounts and timing via press release. Instead, information about the Nuveen Closed-End Funds’ monthly and quarterly periodic distributions to shareholders will be posted and can be found on Nuveen’s enhanced closed-end fund resource page, which is at www.nuveen.com/closed-end-fund-distributions, along with other Nuveen closed-end fund product updates. Shareholders can expect regular distribution information to be posted on www.nuveen.com on the first business day of each month. To ensure that our shareholders have timely access to the latest information, a subscribe function can be activated at this link here, or at this web page (www.nuveen.com/en-us/people/about-nuveen/for-the-media).
COMMON SHARE REPURCHASES
During August 2019, the Funds’ Board of Trustees reauthorized an open-market common share repurchase program, allowing each Fund to repurchase an aggregate of up to approximately 10% of its outstanding common shares.
As of March 31, 2020, and since the inception of the Funds’ repurchase programs, the Funds have cumulatively repurchased and retired their outstanding common shares as shown in the accompanying table.
| | | | | | |
| NXP | NXQ | NXR | NXC | NXN |
Common shares cumulatively repurchased and retired | — | — | — | — | — |
Common shares authorized for repurchase | 1,655,000 | 1,770,000 | 1,305,000 | 635,000 | 390,000 |
During the current reporting period, the Funds did not repurchase any of their outstanding common shares.
OTHER COMMON SHARE INFORMATION
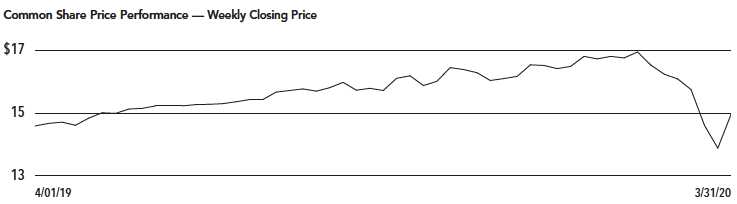
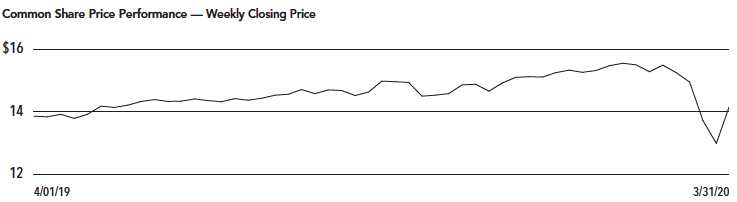
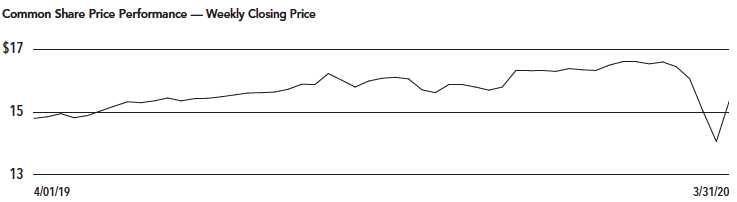
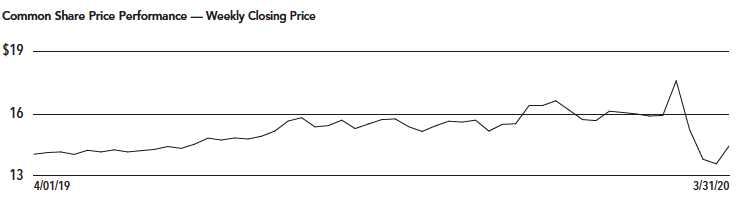
As of March 31, 2020, and during the current reporting period, the Funds’ common share prices were trading at a premium/ (discount) to their common share NAVs as shown in the accompanying table.
| | | | | | | | | | | | | | | | |
| | NXP | | | NXQ | | | NXR | | | NXC | | | NXN | |
Common share NAV | | $ | 15.77 | | | $ | 15.03 | | | $ | 16.28 | | | $ | 15.43 | | | $ | 13.99 | |
Common share price | | $ | 14.97 | | | $ | 14.21 | | | $ | 15.40 | | | $ | 14.50 | | | $ | 12.65 | |
Premium/(Discount) to NAV | | | (5.07 | )% | | | (5.46 | )% | | | (5.41 | )% | | | (6.03 | )% | | | (9.58 | )% |
12-month average premium/(discount) to NAV | | | (1.71 | )% | | | (4.20 | )% | | | (3.89 | )% | | | (2.69 | )% | | | (3.79 | )% |
13
Risk Considerations and Investment Policy Updates
Risk Considerations
Fund common shares are not guaranteed or endorsed by any bank or other insured depository institution, and are not federally insured by the Federal Deposit Insurance Corporation.
Nuveen Select Tax-Free Income Portfolio (NXP)
Investing in closed-end funds involves risk; principal loss is possible. There is no guarantee the Fund’s investment objectives will be achieved. Closed-end fund common shares may frequently trade at a discount or premium to their net asset value. Debt or fixed income securities such as those held by the Fund, are subject to market risk, credit risk, interest rate risk, derivatives risk, liquidity risk, and income risk. As interest rates rise, bond prices fall. These and other risk considerations such as tax risk are described in more detail on the Fund’s web page at www.nuveen.com/NXP.
Nuveen Select Tax-Free Income Portfolio 2 (NXQ)
Investing in closed-end funds involves risk; principal loss is possible. There is no guarantee the Fund’s investment objectives will be achieved. Closed-end fund common shares may frequently trade at a discount or premium to their net asset value. Debt or fixed income securities such as those held by the Fund, are subject to market risk, credit risk, interest rate risk, derivatives risk, liquidity risk, and income risk. As interest rates rise, bond prices fall. These and other risk considerations such as tax risk are described in more detail on the Fund’s web page at www.nuveen.com/NXQ.
Nuveen Select Tax-Free Income Portfolio 3 (NXR)
Investing in closed-end funds involves risk; principal loss is possible. There is no guarantee the Fund’s investment objectives will be achieved. Closed-end fund common shares may frequently trade at a discount or premium to their net asset value. Debt or fixed income securities such as those held by the Fund, are subject to market risk, credit risk, interest rate risk, derivatives risk, liquidity risk, and income risk. As interest rates rise, bond prices fall. These and other risk considerations such as tax risk are described in more detail on the Fund’s web page at www.nuveen.com/NXR.
Nuveen California Select Tax-Free Income Portfolio (NXC)
Investing in closed-end funds involves risk; principal loss is possible. There is no guarantee the Fund’s investment objectives will be achieved. Closed-end fund common shares may frequently trade at a discount or premium to their net asset value. Debt or fixed income securities such as those held by the Fund, are subject to market risk, credit risk, interest rate risk, derivatives risk, liquidity risk, and income risk. As interest rates rise, bond prices fall. State concentration makes the Fund more susceptible to local adverse economic, political, or regulatory changes affecting municipal bond issuers. These and other risk considerations such as tax risk are described in more detail on the Fund’s web page at www.nuveen.com/NXC.
Nuveen New York Select Tax-Free Income Portfolio (NXN)
Investing in closed-end funds involves risk; principal loss is possible. There is no guarantee the Fund’s investment objectives will be achieved. Closed-end fund common shares may frequently trade at a discount or premium to their net asset value. Debt or fixed income securities such as those held by the Fund, are subject to market risk, credit risk, interest rate risk, derivatives risk, liquidity risk, and income risk. As interest rates rise, bond prices fall. State concentration makes the Fund more susceptible to local adverse economic, political, or regulatory changes affecting municipal bond issuers. These and other risk considerations such as tax risk are described in more detail on the Fund’s web page at www.nuveen.com/NXN.
14
Investment Policy Updates
New Temporary Investment Policy
NXC and NXN have adopted the following policy regarding its temporary investments.
NXC and NXN may temporarily depart from its normal investment policies and strategies – for instance, by allocating up to 100% of its assets to cash equivalents, short-term investments, or municipal bonds that do not comply with a Fund’s Name Policy – in response to adverse or unusual market, economic, political or other conditions. Such conditions could include a temporary decline in the availability of municipal bonds that comply with a Fund’s Name Policy. During these periods, the weighted average maturity of a Fund’s investment portfolio may fall below the defined range described in the respective Fund Summary under “Principal Investment Strategies” and a Fund may not achieve its investment objective to distribute income that is exempt from regular federal and state personal income tax.
15
| | |
| NXP | Nuveen Select Tax-Free Income Portfolio |
| Performance Overview and Holding Summaries as of March 31, 2020 |
| | | | |
Refer to the Glossary of Terms Used in this Report for further definition of the terms used within this section. |
| Average Annual Total Returns as of March 31, 2020 |
|
| Average Annual |
| 1-Year | 5-Year | 10-Year |
NXP at Common Share NAV | 5.19% | 4.46% | 5.31% |
NXP at Common Share Price | 5.89% | 4.50% | 4.54% |
S&P Municipal Bond Index | 3.78% | 3.17% | 4.21% |
Past performance is not predictive of future results. Current performance may be higher or lower than the data shown. Returns do not reflect the deduction of taxes that shareholders may have to pay on Fund distributions or upon the sale of Fund shares. Returns at NAV are net of Fund expenses, and assume reinvestment of distributions. Comparative index return information is provided for the Fund’s shares at NAV only. Indexes are not available for direct investment.
16
This data relates to the securities held in the Fund’s portfolio of investments as of the end of the reporting period. It should not be construed as a measure of performance for the Fund itself. Holdings are subject to change.
For financial reporting purposes, the ratings disclosed are the highest rating given by one of the following national rating agencies: Standard & Poor’s Group, Moody’s Investors Service, Inc. or Fitch, Inc. This treatment of split-rated securities may differ from that used for other purposes, such as for Fund investment policies. Credit ratings are subject to change. AAA, AA, A and BBB are investment grade ratings; BB, B, CCC, CC, C and D are below-investment grade ratings. Holdings designated N/R are not rated by these national rating agencies.
| | |
| Fund Allocation | |
| (% of net assets) | |
Long-Term Municipal Bonds | 98.3% |
Common Stocks | 0.3% |
Short-Term Municipal Bonds | 0.8% |
Other Assets Less Liabilities | 0.6% |
| Net Assets | 100% |
| | |
| Portfolio Credit Quality | |
| (% of total investment exposure) | |
U.S. Guaranteed | 7.9% |
AAA | 6.0% |
AA | 38.8% |
A | 26.6% |
BBB | 12.0% |
BB or Lower | 6.2% |
N/R (not rated) | 2.2% |
N/A (not applicable) | 0.3% |
| Total | 100% |
| | |
| Portfolio Composition | |
| (% of total investments) | |
Tax Obligation/Limited | 31.0% |
Tax Obligation/General | 16.0% |
Transportation | 14.8% |
Health Care | 12.4% |
Education and Civic Organizations | 7.7% |
U.S. Guaranteed | 5.4% |
Other | 12.7% |
| Total | 100% |
| | |
| States and Territories | |
| (% of total municipal bonds) | |
California | 16.1% |
Texas | 10.8% |
Illinois | 10.5% |
New Jersey | 10.0% |
Colorado | 6.0% |
Connecticut | 5.4% |
Massachusetts | 4.1% |
Washington | 3.9% |
Missouri | 2.8% |
Virginia | 2.6% |
Iowa | 2.5% |
Guam | 2.5% |
Ohio | 2.1% |
Arizona | 2.1% |
Other | 18.6% |
| Total | 100% |
17
| | |
| NXQ | Nuveen Select Tax-Free Income Portfolio 2 |
| Performance Overview and Holding Summaries as of March 31, 2020 |
| | | | |
Refer to the Glossary of Terms Used in this Report for further definition of the terms used within this section.
|
Average Annual Total Returns as of March 31, 2020
|
|
| Average Annual |
| 1-Year | 5-Year | 10-Year |
NXQ at Common Share NAV | 4.52% | 4.10% | 5.22% |
NXQ at Common Share Price | 5.57% | 4.17% | 4.59% |
S&P Municipal Bond Index | 3.78% | 3.17% | 4.21% |
Past performance is not predictive of future results. Current performance may be higher or lower than the data shown. Returns do not reflect the deduction of taxes that shareholders may have to pay on Fund distributions or upon the sale of Fund shares. Returns at NAV are net of Fund expenses, and assume reinvestment of distributions. Comparative index return information is provided for the Fund’s shares at NAV only. Indexes are not available for direct investment.
18
This data relates to the securities held in the Fund’s portfolio of investments as of the end of the reporting period. It should not be construed as a measure of performance for the Fund itself. Holdings are subject to change.
For financial reporting purposes, the ratings disclosed are the highest rating given by one of the following national rating agencies: Standard & Poor’s Group, Moody’s Investors Service, Inc. or Fitch, Inc. This treatment of split-rated securities may differ from that used for other purposes, such as for Fund investment policies. Credit ratings are subject to change. AAA, AA, A and BBB are investment grade ratings; BB, B, CCC, CC, C and D are below-investment grade ratings. Holdings designated N/R are not rated by these national rating agencies.
| | |
| Fund Allocation | |
| (% of net assets) | |
Long-Term Municipal Bonds | 97.0% |
Common Stocks | 0.3% |
Short-Term Municipal Bonds | 2.0% |
Other Assets Less Liabilities | 0.7% |
| Net Assets | 100% |
| | |
| Portfolio Credit Quality | |
| (% of total investment exposure) | |
U.S. Guaranteed | 6.9% |
AAA | 6.4% |
AA | 31.1% |
A | 34.2% |
BBB | 14.3% |
BB or Lower | 5.1% |
N/R (not rated) | 1.7% |
N/A (not applicable) | 0.3% |
| Total | 100% |
| | |
| Portfolio Composition | |
| (% of total investments) | |
Tax Obligation/Limited | 22.6% |
Tax Obligation/General | 20.9% |
Transportation | 19.6% |
Health Care | 14.8% |
Education and Civic Organizations | 6.3% |
Other | 15.8% |
| Total | 100% |
| | |
| States and Territories | |
| (% of total municipal bonds) | |
California | 15.6% |
Texas | 10.6% |
Illinois | 9.9% |
Colorado | 7.1% |
Massachusetts | 6.5% |
Washington | 4.9% |
Arizona | 4.7% |
Florida | 4.6% |
Connecticut | 3.3% |
Pennsylvania | 3.0% |
New Jersey | 2.5% |
Wisconsin | 2.5% |
Indiana | 2.5% |
Louisiana | 2.4% |
Other | 19.9% |
| Total | 100% |
19
| | |
| NXR | Nuveen Select Tax-Free Income Portfolio 3 |
| Performance Overview and Holding Summaries as of March 31, 2020 |
| | | | |
Refer to the Glossary of Terms Used in this Report for further definition of the terms used within this section.
|
Average Annual Total Returns as of March 31, 2020
|
|
| Average Annual |
| 1-Year | 5-Year | 10-Year |
NXR at Common Share NAV | 6.02% | 4.71% | 5.56% |
NXR at Common Share Price | 8.05% | 4.53% | 5.04% |
S&P Municipal Bond Index | 3.78% | 3.17% | 4.21% |
Past performance is not predictive of future results. Current performance may be higher or lower than the data shown. Returns do not reflect the deduction of taxes that shareholders may have to pay on Fund distributions or upon the sale of Fund shares. Returns at NAV are net of Fund expenses, and assume reinvestment of distributions. Comparative index return information is provided for the Fund’s shares at NAV only. Indexes are not available for direct investment.
20
This data relates to the securities held in the Fund’s portfolio of investments as of the end of the reporting period. It should not be construed as a measure of performance for the Fund itself. Holdings are subject to change.
For financial reporting purposes, the ratings disclosed are the highest rating given by one of the following national rating agencies: Standard & Poor’s Group, Moody’s Investors Service, Inc. or Fitch, Inc. This treatment of split-rated securities may differ from that used for other purposes, such as for Fund investment policies. Credit ratings are subject to change. AAA, AA, A and BBB are investment grade ratings; BB, B, CCC, CC, C and D are below-investment grade ratings. Holdings designated N/R are not rated by these national rating agencies.
| | |
| Fund Allocation | |
| (% of net assets) | |
Long-Term Municipal Bonds | 98.4% |
Common Stocks | 0.3% |
Short-Term Municipal Bonds | 0.5% |
Other Assets Less Liabilities | 0.8% |
| Net Assets | 100% |
| | |
| Portfolio Credit Quality | |
| (% of total investment exposure) | |
U.S. Guaranteed | 14.3% |
AAA | 2.2% |
AA | 33.7% |
A | 29.2% |
BBB | 13.3% |
BB or Lower | 4.7% |
N/R (not rated) | 2.3% |
N/A (not applicable) | 0.3% |
| Total | 100% |
| | |
| Portfolio Composition | |
| (% of total investments) | |
Tax Obligation/Limited | 24.6% |
Tax Obligation/General | 21.0% |
Transportation | 15.4% |
Health Care | 9.7% |
U.S. Guaranteed | 9.3% |
Water and Sewer | 6.5% |
Education and Civic Organizations | 5.3% |
Other | 8.2% |
| Total | 100% |
| | |
| States and Territories | |
| (% of total municipal bonds) | |
California | 25.3% |
Texas | 9.6% |
Illinois | 8.9% |
Massachusetts | 7.2% |
Washington | 5.0% |
Pennsylvania | 4.8% |
Colorado | 4.4% |
Connecticut | 3.7% |
Ohio | 3.7% |
New Jersey | 2.9% |
Virginia | 2.9% |
Florida | 2.5% |
Other | 19.1% |
| Total | 100% |
21
| | |
| NXC | Nuveen California Select Tax-Free |
| Income Portfolio |
| Performance Overview and Holding Summaries as of March 31, 2020 |
| | | | |
Refer to the Glossary of Terms Used in this Report for further definition of the terms used within this section. |
| Average Annual Total Returns as of March 31, 2020 |
|
| Average Annual |
| 1-Year | 5-Year | 10-Year |
NXC at Common Share NAV | 4.86% | 3.94% | 5.67% |
NXC at Common Share Price | 6.26% | 2.91% | 5.86% |
S&P Municipal Bond California Index | 3.97% | 3.29% | 4.79% |
S&P Municipal Bond Index | 3.78% | 3.17% | 4.21% |
Past performance is not predictive of future results. Current performance may be higher or lower than the data shown. Returns do not reflect the deduction of taxes that shareholders may have to pay on Fund distributions or upon the sale of Fund shares. Returns at NAV are net of Fund expenses, and assume reinvestment of distributions. Comparative index return information is provided for the Fund’s shares at NAV only. Indexes are not available for direct investment.
22
This data relates to the securities held in the Fund’s portfolio of investments as of the end of the reporting period. It should not be construed as a measure of performance for the Fund itself. Holdings are subject to change.
For financial reporting purposes, the ratings disclosed are the highest rating given by one of the following national rating agencies: Standard & Poor’s Group, Moody’s Investors Service, Inc. or Fitch, Inc. This treatment of split-rated securities may differ from that used for other purposes, such as for Fund investment policies. Credit ratings are subject to change. AAA, AA, A and BBB are investment grade ratings; BB, B, CCC, CC, C and D are below-investment grade ratings. Holdings designated N/R are not rated by these national rating agencies.
| | |
| Fund Allocation | |
| (% of net assets) | |
Long-Term Municipal Bonds | 99.1% |
Other Assets Less Liabilities | 0.9% |
| Net Assets | 100% |
| | |
| States and Territories | |
| (% of total municipal bonds) | |
California | 97.5% |
Puerto Rico | 1.4% |
Virginia | 1.1% |
| Total | 100% |
| | |
| Portfolio Composition | |
| (% of total investments) | |
Tax Obligation/General | 23.4% |
Tax Obligation/Limited | 18.8% |
Water and Sewer | 13.7% |
Transportation | 11.8% |
Health Care | 10.1% |
U.S. Guaranteed | 9.2% |
Utilities | 7.0% |
Other | 6.0% |
| Total | 100% |
| | |
| Portfolio Credit Quality | |
| (% of total investment exposure) | |
U.S. Guaranteed | 9.2% |
AAA | 15.0% |
AA | 49.2% |
A | 10.8% |
BBB | 5.0% |
BB or Lower | 6.3% |
N/R (not rated) | 4.5% |
| Total | 100% |
23
| | |
| NXN | Nuveen New York Select Tax-Free |
| Income Portfolio |
| Performance Overview and Holding Summaries as of March 31, 2020 |
| | | | |
Refer to the Glossary of Terms Used in this Report for further definition of the terms used within this section. |
| Average Annual Total Returns as of March 31, 2020 |
|
| Average Annual |
| 1-Year | 5-Year | 10-Year |
NXN at Common Share NAV | 2.69% | 2.97% | 4.07% |
NXN at Common Share Price | (3.18)% | 1.63% | 3.37% |
S&P Municipal Bond New York Index | 3.22% | 2.99% | 3.96% |
S&P Municipal Bond Index | 3.78% | 3.17% | 4.21% |
Past performance is not predictive of future results. Current performance may be higher or lower than the data shown. Returns do not reflect the deduction of taxes that shareholders may have to pay on Fund distributions or upon the sale of Fund shares. Returns at NAV are net of Fund expenses, and assume reinvestment of distributions. Comparative index return information is provided for the Fund’s shares at NAV only. Indexes are not available for direct investment.
24
This data relates to the securities held in the Fund’s portfolio of investments as of the end of the reporting period. It should not be construed as a measure of performance for the Fund itself. Holdings are subject to change.
For financial reporting purposes, the ratings disclosed are the highest rating given by one of the following national rating agencies: Standard & Poor’s Group, Moody’s Investors Service, Inc. or Fitch, Inc. This treatment of split-rated securities may differ from that used for other purposes, such as for Fund investment policies. Credit ratings are subject to change. AAA, AA, A and BBB are investment grade ratings; BB, B, CCC, CC, C and D are below-investment grade ratings. Holdings designated N/R are not rated by these national rating agencies.
| | |
| Fund Allocation | |
| (% of net assets) | |
Long-Term Municipal Bonds | 99.0% |
Other Assets Less Liabilities | 1.8% |
| Net Assets Plus Floating | |
| Rate Obligations | 100.8% |
Floating Rate Obligations | (0.8)% |
| Net Assets | 100% |
| | |
| States and Territories | |
| (% of total municipal bonds) | |
New York | 95.5% |
Guam | 1.9% |
Virginia | 1.7% |
Puerto Rico | 0.9% |
| Total | 100% |
| | |
| Portfolio Composition | |
| (% of total investments) | |
Tax Obligation/Limited | 21.7% |
Transportation | 18.5% |
Education and Civic Organizations | 16.5% |
U.S. Guaranteed | 10.4% |
Water and Sewer | 9.8% |
Utilities | 7.5% |
Tax Obligation/General | 5.2% |
Other | 10.4% |
| Total | 100% |
| | |
| Portfolio Credit Quality | |
| (% of total investment exposure) | |
U.S. Guaranteed | 10.2% |
AAA | 17.3% |
AA | 42.9% |
A | 5.4% |
BBB | 9.6% |
BB or Lower | 10.1% |
N/R (not rated) | 4.5% |
| Total | 100% |
25
Report of Independent Registered Public Accounting Firm
To the Shareholders and Board of Trustees
Nuveen Select Tax-Free Income Portfolio
Nuveen Select Tax-Free Income Portfolio 2
Nuveen Select Tax-Free Income Portfolio 3
Nuveen California Select Tax-Free Income Portfolio
Nuveen New York Select Tax-Free Income Portfolio:
Opinion on the Financial Statements
We have audited the accompanying statements of assets and liabilities of Nuveen Select Tax-Free Income Portfolio, Nuveen Select Tax-Free Income Portfolio 2, Nuveen Select Tax-Free Income Portfolio 3, Nuveen California Select Tax-Free Income Portfolio, and Nuveen New York Select Tax-Free Income Portfolio (the Funds), including the portfolios of investments, as of March 31, 2020, the related statements of operations for the year then ended, the statements of changes in net assets for each of the years in the two-year period then ended, and the related notes (collectively, the financial statements) and the financial highlights for each of the years in the five-year period then ended. In our opinion, the financial statements and financial highlights present fairly, in all material respects, the financial position of the Funds as of March 31, 2020, the results of their operations for the year then ended, the changes in their net assets for each of the years in the two-year period then ended, and the financial highlights for each of the years in the five-year period then ended, in conformity with U.S. generally accepted accounting principles.
Basis for Opinion
These financial statements and financial highlights are the responsibility of the Funds’ management. Our responsibility is to express an opinion on these financial statements and financial highlights based on our audits. We are a public accounting firm registered with the Public Company Accounting Oversight Board (United States) (PCAOB) and are required to be independent with respect to the Funds in accordance with the U.S. federal securities laws and the applicable rules and regulations of the Securities and Exchange Commission and the PCAOB.
We conducted our audits in accordance with the standards of the PCAOB. Those standards require that we plan and perform the audit to obtain reasonable assurance about whether the financial statements and financial highlights are free of material misstatement, whether due to error or fraud. Our audits included performing procedures to assess the risks of material misstatement of the financial statements and financial highlights, whether due to error or fraud, and performing procedures that respond to those risks. Such procedures included examining, on a test basis, evidence regarding the amounts and disclosures in the financial statements and financial highlights. Such procedures also included confirmation of securities owned as of March 31, 2020, by correspondence with custodians and brokers or other appropriate auditing procedures. Our audits also included evaluating the accounting principles used and significant estimates made by management, as well as evaluating the overall presentation of the financial statements and financial highlights. We believe that our audits provide a reasonable basis for our opinion.
/s/ KPMG LLP
We have served as the auditor of one or more Nuveen investment companies since 2014.
Chicago, Illinois
May 29, 2020
26
| | |
| NXP | Nuveen Select Tax-Free Income Portfolio |
| Portfolio of Investments |
| March 31, 2020 |
| | | | | | |
| Principal | | | Optional Call | | |
| Amount (000) | | Description (1) | Provisions (2) | Ratings (3) | Value |
| | LONG-TERM INVESTMENTS – 98.6% | | | |
| | MUNICIPAL BONDS – 98.3% | | | |
| | Alaska – 0.3% | | | |
| $ 775 | | Northern Tobacco Securitization Corporation, Alaska, Tobacco Settlement Asset-Backed | 4/20 at 100.00 | B3 | $ 775,093 |
| | Bonds, Series 2006A, 5.000%, 6/01/46 | | | |
| | Arizona – 2.0% | | | |
| 2,500 | | Arizona Health Facilities Authority, Hospital Revenue Bonds, Catholic Healthcare West, | 3/21 at 100.00 | BBB+ | 2,554,750 |
| | Series 2011B-1&2, 5.250%, 3/01/39 | | | |
| 220 | | Arizona Industrial Development Authority, Arizona, Education Facility Revenue Bonds, | No Opt. Call | BB | 212,648 |
| | Basis Schools, Inc Projects, Series 2017D, 3.000%, 7/01/22, 144A | | | |
| 255 | | Arizona Industrial Development Authority, Arizona, Education Facility Revenue Bonds, | No Opt. Call | AA– | 259,468 |
| | Basis Schools, Inc Projects, Series 2017F, 3.000%, 7/01/26 | | | |
| 350 | | Arizona Industrial Development Authority, Arizona, Education Revenue Bonds, Academies of | No Opt. Call | AA– | 361,855 |
| | Math & Science Projects, Series 2018A, 4.000%, 7/01/22 | | | |
| 185 | | Maricopa County Industrial Development Authority, Arizona, Education Revenue Bonds, | No Opt. Call | BB+ | 182,023 |
| | Paradise Schools Projects, Series 2016, 2.875%, 7/01/21, 144A | | | |
| 1,000 | | Maricopa County Industrial Development Authority, Arizona, Revenue Bonds, Banner Health, | 1/27 at 100.00 | AA– | 1,149,620 |
| | Refunding Series 2016A, 5.000%, 1/01/38 | | | |
| 625 | | Pima County Industrial Development Authority, Arizona, Revenue Bonds, Tucson Electric | 10/20 at 100.00 | A– | 629,812 |
| | Power Company, Series 2010A, 5.250%, 10/01/40 | | | |
| 5,135 | | Total Arizona | | | 5,350,176 |
| | Arkansas – 1.1% | | | |
| 6,555 | | Arkansas Development Finance Authority, Tobacco Settlement Revenue Bonds, Arkansas | No Opt. Call | Aa2 | 2,757,033 |
| | Cancer Research Center Project, Series 2006, 0.000%, 7/01/46 – AMBAC Insured | | | |
| | California – 16.0% | | | |
| 4,245 | | Anaheim City School District, Orange County, California, General Obligation Bonds, | No Opt. Call | AA | 3,361,148 |
| | Election 2002 Series 2007, 0.000%, 8/01/31 – AGM Insured | | | |
| 2,840 | | Anaheim Public Financing Authority, California, Lease Revenue Bonds, Public Improvement | No Opt. Call | AA | 2,303,297 |
| | Project, Series 1997C, 0.000%, 9/01/30 – AGM Insured | | | |
| 3,000 | | Bay Area Toll Authority, California, Revenue Bonds, San Francisco Bay Area Toll Bridge, | 4/23 at 100.00 | AA– (4) | 3,350,640 |
| | Series 2013S-4, 5.000%, 4/01/38 (Pre-refunded 4/01/23) | | | |
| 2,310 | | California Health Facilities Financing Authority, Revenue Bonds, Saint Joseph Health | 7/23 at 100.00 | AA– | 2,550,841 |
| | System, Series 2013A, 5.000%, 7/01/33 | | | |
| 1,630 | | California State Public Works Board, Lease Revenue Bonds, Various Capital Projects, | 11/23 at 100.00 | Aa3 | 1,803,937 |
| | Series 2013I, 5.000%, 11/01/38 | | | |
| 2,645 | | Cypress Elementary School District, Orange County, California, General Obligation Bonds, | No Opt. Call | AA | 1,927,253 |
| | Series 2009A, 0.000%, 5/01/34 – AGM Insured | | | |
| 2,710 | | Golden State Tobacco Securitization Corporation, California, Enhanced Tobacco Settlement | No Opt. Call | Aa3 | 2,256,834 |
| | Asset-Backed Revenue Bonds, Series 2005A, 0.000%, 6/01/28 – AMBAC Insured | | | |
| 3,030 | | Grossmont Union High School District, San Diego County, California, General Obligation | No Opt. Call | Aa2 | 2,781,600 |
| | Bonds, Series 2006, 0.000%, 8/01/25 – NPFG Insured | | | |
| 1,000 | | Moreno Valley Unified School District, Riverside County, California, General Obligation | No Opt. Call | A+ | 952,210 |
| | Bonds, Refunding Series 2007, 0.000%, 8/01/23 – NPFG Insured | | | |
| 1,160 | | Mount San Antonio Community College District, Los Angeles County, California, General | 8/35 at 100.00 | Aa1 | 1,191,332 |
| | Obligation Bonds, Election of 2008, Series 2013A, 0.000%, 8/01/43 (5) | | | |
| 4,390 | | Pittsburg Redevelopment Agency, California, Tax Allocation Bonds, Los Medanos Community | No Opt. Call | AA– | 3,574,294 |
| | Development Project, Series 1999, 0.000%, 8/01/29 – AMBAC Insured | | | |
27
| | |
| NXP | Nuveen Select Tax-Free Income Portfolio |
| Portfolio of Investments (continued) |
| March 31, 2020 |
| | | | | | |
| Principal | | | Optional Call | | |
| Amount (000) | | Description (1) | Provisions (2) | Ratings (3) | Value |
| | California (continued) | | | |
| $ 1,700 | | Placentia-Yorba Linda Unified School District, Orange County, California, Certificates | No Opt. Call | A+ (4) | $ 1,283,126 |
| | of Participation, Series 2006, 0.000%, 10/01/34 – FGIC Insured (ETM) | | | |
| 8,000 | | Poway Unified School District, San Diego County, California, General Obligation Bonds, | No Opt. Call | AA– | 6,087,680 |
| | School Facilities Improvement District 2007-1, Election 2008 Series 2009A, 0.000%, 8/01/33 | | | |
| 1,350 | | San Diego Association of Governments, California, South Bay Expressway Toll Revenue | 7/27 at 100.00 | A | 1,600,884 |
| | Bonds, First Senior Lien Series 2017A, 5.000%, 7/01/42 | | | |
| 675 | | San Diego County Regional Airport Authority, California, Airport Revenue Bonds, | 7/29 at 100.00 | A+ | 798,748 |
| | Subordinate Series 2019B, 5.000%, 7/01/38 (AMT) | | | |
| 1,800 | | San Francisco City and County Public Utilities Commission, California, Water Revenue | 11/24 at 100.00 | Aa2 | 2,030,184 |
| | Bonds, Non-WSIP, Series 2017A, 5.000%, 11/01/42 | | | |
| 2,110 | | Sierra Sands Unified School District, Kern County, California, General Obligation Bonds, | No Opt. Call | AA | 1,788,921 |
| | Election of 2006, Series 2006A, 0.000%, 11/01/28 – FGIC Insured | | | |
| 1,195 | | Tobacco Securitization Authority of Northern California, Tobacco Settlement Asset-Backed | 4/20 at 100.00 | B– | 1,120,050 |
| | Bonds, Series 2005A-1, 5.500%, 6/01/45 | | | |
| 1,150 | | Woodside Elementary School District, San Mateo County, California, General Obligation | No Opt. Call | AAA | 957,225 |
| | Bonds, Election of 2005, Series 2007, 0.000%, 10/01/30 – AMBAC Insured | | | |
| 46,940 | | Total California | | | 41,720,204 |
| | Colorado – 5.9% | | | |
| 500 | | Centerra Metropolitan District 1, Loveland, Colorado, Special Revenue Bonds, Refunding & | No Opt. Call | N/R | 506,655 |
| | Improvement Series 2017, 5.000%, 12/01/21, 144A | | | |
| 1,780 | | Colorado Health Facilities Authority, Colorado, Revenue Bonds, Catholic Health | 1/23 at 100.00 | BBB+ (4) | 1,959,460 |
| | Initiatives, Series 2013A, 5.250%, 1/01/45 (Pre-refunded 1/01/23) | | | |
| 150 | | Colorado Health Facilities Authority, Colorado, Revenue Bonds, CommonSpirit Health, | 8/29 at 100.00 | BBB+ | 150,368 |
| | Series 2019A-1, 4.000%, 8/01/44 | | | |
| 2,630 | | Colorado School of Mines Board of Trustees, Golden, Colorado, Institutional Enterprise | 12/27 at 100.00 | A+ | 3,138,852 |
| | Revenue Bonds, Series 2017B, 5.000%, 12/01/47 | | | |
| 1,935 | | Denver City and County, Colorado, Airport System Revenue Bonds, Subordinate Lien Series | 11/23 at 100.00 | A+ | 2,130,977 |
| | 2013B, 5.000%, 11/15/43 | | | |
| 250 | | E-470 Public Highway Authority, Colorado, Senior Revenue Bonds, Series 2000B, 0.000%, | No Opt. Call | A | 196,307 |
| | 9/01/29 – NPFG Insured | | | |
| 12,500 | | E-470 Public Highway Authority, Colorado, Senior Revenue Bonds, Series 2006A, 0.000%, | 9/26 at 54.77 | A | 5,674,375 |
| | 9/01/38 – NPFG Insured | | | |
| 2,000 | | E-470 Public Highway Authority, Colorado, Toll Revenue Bonds, Series 2004B, 0.000%, | 9/20 at 50.83 | A | 1,005,740 |
| | 9/01/32 – NPFG Insured | | | |
| 620 | | Park Creek Metropolitan District, Colorado, Senior Limited Property Tax Supported | 12/25 at 100.00 | A | 712,219 |
| | Revenue Bonds, Refunding Series 2015A, 5.000%, 12/01/35 | | | |
| 22,365 | | Total Colorado | | | 15,474,953 |
| | Connecticut – 5.3% | | | |
| 690 | | Connecticut Health and Educational Facilities Authority, Revenue Bonds, Yale-New Haven | 1/24 at 100.00 | AA– | 691,297 |
| | Health Issue, Series 2014D, 1.800%, 7/01/49 (Mandatory Put 7/01/24) | | | |
| 2,500 | | Connecticut State, General Obligation Bonds, Green Series 2014G, 5.000%, 11/15/31 | 11/24 at 100.00 | A1 | 2,833,900 |
| 1,000 | | Connecticut State, General Obligation Bonds, Refunding Series 2012E, 5.000%, 9/15/32 | 9/22 at 100.00 | A1 | 1,071,730 |
| 1,000 | | Connecticut State, General Obligation Bonds, Refunding Series 2018C, 5.000%, 6/15/26 | No Opt. Call | A1 | 1,184,310 |
| 1,860 | | Connecticut State, Special Tax Obligation Bonds, Transportation Infrastructure Purposes | 10/23 at 100.00 | A+ | 2,050,352 |
| | Series 2013A, 5.000%, 10/01/30 | | | |
| 1,625 | | Connecticut State, Special Tax Obligation Bonds, Transportation Infrastructure Purposes, | 9/24 at 100.00 | A+ | 1,811,323 |
| | Series 2014A, 5.000%, 9/01/34 | | | |
| 3,000 | | Hartford County Metropolitan District, Connecticut, Clean Water Project Revenue Bonds, | 11/24 at 100.00 | Aa2 | 3,396,270 |
| | Refunding Green Bond Series 2014A, 5.000%, 11/01/42 | | | |
28
| | | | | | |
| Principal | | | Optional Call | | |
| Amount (000) | | Description (1) | Provisions (2) | Ratings (3) | Value |
| | Connecticut (continued) | | | |
| $ 750 | | University of Connecticut, General Obligation Bonds, Series 2015A, 5.000%, 3/15/31 | 3/26 at 100.00 | A+ | $ 881,078 |
| 12,425 | | Total Connecticut | | | 13,920,260 |
| | District of Columbia – 1.6% | | | |
| 1,975 | | District of Columbia Water and Sewer Authority, Public Utility Revenue Bonds, | 10/22 at 100.00 | AA+ | 2,154,962 |
| | Subordinate Lien Series 2012A, 5.000%, 10/01/25 | | | |
| 2,000 | | District of Columbia, Income Tax Secured Revenue Bonds, Refunding Series 2010A, | 6/20 at 100.00 | AAA | 2,012,340 |
| | 5.000%, 12/01/24 | | | |
| 3,975 | | Total District of Columbia | | | 4,167,302 |
| | Florida – 1.2% | | | |
| 2,070 | | Florida Development Finance Corporation, Florida, Surface Transportation Facility | No Opt. Call | Aaa | 2,068,737 |
| | Revenue Bonds, Virgin Trains USA Passenger Rail Project , Series 2019B, 0.620%, 1/01/49 | | | |
| | (Mandatory Put 6/18/20) (AMT) | | | |
| 1,000 | | Miami-Dade County, Florida, Aviation Revenue Bonds, Refunding Series 2019A, 5.000%, | 10/29 at 100.00 | A | 1,134,800 |
| | 10/01/49 (AMT) | | | |
| 3,070 | | Total Florida | | | 3,203,537 |
| | Georgia – 0.5% | | | |
| 1,300 | | Brookhaven Development Authority, Georgia, Revenue Bonds, Children’s Healthcare of | 7/29 at 100.00 | AA+ | 1,400,373 |
| | Atlanta, Inc Project, Series 2019A, 4.000%, 7/01/44 | | | |
| | Guam – 2.5% | | | |
| 3,000 | | Government of Guam, Business Privilege Tax Bonds, Refunding Series 2015D, | 11/25 at 100.00 | BB | 2,947,170 |
| | 5.000%, 11/15/39 | | | |
| 1,650 | | Government of Guam, Hotel Occupancy Tax Revenue Bonds, Series 2011A, 6.000%, 11/01/26 | 5/21 at 100.00 | BB | 1,686,861 |
| 1,740 | | Guam Government Waterworks Authority, Water and Wastewater System Revenue Bonds, Series | 7/23 at 100.00 | A– | 1,803,458 |
| | 2013, 5.250%, 7/01/25 | | | |
| 6,390 | | Total Guam | | | 6,437,489 |
| | Idaho – 1.3% | | | |
| 3,000 | | Idaho Health Facilities Authority, Revenue Bonds, Saint Luke’s Health System Project, | 3/24 at 100.00 | A– | 3,291,270 |
| | Series 2014A, 5.000%, 3/01/44 | | | |
| | Illinois – 10.4% | | | |
| | Board of Trustees of Southern Illinois University, Housing and Auxiliary Facilities | | | |
| | System Revenue Bonds, Series 1999A: | | | |
| 2,565 | | 0.000%, 4/01/20 – NPFG Insured | No Opt. Call | Baa2 | 2,565,000 |
| 2,000 | | 0.000%, 4/01/23 – NPFG Insured | No Opt. Call | Baa2 | 1,866,920 |
| 725 | | Chicago Board of Education, Illinois, Dedicated Capital Improvement Tax Revenue Bonds, | 4/27 at 100.00 | A | 771,030 |
| | Series 2016, 6.000%, 4/01/46 | | | |
| 735 | | Chicago Board of Education, Illinois, General Obligation Bonds, Dedicated Revenues | 12/21 at 100.00 | BB | 724,681 |
| | Series 2011A, 5.000%, 12/01/41 | | | |
| 735 | | Chicago Board of Education, Illinois, General Obligation Bonds, Dedicated Revenues, | 12/27 at 100.00 | BB | 751,780 |
| | Refunding Series 2017C, 5.000%, 12/01/30 | | | |
| 360 | | Chicago Board of Education, Illinois, General Obligation Bonds, Dedicated Revenues, | 12/26 at 100.00 | BB | 389,732 |
| | Series 2016B, 6.500%, 12/01/46 | | | |
| 55 | | Chicago Board of Education, Illinois, Unlimited Tax General Obligation Bonds, Dedicated | No Opt. Call | Baa2 | 40,248 |
| | Tax Revenues, Series 1998B-1, 0.000%, 12/01/28 – FGIC Insured | | | |
| 880 | | Chicago, Illinois, General Obligation Bonds, Project & Refunding Series 2017A, | 1/27 at 100.00 | BBB+ | 946,317 |
| | 6.000%, 1/01/38 | | | |
| | Illinois Finance Authority, Revenue Bonds, Northwestern Memorial HealthCare, | | | |
| | Series 2013: | | | |
| 2,100 | | 4.000%, 8/15/33 | 8/22 at 100.00 | AA+ | 2,198,112 |
| 2,245 | | 5.000%, 8/15/43 | 8/22 at 100.00 | AA+ | 2,378,241 |
29
| | | |
| NXP | | Nuveen Select Tax-Free Income Portfolio |
| | Portfolio of Investments (continued) |
| | March 31, 2020 |
|
|
|
| Principal | | | Optional Call | | |
| Amount (000) | | Description (1) | Provisions (2) | Ratings (3) | Value |
| | Illinois (continued) | | | |
| $ 260 | | Illinois Finance Authority, Revenue Bonds, Rehabilitation Institute of Chicago, Series | 7/23 at 100.00 | A– | $ 288,954 |
| | 2013A, 6.000%, 7/01/43 | | | |
| 2,190 | | Illinois State, General Obligation Bonds, Refunding Series 2012, 5.000%, 8/01/23 | No Opt. Call | BBB | 2,273,767 |
| 1,000 | | Kendall, Kane, and Will Counties Community Unit School District 308 Oswego, Illinois, | No Opt. Call | A2 | 939,600 |
| | General Obligation Bonds, Series 2008, 0.000%, 2/01/24 – AGM Insured | | | |
| | Metropolitan Pier and Exposition Authority, Illinois, Revenue Bonds, McCormick Place | | | |
| | Expansion Project, Series 2002A: | | | |
| 1,720 | | 0.000%, 12/15/29 – NPFG Insured | No Opt. Call | BBB | 1,278,579 |
| 45 | | 0.000%, 6/15/30 (ETM) | No Opt. Call | N/R (4) | 37,330 |
| 765 | | 0.000%, 6/15/30 | No Opt. Call | BBB | 558,840 |
| 6,070 | | 0.000%, 12/15/31 – NPFG Insured | No Opt. Call | BBB | 4,155,643 |
| 5,000 | | 0.000%, 12/15/36 – NPFG Insured | No Opt. Call | BBB | 2,702,100 |
| 1,775 | | Springfield, Illinois, Electric Revenue Bonds, Senior Lien Series 2015, 5.000%, 3/01/28 | 3/25 at 100.00 | A | 2,048,386 |
| 310 | | University of Illinois, Health Services Facilities System Revenue Bonds, Series 2013, | 10/23 at 100.00 | A– | 341,800 |
| | 6.000%, 10/01/42 | | | |
| 31,535 | | Total Illinois | | | 27,257,060 |
| | Indiana – 0.9% | | | |
| 1,250 | | Indiana Finance Authority, Wastewater Utility Revenue Bonds, CWA Authority Project, | 10/24 at 100.00 | AA | 1,422,563 |
| | Series 2015A, 5.000%, 10/01/45 | | | |
| 1,000 | | Indianapolis Local Public Improvement Bond Bank, Indiana, Series 1999E, 0.000%, 2/01/24 – | No Opt. Call | AA | 943,180 |
| | AMBAC Insured | | | |
| 2,250 | | Total Indiana | | | 2,365,743 |
| | Iowa – 2.5% | | | |
| 710 | | Iowa Finance Authority, Iowa, Midwestern Disaster Area Revenue Bonds, Iowa Fertilizer | 5/20 at 104.00 | BB– | 717,725 |
| | Company Project, Series 2016, 5.875%, 12/01/26, 144A | | | |
| 830 | | Iowa Finance Authority, Iowa, Midwestern Disaster Area Revenue Bonds, Iowa Fertilizer | 12/22 at 105.00 | BB– | 851,513 |
| | Company Project, Series 2018B, 5.250%, 12/01/50 (Mandatory Put 12/01/37) | | | |
| 1,000 | | Iowa Tobacco Settlement Authority, Asset Backed Settlement Revenue Bonds, Series 2005C, | 5/20 at 100.00 | B– | 980,970 |
| | 5.375%, 6/01/38 | | | |
| 4,000 | | Iowa Tobacco Settlement Authority, Tobacco Asset-Backed Revenue Bonds, Series 2005B, | 5/20 at 100.00 | B– | 3,955,760 |
| | 5.600%, 6/01/34 | | | |
| 6,540 | | Total Iowa | | | 6,505,968 |
| | Kentucky – 1.0% | | | |
| 2,500 | | Kentucky Economic Development Finance Authority, Hospital Revenue Bonds, Baptist | 8/21 at 100.00 | A | 2,604,575 |
| | Healthcare System Obligated Group, Series 2011, 5.250%, 8/15/46 | | | |
| | Massachusetts – 4.1% | | | |
| 1,000 | | Massachusetts Development Finance Agency, Revenue Bonds, CareGroup Issue, Series | 7/28 at 100.00 | A | 1,179,330 |
| | 2018J-2, 5.000%, 7/01/43 | | | |
| 1,625 | | Massachusetts Development Finance Agency, Revenue Bonds, Olin College, Series 2013E, | 11/23 at 100.00 | A+ | 1,773,525 |
| | 5.000%, 11/01/43 | | | |
| 200 | | Massachusetts Development Finance Agency, Revenue Bonds, UMass Memorial Health Care | 7/27 at 100.00 | A– | 194,538 |
| | Obligated Group Issue, Series 2017L, 3.625%, 7/01/37 | | | |
| 2,500 | | Massachusetts School Building Authority, Dedicated Sales Tax Revenue Bonds, Subordinated | 2/26 at 100.00 | AA+ | 2,899,800 |
| | Series 2019A, 5.000%, 2/15/49 | | | |
| 2,415 | | Massachusetts State, Federal Highway Grant Anticipation Notes, Accelerated Bridge | 6/27 at 100.00 | AA+ | 2,849,917 |
| | Program, Series 2017A, 5.000%, 6/01/47 | | | |
| 1,650 | | Massachusetts Water Resources Authority, General Revenue Bonds, Refunding Series 2011C, | 8/21 at 100.00 | AA+ (4) | 1,742,433 |
| | 5.250%, 8/01/42 (Pre-refunded 8/01/21) | | | |
| 9,390 | | Total Massachusetts | | | 10,639,543 |
30
| | | | | | |
| Principal | | | Optional Call | | |
| Amount (000) | | Description (1) | Provisions (2) | Ratings (3) | Value |
| | Michigan – 0.1% | | | |
| $ 355 | | Detroit Water and Sewerage Department, Michigan, Sewage Disposal System Revenue Bonds, | 7/22 at 100.00 | AA– | $ 380,780 |
| | Refunding Senior Lien Series 2012A, 5.250%, 7/01/39 | | | |
| | Missouri – 2.8% | | | |
| | Kansas City Municipal Assistance Corporation, Missouri, Leasehold Revenue Bonds, Series 2004B-1: | | | |
| 1,165 | | 0.000%, 4/15/23 – AMBAC Insured | No Opt. Call | AA | 1,109,593 |
| 5,000 | | 0.000%, 4/15/30 – AMBAC Insured | No Opt. Call | AA– | 3,985,050 |
| 2,000 | | Missouri Health and Educational Facilities Authority, Health Facilities Revenue Bonds, | 11/23 at 100.00 | A2 | 2,202,280 |
| | CoxHealth, Series 2013A, 5.000%, 11/15/38 | | | |
| 8,165 | | Total Missouri | | | 7,296,923 |
| | Nevada – 0.1% | | | |
| 275 | | Carson City, Nevada, Hospital Revenue Bonds, Carson Tahoe Regional Healthcare Project, | 9/27 at 100.00 | A– | 323,868 |
| | Series 2017A, 5.000%, 9/01/37 | | | |
| | New Hampshire – 0.5% | | | |
| 1,250 | | New Hampshire Business Finance Authority, Solid Waste Disposal Revenue Bonds, Waste | No Opt. Call | A– | 1,256,275 |
| | Management Inc Project, Series 2003, 3.125%, 8/01/24 (AMT) | | | |
| | New Jersey – 9.9% | | | |
| 940 | | New Jersey Economic Development Authority, Private Activity Bonds, The Goethals Bridge | 1/24 at 100.00 | AA | 975,739 |
| | Replacement Project, Series 2013, 5.125%, 1/01/39 – AGM Insured (AMT) | | | |
| 1,035 | | New Jersey Economic Development Authority, School Facilities Construction Financing | 3/21 at 100.00 | A– | 1,066,112 |
| | Program Bonds, Refunding Series 2011GG, 5.000%, 9/01/22 | | | |
| 1,380 | | New Jersey Economic Development Authority, Sublease Revenue Bonds, New Jersey Transit | No Opt. Call | A– | 1,462,441 |
| | Corporation Projects, Refunding Series 2017B, 5.000%, 11/01/23 | | | |
| 260 | | New Jersey Health Care Facilities Financing Authority, Revenue Bonds, University | 7/25 at 100.00 | AA | 284,903 |
| | Hospital Issue, Refunding Series 2015A, 5.000%, 7/01/29 – AGM Insured | | | |
| 35,000 | | New Jersey Transportation Trust Fund Authority, Transportation System Bonds, Refunding | No Opt. Call | AA | 22,004,500 |
| | Series 2006C, 0.000%, 12/15/34 – AGM Insured | | | |
| 38,615 | | Total New Jersey | | | 25,793,695 |
| | New Mexico – 1.3% | | | |
| 1,000 | | Farmington Municipal School District 5, San Juan County, New Mexico, General Obligation | 9/25 at 100.00 | Aa3 | 1,185,110 |
| | Bonds, School Building Series 2015, 5.000%, 9/01/28 | | | |
| 1,000 | | New Mexico Mortgage Finance Authority, Multifamily Housing Revenue Bonds, St Anthony, | 4/20 at 100.00 | N/R | 1,001,280 |
| | Series 2007A, 5.250%, 9/01/42 (AMT) | | | |
| 1,035 | | University of New Mexico, Revenue Bonds, Refunding & Improvement Subordinate Lien Series | 6/26 at 100.00 | AA– | 1,175,325 |
| | 2016A, 4.500%, 6/01/36 | | | |
| 3,035 | | Total New Mexico | | | 3,361,715 |
| | New York – 1.2% | | | |
| | Hudson Yards Infrastructure Corporation, New York, Revenue Bonds, Senior Fiscal 2012 | | | |
| | Series 2011A: | | | |
| 25 | | 5.250%, 2/15/47 (Pre-refunded 2/15/21) | 2/21 at 100.00 | Aa2 (4) | 25,893 |
| 475 | | 5.250%, 2/15/47 | 2/21 at 100.00 | Aa2 | 489,525 |
| 1,100 | | Metropolitan Transportation Authority, New York, Transportation Revenue Bonds, Refunding | 11/22 at 100.00 | AA– | 1,168,739 |
| | Series 2002D-1, 5.000%, 11/01/27 | | | |
| 780 | | Port Authority of New York and New Jersey, Special Project Bonds, JFK International Air | 12/20 at 100.00 | BBB+ | 789,976 |
| | Terminal LLC Project, Eighth Series 2010, 6.000%, 12/01/42 | | | |
| 500 | | TSASC Inc, New York, Tobacco Settlement Asset-Backed Bonds, Fiscal 2017 Series B, | No Opt. Call | B– | 529,000 |
| | 5.000%, 6/01/24 | | | |
| 2,880 | | Total New York | | | 3,003,133 |
| | Ohio – 2.1% | | | |
| 230 | | Buckeye Tobacco Settlement Financing Authority, Ohio, Tobacco Settlement Asset-Backed | 6/30 at 100.00 | BBB+ | 246,882 |
| | Revenue Bonds, Refunding Senior Lien Series 2020A-2 Class 1, 4.000%, 6/01/48 | | | |
| 360 | | Buckeye Tobacco Settlement Financing Authority, Ohio, Tobacco Settlement Asset-Backed | 6/30 at 100.00 | N/R | 319,950 |
| | Revenue Bonds, Refunding Senior Lien Series 2020B-2 Class 2, 5.000%, 6/01/55 | | | |
31
| | |
| NXP | Nuveen Select Tax-Free Income Portfolio |
| Portfolio of Investments (continued) |
| March 31, 2020 |
| | | | | | |
| Principal | | | Optional Call | | |
| Amount (000) | | Description (1) | Provisions (2) | Ratings (3) | Value |
| | Ohio (continued) | | | |
| $ 1,975 | | Buckeye Tobacco Settlement Financing Authority, Ohio, Tobacco Settlement Asset-Backed | 6/22 at 100.00 | CCC+ (4) | $ 2,190,512 |
| | Revenue Bonds, Senior Lien Series 2007A-3, 6.250%, 6/01/37 (Pre-refunded 6/01/22) | | | |
| 1,500 | | Montgomery County, Ohio, Revenue Bonds, Miami Valley Hospital, Series 2011A, | 11/20 at 100.00 | A | 1,538,655 |
| | 5.750%, 11/15/21 | | | |
| 1,105 | | Ohio Turnpike Commission, Turnpike Revenue Bonds, Infrastructure Project, Junior Lien | 2/23 at 100.00 | Aa3 (4) | 1,225,058 |
| | Series 2013A-1, 5.000%, 2/15/48 (Pre-refunded 2/15/23) | | | |
| 1,000 | | Ohio Water Development Authority, Pollution Control Revenue Bonds, FirstEnergy Nuclear | No Opt. Call | N/R | 3,750 |
| | Generating Corporation Project, Refunding Series 2005B, 4.000%, 1/01/34 (6) | | | |
| 6,170 | | Total Ohio | | | 5,524,807 |
| | Oklahoma – 0.2% | | | |
| 435 | | Oklahoma Development Finance Authority, Health System Revenue Bonds, OU Medicine | 8/28 at 100.00 | Baa3 | 502,590 |
| | Project, Series 2018B, 5.000%, 8/15/38 | | | |
| | Oregon – 2.0% | | | |
| 590 | | Beaverton School District 48J, Washington and Multnomah Counties, Oregon, General | 6/27 at 100.00 | AA+ | 728,172 |
| | Obligation Bonds, Convertible Deferred Interest Series 2017D, 5.000%, 6/15/36 | | | |
| 515 | | Clackamas County Hospital Facility Authority, Oregon, Senior Living Revenue Bonds, | No Opt. Call | N/R | 525,599 |
| | Willamette View Project, Series 2017A, 4.000%, 11/15/23 | | | |
| 500 | | Lake Oswego, Oregon, General Obligation Bonds, Series 2013, 5.000%, 6/01/26 | 6/23 at 100.00 | AAA | 558,590 |
| 750 | | Multnomah County Hospital Facilities Authority, Oregon, Revenue Bond, Terwilliger Plaza, | No Opt. Call | BBB | 772,875 |
| | Inc, Refunding Series 2012, 5.000%, 12/01/22 | | | |
| 1,365 | | Oregon Facilities Authority, Revenue Bonds, Reed College, Series 2017A, 4.000%, 7/01/41 | 7/27 at 100.00 | Aa2 | 1,533,154 |
| 1,000 | | Oregon Facilities Authority, Revenue Bonds, Willamette University, Refunding Series | 10/26 at 100.00 | A– | 1,143,110 |
| | 2016B, 5.000%, 10/01/40 | | | |
| 4,720 | | Total Oregon | | | 5,261,500 |
| | Pennsylvania – 1.6% | | | |
| 1,225 | | Delaware River Port Authority, New Jersey and Pennsylvania, Revenue Bonds, Series 2013, | 1/24 at 100.00 | A+ | 1,370,567 |
| | 5.000%, 1/01/37 | | | |
| 1,000 | | Pennsylvania Higher Educational Facilities Authority, Revenue Bonds, State System of | 6/26 at 100.00 | Aa3 | 1,182,380 |
| | Higher Education, Refunding Series 2016AT-1, 5.000%, 6/15/31 | | | |
| | Pennsylvania Turnpike Commission, Motor License Fund-Enhanced Subordinate Special | | | |
| | Revenue Bonds, Series 2010B-2: | | | |
| 555 | | 5.000%, 12/01/30 (Pre-refunded 12/01/20) | 12/20 at 100.00 | N/R (4) | 568,858 |
| 295 | | 5.000%, 12/01/30 (Pre-refunded 12/01/20) | 12/20 at 100.00 | N/R (4) | 302,366 |
| 640 | | 5.000%, 12/01/30 (Pre-refunded 12/01/20) | 12/20 at 100.00 | A2 (4) | 655,981 |
| 3,715 | | Total Pennsylvania | | | 4,080,152 |
| | Puerto Rico – 0.8% | | | |
| | Puerto Rico Sales Tax Financing Corporation, Sales Tax Revenue Bonds, Restructured 2018A-1: | | | |
| 1,000 | | 4.750%, 7/01/53 | 7/28 at 100.00 | N/R | 944,160 |
| 900 | | 5.000%, 7/01/58 | 7/28 at 100.00 | N/R | 877,455 |
| 360 | | Puerto Rico Sales Tax Financing Corporation, Sales Tax Revenue Bonds, Taxable | 7/28 at 100.00 | N/R | 338,047 |
| | Restructured Cofina Project Series 2019A-2, 4.784%, 7/01/58 | | | |
| 2,260 | | Total Puerto Rico | | | 2,159,662 |
| | Texas – 10.7% | | | |
| 2,795 | | Alamo Regional Mobility Authority, Texas, Vehicle Registration Fee Revenue Bonds, Senior | 6/25 at 100.00 | AA+ | 3,172,241 |
| | Lien Series 2016, 5.000%, 6/15/46 | | | |
| 250 | | Central Texas Regional Mobility Authority, Revenue Bonds, Senior Lien Series 2011, | 1/21 at 100.00 | A– (4) | 258,990 |
| | 6.000%, 1/01/41 (Pre-refunded 1/01/21) | | | |
| 110 | | Central Texas Regional Mobility Authority, Revenue Bonds, Senior Lien, Series 2015A, | 7/25 at 100.00 | A– | 119,485 |
| | 5.000%, 1/01/33 | | | |
| 5,565 | | Grand Parkway Transportation Corporation, Texas, System Toll Revenue Bonds, First Tier | 10/23 at 100.00 | A+ (4) | 6,404,870 |
| | Series 2013A, 5.500%, 4/01/53 (Pre-refunded 10/01/23) | | | |
32
| | | | | | |
| Principal | | | Optional Call | | |
| Amount (000) | | Description (1) | Provisions (2) | Ratings (3) | Value |
| | Texas (continued) | | | |
| $ 1,250 | | Harris County Flood Control District, Texas, Contract Tax Bonds, Refunding Series 2017A, | 10/27 at 100.00 | AAA | $ 1,439,250 |
| | 4.000%, 10/01/35 | | | |
| | Harris County-Houston Sports Authority, Texas, Revenue Bonds, Junior Lien Series 2001H: | | | |
| 480 | | 0.000%, 11/15/30 – NPFG Insured (ETM) | No Opt. Call | Baa2 (4) | 395,155 |
| 2,935 | | 0.000%, 11/15/30 – NPFG Insured | No Opt. Call | Baa2 | 2,216,512 |
| 4,230 | | Harris County-Houston Sports Authority, Texas, Revenue Bonds, Third Lien Series 2004A-3, | 11/24 at 52.47 | Baa2 | 1,965,216 |
| | 0.000%, 11/15/35 – NPFG Insured | | | |
| 4,015 | | Harris County-Houston Sports Authority, Texas, Special Revenue Bonds, Refunding Senior | 11/30 at 61.17 | AA | 1,970,562 |
| | Lien Series 2001A, 0.000%, 11/15/38 – NPFG Insured | | | |
| 2,260 | | Love Field Airport Modernization Corporation, Texas, Special Facilities Revenue Bonds, | 11/20 at 100.00 | Baa1 | 2,231,908 |
| | Southwest Airlines Company, Series 2010, 5.250%, 11/01/40 | | | |
| 150 | | Mission Economic Development Corporation, Texas, Revenue Bonds, Natgasoline Project, | 10/21 at 105.00 | BB– | 153,507 |
| | Senior Lien Series 2018, 4.625%, 10/01/31, 144A (AMT) | | | |
| 2,000 | | North Texas Tollway Authority, System Revenue Bonds, Refunding First Tier Capital | 1/25 at 100.00 | A+ | 2,448,920 |
| | Appreciation Series 2008I, 6.500%, 1/01/43 | | | |
| 5,000 | | Texas Municipal Gas Acquisition and Supply Corporation III, Gas Supply Revenue Bonds, | 12/22 at 100.00 | A3 | 5,229,750 |
| | Series 2012, 5.000%, 12/15/26 | | | |
| 31,040 | | Total Texas | | | 28,006,366 |
| | Virginia – 2.6% | | | |
| 960 | | Metropolitan Washington Airports Authority, Virginia, Dulles Toll Road Revenue Bonds, | 10/29 at 100.00 | A– | 984,115 |
| | Dulles Metrorail & Capital improvement Projects, Refunding & Subordinate Lien Series 2019B, | | | |
| | 4.000%, 10/01/44 | | | |
| 2,000 | | Metropolitan Washington Airports Authority, Virginia, Dulles Toll Road Revenue Bonds, | 10/28 at 100.00 | A– | 2,487,700 |
| | Dulles Metrorail Capital Appreciation, Second Senior Lien Series 2010B, 6.500%, 10/01/44 | | | |
| | Virginia Small Business Financing Authority, Senior Lien Revenue Bonds, Elizabeth River | | | |
| | Crossing, Opco LLC Project, Series 2012: | | | |
| 1,000 | | 5.250%, 1/01/32 (AMT) | 7/22 at 100.00 | BBB | 1,015,790 |
| 1,205 | | 6.000%, 1/01/37 (AMT) | 7/22 at 100.00 | BBB | 1,242,343 |
| 1,010 | | 5.500%, 1/01/42 (AMT) | 7/22 at 100.00 | BBB | 1,025,888 |
| 6,175 | | Total Virginia | | | 6,755,836 |
| | Washington – 3.9% | | | |
| 385 | | Port of Seattle, Washington, Revenue Bonds, Intermediate Lien Series 2019, 5.000%, | 4/29 at 100.00 | AA– | 439,150 |
| | 4/01/44 (AMT) | | | |
| 990 | | Washington Health Care Facilities Authority, Revenue Bonds, Fred Hutchinson Cancer | 1/21 at 100.00 | A+ | 1,013,809 |
| | Research Center, Series 2011A, 5.625%, 1/01/35 | | | |
| 1,000 | | Washington State Convention Center Public Facilities District, Lodging Tax Revenue | 7/28 at 100.00 | AA– | 1,188,340 |
| | Bonds, Series 2018, 5.000%, 7/01/58 | | | |
| 2,855 | | Washington State, General Obligation Bonds, Various Purpose Series 2015B, | 2/25 at 100.00 | Aaa | 3,295,013 |
| | 5.000%, 2/01/37 | | | |
| 2,060 | | Washington State, General Obligation Bonds, Various Purpose Series 2016A-1, | 8/25 at 100.00 | Aaa | 2,398,005 |
| | 5.000%, 8/01/39 | | | |
| 2,115 | | Washington State, Motor Vehicle Fuel Tax General Obligation Bonds, Series 2003F, 0.000%, | No Opt. Call | Aaa | 1,874,059 |
| | 12/01/27 – NPFG Insured | | | |
| 9,405 | | Total Washington | | | 10,208,376 |
| | West Virginia – 0.6% | | | |
| 1,500 | | West Virginia Hospital Finance Authority, Hospital Revenue Bonds, West Virginia United | 6/23 at 100.00 | A | 1,633,935 |
| | Health System Obligated Group, Refunding & Improvement Series 2013A, 5.500%, 6/01/44 | | | |
| | Wisconsin – 1.3% | | | |
| 1,645 | | Wisconsin Health and Educational Facilities Authority, Revenue Bonds, Mercy Alliance, | 6/22 at 100.00 | A3 | 1,727,217 |
| | Inc, Series 2012, 5.000%, 6/01/39 | | | |
33
| | |
| NXP | Nuveen Select Tax-Free Income Portfolio |
| Portfolio of Investments (continued) |
| March 31, 2020 |
| | | | | | |
| Principal | | | Optional Call | | |
| Amount (000) | | Description (1) | Provisions (2) | Ratings (3) | Value |
| | Wisconsin (continued) | | | |
| $ 1,500 | | Wisconsin Health and Educational Facilities Authority, Wisconsin, Revenue Bonds, Medical | 11/26 at 100.00 | AA– | $ 1,754,460 |
| | College of Wisconsin, Inc, Series 2016, 5.000%, 12/01/41 | | | |
| 3,145 | | Total Wisconsin | | | 3,481,677 |
| $ 287,285 | | Total Municipal Bonds (cost $224,362,750) | | | 257,627,928 |
|
| Shares | | Description (1) | | | Value |
| | COMMON STOCKS – 0.3% | | | |
| | Electric Utilities – 0.3% | | | |
| 32,091 | | Energy Harbor Corp (7), (8) | | | $ 726,059 |
| | Total Common Stocks (cost $851,221) | | | 726,059 |
| | Total Long-Term Investments (cost $225,213,971) | | | 257,627,928 |
|
| Principal | | | Optional Call | | |
| Amount (000) | | Description (1) | Provisions (2) | Ratings (3) | Value |
| | SHORT-TERM INVESTMENTS – 0.8% | | | |
| | MUNICIPAL BONDS – 0.8% | | | |
| | Florida – 0.4% | | | |
| $ 1,305 | | Florida Development Finance Corporation, Florida, Surface Transportation Facility | 6/20 at 104.00 | N/R | $ 1,181,795 |
| | Revenue Bonds, Virgin Trains USA Passenger Rail Project, Variable Rate Demand Obligations, | | | |
| | Series 2019A, 6.250%, 1/01/49 (Mandatory Put 1/01/24), 144A (AMT) (9) | | | |
| | Louisiana – 0.4% | | | |
| 1,000 | | East Baton Rouge Parish, Louisiana, Sales Tax Revenue Bonds, Refunding Road & Street | 5/20 at 100.00 | F1 | 1,000,000 |
| | Improvement, Variable Rate Demand Obligations, Series 2008A, 4.850%, 8/01/30 (Mandatory | | | |
| | Put 5/06/20) (9) | | | |
| $ 2,305 | | Total Short-Term Investments (cost $2,305,000) | | | 2,181,795 |
| | Total Investments (cost $227,518,971) – 99.4% | | | 259,809,723 |
| | Other Assets Less Liabilities – 0.6% | | | 1,628,422 |
| | Net Assets Applicable to Common Shares – 100% | | | $ 261,438,145 |
| | |
(1) | All percentages shown in the Portfolio of Investments are based on net assets applicable to common shares unless otherwise noted. |
(2) | Optional Call Provisions: Dates (month and year) and prices of the earliest optional call or redemption. There may be other call provisions at varying prices at later dates. Certain mortgage-backed securities may be subject to periodic principal paydowns. Optional Call Provisions are not covered by the report of independent registered public accounting firm. |
(3) | For financial reporting purposes, the ratings disclosed are the highest of Standard & Poor’s Group (“Standard & Poor’s”), Moody’s Investors Service, Inc. (“Moody’s”) or Fitch, Inc. (“Fitch”) rating. This treatment of split-rated securities may differ from that used for other purposes, such as for Fund investment policies. Ratings below BBB by Standard & Poor’s, Baa by Moody’s or BBB by Fitch are considered to be below investment grade. Holdings designated N/R are not rated by any of these national rating agencies. Ratings are not covered by the report of independent registered public accounting firm. |
(4) | Backed by an escrow or trust containing sufficient U.S. Government or U.S. Government agency securities, which ensure the timely payment of principal and interest. |
(5) | Step-up coupon bond, a bond with a coupon that increases (“steps up”), usually at regular intervals, while the bond is outstanding. The rate shown is the coupon as of the end of the reporting period. |
(6) | Defaulted security. A security whose issuer has failed to fully pay principal and/or interest when due, or is under the protection of bankruptcy. |
(7) | For fair value measurement disclosure purposes, investment classified as Level 2. See Notes to Financial Statements, Note 3 - Investment Valuation and Fair Value Measurements for more information. |
(8) | Common Stock received as part of the bankruptcy settlement for Ohio Water Development Authority, Pollution Control Revenue Refunding Bonds, FirstEnergy Nuclear Generating Corporation Project, Series 2005B, 0.000%, 1/01/34. |
(9) | Investment has a maturity of greater than one year, but has variable rate and/or demand features which qualify it as a short-term investment. The rate disclosed, as well as the reference rate and spread, where applicable, is that in effect as of the end of the reporting period. This rate changes periodically based on market conditions or a specified market index. |
144A | Investment is exempt from registration under Rule 144A of the Securities Act of 1933, as amended. These investments may only be resold in transactions exempt from registration, which are normally those transactions with qualified institutional buyers. |
AMT | Alternative Minimum Tax |
ETM | Escrowed to maturity |
| See accompanying notes to financial statements. |
34
| | |
| NXQ | Nuveen Select Tax-Free Income Portfolio 2 |
| Portfolio of Investments |
| March 31, 2020 |
| | | | | | |
| Principal | | | Optional Call | | |
| Amount (000) | | Description (1) | Provisions (2) | Ratings (3) | Value |
| | LONG-TERM INVESTMENTS – 97.3% | | | |
| | MUNICIPAL BONDS – 97.0% | | | |
| | Alaska – 0.4% | | | |
| $ 1,000 | | Northern Tobacco Securitization Corporation, Alaska, Tobacco Settlement Asset-Backed | 4/20 at 100.00 | B3 | $ 1,000,110 |
| | Bonds, Series 2006A, 5.000%, 6/01/32 | | | |
| | Arizona – 4.6% | | | |
| 2,500 | | Arizona Health Facilities Authority, Hospital Revenue Bonds, Catholic Healthcare West, | 3/21 at 100.00 | BBB+ | 2,554,750 |
| | Series 2011B-1&2, 5.250%, 3/01/39 | | | |
| 190 | | Maricopa County Industrial Development Authority, Arizona, Education Revenue Bonds, | No Opt. Call | BB+ | 186,943 |
| | Paradise Schools Projects, Series 2016, 2.875%, 7/01/21, 144A | | | |
| 1,000 | | Maricopa County Industrial Development Authority, Arizona, Revenue Bonds, Banner Health, | 1/27 at 100.00 | AA– | 1,149,620 |
| | Refunding Series 2016A, 5.000%, 1/01/38 | | | |
| 1,950 | | McAllister Academic Village LLC, Arizona, Revenue Bonds, Arizona State University | 7/26 at 100.00 | AA– | 2,311,647 |
| | Hassayampa Academic Village Project, Refunding Series 2016, 5.000%, 7/01/37 | | | |
| 1,250 | | Phoenix Civic Improvement Corporation, Arizona, Airport Revenue Bonds, Junior Lien | 7/25 at 100.00 | A+ | 1,430,625 |
| | Series 2015A, 5.000%, 7/01/34 | | | |
| 1,160 | | Phoenix Industrial Development Authority, Arizona, Lease Revenue Bonds, Rowan University | 6/22 at 100.00 | A | 1,208,987 |
| | Project, Series 2012, 5.000%, 6/01/42 | | | |
| 600 | | Pima County Industrial Development Authority, Arizona, Revenue Bonds, Tucson Electric | 10/20 at 100.00 | A– | 604,620 |
| | Power Company, Series 2010A, 5.250%, 10/01/40 | | | |
| 2,250 | | Salt Verde Financial Corporation, Arizona, Senior Gas Revenue Bonds, Citigroup Energy | No Opt. Call | A3 | 2,653,470 |
| | Inc Prepay Contract Obligations, Series 2007, 5.000%, 12/01/37 | | | |
| 215 | | Sedona Wastewater Municipal Property Corporation (Arizona), Excise Tax Revenue Bonds, | No Opt. Call | Baa2 | 214,206 |
| | Series 1998, 0.000%, 7/01/20 – NPFG Insured | | | |
| 11,115 | | Total Arizona | | | 12,314,868 |
| | California – 15.5% | | | |
| 11,000 | | Alhambra Unified School District, Los Angeles County, California, General Obligation | No Opt. Call | AA | 5,968,600 |
| | Bonds, Capital Appreciation Series 2009B, 0.000%, 8/01/41 – AGC Insured | | | |
| 1,500 | | California County Tobacco Securitization Agency, Tobacco Settlement Asset-Backed Bonds, | 4/20 at 100.00 | B2 | 1,488,330 |
| | Los Angeles County Securitization Corporation, Series 2006A, 5.600%, 6/01/36 | | | |
| 2,440 | | Eureka Unified School District, Humboldt County, California, General Obligation Bonds, | No Opt. Call | AA | 2,116,090 |
| | Series 2002, 0.000%, 8/01/27 – AGM Insured | | | |
| 3,290 | | Folsom Cordova Unified School District, Sacramento County, California, General | No Opt. Call | AA– | 3,075,097 |
| | Obligation Bonds, School Facilities Improvement District 4, Series 2007A, 0.000%, 10/01/24 – | | | |
| | NPFG Insured | | | |
| 3,030 | | Grossmont Union High School District, San Diego County, California, General Obligation | No Opt. Call | Aa2 | 2,781,601 |
| | Bonds, Series 2006, 0.000%, 8/01/25 – NPFG Insured | | | |
| 1,495 | | Huntington Beach Union High School District, Orange County, California, General | No Opt. Call | Aa2 | 1,049,789 |
| | Obligation Bonds, Series 2007, 0.000%, 8/01/33 – FGIC Insured | | | |
| 1,160 | | Mount San Antonio Community College District, Los Angeles County, California, General | 8/35 at 100.00 | Aa1 | 1,191,332 |
| | Obligation Bonds, Election of 2008, Series 2013A, 0.000%, 8/01/43 (4) | | | |
| 450 | | M-S-R Energy Authority, California, Gas Revenue Bonds, Citigroup Prepay Contracts, | No Opt. Call | A | 630,441 |
| | Series 2009C, 6.500%, 11/01/39 | | | |
| 1,195 | | Palmdale School District, Los Angeles County, California, General Obligation Bonds, | No Opt. Call | AA | 1,026,601 |
| | Series 2003, 0.000%, 8/01/28 – AGM Insured | | | |
| 4,620 | | Palomar Pomerado Health, California, General Obligation Bonds, Capital Appreciation, | No Opt. Call | A2 | 4,294,613 |
| | Election of 2004, Series 2007A, 0.000%, 8/01/24 – NPFG Insured | | | |
| 4,400 | | Pittsburg Redevelopment Agency, California, Tax Allocation Bonds, Los Medanos Community | No Opt. Call | AA– | 3,582,436 |
| | Development Project, Series 1999, 0.000%, 8/01/29 – AMBAC Insured | | | |
35
| | |
| NXQ | Nuveen Select Tax-Free Income Portfolio 2 |
| Portfolio of Investments (continued) |
| March 31, 2020 |
|
|
| Principal | | | Optional Call | | |
| Amount (000) | | Description (1) | Provisions (2) | Ratings (3) | Value |
| | California (continued) | | | |
| $ 2,500 | | Placentia-Yorba Linda Unified School District, Orange County, California, Certificates | No Opt. Call | A+ (5) | $ 1,886,950 |
| | of Participation, Series 2006, 0.000%, 10/01/34 – FGIC Insured (ETM) | | | |
| 2,755 | | Sacramento City Unified School District, Sacramento County, California, General | No Opt. Call | A2 | 2,491,098 |
| | Obligation Bonds, Series 2007, 0.000%, 7/01/25 – AGM Insured | | | |
| 1,395 | | San Diego Association of Governments, California, South Bay Expressway Toll Revenue | 7/27 at 100.00 | A | 1,654,247 |
| | Bonds, First Senior Lien Series 2017A, 5.000%, 7/01/42 | | | |
| 935 | | San Diego County Regional Airport Authority, California, Airport Revenue Bonds, | 7/29 at 100.00 | A+ | 1,104,123 |
| | Subordinate Series 2019B, 5.000%, 7/01/39 (AMT) | | | |
| 6,025 | | Simi Valley Unified School District, Ventura County, California, General Obligation | No Opt. Call | AA | 4,876,575 |
| | Bonds, Series 2007C, 0.000%, 8/01/30 | | | |
| 2,080 | | Tobacco Securitization Authority of Northern California, Tobacco Settlement Asset-Backed | 4/20 at 100.00 | B– | 1,949,542 |
| | Bonds, Series 2005A-1, 5.500%, 6/01/45 | | | |
| 50,270 | | Total California | | | 41,167,465 |
| | Colorado – 7.0% | | | |
| 540 | | Colorado Health Facilities Authority, Colorado, Revenue Bonds, CommonSpirit Health, | 8/29 at 100.00 | BBB+ | 533,612 |
| | Series 2019A-2, 4.000%, 8/01/49 | | | |
| 1,580 | | Colorado School of Mines Board of Trustees, Golden, Colorado, Institutional Enterprise | 12/27 at 100.00 | A+ | 1,885,698 |
| | Revenue Bonds, Series 2017B, 5.000%, 12/01/47 | | | |
| 1,935 | | Denver City and County, Colorado, Airport System Revenue Bonds, Subordinate Lien Series | 11/23 at 100.00 | A+ | 2,130,977 |
| | 2013B, 5.000%, 11/15/43 | | | |
| | E-470 Public Highway Authority, Colorado, Senior Revenue Bonds, Series 2000B: | | | |
| 5,140 | | 0.000%, 9/01/24 – NPFG Insured | No Opt. Call | A | 4,703,151 |
| 8,100 | | 0.000%, 9/01/29 – NPFG Insured | No Opt. Call | A | 6,360,363 |
| 4,475 | | 0.000%, 9/01/33 – NPFG Insured | No Opt. Call | A | 3,055,038 |
| 21,770 | | Total Colorado | | | 18,668,839 |
| | Connecticut – 3.2% | | | |
| 705 | | Connecticut Health and Educational Facilities Authority, Revenue Bonds, Yale-New Haven | 1/24 at 100.00 | AA– | 706,326 |
| | Health Issue, Series 2014D, 1.800%, 7/01/49 (Mandatory Put 7/01/24) | | | |
| 2,600 | | Connecticut State, General Obligation Bonds, Green Series 2014G, 5.000%, 11/15/31 | 11/24 at 100.00 | A1 | 2,947,256 |
| 1,000 | | Connecticut State, General Obligation Bonds, Refunding Series 2012E, 5.000%, 9/15/32 | 9/22 at 100.00 | A1 | 1,071,730 |
| 1,000 | | Connecticut State, General Obligation Bonds, Refunding Series 2018C, 5.000%, 6/15/26 | No Opt. Call | A1 | 1,184,310 |
| 2,490 | | Connecticut State, Special Tax Obligation Bonds, Transportation Infrastructure Purposes | 10/23 at 100.00 | A+ | 2,724,483 |
| | Series 2013A, 5.000%, 10/01/33 | | | |
| 7,795 | | Total Connecticut | | | 8,634,105 |
| | Florida – 4.1% | | | |
| 1,040 | | Broward County, Florida, Airport System Revenue Bonds, Series 2017, 5.000%, | 10/27 at 100.00 | A+ | 1,166,391 |
| | 10/01/47 (AMT) | | | |
| 2,105 | | Florida Development Finance Corporation, Florida, Surface Transportation Facility | No Opt. Call | Aaa | 2,103,716 |
| | Revenue Bonds, Virgin Trains USA Passenger Rail Project , Series 2019B, 0.620%, 1/01/49 | | | |
| | (Mandatory Put 6/18/20) (AMT) | | | |
| 1,155 | | Greater Orlando Aviation Authority, Florida, Orlando Airport Facilities Revenue Bonds, | 10/27 at 100.00 | A+ | 1,301,119 |
| | Priority Subordinated Series 2017, 5.000%, 10/01/47 (AMT) | | | |
| 1,500 | | Lakeland, Florida, Hospital System Revenue Bonds, Lakeland Regional Health, Series 2015, | 11/24 at 100.00 | A2 | 1,689,435 |
| | 5.000%, 11/15/45 | | | |
| 2,000 | | Miami-Dade County, Florida, Aviation Revenue Bonds, Refunding Series 2019A, 5.000%, | 10/29 at 100.00 | A | 2,269,600 |
| | 10/01/49 (AMT) | | | |
| 2,000 | | Miami-Dade County, Florida, General Obligation Bonds, Build Better Communities Program, | 7/25 at 100.00 | AA | 2,370,980 |
| | Series 2013A, 5.000%, 7/01/30 | | | |
| 9,800 | | Total Florida | | | 10,901,241 |
36
| | | | | | |
| Principal | | | Optional Call | | |
| Amount (000) | | Description (1) | Provisions (2) | Ratings (3) | Value |
| | Georgia – 0.5% | | | |
| $ 1,330 | | Brookhaven Development Authority, Georgia, Revenue Bonds, Children’s Healthcare of | 7/29 at 100.00 | AA+ | $ 1,432,689 |
| | Atlanta, Inc Project, Series 2019A, 4.000%, 7/01/44 | | | |
| | Guam – 2.3% | | | |
| 3,000 | | Government of Guam, Business Privilege Tax Bonds, Refunding Series 2015D, | 11/25 at 100.00 | BB | 2,947,170 |
| | 5.000%, 11/15/39 | | | |
| 1,675 | | Government of Guam, Hotel Occupancy Tax Revenue Bonds, Series 2011A, 6.000%, 11/01/26 | 5/21 at 100.00 | BB | 1,712,419 |
| 1,460 | | Guam Government Waterworks Authority, Water and Wastewater System Revenue Bonds, Series | 7/26 at 100.00 | A– | 1,455,766 |
| | 2016, 5.000%, 1/01/46 | | | |
| 6,135 | | Total Guam | | | 6,115,355 |
| | Idaho – 1.6% | | | |
| 4,000 | | Idaho Health Facilities Authority, Revenue Bonds, Saint Luke’s Health System Project, | 3/24 at 100.00 | A– | 4,388,360 |
| | Series 2014A, 5.000%, 3/01/44 | | | |
| | Illinois – 9.8% | | | |
| 1,615 | | Board of Trustees of Southern Illinois University, Housing and Auxiliary Facilities | No Opt. Call | Baa2 | 1,507,538 |
| | System Revenue Bonds, Series 1999A, 0.000%, 4/01/23 – NPFG Insured | | | |
| 750 | | Chicago Board of Education, Illinois, Dedicated Capital Improvement Tax Revenue Bonds, | 4/27 at 100.00 | A | 797,617 |
| | Series 2016, 6.000%, 4/01/46 | | | |
| 735 | | Chicago Board of Education, Illinois, General Obligation Bonds, Dedicated Revenues | 12/21 at 100.00 | BB | 724,681 |
| | Series 2011A, 5.000%, 12/01/41 | | | |
| 760 | | Chicago Board of Education, Illinois, General Obligation Bonds, Dedicated Revenues, | 12/27 at 100.00 | BB | 777,351 |
| | Refunding Series 2017C, 5.000%, 12/01/30 | | | |
| 365 | | Chicago Board of Education, Illinois, General Obligation Bonds, Dedicated Revenues, | 12/26 at 100.00 | BB | 395,145 |
| | Series 2016B, 6.500%, 12/01/46 | | | |
| 2,245 | | Illinois Finance Authority, Revenue Bonds, Northwestern Memorial HealthCare, Series | 8/22 at 100.00 | AA+ | 2,378,241 |
| | 2013, 5.000%, 8/15/43 | | | |
| 2,190 | | Illinois State, General Obligation Bonds, Refunding Series 2012, 5.000%, 8/01/23 | No Opt. Call | BBB | 2,273,767 |
| 2,500 | | Illinois Toll Highway Authority, Toll Highway Revenue Bonds, Senior Lien Series 2019A, | 7/29 at 100.00 | AA– | 2,762,600 |
| | 4.000%, 1/01/39 | | | |
| | Metropolitan Pier and Exposition Authority, Illinois, Revenue Bonds, McCormick Place | | | |
| | Expansion Project, Series 2002A: | | | |
| 6,350 | | 0.000%, 12/15/31 – NPFG Insured | No Opt. Call | BBB | 4,347,337 |
| 1,350 | | 0.000%, 6/15/35 – NPFG Insured | No Opt. Call | BBB | 779,450 |
| 5,000 | | 0.000%, 12/15/36 – NPFG Insured | No Opt. Call | BBB | 2,702,100 |
| 9,370 | | 0.000%, 6/15/39 – NPFG Insured | No Opt. Call | BBB | 4,532,082 |
| 1,825 | | Springfield, Illinois, Electric Revenue Bonds, Senior Lien Series 2015, 5.000%, 3/01/28 | 3/25 at 100.00 | A | 2,106,086 |
| 35,055 | | Total Illinois | | | 26,083,995 |
| | Indiana – 2.4% | | | |
| 1,600 | | Indiana Bond Bank, Special Program Bonds, Carmel Junior Waterworks Project, Series | No Opt. Call | AA | 1,250,512 |
| | 2008B, 0.000%, 6/01/30 – AGM Insured | | | |
| 2,040 | | Indiana Finance Authority, Hospital Revenue Bonds, Indiana University Health Obligation | 6/25 at 100.00 | AA | 2,368,420 |
| | Group, Refunding 2015A, 5.000%, 12/01/40 | | | |
| 2,500 | | Indiana Finance Authority, Wastewater Utility Revenue Bonds, CWA Authority Project, | 10/24 at 100.00 | AA | 2,845,125 |
| | Series 2015A, 5.000%, 10/01/45 | | | |
| 6,140 | | Total Indiana | | | 6,464,057 |
| | Iowa – 1.6% | | | |
| 710 | | Iowa Finance Authority, Iowa, Midwestern Disaster Area Revenue Bonds, Iowa Fertilizer | 5/20 at 104.00 | BB– | 717,725 |
| | Company Project, Series 2016, 5.875%, 12/01/26, 144A | | | |
| 830 | | Iowa Finance Authority, Iowa, Midwestern Disaster Area Revenue Bonds, Iowa Fertilizer | 12/22 at 105.00 | BB– | 851,513 |
| | Company Project, Series 2018B, 5.250%, 12/01/50 (Mandatory Put 12/01/37) | | | |
37
| | |
| NXQ | Nuveen Select Tax-Free Income Portfolio 2 |
| Portfolio of Investments (continued) |
| March 31, 2020 |
| | | | | | |
| Principal | | | Optional Call | | |
| Amount (000) | | Description (1) | Provisions (2) | Ratings (3) | Value |
| | Iowa (continued) | | | |
| $ 1,645 | | Iowa Tobacco Settlement Authority, Asset Backed Settlement Revenue Bonds, Series 2005C, | 5/20 at 100.00 | B– | $ 1,613,696 |
| | 5.375%, 6/01/38 | | | |
| 1,000 | | Iowa Tobacco Settlement Authority, Tobacco Asset-Backed Revenue Bonds, Series 2005B, | 5/20 at 100.00 | B– | 988,940 |
| | 5.600%, 6/01/34 | | | |
| 4,185 | | Total Iowa | | | 4,171,874 |
| | Kentucky – 1.3% | | | |
| 2,500 | | Kentucky Economic Development Finance Authority, Hospital Revenue Bonds, Baptist | 8/21 at 100.00 | A | 2,604,575 |
| | Healthcare System Obligated Group, Series 2011, 5.250%, 8/15/46 | | | |
| 805 | | Kentucky Public Transportation Infrastructure Authority, First Tier Toll Revenue Bonds, | 7/31 at 100.00 | Baa3 | 801,450 |
| | Downtown Crossing Project, Convertible Capital Appreciation Series 2013C, 0.000%, 7/01/43 (4) | | | |
| 3,305 | | Total Kentucky | | | 3,406,025 |
| | Louisiana – 0.8% | | | |
| 1,870 | | Jefferson Sales Tax District, Jefferson Parish, Louisiana, Special Sales Tax Revenue | 12/27 at 100.00 | AA | 2,255,295 |
| | Bonds, Series 2017B, 5.000%, 12/01/42 – AGM Insured | | | |
| | Maryland – 0.4% | | | |
| 1,000 | | Maryland Health and Higher Educational Facilities Authority, Revenue Bonds, Johns | 7/22 at 100.00 | Aa2 (5) | 1,084,450 |
| | Hopkins Health System Obligated Group Issue, Series 2012B, 5.000%, 7/01/27 | | | |
| | (Pre-refunded 7/01/22) | | | |
| | Massachusetts – 6.5% | | | |
| 2,200 | | Massachusetts Bay Transportation Authority, Assessment Bonds, Series 2012A, | 7/22 at 100.00 | AAA | 2,359,830 |
| | 5.000%, 7/01/41 | | | |
| 2,000 | | Massachusetts Development Finance Agency, Revenue Bonds, Boston College, Series 2010R-1, | 7/20 at 100.00 | AA– | 2,017,860 |
| | 5.000%, 7/01/40 | | | |
| 2,000 | | Massachusetts Development Finance Agency, Revenue Bonds, CareGroup Issue, Series | 7/28 at 100.00 | A | 2,358,660 |
| | 2018J-2, 5.000%, 7/01/43 | | | |
| 1,675 | | Massachusetts Development Finance Agency, Revenue Bonds, Olin College, Series 2013E, | 11/23 at 100.00 | A+ | 1,828,095 |
| | 5.000%, 11/01/43 | | | |
| 2,250 | | Massachusetts Development Finance Agency, Revenue Bonds, Partners HealthCare System, | 7/23 at 100.00 | AA– (5) | 2,526,052 |
| | Series 2014M-4, 5.000%, 7/01/44 (Pre-refunded 7/01/23) | | | |
| 400 | | Massachusetts Development Finance Agency, Revenue Bonds, UMass Memorial Health Care | 7/27 at 100.00 | A– | 389,076 |
| | Obligated Group Issue, Series 2017L, 3.625%, 7/01/37 | | | |
| 2,100 | | Massachusetts School Building Authority, Dedicated Sales Tax Revenue Bonds, Subordinated | 2/26 at 100.00 | AA+ | 2,435,832 |
| | Series 2019A, 5.000%, 2/15/49 | | | |
| 2,115 | | Massachusetts State, Federal Highway Grant Anticipation Notes, Accelerated Bridge | 6/27 at 100.00 | AA+ | 2,522,645 |
| | Program, Series 2017A, 5.000%, 6/01/42 | | | |
| 730 | | Massachusetts Water Resources Authority, General Revenue Bonds, Refunding Series 2011C, | 8/21 at 100.00 | AA+ (5) | 770,895 |
| | 5.250%, 8/01/42 (Pre-refunded 8/01/21) | | | |
| 15,470 | | Total Massachusetts | | | 17,208,945 |
| | Michigan – 1.2% | | | |
| 355 | | Detroit Water and Sewerage Department, Michigan, Sewage Disposal System Revenue Bonds, | 7/22 at 100.00 | AA– | 380,780 |
| | Refunding Senior Lien Series 2012A, 5.250%, 7/01/39 | | | |
| 385 | | Michigan State Building Authority, Revenue Bonds, Facilities Program, Refunding Series | 10/25 at 100.00 | Aa2 | 446,157 |
| | 2015-I, 5.000%, 4/15/38 | | | |
| 2,000 | | Michigan State Building Authority, Revenue Bonds, Facilities Program, Refunding Series | 10/26 at 100.00 | Aa2 | 2,381,600 |
| | 2016-I, 5.000%, 4/15/35 | | | |
| 2,740 | | Total Michigan | | | 3,208,537 |
| | Nebraska – 0.8% | | | |
| 545 | | Douglas County Hospital Authority 3, Nebraska, Health Facilities Revenue Bonds, Nebraska | 11/25 at 100.00 | A | 588,665 |
| | Methodist Health System, Refunding Series 2015, 4.125%, 11/01/36 | | | |
38
| | | | | | |
| Principal | | | Optional Call | | |
| Amount (000) | | Description (1) | Provisions (2) | Ratings (3) | Value |
| | Nebraska (continued) | | | |
| $ 305 | | Madison County Hospital Authority 1, Nebraska, Hospital Revenue Bonds, Faith Regional | 7/25 at 100.00 | BBB | $ 351,351 |
| | Health Services Project, Series 2018, 5.000%, 7/01/27 | | | |
| 1,000 | | Nebraska Public Power District, General Revenue Bonds, Series 2015A-2, 5.000%, 1/01/40 | 1/22 at 100.00 | A+ | 1,061,640 |
| 1,850 | | Total Nebraska | | | 2,001,656 |
| | Nevada – 1.7% | | | |
| 990 | | Carson City, Nevada, Hospital Revenue Bonds, Carson Tahoe Regional Healthcare Project, | 9/27 at 100.00 | A– | 1,165,923 |
| | Series 2017A, 5.000%, 9/01/37 | | | |
| 3,000 | | Las Vegas Valley Water District, Nevada, General Obligation Bonds, Refunding Series | 12/24 at 100.00 | AA+ | 3,460,710 |
| | 2015, 5.000%, 6/01/34 | | | |
| 3,990 | | Total Nevada | | | 4,626,633 |
| | New Jersey – 2.5% | | | |
| 2,000 | | New Jersey Economic Development Authority, School Facilities Construction Bonds, | 12/26 at 100.00 | A– | 2,199,820 |
| | Refunding Series 2016BBB, 5.500%, 6/15/31 | | | |
| 2,165 | | New Jersey Economic Development Authority, School Facilities Construction Financing | 3/21 at 100.00 | A– | 2,230,080 |
| | Program Bonds, Refunding Series 2011GG, 5.000%, 9/01/22 | | | |
| 2,000 | | New Jersey Transportation Trust Fund Authority, Transportation System Bonds, Series | 6/25 at 100.00 | A– | 2,154,160 |
| | 2015AA, 5.250%, 6/15/29 | | | |
| 6,165 | | Total New Jersey | | | 6,584,060 |
| | New Mexico – 0.7% | | | |
| 800 | | New Mexico Hospital Equipment Loan Council, First Mortgage Revenue Bonds, Haverland | 7/22 at 100.00 | BBB– | 799,936 |
| | Carter Lifestyle Group, Series 2013, 5.000%, 7/01/42 | | | |
| 1,000 | | New Mexico Mortgage Finance Authority, Multifamily Housing Revenue Bonds, St Anthony, | 4/20 at 100.00 | N/R | 1,001,280 |
| | Series 2007A, 5.250%, 9/01/42 (AMT) | | | |
| 1,800 | | Total New Mexico | | | 1,801,216 |
| | New York – 1.3% | | | |
| | Hudson Yards Infrastructure Corporation, New York, Revenue Bonds, Senior Fiscal 2012 | | | |
| | Series 2011A: | | | |
| 25 | | 5.250%, 2/15/47 (Pre-refunded 2/15/21) | 2/21 at 100.00 | Aa2 (5) | 25,893 |
| 475 | | 5.250%, 2/15/47 | 2/21 at 100.00 | Aa2 | 489,525 |
| 1,250 | | Metropolitan Transportation Authority, New York, Transportation Revenue Bonds, Refunding | 11/22 at 100.00 | AA– | 1,330,175 |
| | Series 2012F, 5.000%, 11/15/26 | | | |
| 1,135 | | Port Authority of New York and New Jersey, Special Project Bonds, JFK International Air | 12/20 at 100.00 | BBB+ | 1,149,517 |
| | Terminal LLC Project, Eighth Series 2010, 6.000%, 12/01/42 | | | |
| 500 | | TSASC Inc, New York, Tobacco Settlement Asset-Backed Bonds, Fiscal 2017 Series B, | No Opt. Call | B– | 529,000 |
| | 5.000%, 6/01/24 | | | |
| 3,385 | | Total New York | | | 3,524,110 |
| | Ohio – 0.7% | | | |
| 330 | | Buckeye Tobacco Settlement Financing Authority, Ohio, Tobacco Settlement Asset-Backed | 6/30 at 100.00 | BBB+ | 354,222 |
| | Revenue Bonds, Refunding Senior Lien Series 2020A-2 Class 1, 4.000%, 6/01/48 | | | |
| 315 | | Buckeye Tobacco Settlement Financing Authority, Ohio, Tobacco Settlement Asset-Backed | 6/30 at 100.00 | N/R | 279,956 |
| | Revenue Bonds, Refunding Senior Lien Series 2020B-2 Class 2, 5.000%, 6/01/55 | | | |
| 1,105 | | Ohio Turnpike Commission, Turnpike Revenue Bonds, Infrastructure Project, Junior Lien | 2/23 at 100.00 | Aa3 (5) | 1,225,059 |
| | Series 2013A-1, 5.000%, 2/15/48 (Pre-refunded 2/15/23) | | | |
| 1,000 | | Ohio Water Development Authority, Pollution Control Revenue Bonds, FirstEnergy Nuclear | No Opt. Call | N/R | 3,750 |
| | Generating Corporation Project, Refunding Series 2005B, 4.000%, 1/01/34 (6) | | | |
| 2,750 | | Total Ohio | | | 1,862,987 |
39
| | |
| NXQ | Nuveen Select Tax-Free Income Portfolio 2 |
| Portfolio of Investments (continued) |
| March 31, 2020 |
|
|
| Principal | | | Optional Call | | |
| Amount (000) | | Description (1) | Provisions (2) | Ratings (3) | Value |
| | Oklahoma – 0.2% | | | |
| $ 450 | | Oklahoma Development Finance Authority, Health System Revenue Bonds, OU Medicine | 8/28 at 100.00 | Baa3 | $ 519,921 |
| | Project, Series 2018B, 5.000%, 8/15/38 | | | |
| | Oregon – 1.1% | | | |
| 915 | | Beaverton School District 48J, Washington and Multnomah Counties, Oregon, General | 6/27 at 100.00 | AA+ | 1,129,284 |
| | Obligation Bonds, Convertible Deferred Interest Series 2017D, 5.000%, 6/15/36 | | | |
| 60 | | Clackamas Community College District, Oregon, General Obligation Bonds, Deferred | 6/27 at 100.00 | Aa1 | 71,264 |
| | Interest Series 2017A, 0.000%, 6/15/40 (4) | | | |
| 500 | | Lake Oswego, Oregon, General Obligation Bonds, Series 2013, 5.000%, 6/01/26 | 6/23 at 100.00 | AAA | 558,590 |
| 1,090 | | Oregon Facilities Authority, Revenue Bonds, Reed College, Series 2017A, 4.000%, 7/01/41 | 7/27 at 100.00 | Aa2 | 1,224,277 |
| 2,565 | | Total Oregon | | | 2,983,415 |
| | Pennsylvania – 3.0% | | | |
| 1,255 | | Delaware River Port Authority, New Jersey and Pennsylvania, Revenue Bonds, Series 2013, | 1/24 at 100.00 | A+ | 1,404,132 |
| | 5.000%, 1/01/37 | | | |
| 1,500 | | Pennsylvania Higher Educational Facilities Authority, Revenue Bonds, State System of | 6/26 at 100.00 | Aa3 | 1,773,570 |
| | Higher Education, Refunding Series 2016AT-1, 5.000%, 6/15/31 | | | |
| | Pennsylvania Turnpike Commission, Motor License Fund-Enhanced Subordinate Special | | | |
| | Revenue Bonds, Series 2010B-2: | | | |
| 555 | | 5.000%, 12/01/30 (Pre-refunded 12/01/20) | 12/20 at 100.00 | N/R (5) | 568,858 |
| 300 | | 5.000%, 12/01/30 (Pre-refunded 12/01/20) | 12/20 at 100.00 | N/R (5) | 307,491 |
| 645 | | 5.000%, 12/01/30 (Pre-refunded 12/01/20) | 12/20 at 100.00 | A2 (5) | 661,106 |
| 2,970 | | Philadelphia, Pennsylvania, Water and Wastewater Revenue Bonds, Series 2015A, | 7/24 at 100.00 | A+ | 3,298,749 |
| | 5.000%, 7/01/40 | | | |
| 7,225 | | Total Pennsylvania | | | 8,013,906 |
| | Puerto Rico – 1.1% | | | |
| 1,035 | | Puerto Rico Housing Finance Authority, Capital Fund Program Revenue Bonds, Series 2003, | 5/20 at 100.00 | AA– | 1,049,272 |
| | 5.000%, 12/01/20 | | | |
| 1,080 | | Puerto Rico Sales Tax Financing Corporation, Sales Tax Revenue Bonds, Restructured | 7/28 at 100.00 | N/R | 1,052,946 |
| | 2018A-1, 5.000%, 7/01/58 | | | |
| 940 | | Puerto Rico Sales Tax Financing Corporation, Sales Tax Revenue Bonds, Taxable | 7/28 at 100.00 | N/R | 882,679 |
| | Restructured Cofina Project Series 2019A-2, 4.784%, 7/01/58 | | | |
| 3,055 | | Total Puerto Rico | | | 2,984,897 |
| | South Carolina – 0.6% | | | |
| 1,500 | | Richland County School District 2, South Carolina, General Obligation Bonds, Refunding | 5/23 at 100.00 | Aa1 | 1,566,345 |
| | Series 2012B, 3.050%, 5/01/27 | | | |
| | South Dakota – 0.3% | | | |
| 600 | | South Dakota Health and Educational Facilities Authority, Revenue Bonds, Sanford Health, | 11/25 at 100.00 | A+ | 693,780 |
| | Series 2015, 5.000%, 11/01/35 | | | |
| | Texas – 10.5% | | | |
| 1,880 | | Alamo Regional Mobility Authority, Texas, Vehicle Registration Fee Revenue Bonds, Senior | 6/25 at 100.00 | AA+ | 2,133,744 |
| | Lien Series 2016, 5.000%, 6/15/46 | | | |
| 250 | | Central Texas Regional Mobility Authority, Revenue Bonds, Senior Lien Series 2011, | 1/21 at 100.00 | A– (5) | 258,990 |
| | 6.000%, 1/01/41 (Pre-refunded 1/01/21) | | | |
| 240 | | Central Texas Regional Mobility Authority, Revenue Bonds, Senior Lien, Series 2015A, | 7/25 at 100.00 | A– | 259,798 |
| | 5.000%, 1/01/35 | | | |
| 5,560 | | Grand Parkway Transportation Corporation, Texas, System Toll Revenue Bonds, First Tier | 10/23 at 100.00 | A+ (5) | 6,399,115 |
| | Series 2013A, 5.500%, 4/01/53 (Pre-refunded 10/01/23) | | | |
| 1,160 | | Harris County Cultural Education Facilities Finance Corporation, Texas, Revenue Bonds, | 6/25 at 100.00 | AA | 1,320,927 |
| | Houston Methodist Hospital System, Series 2015, 5.000%, 12/01/45 | | | |
40
| | | | | | |
| Principal | | | Optional Call | | |
| Amount (000) | | Description (1) | Provisions (2) | Ratings (3) | Value |
| | Texas (continued) | | | |
| $ 1,250 | | Harris County Flood Control District, Texas, Contract Tax Bonds, Refunding Series 2017A, | 10/27 at 100.00 | AAA | $ 1,439,250 |
| | 4.000%, 10/01/35 | | | |
| | Harris County-Houston Sports Authority, Texas, Revenue Bonds, Junior Lien Series 2001H: | | | |
| 110 | | 0.000%, 11/15/24 – NPFG Insured (ETM) | No Opt. Call | Baa2 (5) | 102,616 |
| 520 | | 0.000%, 11/15/24 – NPFG Insured | No Opt. Call | Baa2 | 472,363 |
| 12,480 | | 0.000%, 11/15/41 – NPFG Insured | 11/31 at 53.78 | Baa2 | 4,833,504 |
| 575 | | Houston, Texas, Hotel Occupancy Tax and Special Revenue Bonds, Convention and | No Opt. Call | A | 532,306 |
| | Entertainment Project, Series 2001B, 0.000%, 9/01/24 – AMBAC Insured | | | |
| 2,255 | | Love Field Airport Modernization Corporation, Texas, Special Facilities Revenue Bonds, | 11/20 at 100.00 | Baa1 | 2,226,970 |
| | Southwest Airlines Company, Series 2010, 5.250%, 11/01/40 | | | |
| 155 | | Mission Economic Development Corporation, Texas, Revenue Bonds, Natgasoline Project, | 10/21 at 105.00 | BB– | 158,624 |
| | Senior Lien Series 2018, 4.625%, 10/01/31, 144A (AMT) | | | |
| 1,025 | | North Texas Tollway Authority, System Revenue Bonds, Refunding First Tier, Series 2015B, | 1/23 at 100.00 | A+ | 1,117,680 |
| | 5.000%, 1/01/40 | | | |
| 200 | | Tarrant County Cultural Education Facilities Finance Corporation, Texas, Hospital | 5/26 at 100.00 | AA– | 217,078 |
| | Revenue Bonds, Scott & White Healthcare Project, Series 2016A, 4.000%, 11/15/42 | | | |
| 5,000 | | Texas Municipal Gas Acquisition and Supply Corporation III, Gas Supply Revenue Bonds, | 12/22 at 100.00 | A3 | 5,229,750 |
| | Series 2012, 5.000%, 12/15/26 | | | |
| 2,000 | | Wylie Independent School District, Collin County, Texas, General Obligation Bonds, | 8/20 at 56.85 | AAA | 1,130,720 |
| | School Building Series 2010, 0.000%, 8/15/31 | | | |
| 34,660 | | Total Texas | | | 27,833,435 |
| | Virginia – 2.0% | | | |
| 985 | | Metropolitan Washington Airports Authority, Virginia, Dulles Toll Road Revenue Bonds, | 10/29 at 100.00 | A– | 1,009,743 |
| | Dulles Metrorail & Capital improvement Projects, Refunding & Subordinate Lien Series 2019B, | | | |
| | 4.000%, 10/01/44 | | | |
| 1,500 | | Metropolitan Washington Airports Authority, Virginia, Dulles Toll Road Revenue Bonds, | 10/26 at 100.00 | AA | 1,850,460 |
| | Dulles Metrorail & Capital improvement Projects, Second Senior Lien Series 2009C, 6.500%, | | | |
| | 10/01/41 – AGC Insured | | | |
| | Virginia Small Business Financing Authority, Senior Lien Revenue Bonds, Elizabeth River | | | |
| | Crossing, Opco LLC Project, Series 2012: | | | |
| 1,000 | | 5.250%, 1/01/32 (AMT) | 7/22 at 100.00 | BBB | 1,015,790 |
| 410 | | 6.000%, 1/01/37 (AMT) | 7/22 at 100.00 | BBB | 422,706 |
| 1,010 | | 5.500%, 1/01/42 (AMT) | 7/22 at 100.00 | BBB | 1,025,887 |
| 4,905 | | Total Virginia | | | 5,324,586 |
| | Washington – 4.9% | | | |
| 395 | | Port of Seattle, Washington, Revenue Bonds, Intermediate Lien Series 2019, 5.000%, | 4/29 at 100.00 | AA– | 450,557 |
| | 4/01/44 (AMT) | | | |
| 860 | | Snohomish County School District 306 Lakewood, Washington, General Obligation Bonds, | 6/24 at 100.00 | Aaa | 990,832 |
| | Series 2014, 5.000%, 12/01/28 | | | |
| 4,000 | | Washington Health Care Facilities Authority, Revenue Bonds, Catholic Health Initiative, | 1/23 at 100.00 | BBB+ | 4,459,400 |
| | Series 2013A, 5.750%, 1/01/45 | | | |
| 990 | | Washington Health Care Facilities Authority, Revenue Bonds, Fred Hutchinson Cancer | 1/21 at 100.00 | A+ | 1,013,809 |
| | Research Center, Series 2011A, 5.625%, 1/01/35 | | | |
| 1,500 | | Washington State Convention Center Public Facilities District, Lodging Tax Revenue | 7/28 at 100.00 | AA– | 1,782,510 |
| | Bonds, Series 2018, 5.000%, 7/01/58 | | | |
| 1,130 | | Washington State, General Obligation Bonds, Various Purpose Series 2015B, | 2/25 at 100.00 | Aaa | 1,304,156 |
| | 5.000%, 2/01/37 | | | |
| 2,535 | | Washington State, General Obligation Bonds, Various Purpose Series 2017A, | 8/26 at 100.00 | Aaa | 3,015,560 |
| | 5.000%, 8/01/38 | | | |
| 11,410 | | Total Washington | | | 13,016,824 |
| | Wisconsin – 2.4% | | | |
| 1,645 | | Wisconsin Health and Educational Facilities Authority, Revenue Bonds, Mercy Alliance, | 6/22 at 100.00 | A3 | 1,727,217 |
| | Inc, Series 2012, 5.000%, 6/01/39 | | | |
41
| | |
| NXQ | Nuveen Select Tax-Free Income Portfolio 2 |
| Portfolio of Investments (continued) |
| March 31, 2020 |
| | | | | | |
| Principal | | | Optional Call | | |
| Amount (000) | | Description (1) | Provisions (2) | Ratings (3) | Value |
| | Wisconsin (continued) | | | |
| $ 2,000 | | Wisconsin Health and Educational Facilities Authority, Revenue Bonds, Gundersen | 10/21 at 100.00 | AA– | $ 2,037,380 |
| | Lutheran, Series 2011A, 5.250%, 10/15/39 | | | |
| 2,355 | | Wisconsin Health and Educational Facilities Authority, Wisconsin, Revenue Bonds, Medical | 11/26 at 100.00 | AA– | 2,754,502 |
| | College of Wisconsin, Inc, Series 2016, 5.000%, 12/01/41 | | | |
| 6,000 | | Total Wisconsin | | | 6,519,099 |
| $ 275,290 | | Total Municipal Bonds (cost $231,200,910) | | | 258,363,080 |
|
| Shares | | Description (1) | | | Value |
| | COMMON STOCKS – 0.3% | | | |
| | Electric Utilities – 0.3% | | | |
| 32,091 | | Energy Harbor Corp (7), (8) | | | $ 726,059 |
| | Total Common Stocks (cost $851,221) | | | 726,059 |
| | Total Long-Term Investments (cost $232,052,131) | | | 259,089,139 |
|
| Principal | | | Optional Call | | |
| Amount (000) | | Description (1) | Provisions (2) | Ratings (3) | Value |
| | SHORT-TERM INVESTMENTS – 2.0% | | | |
| | MUNICIPAL BONDS – 2.0% | | | |
| | Florida – 0.5% | | | |
| $ 1,345 | | Florida Development Finance Corporation, Florida, Surface Transportation Facility | 6/20 at 104.00 | N/R | $ 1,218,019 |
| | Revenue Bonds, Virgin Trains USA Passenger Rail Project, Variable Rate Demand Obligations, | | | |
| | Series 2019A, 6.250%, 1/01/49 (Mandatory Put 1/01/24), 144A (AMT) (9) | | | |
| | Louisiana – 1.5% | | | |
| 4,000 | | East Baton Rouge Parish, Louisiana, Sales Tax Revenue Bonds, Refunding Road & Street | 5/20 at 100.00 | F1 | 4,000,000 |
| | Improvement, Variable Rate Demand Obligations, Series 2008A, 4.850%, 8/01/30 | | | |
| | (Mandatory Put 5/06/20) (9) | | | |
| $ 5,345 | | Total Short-Term Investments (cost $5,345,000) | | | 5,218,019 |
| | Total Investments (cost $237,397,131) – 99.3% | | | 264,307,158 |
| | Other Assets Less Liabilities – 0.7% | | | 1,957,483 |
| | Net Assets Applicable to Common Shares – 100% | | | $ 266,264,641 |
| | |
(1) | All percentages shown in the Portfolio of Investments are based on net assets applicable to common shares unless otherwise noted. |
(2) | Optional Call Provisions: Dates (month and year) and prices of the earliest optional call or redemption. There may be other call provisions at varying prices at later dates. Certain mortgage-backed securities may be subject to periodic principal paydowns. Optional Call Provisions are not covered by the report of independent registered public accounting firm. |
(3) | For financial reporting purposes, the ratings disclosed are the highest of Standard & Poor’s Group (“Standard & Poor’s”), Moody’s Investors Service, Inc. (“Moody’s”) or Fitch, Inc. (“Fitch”) rating. This treatment of split-rated securities may differ from that used for other purposes, such as for Fund investment policies. Ratings below BBB by Standard & Poor’s, Baa by Moody’s or BBB by Fitch are considered to be below investment grade. Holdings designated N/R are not rated by any of these national rating agencies. Ratings are not covered by the report of independent registered public accounting firm. |
(4) | Step-up coupon bond, a bond with a coupon that increases (“steps up”), usually at regular intervals, while the bond is outstanding. The rate shown is the coupon as of the end of the reporting period. |
(5) | Backed by an escrow or trust containing sufficient U.S. Government or U.S. Government agency securities, which ensure the timely payment of principal and interest. |
(6) | Defaulted security. A security whose issuer has failed to fully pay principal and/or interest when due, or is under the protection of bankruptcy. |
(7) | For fair value measurement disclosure purposes, investment classified as Level 2. See Notes to Financial Statements, Note 3 – Investment Valuation and Fair Value Measurements for more information. |
(8) | Common Stock received as part of the bankruptcy settlement for Ohio Water Development Authority, Pollution Control Revenue Refunding Bonds, FirstEnergy Nuclear Generating Corporation Project, Series 2005B, 0.000%, 1/01/34. |
(9) | Investment has a maturity of greater than one year, but has variable rate and/or demand features which qualify it as a short-term investment. The rate disclosed, as well as the reference rate and spread, where applicable, is that in effect as of the end of the reporting period. This rate changes periodically based on market conditions or a specified market index. |
144A | Investment is exempt from registration under Rule 144A of the Securities Act of 1933, as amended. These investments may only be resold in transactions exempt from registration, which are normally those transactions with qualified institutional buyers. |
AMT | Alternative Minimum Tax |
ETM | Escrowed to maturity |
| See accompanying notes to financial statements. |
42
| | |
| NXR | Nuveen Select Tax-Free Income Portfolio 3 |
| Portfolio of Investments |
| March 31, 2020 |
| | | | | | |
| Principal | | | Optional Call | | |
| Amount (000) | | Description (1) | Provisions (2) | Ratings (3)�� | Value |
| | LONG-TERM INVESTMENTS – 98.7% | | | |
| | MUNICIPAL BONDS – 98.4% | | | |
| | Alabama – 0.6% | | | |
| $ 1,170 | | Birmingham, Alabama, General Obligation Convertible Capital Appreiciation Bonds, Series | 3/23 at 100.00 | AA | $ 1,283,233 |
| | 2013A, 5.000%, 3/01/32 | | | |
| | Alaska – 1.3% | | | |
| 2,675 | | Northern Tobacco Securitization Corporation, Alaska, Tobacco Settlement Asset-Backed | 4/20 at 100.00 | B3 | 2,675,294 |
| | Bonds, Series 2006A, 5.000%, 6/01/32 | | | |
| | Arizona – 1.0% | | | |
| 1,950 | | Glendale Municipal Property Corporation, Arizona, Excise Tax Revenue Bonds, Subordinate | 1/23 at 100.00 | AA | 2,051,478 |
| | Series 2012C, 4.000%, 7/01/38 | | | |
| 145 | | Maricopa County Industrial Development Authority, Arizona, Education Revenue Bonds, | No Opt. Call | BB+ | 142,667 |
| | Paradise Schools Projects, Series 2016, 2.875%, 7/01/21, 144A | | | |
| 2,095 | | Total Arizona | | | 2,194,145 |
| | California – 25.0% | | | |
| | Anaheim Public Financing Authority, California, Lease Revenue Bonds, Public Improvement | | | |
| | Project, Series 1997C: | | | |
| 6,740 | | 0.000%, 9/01/35 – AGM Insured (ETM) | No Opt. Call | AA (4) | 4,959,561 |
| 5,760 | | 0.000%, 9/01/35 – AGM Insured | No Opt. Call | AA | 4,002,451 |
| 1,000 | | California County Tobacco Securitization Agency, Tobacco Settlement Asset-Backed Bonds, | 4/20 at 100.00 | B2 | 992,220 |
| | Los Angeles County Securitization Corporation, Series 2006A, 5.600%, 6/01/36 | | | |
| 1,095 | | California County Tobacco Securitization Agency, Tobacco Settlement Asset-Backed Bonds, | 5/20 at 100.00 | BB+ | 1,095,427 |
| | Sonoma County Tobacco Securitization Corporation, Series 2005, 5.000%, 6/01/26 | | | |
| 105 | | California Statewide Financing Authority, Tobacco Settlement Asset-Backed Bonds, Pooled | 5/20 at 100.00 | Baa1 | 105,023 |
| | Tobacco Securitization Program, Series 2002A, 5.625%, 5/01/29 | | | |
| 2,275 | | Folsom Cordova Unified School District, Sacramento County, California, General | No Opt. Call | AA– | 1,940,666 |
| | Obligation Bonds, School Facilities Improvement District 4, Series 2007A, 0.000%, 10/01/28 – | | | |
| | NPFG Insured | | | |
| 3,370 | | Golden State Tobacco Securitization Corporation, California, Enhanced Tobacco Settlement | No Opt. Call | Aa3 | 2,806,469 |
| | Asset-Backed Revenue Bonds, Series 2005A, 0.000%, 6/01/28 – AMBAC Insured | | | |
| 4,055 | | Kern Community College District, California, General Obligation Bonds, Series 2003A, | No Opt. Call | Aa2 | 3,490,463 |
| | 0.000%, 3/01/28 – FGIC Insured | | | |
| 1,160 | | Mount San Antonio Community College District, Los Angeles County, California, General | 8/35 at 100.00 | Aa1 | 1,191,332 |
| | Obligation Bonds, Election of 2008, Series 2013A, 0.000%, 8/01/43 (5) | | | |
| 11,985 | | Norwalk La Mirada Unified School District, Los Angeles County, California, General | No Opt. Call | AA | 9,156,780 |
| | Obligation Bonds, Election 2002, Series 2007C, 0.000%, 8/01/32 – AGM Insured | | | |
| 3,000 | | Palomar Pomerado Health, California, General Obligation Bonds, Capital Appreciation, | No Opt. Call | A2 | 2,725,080 |
| | Election of 2004, Series 2007A, 0.000%, 8/01/25 – NPFG Insured | | | |
| 8,040 | | Placentia-Yorba Linda Unified School District, Orange County, California, Certificates | No Opt. Call | A+ (4) | 6,068,431 |
| | of Participation, Series 2006, 0.000%, 10/01/34 – FGIC Insured (ETM) | | | |
| 1,500 | | Placer Union High School District, Placer County, California, General Obligation Bonds, | No Opt. Call | AA | 1,158,690 |
| | Series 2004C, 0.000%, 8/01/32 – AGM Insured | | | |
| 8,000 | | Poway Unified School District, San Diego County, California, General Obligation Bonds, | No Opt. Call | AA– | 6,263,200 |
| | School Facilities Improvement District 2007-1, Election 2008 Series 2009A, 0.000%, 8/01/32 | | | |
| 3,940 | | Rancho Mirage Redevelopment Agency, California, Tax Allocation Bonds, Combined | No Opt. Call | A+ | 2,708,001 |
| | Whitewater and 1984 Project Areas, Series 2003A, 0.000%, 4/01/35 – NPFG Insured | | | |
| 765 | | San Diego Association of Governments, California, South Bay Expressway Toll Revenue | 7/27 at 100.00 | A | 907,168 |
| | Bonds, First Senior Lien Series 2017A, 5.000%, 7/01/42 | | | |
| 535 | | San Diego County Regional Airport Authority, California, Airport Revenue Bonds, | 7/29 at 100.00 | A+ | 633,081 |
| | Subordinate Series 2019B, 5.000%, 7/01/38 (AMT) | | | |
43
| | |
| NXR | Nuveen Select Tax-Free Income Portfolio 3 |
| Portfolio of Investments (continued) |
| March 31, 2020 |
|
|
| Principal | | | Optional Call | | |
| Amount (000) | | Description (1) | Provisions (2) | Ratings (3) | Value |
| | California (continued) | | | |
| $ 2,525 | | San Francisco City and County Public Utilities Commission, California, Water Revenue | 11/24 at 100.00 | Aa2 | $ 2,847,897 |
| | Bonds, Non-WSIP, Series 2017A, 5.000%, 11/01/42 | | | |
| 65,850 | | Total California | | | 53,051,940 |
| | Colorado – 4.3% | | | |
| 500 | | Centerra Metropolitan District 1, Loveland, Colorado, Special Revenue Bonds, Refunding & | No Opt. Call | N/R | 508,565 |
| | Improvement Series 2017, 5.000%, 12/01/22, 144A | | | |
| 790 | | Colorado School of Mines Board of Trustees, Golden, Colorado, Institutional Enterprise | 12/27 at 100.00 | A+ | 942,849 |
| | Revenue Bonds, Series 2017B, 5.000%, 12/01/47 | | | |
| 1,935 | | Denver City and County, Colorado, Airport System Revenue Bonds, Subordinate Lien Series | 11/23 at 100.00 | A+ | 2,130,977 |
| | 2013B, 5.000%, 11/15/43 | | | |
| 1,295 | | E-470 Public Highway Authority, Colorado, Senior Revenue Bonds, Series 2000B, 0.000%, | No Opt. Call | A | 914,788 |
| | 9/01/32 – NPFG Insured | | | |
| 5,520 | | E-470 Public Highway Authority, Colorado, Toll Revenue Bonds, Series 2004B, 0.000%, | 9/20 at 63.99 | A | 3,498,190 |
| | 9/01/28 – NPFG Insured | | | |
| 1,000 | | Park Creek Metropolitan District, Colorado, Senior Limited Property Tax Supported | 12/25 at 100.00 | A | 1,152,190 |
| | Revenue Bonds, Refunding Series 2015A, 5.000%, 12/01/33 | | | |
| 11,040 | | Total Colorado | | | 9,147,559 |
| | Connecticut – 3.7% | | | |
| 2,290 | | Connecticut State, General Obligation Bonds, Refunding Series 2012E, 5.000%, 9/15/32 | 9/22 at 100.00 | A1 | 2,454,262 |
| 1,500 | | Connecticut State, General Obligation Bonds, Refunding Series 2018C, 5.000%, 6/15/26 | No Opt. Call | A1 | 1,776,465 |
| 1,750 | | Connecticut State, General Obligation Bonds, Series 2012B, 5.000%, 4/15/21 | No Opt. Call | A1 | 1,813,280 |
| 1,615 | | Connecticut State, Special Tax Obligation Bonds, Transportation Infrastructure Purposes | 10/23 at 100.00 | A+ | 1,780,279 |
| | Series 2013A, 5.000%, 10/01/30 | | | |
| 7,155 | | Total Connecticut | | | 7,824,286 |
| | Florida – 2.0% | | | |
| 1,500 | | Florida Development Finance Corporation, Florida, Surface Transportation Facility | No Opt. Call | Aaa | 1,499,085 |
| | Revenue Bonds, Virgin Trains USA Passenger Rail Project , Series 2019B, 0.620%, 1/01/49 | | | |
| | (Mandatory Put 6/18/20) (AMT) | | | |
| 390 | | Greater Orlando Aviation Authority, Florida, Orlando Airport Facilities Revenue Bonds, | 10/27 at 100.00 | A+ | 439,339 |
| | Priority Subordinated Series 2017, 5.000%, 10/01/47 (AMT) | | | |
| 2,000 | | Miami-Dade County, Florida, Aviation Revenue Bonds, Refunding Series 2019A, 5.000%, | 10/29 at 100.00 | A | 2,269,600 |
| | 10/01/49 (AMT) | | | |
| 3,890 | | Total Florida | | | 4,208,024 |
| | Georgia – 0.5% | | | |
| 1,035 | | Brookhaven Development Authority, Georgia, Revenue Bonds, Children’s Healthcare of | 7/29 at 100.00 | AA+ | 1,114,912 |
| | Atlanta, Inc Project, Series 2019A, 4.000%, 7/01/44 | | | |
| | Guam – 1.5% | | | |
| 1,250 | | Government of Guam, Business Privilege Tax Bonds, Refunding Series 2015D, | 11/25 at 100.00 | BB | 1,227,987 |
| | 5.000%, 11/15/39 | | | |
| 2,000 | | Government of Guam, Hotel Occupancy Tax Revenue Bonds, Series 2011A, 6.125%, 11/01/31 | 5/21 at 100.00 | BB | 2,039,540 |
| 3,250 | | Total Guam | | | 3,267,527 |
| | Idaho – 1.6% | | | |
| 3,000 | | Idaho Health Facilities Authority, Revenue Bonds, Saint Luke’s Health System Project, | 3/24 at 100.00 | A– | 3,291,270 |
| | Series 2014A, 5.000%, 3/01/44 | | | |
44
| | | | | | |
| Principal | | | Optional Call | | |
| Amount (000) | | Description (1) | Provisions (2) | Ratings (3) | Value |
| | Illinois – 8.8% | | | |
| $ 575 | | Chicago Board of Education, Illinois, Dedicated Capital Improvement Tax Revenue Bonds, | 4/27 at 100.00 | A | $ 611,507 |
| | Series 2016, 6.000%, 4/01/46 | | | |
| 295 | | Chicago Board of Education, Illinois, General Obligation Bonds, Dedicated Revenues, | 12/27 at 100.00 | BB | 301,735 |
| | Refunding Series 2017C, 5.000%, 12/01/30 | | | |
| 3,900 | | Chicago Board of Education, Illinois, General Obligation Bonds, Series 1999A, 0.000%, | No Opt. Call | Baa2 | 2,853,942 |
| | 12/01/28 – FGIC Insured | | | |
| 260 | | Illinois Finance Authority, Revenue Bonds, Rehabilitation Institute of Chicago, Series | 7/23 at 100.00 | A– | 288,954 |
| | 2013A, 6.000%, 7/01/43 | | | |
| 655 | | Illinois Health Facilities Authority, Revenue Bonds, Evangelical Hospitals Corporation, | 5/20 at 100.00 | N/R (4) | 687,252 |
| | Series 1992C, 6.250%, 4/15/22 (ETM) | | | |
| 2,190 | | Illinois State, General Obligation Bonds, Refunding Series 2012, 5.000%, 8/01/23 | No Opt. Call | BBB | 2,273,767 |
| 1,000 | | Kankakee & Will Counties Community Unit School District 5, Illinois, General Obligation | No Opt. Call | Aa3 | 948,840 |
| | Bonds, Series 2006, 0.000%, 5/01/23 – AGM Insured | | | |
| | Metropolitan Pier and Exposition Authority, Illinois, Revenue Bonds, McCormick Place | | | |
| | Expansion Project, Series 2002A: | | | |
| 2,500 | | 0.000%, 12/15/30 – NPFG Insured | No Opt. Call | BBB | 1,788,175 |
| 4,775 | | 0.000%, 12/15/31 – NPFG Insured | No Opt. Call | BBB | 3,269,060 |
| 5,000 | | 0.000%, 12/15/36 – NPFG Insured | No Opt. Call | BBB | 2,702,100 |
| 2,000 | | 0.000%, 6/15/37 – NPFG Insured | No Opt. Call | BBB | 1,057,200 |
| 1,400 | | Springfield, Illinois, Electric Revenue Bonds, Senior Lien Series 2015, 5.000%, 3/01/28 | 3/25 at 100.00 | A | 1,615,628 |
| 310 | | University of Illinois, Health Services Facilities System Revenue Bonds, Series 2013, | 10/23 at 100.00 | A– | 341,800 |
| | 6.000%, 10/01/42 | | | |
| 24,860 | | Total Illinois | | | 18,739,960 |
| | Indiana – 1.1% | | | |
| 1,250 | | Indiana Finance Authority, Wastewater Utility Revenue Bonds, CWA Authority Project, | 10/24 at 100.00 | AA | 1,422,562 |
| | Series 2015A, 5.000%, 10/01/45 | | | |
| 1,000 | | Zionsville Community Schools Building Corporation, Indiana, First Mortgage Bonds, Series | No Opt. Call | AA | 859,910 |
| | 2005Z, 0.000%, 7/15/28 – AGM Insured | | | |
| 2,250 | | Total Indiana | | | 2,282,472 |
| | Iowa – 1.0% | | | |
| 570 | | Iowa Finance Authority, Iowa, Midwestern Disaster Area Revenue Bonds, Iowa Fertilizer | 5/20 at 104.00 | BB– | 576,202 |
| | Company Project, Series 2016, 5.875%, 12/01/26, 144A | | | |
| 660 | | Iowa Finance Authority, Iowa, Midwestern Disaster Area Revenue Bonds, Iowa Fertilizer | 12/22 at 105.00 | BB– | 677,107 |
| | Company Project, Series 2018B, 5.250%, 12/01/50 (Mandatory Put 12/01/37) | | | |
| 950 | | Iowa Tobacco Settlement Authority, Tobacco Asset-Backed Revenue Bonds, Series 2005B, | 5/20 at 100.00 | B– | 939,493 |
| | 5.600%, 6/01/34 | | | |
| 2,180 | | Total Iowa | | | 2,192,802 |
| | Massachusetts – 7.1% | | | |
| 2,230 | | Massachusetts Development Finance Agency, Revenue Bonds, Boston University, Series | 10/26 at 100.00 | AA– | 2,576,274 |
| | 2016BB-1, 5.000%, 10/01/46 | | | |
| 1,000 | | Massachusetts Development Finance Agency, Revenue Bonds, CareGroup Issue, Refunding | No Opt. Call | A | 1,047,390 |
| | Series 2016-I, 5.000%, 7/01/21 | | | |
| 1,300 | | Massachusetts Development Finance Agency, Revenue Bonds, Olin College, Series 2013E, | 11/23 at 100.00 | A+ | 1,418,820 |
| | 5.000%, 11/01/43 | | | |
| 2,250 | | Massachusetts Development Finance Agency, Revenue Bonds, Partners HealthCare System, | 7/23 at 100.00 | AA– (4) | 2,526,052 |
| | Series 2014M-4, 5.000%, 7/01/44 (Pre-refunded 7/01/23) | | | |
| 2,200 | | Massachusetts School Building Authority, Dedicated Sales Tax Revenue Bonds, Subordinated | 2/26 at 100.00 | AA+ | 2,551,824 |
| | Series 2019A, 5.000%, 2/15/49 | | | |
| 2,180 | | Massachusetts Water Resources Authority, General Revenue Bonds, Refunding Green Series | 8/26 at 100.00 | AA+ | 2,590,211 |
| | 2016C, 5.000%, 8/01/40 | | | |
| 1,000 | | Newburyport, Massachusetts, General Obligation Bonds, Municipal Purpose Loan, Refunding | 1/23 at 100.00 | AAA | 1,071,260 |
| | Series 2013, 4.000%, 1/15/30 | | | |
45
| | |
| NXR | Nuveen Select Tax-Free Income Portfolio 3 |
| Portfolio of Investments (continued) |
| March 31, 2020 |
| | | | | | |
| Principal | | | Optional Call | | |
| Amount (000) | | Description (1) | Provisions (2) | Ratings (3) | Value |
| | Massachusetts (continued) | | | |
| | University of Massachusetts Building Authority, Project Revenue Bonds, Senior | | | |
| | Series 2014-1: | | | |
| $ 210 | | 5.000%, 11/01/39 (Pre-refunded 11/01/24) | 11/24 at 100.00 | N/R (4) | $ 246,383 |
| 955 | | 5.000%, 11/01/39 | 11/24 at 100.00 | Aa2 | 1,085,950 |
| 13,325 | | Total Massachusetts | | | 15,114,164 |
| | Michigan – 1.3% | | | |
| 355 | | Detroit Water and Sewerage Department, Michigan, Sewage Disposal System Revenue Bonds, | 7/22 at 100.00 | AA– | 380,780 |
| | Refunding Senior Lien Series 2012A, 5.250%, 7/01/39 | | | |
| 2,000 | | Michigan State Building Authority, Revenue Bonds, Facilities Program, Refunding Series | 10/26 at 100.00 | Aa2 | 2,381,600 |
| | 2016-I, 5.000%, 4/15/35 | | | |
| 2,355 | | Total Michigan | | | 2,762,380 |
| | Nebraska – 1.7% | | | |
| 250 | | Madison County Hospital Authority 1, Nebraska, Hospital Revenue Bonds, Faith Regional | 7/25 at 100.00 | BBB | 288,482 |
| | Health Services Project, Series 2018, 5.000%, 7/01/26 | | | |
| 2,600 | | Nebraska Public Power District, General Revenue Bonds, Series 2015A-2, 5.000%, 1/01/40 | 1/22 at 100.00 | A+ | 2,760,264 |
| 500 | | Platte County School District 001, Columbus Public Schools, Nebraska, General Obligation | 6/24 at 100.00 | Aa2 | 570,920 |
| | Bonds, School Building Series 2014, 5.000%, 12/15/39 | | | |
| 3,350 | | Total Nebraska | | | 3,619,666 |
| | Nevada – 0.2% | | | |
| 445 | | Carson City, Nevada, Hospital Revenue Bonds, Carson Tahoe Regional Healthcare Project, | 9/27 at 100.00 | A– | 524,077 |
| | Series 2017A, 5.000%, 9/01/37 | | | |
| | New Hampshire – 0.5% | | | |
| 1,000 | | New Hampshire Business Finance Authority, Solid Waste Disposal Revenue Bonds, Waste | No Opt. Call | A– | 1,005,020 |
| | Management Inc Project, Series 2003, 3.125%, 8/01/24 (AMT) | | | |
| | New Jersey – 2.9% | | | |
| 1,850 | | New Jersey Economic Development Authority, Sublease Revenue Bonds, New Jersey Transit | No Opt. Call | A– | 1,960,519 |
| | Corporation Projects, Refunding Series 2017B, 5.000%, 11/01/23 | | | |
| 305 | | New Jersey Health Care Facilities Financing Authority, Revenue Bonds, University | 7/25 at 100.00 | AA | 337,242 |
| | Hospital Issue, Refunding Series 2015A, 5.000%, 7/01/28 – AGM Insured | | | |
| 4,900 | | New Jersey Transportation Trust Fund Authority, Transportation System Bonds, Refunding | No Opt. Call | A– | 3,807,790 |
| | Series 2006C, 0.000%, 12/15/28 – AMBAC Insured | | | |
| 7,055 | | Total New Jersey | | | 6,105,551 |
| | New Mexico – 0.5% | | | |
| 1,000 | | New Mexico Mortgage Finance Authority, Multifamily Housing Revenue Bonds, St Anthony, | 4/20 at 100.00 | N/R | 1,001,280 |
| | Series 2007A, 5.250%, 9/01/42 (AMT) | | | |
| | New York – 1.4% | | | |
| 1,250 | | Metropolitan Transportation Authority, New York, Transportation Revenue Bonds, Refunding | 11/22 at 100.00 | AA– | 1,330,175 |
| | Series 2012F, 5.000%, 11/15/26 | | | |
| 1,260 | | New York City Municipal Water Finance Authority, New York, Water and Sewer System Second | 6/25 at 100.00 | AA+ | 1,460,932 |
| | General Resolution Revenue Bonds, Fiscal 2015 Series HH, 5.000%, 6/15/37 | | | |
| 265 | | Port Authority of New York and New Jersey, Special Project Bonds, JFK International Air | 12/20 at 100.00 | BBB+ | 268,390 |
| | Terminal LLC Project, Eighth Series 2010, 6.000%, 12/01/42 | | | |
| 2,775 | | Total New York | | | 3,059,497 |
| | Ohio – 3.7% | | | |
| 130 | | Buckeye Tobacco Settlement Financing Authority, Ohio, Tobacco Settlement Asset-Backed | 6/30 at 100.00 | BBB+ | 139,542 |
| | Revenue Bonds, Refunding Senior Lien Series 2020A-2 Class 1, 4.000%, 6/01/48 | | | |
| 360 | | Buckeye Tobacco Settlement Financing Authority, Ohio, Tobacco Settlement Asset-Backed | 6/30 at 100.00 | N/R | 319,950 |
| | Revenue Bonds, Refunding Senior Lien Series 2020B-2 Class 2, 5.000%, 6/01/55 | | | |
| 3,720 | | Buckeye Tobacco Settlement Financing Authority, Ohio, Tobacco Settlement Asset-Backed | 6/22 at 100.00 | CCC+ (4) | 4,125,926 |
| | Revenue Bonds, Senior Lien Series 2007A-3, 6.250%, 6/01/37 (Pre-refunded 6/01/22) | | | |
46
| | | | | | |
| Principal | | | Optional Call | | |
| Amount (000) | | Description (1) | Provisions (2) | Ratings (3) | Value |
| | Ohio (continued) | | | |
| $ 1,500 | | Montgomery County, Ohio, Revenue Bonds, Miami Valley Hospital, Series 2011A, | 11/20 at 100.00 | A | $ 1,538,655 |
| | 5.750%, 11/15/21 | | | |
| 1,475 | | Ohio Turnpike Commission, Turnpike Revenue Bonds, Infrastructure Project, Junior Lien | 2/23 at 100.00 | Aa3 (4) | 1,635,259 |
| | Series 2013A-1, 5.000%, 2/15/48 (Pre-refunded 2/15/23) | | | |
| 1,000 | | Ohio Water Development Authority, Pollution Control Revenue Bonds, FirstEnergy Nuclear | No Opt. Call | N/R | 3,750 |
| | Generating Corporation Project, Refunding Series 2005B, 4.000%, 1/01/34 (6) | | | |
| 8,185 | | Total Ohio | | | 7,763,082 |
| | Oklahoma – 0.2% | | | |
| 345 | | Oklahoma Development Finance Authority, Health System Revenue Bonds, OU Medicine | 8/28 at 100.00 | Baa3 | 398,606 |
| | Project, Series 2018B, 5.000%, 8/15/38 | | | |
| | Oregon – 1.5% | | | |
| 490 | | Clackamas County Hospital Facility Authority, Oregon, Senior Living Revenue Bonds, | No Opt. Call | N/R | 496,649 |
| | Willamette View Project, Series 2017A, 4.000%, 5/15/22 | | | |
| 545 | | Oregon Facilities Authority, Revenue Bonds, Reed College, Series 2017A, 4.000%, 7/01/41 | 7/27 at 100.00 | Aa2 | 612,139 |
| 1,000 | | Oregon Facilities Authority, Revenue Bonds, Willamette University, Refunding Series | 10/26 at 100.00 | A– | 1,143,110 |
| | 2016B, 5.000%, 10/01/40 | | | |
| 750 | | Washington and Clackamas Counties School District 23J Tigard-Tualatin, Oregon, General | 6/27 at 100.00 | AA+ | 931,365 |
| | Obligation Bonds, Series 2017, 5.000%, 6/15/30 | | | |
| 2,785 | | Total Oregon | | | 3,183,263 |
| | Pennsylvania – 4.7% | | | |
| 1,015 | | Delaware River Port Authority, New Jersey and Pennsylvania, Revenue Bonds, Series 2013, | 1/24 at 100.00 | A+ | 1,135,612 |
| | 5.000%, 1/01/37 | | | |
| 2,500 | | Pennsylvania Higher Educational Facilities Authority, Revenue Bonds, State System of | 6/26 at 100.00 | Aa3 | 2,955,950 |
| | Higher Education, Refunding Series 2016AT-1, 5.000%, 6/15/31 | | | |
| | Pennsylvania Turnpike Commission, Motor License Fund-Enhanced Subordinate Special | | | |
| | Revenue Bonds, Series 2010B-2: | | | |
| 370 | | 5.000%, 12/01/30 (Pre-refunded 12/01/20) | 12/20 at 100.00 | N/R (4) | 379,239 |
| 200 | | 5.000%, 12/01/30 (Pre-refunded 12/01/20) | 12/20 at 100.00 | N/R (4) | 204,994 |
| 430 | | 5.000%, 12/01/30 (Pre-refunded 12/01/20) | 12/20 at 100.00 | A2 (4) | 440,737 |
| 4,455 | | Philadelphia, Pennsylvania, Water and Wastewater Revenue Bonds, Series 2015A, | 7/24 at 100.00 | A+ | 4,948,124 |
| | 5.000%, 7/01/40 | | | |
| 8,970 | | Total Pennsylvania | | | 10,064,656 |
| | Puerto Rico – 1.2% | | | |
| 945 | | Puerto Rico Highway and Transportation Authority, Highway Revenue Bonds, Series 2007N, | No Opt. Call | C | 990,700 |
| | 5.250%, 7/01/31 – AMBAC Insured | | | |
| 750 | | Puerto Rico Sales Tax Financing Corporation, Sales Tax Revenue Bonds, Restructured | 7/28 at 100.00 | N/R | 731,213 |
| | 2018A-1, 5.000%, 7/01/58 | | | |
| 825 | | Puerto Rico Sales Tax Financing Corporation, Sales Tax Revenue Bonds, Taxable | 7/28 at 100.00 | N/R | 774,691 |
| | Restructured Cofina Project Series 2019A-2, 4.784%, 7/01/58 | | | |
| 2,520 | | Total Puerto Rico | | | 2,496,604 |
| | South Carolina – 0.6% | | | |
| 1,270 | | South Carolina Transportation Infrastructure Bank, Revenue Bonds, Refunding Series | 10/24 at 100.00 | Aa3 | 1,346,086 |
| | 2015A, 2.900%, 10/01/25 | | | |
| | South Dakota – 0.2% | | | |
| 400 | | South Dakota Health and Educational Facilities Authority, Revenue Bonds, Sanford Health, | 11/25 at 100.00 | A+ | 462,520 |
| | Series 2015, 5.000%, 11/01/35 | | | |
| | Tennessee – 0.4% | | | |
| 795 | | Chattanooga Health, Educational and Housing Facility Board, Tennessee, Revenue Bonds, | 1/23 at 100.00 | BBB+ (4) | 879,691 |
| | Catholic Health Initiatives, Series 2013A, 5.250%, 1/01/45 (Pre-refunded 1/01/23) | | | |
47
| | |
| NXR | Nuveen Select Tax-Free Income Portfolio 3 |
| Portfolio of Investments (continued) |
| March 31, 2020 |
|
|
|
| Principal | | | Optional Call | | |
| Amount (000) | | Description (1) | Provisions (2) | Ratings (3) | Value |
| | Texas – 9.5% | | | |
| $ 250 | | Central Texas Regional Mobility Authority, Revenue Bonds, Senior Lien Series 2011, | 1/21 at 100.00 | A– (4) | $ 258,990 |
| | 6.000%, 1/01/41 (Pre-refunded 1/01/21) | | | |
| 85 | | Central Texas Regional Mobility Authority, Revenue Bonds, Senior Lien, Series 2015A, | 7/25 at 100.00 | A– | 92,181 |
| | 5.000%, 1/01/34 | | | |
| 4,640 | | Grand Parkway Transportation Corporation, Texas, System Toll Revenue Bonds, First Tier | 10/23 at 100.00 | A+ (4) | 5,340,269 |
| | Series 2013A, 5.500%, 4/01/53 (Pre-refunded 10/01/23) | | | |
| | Harris County-Houston Sports Authority, Texas, Revenue Bonds, Junior Lien Series 2001H: | | | |
| 1,405 | | 0.000%, 11/15/32 – NPFG Insured | 11/31 at 94.05 | Baa2 | 964,926 |
| 2,510 | | 0.000%, 11/15/36 – NPFG Insured | 11/31 at 73.51 | Baa2 | 1,333,337 |
| 2,235 | | Harris County-Houston Sports Authority, Texas, Revenue Bonds, Third Lien Series 2004A-3, | 11/24 at 62.71 | Baa2 | 1,244,336 |
| | 0.000%, 11/15/32 – NPFG Insured | | | |
| | Harris County-Houston Sports Authority, Texas, Special Revenue Bonds, Refunding Senior | | | |
| | Lien Series 2001A: | | | |
| 3,045 | | 0.000%, 11/15/34 – NPFG Insured | 11/30 at 78.27 | AA | 1,935,889 |
| 4,095 | | 0.000%, 11/15/38 – NPFG Insured | 11/30 at 61.17 | AA | 2,009,826 |
| 2,255 | | Love Field Airport Modernization Corporation, Texas, Special Facilities Revenue Bonds, | 11/20 at 100.00 | Baa1 | 2,226,970 |
| | Southwest Airlines Company, Series 2010, 5.250%, 11/01/40 | | | |
| 125 | | Mission Economic Development Corporation, Texas, Revenue Bonds, Natgasoline Project, | 10/21 at 105.00 | BB– | 127,923 |
| | Senior Lien Series 2018, 4.625%, 10/01/31, 144A (AMT) | | | |
| 290 | | North Texas Tollway Authority, System Revenue Bonds, Refunding First Tier Capital | 1/25 at 100.00 | AA | 350,242 |
| | Appreciation Series 2008I, 6.200%, 1/01/42 – AGC Insured | | | |
| 2,000 | | Texas Municipal Gas Acquisition and Supply Corporation III, Gas Supply Revenue Bonds, | 12/22 at 100.00 | A3 | 2,066,360 |
| | Series 2012, 5.000%, 12/15/32 | | | |
| 2,410 | | Texas Turnpike Authority, Central Texas Turnpike System Revenue Bonds, First Tier Series | No Opt. Call | A | 2,188,617 |
| | 2002A, 0.000%, 8/15/25 – AMBAC Insured | | | |
| 25,345 | | Total Texas | | | 20,139,866 |
| | Virginia – 2.9% | | | |
| 3,500 | | Chesapeake, Virginia, Transportation System Senior Toll Road Revenue Bonds, Capital | 7/28 at 100.00 | BBB+ | 3,323,355 |
| | Appreciation Series 2012B, 0.000%, 7/15/32 (5) | | | |
| 765 | | Metropolitan Washington Airports Authority, Virginia, Dulles Toll Road Revenue Bonds, | 10/29 at 100.00 | A– | 784,217 |
| | Dulles Metrorail & Capital improvement Projects, Refunding & Subordinate Lien Series 2019B, | | | |
| | 4.000%, 10/01/44 | | | |
| | Virginia Small Business Financing Authority, Senior Lien Revenue Bonds, Elizabeth River | | | |
| | Crossing, Opco LLC Project, Series 2012: | | | |
| 410 | | 6.000%, 1/01/37 (AMT) | 7/22 at 100.00 | BBB | 422,706 |
| 1,510 | | 5.500%, 1/01/42 (AMT) | 7/22 at 100.00 | BBB | 1,533,752 |
| 6,185 | | Total Virginia | | | 6,064,030 |
| | Washington – 4.9% | | | |
| 205 | | Port of Seattle, Washington, Revenue Bonds, Intermediate Lien Series 2019, 5.000%, | 4/29 at 100.00 | AA– | 233,833 |
| | 4/01/44 (AMT) | | | |
| 1,600 | | Washington Health Care Facilities Authority, Revenue Bonds, CommonSpirit Health, Series | 8/29 at 100.00 | BBB+ | 1,728,960 |
| | 2019A-2, 5.000%, 8/01/44 | | | |
| 990 | | Washington Health Care Facilities Authority, Revenue Bonds, Fred Hutchinson Cancer | 1/21 at 100.00 | A+ | 1,013,810 |
| | Research Center, Series 2011A, 5.625%, 1/01/35 | | | |
| 4,000 | | Washington Health Care Facilities Authority, Revenue Bonds, Providence Health & | 10/22 at 100.00 | AA– | 4,257,640 |
| | Services, Refunding Series 2012A, 5.000%, 10/01/32 | | | |
| 1,000 | | Washington State Convention Center Public Facilities District, Lodging Tax Revenue | 7/28 at 100.00 | AA– | 1,188,340 |
| | Bonds, Series 2018, 5.000%, 7/01/58 | | | |
| 1,725 | | Washington State, General Obligation Bonds, Various Purpose Series 2015B, | 2/25 at 100.00 | Aaa | 1,990,857 |
| | 5.000%, 2/01/37 | | | |
| 9,520 | | Total Washington | | | 10,413,440 |
48
| | | | | | |
| Principal | | | Optional Call | | |
| Amount (000) | | Description (1) | Provisions (2) | Ratings (3) | Value |
| | Wisconsin – 0.6% | | | |
| $ 1,250 | | Wisconsin Health and Educational Facilities Authority, Revenue Bonds, Marshfield Clinic, | 2/22 at 100.00 | A– | $ 1,317,738 |
| | Series 2012B, 5.000%, 2/15/32 | | | |
| $ 229,325 | | Total Municipal Bonds (cost $176,951,111) | | | 208,994,641 |
|
| Shares | | Description (1) | | | Value |
| | COMMON STOCKS – 0.3% | | | |
| | Electric Utilities – 0.3% | | | |
| 32,091 | | Energy Harbor Corp (7), (8) | | | $ 726,059 |
| | Total Common Stocks (cost $851,221) | | | 726,059 |
| | Total Long-Term Investments (cost $177,802,332) | | | 209,720,700 |
|
| Principal | | | Optional Call | | |
| Amount (000) | | Description (1) | Provisions (2) | Ratings (3) | Value |
| | SHORT-TERM INVESTMENTS – 0.5% | | | |
| | MUNICIPAL BONDS – 0.5% | | | |
| | Florida – 0.5% | | | |
| $ 1,040 | | Florida Development Finance Corporation, Florida, Surface Transportation Facility Revenue Bonds, | | | |
| | Virgin Trains USA Passenger Rail Project , Variable Rate Demand Obligations, Series 2019A, | | | |
| | 6.250%, 1/01/49 (Mandatory Put 1/01/24), 144A (AMT) (9) | 6/20 at 104.00 | N/R | $ 941,813 |
| $ 1,040 | | Total Short-Term Investments (cost $1,040,000) | | | 941,813 |
| | Total Investments (cost $178,842,332) – 99.2% | | | 210,662,513 |
| | Other Assets Less Liabilities – 0.8% | | | 1,771,371 |
| | Net Assets Applicable to Common Shares – 100% | | | $ 212,433,884 |
| | |
(1) | All percentages shown in the Portfolio of Investments are based on net assets applicable to common shares unless otherwise noted. |
(2) | Optional Call Provisions: Dates (month and year) and prices of the earliest optional call or redemption. There may be other call provisions at varying prices at later dates. Certain mortgage-backed securities may be subject to periodic principal paydowns. Optional Call Provisions are not covered by the report of independent registered public accounting firm. |
(3) | For financial reporting purposes, the ratings disclosed are the highest of Standard & Poor’s Group (“Standard & Poor’s”), Moody’s Investors Service, Inc. (“Moody’s”) or Fitch, Inc. (“Fitch”) rating. This treatment of split-rated securities may differ from that used for other purposes, such as for Fund investment policies. Ratings below BBB by Standard & Poor’s, Baa by Moody’s or BBB by Fitch are considered to be below investment grade. Holdings designated N/R are not rated by any of these national rating agencies. Ratings are not covered by the report of independent registered public accounting firm. |
(4) | Backed by an escrow or trust containing sufficient U.S. Government or U.S. Government agency securities, which ensure the timely payment of principal and interest. |
(5) | Step-up coupon bond, a bond with a coupon that increases ("steps up"), usually at regular intervals, while the bond is outstanding. The rate shown is the coupon as of the end of the reporting period. |
(6) | Defaulted security. A security whose issuer has failed to fully pay principal and/or interest when due, or is under the protection of bankruptcy. |
(7) | For fair value measurement disclosure purposes, investment classified as Level 2. See Notes to Financial Statements, Note 3 - Investment Valuation and Fair Value Measurements for more information. |
(8) | Common Stock received as part of the bankruptcy settlement for Ohio Water Development Authority, Pollution Control Revenue Refunding Bonds, FirstEnergy Nuclear Generating Corporation Project, Series 2005B, 0.000%, 1/01/34. |
(9) | Investment has a maturity of greater than one year, but has variable rate and/or demand features which qualify it as a short-term investment. The rate disclosed, as well as the reference rate and spread, where applicable, is that in effect as of the end of the reporting period. This rate changes periodically based on market conditions or a specified market index. |
144A | Investment is exempt from registration under Rule 144A of the Securities Act of 1933, as amended. These investments may only be resold in transactions exempt from registration, which are normally those transactions with qualified institutional buyers. |
AMT | Alternative Minimum Tax |
ETM | Escrowed to maturity |
| See accompanying notes to financial statements. |
49
| | |
| NXC | Nuveen California Select Tax-Free |
| Income Portfolio |
| Portfolio of Investments |
| March 31, 2020 |
| | | | | | |
| Principal | | | Optional Call | | |
| Amount (000) | | Description (1) | Provisions (2) | Ratings (3) | Value |
| | LONG-TERM INVESTMENTS – 99.1% | | | |
| | MUNICIPAL BONDS – 99.1% | | | |
| | Consumer Staples – 2.7% | | | |
| $ 1,095 | | Golden State Tobacco Securitization Corporation, California, Tobacco Settlement | 6/22 at 100.00 | B– | $ 1,098,460 |
| | Asset-Backed Bonds, Senior Convertible Series 2007A-2, 5.300%, 6/01/37 | | | |
| 100 | | Golden State Tobacco Securitization Corporation, California, Tobacco Settlement | 6/22 at 100.00 | N/R | 98,021 |
| | Asset-Backed Bonds, Series 2018A-1, 5.250%, 6/01/47 | | | |
| 1,500 | | Tobacco Securitization Authority of Northern California, Tobacco Settlement Asset-Backed | 4/20 at 100.00 | B– | 1,405,920 |
| | Bonds, Series 2005A-1, 5.500%, 6/01/45 | | | |
| 2,695 | | Total Consumer Staples | | | 2,602,401 |
| | Education and Civic Organizations – 1.2% | | | |
| 550 | | California Municipal Finance Authority, Charter School Revenue Bonds, Partnerships to | 8/22 at 100.00 | BB | 553,069 |
| | Uplift Communities Project, Series 2012A, 5.250%, 8/01/42 | | | |
| 160 | | California Municipal Finance Authority, Charter School Revenue Bonds, Rocketship | 6/22 at 102.00 | N/R | 171,971 |
| | Education?Multiple Projects, Series 2014A, 7.250%, 6/01/43 | | | |
| 60 | | California School Finance Authority, School Facility Revenue Bonds, Alliance for | 7/25 at 100.00 | BBB | 62,606 |
| | College-Ready Public Schools Project, Series 2016A, 5.000%, 7/01/46, 144A | | | |
| 385 | | California School Finance Authority, School Facility Revenue Bonds, Alliance for | 7/25 at 101.00 | BBB | 404,527 |
| | College-Ready Public Schools Project, Series 2016C, 5.000%, 7/01/46 | | | |
| 1,155 | | Total Education and Civic Organizations | | | 1,192,173 |
| | Health Care – 10.0% | | | |
| 1,000 | | California Health Facilities Financing Authority, California, Revenue Bonds, Sutter | 11/26 at 100.00 | AA– | 1,147,950 |
| | Health, Refunding Series 2016B, 5.000%, 11/15/46 | | | |
| 1,000 | | California Health Facilities Financing Authority, California, Revenue Bonds, Sutter | 11/27 at 100.00 | AA– | 1,185,010 |
| | Health, Refunding Series 2017A, 5.000%, 11/15/48 | | | |
| 2,500 | | California Health Facilities Financing Authority, California, Revenue Bonds, Sutter | 11/25 at 100.00 | AA– | 2,843,225 |
| | Health, Series 2016A, 5.000%, 11/15/41 | | | |
| 1,000 | | California Health Facilities Financing Authority, California, Revenue Bonds, Sutter | 11/27 at 100.00 | AA– | 1,185,010 |
| | Health, Series 2018A, 5.000%, 11/15/48 | | | |
| 115 | | California Health Facilities Financing Authority, Revenue Bonds, Lucile Salter Packard | 8/24 at 100.00 | AA– | 129,482 |
| | Children’s Hospital, Series 2014A, 5.000%, 8/15/43 | | | |
| 70 | | California Health Facilities Financing Authority, Revenue Bonds, Providence Health & | 10/24 at 100.00 | AA– | 80,651 |
| | Services, Refunding Series 2014A, 5.000%, 10/01/38 | | | |
| 255 | | California Health Facilities Financing Authority, Revenue Bonds, Providence Health & | 10/24 at 100.00 | AA– | 292,814 |
| | Services, Series 2014B, 5.000%, 10/01/44 | | | |
| 235 | | California Health Facilities Financing Authority, Revenue Bonds, Rady Children’s | 8/21 at 100.00 | AA | 247,232 |
| | Hospital – San Diego, Series 2011, 5.250%, 8/15/41 | | | |
| 35 | | California Municipal Finance Authority, Revenue Bonds, Eisenhower Medical Center, | 7/27 at 100.00 | Baa2 | 38,427 |
| | Refunding Series 2017A, 5.000%, 7/01/42 | | | |
| 130 | | California Municipal Finance Authority, Revenue Bonds, NorthBay Healthcare Group, Series | 11/26 at 100.00 | BBB– | 140,849 |
| | 2017A, 5.250%, 11/01/41 | | | |
| 350 | | California Statewide Communities Development Authority, California, Revenue Bonds, Loma | 12/24 at 100.00 | BB | 386,113 |
| | Linda University Medical Center, Series 2014A, 5.250%, 12/01/34 | | | |
| | California Statewide Communities Development Authority, California, Revenue Bonds, Loma | | | |
| | Linda University Medical Center, Series 2016A: | | | |
| 825 | | 5.000%, 12/01/46, 144A | 6/26 at 100.00 | BB | 871,645 |
| 540 | | 5.250%, 12/01/56, 144A | 6/26 at 100.00 | BB | 575,240 |
| 670 | | San Buenaventura, California, Revenue Bonds, Community Memorial Health System, Series | 12/21 at 100.00 | BB | 722,789 |
| | 2011, 7.500%, 12/01/41 | | | |
| 8,725 | | Total Health Care | | | 9,846,437 |
50
| | | | | | |
| Principal | | | Optional Call | | |
| Amount (000) | | Description (1) | Provisions (2) | Ratings (3) | Value |
| | Housing/Multifamily – 2.1% | | | |
| $ 750 | | California Community Housing Agency, California, Essential Housing Revenue Bonds, | 2/30 at 100.00 | N/R | $ 758,662 |
| | Serenity at Larkspur Apartments, Series 2020A, 5.000%, 2/01/50, 144A | | | |
| 648 | | California Housing Finance Agency, Municipal Certificate Revenue Bonds, Class A Series | No Opt. Call | BBB+ | 688,129 |
| | 2019-2, 4.000%, 3/20/33 | | | |
| 94 | | California Housing Finance Agency, Municipal Certificate Revenue Bonds, Class A | No Opt. Call | BBB+ | 101,190 |
| | Series2019-1, 4.250%, 1/15/35 | | | |
| | California Municipal Finance Authority, Mobile Home Park Revenue Bonds, Caritas | | | |
| | Affordable Housing Inc Projects, Senior Series 2014A: | | | |
| 25 | | 5.250%, 8/15/39 | 8/24 at 100.00 | BBB+ | 27,244 |
| 65 | | 5.250%, 8/15/49 | 8/24 at 100.00 | BBB+ | 70,225 |
| 395 | | California Municipal Finance Authority, Mobile Home Park Revenue Bonds, Caritas Projects | 8/22 at 100.00 | BBB | 415,094 |
| | Series 2012A, 5.500%, 8/15/47 | | | |
| 1,977 | | Total Housing/Multifamily | | | 2,060,544 |
| | Tax Obligation/General – 23.2% | | | |
| 1,000 | | California State, General Obligation Bonds, Various Purpose Refunding Series 2015, | 8/25 at 100.00 | Aa2 | 1,178,020 |
| | 5.000%, 8/01/34 | | | |
| 1,965 | | California State, General Obligation Bonds, Various Purpose Series 2011, | 10/21 at 100.00 | Aa2 | 2,078,636 |
| | 5.000%, 10/01/41 | | | |
| 2,000 | | California State, General Obligation Bonds, Various Purpose Series 2012, 5.250%, 4/01/35 | 4/22 at 100.00 | Aa2 | 2,143,320 |
| 1,000 | | Chaffey Joint Union High School District, San Bernardino County, California, General | 8/28 at 100.00 | Aa1 | 1,105,080 |
| | Obligation Bonds, Election 2012 Series 2019D, 4.000%, 8/01/49 | | | |
| 1,000 | | Los Angeles Unified School District, Los Angeles County, California, General Obligation | 1/28 at 100.00 | AAA | 1,207,400 |
| | Bonds, Election 2008 Series 2018B-1, 5.250%, 7/01/42 | | | |
| 7,575 | | Palomar Pomerado Health, California, General Obligation Bonds, Convertible Capital | No Opt. Call | A2 | 5,155,393 |
| | Appreciation, Election 2004 Series 2010A, 0.000%, 8/01/34 | | | |
| 1,000 | | San Benito High School District, San Benito and Santa Clara Counties, California, | 8/27 at 100.00 | Aa3 | 1,207,510 |
| | General Obligation Bonds, 2016 Election Series 2017, 5.250%, 8/01/46 | | | |
| 8,075 | | San Bernardino Community College District, California, General Obligation Bonds, | No Opt. Call | Aa1 | 3,980,410 |
| | Election of 2008 Series 2009B, 0.000%, 8/01/44 | | | |
| 2,050 | | San Mateo County Community College District, California, General Obligation Bonds, | 9/28 at 100.00 | AAA | 2,497,741 |
| | Election 2014 Series 2018B, 5.000%, 9/01/45 | | | |
| 2,000 | | West Hills Community College District, California, General Obligation Bonds, School | 8/31 at 100.00 | AA | 2,144,060 |
| | Facilities Improvement District 3, 2008 Election Series 2011, 0.000%, 8/01/38 – AGM Insured (4) | | | |
| 27,665 | | Total Tax Obligation/General | | | 22,697,570 |
| | Tax Obligation/Limited – 18.6% | | | |
| 1,000 | | Bell Community Redevelopment Agency, California, Tax Allocation Bonds, Bell Project | 5/20 at 100.00 | AA | 1,003,500 |
| | Area, Series 2003, 5.625%, 10/01/33 – RAAI Insured | | | |
| 2,000 | | California State Public Works Board, Lease Revenue Bonds, Department of Corrections & | 9/23 at 100.00 | Aa3 | 2,254,580 |
| | Rehabilitation, Various Correctional Facilities Series 2013F, 5.250%, 9/01/33 | | | |
| 3,000 | | Golden State Tobacco Securitization Corporation, California, Enhanced Tobacco Settlement | 6/25 at 100.00 | Aa3 | 3,387,120 |
| | Asset-Backed Revenue Bonds, Refunding Series 2015A, 5.000%, 6/01/40 | | | |
| 1,215 | | Los Angeles Community Redevelopment Agency, California, Lease Revenue Bonds, Vermont | 5/20 at 100.00 | Aa2 | 1,218,475 |
| | Manchester Social Services Project, Series 2005, 5.000%, 9/01/37 – AMBAC Insured | | | |
| 1,000 | | Los Angeles County Metropolitan Transportation Authority, California, Measure R Sales | 6/26 at 100.00 | AAA | 1,202,700 |
| | Tax Revenue Bonds, Senior Series 2016A, 5.000%, 6/01/38 | | | |
| 3,000 | | Los Angeles County Metropolitan Transportation Authority, California, Proposition C | 7/27 at 100.00 | AAA | 3,606,480 |
| | Sales Tax Revenue Bonds, Senior Lien Series 2017A, 5.000%, 7/01/42 | | | |
| 1,000 | | Norco Redevelopment Agency, California, Tax Allocation Bonds, Project Area 1, Series | 5/20 at 100.00 | A+ | 1,004,580 |
| | 2009, 7.000%, 3/01/34 | | | |
| 320 | | Patterson Public Finance Authority, California, Revenue Bonds, Community Facilities | 9/23 at 100.00 | N/R | 345,744 |
| | District 2001-1, Senior Series 2013A, 5.750%, 9/01/39 | | | |
| 60 | | Patterson Public Finance Authority, California, Revenue Bonds, Community Facilities | 9/23 at 100.00 | N/R | 65,006 |
| | District 2001-1, Subordinate Lien Series 2013B, 5.875%, 9/01/39 | | | |
51
| | |
| NXC | Nuveen California Select Tax-Free Income Portfolio |
| Portfolio of Investments (continued) |
| March 31, 2020 |
| | | | | | |
| Principal | | | Optional Call | | |
| Amount (000) | | Description (1) | Provisions (2) | Ratings (3) | Value |
| | Tax Obligation/Limited (continued) | | | |
| $ 350 | | Patterson Public Finance Authority, Revenue Bonds, Community Facilities District 2001-1, | 9/23 at 100.00 | N/R | $ 378,063 |
| | Senior Series 2013A, 5.250%, 9/01/30 | | | |
| | Puerto Rico Sales Tax Financing Corporation, Sales Tax Revenue Bonds, Restructured 2018A-1: | | | |
| 9 | | 0.000%, 7/01/24 | No Opt. Call | N/R | 7,717 |
| 8 | | 4.550%, 7/01/40 | 7/28 at 100.00 | N/R | 7,593 |
| 408 | | 0.000%, 7/01/51 | 7/28 at 30.01 | N/R | 72,498 |
| 857 | | 5.000%, 7/01/58 | 7/28 at 100.00 | N/R | 835,532 |
| 30 | | Riverside County Redevelopment Agency, California, Tax Allocation Bonds, Jurupa Valley | 10/21 at 100.00 | A | 32,376 |
| | Project Area, Series 2011B, 6.500%, 10/01/25 | | | |
| 115 | | Sacramento City Financing Authority, California, Lease Revenue Refunding Bonds, Series | No Opt. Call | AA– | 117,893 |
| | 1993A, 5.400%, 11/01/20 – NPFG Insured | | | |
| 20 | | San Clemente, California, Special Tax Revenue Bonds, Community Facilities District | 9/25 at 100.00 | N/R | 21,693 |
| | 2006-1 Marblehead Coastal, Series 2015, 5.000%, 9/01/40 | | | |
| 60 | | San Francisco City and County Redevelopment Agency Successor Agency, California, Special | 8/24 at 100.00 | N/R | 63,734 |
| | Tax Bonds, Community Facilities District 7, Hunters Point Shipyard Phase One Improvements, | | | |
| | Refunding Series 2014, 5.000%, 8/01/39 | | | |
| 40 | | Signal Hill Redevelopment Agency, California, Project 1 Tax Allocation Bonds, Series | 4/21 at 100.00 | N/R | 41,814 |
| | 2011, 7.000%, 10/01/26 | | | |
| 1,285 | | Stockton Public Financing Authority, California, Revenue Bonds, Arch Road East Community | 9/25 at 103.00 | N/R | 1,484,278 |
| | Facility District 99-02, Series 2018A, 5.000%, 9/01/28 | | | |
| 1,000 | | Virgin Islands Public Finance Authority, Matching Fund Loan Notes Revenue Bonds, Series | 10/22 at 100.00 | AA | 1,083,420 |
| | 2012A, 5.000%, 10/01/32 – AGM Insured | | | |
| 16,777 | | Total Tax Obligation/Limited | | | 18,234,796 |
| | Transportation – 11.7% | | | |
| 60 | | California Municipal Finance Authority, Special Facility Revenue Bonds, United Airlines, | No Opt. Call | BB– | 60,368 |
| | Inc Los Angeles International Airport Project, Series 2019, 4.000%, 7/15/29 (AMT) | | | |
| 530 | | Foothill/Eastern Transportation Corridor Agency, California, Toll Road Revenue Bonds, | 1/24 at 100.00 | BBB+ | 599,748 |
| | Refunding Junior Lien Series 2013C, 6.500%, 1/15/43 | | | |
| | Foothill/Eastern Transportation Corridor Agency, California, Toll Road Revenue Bonds, | | | |
| | Refunding Series 2013A: | | | |
| 1,000 | | 5.000%, 1/15/42 – AGM Insured | 1/24 at 100.00 | AA | 1,115,320 |
| 1,170 | | 5.750%, 1/15/46 | 1/24 at 100.00 | A– | 1,282,086 |
| 800 | | Long Beach, California, Harbor Revenue Bonds, Series 2015D, 5.000%, 5/15/42 | 5/25 at 100.00 | AA | 920,672 |
| 1,525 | | Los Angeles Department of Airports, California, Revenue Bonds, Los Angeles International | 5/28 at 100.00 | AA– | 1,746,384 |
| | Airport, Subordinate Lien Series 2018A, 5.250%, 5/15/48 (AMT) | | | |
| 2,315 | | Los Angeles Department of Airports, California, Revenue Bonds, Los Angeles International | 5/29 at 100.00 | AA– | 2,780,963 |
| | Airport, Subordinate Lien Series 2019F, 5.000%, 5/15/37 (AMT) | | | |
| 955 | | Port of Oakland, California, Revenue Bonds, Refunding Series 2012P, 5.000%, 5/01/31 (AMT) | 5/22 at 100.00 | A+ | 1,017,648 |
| 1,000 | | San Diego County Regional Airport Authority, California, Airport Revenue Bonds, | 7/29 at 100.00 | A+ | 1,160,630 |
| | Subordinate Series 2019B, 5.000%, 7/01/49 (AMT) | | | |
| 750 | | San Joaquin Hills Transportation Corridor Agency, Orange County, California, Toll Road | 1/25 at 100.00 | BBB+ | 803,918 |
| | Revenue Bonds, Refunding Junior Lien Series 2014B, 5.250%, 1/15/44 | | | |
| 10,105 | | Total Transportation | | | 11,487,737 |
| | U.S. Guaranteed – 9.1% (5) | | | |
| 55 | | California Health Facilities Financing Authority, Revenue Bonds, Providence Health & | 10/24 at 100.00 | N/R | 64,519 |
| | Services, Refunding Series 2014A, 5.000%, 10/01/38 (Pre-refunded 10/01/24) | | | |
| 250 | | California Statewide Communities Development Authority, School Facility Revenue Bonds, | 7/21 at 100.00 | B+ | 268,085 |
| | Alliance College-Ready Public Schools, Series 2011A, 7.000%, 7/01/46 (Pre-refunded 7/01/21) | | | |
| 2,000 | | Escondido Joint Powers Financing Authority, California, Revenue Bonds, Water System | 3/22 at 100.00 | AA– | 2,148,500 |
| | Financing, Series 2012, 5.000%, 9/01/41 (Pre-refunded 3/01/22) | | | |
| 1,175 | | Foothill/Eastern Transportation Corridor Agency, California, Toll Road Revenue Bonds, | 1/24 at 100.00 | A– | 1,387,910 |
| | Refunding Series 2013A, 6.000%, 1/15/53 (Pre-refunded 1/15/24) | | | |
| 675 | | Imperial Irrigation District, California, Electric System Revenue Bonds, Refunding | 11/20 at 100.00 | A1 | 692,692 |
| | Series 2011A, 5.500%, 11/01/41 (Pre-refunded 11/01/20) | | | |
52
| | | | | | |
| Principal | | | Optional Call | | |
| Amount (000) | | Description (1) | Provisions (2) | Ratings (3) | Value |
| | U.S. Guaranteed (5) (continued) | | | |
| $ 135 | | National City Community Development Commission, California, Tax Allocation Bonds, | 8/21 at 100.00 | A | $ 144,713 |
| | National City Redevelopment Project, Series 2011, 6.500%, 8/01/24 (Pre-refunded 8/01/21) | | | |
| 50 | | Novato Redevelopment Agency, California, Tax Allocation Bonds, Hamilton Field | 9/21 at 100.00 | A– | 53,989 |
| | Redevelopment Project, Series 2011, 6.750%, 9/01/40 (Pre-refunded 9/01/21) | | | |
| 1,100 | | Palomar Pomerado Health Care District, California, Certificates of Participation, Series | 11/20 at 100.00 | Ba1 | 1,130,701 |
| | 2010, 6.000%, 11/01/41 (Pre-refunded 11/01/20) | | | |
| 160 | | Rancho Santa Fe CSD Financing Authority, California, Revenue Bonds, Superior Lien Series | 9/21 at 100.00 | A– | 170,549 |
| | 2011A, 5.750%, 9/01/30 (Pre-refunded 9/01/21) | | | |
| 1,365 | | San Diego County Regional Transportation Commission, California, Sales Tax Revenue | 4/22 at 100.00 | AAA | 1,465,095 |
| | Bonds, Refunding Series 2012A, 5.000%, 4/01/42 (Pre-refunded 4/01/22) | | | |
| 25 | | San Francisco Redevelopment Finance Authority, California, Tax Allocation Revenue Bonds, | 2/21 at 100.00 | A– | 26,164 |
| | Mission Bay North Redevelopment Project, Series 2011C, 6.750%, 8/01/41 (Pre-refunded 2/01/21) | | | |
| | San Francisco Redevelopment Financing Authority, California, Tax Allocation Revenue | | | |
| | Bonds, Mission Bay South Redevelopment Project, Series 2011D: | | | |
| 25 | | 7.000%, 8/01/33 (Pre-refunded 2/01/21) | 2/21 at 100.00 | BBB+ | 26,175 |
| 30 | | 7.000%, 8/01/41 (Pre-refunded 2/01/21) | 2/21 at 100.00 | BBB+ | 31,410 |
| 360 | | Turlock Public Financing Authority, California, Tax Allocation Revenue Bonds, Series | 3/21 at 100.00 | N/R | 380,750 |
| | 2011, 7.500%, 9/01/39 (Pre-refunded 3/01/21) | | | |
| 800 | | Upland, California, Certificates of Participation, San Antonio Community Hospital, | 1/21 at 100.00 | BBB+ | 828,976 |
| | Series 2011, 6.500%, 1/01/41 (Pre-refunded 1/01/21) | | | |
| 70 | | Yorba Linda Redevelopment Agency, Orange County, California, Tax Allocation Revenue | 9/21 at 100.00 | N/R | 75,288 |
| | Bonds, Yorba Linda Redevelopment Project, Subordinate Lien Series 2011A, 6.500%, 9/01/32 | | | |
| | (Pre-refunded 9/01/21) | | | |
| 8,275 | | Total U.S. Guaranteed | | | 8,895,516 |
| | Utilities – 6.9% | | | |
| 645 | | Long Beach Bond Finance Authority, California, Natural Gas Purchase Revenue Bonds, | No Opt. Call | A+ | 828,090 |
| | Series 2007A, 5.500%, 11/15/37 | | | |
| 3,000 | | Los Angeles Department of Water and Power, California, Power System Revenue Bonds, | 7/27 at 100.00 | Aa2 | 3,545,820 |
| | Series 2017C, 5.000%, 7/01/47 | | | |
| 2,000 | | Los Angeles Department of Water and Power, California, Power System Revenue Bonds, | 1/28 at 100.00 | Aa2 | 2,429,920 |
| | Series 2018A, 5.000%, 7/01/38 | | | |
| 5,645 | | Total Utilities | | | 6,803,830 |
| | Water and Sewer – 13.6% | | | |
| 1,000 | | Bay Area Water Supply and Conservation Agency, California, Revenue Bonds, Capital Cost | 4/23 at 100.00 | AA– | 1,104,350 |
| | Recovery Prepayment Program, Series 2013A, 5.000%, 10/01/34 | | | |
| 1,480 | | California Infrastructure and Economic Development Bank, Clean Water State Revolving | 4/27 at 100.00 | AAA | 1,803,469 |
| | Fund Revenue Bonds, Green Series 2017, 5.000%, 10/01/33 | | | |
| | California Pollution Control Financing Authority, Water Furnishing Revenue Bonds, | | | |
| | Poseidon Resources Channelside LP Desalination Project, Series 2012: | | | |
| 375 | | 5.000%, 7/01/37 (AMT), 144A | 7/22 at 100.00 | BBB | 376,234 |
| 1,160 | | 5.000%, 11/21/45 (AMT), 144A | 7/22 at 100.00 | BBB | 1,143,435 |
| 1,730 | | East Bay Municipal Utility District, Alameda and Contra Costa Counties, California, | 6/27 at 100.00 | AAA | 1,912,359 |
| | Water System Revenue Bonds, Green Series 2017A, 4.000%, 6/01/45 | | | |
| 2,000 | | Irvine Ranch Water District, California, Certificates of Participation, Irvine Ranch | 9/26 at 100.00 | AAA | 2,353,000 |
| | Water District Series 2016, 5.000%, 3/01/41 | | | |
| 1,970 | | Los Angeles Department of Water and Power, California, Waterworks Revenue Bonds, Series | 7/24 at 100.00 | AA+ | 2,237,703 |
| | 2014A, 5.000%, 7/01/44 | | | |
| 1,000 | | Los Angeles Department of Water and Power, California, Waterworks Revenue Bonds, Series | 7/28 at 100.00 | AA+ | 1,231,160 |
| | 2018B, 5.000%, 7/01/38 | | | |
| 620 | | Los Angeles, California, Wastewater System Revenue Bonds, Green Subordinate Lien Series | 6/27 at 100.00 | AA | 737,788 |
| | 2017A, 5.250%, 6/01/47 | | | |
53
| | |
| NXC | Nuveen California Select Tax-Free Income Portfolio |
| Portfolio of Investments (continued) |
| March 31, 2020 |
| | | | | | |
| Principal | | | Optional Call | | |
| Amount (000) | | Description (1) | Provision (2) | Ratings (3) | Value |
| | Water and Sewer (continued) | | | |
| $ 90 | | Puerto Rico Aqueduct and Sewerage Authority, Revenue Bonds, Senior Lien Series 2008A, | 5/20 at 100.00 | CC | $ 90,900 |
| | 6.000%, 7/01/44 | | | |
| | Puerto Rico Aqueduct and Sewerage Authority, Revenue Bonds, Senior Lien Series 2012A: | | | |
| 50 | | 5.500%, 7/01/28 | 7/22 at 100.00 | CC | 48,988 |
| 175 | | 5.750%, 7/01/37 | 7/22 at 100.00 | CC | 171,937 |
| 145 | | 6.000%, 7/01/47 | 7/22 at 100.00 | CC | 142,825 |
| 11,795 | | Total Water and Sewer | | | 13,354,148 |
| $ 94,814 | | Total Long-Term Investments (cost $87,392,528) | | | 97,175,152 |
| | Other Assets Less Liabilities – 0.9% | | | 837,711 |
| | Net Assets Applicable to Common Shares – 100% | | | $ 98,012,863 |
| | |
(1) | All percentages shown in the Portfolio of Investments are based on net assets applicable to common shares unless otherwise noted. |
(2) | Optional Call Provisions: Dates (month and year) and prices of the earliest optional call or redemption. There may be other call provisions at varying prices at later dates. Certain mortgage-backed securities may be subject to periodic principal paydowns. Optional Call Provisions are not covered by the report of independent registered public accounting firm. |
(3) | For financial reporting purposes, the ratings disclosed are the highest of Standard & Poor’s Group (“Standard & Poor’s”), Moody’s Investors Service, Inc. (“Moody’s”) or Fitch, Inc. (“Fitch”) rating. This treatment of split-rated securities may differ from that used for other purposes, such as for Fund investment policies. Ratings below BBB by Standard & Poor’s, Baa by Moody’s or BBB by Fitch are considered to be below investment grade. Holdings designated N/R are not rated by any of these national rating agencies. Ratings are not covered by the report of independent registered public accounting firm. |
(4) | Step-up coupon bond, a bond with a coupon that increases ("steps up"), usually at regular intervals, while the bond is outstanding. The rate shown is the coupon as of the end of the reporting period. |
(5) | Backed by an escrow or trust containing sufficient U.S. Government or U.S. Government agency securities, which ensure the timely payment of principal and interest. |
144A | Investment is exempt from registration under Rule 144A of the Securities Act of 1933, as amended. These investments may only be resold in transactions exempt from registration, which are normally those transactions with qualified institutional buyers. |
AMT | Alternative Minimum Tax |
| See accompanying notes to financial statements. |
54
| | |
| NXN | Nuveen New York Select Tax-Free |
| Income Portfolio |
| Portfolio of Investments |
| March 31, 2020 |
| | | | | | |
| Principal | | | Optional Call | | |
| Amount (000) | | Description (1) | Provisions (2) | Ratings (3) | Value |
| | LONG-TERM INVESTMENTS – 99.0% | | | |
| | MUNICIPAL BONDS – 99.0% | | | |
| | Consumer Staples – 4.7% | | | |
| $ 435 | | Erie County Tobacco Asset Securitization Corporation, New York, Tobacco Settlement | 5/20 at 100.00 | B– | $ 408,744 |
| | Asset-Backed Bonds, Series 2005A, 5.000%, 6/01/38 | | | |
| 150 | | Nassau County Tobacco Settlement Corporation, New York, Tobacco Settlement Asset-Backed | 4/20 at 100.00 | B– | 141,567 |
| | Bonds, Refunding Series 2006A-2, 5.250%, 6/01/26 | | | |
| | New York Counties Tobacco Trust VI, New York, Tobacco Settlement Pass-Through Bonds, | | | |
| | Series 2016A-1: | | | |
| 425 | | 5.625%, 6/01/35 | No Opt. Call | BBB | 440,338 |
| 1,530 | | 5.750%, 6/01/43 | No Opt. Call | BB+ | 1,593,969 |
| 2,540 | | Total Consumer Staples | | | 2,584,618 |
| | Education and Civic Organizations – 16.4% | | | |
| 165 | | Albany Industrial Development Agency, New York, Revenue Bonds, Brighter Choice Charter | 5/20 at 100.00 | BB | 160,019 |
| | Schools, Series 2007A, 5.000%, 4/01/37 | | | |
| 280 | | Buffalo and Erie County Industrial Land Development Corporation, New York, Revenue | 12/20 at 100.00 | B+ | 282,640 |
| | Bonds, Enterprise Charter School Project, Series 2011A, 7.500%, 12/01/40 | | | |
| | Build New York City Resource Corporation, New York, Revenue Bonds, South Bronx Charter | | | |
| | School for International Cultures and the Arts Project, Series 2013A: | | | |
| 75 | | 5.000%, 4/15/33 | 4/23 at 100.00 | BB+ | 75,650 |
| 110 | | 5.000%, 4/15/43 | 4/23 at 100.00 | BB+ | 108,515 |
| 150 | | Dormitory Authority of the State of New York, General Revenue Bonds, Saint Johns | 7/23 at 100.00 | A– | 164,152 |
| | University, Series 2013A, 5.000%, 7/01/44 | | | |
| 1,000 | | Dormitory Authority of the State of New York, Housing Revenue Bonds, Fashion Institute | No Opt. Call | Baa2 | 1,307,950 |
| | of Technology, Series 2007, 5.250%, 7/01/34 – FGIC Insured | | | |
| | Dormitory Authority of the State of New York, Lease Revenue Bonds, State University | | | |
| | Dormitory Facilities, Series 2015A: | | | |
| 20 | | 5.000%, 7/01/31 | 7/25 at 100.00 | Aa3 | 23,444 |
| 25 | | 5.000%, 7/01/33 | 7/25 at 100.00 | Aa3 | 29,236 |
| 1,000 | | Dormitory Authority of the State of New York, Revenue Bonds, Columbia University, Series | 4/21 at 100.00 | AAA | 1,035,420 |
| | 2011A, 5.000%, 10/01/41 | | | |
| 605 | | Dormitory Authority of the State of New York, Revenue Bonds, Icahn School of Medicine at | 7/25 at 100.00 | A– | 693,070 |
| | Mount Sinai, Refunding Series 2015A, 5.000%, 7/01/40 | | | |
| 290 | | Dormitory Authority of the State of New York, Revenue Bonds, New York University, Series | 7/25 at 100.00 | Aa2 | 339,616 |
| | 2015A, 5.000%, 7/01/35 | | | |
| 1,185 | | Dormitory Authority of the State of New York, Revenue Bonds, New York University, Series | 7/26 at 100.00 | Aa2 | 1,361,743 |
| | 2016A, 5.000%, 7/01/39 | | | |
| 70 | | Dormitory Authority of the State of New York, Revenue Bonds, Rochester Institute of | 7/29 at 100.00 | A1 | 85,611 |
| | Technology, Series 2019A, 5.000%, 7/01/49 | | | |
| 120 | | Dormitory Authority of the State of New York, Revenue Bonds, Saint Joseph’s College, | 7/20 at 100.00 | Ba1 | 120,012 |
| | Series 2010, 5.250%, 7/01/35 | | | |
| 250 | | Dormitory Authority of the State of New York, Revenue Bonds, Vaughn College of | 12/26 at 100.00 | BB– | 247,292 |
| | Aeronautics & Technology, Series 2016A, 5.500%, 12/01/36, 144A | | | |
| 215 | | Glen Cove Local Economic Assistance Corporation, New York, Revenue Bonds, Garvies Point | 1/34 at 100.00 | N/R | 185,904 |
| | Public Improvement Project, Capital Appreciation Series 2016C, 0.000%, 1/01/55 (4) | | | |
| 110 | | Hempstead Town Local Development Corporation, New York, Revenue Bonds, Adelphi | 9/23 at 100.00 | A– | 121,576 |
| | University Project, Series 2013, 5.000%, 9/01/38 | | | |
55
| | | |
| NXN | | Nuveen New York Select Tax-Free Income Portfolio |
| | Portfolio of Investments (continued) |
| | March 31, 2020 |
|
|
| Principal | | | Optional Call | | |
| Amount (000) | | Description (1) | Provisions (2) | Ratings (3) | Value |
| | Education and Civic Organizations (continued) | | | |
| | New York City Industrial Development Agency, New York, PILOT Revenue Bonds, Queens | | | |
| | Baseball Stadium Project, Series 2006: | | | |
| $ 500 | | 5.000%, 1/01/31 – AMBAC Insured | 5/20 at 100.00 | BBB | $ 491,095 |
| 430 | | 4.750%, 1/01/42 – AMBAC Insured | 5/20 at 100.00 | BBB | 422,595 |
| 300 | | New York City Industrial Development Authority, New York, PILOT Revenue Bonds, Yankee | 5/20 at 100.00 | Baa1 | 294,927 |
| | Stadium Project, Series 2006, 4.750%, 3/01/46 – NPFG Insured | | | |
| 1,005 | | New York City Trust for Cultural Resources, New York, Revenue Bonds, Wildlife | 8/23 at 100.00 | AA– | 1,119,681 |
| | Conservation Society, Series 2014A, 5.000%, 8/01/32 | | | |
| 190 | | New York Liberty Development Corporation, New York, Liberty Revenue Bonds, Bank of | 3/29 at 100.00 | A2 | 181,416 |
| | America Tower at One Bryant Park Project, Second Priority Refunding Series 2019 Class 2, | | | |
| | 2.625%, 9/15/69 | | | |
| 145 | | New York Liberty Development Corporation, New York, Liberty Revenue Bonds, Bank of | 3/29 at 100.00 | Baa2 | 138,445 |
| | America Tower at One Bryant Park Project, Second Priority Refunding Series 2019 Class 3, | | | |
| | 2.800%, 9/15/69 | | | |
| 8,240 | | Total Education and Civic Organizations | | | 8,990,009 |
| | Financials – 1.0% | | | |
| 450 | | Liberty Development Corporation, New York, Goldman Sachs Headquarter Revenue Bonds, | No Opt. Call | A | 555,808 |
| | Series 2005, 5.250%, 10/01/35 | | | |
| | Health Care – 0.6% | | | |
| 100 | | Dormitory Authority of the State of New York, Highland Hospital of Rochester Revenue | 7/20 at 100.00 | A | 100,800 |
| | Bonds, Series 2010, 5.200%, 7/01/32 | | | |
| 200 | | Dutchess County Local Development Corporation, New York, Revenue Bonds, Health Quest | 7/26 at 100.00 | A– | 213,608 |
| | Systems, Inc Project, Series 2016B, 4.000%, 7/01/41 | | | |
| 300 | | Total Health Care | | | 314,408 |
| | Industrials – 3.8% | | | |
| 160 | | Build New York City Resource Corporation, New York, Solid Waste Disposal Revenue Bonds, | 1/25 at 100.00 | N/R | 163,856 |
| | Pratt Paper NY, Inc Project, Series 2014, 5.000%, 1/01/35 (AMT), 144A | | | |
| 1,865 | | New York Liberty Development Corporation, New York, Liberty Revenue Bonds, 3 World Trade | 11/24 at 100.00 | N/R | 1,894,075 |
| | Center Project, Class 1 Series 2014, 5.000%, 11/15/44, 144A | | | |
| 2,025 | | Total Industrials | | | 2,057,931 |
| | Long-Term Care – 0.2% | | | |
| 100 | | Dormitory Authority of the State of New York, Non-State Supported Debt, Ozanam Hall of | 5/20 at 100.00 | A2 | 100,219 |
| | Queens Nursing Home Revenue Bonds, Series 2006, 5.000%, 11/01/31 | | | |
| 25 | | Monroe County Industrial Development Corporation, New York, Revenue Bonds, Saint Ann?s | 1/26 at 103.00 | N/R | 22,179 |
| | Community Project, Series 2019, 5.000%, 1/01/50 | | | |
| 125 | | Total Long-Term Care | | | 122,398 |
| | Tax Obligation/General – 5.2% | | | |
| 1,080 | | New York City, New York, General Obligation Bonds, Fiscal 2017 Series B-1, 5.000%, 12/01/41 | 12/26 at 100.00 | Aa1 | 1,276,873 |
| 835 | | New York City, New York, General Obligation Bonds, Fiscal 2020 Series D-1, 4.000%, 3/01/50 | 3/30 at 100.00 | Aa1 | 934,198 |
| 600 | | Yonkers, New York, General Obligation Bonds, Refunding Series 2011A, 5.000%, 10/01/24 – | 10/21 at 100.00 | AA | 635,946 |
| | AGM Insured | | | |
| 2,515 | | Total Tax Obligation/General | | | 2,847,017 |
| | Tax Obligation/Limited – 21.5% | | | |
| 1,050 | | Dormitory Authority of the State of New York, State Personal Income Tax Revenue Bonds, | 2/22 at 100.00 | AA+ | 1,109,346 |
| | General Purpose Series 2012D, 5.000%, 2/15/37 | | | |
| 1,000 | | Dormitory Authority of the State of New York, State Personal Income Tax Revenue Bonds, | 3/29 at 100.00 | Aa1 | 1,222,160 |
| | General Purpose, Series 2019A Bidding Group 2,3,4, 5.000%, 3/15/46 | | | |
| 1,000 | | Dormitory Authority of the State of New York, State Sales Tax Revenue Bonds, Series | 9/25 at 100.00 | AA+ | 1,176,540 |
| | 2015B Group A,B&C, 5.000%, 3/15/35 | | | |
| 1,000 | | Government of Guam, Business Privilege Tax Bonds, Refunding Series 2015D, | No Opt. Call | BB | 1,027,480 |
| | 5.000%, 11/15/25 | | | |
56
| | | | | | |
| Principal | | | Optional Call | | |
| Amount (000) | | Description (1) | Provisions (2) | Ratings (3) | Value |
| | Tax Obligation/Limited (continued) | | | |
| $ 800 | | Hudson Yards Infrastructure Corporation, New York, Revenue Bonds, Second Indenture | 2/27 at 100.00 | Aa2 | $ 953,488 |
| | Fiscal 2017 Series A, 5.000%, 2/15/38 | | | |
| 760 | | Hudson Yards Infrastructure Corporation, New York, Revenue Bonds, Senior Fiscal 2012 | 2/21 at 100.00 | Aa2 | 786,372 |
| | Series 2011A, 5.750%, 2/15/47 | | | |
| 1,000 | | New York City Transitional Finance Authority, New York, Building Aid Revenue Bonds, | 7/25 at 100.00 | AA | 1,148,140 |
| | Fiscal Series 2015S-2, 5.000%, 7/15/40 | | | |
| 1,000 | | New York City Transitional Finance Authority, New York, Future Tax Secured Bonds, | 5/23 at 100.00 | AAA | 1,096,980 |
| | Subordinate Fiscal 2013 Series I, 5.000%, 5/01/38 | | | |
| 450 | | New York City Transitional Finance Authority, New York, Future Tax Secured Bonds, | 2/24 at 100.00 | AAA | 504,959 |
| | Subordinate Fiscal 2014 Series D-1, 5.000%, 2/01/35 | | | |
| 500 | | New York City Transitional Finance Authority, New York, Future Tax Secured Revenue | 2/21 at 100.00 | AAA | 515,915 |
| | Bonds, Subordinate Series 2011-D1, 5.250%, 2/01/30 | | | |
| 535 | | New York City Transitional Finance Authority, New York, Future Tax Secured Revenue | 6/20 at 100.00 | AAA | 539,847 |
| | Bonds, Tender Option Bond Trust 2015-XF0080, 4.064%, 5/01/38, 144A (IF) | | | |
| 570 | | New York State Thruway Authority, Highway and Bridge Trust Fund Bonds, Second General, | No Opt. Call | AA+ | 570,000 |
| | Series 2005B, 5.500%, 4/01/20 – AMBAC Insured (UB) (5) | | | |
| 235 | | Puerto Rico Sales Tax Financing Corporation, Sales Tax Revenue Bonds, Restructured | 7/28 at 100.00 | N/R | 229,113 |
| | 2018A-1, 5.000%, 7/01/58 | | | |
| 845 | | Virgin Islands Public Finance Authority, Matching Fund Loan Notes Revenue Bonds, Series | 10/22 at 100.00 | AA | 915,490 |
| | 2012A, 5.000%, 10/01/32 – AGM Insured | | | |
| 10,745 | | Total Tax Obligation/Limited | | | 11,795,830 |
| | Transportation – 18.3% | | | |
| 1,000 | | Metropolitan Transportation Authority, New York, Transportation Revenue Bonds, Series | 5/24 at 100.00 | AA– | 1,086,600 |
| | 2014B, 5.250%, 11/15/38 | | | |
| 250 | | New York Liberty Development Corporation, New York, Liberty Revenue Bonds, 4 World Trade | 11/21 at 100.00 | A+ | 263,245 |
| | Center Project, Series 2011, 5.000%, 11/15/44 | | | |
| | New York Transportation Development Corporation, New York, Special Facility Revenue | | | |
| | Bonds, American Airlines, Inc John F Kennedy International Airport Project, Refunding | | | |
| | Series 2016: | | | |
| 345 | | 5.000%, 8/01/26 (AMT) | 8/21 at 100.00 | BB | 344,237 |
| 685 | | 5.000%, 8/01/31 (AMT) | 8/21 at 100.00 | BB | 683,191 |
| 700 | | New York Transportation Development Corporation, New York, Special Facility Revenue | No Opt. Call | Baa3 | 700,840 |
| | Bonds, Delta Air Lines, Inc – LaGuardia Airport Terminals C&D Redevelopment Project, Series | | | |
| | 2018, 5.000%, 1/01/28 (AMT) | | | |
| 980 | | New York Transportation Development Corporation, Special Facilities Bonds, LaGuardia | 7/24 at 100.00 | BBB | 994,857 |
| | Airport Terminal B Redevelopment Project, Series 2016A, 5.000%, 7/01/46 (AMT) | | | |
| 1,000 | | Port Authority of New York and New Jersey, Consolidated Revenue Bonds, One Hundred | 10/25 at 100.00 | AA– | 1,144,780 |
| | Ninety-Fourth Series 2015, 5.250%, 10/15/55 | | | |
| 1,500 | | Port Authority of New York and New Jersey, Consolidated Revenue Bonds, Two Hundred | 9/28 at 100.00 | AA– | 1,827,315 |
| | Eleventh Series 2018, 5.000%, 9/01/48 | | | |
| | Port Authority of New York and New Jersey, Special Project Bonds, JFK International Air | | | |
| | Terminal LLC Project, Eighth Series 2010: | | | |
| 290 | | 6.500%, 12/01/28 | 5/20 at 100.00 | BBB+ | 290,273 |
| 215 | | 6.000%, 12/01/36 | 12/20 at 100.00 | BBB+ | 221,003 |
| 1,000 | | Triborough Bridge and Tunnel Authority, New York, General Purpose Revenue Bonds, MTA | 5/27 at 100.00 | AA– | 1,194,050 |
| | Bridges & Tunnels, Refunding Series 2017B, 5.000%, 11/15/36 | | | |
| 1,095 | | Triborough Bridge and Tunnel Authority, New York, General Purpose Revenue Bonds, MTA | 5/27 at 100.00 | AA– | 1,283,581 |
| | Bridges & Tunnels, Series 2017A, 5.000%, 11/15/47 | | | |
| 9,060 | | Total Transportation | | | 10,033,972 |
| | U.S. Guaranteed – 10.2% (6) | | | |
| 1,800 | | Dormitory Authority of the State of New York, Revenue Bonds, Non State Supported Debt, | 7/20 at 100.00 | Aa1 | 1,817,748 |
| | Cornell University, Series 2010A, 5.000%, 7/01/40 (Pre-refunded 7/01/20) | | | |
| 1,240 | | Hudson Yards Infrastructure Corporation, New York, Revenue Bonds, Senior Fiscal 2012 | 2/21 at 100.00 | Aa2 | 1,289,625 |
| | Series 2011A, 5.750%, 2/15/47 (Pre-refunded 2/15/21) | | | |
| 400 | | Long Island Power Authority, New York, Electric System Revenue Bonds, Series 2011A, | 5/21 at 100.00 | A | 417,104 |
| | 5.000%, 5/01/38 (Pre-refunded 5/01/21) | | | |
57
| | |
| NXN | Nuveen New York Select Tax-Free Income Portfolio |
| Portfolio of Investments (continued) |
| March 31, 2020 |
| | | | | | |
| Principal | | | Optional Call | | |
| Amount (000) | | Description (1) | Provisions (2) | Ratings (3) | Value |
| | U.S. Guaranteed (6) (continued) | | | |
| $ 2,000 | | Monroe County Industrial Development Corporation, New York, Revenue Bonds, University | 7/21 at 100.00 | AA– | $ 2,099,900 |
| | of Rochester Project, Series 2011B, 5.000%, 7/01/41 (Pre-refunded 7/01/21) | | | |
| 5,440 | | Total U.S. Guaranteed | | | 5,624,377 |
| | Utilities – 7.4% | | | |
| 35 | | Guam Power Authority, Revenue Bonds, Series 2012A, 5.000%, 10/01/34 | 10/22 at 100.00 | BBB | 35,326 |
| 50 | | Long Island Power Authority, New York, Electric System General Revenue Bonds, Series | 9/24 at 100.00 | A | 55,556 |
| | 2014A, 5.000%, 9/01/44 | | | |
| 180 | | Long Island Power Authority, New York, Electric System General Revenue Bonds, Series | 9/27 at 100.00 | A | 209,810 |
| | 2017, 5.000%, 9/01/47 | | | |
| 150 | | Niagara Area Development Corporation, New York, Solid Waste Disposal Facility Revenue | 7/23 at 100.00 | B1 | 146,941 |
| | Refunding Bonds, Covanta Energy Project, Series 2018A, 4.750%, 11/01/42 (AMT), 144A | | | |
| 1,365 | | Utility Debt Securitization Authority, New York, Restructuring Bonds, Series 2013TE, | 12/23 at 100.00 | AAA | 1,536,881 |
| | 5.000%, 12/15/41 | | | |
| 1,750 | | Utility Debt Securitization Authority, New York, Restructuring Bonds, Series 2016B, | 6/26 at 100.00 | AAA | 2,086,122 |
| | 5.000%, 12/15/35 | | | |
| 3,530 | | Total Utilities | | | 4,070,636 |
| | Water and Sewer – 9.7% | | | |
| 200 | | Buffalo Municipal Water Finance Authority, New York, Water System Revenue Bonds, | 7/25 at 100.00 | A+ | 234,768 |
| | Refunding Series 2015A, 5.000%, 7/01/29 | | | |
| 3,000 | | New York City Municipal Water Finance Authority, New York, Water and Sewer System Second | 12/27 at 100.00 | AA+ | 3,636,180 |
| | General Resolution Revenue Bonds, Fiscal 2018 Series EE, 5.000%, 6/15/40 | | | |
| 1,000 | | New York State Environmental Facilities Corporation, State Clean Water and Drinking | 6/27 at 100.00 | AAA | 1,198,830 |
| | Water Revolving Funds Revenue Bonds, New York City Municipal Water Finance Authority | | | |
| | Projects-Second Resolution Bonds,, 5.000%, 6/15/42 | | | |
| 55 | | Puerto Rico Aqueduct and Sewerage Authority, Revenue Bonds, Senior Lien Series 2008A, | 5/20 at 100.00 | CC | 55,550 |
| | 6.000%, 7/01/44 | | | |
| | Puerto Rico Aqueduct and Sewerage Authority, Revenue Bonds, Senior Lien Series 2012A: | | | |
| 25 | | 5.500%, 7/01/28 | 7/22 at 100.00 | CC | 24,494 |
| 100 | | 5.750%, 7/01/37 | 7/22 at 100.00 | CC | 98,250 |
| 80 | | 6.000%, 7/01/47 | 7/22 at 100.00 | CC | 78,800 |
| 4,460 | | Total Water and Sewer | | | 5,326,872 |
| $ 49,430 | | Total Long-Term Investments (cost $51,976,473) | | | 54,323,876 |
| | Floating Rate Obligations – (0.8)% | | | (425,000) |
| | Other Assets Less Liabilities – 1.8% | | | 993,768 |
| | Net Assets Applicable to Common Shares – 100% | | | $ 54,892,644 |
| | |
(1) | All percentages shown in the Portfolio of Investments are based on net assets applicable to common shares unless otherwise noted. |
(2) | Optional Call Provisions: Dates (month and year) and prices of the earliest optional call or redemption. There may be other call provisions at varying prices at later dates. Certain mortgage-backed securities may be subject to periodic principal paydowns. Optional Call Provisions are not covered by the report of independent registered public accounting firm. |
(3) | For financial reporting purposes, the ratings disclosed are the highest of Standard & Poor’s Group (“Standard & Poor’s”), Moody’s Investors Service, Inc. (“Moody’s”) or Fitch, Inc. (“Fitch”) rating. This treatment of split-rated securities may differ from that used for other purposes, such as for Fund investment policies. Ratings below BBB by Standard & Poor’s, Baa by Moody’s or BBB by Fitch are considered to be below investment grade. Holdings designated N/R are not rated by any of these national rating agencies. Ratings are not covered by the report of independent registered public accounting firm. |
(4) | Step-up coupon bond, a bond with a coupon that increases ("steps up"), usually at regular intervals, while the bond is outstanding. The rate shown is the coupon as of the end of the reporting period. |
(5) | Investment, or portion of investment, has been pledged to collateralize the net payment obligations for investments in inverse floating rate transactions. |
(6) | Backed by an escrow or trust containing sufficient U.S. Government or U.S. Government agency securities, which ensure the timely payment of principal and interest. |
144A | Investment is exempt from registration under Rule 144A of the Securities Act of 1933, as amended. These investments may only be resold in transactions exempt from registration, which are normally those transactions with qualified institutional buyers. |
AMT | Alternative Minimum Tax |
IF | Inverse floating rate security issued by a tender option bond (“TOB”) trust, the interest rate on which varies inversely with the Securities Industry Financial Markets Association (SIFMA) short-term rate, which resets weekly, or a similar short-term rate, and is reduced by the expenses related to the TOB trust. |
UB | Underlying bond of an inverse floating rate trust reflected as a financing transaction. See Notes to Financial Statements, Note 4 – Portfolio Securities and Investments in Derivatives, Inverse Floating Rate Securities for more information. |
| See accompanying notes to financial statements. |
58
Statement of Assets and Liabilities
March 31, 2020
| | | | | | | | | | | | | | | | | |
| | | | NXP | | | NXQ | | | NXR | | | NXC | | | NXN | |
| Assets | | | | | | | | | | | | | | | | |
Long-term investments, at value (cost $225,213,971, | | | | | | | | | | | | | | | | |
| $232,052,131, $177,802,332, $87,392,528 | | | | | | | | | | | | | | | | |
| and $51,976,473, respectively) | | | $ | 257,627,928 | | | $ | 259,089,139 | | | $ | 209,720,700 | | | $ | 97,175,152 | | | $ | 54,323,876 | |
Short-term investments, at value (cost | | | | | | | | | | | | | | | | | | | | | |
| $2,305,000, $5,345,000, $1,040,000, $— and | | | | | | | | | | | | | | | | | | | | | |
| $—, respectively) | | | | 2,181,795 | | | | 5,218,019 | | | | 941,813 | | | | — | | | | — | |
Cash | | | | 94,348 | | | | 230,527 | | | | 266,128 | | | | — | | | | 507,106 | |
Receivable for: | | | | | | | | | | | | | | | | | | | | | |
| Interest | | | | 2,375,290 | | | | 2,584,788 | | | | 1,867,912 | | | | 1,109,908 | | | | 704,507 | |
| Investments sold | | | | — | | | | — | | | | 300,000 | | | | 694,661 | | | | 703,884 | |
Other assets | | | | 66,024 | | | | 68,950 | | | | 51,292 | | | | 25,095 | | | | 15,377 | |
| Total assets | | | | 262,345,385 | | | | 267,191,423 | | | | 213,147,845 | | | | 99,004,816 | | | | 56,254,750 | |
| Liabilities | | | | | | | | | | | | | | | | | | | | | |
Cash overdraft | | | | — | | | | — | | | | — | | | | 626,459 | | | | — | |
Floating rate obligations | | | | — | | | | — | | | | — | | | | — | | | | 425,000 | |
Payable for: | | | | | | | | | | | | | | | | | | | | | |
| Dividends | | | | 715,499 | | | | 720,231 | | | | 548,212 | | | | 266,347 | | | | 149,292 | |
| Interest | | | | — | | | | — | | | | — | | | | — | | | | 4,215 | |
| Investments purchased — regular settlement | | | | — | | | | — | | | | — | | | | — | | | | 709,687 | |
Accrued expenses: | | | | | | | | | | | | | | | | | | | | | |
| Management fees | | | | 44,723 | | | | 56,879 | | | | 45,674 | | | | 21,459 | | | | 12,082 | |
| Trustees fees | | | | 67,345 | | | | 70,297 | | | | 52,355 | | | | 25,588 | | | | 15,657 | |
| Other | | | | 79,673 | | | | 79,375 | | | | 67,720 | | | | 52,100 | | | | 46,173 | |
Total liabilities | | | | 907,240 | | | | 926,782 | | | | 713,961 | | | | 991,953 | | | | 1,362,106 | |
Net assets applicable to common shares | | | $ | 261,438,145 | | | $ | 266,264,641 | | | $ | 212,433,884 | | | $ | 98,012,863 | | | $ | 54,892,644 | |
Common shares outstanding | | | | 16,577,786 | | | | 17,713,727 | | | | 13,045,560 | | | | 6,351,912 | | | | 3,924,895 | |
Net asset value (“NAV”) per common share outstanding | | | $ | 15.77 | | | $ | 15.03 | | | $ | 16.28 | | | $ | 15.43 | | | $ | 13.99 | |
| | |
| Net assets applicable to common shares consist of: | | | | | | | | | | | | | | | | | | | | | |
Common shares, $0.01 par value per share | | | $ | 165,778 | | | $ | 177,137 | | | $ | 130,456 | | | $ | 63,519 | | | $ | 39,249 | |
Paid-in-surplus | | | | 230,227,958 | | | | 245,552,725 | | | | 179,536,881 | | | | 88,388,411 | | | | 53,856,609 | |
Total distributable earnings | | | | 31,044,409 | | | | 20,534,779 | | | | 32,766,547 | | | | 9,560,933 | | | | 996,786 | |
Net assets applicable to common shares | | | $ | 261,438,145 | | | $ | 266,264,641 | | | $ | 212,433,884 | | | $ | 98,012,863 | | | $ | 54,892,644 | |
Authorized shares | | | Unlimited | | | Unlimited | | | Unlimited | | | Unlimited | | | Unlimited | |
See accompanying notes to financial statements.
59
| |
|
|
| Year Ended March 31, 2020 |
|
|
|
| | |
| | NXP | | | NXQ | | | NXR | | | NXC | | | NXN | |
| Investment Income | | $ | 10,247,210 | | | $ | 10,255,162 | | | $ | 8,153,356 | | | $ | 3,730,489 | | | $ | 2,143,646 | |
| Expenses | | | | | | | | | | | | | | | | | | | | |
Management fees | | | 530,335 | | | | 675,433 | | | | 539,139 | | | | 255,125 | | | | 144,740 | |
Interest expense | | | — | | | | — | | | | — | | | | — | | | | 8,586 | |
Custodian fees | | | 38,904 | | | | 39,408 | | | | 32,797 | | | | 21,726 | | | | 16,926 | |
Trustees fees | | | 6,330 | | | | 6,459 | | | | 5,104 | | | | 2,365 | | | | 1,341 | |
Professional fees | | | 34,913 | | | | 35,046 | | | | 33,636 | | | | 31,234 | | | | 29,831 | |
Shareholder reporting expenses | | | 37,689 | | | | 35,479 | | | | 27,358 | | | | 16,235 | | | | 11,558 | |
Shareholder servicing agent fees | | | 9,288 | | | | 8,341 | | | | 7,020 | | | | 2,407 | | | | 2,338 | |
Stock exchange listing fees | | | 6,904 | | | | 6,904 | | | | 6,904 | | | | 6,937 | | | | 6,904 | |
Investor relations expenses | | | 15,787 | | | | 16,030 | | | | 12,513 | | | | 6,077 | | | | 3,759 | |
Other | | | 16,599 | | | | 19,269 | | | | 15,147 | | | | 12,934 | | | | 13,031 | |
Total expenses | | | 696,749 | | | | 842,369 | | | | 679,618 | | | | 355,040 | | | | 239,014 | |
Net investment income (loss) | | | 9,550,461 | | | | 9,412,793 | | | | 7,473,738 | | | | 3,375,449 | | | | 1,904,632 | |
| Realized and Unrealized Gain (Loss) | | | | | | | | | | | | | | | | | | | | |
Net realized gain (loss) from investments | | | 744,584 | | | | 1,145,079 | | | | 344,363 | | | | 129,883 | | | | 21,954 | |
Change in net unrealized appreciation (depreciation) | | | | | | | | | | | | | | | | | | | | |
| of investments | | | 3,133,910 | | | | 1,324,827 | | | | 4,647,408 | | | | 1,198,763 | | | | (443,509 | ) |
Net realized and unrealized gain (loss) | | | 3,878,494 | | | | 2,469,906 | | | | 4,991,771 | | | | 1,328,646 | | | | (421,555 | ) |
Net increase (decrease) in net assets applicable | | | | | | | | | | | | | | | | | | | | |
| to common shares from operations | | $ | 13,428,955 | | | $ | 11,882,699 | | | $ | 12,465,509 | | | $ | 4,704,095 | | | $ | 1,483,077 | |
See accompanying notes to financial statements.
60
Statement of Changes in Net Assets
| | | | | | | | | | | | | | | | | | | |
| | NXP | | | NXQ | | | NXR | |
| | Year | | | Year | | | Year | | | Year | | | Year | | | Year | |
| | Ended | | | Ended | | | Ended | | | Ended | | | Ended | | | Ended | |
| | 3/31/20 | | | 3/31/19 | | | 3/31/20 | | | 3/31/19 | | | 3/31/20 | | | 3/31/19 | |
| Operations | | | | | | | | | | | | | | | | | | |
Net investment income (loss) | | $ | 9,550,461 | | | $ | 9,442,122 | | | $ | 9,412,793 | | | $ | 9,344,515 | | | $ | 7,473,738 | | | $ | 7,278,439 | |
Net realized gain (loss) from investments | | | 744,584 | | | | 412,456 | | | | 1,145,079 | | | | (108,741 | ) | | | 344,363 | | | | 371,899 | |
Change in net unrealized appreciation | | | | | | | | | | | | | | | | | | | | | | | | |
| (depreciation) of investments | | | 3,133,910 | | | | 5,578,624 | | | | 1,324,827 | | | | 5,751,292 | | | | 4,647,408 | | | | 5,173,016 | |
Net increase (decrease) in net assets | | | | | | | | | | | | | | | | | | | | | | | | |
| applicable to common shares | | | | | | | | | | | | | | | | | | | | | | | | |
| from operations | | | 13,428,955 | | | | 15,433,202 | | | | 11,882,699 | | | | 14,987,066 | | | | 12,465,509 | | | | 12,823,354 | |
| Distributions to Common Shareholders | | | | | | | | | | | | | | | | | | | | | | | | |
Dividends | | | (9,048,585 | ) | | | (9,047,389 | ) | | | (8,927,718 | ) | | | (8,927,718 | ) | | | (6,809,782 | ) | | | (6,809,782 | ) |
Decrease in net assets applicable to | | | | | | | | | | | | | | | | | | | | | | | | |
| common shares from distributions to | | | | | | | | | | | | | | | | | | | | | | | | |
| common shareholders | | | (9,048,585 | ) | | | (9,047,389 | ) | | | (8,927,718 | ) | | | (8,927,718 | ) | | | (6,809,782 | ) | | | (6,809,782 | ) |
| Capital Share Transactions | | | | | | | | | | | | | | | | | | | | | | | | |
Common shares: | | | | | | | | | | | | | | | | | | | | | | | | |
| Proceeds from shelf offering, net of | | | | | | | | | | | | | | | | | | | | | | | | |
| offering costs | | | — | | | | — | | | | — | | | | — | | | | — | | | | — | |
Net proceeds from shares issued | | | | | | | | | | | | | | | | | | | | | | | | |
| to shareholders due to | | | | | | | | | | | | | | | | | | | | | | | | |
| reinvestment of distributions | | | 120,787 | | | | — | | | | — | | | | — | | | | — | | | | — | |
Net increase (decrease) in net assets | | | | | | | | | | | | | | | | | | | | | | | | |
| applicable to common shares | | | | | | | | | | | | | | | | | | | | | | | | |
| from capital share transactions | | | 120,787 | | | | — | | | | — | | | | — | | | | — | | | | — | |
Net increase (decrease) in net assets | | | | | | | | | | | | | | | | | | | | | | | | |
| applicable to common shares | | | 4,501,157 | | | | 6,385,813 | | | | 2,954,981 | | | | 6,059,348 | | | | 5,655,727 | | | | 6,013,572 | |
Net assets applicable to common | | | | | | | | | | | | | | | | | | | | | | | | |
| shares at the beginning of period | | | 256,936,988 | | | | 250,551,175 | | | | 263,309,660 | | | | 257,250,312 | | | | 206,778,157 | | | | 200,764,585 | |
Net assets applicable to common | | | | | | | | | | | | | | | | | | | | | | | | |
| shares at the end of period | | $ | 261,438,145 | | | $ | 256,936,988 | | | $ | 266,264,641 | | | $ | 263,309,660 | | | $ | 212,433,884 | | | $ | 206,778,157 | |
See accompanying notes to financial statements.
61
| |
| Statement of Changes in Net Assets (continued) |
|
|
|
| | |
| | NXC | | | NXN | |
| | Year | | | Year | | | Year | | | Year | |
| | Ended | | | Ended | | | Ended | | | Ended | |
| | 3/31/20 | | | 3/31/19 | | | 3/31/20 | | | 3/31/19 | |
| Operations | | | | | | | | | | | | |
Net investment income (loss) | | $ | 3,375,449 | | | $ | 3,202,963 | | | $ | 1,904,632 | | | $ | 1,947,631 | |
Net realized gain (loss) from investments | | | 129,883 | | | | (362,089 | ) | | | 21,954 | | | | (57,760 | ) |
Change in net unrealized appreciation | | | | | | | | | | | | | | | | |
| (depreciation) of investments | | | 1,198,763 | | | | 1,545,986 | | | | (443,509 | ) | | | 669,699 | |
Net increase (decrease) in net assets | | | | | | | | | | | | | | | | |
| applicable to common shares | | | | | | | | | | | | | | | | |
| from operations | | | 4,704,095 | | | | 4,386,860 | | | | 1,483,077 | | | | 2,559,570 | |
| Distributions to Common Shareholders | | | | | | | | | | | | | | | | |
Dividends | | | (3,295,962 | ) | | | (3,276,565 | ) | | | (1,860,400 | ) | | | (1,968,334 | ) |
Decrease in net assets applicable to | | | | | | | | | | | | | | | | |
| common shares from distributions to | | | | | | | | | | | | | | | | |
| common shareholders | | | (3,295,962 | ) | | | (3,276,565 | ) | | | (1,860,400 | ) | | | (1,968,334 | ) |
| Capital Share Transactions | | | | | | | | | | | | | | | | |
Common shares: | | | | | | | | | | | | | | | | |
| Proceeds from shelf offering, net of | | | | | | | | | | | | | | | | |
| offering costs | | | — | | | | 106,141 | | | | — | | | | — | |
Net proceeds from shares issued | | | | | | | | | | | | | | | | |
| to shareholders due to | | | | | | | | | | | | | | | | |
| reinvestment of distributions | | | 31,306 | | | | — | | | | — | | | | — | |
Net increase (decrease) in net assets | | | | | | | | | | | | | | | | |
| applicable to common shares | | | | | | | | | | | | | | | | |
| from capital share transactions | | | 31,306 | | | | 106,141 | | | | — | | | | — | |
Net increase (decrease) in net assets | | | | | | | | | | | | | | | | |
| applicable to common shares | | | 1,439,439 | | | | 1,216,436 | | | | (377,323 | ) | | | 591,236 | |
Net assets applicable to common | | | | | | | | | | | | | | | | |
| shares at the beginning of period | | | 96,573,424 | | | | 95,356,988 | | | | 55,269,967 | | | | 54,678,731 | |
Net assets applicable to common | | | | | | | | | | | | | | | | |
| shares at the end of period | | $ | 98,012,863 | | | $ | 96,573,424 | | | $ | 54,892,644 | | | $ | 55,269,967 | |
See accompanying notes to financial statements.
62
THIS PAGE INTENTIONALLY LEFT BLANK
63
Selected data for a common share outstanding throughout each period:
| | | | | | | | | | | | | | | | | | | | | | | | | | | | |
| | | | | Investment Operations | | | Less Distributions to Common Shareholders | | | Common Share | |
| | | Beginning Common Share NAV | | | Net Investment Income (Loss) | | | Net Realized/ Unrealized Gain (Loss) | | | Total | | | From Net Investment Income | | | From Accumulated
Net Realized
Gains | | | Total | | | Ending NAV | | | Ending Share Price | |
| NXP | | | | | | | | | | | | | | | | | | | | | | | | | | | |
Year Ended 3/31:
| | | | | | | | | | | | | | | | | | | | | | |
2020 | | $ | 15.51 | | | $ | 0.58 | | | $ | 0.23 | | | $ | 0.81 | | | $ | (0.55 | ) | | $ | — | | | $ | (0.55 | ) | | $ | 15.77 | | | $ | 14.97 | |
2019 | | | 15.12 | | | | 0.57 | | | | 0.37 | | | | 0.94 | | | | (0.55 | ) | | | — | | | | (0.55 | ) | | | 15.51 | | | | 14.64 | |
2018 | | | 15.00 | | | | 0.56 | | | | 0.11 | | | | 0.67 | | | | (0.55 | ) | | | — | | | | (0.55 | ) | | | 15.12 | | | | 14.02 | |
2017 | | | 15.46 | | | | 0.56 | | | | (0.47 | ) | | | 0.09 | | | | (0.55 | ) | | | — | | | | (0.55 | ) | | | 15.00 | | | | 14.03 | |
2016 | | | 15.17 | | | | 0.58 | | | | 0.27 | | | | 0.85 | | | | (0.56 | ) | | | — | | | | (0.56 | ) | | | 15.46 | | | | 14.89 | |
| | |
| NXQ | | | | | | | | | | | | | | | | | | | | | | | | | | | | | | | | | | | | |
Year Ended 3/31:
| | | | | | | | | | | | | | | | | | | | | | | | | | | | | |
2020 | | | 14.86 | | | | 0.53 | | | | 0.14 | | | | 0.67 | | | | (0.50 | ) | | | — | | | | (0.50 | ) | | | 15.03 | | | | 14.21 | |
2019 | | | 14.52 | | | | 0.53 | | | | 0.31 | | | | 0.84 | | | | (0.50 | ) | | | — | | | | (0.50 | ) | | | 14.86 | | | | 13.93 | |
2018 | | | 14.47 | | | | 0.52 | | | | 0.05 | | | | 0.57 | | | | (0.52 | ) | | | — | | | | (0.52 | ) | | | 14.52 | | | | 13.47 | |
2017 | | | 14.88 | | | | 0.53 | | | | (0.42 | ) | | | 0.11 | | | | (0.52 | ) | | | — | | | | (0.52 | ) | | | 14.47 | | | | 13.41 | |
2016 | | | 14.64 | | | | 0.55 | | | | 0.23 | | | | 0.78 | | | | (0.54 | ) | | | — | | | | (0.54 | ) | | | 14.88 | | | | 14.13 | |
| | |
(a) | Total Return Based on Common Share NAV is the combination of changes in common share NAV, reinvested dividend income at NAV and reinvested capital gains distributions at NAV, if any. The last dividend declared in the period, which is typically paid on the first business day of the following month, is assumed to be reinvested at the ending NAV. The actual reinvest price for the last dividend declared in the period may often be based on the Fund’s market price (and not its NAV), and therefore may be different from the price used in the calculation. Total returns are not annualized. |
| Total Return Based on Common Share Price is the combination of changes in the market price per share and the effect of reinvested dividend income and reinvested capital gains distributions, if any, at the average price paid per share at the time of reinvestment. The last dividend declared in the period, which is typically paid on the first business day of the following month, is assumed to be reinvested at the ending market price. The actual reinvestment for the last dividend declared in the period may take place over several days, and in some instances may not be based on the market price, so the actual reinvestment price may be different from the price used in the calculation. Total returns are not annualized. |
64
| | | | | | | | | | | | | | | | | |
| | | | | | | Common Share Supplemental Data/ Ratios Applicable to Common Shares | |
Common Share Total Returns
| | | | | | Ratios to Average Net Assets | | | | |
Based on NAV(a) | | | Based on Share Price(a) | | | Ending Net Assets (000) | | | Expenses(b) | | | Net Investment Income (Loss) | | | Portfolio Turnover Rate(c) | |
| | |
| | |
| | 5.19 | % | | | 5.89 | % | | $ | 261,438 | | | | 0.26 | % | | | 3.60 | % | | | 10 | % |
| | 6.34 | | | | 8.51 | | | | 256,937 | | | | 0.26 | | | | 3.77 | | | | 17 | |
| | 4.52 | | | | 3.83 | | | | 250,551 | | | | 0.27 | | | | 3.66 | | | | 19 | |
| | 0.55 | | | | (2.20 | ) | | | 248,518 | | | | 0.28 | | | | 3.64 | | | | 28 | |
| | 5.78 | | | | 6.82 | | | | 256,228 | | | | 0.28 | | | | 3.88 | | | | 25 | |
| | |
| | |
| | |
| | 4.52 | | | | 5.57 | | | | 266,265 | | | | 0.31 | | | | 3.48 | | | | 13 | |
| | 5.95 | | | | 7.32 | | | | 263,310 | | | | 0.31 | | | | 3.64 | | | | 12 | |
| | 3.98 | | | | 4.32 | | | | 257,250 | | | | 0.32 | | | | 3.53 | | | | 20 | |
| | 0.69 | | | | (1.56 | ) | | | 256,325 | | | | 0.33 | | | | 3.61 | | | | 27 | |
| | 5.46 | | | | 5.46 | | | | 263,530 | | | | 0.33 | | | | 3.76 | | | | 23 | |
| | |
(b) | The expense ratios reflect, among other things, the interest expense deemed to have been paid by the Fund on the floating rate certificates issued by the special purpose trusts for the self-deposited inverse floaters held by the Fund (as described in Note 4 – Portfolio Securities and Investments in Derivatives, Inverse Floating Rate Securities), where applicable, as follows: |
| | | | | |
| NXP | | | NXQ | |
Year Ended 3/31: | | | Year Ended 3/31: | |
2020 | —% | | 2020 | —% |
2019 | — | | 2019 | — |
2018 | — | | 2018 | — |
2017 | — | | 2017 | — |
2016 | — | | 2016 | — |
| | |
(c) | Portfolio Turnover Rate is calculated based on the lesser of long-term purchases or sales (as disclosed in Note 4 – Portfolio Securities and Investments in Derivatives, Investment Transactions) divided by the average long-term market value during the period. |
See accompanying notes to financial statements.
65
Financial Highlights (continued)
Selected data for a common share outstanding throughout each period:
| | | | | | | | | | | | | | | | | | | | | | | | | | | | | | | | | | |
| |
| | | Investment Operations | | | Less Distributions to Common Shareholders | | | Common Share | |
| | | Beginning Common Share NAV | | | Net Investment Income (Loss) | | | Net Realized/ Unrealized Gain (Loss) | | | Total | | | From Net
Investment
Income | | | From Accumulated Net Realized Gains | | | Total | | | Shelf Offering Costs | | | Premium Per Share Sold through Shelf Offering | | | Ending NAV | | | Ending Share Price | |
| NXR | | | | | | | | | | | | | | | | | | | | | | | | | | | | | | | | | |
Year Ended 3/31:
| | | | | | | | | | | | | | | | | | | | | | | | | | | | |
2020 | | $ | 15.85 | | | $ | 0.57 | | | $ | 0.38 | | | $ | 0.95 | | | $ | (0.52 | ) | | $ | — | | | $ | (0.52 | ) | | $ | — | | | $ | — | | | $ | 16.28 | | | $ | 15.40 | |
2019 | | | 15.39 | | | | 0.56 | | | | 0.42 | | | | 0.98 | | | | (0.52 | ) | | | — | | | | (0.52 | ) | | | — | | | | — | | | | 15.85 | | | | 14.73 | |
2018 | | | 15.29 | | | | 0.55 | | | | 0.09 | | | | 0.64 | | | | (0.54 | ) | | | — | | | | (0.54 | ) | | | — | | | | — | | | | 15.39 | | | | 14.23 | |
2017 | | | 15.76 | | | | 0.57 | | | | (0.51 | ) | | | 0.06 | | | | (0.53 | ) | | | — | | | | (0.53 | ) | | | — | | | | — | | | | 15.29 | | | | 14.21 | |
2016 | | | 15.34 | | | | 0.58 | | | | 0.40 | | | | 0.98 | | | | (0.56 | ) | | | — | | | | (0.56 | ) | | | — | | | | — | | | | 15.76 | | | | 14.89 | |
| | |
| NXC | | | | | | | | | | | | | | | | | | | | | | | | | | | | | | | | | | | | | | | | | | | | |
Year Ended 3/31:
| | | | | | | | | | | | | | | | | | | | | | | | | | | | | | | | | | | | | |
2020 | | | 15.21 | | | | 0.53 | | | | 0.21 | | | | 0.74 | | | | (0.52 | ) | | | — | | | | (0.52 | ) | | | — | | | | — | | | | 15.43 | | | | 14.50 | |
2019 | | | 15.02 | | | | 0.50 | | | | 0.19 | | | | 0.69 | | | | (0.52 | ) | | | — | | | | (0.52 | ) | | | 0.02 | | | | — | | | | 15.21 | | | | 14.12 | |
2018 | | | 15.00 | | | | 0.57 | | | | 0.09 | | | | 0.66 | | | | (0.58 | ) | | | (0.06 | ) | | | (0.64 | ) | | | — | | | | — | * | | | 15.02 | | | | 13.90 | |
2017 | | | 15.68 | | | | 0.60 | | | | (0.56 | ) | | | 0.04 | | | | (0.62 | ) | | | (0.10 | ) | | | (0.72 | ) | | | — | | | | — | | | | 15.00 | | | | 14.83 | |
2016 | | | 15.52 | | | | 0.64 | | | | 0.19 | | | | 0.83 | | | | (0.65 | ) | | | (0.02 | ) | | | (0.67 | ) | | | — | | | | — | | | | 15.68 | | | | 16.70 | |
| | |
(a) | Total Return Based on Common Share NAV is the combination of changes in common share NAV, reinvested dividend income at NAV and reinvested capital gains distributions at NAV, if any. The last dividend declared in the period, which is typically paid on the first business day of the following month, is assumed to be reinvested at the ending NAV. The actual reinvest price for the last dividend declared in the period may often be based on the Fund’s market price (and not its NAV), and therefore may be different from the price used in the calculation. Total returns are not annualized. |
| Total Return Based on Common Share Price is the combination of changes in the market price per share and the effect of reinvested dividend income and reinvested capital gains distributions, if any, at the average price paid per share at the time of reinvestment. The last dividend declared in the period, which is typically paid on the first business day of the following month, is assumed to be reinvested at the ending market price. The actual reinvestment for the last dividend declared in the period may take place over several days, and in some instances may not be based on the market price, so the actual reinvestment price may be different from the price used in the calculation. Total returns are not annualized. |
66
| | | | | | | | | | | | | | | | | |
| | | | | | | Common Share Supplemental Data/ Ratios Applicable to Common Shares | |
Common Share Total Returns | | | | | | Ratios to Average Net Assets | | | | |
| | |
| | |
Based on NAV(a) | | | Based on Share Price(a) | | | Ending Net Assets (000) | | | Expenses(b) | | | Net Investment Income (Loss) | | | Portfolio Turnover Rate(c) | |
| | |
| | |
| | 6.02 | % | | | 8.05 | % | | $ | 212,434 | | | | 0.32 | % | | | 3.50 | % | | | 13 | % |
| | 6.53 | | | | 7.31 | | | | 206,778 | | | | 0.32 | | | | 3.62 | | | | 17 | |
| | 4.19 | | | | 3.87 | | | | 200,765 | | | | 0.33 | | | | 3.55 | | | | 15 | |
| | 0.37 | | | | (1.09 | ) | | | 199,496 | | | | 0.33 | | | | 3.61 | | | | 29 | |
| | 6.56 | | | | 4.76 | | | | 205,595 | | | | 0.34 | | | | 3.81 | | | | 22 | |
| | |
| | |
| | |
| | 4.86 | | | | 6.26 | | | | 98,013 | | | | 0.36 | | | | 3.41 | | | | 10 | |
| | 4.82 | | | | 5.44 | | | | 96,573 | | | | 0.55 | | | | 3.38 | | | | 23 | |
| | 4.37 | | | | (2.23 | ) | | | 95,357 | | | | 0.37 | | | | 3.73 | | | | 20 | |
| | 0.20 | | | | (6.98 | ) | | | 94,310 | | | | 0.37 | | | | 3.89 | | | | 24 | |
| | 5.51 | | | | 13.25 | | | | 98,494 | | | | 0.37 | | | | 4.18 | | | | 10 | |
| | |
(b) | The expense ratios reflect, among other things, the interest expense deemed to have been paid by the Fund on the floating rate certificates issued by the special purpose trusts for the self-deposited inverse floaters held by the Fund (as described in Note 4 – Portfolio Securities and Investments in Derivatives, Inverse Floating Rate Securities), where applicable, as follows: |
| | | | | |
| NXR | | | NXC | |
Year Ended 3/31: | | | Year Ended 3/31: | |
2020 | —% | | 2020 | —% |
2019 | — | | 2019 | — |
2018 | — | | 2018 | — |
2017 | — | | 2017 | — |
2016 | — | | 2016 | — |
| | |
(c) | Portfolio Turnover Rate is calculated based on the lesser of long-term purchases or sales (as disclosed in Note 4 – Portfolio Securities and Investments in Derivatives, Investment Transactions) divided by the average long-term market value during the period. |
* | Rounds to less than $0.01 per share. |
See accompanying notes to financial statements.
67
Financial Highlights (continued)
Selected data for a common share outstanding throughout each period:
| | | | | | | | | | | | | | | | | | | | | | | | | | | | |
| | | | | Investment Operations | | | Less Distributions to Common Shareholders
| | | Common Share | |
| | | Beginning Common Share NAV | | | Net Investment Income (Loss) | | | Net Realized/ Unrealized Gain (Loss) | | | Total | | | From Net Investment
Income | | | From Accumulated
Net Realized Gains | | | Total | | | Ending NAV | | | Ending Common Share Price | |
| NXN | | | | | | | | | | | | | | | | | | | | | | | | | | | |
Year Ended 3/31:
| | | | | | | | | | | | | | | | | | | | | | |
2020 | | $ | 14.08 | | | $ | 0.49 | | | $ | (0.11 | ) | | $ | 0.38 | | | $ | (0.47 | ) | | $ | — | | | $ | (0.47 | ) | | $ | 13.99 | | | $ | 12.65 | |
2019 | | | 13.93 | | | | 0.50 | | | | 0.15 | | | | 0.65 | | | | (0.50 | ) | | | — | | | | (0.50 | ) | | | 14.08 | | | | 13.52 | |
2018 | | | 14.04 | | | | 0.52 | | | | (0.09 | ) | | | 0.43 | | | | (0.54 | ) | | | — | | | | (0.54 | ) | | | 13.93 | | | | 12.98 | |
2017 | | | 14.53 | | | | 0.55 | | | | (0.49 | ) | | | 0.06 | | | | (0.55 | ) | | | — | | | | (0.55 | ) | | | 14.04 | | | | 13.69 | |
2016 | | | 14.52 | | | | 0.57 | | | | (0.01 | ) | | | 0.56 | | | | (0.55 | ) | | | — | | | | (0.55 | ) | | | 14.53 | | | | 14.06 | |
| | |
(a) | Total Return Based on Common Share NAV is the combination of changes in common share NAV, reinvested dividend income at NAV and reinvested capital gains distributions at NAV, if any. The last dividend declared in the period, which is typically paid on the first business day of the following month, is assumed to be reinvested at the ending NAV. The actual reinvest price for the last dividend declared in the period may often be based on the Fund’s market price (and not its NAV), and therefore may be different from the price used in the calculation. Total returns are not annualized. |
| Total Return Based on Common Share Price is the combination of changes in the market price per share and the effect of reinvested dividend income and reinvested capital gains distributions, if any, at the average price paid per share at the time of reinvestment. The last dividend declared in the period, which is typically paid on the first business day of the following month, is assumed to be reinvested at the ending market price. The actual reinvestment for the last dividend declared in the period may take place over several days, and in some instances may not be based on the market price, so the actual reinvestment price may be different from the price used in the calculation. Total returns are not annualized. |
68
| | | | | | | | | | | | | | | | | |
| | | | | | | Common Share Supplemental Data/ Ratios Applicable to Common Shares
| |
Common Share Total Returns
| | | | | | Ratios to Average Net Assets | | | | |
Based on NAV(a) | | | Based on Share Price(a) | | | Ending Net Assets (000) | | | Expenses(b) | | | Net Investment Income (Loss) | | | Portfolio Turnover Rate(c) | |
| | |
| | |
| | 2.69 | % | | | (3.18 | )% | | $ | 54,893 | | | | 0.43 | % | | | 3.39 | % | | | 5 | % |
| | 4.80 | | | | 8.26 | | | | 55,270 | | | | 0.42 | | | | 3.59 | | | | 16 | |
| | 3.05 | | | | (1.41 | ) | | | 54,679 | | | | 0.43 | | | | 3.64 | | | | 17 | |
| | 0.40 | | | | 1.26 | | | | 55,120 | | | | 0.44 | | | | 3.83 | | | | 29 | |
| | 3.98 | | | | 3.63 | | | | 57,031 | | | | 0.42 | | | | 3.97 | | | | 14 | |
| | |
(b) | The expense ratios reflect, among other things, the interest expense deemed to have been paid by the Fund on the floating rate certificates issued by the special purpose trusts for the self-deposited inverse floaters held by the Fund (as described in Note 4 – Portfolio Securities and Investments in Derivatives, Inverse Floating Rate Securities), where applicable, as follows: |
| | |
| NXN | |
Year Ended 3/31: |
2020 | 0.02% |
2019 | 0.02 |
2018 | 0.02 |
2017 | 0.02 |
2016 | 0.01 |
| | |
(c) | Portfolio Turnover Rate is calculated based on the lesser of long-term purchases or sales (as disclosed in Note 4 – Portfolio Securities and Investments in Derivatives, Investment Transactions) divided by the average long-term market value during the period. |
See accompanying notes to financial statements.
69
Notes toFinancial Statements 1. General Information
Fund Information
The funds covered in this report and their corresponding New York Stock Exchange (“NYSE”) symbols are as follows (each a “Fund” and collectively, the “Funds”):
| • | Nuveen Select Tax-Free Income Portfolio (NXP) |
| • | Nuveen Select Tax-Free Income Portfolio 2 (NXQ) |
| • | Nuveen Select Tax-Free Income Portfolio 3 (NXR) |
| • | Nuveen California Select Tax-Free Income Portfolio (NXC) |
| • | Nuveen New York Select Tax-Free Income Portfolio (NXN) |
The Funds are registered under the Investment Company Act of 1940 (the “1940 Act”), as amended, as diversified closed-end management investment companies. NXP, NXQ, NXR, NXC, and NXN were organized as Massachusetts business trusts on January 29, 1992, March 30, 1992, May 28, 1992, March 30, 1992, and March 30, 1992, respectively.
The end of the reporting period for the Funds is March 31, 2020, and the period covered by these Notes to Financial Statements is the fiscal year ended March 31, 2020 (the “current fiscal period”).
Investment Adviser and Sub-Adviser
The Funds’ investment adviser is Nuveen Fund Advisors, LLC (the “Adviser”), a subsidiary of Nuveen, LLC (“Nuveen”). Nuveen is the investment management arm of Teachers Insurance and Annuity Association of America (TIAA). The Adviser has overall responsibility for management of the Funds, oversees the management of the Funds’ portfolios, manages the Funds’ business affairs and provides certain clerical, bookkeeping and other administrative services, and, if necessary, asset allocation decisions. The Adviser has entered into sub-advisory agreements with Nuveen Asset Management, LLC, (the “Sub-Adviser”), a subsidiary of the Adviser, under which the Sub-Adviser manages the investment portfolios of the Funds.
Other Matters
The outbreak of the novel coronavirus (“COVID-19”) and subsequent global pandemic began significantly impacting the U.S. and global financial markets and economies during the quarter ended March 31, 2020. The worldwide spread of COVID-19 has created significant uncertainty in the global economy. The duration and extent of COVID-19 over the long-term cannot be reasonably estimated at this time. There have been no comparable recent events that provide guidance as to the effect the spread of COVID-19 as a global pandemic may have on the Funds’ financial performance. The ultimate impact of COVID-19 and the extent to which COVID-19 impacts the Funds’ normal course of business, results of operations, investments, and cash flows will depend on future developments, which are highly uncertain and difficult to predict. Management continues to monitor and evaluate this situation.
2. Significant Accounting Policies
The accompanying financial statements were prepared in accordance with accounting principles generally accepted in the United States of America (“U.S. GAAP”), which may require the use of estimates made by management and the evaluation of subsequent events. Actual results may differ from those estimates. Each Fund is an investment company and follows the accounting guidance in the Financial Accounting Standards Board (“FASB”) Accounting Standards Codification 946, Financial Services — Investment Companies. The net asset value (“NAV”) for financial reporting purposes may differ from the NAV for processing security and common share transactions. The NAV for financial reporting purposes includes security and common share transactions through the date of the report. Total return is computed based on the NAV used for processing security and common share transactions. The following is a summary of the significant accounting policies consistently followed by the Funds.
Compensation
The Funds pay no compensation directly to those of its trustees who are affiliated with the Adviser or to its officers, all of whom receive remuneration for their services to the Funds from the Adviser or its affiliates. The Funds’ Board of Trustees (the “Board”) has adopted a deferred compensation plan for independent trustees that enables trustees to elect to defer receipt of all or a portion of the annual compensation they are entitled to receive from certain Nuveen-advised funds. Under the plan, deferred amounts are treated as though equal dollar amounts had been invested in shares of select Nuveen-advised funds.
70
Distributions to Common Shareholders
Distributions to common shareholders are recorded on the ex-dividend date. The amount, character and timing of distributions are determined in accordance with federal income tax regulations, which may differ from U.S. GAAP.
Indemnifications
Under the Funds’ organizational documents, their officers and trustees are indemnified against certain liabilities arising out of the performance of their duties to the Funds. In addition, in the normal course of business, the Funds enter into contracts that provide general indemnifications to other parties. The Funds’ maximum exposure under these arrangements is unknown as this would involve future claims that may be made against the Funds that have not yet occurred. However, the Funds have not had prior claims or losses pursuant to these contracts and expect the risk of loss to be remote.
Investments and Investment Income
Securities transactions are accounted for as of the trade date for financial reporting purposes. Realized gains and losses on securities transactions are based upon the specific identification method. Investment income is comprised of interest income, which is recorded on an accrual basis and includes accretion of discounts and amortization of premiums for financial reporting purposes. Investment income also reflects payment-in-kind (“PIK”) interest and paydown gains and losses, if any. PIK interest represents income received in the form of securities in lieu of cash. Investment income also reflects dividend income, which is recorded on the ex-dividend date.
Netting Agreements
In the ordinary course of business, the Funds may enter into transactions subject to enforceable International Swaps and Derivatives Association, Inc. (ISDA) master agreements or other similar arrangements (“netting agreements”). Generally, the right to offset in netting agreements allows each Fund to offset certain securities and derivatives with a specific counterparty, when applicable, as well as any collateral received or delivered to that counterparty based on the terms of the agreements. Generally, each Fund manages its cash collateral and securities collateral on a counterparty basis.
The Funds’ investments subject to netting agreements as of the end of the reporting period, if any, are further described in Note 4 – Portfolio Securities and Investments in Derivatives.
New Accounting Pronouncements and Rule Issuances
FASB Accounting Standards Update (“ASU”) 2017-08 (“ASU 2017-08”) Premium Amortization on Purchased Callable Debt Securities
The FASB has issued ASU 2017-08, which shortens the premium amortization period for purchased non-contingently callable debt securities. ASU 2017-08 specifies that the premium amortization period ends at the earliest call date, for purchased non-contingently callable debt securities. ASU 2017-08 is effective for fiscal years, and interim periods within those fiscal years, beginning after December 15, 2018. During the current fiscal period, ASU 2017-08 became effective for the Funds and it did not have a material impact on the Funds’ financial statements.
Fair Value Measurement: Disclosure Framework
During August 2018, the FASB issued ASU 2018-13 (“ASU 2018-13”), Fair Value Measurement: Disclosure Framework – Changes to the Disclosure Requirements for Fair Value Measurements. ASU 2018-13 modifies the disclosures required by Topic 820, Fair Value Measurements. The amendments in ASU 2018-13 are effective for all entities for fiscal years, and interim periods within those fiscal years, beginning after December 15, 2019. Management early implemented this guidance and it did not have a material impact on the Funds’ financial statements.
Reference Rate Reform
In March 2020, FASB issued ASU 2020-04, Reference Rate Reform: Facilitation of the Effects of Reference Rate Reform on Financial Reporting. The main objective of the new guidance is to provide relief to companies that will be impacted by the expected change in benchmark interest rates at the end of 2021, when participating banks will no longer be required to submit London Interbank Offered Rate (LIBOR) quotes by the UK Financial Conduct Authority (FCA). The new guidance allows companies to, provided the only change to existing contracts are a change to an approved benchmark interest rate, account for modifications as a continuance of the existing contract without additional analysis. In addition, derivative contracts that qualified for hedge accounting prior to modification, will be allowed to continue to receive such treatment, even if critical terms change due to a change in the benchmark interest rate. For new and existing contracts, the Funds may elect to apply the amendments as of March 12, 2020 through December 31, 2022. Management is currently assessing the impact of the ASU’s adoption to the Funds’ financial statements and various filings.
3. Investment Valuation and Fair Value Measurements
The fair valuation input levels as described below are for fair value measurement purposes.
The Funds’ investments in securities are recorded at their estimated fair value. Fair value is defined as the price that would be received upon selling an investment or transferring a liability in an orderly transaction to an independent buyer in the principal or most advantageous market for the investment. A three-tier hierarchy is used to maximize the use of observable market data and minimize the use of unobservable inputs and to establish classification of fair value measurements for disclosure purposes. Observable inputs reflect the assumptions market participants would use in pricing the asset or
71
Notes to Financial Statements (continued)
liability. Observable inputs are based on market data obtained from sources independent of the reporting entity. Unobservable inputs reflect the reporting entity’s own assumptions about the assumptions market participants would use in pricing the asset or liability. Unobservable inputs are based on the best information available in the circumstances. The following is a summary of the three-tiered hierarchy of valuation input levels.
Level 1 – Inputs are unadjusted and prices are determined using quoted prices in active markets for identical securities.
Level 2 – Prices are determined using other significant observable inputs (including quoted prices for similar securities, interest rates, credit spreads, etc.).
Level 3 – Prices are determined using significant unobservable inputs (including management’s assumptions in determining the fair value of investments).
Prices of fixed income securities are provided by an independent pricing service (“pricing service”) approved by the Board. The pricing service establishes a security’s fair value using methods that may include consideration of the following: yields or prices of investments of comparable quality, type of issue, coupon, maturity and rating, market quotes or indications of value from security dealers, evaluations of anticipated cash flows or collateral, general market conditions and other information and analysis, including the obligor’s credit characteristics considered relevant. These securities are generally classified as Level 2. In pricing certain securities, particularly less liquid and lower quality securities, the pricing service may consider information about a security, its issuer or market activity, provided by the Adviser. These securities are generally classified as Level 2 or Level 3 depending on the observability of the significant inputs.
Common stocks and other equity-type securities are valued at the last sales price on the securities exchange on which such securities are primarily traded and are generally classified as Level 1. Securities primarily traded on the Nasdaq National Market (“Nasdaq”) are valued, at the Nasdaq Official Closing Price and are generally classified as Level 1. However, securities traded on a securities exchange or Nasdaq for which there were no transactions on a given day or securities not listed on a securities exchange or Nasdaq are valued at the quoted bid price and are generally classified as Level 2.
Certain securities may not be able to be priced by the pre-established pricing methods as described above. Such securities may be valued by the Board and/or its appointee at fair value. These securities generally include, but are not limited to, restricted securities (securities which may not be publicly sold without registration under the Securities Act of 1933, as amended) for which a pricing service is unable to provide a market price; securities whose trading has been formally suspended; debt securities that have gone into default and for which there is no current market quotation; a security whose market price is not available from a pre-established pricing source; a security with respect to which an event has occurred that is likely to materially affect the value of the security after the market has closed but before the calculation of a Fund’s NAV (as may be the case in non-U.S. markets on which the security is primarily traded) or make it difficult or impossible to obtain a reliable market quotation; and a security whose price, as provided by the pricing service, is not deemed to reflect the security’s fair value. As a general principle, the fair value of a security would appear to be the amount that the owner might reasonably expect to receive for it in a current sale. A variety of factors may be considered in determining the fair value of such securities, which may include consideration of the following: yields or prices of investments of comparable quality, type of issue, coupon, maturity and rating, market quotes or indications of value from security dealers, evaluations of anticipated cash flows or collateral, general market conditions and other information and analysis, including the obligor’s credit characteristics considered relevant. These securities are generally classified as Level 2 or Level 3 depending on the observability of the significant inputs. Regardless of the method employed to value a particular security, all valuations are subject to review by the Board and/or its appointee.
The inputs or methodologies used for valuing securities are not an indication of the risks associated with investing in those securities. The following is a summary of each Fund’s fair value measurements as of the end of the reporting period:
| | | | | | | | | | | | | |
| NXP | | Level 1 | | | Level 2 | | | Level 3 | | | Total | |
| | |
Long-Term Investments*: | | | | | | | | | | | | |
| Municipal Bonds | | $ | — | | | $ | 256,901,869 | | | $ | — | | | $ | 256,901,869 | |
| Common Stocks | | | — | | | | 726,059 | **
| | | — | | | | 726,059 | |
Short-Term Investments*: | | | | | | | | | | | | | | | | |
| Municipal Bonds | | | — | | | | 2,181,795 | | | | — | | | | 2,181,795 | |
Total | | $ | — | | | $ | 259,809,723 | | | $ | — | | | $ | 259,809,723 | |
| | |
| NXQ | | | | | | | | | | | | | | | | |
| | |
Long-Term Investments*: | | | | | | | | | | | | | | | | |
| Municipal Bonds | | $ | — | | | $ | 258,363,080 | | | $ | — | | | $ | 258,363,080 | |
| Common Stocks | | | — | | | | 726,059 | **
| | | — | | | | 726,059 | |
Short-Term Investments*: | | | | | | | | | | | | | | | | |
| Municipal Bonds | | | — | | | | 5,218,019 | | | | — | | | | 5,218,019 | |
Total | | $ | — | | | $ | 264,307,158 | | | $ | — | | | $ | 264,307,158 | |
72
| | | | | | | | | | | | | |
| NXR | | Level 1 | | | Level 2 | | | Level 3 | | | Total | |
| | |
Long-Term Investments*: | | | | | | | | | | | | |
| Municipal Bonds | | $ | — | | | $ | 208,994,641 | | | $ | — | | | $ | 208,994,641 | |
| Common Stocks | | | — | | | | 726,059 | **
| | | — | | | | 726,059 | |
Short-Term Investments*: | | | | | | | | | | | | | | | | |
| Municipal Bonds | | | — | | | | 941,813 | | | | — | | | | 941,813 | |
Total | | $ | — | | | $ | 210,662,513 | | | $ | — | | | $ | 210,662,513 | |
| | |
| NXC | | | | | | | | | | | | | | | | |
| | |
Long-Term Investments*: | | | | | | | | | | | | | | | | |
| Municipal Bonds | | $ | — | | | $ | 97,175,152 | | | $ | — | | | $ | 97,175,152 | |
| | |
| NXN | | | | | | | | | | | | | | | | |
| | |
Long-Term Investments*: | | | | | | | | | | | | | | | | |
| Municipal Bonds | | $ | — | | | $ | 54,323,876 | | | $ | — | | | $ | 54,323,876 | |
| | |
* | Refer to the Fund’s Portfolio of Investments for state/industry classifications. |
** | Refer to the Fund’s Portfolio of Investments for securities classified as Level 2. |
4. Portfolio Securities and Investments in Derivatives
Portfolio Securities
Inverse Floating Rate Securities
Each Fund is authorized to invest in inverse floating rate securities. An inverse floating rate security is created by depositing a municipal bond (referred to as an “Underlying Bond”), typically with a fixed interest rate, into a special purpose tender option bond (“TOB”) trust (referred to as the “TOB Trust”) created by or at the direction of one or more Funds. In turn, the TOB Trust issues (a) floating rate certificates (referred to as “Floaters”), in face amounts equal to some fraction of the Underlying Bond’s par amount or market value, and (b) an inverse floating rate certificate (referred to as an “Inverse Floater”) that represents all remaining or residual interest in the TOB Trust. Floaters typically pay short-term tax-exempt interest rates to third parties who are also provided a right to tender their certificate and receive its par value, which may be paid from the proceeds of a remarketing of the Floaters, by a loan to the TOB Trust from a third party liquidity provider (“Liquidity Provider”), or by the sale of assets from the TOB Trust. The Inverse Floater is issued to a long term investor, such as one or more of the Funds. The income received by the Inverse Floater holder varies inversely with the short-term rate paid to holders of the Floaters, and in most circumstances the Inverse Floater holder bears substantially all of the Underlying Bond’s downside investment risk and also benefits disproportionately from any potential appreciation of the Underlying Bond’s value. The value of an Inverse Floater will be more volatile than that of the Underlying Bond because the interest rate is dependent on not only the fixed coupon rate of the Underlying Bond but also on the short-term interest paid on the Floaters, and because the Inverse Floater essentially bears the risk of loss (and possible gain) of the greater face value of the Underlying Bond.
The Inverse Floater held by a Fund gives the Fund the right to (a) cause the holders of the Floaters to tender their certificates at par (or slightly more than par in certain circumstances), and (b) have the trustee of the TOB Trust (the “Trustee”) transfer the Underlying Bond held by the TOB Trust to the Fund, thereby collapsing the TOB Trust.
The Fund may acquire an Inverse Floater in a transaction where it (a) transfers an Underlying Bond that it owns to a TOB Trust created by a third party or (b) transfers an Underlying Bond that it owns, or that it has purchased in a secondary market transaction for the purpose of creating an Inverse Floater, to a TOB Trust created at its direction, and in return receives the Inverse Floater of the TOB Trust (referred to as a “self-deposited Inverse Floater”). A Fund may also purchase an Inverse Floater in a secondary market transaction from a third party creator of the TOB Trust without first owning the Underlying Bond (referred to as an “externally-deposited Inverse Floater”).
An investment in a self-deposited Inverse Floater is accounted for as a “financing” transaction (i.e., a secured borrowing). For a self-deposited Inverse Floater, the Underlying Bond deposited into the TOB Trust is identified in the Fund’s Portfolio of Investments as “(UB) – Underlying bond of an inverse floating rate trust reflected as a financing transaction,” with the Fund recognizing as liabilities, labeled “Floating rate obligations” on the Statement of Assets and Liabilities, (a) the liquidation value of Floaters issued by the TOB Trust, and (b) the amount of any borrowings by the TOB Trust from a Liquidity Provider to enable the TOB Trust to purchase outstanding Floaters in lieu of a remarketing. In addition, the Fund recognizes in “Investment Income” the entire earnings of the Underlying Bond, and recognizes (a) the interest paid to the holders of the Floaters or on the TOB Trust’s borrowings, and (b) other expenses related to remarketing, administration, trustee, liquidity and other services to a TOB Trust, as a component of “Interest expense and amortization of offering costs” on the Statement of Operations. Earnings due from the Underlying Bond and interest due to the holders of the Floaters as of the end of the reporting period are recognized as components of “Receivable for interest” and “Payable for interest” on the Statement of Assets and Liabilities, respectively.
In contrast, an investment in an externally-deposited Inverse Floater is accounted for as a purchase of the Inverse Floater and is identified in the Fund’s Portfolio of Investments as “(IF) – Inverse floating rate investment.” For an externally-deposited Inverse Floater, a Fund’s Statement of Assets and Liabilities recognizes the Inverse Floater and not the Underlying Bond as an asset, and the Fund does not recognize the Floaters, or any related
73
Notes to Financial Statements (continued)
borrowings from a Liquidity Provider, as a liability. Additionally, the Fund reflects in “Investment Income” only the net amount of earnings on the Inverse Floater (net of the interest paid to the holders of the Floaters or the Liquidity Provider as lender, and the expenses of the Trust), and does not show the amount of that interest paid or the expenses of the TOB Trust as described above as interest expense on the Statement of Operations.
Fees paid upon the creation of a TOB Trust for self-deposited Inverse Floaters and externally-deposited Inverse Floaters are recognized as part of the cost basis of the Inverse Floater and are capitalized over the term of the TOB Trust.
As of the end of the reporting period, the aggregate value of Floaters issued by each Fund’s TOB Trust for self-deposited Inverse Floaters and externally-deposited Inverse Floaters was as follows:
| | | | | | | | | | | | | | | | |
| Floating Rate Obligations Outstanding | | NXP | | | NXQ | | | NXR | | | NXC | | | NXN | |
Floating rate obligations: self-deposited Inverse Floaters | | $ | — | | | $ | — | | | $ | — | | | $ | — | | | $ | 425,000 | |
Floating rate obligations: externally-deposited Inverse Floaters | | | — | | | | — | | | | — | | | | — | | | | 1,065,000 | |
Total | | $ | — | | | $ | — | | | $ | — | | | $ | — | | | $ | 1,490,000 | |
During the current fiscal period, the average amount of Floaters (including any borrowings from a Liquidity Provider) outstanding, and the average annual interest rate and fees related to self-deposited Inverse Floaters, were as follows:
| | | | | | | | | | | | | | | | |
| Self-Deposited Inverse Floaters | | NXP | | | NXQ | | | NXR | | | NXC | | | NXN | |
Average floating rate obligations outstanding | | $ | — | | | $ | — | | | $ | — | | | $ | — | | | $ | 425,000 | |
Average annual interest rate and fees | | | — | % | | | — | % | | | — | % | | | — | % | | | 2.02 | % |
TOB Trusts are supported by a liquidity facility provided by a Liquidity Provider pursuant to which the Liquidity Provider agrees, in the event that Floaters are (a) tendered to the Trustee for remarketing and the remarketing does not occur, or (b) subject to mandatory tender pursuant to the terms of the TOB Trust agreement, to either purchase Floaters or to provide the Trustee with an advance from a loan facility to fund the purchase of Floaters by the TOB Trust. In certain circumstances, the Liquidity Provider may otherwise elect to have the Trustee sell the Underlying Bond to retire the Floaters that were tendered and not remarketed prior to providing such a loan. In these circumstances, the Liquidity Provider remains obligated to provide a loan to the extent that the proceeds of the sale of the Underlying Bond is not sufficient to pay the purchase price of the Floaters.
The size of the commitment under the loan facility for a given TOB Trust is at least equal to the balance of that TOB Trust’s outstanding Floaters plus any accrued interest. In consideration of the loan facility, fee schedules are in place and are charged by the Liquidity Provider(s). Any loans made by the Liquidity Provider will be secured by the purchased Floaters held by the TOB Trust. Interest paid on any outstanding loan balances will be effectively borne by the Fund that owns the Inverse Floaters of the TOB Trust that has incurred the borrowing and may be at a rate that is greater than the rate that would have been paid had the Floaters been successfully remarketed.
As described above, any amounts outstanding under a liquidity facility are recognized as a component of “Floating rate obligations” on the Statement of Assets and Liabilities by the Fund holding the corresponding Inverse Floaters issued by the borrowing TOB Trust. As of the end of the reporting period, there were no loans outstanding under any such facility.
Each Fund may also enter into shortfall and forbearance agreements (sometimes referred to as a “recourse arrangement”) (TOB Trusts involving such agreements are referred to herein as “Recourse Trusts”), under which a Fund agrees to reimburse the Liquidity Provider for the Trust’s Floaters, in certain circumstances, for the amount (if any) by which the liquidation value of the Underlying Bond held by the TOB Trust may fall short of the sum of the liquidation value of the Floaters issued by the TOB Trust plus any amounts borrowed by the TOB Trust from the Liquidity Provider, plus any shortfalls in interest cash flows. Under these agreements, a Fund’s potential exposure to losses related to or on an Inverse Floater may increase beyond the value of the Inverse Floater as a Fund may potentially be liable to fulfill all amounts owed to holders of the Floaters or the Liquidity Provider. Any such shortfall amount in the aggregate is recognized as “Unrealized depreciation on Recourse Trusts” on the Statement of Assets and Liabilities.
As of the end of the reporting period, each Fund’s maximum exposure to the Floaters issued by Recourse Trusts for self-deposited Inverse Floaters and externally-deposited Inverse Floaters was as follows:
| | | | | | | | | | | | | | | | |
| Floating Rate Obligations – Recourse Trusts | | NXP | | | NXQ | | | NXR | | | NXC | | | NXN | |
Maximum exposure to Recourse Trusts: self-deposited Inverse Floaters | | $ | — | | | $ | — | | | $ | — | | | $ | — | | | $ | 425,000 | |
Maximum exposure to Recourse Trusts: externally-deposited Inverse Floaters | | | — | | | | — | | | | — | | | | — | | | | — | |
Total | | $ | — | | | $ | — | | | $ | — | | | $ | — | | | $ | 425,000 | |
74
Zero Coupon Securities
A zero coupon security does not pay a regular interest coupon to its holders during the life of the security. Income to the holder of the security comes from accretion of the difference between the original purchase price of the security at issuance and the par value of the security at maturity and is effectively paid at maturity. The market prices of zero coupon securities generally are more volatile than the market prices of securities that pay interest periodically.
Investment Transactions
Long-term purchases and sales (including maturities) during the current fiscal period were as follows:
| | | | | | | | | | | | | | | | |
| | NXP | | | NXQ | | | NXR | | | NXC | | | NXN | |
Purchases | | $ | 25,396,046 | | | $ | 33,837,500 | | | $ | 27,090,274 | | | $ | 10,581,307 | | | $ | 3,824,061 | |
Sales and maturities | | | 28,532,552 | | | | 39,079,747 | | | | 29,214,357 | | | | 9,424,362 | | | | 2,932,878 | |
The Funds may purchase securities on a when-issued or delayed-delivery basis. Securities purchased on a when-issued or delayed-delivery basis may have extended settlement periods; interest income is not accrued until settlement date. Any securities so purchased are subject to market fluctuation during this period. The Funds have earmarked securities in their portfolios with a current value at least equal to the amount of the when-issued/ delayed-delivery purchase commitments. If a Fund has outstanding when-issued/delayed-delivery purchases commitments as of the end of the reporting period, such amounts are recognized on the Statement of Assets and Liabilities.
Investments in Derivatives
In addition to the inverse floating rate securities in which each Fund may invest, which are considered portfolio securities for financial reporting purposes, each Fund is authorized to invest in certain other derivative instruments, such as futures, options and swap contracts. Each Fund limits its investments in futures, options on futures and swap contracts to the extent necessary for the Adviser to claim the exclusion from registration by the Commodity Futures Trading Commission as a commodity pool operator with respect to the Fund. The Funds record derivative instruments at fair value, with changes in fair value recognized on the Statement of Operations, when applicable. Even though the Funds’ investments in derivatives may represent economic hedges, they are not considered to be hedge transactions for financial reporting purposes.
Although the Funds are authorized to invest in derivative instruments and may do so in the future, they did not make any such investments during the current fiscal period.
Market and Counterparty Credit Risk
In the normal course of business each Fund may invest in financial instruments and enter into financial transactions where risk of potential loss exists due to changes in the market (market risk) or failure of the other party to the transaction to perform (counterparty credit risk). The potential loss could exceed the value of the financial assets recorded on the financial statements. Financial assets, which potentially expose each Fund to counterparty credit risk, consist principally of cash due from counterparties on forward, option and swap transactions, when applicable. The extent of each Fund’s exposure to counterparty credit risk in respect to these financial assets approximates their carrying value as recorded on the Statement of Assets and Liabilities.
Each Fund helps manage counterparty credit risk by entering into agreements only with counterparties the Adviser believes have the financial resources to honor their obligations and by having the Adviser monitor the financial stability of the counterparties. Additionally, counterparties may be required to pledge collateral daily (based on the daily valuation of the financial asset) on behalf of each Fund with a value approximately equal to the amount of any unrealized gain above a pre-determined threshold. Reciprocally, when each Fund has an unrealized loss, the Funds have instructed the custodian to pledge assets of the Funds as collateral with a value approximately equal to the amount of the unrealized loss above a pre-determined threshold. Collateral pledges are monitored and subsequently adjusted if and when the valuations fluctuate, either up or down, by at least the pre-determined threshold amount.
5. Fund Shares
Common Shares Equity Shelf Program and Offering Costs
NXC has filed a registration statement with the Securities and Exchange Commission (“SEC”) authorizing the Fund to issue additional common shares through one or more equity shelf programs (“Shelf Offering”), which became effective with the SEC during a prior fiscal period.
Under this Shelf Offering, the Fund, subject to market conditions, may raise additional equity capital by issuing additional common shares from time to time in varying amounts and by different offering methods at a net price at or above the Fund’s NAV per common share. In the event the Fund’s Shelf Offering registration statement is no longer current, the Fund may not issue additional common shares until a post-effective amendment to the registration statement has been filed with the SEC.
75
Notes to Financial Statements (continued)
Additional authorized common shares, common shares sold and offering proceeds, net of offering costs under the Fund’s Shelf Offering during the Fund’s prior fiscal period were as follows:
| | | | | | | |
| | NXC
| |
| | Year | | | Year | |
| | Ended | | | Ended | |
| | 3/31/20 | | | 3/31/19 | |
Additional authorized common shares | | | — | | | | 600,000 | * |
Common shares sold | | | — | | | | — | |
Offering proceeds, net of offering costs | | $ | — | | | $ | 106,141 | |
* Represents additional authorized common shares for the period April 1, 2018 through July 31, 2018.
Costs incurred by the Fund in connection with its initial shelf registration were recorded as a prepaid expense and recognized as “Deferred offering costs” on the Statement of Assets and Liabilities. These costs are amortized pro rata as common shares are sold and are recognized as a component of “Proceeds from shelf offering, net of offering costs” on the Statement of Changes in Net Assets. Any deferred offering costs remaining one year after effectiveness of the initial shelf registration will be expensed. Costs incurred by the Fund to keep the shelf registration current are expensed as incurred and recognized as a component of “Other expenses” on the Statement of Operations.
Common Shares Transactions
Transactions in common shares during the Funds’ current and prior fiscal period, where applicable, were as follows:
| | | | | |
| NXP | NXC |
|
| Year | Year | Year | Year |
| Ended | Ended | Ended | Ended |
| 3/31/20 | 3/31/19 | 3/31/20 | 3/31/19 |
Common shares issued to shareholders due to reinvestment of distributions | 7,476 | — | 1,980 | — |
6. Income Tax Information
Each Fund is a separate taxpayer for federal income tax purposes. Each Fund intends to distribute substantially all of its net investment income and net capital gains to shareholders and to otherwise comply with the requirements of Subchapter M of the Internal Revenue Code applicable to regulated investment companies. Therefore, no federal income tax provision is required. Furthermore, each Fund intends to satisfy conditions that will enable interest from municipal securities, which is exempt from regular federal and designated state income taxes, to retain such tax-exempt status when distributed to shareholders of the Funds. Net realized capital gains and ordinary income distributions paid by the Funds are subject to federal taxation.
For all open tax years and all major taxing jurisdictions, management of the Funds has concluded that there are no significant uncertain tax positions that would require recognition in the financial statements. Open tax years are those that are open for examination by taxing authorities (i.e., generally the last four tax year ends and the interim tax period since then). Furthermore, management of the Funds is also not aware of any tax positions for which it is reasonably possible that the total amounts of unrecognized tax benefits will significantly change in the next twelve months.
The following information is presented on an income tax basis. Differences between amounts for financial statement and federal income tax purposes are primarily due to timing differences in recognizing taxable market discount, timing differences in recognizing certain gains and losses on investment transactions and the treatment of investments in inverse floating rate securities reflected as financing transactions, if any. To the extent that differences arise that are permanent in nature, such amounts are reclassified within the capital accounts as detailed below. Temporary differences do not require reclassification. Temporary and permanent differences do not impact the NAVs of the Funds.
The table below presents the cost and unrealized appreciation (depreciation) of each Fund’s investment portfolio, as determined on a federal income tax basis, as of March 31, 2020.
| | | | | | | | | | | | | | | | |
| | NXP | | | NXQ | | | NXR | | | NXC | | | NXN | |
Tax cost of investments | | $ | 225,469,031 | | | $ | 236,356,047 | | | $ | 176,668,830 | | | $ | 87,419,151 | | | $ | 51,571,802 | |
Gross unrealized: | | | | | | | | | | | | | | | | | | | | |
| Appreciation | | $ | 35,385,574 | | | $ | 29,096,408 | | | $ | 34,914,510 | | | $ | 10,021,528 | | | $ | 2,658,458 | |
| Depreciation | | | (1,044,882 | ) | | | (1,145,297 | ) | | | (920,827 | ) | | | (265,527 | ) | | | (331,384 | ) |
Net unrealized appreciation (depreciation) of investments | | $ | 34,340,692 | | | $ | 27,951,111 | | | $ | 33,993,683 | | | $ | 9,756,001 | | | $ | 2,327,074 | |
Permanent differences, primarily due to taxable market discount, resulted in reclassifications among the Funds’ components of net assets as of March 31, 2020, the Funds’ tax year end.
76
The tax components of undistributed net tax-exempt income, net ordinary income and net long-term capital gains as of March 31, 2020, the Funds’ tax year end, were as follows:
| | | | | | | | | | | | | | | | |
| | NXP | | | NXQ | | | NXR | | | NXC | | | NXN | |
Undistributed net tax-exempt income1 | | $ | 1,349,119 | | | $ | 1,373,960 | | | $ | 990,133 | | | $ | 245,684 | | | $ | 113,001 | |
Undistributed net ordinary income2 | | | 35,909 | | | | 111,635 | | | | 25,730 | | | | 3,897 | | | | — | |
Undistributed net long-term capital gains | | | — | | | | — | | | | — | | | | — | | | | — | |
| |
1 Undistributed net tax-exempt income (on a tax basis) has not been reduced for the dividend declared on March 2, 2020, paid on April 1, 2020. |
2 Net ordinary income consists of taxable market discount income and net short-term capital gains, if any. | |
The tax character of distributions paid during the Funds’ tax years ended March 31, 2020 and March 31, 2019 was designated for purposes of the dividends paid deduction as follows:
| | | | | | | | | | | | | | | | |
| 2020 | | NXP | | | NXQ | | | NXR | | | NXC | | | NXN | |
Distributions from net tax-exempt income3 | | $ | 8,859,987 | | | $ | 8,634,896 | | | $ | 6,723,526 | | | $ | 3,295,962 | | | $ | 1,852,487 | |
Distributions from net ordinary income2 | | | 188,598 | | | | 292,822 | | | | 86,256 | | | | — | | | | 7,913 | |
Distributions from net long-term capital gains | | | — | | | | — | | | | — | | | | — | | | | — | |
| 2019 | | NXP | | | NXQ | | | NXR | | | NXC | | | NXN | |
Distributions from net tax-exempt income | | $ | 8,832,787 | | | $ | 8,882,196 | | | $ | 6,704,420 | | | $ | 3,267,547 | | | $ | 1,977,592 | |
Distributions from net ordinary income2 | | | 214,602 | | | | 45,521 | | | | 105,362 | | | | 28,068 | | | | 555 | |
Distributions from net long-term capital gains | | | — | | | | — | | | | — | | | | — | | | | — | |
| |
2 Net ordinary income consists of taxable market discount income and net short-term capital gains, if any. |
3 The Funds hereby designate these amounts paid during the fiscal year ended March 31, 2020, as Exempt Interest Dividends. |
As of March 31, 2020, the Funds’ tax year end, the Funds had unused capital losses carrying forward available for federal income tax purposes to be applied against future capital gains, if any. The capital losses are not subject to expiration.
| | | | | | | | | | | | | | | | |
| | NXP | | | NXQ | | | NXR | | | NXC | | | NXN | |
Not subject to expiration: | | | | | | | | | | | | | | | |
| Short-term | | $ | 398,444 | | | $ | 728,144 | | | $ | 116,131 | | | $ | 167,069 | | | $ | 1,038,943 | |
| Long-term | | | 3,528,578 | | | | 7,429,806 | | | | 1,559,386 | | | | — | | | | 249,313 | |
Total | | $ | 3,927,022 | | | $ | 8,157,950 | | | $ | 1,675,517 | | | $ | 167,069 | | | $ | 1,288,256 | |
During the Funds’ tax year ended March 31, 2020, the Funds utilized capital loss carryforwards as follows:
| | | | | | | | | | | | | | | | |
| | NXP | | | NXQ | | | NXR | | | NXC | | | NXN | |
Utilized capital loss carryforwards | | $ | 597,278 | | | $ | 875,213 | | | $ | 456,024 | | | $ | 138,660 | | | $ | 22,370 | |
7. Management Fees and Other Transactions with Affiliates
Management Fees
Each Fund’s management fee compensates the Adviser for overall investment advisory and administrative services and general office facilities. The Sub-Adviser is compensated for its services to the Funds from the management fees paid to the Adviser.
Each Fund’s management fee consists of two components – a fund-level fee, based only on the amount of assets within each individual Fund, and a complex-level fee, based on the aggregate amount of all eligible fund assets managed by the Adviser. This pricing structure enables Fund shareholders to benefit from growth in the assets within their respective Fund as well as from growth in the amount of complex-wide assets managed by the Adviser.
The annual fund-level fee, payable monthly, for NXP, is calculated according to the following schedule:
| | | | |
| | NXP | |
| Average Daily Net Assets* | | Fund-Level Fee Rate | |
For the first $125 million | | | 0.0500 | % |
For the next $125 million | | | 0.0375 | |
For the next $250 million | | | 0.0250 | |
For the next $500 million | | | 0.0125 | |
77
Notes to Financial Statements (continued)
The annual fund-level fee, payable monthly, for each Fund (excluding NXP) is calculated according to the following schedule:
| | | | |
| | NXQ | |
| | NXR | |
| | NXC | |
| | NXN | |
| Average Daily Net Assets* | | Fund-Level Fee Rate | |
For the first $125 million | | | 0.1000 | % |
For the next $125 million | | | 0.0875 | |
For the next $250 million | | | 0.0750 | |
For the next $500 million | | | 0.0625 | |
For the next $1 billion | | | 0.0500 | |
For the next $3 billion | | | 0.0250 | |
For managed assets over $5 billion | | | 0.0125 | |
The annual complex-level fee, payable monthly, for each Fund is calculated by multiplying the current complex-wide fee rate, determined according to the following schedule by the Funds’ daily net assets:
| | | | |
| Complex-Level Eligible Asset Breakpoint Level* | | Effective Complex-Level Fee Rate at Breakpoint Level | |
$55 billion | | | 0.2000 | % |
$56 billion | | | 0.1996 | |
$57 billion | | | 0.1989 | |
$60 billion | | | 0.1961 | |
$63 billion | | | 0.1931 | |
$66 billion | | | 0.1900 | |
$71 billion | | | 0.1851 | |
$76 billion | | | 0.1806 | |
$80 billion | | | 0.1773 | |
$91 billion | | | 0.1691 | |
$125 billion | | | 0.1599 | |
$200 billion | | | 0.1505 | |
$250 billion | | | 0.1469 | |
$300 billion | | | 0.1445 | |
| |
| * For the complex-level fees, managed assets include closed-end fund assets managed by the Adviser that are attributable to certain types of leverage. For these purposes, leverage includes the funds’ use of preferred stock and borrowings and certain investments in the residual interest certificates (also called inverse floating rate securities) in tender option bond (TOB) trusts, including the portion of assets held by a TOB trust that has been effectively financed by the trust’s issuance of floating rate securities, subject to an agreement by the Adviser as to certain funds to limit the amount of such assets for determining managed assets in certain circumstances. The complex-level fee is calculated based upon the aggregate daily managed assets of all Nuveen open-end and closed-end funds that constitute “eligible assets.” Eligible assets do not include assets attributable to investments in other Nuveen funds or assets in excess of a determined amount (originally $2 billion) added to the Nuveen fund complex in connection with the Adviser’s assumption of the management of the former First American Funds effective January 1, 2011, but do not include certain assets of certain Nuveen funds that were reorganized into funds advised by an affiliate of the Adviser during the 2019 calendar year. As of March 31, 2020, the complex-level fee for each Fund was 0.1590%. |
Other Transactions with Affiliates
Each Fund is permitted to purchase or sell securities from or to certain other funds managed by the Adviser (“inter-fund trade”) under specified conditions outlined in procedures adopted by the Board. These procedures have been designed to ensure that any inter-fund trade of securities by the Fund from or to another fund that is, or could be, considered an affiliate of the Fund under certain limited circumstances by virtue of having a common investment adviser (or affiliated investment adviser), common officer and/or common trustee complies with Rule 17a-7 of the 1940 Act. Further, as defined under these procedures, each inter-fund trade is effected at the current market price as provided by an independent pricing service. Unsettled inter-fund trades as of the end of the reporting period are recognized as a component of “Receivable for investments sold” and/or “Payable for investments purchased” on the Statement of Assets and Liabilities, when applicable.
During the current fiscal period, the Funds engaged in inter-fund trades pursuant to these procedures as follows:
| | | | | | | | | | | | | | | | |
| Inter-Fund Trades | | NXP | | | NXQ | | | NXR | | | NXC | | | NXN | |
Purchases | | $ | 1,077,090 | | | $ | 1,077,090 | | | $ | 2,466,536 | | | $ | 2,092,885 | | | $ | 700,840 | |
Sales | | | — | | | | — | | | | — | | | | 49,441 | | | | 695,037 | |
78
8. Borrowing Arrangements
Committed Line of Credit
The Funds, along with certain other funds managed by the Adviser (“Participating Funds”), have established a 364-day, $2.65 billion standby credit facility with a group of lenders, under which the Participating Funds may borrow for various purposes other than leveraging for investment purposes. Each Participating Fund is allocated a designated proportion of the facility’s capacity (and its associated costs, as described below) based upon a multi-factor assessment of the likelihood and frequency of its need to draw on the facility, the size of the Fund and its anticipated draws, and the potential importance of such draws to the operations and well-being of the Fund, relative to those of the other Funds. A Fund may effect draws on the facility in excess of its designated capacity if and to the extent that other Participating Funds have undrawn capacity. The credit facility expires in June 2020 unless extended or renewed.
The credit facility has the following terms: a fee of 0.15% per annum on unused commitment amounts, and interest at a rate equal to the higher of (a) one-month LIBOR (London Inter-Bank Offered Rate) plus 1.00% per annum or (b) the Fed Funds rate plus 1.00% per annum on amounts borrowed. Participating Funds paid administration, legal and arrangement fees, which are recognized as a component of “Other expenses” on the Statement of Operations, and along with commitment fees, have been allocated among such Participating Funds based upon the relative proportions of the facility’s aggregate capacity reserved for them and other factors deemed relevant by the Adviser and the Board of each Participating Fund.
During the current fiscal period, NXP, NXQ and NXR utilized this facility. Each Fund’s maximum outstanding balance during the utilization period was as follows:
| | | | | | | | | | |
| | NXP | | | NXQ | | | NXR | |
Maximum outstanding balance | | $ | 96,894 | | | $ | 2,157,766 | | | $ | 1,697,634 | |
During the Funds’ utilization period(s) during the current fiscal period, the average daily balance outstanding and average annual interest rate on the Borrowings were as follows:
| | | | | | | | | | |
| | NXP | | | NXQ | | | NXR | |
Utilization period (days outstanding) | | | 2 | | | | 2 | | | | 2 | |
Average daily balance outstanding | | $ | 96,894 | | | $ | 2,157,766 | | | $ | 1,697,634 | |
Average annual interest rate | | | 2.76 | % | | | 2.76 | % | | | 2.76 | % |
Borrowings outstanding as of the end of the reporting period are recognized as “Borrowings” on the Statement of Assets and Liabilities, where applicable.
Inter-Fund Borrowing and Lending
The SEC has granted an exemptive order permitting registered open-end and closed-end Nuveen funds to participate in an inter-fund lending facility whereby the Nuveen funds may directly lend to and borrow money from each other for temporary purposes (e.g., to satisfy redemption requests or when a sale of securities “fails,” resulting in an unanticipated cash shortfall) (the “Inter-Fund Program”). The closed-end Nuveen funds, including the Funds covered by this shareholder report, will participate only as lenders, and not as borrowers, in the Inter-Fund Program because such closed-end funds rarely, if ever, need to borrow cash to meet redemptions. The Inter-Fund Program is subject to a number of conditions, including, among other things, the requirements that (1) no fund may borrow or lend money through the Inter-Fund Program unless it receives a more favorable interest rate than is typically available from a bank or other financial institution for a comparable transaction; (2) no fund may borrow on an unsecured basis through the Inter-Fund Program unless the fund’s outstanding borrowings from all sources immediately after the inter-fund borrowing total 10% or less of its total assets; provided that if the borrowing fund has a secured borrowing outstanding from any other lender, including but not limited to another fund, the inter-fund loan must be secured on at least an equal priority basis with at least an equivalent percentage of collateral to loan value; (3) if a fund’s total outstanding borrowings immediately after an inter-fund borrowing would be greater than 10% of its total assets, the fund may borrow through the inter-fund loan on a secured basis only; (4) no fund may lend money if the loan would cause its aggregate outstanding loans through the Inter-Fund Program to exceed 15% of its net assets at the time of the loan; (5) a fund’s inter-fund loans to any one fund shall not exceed 5% of the lending fund’s net assets; (6) the duration of inter-fund loans will be limited to the time required to receive payment for securities sold, but in no event more than seven days; and (7) each inter-fund loan may be called on one business day’s notice by a lending fund and may be repaid on any day by a borrowing fund. In addition, a Nuveen fund may participate in the Inter-Fund Program only if and to the extent that such participation is consistent with the fund’s investment objective and investment policies. The Board is responsible for overseeing the Inter-Fund Program.
The limitations detailed above and the other conditions of the SEC exemptive order permitting the Inter-Fund Program are designed to minimize the risks associated with Inter-Fund Program for both the lending fund and the borrowing fund. However, no borrowing or lending activity is without risk. When a fund borrows money from another fund, there is a risk that the loan could be called on one day’s notice or not renewed, in which case the fund may have to borrow from a bank at a higher rate or take other actions to payoff such loan if an inter-fund loan is not available from another fund. Any delay in repayment to a lending fund could result in a lost investment opportunity or additional borrowing costs.
During the current reporting period, none of the Funds covered by this shareholder report have entered into any inter-fund loan activity.
79
Information (Unaudited)
| | | | | | |
| Board of Trustees | | | | | |
Jack B. Evans | William C. Hunter | Albin F. Moschner | John K. Nelson | Judith M. Stockdale | Carole E. Stone |
Terence J. Toth | Margaret L. Wolff | Robert L. Young | | | |
| | | | | |
| Investment Adviser | Custodian | Legal Counsel | Independent Registered | Transfer Agent and |
Nuveen Fund Advisors, LLC | State Street Bank | Chapman and Cutler LLP | Public Accounting Firm | Shareholder Services |
333 West Wacker Drive | & Trust Company | Chicago, IL 60603 | KPMG LLP | Computershare Trust |
Chicago, IL 60606 | One Lincoln Street | | 200 East Randolph Street | Company, N.A. |
| Boston, MA 02111 | | Chicago, IL 60601 | 150 Royall Street |
| | | | Canton, MA 02021 |
| | | | (800) 257-8787 |
Portfolio of Investments Information
Each Fund is required to file its complete schedule of portfolio holdings with the Securities and Exchange Commission (SEC) for the first and third quarters of each fiscal year as an exhibit to its report on Form N-Port. You may obtain this information on the SEC’s website at http://www.sec.gov.
Nuveen Funds’ Proxy Voting InformationYou may obtain (i) information regarding how each fund voted proxies relating to portfolio securities held during the most recent twelve-month period ended June 30, without charge, upon request, by calling Nuveen toll-free at (800) 257-8787 or on Nuveen’s website at www.nuveen.com and (ii) a description of the policies and procedures that each fund used to determine how to vote proxies relating to portfolio securities without charge, upon request, by calling Nuveen toll free at (800) 257-8787. You may also obtain this information directly from the SEC. Visit the SEC on-line at http://www.sec.gov.
CEO Certification DisclosureEach Fund’s Chief Executive Officer (CEO) has submitted to the New York Stock Exchange (NYSE) the annual CEO certification as required by Section 303A.12(a) of the NYSE Listed Company Manual. Each Fund has filed with the SEC the certification of its CEO and Chief Financial Officer required by Section 302 of the Sarbanes-Oxley Act.
Common Share RepurchasesEach Fund intends to repurchase, through its open-market share repurchase program, shares of its own common stock at such times and in such amounts as is deemed advisable. During the period covered by this report, each Fund repurchased shares of its common stock as shown in the accompanying table. Any future repurchases will be reported to shareholders in the next annual or semi-annual report.
| | | | | | |
| NXP | NXQ | NXR | NXC | NXN |
Common Shares repurchased | — | — | — | — | — |
FINRA BrokerCheck
The Financial Industry Regulatory Authority (FINRA) provides information regarding the disciplinary history of FINRA member firms and associated investment professionals. This information as well as an investor brochure describing FINRA BrokerCheck is available to the public by calling the FINRA BrokerCheck Hotline number at (800) 289-9999 or by visiting www.FINRA.org.
80Glossary of Terms Used in this Report
(Unaudited)
| ■ | Average Annual Total Return: This is a commonly used method to express an investment’s performance over a particular, usually multi-year time period. It expresses the return that would have been necessary each year to equal the investment’s actual cumulative performance (including change in NAV or market price and reinvested dividends and capital gains distributions, if any) over the time period being considered. |
| ■ | Duration: Duration is a measure of the expected period over which a bond’s principal and interest will be paid, and consequently is a measure of the sensitivity of a bond’s or bond fund’s value to changes when market interest rates change. Generally, the longer a bond’s or fund’s duration, the more the price of the bond or fund will change as interest rates change. |
| ■ | Effective Leverage: Effective leverage is a fund’s effective economic leverage, and includes both regulatory leverage (see leverage) and the leverage effects of certain derivative investments in the fund’s portfolio. Currently, the leverage effects of Tender Option Bond (TOB) inverse floater holdings are included in effective leverage values, in addition to any regulatory leverage. |
| ■ | Gross Domestic Product (GDP): The total market value of all final goods and services produced in a country/region in a given year, equal to total consumer, investment and government spending, plus the value of exports, minus the value of imports. |
| ■ | Industrial Development Revenue Bond (IDR): A unique type of revenue bond issued by a state or local government agency on behalf of a private sector company and intended to build or acquire factories or other heavy equipment and tools. |
| ■ | Inverse Floating Rate Securities: Inverse floating rate securities, also known as inverse floaters or tender option bonds (TOBs), are created by depositing a municipal bond, typically with a fixed interest rate, into a special purpose trust. This trust, in turn, (a) issues floating rate certificates typically paying short-term tax-exempt interest rates to third parties in amounts equal to some fraction of the deposited bond’s par amount or market value, and (b) issues an inverse floating rate certificate (sometimes referred to as an “inverse floater”) to an investor (such as a fund) interested in gaining investment exposure to a long-term municipal bond. The income received by the holder of the inverse floater varies inversely with the short-term rate paid to the floating rate certificates’ holders, and in most circumstances the holder of the inverse floater bears substantially all of the underlying bond’s downside invest- ment risk. The holder of the inverse floater typically also benefits disproportionately from any potential appreciation of the underlying bond’s value. Hence, an inverse floater essentially represents an investment in the underlying bond on a leveraged basis. |
| ■ | Leverage: Leverage is created whenever a fund has investment exposure (both reward and/or risk) equivalent to more than 100% of the investment capital. |
| ■ | Net Asset Value (NAV) Per Share: A fund’s Net Assets is equal to its total assets (securities, cash, accrued earnings and receivables) less its total liabilities. NAV per share is equal to the fund’s Net Assets divided by its number of shares outstanding. |
| ■ | Pre-Refunding: Pre-Refunding, also known as advanced refundings or refinancings, is a procedure used by state and local governments to refinance municipal bonds to lower interest expenses. The issuer sells new bonds with a lower yield and uses the proceeds to buy U.S. Treasury securities, the interest from which is used to make payments on the higher-yielding bonds. Because of this collateral, pre-refunding generally raises a bond’s credit rating and thus its value. |
| ■ | Regulatory Leverage: Regulatory leverage consists of preferred shares issued by or borrowings of a fund. Both of these are part of a fund’s capital structure. Regulatory leverage is subject to asset coverage limits set in the Investment Company Act of 1940. |
| ■ | S&P Municipal Bond California Index: An unleveraged, market value-weighted index designed to measure the performance of the tax-exempt, investment grade California municipal bond market. Index returns assume reinvestment of distributions, but do not reflect any applicable sales charges or management fees. |
81
Glossary of Terms Used in this Report (Unaudited)(continued)
| ■ | S&P Municipal Bond Index: An unleveraged, market value-weighted index designed to measure the performance of the tax-exempt, investment grade U.S. municipal bond market. Index returns assume reinvestment of distributions, but do not reflect any applicable sales charges or management fees. |
| ■ | S&P Municipal Bond New York Index: An unleveraged, market value-weighted index designed to measure the performance of the tax-exempt, investment grade New York municipal bond market. Index returns assume reinvestment of distributions, but do not reflect any applicable sales charges or management fees. |
| ■ | Total Investment Exposure: Total investment exposure is a fund’s assets managed by the Adviser that are attributable to financial leverage. For these purposes, financial leverage includes a fund’s use of preferred stock and borrowings and investments in the residual interest certificates (also called inverse floating rate securities) in tender option bond (TOB) trusts, including the portion of assets held by a TOB trust that has been effectively financed by the trust’s issuance of floating rate securities. |
| ■ | Zero Coupon Bond: A zero coupon bond does not pay a regular interest coupon to its holders during the life of the bond. Income to the holder of the bond comes from accretion of the difference between the original purchase price of the bond at issuance and the par value of the bond at maturity and is effectively paid at maturity. The market prices of zero coupon bonds generally are more volatile than the market prices of bonds that pay interest periodically. |
82
Reinvest Automatically, Easily and
Conveniently
Nuveen makes reinvesting easy. A phone call is all it takes to set up your reinvestment account.
Nuveen Closed-End Funds Automatic Reinvestment PlanNuveen Closed-End Fund allows you to conveniently reinvest distributions in additional Fund shares. By choosing to reinvest, you’ll be able to invest money regularly and automatically, and watch your investment grow through the power of compounding. Just like distributions in cash, there may be times when income or capital gains taxes may be payable on distributions that are reinvested. It is important to note that an automatic reinvestment plan does not ensure a profit, nor does it protect you against loss in a declining market.
Easy and convenient
To make recordkeeping easy and convenient, each month you’ll receive a statement showing your total distributions, the date of investment, the shares acquired and the price per share, and the total number of shares you own.
How shares are purchased
The shares you acquire by reinvesting will either be purchased on the open market or newly issued by the Fund. If the shares are trading at or above net asset value at the time of valuation, the Fund will issue new shares at the greater of the net asset value or 95% of the then-current market price. If the shares are trading at less than net asset value, shares for your account will be purchased on the open market. If the Plan Agent begins purchasing Fund shares on the open market while shares are trading below net asset value, but the Fund’s shares subsequently trade at or above their net asset value before the Plan Agent is able to complete its purchases, the Plan Agent may cease open-market purchases and may invest the uninvested portion of the distribution in newly-issued Fund shares at a price equal to the greater of the shares’ net asset value or 95% of the shares’ market value on the last business day immediately prior to the purchase date. Distributions received to purchase shares in the open market will normally be invested shortly after the distribution payment date. No interest will be paid on distributions awaiting reinvestment. Because the market price of the shares may increase before purchases are completed, the average purchase price per share may exceed the market price at the time of valuation, resulting in the acquisition of fewer shares than if the distribution had been paid in shares issued by the Fund. A pro rata portion of any applicable brokerage commissions on open market purchases will be paid by Plan participants. These commissions usually will be lower than those charged on individual transactions.
Flexible
You may change your distribution option or withdraw from the Plan at any time, should your needs or situation change. You can reinvest whether your shares are registered in your name, or in the name of a brokerage firm, bank, or other nominee. Ask your investment advisor if his or her firm will participate on your behalf. Participants whose shares are registered in the name of one firm may not be able to transfer the shares to another firm and continue to participate in the Plan. The Fund reserves the right to amend or terminate the Plan at any time. Although the Fund reserves the right to amend the Plan to include a service charge payable by the participants, there is no direct service charge to participants in the Plan at this time.
Call today to start reinvesting distributions
For more information on the Nuveen Automatic Reinvestment Plan or to enroll in or withdraw from the Plan, speak with your financial advisor or call us at (800) 257-8787.
83
Officers (Unaudited)
The management of the Funds, including general supervision of the duties performed for the Funds by the Adviser, is the responsibility of the Board of Trustees of the Funds. The number of trustees of the Funds is set at nine. None of the trustees who are not “interested” persons of the Funds (referred to herein as “independent board members”) has ever been a director or employee of, or consultant to, Nuveen or its affiliates. The names and business addresses of the trustees and officers of the Funds, their principal occupations and other affiliations during the past five years, the number of portfolios each Trustee oversees and other directorships they hold are set forth below.
| | | | | |
| Name, | Position(s) Held | Year First | Principal | Number |
| Year of Birth | with the Funds | Elected or | Occupation(s) | of Portfolios |
| & Address | | Appointed | Including other | in Fund Complex |
| | and Term(1) | Directorships | Overseen by |
| | | During Past 5 Years | Board Member |
| | | | | |
Independent Board Members: |
| | | | | |
■ TERENCE J. TOTH | | | Formerly, a Co-Founding Partner, Promus Capital (2008-2017); Director, | |
| 1959 | | | Quality Control Corporation (since 2012); member: Catalyst Schools of | |
| 333 W. Wacker Drive | Chairman and | 2008 | Chicago Board (since 2008) and Mather Foundation Board (since 2012), | 156 |
| Chicago, IL 6o6o6 | Board Member | Class II | and chair of its Investment Committee; formerly, Director, Fulcrum IT | |
| | | Services LLC (2010- 2019); formerly, Director, Legal & General Investment | |
| | | Management America, Inc. (2008-2013); formerly, CEO and President, | |
| | | Northern Trust Global Investments (2004-2007): Executive Vice President, | |
| | | Quantitative Management & Securities Lending (2000-2004); prior thereto, | |
| | | various positions with Northern Trust Company (since 1994); formerly, | |
| | | Member, Northern Trust Mutual Funds Board (2005-2007), Northern Trust | |
| | | Global Investments Board (2004-2007), Northern Trust Japan Board | |
| | | (2004-2007), Northern Trust Securities Inc. Board (2003-2007) and Northern | |
| | | Trust Hong Kong Board (1997-2004). | |
|
■ JACK B. EVANS | | | Chairman (since 2019), formerly, President (1996-2019), The Hall-Perrine | |
| 1948 | | | Foundation, a private philanthropic corporation; Director and Chairman, | |
| 333 W. Wacker Drive | Board Member | 1999 | United Fire Group, a publicly held company; Director, Public Member, | 156 |
| Chicago, IL 6o6o6 | | Class III | American Board of Orthopaedic Surgery (since 2015); Life Trustee of | |
| | | Coe College and the Iowa College Foundation; formerly, President | |
| | | Pro-Tem of the Board of Regents for the State of Iowa University System; | |
| | | formerly, Director, Alliant Energy and The Gazette Company; formerly, | |
| | | Director, Federal Reserve Bank of Chicago; formerly, President and Chief | |
| | | Operating Officer, SCI Financial Group, Inc., a regional financial services firm. | |
|
■ WILLIAM C. HUNTER | | | Dean Emeritus, formerly, Dean, Tippie College of Business, University of | |
| 1948 | | | Iowa (2006-2012); Director of Wellmark, Inc. (since 2009); past Director | |
| 333 W. Wacker Drive | Board Member | 2003 | (2005-2015), and past President (2010-2014) Beta Gamma Sigma, Inc., | 156 |
| Chicago, IL 6o6o6 | | Class I | The International Business Honor Society; formerly, Director (2004-2018) | |
| | | of Xerox Corporation; Dean and Distinguished Professor of Finance, | |
| | | School of Business at the University of Connecticut (2003-2006); previously, | |
| | | Senior Vice President and Director of Research at the Federal Reserve Bank | |
| | | of Chicago (1995-2003); formerly, Director (1997-2007), Credit Research | |
| | | Center at Georgetown University. | |
|
■ ALBIN F. MOSCHNER | | | Founder and Chief Executive Officer, Northcroft Partners, LLC, a | |
| 1952 | | | management consulting firm (since 2012); formerly, Chairman (2019), | |
| 333 W. Wacker Drive | Board Member | 2016 | and Director (2012-2019), USA Technologies, Inc., a provider of | 156 |
| Chicago, IL 6o6o6 | | Class III | solutions and services to facilitate electronic payment transactions; | |
| | | formerly, Director, Wintrust Financial Corporation (1996-2016); previously, | |
| | | held positions at Leap Wireless International, Inc., including Consultant | |
| | | (2011-2012), Chief Operating Officer (2008-2011), and Chief Marketing | |
| | | Officer (2004-2008); formerly, President, Verizon Card Services division | |
| | | of Verizon Communications, Inc. (2000-2003); formerly, President, One | |
| | | Point Services at One Point Communications (1999- 2000); formerly, | |
| | | Vice Chairman of the Board, Diba, Incorporated (1996-1997); formerly, | |
| | | various executive positions (1991-1996) and Chief Executive Officer | |
| | | (1995-1996) of Zenith Electronics Corporation. | |
84
| | | | | |
| Name, | Position(s) Held | Year First | Principal | Number |
| Year of Birth | with the Funds | Elected or | Occupation(s) | of Portfolios |
| & Address | | Appointed | Including other | in Fund Complex |
| | and Term(1) | Directorships | Overseen by |
| | | During Past 5 Years | Board Member |
|
Independent Board Members (continued): |
|
■ JOHN K. NELSON | | | Member of Board of Directors of Core12 LLC. (since 2008), a private firm | |
| 1962 | | | which develops branding, marketing and communications strategies for | |
| 333 W. Wacker Drive | Board Member | 2013 | clients; served on The President’s Council of Fordham University (2010- | 156 |
| Chicago, IL 6o6o6 | | Class II | 2019) and previously a Director of the Curran Center for Catholic | |
| | | American Studies (2009- 2018); formerly, senior external advisor to the | |
| | | Financial Services practice of Deloitte Consulting LLP. (2012-2014); former | |
| | | Chair of the Board of Trustees of Marian University (2010-2014 as trustee, | |
| | | 2011-2014 as Chair); formerly Chief Executive Officer of ABN AMRO | |
| | | Bank N.V., North America, and Global Head of the Financial Markets | |
| | | Division (2007-2008), with various executive leadership roles in ABN | |
| | | AMRO Bank N.V. between 1996 and 2007. | |
|
■ JUDITH M. STOCKDALE | | | Board Member, Land Trust Alliance (since 2013); formerly, Board Member, | |
| 1947 | | | U.S. Endowment for Forestry and Communities (2013-2019); formerly, | |
| 333 W. Wacker Drive | Board Member | 1997 | Executive Director (1994-2012), Gaylord and Dorothy Donnelley | 156 |
| Chicago, IL 6o6o6 | | Class I | Foundation; prior thereto, Executive Director, Great Lakes Protection | |
| | | Fund (1990-1994). | |
|
■ CAROLE E. STONE | | | Former Director, Chicago Board Options Exchange, Inc. (2006-2017); | |
| 1947 | | | and C2 Options Exchange, Incorporated (2009-2017); former Director, | |
| 333 W. Wacker Drive | Board Member | 2007 | Cboe, Global Markets, Inc., formerly, CBOE Holdings, Inc. (2010-May | 156 |
| Chicago, IL 6o6o6 | | Class I | 2020); formerly, Commissioner, New York State Commission on Public | |
| | | Authority Reform (2005-2010). | |
|
■ MARGARET L. WOLFF | | | Formerly, member of the Board of Directors (2013-2017) of Travelers | |
| 1955 | | | Insurance Company of Canada and The Dominion of Canada General | |
| 333 W. Wacker Drive | Board Member | 2016 | Insurance Company (each, a part of Travelers Canada, the Canadian | 156 |
| Chicago, IL 6o6o6 | | Class I | operation of The Travelers Companies, Inc.); formerly, Of Counsel, | |
| | | Skadden, Arps, Slate, Meagher & Flom LLP (Mergers & Acquisitions | |
| | | Group) (2005-2014); Member of the Board of Trustees of New | |
| | | York-Presbyterian Hospital (since 2005); Member (since 2004) and | |
| | | Chair (since 2015) of the Board of Trustees of The John A. Hartford | |
| | | Foundation (a philanthropy dedicated to improving the care of older | |
| | | adults); formerly, Member (2005-2015) and Vice Chair (2011-2015) of | |
| | | the Board of Trustees of Mt. Holyoke College. | |
|
■ ROBERT L. YOUNG | | | Formerly, Chief Operating Officer and Director, J.P.Morgan Investment | |
| 1963 | | | Management Inc. (2010-2016); formerly, President and Principal | |
| 333 W. Wacker Drive | Board Member | 2017 | Executive Officer (2013-2016), and Senior Vice President and Chief | 156 |
| Chicago, IL 6o6o6 | | Class II | Operating Officer (2005-2010), of J.P.Morgan Funds; formerly, Director | |
| | | and various officer positions for J.P.Morgan Investment Management Inc. | |
| | | (formerly, JPMorgan Funds Management, Inc. and formerly, One Group | |
| | | Administrative Services) and JPMorgan Distribution Services, Inc. | |
| | | (formerly, One Group Dealer Services, Inc.) (1999-2017). | |
85
Board Members & Officers (Unaudited) (continued)
| | | | |
| Name, | Position(s) Held | Year First | Principal |
| Year of Birth | with the Funds | Elected or | Occupation(s) |
| & Address | | Appointed(2) | During Past 5 Years |
|
Officers of the Funds: |
|
■ CEDRIC H. ANTOSIEWICZ | | | Senior Managing Director (since 2017), formerly, Managing Director |
| 1962 | Chief | | (2004-2017) of Nuveen Securities, LLC; Senior Managing Director (since |
| 333 W. Wacker Drive | Administrative | 2007 | 2017), formerly, Managing Director (2014-2017) of Nuveen Fund |
| Chicago, IL 6o6o6 | Officer | | Advisors, LLC. |
|
■ NATHANIEL T. JONES | | | Managing Director (since 2017), formerly, Senior Vice President |
| 1979 | | | (2016-2017), formerly, Vice President (2011-2016) of Nuveen; Managing |
| 333 W. Wacker Drive | Vice President | 2016 | Director (since 2015) of Nuveen Fund Advisors, LLC; Chartered Financial Analyst. |
| Chicago, IL 6o6o6 | and Treasurer | | |
|
■ WALTER M. KELLY | | | Managing Director (since 2017), formerly, Senior Vice President |
| 1970 | Chief Compliance | | (2008-2017) of Nuveen. |
| 333 W. Wacker Drive | Officer and | 2003 | |
| Chicago, IL 6o6o6 | Vice President | | |
|
■ DAVID J. LAMB | | | Managing Director (since 2017), formerly, Senior Vice President of |
| 1963 | | | Nuveen (since 2006), Vice President prior to 2006. |
| 333 W. Wacker Drive | Vice President | 2015 | |
| Chicago, IL 6o6o6 | | | |
|
■ TINA M. LAZAR | | | Managing Director (since 2017), formerly, Senior Vice President |
| 1961 | | | (2014-2017) of Nuveen Securities, LLC. |
| 333 W. Wacker Drive | Vice President | 2002 | |
| Chicago, IL 6o6o6 | | | |
|
■ BRIAN J. LOCKHART | | | Managing Director (since 2019) of Nuveen Fund Advisors, LLC; Managing Director |
| 1974 | | | (since 2017), formerly, Vice President (2010-2017) of Nuveen; Head of Investment |
| 333 W. Wacker Drive | Vice President | 2019 | Oversight (since 2017), formerly, Team Leader of Manager Oversight (2015-2017); |
| Chicago, IL 6o6o6 | | | Chartered Financial Analyst and Certified Financial Risk Manager. |
|
■ JACQUES M. LONGERSTAEY | | | Senior Managing Director, Chief Risk Officer, Nuveen, LLC (since May 2019); Senior |
| 1963 | | | Managing Director (since May 2019) of Nuveen Fund Advisors, LLC; formerly, Chief |
| 8500 Andrew Carnegie Blvd. | Vice President | 2019 | Investment and Model Risk Officer, Wealth & Investment Management Division, |
| Charlotte, NC 28262 | | | Wells Fargo Bank (NA) (from 2013-2019). |
86
| | | | |
| Name, | Position(s) Held | Year First | Principal |
| Year of Birth | with the Funds | Elected or | Occupation(s) |
| & Address | | Appointed(2) | During Past 5 Years |
|
Officers of the Funds (continued):
|
|
■ KEVIN J. MCCARTHY | | | Senior Managing Director (since 2017) and Secretary and General Counsel |
| 1966 | Vice President | | (since 2016) of Nuveen Investments, Inc., formerly, Executive Vice |
| 333 W. Wacker Drive | and Assistant | 2007 | President (2016-2017) and Managing Director and Assistant Secretary |
| Chicago, IL 6o6o6 | Secretary | | (2008-2016); Senior Managing Director (since 2017) and Assistant |
| | | Secretary (since 2008) of Nuveen Securities, LLC, formerly Executive |
| | | Vice President (2016-2017) and Managing Director (2008-2016); Senior |
| | | Managing Director (since 2017), Secretary (since 2016) and Co-General |
| | | Counsel (since 2011) of Nuveen Fund Advisors, LLC, formerly, Executive |
| | | Vice President (2016-2017), Managing Director (2008-2016) and Assistant |
| | | Secretary (2007-2016); Senior Managing Director (since 2017), Secretary |
| | | (since 2016) and Associate General Counsel (since 2011) of Nuveen Asset |
| | | Management, LLC, formerly Executive Vice President (2016-2017) and |
| | | Managing Director and Assistant Secretary (2011- 2016); Senior Managing |
| | | Director (since 2017) and Secretary (since 2016) of Nuveen Investments |
| | | Advisers, LLC, formerly Executive Vice President (2016- 2017); Vice President |
| | | (since 2007) and Secretary (since 2016), formerly, Assistant Secretary, of |
| | | NWQ Investment Management Company, LLC, Symphony Asset |
| | | Management LLC, Santa Barbara Asset Management, LLC and Winslow |
| | | Capital Management, LLC (since 2010). Senior Managing Director (since 2017) |
| | | and Secretary (since 2016) of Nuveen Alternative Investments, LLC. |
|
■ JON SCOTT MEISSNER | | | Managing Director of Mutual Fund Tax and Financial Reporting groups at |
| 1973 | | | Nuveen (since 2017); Managing Director of Nuveen Fund Advisors, LLC |
| 8500 Andrew Carnegie Blvd. | Vice President | 2019 | (since 2019); Senior Director of Teachers Advisors, LLC and TIAA-CREF |
| Charlotte, NC 28262 | | | Investment Management, LLC (since 2016); Senior Director (since 2015) Mutual |
| | | Fund Taxation to the TIAA-CREF Funds, the TIAA-CREF Life Funds, the TIAA |
| | | Separate Account VA-1 and the CREF Accounts; has held various positions with |
| | | TIAA since 2004. |
|
■ WILLIAM T. MEYERS | | | Senior Managing Director (since 2017), formerly, Managing Director |
| 1966 | | | (2016-2017), Senior Vice President (2010-2016) of Nuveen Securities, LLC |
| 333 W. Wacker Drive | Vice President | 2018 | and Nuveen Fund Advisors, LLC; Senior Managing Director (since 2017), |
| Chicago, IL 60606 | | | formerly, Managing Director (2016-2017), Senior Vice President (2010-2016) |
| | | of Nuveen, has held various positions with Nuveen since 1991. |
|
■ DEANN D. MORGAN | | | Executive Vice President, Global Head of Product at Nuveen (since November |
| 1969 | | | 2019); Co-Chief Executive Officer of Nuveen Securities, LLC (since March 2020); |
| 100 Park Avenue | Vice President | 2020 | Managing Member MDR Collaboratory LLC (since 2018); Managing Director, |
| New York, NY 10016 | | | Head of Wealth Management Product Structuring & COO Multi Asset Investing, |
| | | The Blackstone Group (2013-2017). |
|
■ MICHAEL A. PERRY | | | Executive Vice President (since 2017), previously Managing Director |
| 1967 | | | from 2016), of Nuveen Fund Advisors, LLC and Nuveen Alternative |
| 333 W. Wacker Drive | Vice President | 2017 | Investments, LLC; Executive Vice President (since 2017), formerly, |
| Chicago, IL 6o6o6 | | | Managing Director (2015-2017), of Nuveen Securities, LLC; formerly, |
| | | Managing Director (2010-2015) of UBS Securities, LLC. |
|
■ CHRISTOPHER M. ROHRBACHER | | | Managing Director (since 2017) and Assistant Secretary of Nuveen |
| 1971 | Vice President | | Securities, LLC; Managing Director (since 2017), formerly, Senior |
| 333 W. Wacker Drive | and Assistant | 2008 | Vice President (2016-2017), Co-General Counsel (since 2019) and |
| Chicago, IL 6o6o6 | Secretary | | Assistant Secretary (since 2016) of Nuveen Fund Advisors, LLC; |
| | | Managing Director (since 2017), formerly, Senior Vice President |
| | | (2012-2017) and Associate General Counsel (since 2016), formerly, |
| | | Assistant General Counsel (2008-2016) of Nuveen. |
87
Board Members & Officers (Unaudited) (continued)
| | | | |
| Name, | Position(s) Held | Year First | Principal |
| Year of Birth | with the Funds | Elected or | Occupation(s) |
| & Address | | Appointed(2) | During Past 5 Years |
|
Officers of the Funds (continued):
|
|
■ WILLIAM A. SIFFERMANN | | | Managing Director (since 2017), formerly Senior Vice President |
| 1975 | | | (2016-2017) and Vice President (2011-2016) of Nuveen. |
| 333 W. Wacker Drive | Vice President | 2017 | |
| Chicago, IL 6o6o6 | | | |
|
■ E. SCOTT WICKERHAM | | | Senior Managing Director, Head of Fund Administration at Nuveen, LLC |
| 1973 | Vice President | | (since 2019), formerly, Managing Director; Senior Managing Director |
| TIAA | and Controller | 2019 | (since 2019), Nuveen Fund Advisers, LLC; Principal Financial Officer, |
| 730 Third Avenue | | | Principal Accounting Officer and Treasurer (since 2017) to the TIAA-CREF Funds, |
| New York, NY 10017 | | | the TIAA-CREF Life Funds, the TIAA Separate Account VA-1 and the Treasurer |
| | | (since 2017) to the CREF Accounts; Senior Director, TIAA-CREF Fund Administration |
| | | (2014-2015); has held various positions with TIAA since 2006. |
|
■ MARK L. WINGET | | | Vice President and Assistant Secretary of Nuveen Securities, LLC (since |
| 1968 | Vice President | | 2008); Vice President and Assistant Secretary of Nuveen Fund Advisors, LLC |
| 333 W. Wacker Drive | and Assistant | 2008 | (since 2019); Vice President (since 2010) and Associate General Counsel |
| Chicago, IL 60606 | Secretary | | (since 2016), formerly, Assistant General Counsel (2008-2016) of Nuveen. |
|
■ GIFFORD R. ZIMMERMAN | | | Managing Director (since 2002), and Assistant Secretary of Nuveen |
| 1956 | Vice President | | Securities, LLC; Managing Director (since 2004) and Assistant Secretary |
| 333 W. Wacker Drive | Secretary | 1988 | (since 1994) of Nuveen Investments, Inc.; Managing Director (since |
| Chicago, IL 60606 | | | 2002), Assistant Secretary (since 1997) and Co-General Counsel (since 2011) |
| | | of Nuveen Fund Advisors, LLC; Managing Director, Assistant Secretary and |
| | | Associate General Counsel of Nuveen Asset Management, LLC (since 2011); |
| | | Vice President (since 2017), formerly, Managing Director (2003-2017) and |
| | | Assistant Secretary (since 2003) of Symphony Asset Management LLC; |
| | | Managing Director and Assistant Secretary (since 2002) of Nuveen Investments |
| | | Advisers, LLC; Vice President and Assistant Secretary of NWQ Investment |
| | | Management Company, LLC (since 2002), Santa Barbara Asset Management, LLC |
| | | (since 2006), and of Winslow Capital Management, LLC, (since 2010); Chartered |
| | | Financial Analyst. |
| | |
(1) | The Board of Trustees is divided into three classes, Class I, Class II, and Class III, with each being elected to serve until the third succeeding annual shareholders’ meeting subsequent to its election or thereafter in each case when its respective successors are duly elected or appointed, except two board members are elected by the holders of Preferred Shares, when applicable, to serve until the next annual shareholders’ meeting subsequent to its election or thereafter in each case when its respective successors are duly elected or appointed. The year first elected or appointed represents the year in which the board member was first elected or appointed to any fund in the Nuveen complex. |
(2) | Officers serve one year terms through August of each year. The year first elected or appointed represents the year in which the Officer was first elected or appointed to any fund in the Nuveen complex. |
88
Notes
89
Notes
90
Notes
91
Nuveen:
Serving Investors for Generations
Since 1898, financial advisors and their clients have relied on Nuveen to provide dependable investment solutions through continued adherence to proven, long-term investing principles. Today, we offer a range of high quality solutions designed to be integral components of a well-diversified core portfolio.
Focused on meeting investor needs.
Nuveen is the investment manager of TIAA. We have grown into one of the world’s premier global asset managers, with specialist knowledge across all major asset classes and particular strength in solutions that provide income for investors and that draw on our expertise in alternatives and responsible investing. Nuveen is driven not only by the independent investment processes across the firm, but also the insights, risk management, analytics and other tools and resources that a truly world-class platform provides. As a global asset manager, our mission is to work in partnership with our clients to create solutions which help them secure their financial future.
Find out how we can help you.
To learn more about how the products and services of Nuveen may be able to help you meet your financial goals, talk to your financial advisor, or call us at (800) 257-8787. Please read the information provided carefully before you invest. Investors should consider the investment objective and policies, risk considerations, charges and expenses of any investment carefully. Where applicable, be sure to obtain a prospectus, which contains this and other relevant information. To obtain a prospectus, please contact your securities representative or Nuveen, 333 W. Wacker Dr., Chicago, IL 60606. Please read the prospectus carefully before you invest or send money.
Learn more about Nuveen Funds at: www.nuveen.com/closed-end-funds
Nuveen Securities, LLC, member FINRA and SIPC | 333 West Wacker Drive Chicago, IL 60606 | www.nuveen.com |  |
EAN-B-0320D 1172662-INV-Y-05/21