Exhibit 99.2

Sapiens International Corporation N.V.
July 9, 2024
Rating Affirmation
‘ilAA-’ Rating Affirmed; Outlook Stable
Primary Credit Analyst:
Sivan Mesilati, 972-3-7539735 sivan.mesilati@spglobal.com
Additional Contact:
Tom Dar, 972-3-7539722 tom.dar@spglobal.com
| Please note that this translation was made for convenience purposes and for the company’s use only and under no circumstances shall obligate S&P Global Ratings Maalot Ltd. The translation has no legal status and S&P Global Ratings Maalot Ltd. does not assume any responsibility whatsoever as to its accuracy and is not bound by its contents. In the case of any discrepancy with the official Hebrew version published on July 9, 2024, the Hebrew version shall apply. |
| 1 | July 9, 2024 | Rating Affirmation |
Sapiens International Corporation N.V.
Table of Contents
| ‘ilAA-’ Rating Affirmed; Outlook Stable | 1 |
| Table of Contents | 2 |
| ‘ilAA-’ Rating Affirmed; Outlook Stable | 3 |
| Overview | 3 |
| Outlook | 4 |
| Downside Scenario | 4 |
| Upside Scenario | 4 |
| Base Case Scenario | 4 |
| Assumptions | 4 |
| Key Metrics | 5 |
| Company Description | 5 |
| Business Risk | 5 |
| Financial Risk | 6 |
| Liquidity | 8 |
| Covenant Analysis | 8 |
| Compliance expectations | 8 |
| Requirements | 8 |
| Modifiers | 8 |
| Environmental, Social, And Governance | 8 |
| Recovery Analysis | 9 |
| Key analytical factors | 9 |
| Simulated default assumptions | 9 |
| Simplified Waterfall | 9 |
| Reconciliation | 10 |
| Related Criteria And Research | 11 |
| Ratings List | 12 |
| 2 | July 9, 2024 | www.maalot.co.il |
Sapiens International Corporation N.V.
Rating Affirmation
‘ilAA-’ Rating Affirmed; Outlook Stable
Overview
| Key Strengths | Key Risks | |||
| ● | International geographic diversification. | ● | Limited intellectual property rights and R&D capabilities. | |
| ● | Growth and modernization trends in software solutions for the insurance market. | ● | Small revenue base and EBITDA compared with global peers. | |
| ● | High barriers to entry underpinned by high software replacement costs and long-term relationships with clients. | ● | Exposure to cyber risks. | |
| ● | Strong liquidity. | |||
As we expected, Sapiens International Corporation N.V. (“Sapiens” or “the Company”) continued growing in 2023, presenting an 8.4% increase in revenue. In the first quarter of 2024, the Company’s sales totaled $134.2 million, an increase of about 7.6% compared to the corresponding quarter last year. The growth was mainly due to the Company’s organic activity due to the creation of synergy between the companies it had acquired.
In our base case scenario, we expect the Company’s operations will continue to grow in 2024, including a ~5%-7% increase in sales. We believe the Company’s growth will be based on its expanding business in Europe, in particular Germany, Austria and the Nordic countries, and in its core segments in the United States, in addition to continued synergy between the companies acquired in the past two years and the Company’s existing products. As a result, we expect the Company’s adjusted EBITDA to increase to about $105 million - $110 million in 2024.
We expect Sapiens to continue to maintain low leverage. Sapiens has a cash cushion and bank deposits totaling about $196 million as of March 31, 2024, and in our base scenario we assume that if it makes small-medium acquisitions they will be financed with cash and/or by debt issuances. Accordingly, we believe that considering Sapiens’ low debt and projected increase EBITDA growth in the coming year, the Company is expected to present in 2024 an adjusted debt to EBITDA ratio of 0.7x-1.0x and an FFO (funds from operations) to debt ratio of 90%-100%. We estimate that in accordance with the Company’s dividend policy, in the next two years it will distribute an annual dividend totaling $25 million - $35 million in two semi-annual installments.
| 3 | July 9, 2024 | www.maalot.co.il |
Sapiens International Corporation N.V.
We acknowledge a high degree of uncertainty regarding the scope, duration and effects of the war in Israel. If the conflict expands to additional fronts, it could significantly increase the adverse risk to macroeconomic parameters in Israel and capital market volatility. There are already concerns that Israel’s main economic indicators may be weaker than expected (see Israel Long-Term Ratings Lowered To ‘A+’ From ‘AA-’ On Heightened Geopolitical Risk; Outlook Negative, published on April 18, 2024). As the situation evolves, we will update our assumptions and estimates accordingly.
Outlook
The stable outlook reflects our assessment that Sapiens will maintain its position in the software solutions market in North America, EMEA (Europe, Middle East and Africa) and APAC (Asia Pacific). We also expect the Company to maintain organic growth, alongside acquisitions of companies in similar or tangent areas, while maintaining stable operating performance. The outlook also reflects our assessment that in the next 12 months the Company will maintain adjusted debt to EBITDA of about 1.0x and adjusted FFO to debt of about 90%, commensurate with the rating.
Downside Scenario
We may lower the rating if Sapiens’s competitive position is undermined. This could happen if market conditions worsen, leading to a deterioration in the Company’s operating performance and to continued or material decline in profitability. The rating will also come under pressure if Sapiens materially increases its financial debt in order to finance acquisitions or large dividend distributions to shareholders, such that it fails to consistently post an adjusted debt to EBITDA ratio of about 2.0x.
Upside Scenario
We may consider a positive rating action if Sapiens’s business risk profile materially improves, as reflected, inter alia, by a higher market share in its regions of operation, materially improved profitability and a wider client base and product variety compared with peers.
Base Case Scenario
Assumptions
| ● | About 5%-7% sales growth in 2024, due to organic growth, notably in Europe and APAC in life and elementary insurance. |
| ● | R&D expenditures of 12%-13% of total expenses in 2024-2025. |
| ● | Adjusted EBITDA margin of about 19%-20% in 2024-2025. |
| ● | Acquisitions of about $15 million per year in 2024-2025. |
| 4 | July 9, 2024 | www.maalot.co.il |
Sapiens International Corporation N.V.
| ● | Dividend distribution of about $25 million - $35 million per year in two semi-annual installments, in accordance with the Company’s dividend distribution policy (about 40% of its non-GAAP net profit). |
Key Metrics
| Financial Metric | 2023A | 2024E | 2025E | |||
| Debt/EBITDA | 0.9x | 0.7x-1.0x | 0.7x-1.0x | |||
| FFO/debt | 76.1% | 90%-100% | 105%-115% |
A - actual. E – Estimate.
Company Description
Sapiens International Corporation N.V. (“Sapiens”) is engaged in the development and marketing of global software solutions for financial markets and in particular for insurance companies, adapted to the segments of general insurance, life insurance and pension, reinsurance, etc. Sapiens has been working with international insurance companies and banks for years, and serves more than 600 insurance companies in North America, Europe, Israel and Asia.
The controlling shareholder (43.6%) in Sapiens is Formula Systems (1985) Ltd. (“Formula”, ilAA- /Stable) which, through subsidiaries, is engaged in the development, marketing and distribution of software and software tools and the provision of software services for IT systems. The remaining shares are held by the public. The Company’s shares are traded on the Tel Aviv Stock Exchange and on NASDAQ.
Business Risk
Sapiens’s business risk assessment is supported by the geographical spread of its operations. Sapiens operates in North America, EMEA and APAC. The Company’s markets of operation are characterized by high barriers to entry, underpinned by long-term relationships with clients and by high replacement costs when changing software suppliers.
In the past year, Sapiens’s organic growth stood out against the backdrop of significant acquisitions it has made in recent years, in particular growth for the deployment of global operations. The Company’s North American and European operations are currently generating most of its sales, following the acquisition of U.S.-based Delphi Technology, which provides software solutions for the insurance market with an emphasis on medical malpractice, Nordic Tia Technology, which provides digital software solutions, and Sum.Cumo which provides a foothold in the German market.
| 5 | July 9, 2024 | www.maalot.co.il |
Sapiens International Corporation N.V.
Figure 1: Geographical distribution (% of revenue)
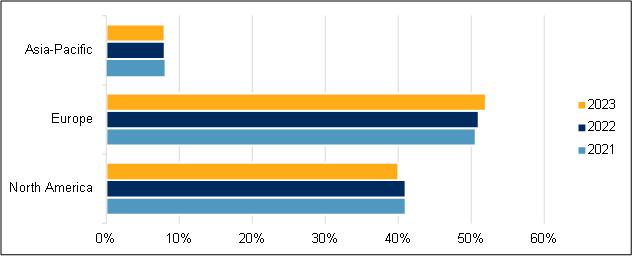
On the other hand, we believe Sapiens’s revenues and EBITDA to be small compared with global peers. Global competitors benefit from economies of scale allowing them to bear high R&D costs and to make substantial capital investments. Furthermore, the Company has relatively limited intellectual property rights and R&D capabilities compared with global peers. Intellectual property rights and R&D capabilities are critical to creating barriers to entry and a leading market position.It should also be noted that in the context of intellectual property, the Company is exposed to cyber risks, including the disclosure of confidential information, system failures, etc., which may affect its activities and reputation. However, the Company has been investing in information security, and has insurance policies to cover certain types of damages of this kind.
Financial Risk
Sapiens’s financial profile is based on low leverage and maintaining a cash cushion (which includes short-term bank deposits) amounting to about $196 million as of March 31, 2024. In 2023, its adjusted debt to EBITDA was about 0.9x, compared with about 1.3x in 2022.
The Company’s sales increased by about 7.6% In the first quarter of 2024 compared to the corresponding quarter last year, totaling about $134.2 million. This is mainly due to organic growth led by the North American region, where sales grew by about 9.5%, and Europe where sales grew by about 6.5%. Sales in the South Africa and APAC regions also grew, by about 5.4% compared to the first quarter of 2023. In addition, Non-GAAP operating income grew by about 7.8% to about $24.3 million, but the EBITDA margin remained about 18%.
| 6 | July 9, 2024 | www.maalot.co.il |
Sapiens International Corporation N.V.
In our base case scenario, we assume that sales will grow by about 5%-7% in 2024, due to expected expansions in Europe, in particular Germany, Austria and the Nordic countries, and in its core segments in the United States, and due to continued synergy between acquired companies and the Company’s existing products. As a result, we expect the Company’s adjusted EBITDA to increase to about $105 million - $110 million in 2024. We believe that if small- to medium scale acquisitions are made this year, they will be financed with cash and/or debt. We therefore estimate that, considering Sapiens’ low debt and projected EBITDA growth in the coming year, the Company is expected to present an adjusted debt to EBITDA ratio of 0.7x-1.0x and an FFO to debt ratio of 90%-100%.
We expect Sapiens to distributed about $25 million -$35 million in dividends this year, and a similar amount next year. This is in accordance with the Company’s dividend distribution policy, according to which it distributes up to 40% of its net income (Non-GAAP).
Table 1.
Sapiens International Corp. N.V. -- Financial Summary (Mil. $)
Industry Sector: Software & Services
| 2023 | 2022 | 2021 | 2020 | 2019 | ||||||||||||||||
| Revenue | 514.6 | 474.7 | 461.0 | 382.9 | 325.7 | |||||||||||||||
| EBITDA | 102.4 | 92.5 | 90.9 | 74.7 | 58.0 | |||||||||||||||
| Funds from operations (FFO) | 69.7 | 78.8 | 78.4 | 50.5 | 46.5 | |||||||||||||||
| Interest expense | 2.1 | 3.6 | 6.4 | 6.8 | 5.7 | |||||||||||||||
| Cash interest paid | 2.8 | 3.1 | 5.8 | 7.9 | 5.1 | |||||||||||||||
| Cash flow from operations | 75.8 | 41.5 | 78.0 | 58.1 | 63.1 | |||||||||||||||
| Capital expenditure | 2.8 | 3.0 | 3.9 | 5.4 | 11.5 | |||||||||||||||
| Free operating cash flow (FOCF) | 73.1 | 38.5 | 74.1 | 52.7 | 51.6 | |||||||||||||||
| Dividends paid | 28.2 | 38.6 | 20.3 | 7.0 | 11.2 | |||||||||||||||
| Discretionary cash flow (DCF) | 44.9 | (0.0 | ) | 53.8 | 45.7 | 40.5 | ||||||||||||||
| Cash and short-term investments | 202.1 | 180.3 | 210.2 | 182.6 | 66.3 | |||||||||||||||
| Gross available cash | 202.1 | 180.3 | 210.2 | 182.6 | 66.3 | |||||||||||||||
| Debt | 91.6 | 116.6 | 151.6 | 180.2 | 121.7 | |||||||||||||||
| Equity | 449.9 | 402.9 | 408.7 | 383.7 | 225.5 | |||||||||||||||
| Adjusted ratios | ||||||||||||||||||||
| Annual revenue growth (%) | 8.4 | 3.0 | 20.4 | 17.6 | 12.4 | |||||||||||||||
| EBITDA margin (%) | 19.9 | 19.5 | 19.7 | 19.5 | 17.8 | |||||||||||||||
| Return on capital (%) | 15.7 | 12.7 | 10.8 | 10.7 | 12.4 | |||||||||||||||
| EBITDA interest coverage (x) | 48.9 | 25.4 | 14.3 | 11.1 | 10.2 | |||||||||||||||
| FFO cash interest coverage (x) | 25.5 | 26.7 | 14.5 | 7.4 | 10.0 | |||||||||||||||
| Debt/EBITDA (x) | 0.9 | 1.3 | 1.7 | 2.4 | 2.1 | |||||||||||||||
| FFO/debt (%) | 76.1 | 67.6 | 51.7 | 28.0 | 38.2 | |||||||||||||||
| Cash flow from operations/debt (%) | 82.8 | 35.6 | 51.4 | 32.3 | 51.8 | |||||||||||||||
| FOCF/debt (%) | 79.8 | 33.1 | 48.8 | 29.3 | 42.4 | |||||||||||||||
| DCF/debt (%) | 49.0 | (0.0 | ) | 35.5 | 25.3 | 33.2 | ||||||||||||||
| 7 | July 9, 2024 | www.maalot.co.il |
Sapiens International Corporation N.V.
Liquidity
We assess Sapiens’s liquidity as strong, supported by a robust free operating cash flow. We expect the ratio between the Company’s sources and uses to exceed 1.5x in the 12 months starting April 1, 2024. This assessment reflects the Company’s cash balance, operating cash flow, debt maturities, maturities, relatively limited capital expenditure and dividend distributions.
Following are the Company’s main sources and uses for the 12 months starting April 1, 2024:
| Principal Liquidity Sources | Principal Liquidity Uses | |||
| ● | About $196 million in cash and cash equivalents (including short-term bank deposits). | ● | Debt maturities of about $20 million. | |
| ● | Cash FFO of $90 million - $100 million. | ● | Capital expenditure (capex) of about $10 million - $15 million. | |
| ● | Dividend distribution of about $25 million - $35 million. | |||
Covenant Analysis
Compliance expectations
As of March 31, 2024, the Company has adequate headroom on its financial covenants, and we estimate that it will maintain this headroom in the medium term.
Requirements
Under the terms of its bonds, the Company must maintain consolidated equity attributable to its shareholders (excluding minority interests) of at least $120 million. It must also maintain a ratio not exceeding 65% between net financial debt and net CAP on a consolidated basis, and a net financial debt to EBITDA ratio not exceeding 5.5x.
Modifiers
Diversification/portfolio effect: Neutral
Capital structure: Neutral
Liquidity: Neutral
Financial policy: Neutral
Management and governance: Neutral
Comparable ratings analysis: Neutral
Environmental, Social, And Governance
ESG factors have an overall neutral influence on our credit analysis of Sapiens International Corporation N.V.
| 8 | July 9, 2024 | www.maalot.co.il |
Sapiens International Corporation N.V.
Recovery Analysis
Key analytical factors
| ● | We are affirming our ‘ilAA-’ rating, identical to the issuer rating, on Sapiens International Corporation N.V.’s unsecured Series B bonds. The recovery rating for this series is ’3’, reflecting our assessment that in the case of a hypothetical default, the recovery rate would be 50%-70%. |
| ● | Our recovery prospects assessment is constrained to the 50%-70% range despite the simplified waterfall, according to which the value available for unsecured debtors exceeds total unsecured debt, due to our assessment that on the path to default the Company will replace unsecured debt by secured or senior debt. |
Simulated default assumptions
| ● | Simulated year of default: 2029 |
| ● | A deep recession in the countries of operation, alongside failed M&A activity and the loss of several significant customers, will significantly hurt the Company’s operating performance. |
| ● | The Company will continue operating as a going concern, an assessment supported by its long- term signed contracts with clients and by the high costs of replacing existing chip suppliers. |
Simplified Waterfall
| ● | EBITDA on emergence: about $11.5 million |
| ● | Industry EBITDA multiple: 6.5x |
| ● | Gross enterprise value as going concern: about $75 million |
| ● | Administrative and operating costs: 5% |
| ● | Net value available for unsecured debt: about $70 million |
| ● | Unsecured debt claims: about $36 million |
| ● | Recovery expectations for unsecured debt: 50%-70% (constrained as noted above) |
| ● | Unsecured recovery rating (1 to 6): 3 |
All debt amounts include six months’ prepetition interest.
| 9 | July 9, 2024 | www.maalot.co.il |
Sapiens International Corporation N.V.
Mapping Recovery Percentages To Recovery Ratings
| Recovery expectations (%) | Description | Recovery rating | Notching above/below issuer rating | |||
| 100% | Full recovery | 1+ | +3 notches | |||
| 90%-100% | Very high recovery | 1 | +2 notches | |||
| 70%-90% | Substantial recovery | 2 | +1 notch | |||
| 50%-70% | Meaningful recovery | 3 | 0 notches | |||
| 30%-50% | Average recovery | 4 | 0 notches | |||
| 10%-30% | Modest recovery | 5 | -1 notch | |||
| 0%-10% | Negligible recovery | 6 | -2 notches |
Recovery ratings are capped in certain countries to adjust for reduced creditor recovery prospects in these jurisdictions. Recovery ratings on unsecured debt issues are generally also subject to caps (see Step 6, paragraphs 90-98 of Recovery Rating Criteria For Speculative-Grade Corporate Issuers, December 7, 2016, for further detail). ICR--Issuer credit rating.
Reconciliation
In order to create a basis for comparison with other rated companies, we adjust the data reported in the financial statements which we use to calculate financial ratios. The main adjustment to Sapiens International Corporation N.V.’s consolidated data for 2023 is the discounting of R&D expenses and their deduction from EBITDA. Cash was not deducted from debt.
Table 2.
Sapiens International Corp. N.V.--Reconciliation Of Reported Amounts With S&P Global Ratings’ Adjusted Amounts (Mil. $) for the Fiscal Year Ended Dec 31, 2023
| Debt | Shareholder’ equity | EBITDA | Interest expense | S&P Global Ratings’ adjusted EBITDA | Cash flow from operations | Capital expenditure | ||||||||||||||||||||||
| Reported Amounts | 59.3 | 447.3 | 100.3 | -- | 102.4 | 79.4 | 9.3 | |||||||||||||||||||||
| S&P Global Ratings adjustments | ||||||||||||||||||||||||||||
| Cash taxes paid | -- | -- | -- | -- | (29.9 | ) | -- | -- | ||||||||||||||||||||
| Cash interest paid | -- | -- | -- | -- | (0.8 | ) | -- | -- | ||||||||||||||||||||
| Reported lease liabilities | 27.7 | -- | -- | -- | -- | -- | -- | |||||||||||||||||||||
| Operating leases | -- | -- | 5.0 | 2.1 | (2.1 | ) | 2.9 | -- | ||||||||||||||||||||
| Postretirement benefit obligations/deferred compensation | 3.1 | -- | -- | -- | -- | -- | -- | |||||||||||||||||||||
| Capitalized development costs | -- | -- | (6.5 | ) | -- | -- | (6.5 | ) | (6.5 | ) | ||||||||||||||||||
| Share-based compensation expense | -- | -- | 3.6 | -- | -- | -- | -- | |||||||||||||||||||||
| Nonoperating income (expense) | -- | -- | -- | -- | -- | -- | -- | |||||||||||||||||||||
| Noncontrolling interest/minority interest | -- | 2.7 | -- | -- | -- | -- | -- | |||||||||||||||||||||
| Debt: Earnouts and deferred consideration for business acquisitions | 1.5 | -- | -- | -- | -- | -- | -- | |||||||||||||||||||||
| Total adjustments | 32.2 | 2.7 | 2.1 | 2.1 | (32.7 | ) | (3.6 | ) | (6.5 | ) | ||||||||||||||||||
| 10 | July 9, 2024 | www.maalot.co.il |
Sapiens International Corporation N.V.
S&P Global Ratings adjusted amounts
| Debt | Equity | EBITDA | Interest expense | Funds from operations | Cash flow from operations | Capital expenditure | |||||||||||||||||||||||
| Adjusted | 91.6 | 449.9 | 102.4 | 2.1 | 69.7 | 75.8 | 2.8 | ||||||||||||||||||||||
Related Criteria And Research
| ● | Principles Of Credit Ratings, February 16, 2011 |
| ● | Methodology: Industry Risk, November 19, 2013 |
| ● | Country Risk Assessment Methodology And Assumptions, November 19, 2013 |
| ● | Methodology And Assumptions: Liquidity Descriptors For Global Corporate Issuers, December 16, 2014 |
| ● | Recovery Rating Criteria For Speculative-Grade Corporate Issuers, December 7, 2016 |
| ● | Corporate Methodology: Ratios And Adjustments, April 1, 2019 |
| ● | Group Rating Methodology, July 1, 2019 |
| ● | Environmental, Social, And Governance Principles In Credit Ratings, October 10, 2021 |
| ● | Methodology For National And Regional Scale Credit Ratings, June 8, 2023 |
| ● | Corporate Methodology, January 7, 2024 |
| ● | Methodology: Management And Governance Credit Factors For Corporate Entities And Insurers, January 7, 2024 |
| ● | Sector-Specific Corporate Methodology, April 4, 2024 |
| ● | S&P Global Ratings Definitions, June 9, 2023 |
| 11 | July 9, 2024 | www.maalot.co.il |
Sapiens International Corporation N.V.
Ratings List
| Sapiens International Corporation N.V. | Rating | Date when the rating was first published | Date when the rating was last updated | |||
| Issuer rating(s) | ||||||
| Long term | ilAA-/Stable | 13/08/2017 | 11/07/2023 | |||
| Issue rating(s) | ||||||
| Senior Unsecured Debt | ||||||
| Series B | ilAA- | 12/09/2017 | 11/07/2023 | |||
| Issuer Credit Rating history | ||||||
| Long term | ||||||
| June 28, 2022 | ilAA-/Stable | |||||
| August 13, 2017 | ilA+/Stable |
| Additional details | ||
| Time of the event | 09/07/2024 09:19 | |
| Time when the event was learned of | 09/07/2024 09:19 | |
| Rating requested by | Issuer |
| 12 | July 9, 2024 | www.maalot.co.il |
Sapiens International Corporation N.V.
S&P Maalot is the commercial name of S&P Global Ratings Maalot Ltd. For a list of the most up-to- date ratings and for additional information regarding S&P Maalot’s surveillance policy, see S&P Global Ratings Maalot Ltd. website at www.maalot.co.il.
All rights reserved © No content (including ratings, credit-related analyses and data, valuations, model, software or other application or output therefrom) or any part thereof (collectively, “the Content”) may be modified, reverse engineered, reproduced or distributed in any form by any means, or stored in a database or retrieval system, without the prior written permission of S&P Global Ratings Maalot Ltd. or its affiliates (collectively, S&P). The Content shall not be used for any unlawful or unauthorized purposes. &P and any third-party providers, as well as their directors, officers, shareholders, employees or agents (collectively, “S&P Parties”) do not guarantee the accuracy, completeness, timeliness or availability of the Content. S&P Parties are not responsible for any errors or omissions (negligent or otherwise), regardless of the cause, for the results obtained from the use of the Content, or for the security or maintenance of any data input by the user. The Content is provided on an “as is” basis. S&P PARTIES DISCLAIM ANY AND ALL EXPRESS OR IMPLIED WARRANTIES, INCLUDING, BUT NOT LIMITED TO, ANY WARRANTIES OF MERCHANTABILITY OR FITNESS FOR A PARTICULAR PURPOSE OR USE, FREEDOM FROM BUGS, SOFTWARE ERRORS OR DEFECTS, THAT THE CONTENT’S FUNCTIONING WILL BE UNINTERRUPTED OR THAT THE CONTENT WILL OPERATE WITH ANY SOFTWARE OR HARDWARE CONFIGURATION. In no event shall S&P Parties be liable to any party for any direct, indirect, incidental, exemplary, compensatory, punitive, special or consequential damages, costs, expenses, legal fees, or losses (including, without limitation, lost income or lost profits and opportunity costs or losses caused by negligence) in connection with any use of the Content even if advised of the possibility of such damages.
Credit-related and other analyses, including ratings, and statements in the Content are statements of opinion as of the date they are expressed and not statements of fact. S&P’s ratings and other analyses are not recommendations to purchase, hold, or sell any securities or to make any investment decisions, and do not address the suitability of any security. S&P assumes no obligation to update the Content following publication in any form or format. The Content should not be relied on in making investment decisions or any other business decision, and is not a substitute for the skill, judgment and experience of the user, its management, employees, advisors and/or clients when making such decisions. S&P does not act as a fiduciary or an investment advisor except where registered as such. Rating reports are correct as of the time of their publication. S&P updates rating reports following ongoing surveillance of events or annual surveillance.
While S&P obtains information from sources it believes to be reliable, S&P does not perform an audit and undertakes no duty of due diligence or independent verification of any information it receives. S&P publishes rating-related reports for a variety of reasons that are not necessarily dependent on action by rating committees, including, but not limited to, the publication of a periodic update on a credit rating and related analyses.
S&P keeps certain activities of its business units separate from each other in order to preserve the independence and objectivity of their respective activities. S&P has established policies and procedures to maintain the confidentiality of certain non-public information received in connection with each analytical process.
S&P receives compensation for its ratings and certain analyses, normally from issuers or underwriters of securities or from obligors. S&P reserves the right to disseminate its opinions and analyses. S&P’s public ratings and analyses are made available on S&P Maalot’s website, www.maalot.co.il and on S&P Global’s website, www.spglobal.com/ratings, and may be distributed through other means, including via S&P publications and third-party redistributors.
| 13 | July 9, 2024 | www.maalot.co.il |