Exhibit 99.2
| | |
| Avnet, Inc. Q4 & Fiscal Year 2013 | | |
$ in millions - except per share data August 07, 2013 | | |
CFO Review of Fiscal 2013 Fourth Quarter Results
| | | | | | | | | | | | | | | | | | | | |
| | | 4Q’ FY12 | | | 3Q’ FY13 | | | 4Q’ FY13 | | | Y/Y Chg | | | Seq. Chg | |
Sales | | $ | 6,307.4 | | | $ | 6,298.7 | | | $ | 6,590.7 | | | $ | 283.3 | | | $ | 292.0 | |
Gross Profit | | $ | 759.0 | | | $ | 756.0 | | | $ | 770.9 | | | $ | 11.9 | | | $ | 14.9 | |
GP Margin | | | 12.0 | % | | | 12.0 | % | | | 11.7 | % | | | (33 | ) bps | | | (30 | ) bps |
SG&A Expenses | | $ | 525.1 | | | $ | 561.1 | | | $ | 548.3 | | | $ | 23.2 | | | ($ | 12.8 | ) |
SG&A as % of Sales | | | 8.3 | % | | | 8.9 | % | | | 8.3 | % | | | (1 bps | ) | | | (59 bps | ) |
SG&A as % of GP | | | 69.2 | % | | | 74.2 | % | | | 71.1 | % | | | 194 bps | | | | (309 bps | ) |
GAAP Operating Income | | $ | 213.4 | | | $ | 167.6 | | | $ | 162.8 | | | ($ | 50.6 | ) | | ($ | 4.8 | ) |
Adjusted Operating Income (1) | | $ | 233.9 | | | $ | 195.0 | | | $ | 222.7 | | | ($ | 11.2 | ) | | $ | 27.7 | |
Adjusted Operating Income Margin (1) | | | 3.7 | % | | | 3.1 | % | | | 3.4 | % | | | (33 | ) bps | | | 28 bps | |
GAAP Net Income (Loss) | | $ | 133.4 | | | $ | 86.2 | | | $ | 126.1 | | | ($ | 7.3 | ) | | $ | 39.9 | |
Adjusted Net Income (1) | | $ | 145.3 | | | $ | 125.4 | | | $ | 135.8 | | | ($ | 9.4 | ) | | $ | 10.5 | |
GAAP Diluted EPS | | $ | 0.91 | | | $ | 0.62 | | | $ | 0.91 | | | | 0.0 | % | | | 46.8 | % |
Adjusted EPS (1) | | $ | 0.99 | | | $ | 0.90 | | | $ | 0.98 | | | | -1.0 | % | | | 8.9 | % |
Return on Working Capital (ROWC) (1) | | | 23.7 | % | | | 20.0 | % | | | 23.0 | % | | | (75 | ) bps | | | 298 bps | |
Return on Capital Employed (ROCE) (1) | | | 12.5 | % | | | 10.5 | % | | | 12.1 | % | | | (46 | ) bps | | | 154 bps | |
Working Capital Velocity | | | 6.40 | | | | 6.46 | | | | 6.80 | | | | 0.40 | | | | 0.34 | |
| (1) | A reconcilliation of non-GAAP financial measures is presented in the Non-GAAP Financial Information section at the end of this document. |
K e y H i g h l i g h t s
| | • | | Revenue for the fourth quarter of fiscal 2013 was $6.6 billion, representing sequential growth in organic revenue (as defined later in this report) of 5.0% when excluding the translation impact of changes in foreign currency exchanges rates (also referred to as “constant dollars” or “constant currency” and referenced as “CC” in the graphs that follow), which is at the high end of the normal seasonal range of +1% to +5%. |
| | • | | Gross profit margin declined 30 basis points sequentially, primarily due to competitive pressure in the western regions at both operating groups. |
| | • | | Adjusted operating income increased 14.2% sequentially to $223 million and operating income margin improved 28 basis points to 3.4%, with both operating groups contributing to the improvement. |
| | • | | Adjusted diluted earnings per share increased $0.08, or 8.9%, sequentially to $0.98 due to the improvement in operating income partially offset by a $10.8 million, or $0.06 per share, sequential increase in other expense. (See discussion later in this document) |
| | • | | Enterprise ROCE improved 154 basis points and ROWC increased 298 basis points sequentially, with both operating groups contributing to the increase. |
| | • | | Cash flow from operations was $267 million in the June quarter and $696 million in fiscal 2013. |
1
| | |
| Avnet, Inc. Q4 & Fiscal Year 2013 | | |
$ in millions - except per share data August 07, 2013 | | |
R e v e n u e
| | | | | | | | | | | | | | | | | | | | | | | | | | | | |
| | | | | | | | | | | | | | | | | | Year-over-Year Growth Rates | |
| | | 4Q’ FY12 | | | 1Q’ FY13 | | | 2Q’ FY13 | | | 3Q’ FY13 | | | 4Q’ FY13 | | | Reported (1) | | | Organic (2) | |
Avnet, Inc. | | | 6,307.4 | | | | 5,870.1 | | | | 6,699.5 | | | | 6,298.7 | | | | 6,590.7 | | | | 4.49 | % | | | 0.21 | % |
Excluding FX(1) | | | | | | | | | | | | | | | | | | | | | | | 4.83 | % | | | 0.53 | % |
Electronics Marketing (EM) Total | | | 3,764.4 | | | | 3,653.2 | | | | 3,673.5 | | | | 3,797.2 | | | | 3,970.6 | | | | 5.48 | % | | | 2.01 | % |
Excluding FX(1) | | | | | | | | | | | | | | | | | | | | | | | 6.04 | % | | | 2.55 | % |
Americas | | | 1,435.4 | | | | 1,287.8 | | | | 1,264.9 | | | | 1,320.1 | | | | 1,391.0 | | | | -3.09 | % | | | -4.62 | % |
EMEA | | | 1,044.4 | | | | 958.5 | | | | 914.3 | | | | 1,100.1 | | | | 1,123.2 | | | | 7.53 | % | | | 6.13 | % |
Excluding FX(1) | | | | | | | | | | | | | | | | | | | | | | | 5.87 | % | | | 4.48 | % |
Asia | | | 1,284.6 | | | | 1,406.9 | | | | 1,494.3 | | | | 1,377.0 | | | | 1,456.4 | | | | 13.38 | % | | | 5.86 | % |
Technology Solutions (TS) Total | | | 2,543.0 | | | | 2,216.9 | | | | 3,026.0 | | | | 2,501.5 | | | | 2,620.1 | | | | 3.03 | % | | | -2.40 | % |
Excluding FX(1) | | | | | | | | | | | | | | | | | | | | | | | 3.03 | % | | | -2.40 | % |
Americas | | | 1,414.4 | | | | 1,164.6 | | | | 1,598.3 | | | | 1,300.1 | | | | 1,389.8 | | | | -1.74 | % | | | -2.51 | % |
EMEA | | | 676.1 | | | | 635.5 | | | | 963.8 | | | | 783.0 | | | | 799.6 | | | | 18.27 | % | | | -1.26 | % |
Excluding FX(1) | | | | | | | | | | | | | | | | | | | | | | | 17.87 | % | | | -1.59 | % |
Asia | | | 452.5 | | | | 416.8 | | | | 463.9 | | | | 418.4 | | | | 430.7 | | | | -4.81 | % | | | -4.11 | % |
| (1) | Year-over-year revenue growth rate excluding the impact of changes in foreign currency exchange rates. |
| (2) | Organic revenue as defined in this document. |
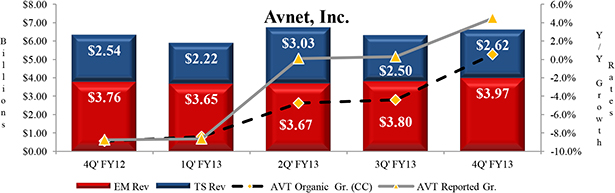
| | • | | Avnet, Inc. quarterly revenue of $6.6 billion, which was above the midpoint of expectations at both Electronics Marketing (EM) and Technology Solutions (TS), increased 4.8% year over year in constant dollars, with all three regions delivering positive growth. |
| | • | | Year-over-year organic sales (as defined later in this document) increased 0.2% and was up 0.5% in constant dollars, marking the first positive organic growth in seven quarters. |
| | • | | On a sequential basis, organic sales increased 4.3% and were up 5.0% in constant dollars, which is at the high end of normal seasonality of +1% to +5%. |
2
| | |
| Avnet, Inc. Q4 & Fiscal Year 2013 | | |
$ in millions - except per share data August 07, 2013 | | |
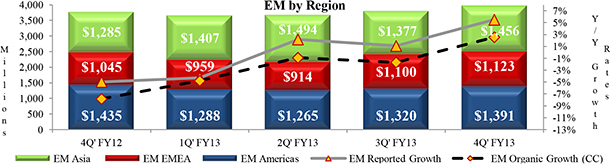
| | • | | EM’s quarterly revenue of $3.97 billion exceeded the midpoint of expectations with all three regions contributing towards this performance. Reported revenue increased 5.5% year over year (6.0% in constant dollars) and organic revenue grew 2.0% (2.6% in constant currency), turning positive for the first time in eight quarters. After accounting for the decision to exit the commercial components business in Latin America (LAC), all three regions realized positive year-over-year organic growth. |
| | • | | EM’s revenue increased 4.6% sequentially in reported dollars and sequential organic growth in constant currency of 4.7% was above normal seasonality of 0% to +4%. |
| | • | | America’s organic revenue declined 4.6% year over year primarily due to the decision to exit the lower margin commercial components business in LAC; organic revenue increased 5.5% sequentially. |
| | • | | EMEA’s organic revenue increased 4.5% year over year in constant dollars and 3.3% sequentially. |
| | • | | Asia’s organic revenue increased 5.9% year over year and 4.3% sequentially. |
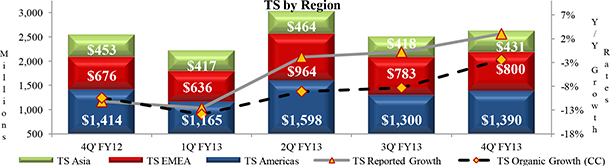
| | • | | TS’ reported revenue increased 3.0% year over year to $2.6 billion and on an organic basis revenue declined 2.4% with all three regions realizing negative organic growth. |
| | • | | TS’ revenue increased 4.7% sequentially and organic revenue increased 5.4% in constant dollars, which was within the normal seasonal range of +3% to +7%. |
| | • | | America’s organic revenue declined 2.5% year over year and increased 6.9% sequentially. |
| | • | | EMEA’s organic revenue declined 1.6% year over year in constant dollars and increased 3.3% sequentially in constant dollars. |
| | • | | Asia’s organic revenue declined 4.1% year over year and increased 3.0% sequentially. |
| | • | | Storage, services, and software grew year over year partially offset by declines in servers. |
3
| | |
| Avnet, Inc. Q4 & Fiscal Year 2013 | | |
$ in millions - except per share data August 07, 2013 | | |
G r o s s P r o f i t
| | | | | | | | | | | | | | | | | | | | | | | | |
| | | 4Q’ FY12 | | | 1Q’ FY13 | | | 2Q’ FY13 | | | 3Q’ FY13 | | | 4Q’ FY13 | | | Y/Y Change | |
Gross Profit | | $ | 759.0 | | | $ | 684.4 | | | $ | 768.5 | | | $ | 756.0 | | | $ | 770.9 | | | $ | 11.9 | |
Gross Profit Margin | | | 12.0 | % | | | 11.7 | % | | | 11.5 | % | | | 12.0 | % | | | 11.7 | % | | | (33 | ) bps |
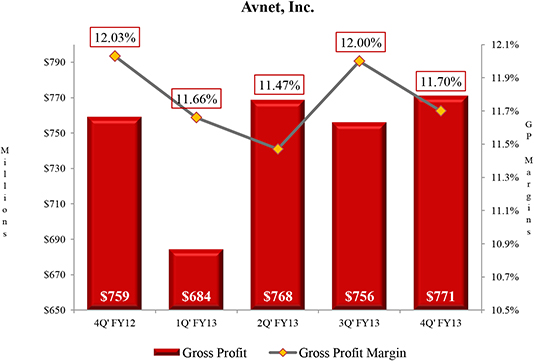
| | • | | Gross profit was $771 million, up 1.6% year over year and up 2.0% sequentially. |
| | • | | Gross profit margin of 11.7% was down 33 basis points from the year ago quarter and down 30 basis points sequentially with both operating groups contributing to the weakness. |
| | • | | EM gross profit margin decreased 34 basis points sequentially due to competitive pressure in the higher-margin western regions and declined 61 basis points year over year primarily due to a decline in the EMEA region driven by competitive pressures and a geographic mix shift as the lower gross profit margin Asia region grew from 34.1% of revenue to 36.7%. |
| | • | | TS gross profit margin decreased 25 basis points sequentially and was essentially flat year over year due to the net impact of the increases in the Americas region and declines in the EMEA region, which has been challenged with slower growth related to macroeconomic conditions. |
4
| | |
| Avnet, Inc. Q4 & Fiscal Year 2013 | | |
$ in millions - except per share data August 07, 2013 | | |
O p e r a t i n g E x p e n s e s
| | | | | | | | | | | | | | | | | | | | | | | | |
| | | 4Q’ FY12 | | | 1Q’ FY13 | | | 2Q’ FY13 | | | 3Q’ FY13 | | | 4Q’ FY13 | | | Y/Y Change | |
Selling, General and Adminstrative Expenses | | $ | 525.1 | | | $ | 547.0 | | | $ | 548.0 | | | $ | 561.1 | | | $ | 548.3 | | | $ | 23.2 | |
SG&A Expenses as a % of Gross Profit | | | 69.2 | % | | | 79.9 | % | | | 71.3 | % | | | 74.2 | % | | | 71.1 | % | | | 194 bps | |
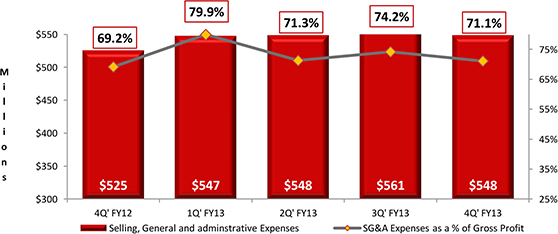
| | • | | Selling, general and administrative expenses (“SG&A expenses”) increased 4.4% year over year and decreased 2.3% sequentially to $548 million. |
| | • | | Even with an increase of approximately $292 million in additional revenue, operating expense declined $12.8 million sequentially. This sequential decline consisted of (i) an organic decrease of approximately $12.4 million related primarily to cost reduction actions, net of other items, (ii) a decrease of approximately $4.5 million due to the translation impact of changes in foreign currency exchange rates, offset by (iii) an increase of approximately $4.1 million due to operating expenses of acquired businesses. |
| | • | | The $23.2 million year-over-year increase consisted of (i) an increase of approximately $35.7 million due to operating expenses of acquired businesses, (ii) a net organic decrease of approximately $10.7 million as benefits from cost reduction actions more than offset increases due to inflation and other items, and (iii) a decrease of approximately $1.8 million due to the translation impact of changes in foreign currency exchange rates. |
5
| | |
| Avnet, Inc. Q4 & Fiscal Year 2013 | | |
$ in millions - except per share data August 07, 2013 | | |
O p e r a t i n g I n c o m e
| | | | | | | | | | | | | | | | | | | | | | | | |
| | | 4Q’ FY12 | | | 1Q’ FY13 | | | 2Q’ FY13 | | | 3Q’ FY13 | | | 4Q’ FY13 | | | Y/Y Chg | |
Avnet, Inc. GAAP Operating Income | | $ | 213.4 | | | $ | 100.0 | | | $ | 195.6 | | | $ | 167.6 | | | $ | 162.8 | | | ($ | 50.6 | ) |
Adjusted Operating Income (1) | | $ | 233.9 | | | $ | 137.4 | | | $ | 220.5 | | | $ | 195.0 | | | $ | 222.7 | | | ($ | 11.2 | ) |
Adjusted Operating Margin (1) | | | 3.71 | % | | | 2.34 | % | | | 3.29 | % | | | 3.10 | % | | | 3.38 | % | | | (33 | ) bps |
Electronics Marketing (EM) Total | | | | | | | | | | | | | | | | | | | | | | | | |
Operating Income | | $ | 191.1 | | | $ | 146.3 | | | $ | 140.1 | | | $ | 162.1 | | | $ | 175.4 | | | ($ | 15.7 | ) |
Operating Income Margin | | | 5.08 | % | | | 4.00 | % | | | 3.81 | % | | | 4.27 | % | | | 4.42 | % | | | (66 | ) bps |
Technology Solutions (TS) Total | | | | | | | | | | | | | | | | | | | | | | | | |
Operating Income | | $ | 67.5 | | | $ | 34.4 | | | $ | 108.0 | | | $ | 62.8 | | | $ | 73.3 | | | $ | 5.8 | |
Operating Income Margin | | | 2.65 | % | | | 1.55 | % | | | 3.57 | % | | | 2.51 | % | | | 2.80 | % | | | 15 bps | |
| (1) | A reconciliation of GAAP to non-GAAP financial measures is presented in the Non-GAAP Financial Information section at the end of this document. |
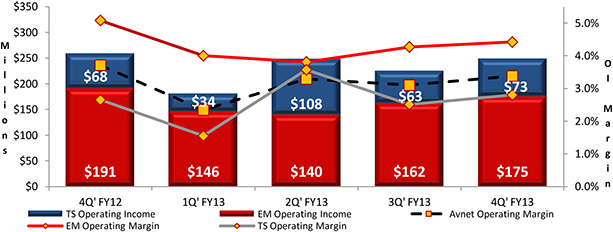
| | • | | Adjusted enterprise operating income of $222.7 million declined 4.8% year over year primarily due to lower EM profitability in the western regions. |
| | • | | Adjusted operating income margin of 3.4% declined 33 basis points year over year and increased 28 basis points sequentially with both operating groups contributing towards the gain. |
| | • | | EM operating income margin decreased 66 basis points year over year primarily due to a decline in the EMEA region related to the previously mentioned decline in gross profit margin. Operating income margin improved 15 basis points sequentially with increases in the Americas and Asia regions partially offset by a decline in the EMEA region. |
| | • | | TS operating income margin increased 15 basis points year over year as improvements in the Americas and Asia regions were somewhat offset by declines in EMEA. Operating income margin improved 29 basis points sequentially primarily driven by improvement in the Americas region and, to a lesser extent, the EMEA region. |
6
| | |
| Avnet, Inc. Q4 & Fiscal Year 2013 | | |
$ in millions - except per share data August 07, 2013 | | |
I n t e r e s t E x p e n s e , O t h e r I n c o m e a n d I n c o m e T a x e s
| | | | | | | | | | | | | | | | | | | | | | | | |
| | | 4Q’ FY12 | | | 1Q’ FY13 | | | 2Q’ FY13 | | | 3Q’ FY13 | | | 4Q’ FY13 | | | Y/Y Change | |
Interest Expense | | ($ | 23.2 | ) | | ($ | 23.9 | ) | | ($ | 27.8 | ) | | ($ | 27.3 | ) | | ($ | 28.6 | ) | | $ | 5.4 | |
Other Income (Expense) | | ($ | 4.1 | ) | | $ | 1.5 | | | $ | 1.1 | | | $ | 4.1 | | | ($ | 6.7 | ) | | ($ | 2.7 | ) |
GAAP Income Taxes | | $ | 52.6 | | | $ | 8.6 | | | $ | 31.4 | | | $ | 58.2 | | | $ | 1.0 | | | ($ | 51.6 | ) |
Adjusted Income Taxes (1) | | $ | 61.4 | | | $ | 31.0 | | | $ | 53.8 | | | $ | 46.4 | | | $ | 51.5 | | | ($ | 9.9 | ) |
GAAP Effective Tax Rate | | | 28.28 | % | | | 7.86 | % | | | 18.60 | % | | | 40.30 | % | | | 0.82 | % | | | (2,746 | ) bps |
Adjusted Effective Tax Rate (1) | | | 29.69 | % | | | 27.00 | % | | | 27.75 | % | | | 27.00 | % | | | 27.48 | % | | | (221 | ) bps |
| (1) | A reconciliation of GAAP to non-GAAP financial measures is presented in the Non-GAAP Financial Information section at the end of this document. |
| | • | | Interest expense for the June 2013 quarter was $28.6 million, up $5.4 million over the prior year quarter due to higher average debt outstanding and the impact of the November 2012 issuance of long-term senior notes that have a higher interest rate than the short-term debt they replaced. |
| | • | | The Company recognized $6.7 million of other expense in the June quarter related to foreign currency exchange losses and the net impact of other items. This compares with an expense of $4.1 million in the year ago quarter and a gain of $4.1 million in the March quarter. |
| | • | | The GAAP effective tax rate of 0.8% in the June quarter was primarily due to a net tax benefit of $34.2 million, which is comprised of (i) a tax benefit of $27.6 million for the release of tax valuation allowances against deferred tax assets that were determined to be realizable during the fourth quarter of fiscal 2013, and (ii) a tax benefit of $6.6 million primarily related to the release of existing reserves due to an audit settlement. |
7
| | |
| Avnet, Inc. Q4 & Fiscal Year 2013 | | |
$ in millions - except per share data August 07, 2013 | | |
N e t I n c o m e a n d E P S
| | | | | | | | | | | | | | | | | | | | | | | | |
| | | 4Q’ FY12 | | | 1Q’ FY13 | | | 2Q’ FY13 | | | 3Q’ FY13 | | | 4Q’ FY13 | | | Y/Y Change | |
GAAP Net Income | | $ | 133.4 | | | $ | 100.3 | | | $ | 137.5 | | | $ | 86.2 | | | $ | 126.1 | | | | -5.5 | % |
Adjusted Net Income (1) | | $ | 145.3 | | | $ | 83.9 | | | $ | 140.0 | | | $ | 125.4 | | | $ | 135.8 | | | | -6.5 | % |
GAAP EPS | | $ | 0.91 | | | $ | 0.70 | | | $ | 0.99 | | | $ | 0.62 | | | $ | 0.91 | | | | 0.0 | % |
Adjusted EPS (1) | | $ | 0.99 | | | $ | 0.59 | | | $ | 1.01 | | | $ | 0.90 | | | $ | 0.98 | | | | -1.0 | % |
| (1) | A reconciliation of GAAP to non-GAAP financial measures is presented in the Non-GAAP Financial Information section at the end of this document. |
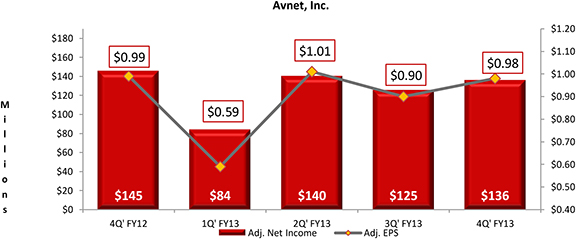
| | • | | GAAP net income declined 5.5% year over year to $126.1 million, or $0.91 per share on a diluted basis, and improved 46.3% sequentially primarily due to the factors noted above, including the impact of a lower effective tax rate, which was partially offset by higher restructuring integration and other charges. |
| | • | | Adjusted net income for the fourth quarter of 2013 was $135.8 million, or $0.98 per share on a diluted basis. |
| | • | | On an adjusted basis, sequential net income and diluted earnings per share increased 8.4% and 8.9%, respectively, due to higher profitability in both groups partially offset by the increase in other expense discussed above. |
| | • | | Adjusted earnings per share of $0.98 declined $0.01, or 1.0%, from the year ago quarter due to the factors noted above. |
8
| | |
| Avnet, Inc. Q4 & Fiscal Year 2013 | | |
$ in millions - except per share data August 07, 2013 | | |
W o r k i n g C a p i t a l
| | | | | | | | | | | | | | | | | | | | | | | | |
| | | 4Q’ FY12 | | | 1Q’ FY13 | | | 2Q’ FY13 | | | 3Q’ FY13 | | | 4Q’ FY13 | | | Y/Y Change | |
Account Receivable | | $ | 4,607.3 | | | $ | 4,477.9 | | | $ | 5,161.5 | | | $ | 4,778.1 | | | $ | 4,869.0 | | | $ | 261.7 | |
Inventory | | $ | 2,388.7 | | | $ | 2,360.5 | | | $ | 2,223.8 | | | $ | 2,284.7 | | | $ | 2,264.3 | | | ($ | 124.3 | ) |
Accounts Payable | | ($ | 3,230.8 | ) | | ($ | 2,920.6 | ) | | ($ | 3,565.4 | ) | | ($ | 3,175.5 | ) | | ($ | 3,278.1 | ) | | ($ | 47.4 | ) |
| | | | | | | | | | | | | | | | | | | | | | | | |
Working Capital | | $ | 3,765.2 | | | $ | 3,917.8 | | | $ | 3,819.9 | | | $ | 3,887.3 | | | $ | 3,855.2 | | | $ | 90.0 | |
| | | | | | | | | | | | | | | | | | | | | | | | |
Working Capital Velocity | | | 6.40 | | | | 6.20 | | | | 6.72 | | | | 6.46 | | | | 6.80 | | | | 0.40 | |
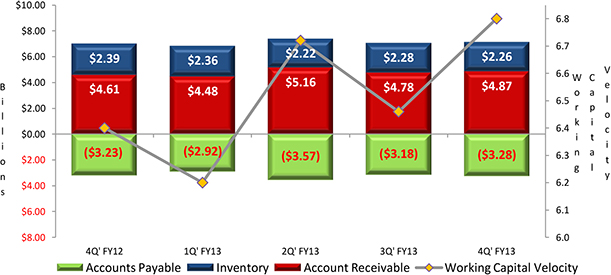
| | • | | Working capital (receivables plus inventory less accounts payable) decreased $32.2 million sequentially and decreased approximately $47.8 million when adjusted for acquisitions and the translation impact of changes in foreign currency exchange rates. |
| | • | | Working capital velocity improved 0.4 turns from the year ago quarter and 0.3 turns sequentially due to the growth in revenue and efficient working capital management. |
| | • | | EM improved working capital velocity both sequentially and year over year primarily due to a decrease in days of inventory of 6.0 days year over year and 2.0 days sequentially. |
| | • | | Inventory declined by 5.2% or $124.3 million year over year and decreased 10.1% when adjusted for acquisitions and the translation impact of changes in foreign currency exchange rates. |
9
| | |
| Avnet, Inc. Q4 & Fiscal Year 2013 | | |
$ in millions - except per share data August 07, 2013 | | |
R e t u r n s
| | | | | | | | | | | | | | | | | | | | | | | | |
| | | 4Q’ FY12 | | | 1Q’ FY13 | | | 2Q’ FY13 | | | 3Q’ FY13 | | | 4Q’ FY13 | | | Y/Y Change | |
Return on Working Capital (ROWC) (1) | | | 23.72 | % | | | 14.51 | % | | | 22.12 | % | | | 19.99 | % | | | 22.97 | % | | | (75 | ) bps |
Return on Capital Employed (ROCE) (1) | | | 12.54 | % | | | 7.81 | % | | | 11.85 | % | | | 10.54 | % | | | 12.08 | % | | | (46 | ) bps |
| (1) | A reconciliation of non-GAAP financial measures to GAAP financial measures is presented in the Non-GAAP Financial Information section at the end of this document. |
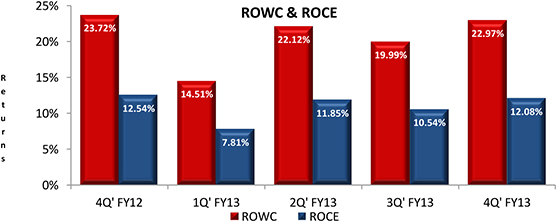
| | • | | ROWC for the quarter was 23.0%, a decrease of 75 basis points year over year but improved 298 basis points sequentially. |
| | • | | The year-over-year decrease was primarily due to lower returns at EM. At TS, ROWC increased 245 basis points year over year with all three regions contributing to this increase. |
| | • | | The sequential increase was primarily due to an improvement at both operating groups. |
| | • | | ROCE of 12.1% declined 46 basis points year over year but improved 154 basis points sequentially. |
10
| | |
| Avnet, Inc. Q4 & Fiscal Year 2013 | | |
$ in millions - except per share data August 07, 2013 | | |
C a s h F l o w
| | | | | | | | | | | | | | | | | | | | | | | | |
| | | 4Q’ FY12 | | | 1Q’ FY13 | | | 2Q’ FY13 | | | 3Q’ FY13 | | | 4Q’ FY13 | | | Y/Y Change | |
Net Income | | $ | 133.4 | | | $ | 100.3 | | | $ | 137.5 | | | $ | 86.2 | | | $ | 126.1 | | | ($ | 7.3 | ) |
Non-Cash Items | | $ | 39.8 | | | $ | 27.9 | | | $ | 57.6 | | | $ | 75.0 | | | $ | 35.0 | | | ($ | 4.8 | ) |
Working Capital | | $ | 86.1 | | | ($ | 47.2 | ) | | $ | 131.3 | | | ($ | 139.2 | ) | | $ | 105.7 | | | $ | 19.6 | |
| | | | | | | | | | | | | | | | | | | | | | | | |
Cash Flow from Operations | | $ | 259.3 | | | $ | 81.0 | | | $ | 326.4 | | | $ | 22.0 | | | $ | 266.8 | | | $ | 7.5 | |
| | | | | | | | | | | | | | | | | | | | | | | | |
TTM CF from Operations | | $ | 528.7 | | | $ | 813.8 | | | $ | 690.3 | | | $ | 688.7 | | | $ | 696.2 | | | $ | 167.5 | |
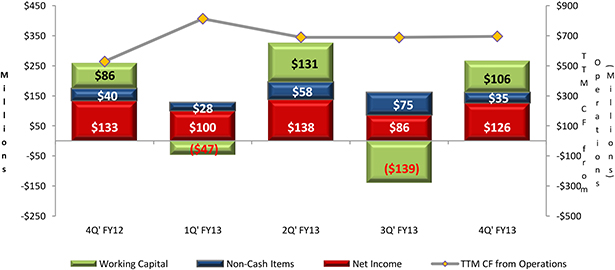
| | • | | During the fourth quarter of fiscal 2013, cash flow from operations was $266.8 million and for the fiscal year was $696.2 million. |
| | • | | Cash flow from operations was $266.8 million for the quarter driven primarily by net income adjusted for non-cash items and to a lesser extent a decrease in working capital, including accrued expenses. |
| | • | | The Company did not purchase any shares under the $750 million share repurchase program during the June quarter. As of the end of the quarter, the Company had approximately $225 million remaining in the program. |
| | • | | Cash and cash equivalents at the end of the quarter were $1.0 billion; net debt (total debt less cash and cash equivalents) was $1.04 billion. |
11
| | |
| Avnet, Inc. Q4 & Fiscal Year 2013 | | |
$ in millions - except per share data August 07, 2013 | | |
Reporting and Structural Changes for fiscal 2014
Amortization of Intangibles
Beginning in fiscal 2014, the Company will exclude the amortization of intangibles from adjusted results to be consistent with many technology companies. The table below summarizes the impact of these changes to Avnet’s adjusted results.
| | | | | | | | | | | | | | | | | | | | | | | | |
| | | | | | | | | Fiscal Year 2013 | | | | | | | |
| | | Q1’ FY13 | | | Q2’ FY13 | | | Q3’ FY13 | | | Q4’ FY13 | | | FY2013 | | | FY2014 | |
Impact of Amortization Change | | ($ in millions) | |
EM operating income | | $ | 2.8 | | | $ | 2.8 | | | $ | 3.0 | | | $ | 3.0 | | | $ | 11.6 | | | | 20% | |
TS operating income | | $ | 4.3 | | | $ | 5.2 | | | $ | 5.8 | | | $ | 5.5 | | | $ | 20.8 | | | | 80% | |
Avnet operating income | | $ | 7.1 | | | $ | 8.0 | | | $ | 8.8 | | | $ | 8.5 | | | $ | 32.4 | | | ~$ | 32.5 | |
Avnet net income* | | $ | 5.0 | | | $ | 5.6 | | | $ | 6.1 | | | $ | 6.0 | | | $ | 22.7 | | | | | |
Avnet earnings per share* | | $ | 0.03 | | | $ | 0.04 | | | $ | 0.05 | | | $ | 0.04 | | | $ | 0.16 | | | | | |
| * | Assumes an effective tax rate of 30%. |
Structural Changes
In fiscal 2014, the reverse logistics business, Avnet Integrated, will be combined with TS’ services offering into a new organization within TS called Avnet Services. This newly formed organization will execute a unified strategy focused on software, lifecycle and education services that complement existing solution sales and supplier’s service offerings. In addition, in fiscal 2014 the Company will combine its regional computing components businesses within EM and TS into a single global organization within TS called Avnet Global Computing Components. This combined global organization will focus on commercial hard disk drives, microprocessors and memory modules. As a result of these changes, revenue previously reported in EM will be consolidated within TS starting in fiscal 2014. The annual run rate of this revenue for fiscal 2014 is expected to be approximately $400 to $450 million.
These changes are factored into the guidance provided in the Company’s press release for the first quarter of fiscal 2014 and the Company will account for these changes when reporting Y/Y organic growth rates and changes in adjusted operating income.
12
| | |
| Avnet, Inc. Q4 & Fiscal Year 2013 | | |
$ in millions - except per share data August 07, 2013 | | |
CFO Review of Fiscal Year 2013 Results
| | | | | | | | | | | | |
| | | Fiscal Year Ended | |
| | | June 30, 2012 | | | June 29, 2013 | | | Net Chg | |
Sales | | $ | 25,707.5 | | | $ | 25,458.9 | | | ($ | 248.6 | ) |
Gross Profit | | $ | 3,050.6 | | | $ | 2,979.8 | | | ($ | 70.8 | ) |
GP Margin | | | 11.9 | % | | | 11.7 | % | | | (17 | ) bps |
SG&A Expenses | | $ | 2,092.8 | | | $ | 2,204.3 | | | $ | 111.5 | |
SG&A as % of Sales | | | 8.1 | % | | | 8.7 | % | | | 52 bps | |
SG&A as % of GP | | | 68.6 | % | | | 74.0 | % | | | 538 bps | |
GAAP Operating Income | | $ | 884.2 | | | $ | 626.0 | | | ($ | 258.2 | ) |
Adjusted Operating Income (1) | | $ | 957.8 | | | $ | 775.5 | | | ($ | 182.3 | ) |
Adjusted Operating Income Margin (1) | | | 3.7 | % | | | 3.0 | % | | | (68 | ) bps |
GAAP Net Income (Loss) | | $ | 567.0 | | | $ | 450.1 | | | ($ | 116.9 | ) |
Adjusted Net Income (1) | | $ | 607.9 | | | $ | 485.1 | | | ($ | 122.8 | ) |
GAAP Diluted EPS | | $ | 3.79 | | | $ | 3.21 | | | | -15.3 | % |
Adjusted EPS (1) | | $ | 4.06 | | | $ | 3.47 | | | | -14.5 | % |
Return on Working Capital (ROWC) (1) | | | 23.9 | % | | | 19.9 | % | | | (394 | ) bps |
Return on Capital Employed (ROCE) (1) | | | 12.9 | % | | | 10.6 | % | | | (230 | ) bps |
Working Capital Velocity | | | 6.41 | | | | 6.54 | | | | 0.13 | |
| (1) | A reconcilliation of non-GAAP financial measures is presented in the Non-GAAP Financial Information section at the end of this document. |
K e y H i g h l i g h t s
| | • | | For fiscal 2013, consolidated sales declined 1.0%, or $248.6 million to $25.5 billion, primarily due to weakness in the western regions at both operating groups due primarily to the global macroeconomic environment, partially offset by strength in Asia, which grew from 26.4% of enterprise revenue in fiscal 2012 to 29.3% in fiscal 2013. |
| | • | | Organic revenue declined 5.3% year over year due to slower growth in the western regions. Organic revenue in constant currency declined 4.2%; Americas declined 9.3%, EMEA declined 5.9%, and Asia increased 4.9%. |
| | • | | Weak organic revenue growth during the second half of fiscal 2012 carried into the first quarter of fiscal 2013 as weak demand in the higher-margin western regions resulted in a disappointing setback in profitability. In reaction to the slower than expected growth, both operating groups initiated portfolio actions to align resources with profitable growth opportunities and implemented cost reduction initiatives in parts of the business that were most impacted. Over the course of the fiscal year, the operating groups initiated a total of $140 million in annualized cost reductions. |
13
| | |
| Avnet, Inc. Q4 & Fiscal Year 2013 | | |
$ in millions - except per share data August 07, 2013 | | |
| | • | | Gross profit decreased 2.3% to $3.0 billion and gross profit margin decreased 17 basis points to 11.7%, as a modest improvement in TS was offset by a decline in EM due to higher mix of lower margin Asia revenue and competitive pressures most notably in the EMEA region. |
| | • | | Selling, general, and administrative expenses as a percentage of gross profit increased 538 basis points as benefits of the cost reduction activities initiated in fiscal 2013, which were not fully realized until the end of the year, were offset by the additional costs related to companies acquired in prior quarters and inflation. |
| | • | | Adjusted operating income at the enterprise level declined 19% to $775.5 million and operating income margin declined 68 basis points. |
| | • | | EM was down 90 basis points to 4.1% due to slower growth in the western regions. |
| | • | | TS was down 27 basis points to 2.7% due to the weakness in the EMEA region. |
| | • | | Adjusted diluted earnings per share (EPS) declined 14.5% to $3.47; roughly $0.05 of the decline can be attributed to the translation impact of changes in foreign currency exchange rates. EPS benefitted by approximately $0.23 as a result of the share repurchases during the fiscal year. |
| | • | | Cash flow from operations increased approximately 32% to $696 million, which supported the $262 million invested in value creating M&A and the $207 million used to repurchase shares. |
| | • | | ROCE for fiscal 2013 declined 230 basis points to 10.6% |
| | • | | Working capital velocity improved 0.13 turns, primarily due to an 8.3% improvement in inventory turns. |
14
| | |
| Avnet, Inc. Q4 & Fiscal Year 2013 | | |
$ in millions - except per share data August 07, 2013 | | |
Risk Factors
The discussion of Avnet’s business and operations should be read together with the Company’s filings with the Securities and Exchange Commission, including the risk factors and uncertainties discussed in the Company’s reports on Form 10-K, Form 10-Q and Form 8-K. These risks and uncertainties have the potential to affect Avnet’s business, financial condition, results of operations, cash flows, strategies or prospects in a material and adverse manner.
Forward-Looking Statements
This document contains certain “forward-looking statements” within the meaning of Section 27A of the Securities Act of 1933, as amended, and Section 21E of the Securities Exchange Act of 1934, as amended. These statements are based on management’s current expectations and are subject to uncertainty and changes in facts and circumstances. The forward-looking statements herein include statements addressing future financial and operating results of Avnet and may include words such as “will,” “anticipate,” “estimate,” “forecast,” “expect,” believe,” and “should,” and other words and terms of similar meaning in connection with any discussions of future operating or financial performance, business prospects or market conditions. Actual results may vary materially from the expectations contained in the forward-looking statements.
The following factors, among others, could cause actual results to differ materially from those described in the forward-looking statements: the Company’s ability to retain and grow market share and to generate additional cash flow, risks associated with any acquisition activities and the successful integration of acquired companies, declines in sales, changes in business conditions and the economy in general, changes in market demand and pricing pressures, any material changes in the allocation of product or product rebates by suppliers, and other competitive and/or regulatory factors affecting the businesses of Avnet generally.
More detailed information about these and other factors is set forth in Avnet’s filings with the Securities and Exchange Commission, including the Company’s reports on Form 10-K, Form 10-Q and Form 8-K. Except as required by law, Avnet is under no obligation to update any forward-looking statements, whether as a result of new information, future events or otherwise.
Non-GAAP Financial Information
In addition to disclosing financial results that are determined in accordance with generally accepted accounting principles in the United States (“GAAP”), the Company also discloses in this document certain non-GAAP financial information including adjusted operating income, adjusted net income and adjusted diluted earnings per share, as well as revenue adjusted for the impact of acquisitions and other items (as defined in the Organic Revenue section of this document). Management believes organic revenue is a useful measure for evaluating current period performance as compared with prior periods and for understanding underlying trends.
Management believes that operating income adjusted for restructuring, integration and other items is a useful measure to help investors better assess and understand the Company’s operating performance, especially when comparing results with previous periods or forecasting performance for future periods, primarily because management views the excluded items to be outside of Avnet’s normal operating results. Management analyzes operating income without the impact of these items as an indicator of ongoing margin performance and underlying trends in the business. Management also uses these non-GAAP measures to establish operational goals and, in some cases, for measuring performance for compensation purposes.
15
| | |
| Avnet, Inc. Q4 & Fiscal Year 2013 | | |
$ in millions - except per share data August 07, 2013 | | |
Management believes net income and EPS adjusted for the impact of the items described above is useful to investors because it provides a measure of the Company’s net profitability on a more comparable basis to historical periods and provides a more meaningful basis for forecasting future performance. Additionally, because of management’s focus on generating shareholder value, of which net profitability is a primary driver, management believes net income and EPS excluding the impact of these items provides an important measure of the Company’s net results of operations for the investing public.
Other metrics management monitors in its assessment of business performance include return on working capital (ROWC), return on capital employed (ROCE) and working capital velocity (WC velocity).
| | • | | ROWC is defined as annualized operating income, excluding restructuring, integration and other items, divided by the sum of the monthly average balances of receivables and inventory less accounts payable. |
| | • | | ROCE is defined as annualized, tax effected operating income, excluding restructuring, integration and other items, divided by the monthly average balances of interest-bearing debt and equity less cash and cash equivalents. |
| | • | | WC velocity is defined as annualized sales divided by the sum of the monthly average balances of receivable and inventory less accounts payable. |
Any analysis of results and outlook on a non-GAAP basis should be used as a complement to, and in conjunction with, data presented in accordance with GAAP.
Fiscal Year 2013
| | | | | | | | | | | | | | | | | | | | | | | | | | | | | | | | |
| | | Fourth Quarter Ended Fiscal 2013 | | | Fiscal Year Ended Fiscal 2013 | |
| | | Op Income | | | Pre-tax | | | Net Income | | | Diluted
EPS | | | Op Income | | | Pre-tax | | | Net Income | | | Diluted
EPS * | |
| | | $ in thousands, except per share data | |
GAAP results | | $ | 162,826 | | | $ | 127,139 | | | $ | 126,091 | | | $ | 0.91 | | | $ | 625,981 | | | $ | 549,265 | | | $ | 450,073 | | | $ | 3.21 | |
Restructuring, integration and other charges | | | 59,845 | | | | 59,845 | | | | 43,610 | | | | 0.31 | | | | 149,501 | | | | 149,501 | | | | 116,382 | | | $ | 0.83 | |
Gain on bargain purchase and other | | | — | | | | 339 | | | | 339 | | | | — | | | | — | | | | (31,011 | ) | | | (30,974 | ) | | | (0.22 | ) |
Net tax benefit | | | — | | | | — | | | | (34,197 | ) | | | (0.24 | ) | | | — | | | | — | | | | (50,376 | ) | | | (0.36 | ) |
| | | | | | | | | | | | | | | | | | | | | | | | | | | | | | | | |
Total adjustments | | | 59,845 | | | | 60,184 | | | | 9,752 | | | | 0.07 | | | | 149,501 | | | | 118,490 | | | | 35,032 | | | $ | 0.25 | |
| | | | | | | | | | | | | | | | | | | | | | | | | | | | | | | | |
Adjusted results | | $ | 222,671 | | | $ | 187,323 | | | $ | 135,843 | | | $ | 0.98 | | | $ | 775,482 | | | $ | 667,755 | | | $ | 485,105 | | | $ | 3.47 | |
| | | | | | | | | | | | | | | | | | | | | | | | | | | | | | | | |
| * | Does not foot due to rounding of individual components. |
Items impacting the fourth quarter of 2013 consisted of the following:
| | • | | restructuring, integration and other charges of $59.8 million pre-tax related to cost reduction actions initiated during the fourth quarter and acquisition and integration charges associated with acquired businesses. |
| | • | | a small adjustment to the gain on bargain purchase related to the business in Japan acquired in the first quarter; and |
| | • | | a net tax benefit of $34.2 million, which is comprised of (i) a tax benefit of $27.6 million for the release of tax valuation allowances against deferred tax assets that were determined to be realizable during the fourth quarter of fiscal 2013, and (ii) a tax benefit of $6.6 million related to the release of existing reserves due to audit settlement and statute expiration |
16
| | |
| Avnet, Inc. Q4 & Fiscal Year 2013 | | |
$ in millions - except per share data August 07, 2013 | | |
Items impacting the full fiscal year 2013 consisted of the following:
| • | | restructuring, integration and other charges of $149.5 million pre-tax, which included a (i) loss of $8.8 million in integration-related costs due to the exit from two multi-employer pension plan associated with acquired entities in Japan, (ii) a credit of $11.2 million in acquisition charges related to the reversal of an earn-out liability, and (iii) $6.6 million in other restructuring charges related to the write-down of the net assets and goodwill associated with the exit of a non-integrated business in the EM Americas region; |
| • | | a gain on bargain purchase of $32.7 million related to the acquisition of a Japanese entity, partially offset by a loss on divestiture of $1.7 million related to a small business in TS Asia; and |
| • | | a net tax benefit of $50.4 million, which is comprised of (i) a net tax benefit of $17.2 million for the release of valuation allowances against deferred tax assets that were determined to be realizable, and (ii) net favorable audit settlements of $33.2 million. |
Fiscal Year 2012
| | | | | | | | | | | | | | | | | | | | | | | | | | | | | | | | |
| | | Fourth Quarter Ended Fiscal 2012 | | | Fiscal Year Ended Fiscal 2012 | |
| | | Op Income | | | Pre-tax | | | Net Income | | | Diluted
EPS | | | Op Income | | | Pre-tax | | | Net Income | | | Diluted
EPS | |
| | | $ in thousands, except per share data | |
GAAP results | | $ | 213,438 | | | $ | 186,004 | | | $ | 133,404 | | | $ | 0.91 | | | $ | 884,165 | | | $ | 790,782 | | | $ | 567,019 | | | $ | 3.79 | |
Restructuring, integration and other charges | | | 20,471 | | | | 20,471 | | | | 15,708 | | | | 0.11 | | | | 73,585 | | | | 73,585 | | | | 52,963 | | | | 0.35 | |
Gain on bargain purchase and other | | | — | | | | 143 | | | | 143 | | | | — | | | | — | | | | (2,918 | ) | | | (3,463 | ) | | | (0.02 | ) |
Net tax benefit | | | — | | | | — | | | | (3,987 | ) | | | (0.03 | ) | | | — | | | | — | | | | (8,616 | ) | | | (0.06 | ) |
| | | | | | | | | | | | | | | | | | | | | | | | | | | | | | | | |
Total adjustments | | | 20,471 | | | | 20,614 | | | | 11,864 | | | | 0.08 | | | | 73,585 | | | | 70,667 | | | | 40,884 | | | | 0.27 | |
| | | | | | | | | | | | | | | | | | | | | | | | | | | | | | | | |
Adjusted results | | $ | 233,909 | | | $ | 206,618 | | | $ | 145,268 | | | $ | 0.99 | | | $ | 957,750 | | | $ | 861,449 | | | $ | 607,903 | | | $ | 4.06 | |
| | | | | | | | | | | | | | | | | | | | | | | | | | | | | | | | |
Items impacting the fourth quarter of 2012 consisted of the following:
| | • | | restructuring, integration and other charges of $20.5 million pre-tax, which included $6.7 million of other charges related to legal claims; |
| | • | | a small adjustment to the gain on bargain purchase related to the business in Japan acquired in the third quarter; and |
| | • | | a net tax benefit of $4.0 million, which is comprised of (i) a tax benefit of $26.3 million for the release of tax reserves against deferred tax assets that were determined to be realizable during the fourth quarter of fiscal 2012, partially offset by (ii) a tax provision of $22.3 million primarily related to the impact of withholding tax related to legal entity reorganizations and the establishment of tax reserves against deferred tax assets that were determined to be unrealizable during the fourth quarter of fiscal 2012. |
Items impacting the full fiscal year 2012 consisted of the following:
| | • | | restructuring, integration and other charges of $73.6 million pre-tax, which included $6.7 million of other charges related to legal claims; |
| | • | | a gain on bargain purchase and other of $2.9 million pre-tax related to the business in Japan acquired in the third quarter; and |
| | • | | a net tax benefit of $8.6 million, which is comprised of (i) a tax benefit of $30.8 million for the release of tax reserves against deferred tax assets that were determined to be realizable, partially offset by (ii) a tax provision of $22.2 million related to changes to existing tax positions, withholding tax related to legal entity reorganizations and the establishment of tax reserves against certain deferred tax assets partially offset by net favorable audit settlements. |
17
| | |
| Avnet, Inc. Q4 & Fiscal Year 2013 | | |
$ in millions - except per share data August 07, 2013 | | |
Organic Revenue
Organic revenue is defined as reported revenue adjusted for: (i) the impact of acquisitions by adjusting Avnet’s prior periods to include the sales of businesses acquired as if the acquisitions had occurred at the beginning of fiscal 2012; (ii) the impact of two small divestitures by adjusting Avnet’s prior periods to exclude the sales of the business divested as if the divestiture had occurred at the beginning of fiscal 2012; and (iii) the impact of the transfer of a business unit from TS Americas to EM Americas that was completed at the beginning of fiscal 2013. Sales, taking into account the combination of these adjustments, are referred to as “organic sales.”
| | | | | | | | | | | | |
| | | | | | Acquisition / | | | | |
| | | Revenue
as Reported | | | Divested
Revenue | | | Pro forma
Revenue | |
| | | (in thousands) | |
Q1 Fiscal 2013 | | $ | 5,870,057 | | | $ | 242,534 | | | $ | 6,112,591 | |
Q2 Fiscal 2013 | | | 6,699,465 | | | | 42,529 | | | | 6,741,994 | |
Q3 Fiscal 2013 | | | 6,298,699 | | | | 17,749 | | | | 6,316,448 | |
Q4 Fiscal 2013 | | | 6,590,703 | | | | (634 | ) | | | 6,590,069 | |
| | | | | | | | | | | | |
Fiscal year 2013 | | $ | 25,458,924 | | | $ | 302,178 | | | $ | 25,761,102 | |
| | | | | | | | | | | | |
| | | |
Q1 Fiscal 2012 | | $ | 6,426,006 | | | $ | 438,155 | | | $ | 6,864,161 | |
Q2 Fiscal 2012 | | | 6,693,572 | | | | 442,505 | | | | 7,136,077 | |
Q3 Fiscal 2012 | | | 6,280,557 | | | | 347,236 | | | | 6,627,793 | |
Q4 Fiscal 2012 | | | 6,307,386 | | | | 268,989 | | | | 6,576,375 | |
| | | | | | | | | | | | |
Fiscal year 2012 | | $ | 25,707,521 | | | $ | 1,496,885 | | | $ | 27,204,406 | |
| | | | | | | | | | | | |
18
| | |
| Avnet, Inc. Q4 & Fiscal Year 2013 | | |
$ in millions - except per share data August 07, 2013 | | |
“Acquisition Revenue” as presented in the preceding table includes the acquisitions listed below.
| | | | | | |
Acquired Business | | Operating
Group | | Acquisition
Date | |
Amosdec | | TS | | | Jul-11 | |
Prospect Technology | | EM | | | Aug-11 | |
JC Tally Trading & subsidiary | | EM | | | Aug-11 | |
DE2 | | EM | | | Nov-11 | |
Round2 Tech | | EM | | | Jan-12 | |
Unidux Electronics Limited (Singapore) | | EM | | | Jan-12 | |
Canvas Systems | | TS | | | Jan-12 | |
Pinnacle Data Systems | | EM | | | Jan-12 | |
Acquisition of controlling interest in a non-wholly owned entity | | EM | | | Jan-12 | |
Nexicore Services | | EM | | | Apr-12 | |
Ascendant Technology | | TS | | | Apr-12 | |
Altron GmbH & Co KG | | EM | | | Jul-12 | |
Mattelli Limited | | TS | | | Jul-12 | |
Pepperweed Consulting | | TS | | | Aug-12 | |
C.R.G. Electronics, Ltd. | | EM | | | Aug-12 | |
Internix, Inc. | | EM | | | Aug-12 | |
Tekdata Interconnections, Limited | | EM | | | Oct-12 | |
Magirus AG | | TS | | | Oct-12 | |
Brightstar Partners, Inc. | | TS | | | Nov-12 | |
Genilogix | | TS | | | Nov-12 | |
Universal Semiconductor, Inc. | | EM | | | Dec-12 | |
TSSLink, Inc. | | TS | | | Dec-12 | |
RTI Holdings | | EM | | | Apr-13 | |
19
| | |
| Avnet, Inc. Q4 & Fiscal Year 2013 | | |
$ in millions - except per share data August 07, 2013 | | |
ROWC, ROCE and WC Velocity
The following table presents the calculation for ROWC, ROCE and WC velocity.
| | | | | | | | | | | | | | | | |
| | | | | | Q4 FY 13 | | | Q4 FY 12 | | | 12M FY 13 | |
Sales | | | | | | | 6,590,703 | | | | 6,307,386 | | | | 25,458,924 | |
Sales, annualized | | | (a | ) | | | 26,362,812 | | | | 25,229,543 | | | | 25,458,924 | |
Adjusted operating income (1) | | | | | | | 222,671 | | | | 233,910 | | | | 775,482 | |
Adjusted operating income, annualized | | | (b | ) | | | 890,684 | | | | 935,639 | | | | 775,482 | |
Adjusted effective tax rate (2) | | | | | | | 27.35 | % | | | 29.43 | % | | | 27.35 | % |
Adjusted operating income, net after tax | | | (c | ) | | | 647,082 | | | | 660,281 | | | | 563,387 | |
Average monthly working capital | | | | | | | | | | | | | | | | |
Accounts receivable | | | | | | | 4,664,011 | | | | 4,517,821 | | | | 4,579,074 | |
Inventory | | | | | | | 2,353,662 | | | | 2,502,535 | | | | 2,392,535 | |
Accounts payable | | | | | | | (3,139,471 | ) | | | (3,076,214 | ) | | | (3,080,372 | ) |
| | | | | | | | | | | | | | | | |
Average working capital | | | (d | ) | | | 3,878,202 | | | | 3,944,142 | | | | 3,891,237 | |
| | | | | | | | | | | | | | | | |
Average monthly total capital | | | (e | ) | | | 5,356,288 | | | | 5,266,810 | | | | 5,313,705 | |
| | | | | | | | | | | | | | | | |
ROWC = (b) / (d) | | | | | | | 22.97 | % | | | 23.72 | % | | | 19.93 | % |
WC Velocity = (a) / (d) | | | | | | | 6.80 | | | | 6.40 | | | | 6.54 | |
ROCE = (c ) / (e) | | | | | | | 12.08 | % | | | 12.54 | % | | | 10.60 | % |
| | (1) | See reconciliation to GAAP amounts in the preceding tables in this Non-GAAP Financial Information Section. |
| | (2) | Adjusted effective tax rate is based upon a year-to-date calculation excluding restructuring, integration and other charges and tax adjustments as described in the reconcilation to GAAP amounts in this Non-GAAP Financial Information Section. |
20