UNITED STATES
SECURITIES AND EXCHANGE COMMISSION
Washington, D.C. 20549
FORM N-CSR
CERTIFIED SHAREHOLDER REPORT OF REGISTERED
MANAGEMENT INVESTMENT COMPANIES
Investment Company Act file number 811-06629
Western Asset Managed Municipals Fund Inc.
(Exact name of registrant as specified in charter)
620 Eighth Avenue, 47th Floor, New York, NY 10018
(Address of principal executive offices) (Zip code)
George P Hoyt
Franklin Templeton
100 First Stamford Place
Stamford, CT 06902
(Name and address of agent for service)
Registrant’s telephone number, including area code: 1-888-777-0102
Date of fiscal year end: May 31
Date of reporting period: November 30, 2022
| ITEM 1. | REPORT TO STOCKHOLDERS. |
The Semi-Annual Report to Stockholders is filed herewith.

| | |
| Semi-Annual Report | | November 30, 2022 |
WESTERN ASSET
MANAGED MUNICIPALS
FUND INC. (MMU)

|
| INVESTMENT PRODUCTS: NOT FDIC INSURED • NO BANK GUARANTEE • MAY LOSE VALUE |
Fund objective
The Fund’s investment objective is to seek as high a level of current income exempt from federal income tax* as is consistent with preservation of capital.
When pursuing its investment objective, the Fund seeks to maximize current income exempt from federal income tax as is consistent with preservation of principal.
The Fund seeks to achieve its objective by investing primarily in long-term investment grade municipal debt securities issued by state and local governments, political subdivisions, agencies and public authorities (municipal obligations). Under normal market conditions, the Fund will invest at least 80% of its total assets in municipal obligations rated investment grade at the time of investment.
| * | Certain investors may be subject to the federal alternative minimum tax (“AMT”), and state and local taxes will apply. Capital gains, if any, are fully taxable. Please consult your personal tax or legal adviser. |
| | |
| II | | Western Asset Managed Municipals Fund Inc. |
Letter from the chairman

Dear Shareholder,
We are pleased to provide the semi-annual report of Western Asset Managed Municipals Fund Inc. for the six-month reporting period ended November 30, 2022. Please read on for Fund performance information during the Fund’s reporting period.
As always, we remain committed to providing you with excellent service and a full spectrum of investment choices. We also remain committed to supplementing the support you receive from your financial advisor. One way we accomplish this is through our website, www.franklintempleton.com. Here you can gain immediate access to market and investment information, including:
| • | | Fund prices and performance, |
| • | | Market insights and commentaries from our portfolio managers, and |
| • | | A host of educational resources. |
We look forward to helping you meet your financial goals.
Sincerely,

Jane Trust, CFA
Chairman, President and Chief Executive Officer
December 30, 2022
| | | | |
| Western Asset Managed Municipals Fund Inc. | | | | III |
Performance review
For the six months ended November 30, 2022, Western Asset Managed Municipals Fund Inc. returned -4.38% based on its net asset value (“NAV”)i and -3.14% based on its New York Stock Exchange (“NYSE”) market price per share. The Fund’s unmanaged benchmark, the Bloomberg Municipal Bond Indexii, returned -1.43% for the same period. The Lipper General & Insured Municipal Debt (Leveraged) Closed-End Funds Category Averageiii returned -5.15% over the same time frame. Please note that Lipper performance returns are based on each fund’s NAV.
The Fund has a practice of seeking to maintain a relatively stable level of distributions to shareholders. This practice has no impact on the Fund’s investment strategy and may reduce the Fund’s NAV. The Fund’s manager believes the practice helps maintain the Fund’s competitiveness and may benefit the Fund’s market price and premium/discount to the Fund’s NAV.
Certain investors may be subject to the federal alternative minimum tax, and state and local taxes will apply. Capital gains, if any, are fully taxable. Please consult your personal tax or legal adviser.
During this six-month period, the Fund made distributions to shareholders totaling $0.23 per share. As of November 30, 2022, the Fund estimates that 91% of the distributions were sourced from net investment income and 9% constituted a return of capital.* The performance table shows the Fund’s six-month total return based on its NAV and market price as of November 30, 2022. Past performance is no guarantee of future results.
| | | | |
Performance Snapshot as of November 30, 2022 (unaudited) | |
| Price Per Share | | 6-Month
Total Return† | |
| $11.43 (NAV) | | | -4.38 | %‡ |
| $10.54 (Market Price) | | | -3.14 | %‡‡ |
All figures represent past performance and are not a guarantee of future results. Performance figures for periods shorter than one year represent cumulative figures and are not annualized.
† Total returns are based on changes in NAV or market price, respectively. Returns reflect the deduction of all Fund expenses, including management fees, operating expenses, and other Fund expenses. Returns do not reflect the deduction of brokerage commissions or taxes that investors may pay on distributions or the sale of shares.
‡ Total return assumes the reinvestment of all distributions, including returns of capital, if any, at NAV.
‡‡ Total return assumes the reinvestment of all distributions, including returns of capital, if any, in additional shares in accordance with the Fund’s Dividend Reinvestment Plan.
| * | These estimates are not for tax purposes. The Fund will issue a Form 1099 with final composition of the distributions for tax purposes after year-end. A return of capital is not taxable and results in a reduction in the tax basis of a shareholder’s investment. For more information about a distribution’s composition, please refer to the Fund’s distribution press release or, if applicable, the Section 19 notice located in the press release section of our website, www.franklintempleton.com. |
| | | | |
IV | | | | Western Asset Managed Municipals Fund Inc. |
Performance review (cont’d)
Looking for additional information?
The Fund is traded under the symbol “MMU” and its closing market price is available in most newspapers under the NYSE listings. The daily NAV is available online under the symbol “XMMUX” on most financial websites. Barron’s and The Wall Street Journal’s Monday edition both carry closed-end fund tables that provide additional information. In addition, the Fund issues a quarterly press release that can be found on most major financial websites as well as www.franklintempleton.com.
In a continuing effort to provide information concerning the Fund, shareholders may call 1-888-777-0102 (toll free), Monday through Friday from 8:00 a.m. to 5:30 p.m. Eastern Time, for the Fund’s current NAV, market price and other information.
Thank you for your investment in Western Asset Managed Municipals Fund Inc. As always, we appreciate that you have chosen us to manage your assets and we remain focused on achieving the Fund’s investment goals.
Sincerely,
Jane Trust, CFA
Chairman, President and Chief Executive Officer
December 30, 2022
RISKS: The Fund is a non-diversified, closed-end management investment company designed primarily as a long-term investment and not as a trading vehicle. The Fund is not intended to be a complete investment program and, due to the uncertainty inherent in all investments, there can be no assurance that the Fund will achieve its investment objective. The Fund’s common stock is traded on the New York Stock Exchange. Similar to stocks, the Fund’s share price will fluctuate with market conditions and, at the time of sale, may be worth more or less than the original investment. Shares of closed-end funds often trade at a discount to their net asset value. Because the Fund is non-diversified, it may be more susceptible to economic, political or regulatory events than a diversified fund. The Fund’s investments are subject to a number of risks, including interest rate risk, credit risk, leveraging risk and management risk. As interest rates rise, the price of fixed income investments declines. Lower rated, higher-yielding bonds, known as “high yield” or “junk” bonds, are subject to greater liquidity and credit risk than higher-rated investment grade securities. Municipal securities purchased by the Fund may be adversely affected by changes in the financial condition of municipal issuers and insurers, regulatory and political developments, uncertainties and public perceptions, and other factors. The Fund may make significant investments in derivative instruments. Derivative instruments can be illiquid, may disproportionately increase losses and could have a potentially large impact on Fund performance. The Fund may enter into tender option bond (“TOB”) transactions, which expose
| | | | |
| Western Asset Managed Municipals Fund Inc. | | | | V |
the Fund to leverage and credit risk, and generally involve greater risk than investments in fixed rate municipal bonds, including the risk of loss of principal. The interest payments that the Fund would typically receive on inverse floaters acquired in such transactions vary inversely with short-term interest rates and will be reduced (and potentially eliminated) when short-term interest rates increase. Inverse floaters will generally underperform the market for fixed rate municipal securities when interest rates rise. The value and market for inverse floaters can be volatile, and inverse floaters can have limited liquidity. Investments in inverse floaters issued in TOB transactions are derivative instruments and, therefore, are also subject to the risks generally applicable to investments in derivatives. The Fund may invest in securities of other investment companies. To the extent it does, Fund stockholders will indirectly pay a portion of the operating costs of such companies, in addition to the expenses that the Fund bears directly in connection with its own operations. Investing in securities issued by other investment companies, including exchange-traded funds (“ETFs”) that invest primarily in municipal securities, involves risks similar to those of investing directly in the securities in which those investment companies invest. To the extent the Fund invests in securities of other investment companies, Fund stockholders will indirectly pay a portion of the operating costs of such companies, in addition to the expenses that the Fund bears directly in connection with its own operation. Leverage may result in greater volatility of NAV and market price of common shares and increases a shareholder’s risk of loss. The Fund may also invest in money market funds, including funds affiliated with the Fund’s manager and subadviser.
All investments are subject to risk including the possible loss of principal. Past performance is no guarantee of future results. All index performance reflects no deduction for fees, expenses or taxes. Please note that an investor cannot invest directly in an index.
| i | Net asset value (“NAV”) is calculated by subtracting total liabilities, including liabilities associated with financial leverage (if any), from the closing value of all securities held by the Fund (plus all other assets) and dividing the result (total net assets) by the total number of the common shares outstanding. The NAV fluctuates with changes in the market prices of securities in which the Fund has invested. However, the price at which an investor may buy or sell shares of the Fund is the Fund’s market price as determined by supply of and demand for the Fund’s shares. |
| ii | The Bloomberg Municipal Bond Index is a market value weighted index of investment grade municipal bonds with maturities of one year or more. |
| iii | Lipper, Inc., a wholly-owned subsidiary of Refinitiv, provides independent insight on global collective investments. Returns are based on the six-month period ended November 30, 2022, including the reinvestment of all distributions, including returns of capital, if any, calculated among the 58 funds in the Fund’s Lipper category. |
| | | | |
VI | | | | Western Asset Managed Municipals Fund Inc. |
Fund at a glance† (unaudited)
Investment breakdown (%) as a percent of total investments
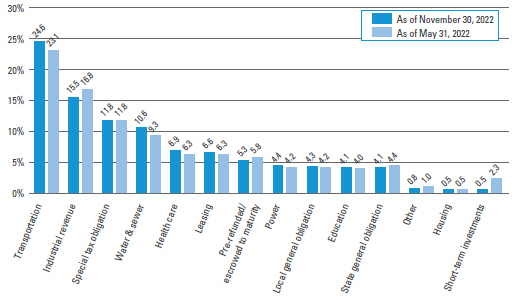
| † | The bar graph above represents the composition of the Fund’s investments as of November 30, 2022 and May 31, 2022. The Fund is actively managed. As a result, the composition of the Fund’s investments is subject to change at any time. |
| | | | |
| Western Asset Managed Municipals Fund Inc. 2022 Semi-Annual Report | | | | 1 |
Schedule of investments (unaudited)
November 30, 2022
Western Asset Managed Municipals Fund Inc.
(Percentages shown based on Fund net assets)
| | | | | | | | | | | | | | | | |
| Security | | Rate | | | Maturity
Date | | | Face Amount | | | Value | |
| Municipal Bonds — 146.5% | | | | | | | | | | | | | | | | |
Alabama — 8.1% | | | | | | | | | | | | | | | | |
Alabama State Corrections Institution Finance Authority Revenue, Series A | | | 5.250 | % | | | 7/1/52 | | | $ | 2,600,000 | | | $ | 2,797,375 | |
Black Belt Energy Gas District, Gas Project Revenue Bonds, Project #6, Series B | | | 4.000 | % | | | 12/1/26 | | | | 560,000 | | | | 554,588 | (a)(b) |
Hoover, AL, IDA Revenue, United States Steel Corp. Project, Series 2019 | | | 5.750 | % | | | 10/1/49 | | | | 700,000 | | | | 732,068 | (c) |
Jefferson County, AL, Sewer Revenue: | | | | | | | | | | | | | | | | |
Convertible CAB, Subordinated Lien, Warrants, Step bond, Series F, Refunding (0.000% to 10/1/23 then 7.900%) | | | 0.000 | % | | | 10/1/50 | | | | 11,580,000 | | | | 11,801,587 | |
Senior Lien, Warrants, Series A, Refunding, AGM | | | 5.500 | % | | | 10/1/53 | | | | 1,400,000 | | | | 1,446,623 | |
Subordinated Lien, Warrants, Series D, Refunding | | | 6.000 | % | | | 10/1/42 | | | | 9,230,000 | | | | 9,873,996 | |
Subordinated Lien, Warrants, Series D, Refunding | | | 6.500 | % | | | 10/1/53 | | | | 6,900,000 | | | | 7,400,043 | |
Southeast Alabama Gas Supply District, Gas Supply Revenue, Project #2, Series A | | | 4.000 | % | | | 6/1/24 | | | | 5,690,000 | | | | 5,680,964 | (a)(b) |
Total Alabama | | | | | | | | | | | | | | | 40,287,244 | |
Alaska — 0.8% | | | | | | | | | | | | | | | | |
Alaska State Housing Finance Corp. Revenue, State Capital Project II, Series B | | | 5.000 | % | | | 12/1/38 | | | | 750,000 | | | | 806,734 | |
Anchorage, AK, Port Revenue, Series A | | | 5.000 | % | | | 12/1/50 | | | | 1,000,000 | | | | 1,010,194 | (c) |
Northern Tobacco Securitization Corp., AK, Tobacco Settlement Revenue: | | | | | | | | | | | | | | | | |
Asset Backed Senior Bonds, Class 1, Series A, Refunding | | | 4.000 | % | | | 6/1/50 | | | | 500,000 | | | | 426,382 | |
Asset Backed Senior Bonds, Series A, Class 1, Refunding | | | 4.000 | % | | | 6/1/41 | | | | 1,690,000 | | | | 1,540,413 | |
Total Alaska | | | | | | | | | | | | | | | 3,783,723 | |
Arizona — 5.0% | | | | | | | | | | | | | | | | |
Arizona State IDA, Education Revenue, Basis School Project, Credit Enhanced, Series F, Refunding, SD Credit Program | | | 5.000 | % | | | 7/1/52 | | | | 725,000 | | | | 738,461 | |
Chandler, AZ, IDA Revenue, Intel Corp. Project | | | 5.000 | % | | | 6/3/24 | | | | 4,120,000 | | | | 4,180,820 | (a)(b)(c) |
Navajo Nation, AZ, Revenue, Series A, Refunding | | | 5.500 | % | | | 12/1/30 | | | | 950,000 | | | | 993,719 | (d) |
Queen Creek, AZ, Excise Tax & State Shared Revenue, Series A | | | 5.000 | % | | | 8/1/42 | | | | 750,000 | | | | 805,349 | |
See Notes to Financial Statements.
| | | | |
2 | | | | Western Asset Managed Municipals Fund Inc. 2022 Semi-Annual Report |
Western Asset Managed Municipals Fund Inc.
(Percentages shown based on Fund net assets)
| | | | | | | | | | | | | | | | |
| Security | | Rate | | | Maturity
Date | | | Face
Amount | | | Value | |
Arizona — continued | | | | | | | | | | | | | | | | |
Salt Verde, AZ, Financial Corp., Natural Gas Revenue: | | | | | | | | | | | | | | | | |
Series 2007 | | | 5.250 | % | | | 12/1/28 | | | $ | 2,000,000 | | | $ | 2,109,414 | |
Series 2007 | | | 5.000 | % | | | 12/1/32 | | | | 10,000,000 | | | | 10,501,830 | |
Series 2007 | | | 5.000 | % | | | 12/1/37 | | | | 5,500,000 | | | | 5,692,552 | |
Total Arizona | | | | | | | | | | | | | | | 25,022,145 | |
California — 19.2% | | | | | | | | | | | | | | | | |
Alameda, CA, Corridor Transportation Authority Revenue: | | | | | | | | | | | | | | | | |
Convertible CAB, Series C, Refunding, AGM | | | 5.000 | % | | | 10/1/52 | | | | 2,050,000 | | | | 2,156,298 | |
Second Subordinated Lien, Series B, Refunding | | | 5.000 | % | | | 10/1/34 | | | | 1,750,000 | | | | 1,801,070 | |
Anaheim, CA, Public Financing Authority Lease Revenue, Series A, Refunding | | | 5.000 | % | | | 5/1/46 | | | | 2,000,000 | | | | 2,069,717 | (e) |
Bay Area Toll Authority, CA, Toll Bridge Revenue, San Francisco Bay Area, Series B-1 (SIFMA Municipal Swap Index Yield + 1.100%) | | | 3.000 | % | | | 4/1/24 | | | | 5,500,000 | | | | 5,541,857 | (a)(b) |
California State Community Choice Financing Authority Revenue, Clean Energy Project, Green Bonds, Series A-1 | | | 4.000 | % | | | 8/1/28 | | | | 700,000 | | | | 700,128 | (a)(b) |
California State Health Facilities Financing Authority Revenue, Lucile Salter Packard Children’s Hospital at Stanford | | | 5.000 | % | | | 11/15/56 | | | | 500,000 | | | | 514,207 | |
California State MFA Revenue, Senior Lien, LINXS APM Project, Series A | | | 5.000 | % | | | 12/31/43 | | | | 3,400,000 | | | | 3,438,954 | (c) |
California State PCFA Water Furnishing Revenue, Poseidon Resources Desalination Project | | | 5.000 | % | | | 11/21/45 | | | | 12,500,000 | | | | 11,861,887 | (c)(d) |
California State, GO, Various Purpose, Refunding | | | 4.000 | % | | | 11/1/36 | | | | 1,000,000 | | | | 1,031,411 | |
California Statewide CDA Revenue, Provident Group-Pomona Properties LLC, Series A | | | 5.750 | % | | | 1/15/45 | | | | 1,770,000 | | | | 1,758,917 | (d) |
California Statewide CDA, Community Improvement Authority Revenue, Renaissance at City Center, Series A | | | 5.000 | % | | | 7/1/51 | | | | 750,000 | | | | 677,313 | |
Chino Valley, CA, USD, GO, Series B | | | 5.000 | % | | | 8/1/55 | | | | 1,250,000 | | | | 1,338,089 | |
Inland Valley, CA, Development Agency, Successor Agency Tax Allocation Revenue, Series A, Refunding | | | 5.000 | % | | | 9/1/44 | | | | 2,405,000 | | | | 2,435,881 | |
See Notes to Financial Statements.
| | | | |
| Western Asset Managed Municipals Fund Inc. 2022 Semi-Annual Report | | | | 3 |
Schedule of investments (unaudited) (cont’d)
November 30, 2022
Western Asset Managed Municipals Fund Inc.
(Percentages shown based on Fund net assets)
| | | | | | | | | | | | | | | | |
| Security | | Rate | | | Maturity
Date | | | Face
Amount | | | Value | |
California — continued | | | | | | | | | | | | | | | | |
Los Angeles, CA, Department of Airports Revenue: | | | | | | | | | | | | | | | | |
Los Angeles International Airport, Subordinated, Series C, Refunding | | | 4.000 | % | | | 5/15/36 | | | $ | 800,000 | | | $ | 781,164 | (c) |
Los Angeles International Airport, Subordinated, Series C, Refunding | | | 4.000 | % | | | 5/15/37 | | | | 500,000 | | | | 484,353 | (c) |
Los Angeles International Airport, Subordinated, Series D | | | 5.000 | % | | | 5/15/38 | | | | 500,000 | | | | 522,731 | (c) |
Los Angeles International Airport, Subordinated, Series F | | | 5.000 | % | | | 5/15/27 | | | | 5,565,000 | | | | 5,951,902 | (c) |
Los Angeles International Airport, Subordinated, Series F | | | 4.000 | % | | | 5/15/49 | | | | 2,000,000 | | | | 1,814,473 | (c) |
Los Angeles, CA, Department of Water & Power Waterworks Revenue, Series A | | | 5.000 | % | | | 7/1/48 | | | | 2,500,000 | | | | 2,653,241 | |
Los Angeles, CA, Department of Water & Power, Power System Revenue: | | | | | | | | | | | | | | | | |
Los Angeles Water & Power, Series A | | | 5.000 | % | | | 7/1/42 | | | | 4,000,000 | | | | 4,224,760 | |
Series C | | | 5.000 | % | | | 7/1/37 | | | | 1,000,000 | | | | 1,079,523 | |
Series C | | | 5.000 | % | | | 7/1/42 | | | | 2,000,000 | | | | 2,125,092 | |
Los Angeles, CA, Wastewater System Revenue, Green Bonds, Subordinated, Series A | | | 5.000 | % | | | 6/1/48 | | | | 1,500,000 | | | | 1,598,807 | |
M-S-R Energy Authority, CA, Natural Gas Revenue: | | | | | | | | | | | | | | | | |
Series A | | | 7.000 | % | | | 11/1/34 | | | | 3,430,000 | | | | 4,244,329 | |
Series B | | | 6.500 | % | | | 11/1/39 | | | | 8,000,000 | | | | 9,706,513 | |
Regents of the University of California Medical Center Pooled Revenue, Series L, Refunding | | | 5.000 | % | | | 5/15/32 | | | | 1,750,000 | | | | 1,866,114 | |
River Islands, CA, Public Financing Authority, Special Tax Revenue: | | | | | | | | | | | | | | | | |
Community Facilities District No. 2003-1 | | | 5.500 | % | | | 9/1/37 | | | | 545,000 | | | | 534,031 | |
Community Facilities District No. 2003-1 | | | 5.750 | % | | | 9/1/52 | | | | 1,000,000 | | | | 970,057 | |
Riverside County, CA, Transportation Commission Sales Tax Revenue, Series B, Refunding | | | 5.000 | % | | | 6/1/37 | | | | 1,900,000 | | | | 2,062,939 | |
San Bernardino, CA, USD Revenue, COP, 2019 School Financing Project, AGM | | | 5.000 | % | | | 10/1/36 | | | | 1,000,000 | | | | 1,091,604 | |
San Diego County, CA, Regional Airport Authority Revenue, Series B | | | 5.000 | % | | | 7/1/46 | | | | 1,500,000 | | | | 1,540,166 | (c) |
See Notes to Financial Statements.
| | | | |
4 | | | | Western Asset Managed Municipals Fund Inc. 2022 Semi-Annual Report |
Western Asset Managed Municipals Fund Inc.
(Percentages shown based on Fund net assets)
| | | | | | | | | | | | | | | | |
| Security | | Rate | | | Maturity
Date | | | Face
Amount | | | Value | |
California — continued | | | | | | | | | | | | | | | | |
San Diego County, CA, Regional Transportation Commission, Sales Tax Revenue, Series A | | | 5.000 | % | | | 4/1/48 | | | $ | 2,500,000 | | | $ | 2,625,964 | |
San Francisco, CA, City & County Airport Commission, International Airport Revenue: | | | | | | | | | | | | | | | | |
Second Series A, Refunding | | | 5.000 | % | | | 5/1/47 | | | | 9,135,000 | | | | 9,276,086 | (c) |
SFO Fuel Company LLC, Series A, Refunding | | | 5.000 | % | | | 1/1/47 | | | | 1,500,000 | | | | 1,530,795 | (c) |
San Mateo County, CA, Joint Powers Financing Authority Lease Revenue, Capital Project, Series A | | | 5.000 | % | | | 7/15/43 | | | | 1,000,000 | | | | 1,078,374 | |
Sanger, CA, USD Revenue, COP, Capital Projects, Refunding, AGM | | | 5.000 | % | | | 6/1/49 | | | | 1,000,000 | | | | 1,031,993 | |
Tobacco Securitization Authority of Southern California Revenue: | | | | | | | | | | | | | | | | |
Asset Backed Refunding, San Diego County Tobacco Asset Securitization Corporation, Class 1, Series A | | | 5.000 | % | | | 6/1/39 | | | | 500,000 | | | | 519,591 | |
Asset Backed Refunding, San Diego County Tobacco Asset Securitization Corporation, Class 1, Series A | | | 5.000 | % | | | 6/1/48 | | | | 500,000 | | | | 510,650 | |
Total California | | | | | | | | | | | | | | | 95,150,981 | |
Colorado — 6.4% | | | | | | | | | | | | | | | | |
Base Village Metropolitan District #2, CO, GO, Series A, Refunding | | | 5.750 | % | | | 12/1/46 | | | | 500,000 | | | | 500,343 | |
Colorado State Educational & Cultural Facilities Authority Revenue, University of Denver Project, Series A | | | 5.000 | % | | | 3/1/47 | | | | 1,600,000 | | | | 1,674,671 | |
Colorado State Health Facilities Authority Revenue: | | | | | | | | | | | | | | | | |
Commonspirit Health Initiatives, Series B-2 | | | 5.000 | % | | | 8/1/26 | | | | 1,000,000 | | | | 1,041,510 | (a)(b) |
Commonspirit Health Project, Series A-2 | | | 4.000 | % | | | 8/1/49 | | | | 1,900,000 | | | | 1,587,296 | |
Colorado State High Performance Transportation Enterprise Revenue, C-470 Express Lanes | | | 5.000 | % | | | 12/31/51 | | | | 600,000 | | | | 600,689 | |
Denver, CO, Airport System Revenue, Series C | | | 6.125 | % | | | 11/15/25 | | | | 10,945,000 | | | | 11,391,537 | (c)(f) |
Public Authority for Colorado Energy, Natural Gas Purchase Revenue | | | 6.500 | % | | | 11/15/38 | | | | 12,200,000 | | | | 14,690,730 | |
Total Colorado | | | | | | | | | | | | | | | 31,486,776 | |
Connecticut — 1.7% | | | | | | | | | | | | | | | | |
Connecticut State Special Tax Revenue: | | | | | | | | | | | | | | | | |
Transportation Infrastructure, Series A | | | 5.000 | % | | | 1/1/37 | | | | 1,500,000 | | | | 1,619,603 | |
See Notes to Financial Statements.
| | | | |
| Western Asset Managed Municipals Fund Inc. 2022 Semi-Annual Report | | | | 5 |
Schedule of investments (unaudited) (cont’d)
November 30, 2022
Western Asset Managed Municipals Fund Inc.
(Percentages shown based on Fund net assets)
| | | | | | | | | | | | | | | | |
| Security | | Rate | | | Maturity
Date | | | Face
Amount | | | Value | |
Connecticut — continued | | | | | | | | | | | | | | | | |
Transportation Infrastructure, Series A | | | 5.000 | % | | | 5/1/38 | | | $ | 2,750,000 | | | $ | 3,049,374 | |
Connecticut State, GO: | | | | | | | | | | | | | | | | |
Series A | | | 5.000 | % | | | 4/15/35 | | | | 1,650,000 | | | | 1,799,831 | |
Series E | | | 5.000 | % | | | 10/15/34 | | | | 930,000 | | | | 991,111 | |
Harbor Point, CT, Infrastructure Improvement District, Special Obligation Revenue, Harbor Point Project Ltd., Refunding | | | 5.000 | % | | | 4/1/39 | | | | 900,000 | | | | 877,679 | (d) |
Total Connecticut | | | | | | | | | | | | | | | 8,337,598 | |
District of Columbia — 0.6% | | | | | | | | | | | | | | | | |
District of Columbia Revenue, KIPP DC Project, Series B, Refunding | | | 5.000 | % | | | 7/1/48 | | | | 2,800,000 | | | | 2,834,184 | |
Florida — 4.8% | | | | | | | | | | | | | | | | |
Broward County, FL, Airport System Revenue, Series 2017 | | | 5.000 | % | | | 10/1/47 | | | | 1,250,000 | | | | 1,262,285 | (c) |
Broward County, FL, Port Facilities Revenue, Series 2022 | | | 5.000 | % | | | 9/1/37 | | | | 400,000 | | | | 428,906 | (c) |
Florida State Development Finance Corp., Educational Facilities Revenue, Renaissance Charter School Inc. Projects, Series A | | | 6.125 | % | | | 6/15/46 | | | | 555,000 | | | | 556,206 | (d) |
Florida State Mid-Bay Bridge Authority, Series A, Refunding | | | 5.000 | % | | | 10/1/30 | | | | 2,410,000 | | | | 2,453,745 | |
Fort Pierce, FL, Utilities Authority Revenue, Series A, Refunding, AGM | | | 4.000 | % | | | 10/1/52 | | | | 700,000 | | | | 640,274 | |
Greater Orlando, FL, Aviation Authority, Airport Facilities Revenue, Priority Subordinated, Series A | | | 5.000 | % | | | 10/1/47 | | | | 1,500,000 | | | | 1,516,676 | (c) |
Hillsborough County, FL, Aviation Authority Revenue, Tampa International Airport, Series E | | | 5.000 | % | | | 10/1/43 | | | | 1,000,000 | | | | 1,026,214 | (c) |
Miami-Dade County, FL, Aviation Revenue, Series A, Refunding | | | 5.000 | % | | | 10/1/49 | | | | 3,000,000 | | | | 3,036,071 | (c) |
Miami-Dade County, FL, Expressway Authority, Series A | | | 5.000 | % | | | 7/1/40 | | | | 9,000,000 | | | | 9,000,553 | |
Orange County, FL, Health Facilities Authority Revenue, Presbyterian Retirement Communities, Refunding | | | 5.000 | % | | | 8/1/47 | | | | 750,000 | | | | 781,639 | |
Palm Beach County, FL, Health Facilities Authority Revenue: | | | | | | | | | | | | | | | | |
Acts Retirement-Life Communities | | | 5.000 | % | | | 11/15/45 | | | | 750,000 | | | | 733,946 | |
See Notes to Financial Statements.
| | | | |
6 | | | | Western Asset Managed Municipals Fund Inc. 2022 Semi-Annual Report |
Western Asset Managed Municipals Fund Inc.
(Percentages shown based on Fund net assets)
| | | | | | | | | | | | | | | | |
| Security | | Rate | | | Maturity
Date | | | Face
Amount | | | Value | |
Florida — continued | | | | | | | | | | | | | | | | |
Jupiter Medical Center Project, Series A | | | 5.000 | % | | | 11/1/52 | | | $ | 2,200,000 | | | $ | 2,205,791 | |
Toby & Leon Cooperman Sinai Residences of Boca Raton Expansion, Refunding | | | 4.000 | % | | | 6/1/41 | | | | 500,000 | | | | 393,907 | |
Total Florida | | | | | | | | | | | | | | | 24,036,213 | |
Georgia — 1.0% | | | | | | | | | | | | | | | | |
Cobb County, GA, Kennestone Hospital Authority Revenue, Wellstar Health System, Inc. Project, Series A | | | 5.000 | % | | | 4/1/50 | | | | 1,000,000 | | | | 1,006,353 | |
Fulton County, GA, Development Authority Revenue, Georgia Institute of Technology | | | 5.000 | % | | | 6/15/44 | | | | 1,000,000 | | | | 1,080,883 | |
Georgia State Municipal Electric Authority Power Revenue: | | | | | | | | | | | | | | | | |
Plant Vogtle Units 3 & 4 Project, Series A | | | 5.000 | % | | | 1/1/56 | | | | 1,000,000 | | | | 991,086 | |
Project One, Series A | | | 5.000 | % | | | 1/1/50 | | | | 1,000,000 | | | | 1,004,928 | |
Main Street Natural Gas Inc., GA, Gas Project Revenue, Series A | | | 5.000 | % | | | 5/15/43 | | | | 800,000 | | | | 805,112 | |
Total Georgia | | | | | | | | | | | | | | | 4,888,362 | |
Guam — 0.2% | | | | | | | | | | | | | | | | |
Guam Government, Business Privilege Tax Revenue, Series F, Refunding | | | 4.000 | % | | | 1/1/36 | | | | 970,000 | | | | 897,793 | |
Idaho — 0.2% | | | | | | | | | | | | | | | | |
Idaho State Health Facilities Authority Revenue, Trinity Health Credit Group, Series A | | | 5.000 | % | | | 12/1/47 | | | | 1,100,000 | | | | 1,116,586 | |
Illinois — 18.6% | | | | | | | | | | | | | | | | |
Chicago, IL, Board of Education, Dedicated Capital Improvement, Special Tax Revenue, Series 2018 | | | 5.000 | % | | | 4/1/42 | | | | 1,500,000 | | | | 1,502,969 | |
Chicago, IL, Board of Education, GO: | | | | | | | | | | | | | | | | |
Dedicated, Series G, Refunding | | | 5.000 | % | | | 12/1/34 | | | | 100,000 | | | | 99,536 | |
Dedicated, Series G, Refunding | | | 5.000 | % | | | 12/1/44 | | | | 420,000 | | | | 399,042 | |
Dedicated, Series H | | | 5.000 | % | | | 12/1/36 | | | | 500,000 | | | | 492,598 | |
Dedicated, Series H | | | 5.000 | % | | | 12/1/46 | | | | 4,150,000 | | | | 3,917,521 | |
Series D | | | 5.000 | % | | | 12/1/46 | | | | 6,435,000 | | | | 6,055,532 | |
Chicago, IL, GO: | | | | | | | | | | | | | | | | |
Series A | | | 5.000 | % | | | 1/1/44 | | | | 1,000,000 | | | | 982,038 | |
Series A, Refunding | | | 5.625 | % | | | 1/1/29 | | | | 2,000,000 | | | | 2,065,681 | |
Series A, Refunding | | | 6.000 | % | | | 1/1/38 | | | | 1,500,000 | | | | 1,559,713 | |
Series C, Refunding | | | 5.000 | % | | | 1/1/25 | | | | 3,000,000 | | | | 3,041,740 | |
See Notes to Financial Statements.
| | | | |
| Western Asset Managed Municipals Fund Inc. 2022 Semi-Annual Report | | | | 7 |
Schedule of investments (unaudited) (cont’d)
November 30, 2022
Western Asset Managed Municipals Fund Inc.
(Percentages shown based on Fund net assets)
| | | | | | | | | | | | | | | | |
| Security | | Rate | | | Maturity
Date | | | Face
Amount | | | Value | |
Illinois — continued | | | | | | | | | | | | | | | | |
Chicago, IL, O’Hare International Airport Revenue: | | | | | | | | | | | | | | | | |
General Senior Lien, Series B, Refunding | | | 5.000 | % | | | 1/1/41 | | | $ | 1,000,000 | | | $ | 1,019,596 | |
General Senior Lien, Series C, Refunding | | | 5.000 | % | | | 1/1/44 | | | | 2,500,000 | | | | 2,565,996 | (c) |
Series A, Refunding | | | 5.000 | % | | | 1/1/31 | | | | 1,000,000 | | | | 1,019,639 | (c) |
Series A, Refunding | | | 5.000 | % | | | 1/1/35 | | | | 7,000,000 | | | | 7,099,004 | (c) |
TrIPS Obligated Group | | | 5.000 | % | | | 7/1/48 | | | | 700,000 | | | | 701,118 | (c) |
Chicago, IL, Transit Authority, Sales Tax Receipts Revenue: | | | | | | | | | | | | | | | | |
Second Lien | | | 5.000 | % | | | 12/1/51 | | | | 1,000,000 | | | | 1,012,287 | |
Second Lien, Series A, Refunding | | | 5.000 | % | | | 12/1/45 | | | | 500,000 | | | | 513,969 | |
Second Lien, Series A, Refunding | | | 4.000 | % | | | 12/1/55 | | | | 1,300,000 | | | | 1,141,265 | |
Chicago, IL, Wastewater Transmission Revenue: | | | | | | | | | | | | | | | | |
Second Lien | | | 5.000 | % | | | 1/1/44 | | | | 1,000,000 | | | | 1,000,792 | |
Second Lien, Series A | | | 5.000 | % | | | 1/1/47 | | | | 2,300,000 | | | | 2,305,094 | |
Second Lien, Series B, Refunding | | | 5.000 | % | | | 1/1/38 | | | | 750,000 | | | | 760,173 | |
Chicago, IL, Waterworks Revenue: | | | | | | | | | | | | | | | | |
Second Lien, Series 2017, Refunding | | | 5.000 | % | | | 11/1/29 | | | | 1,800,000 | | | | 1,884,383 | |
Second Lien, Series 2017-2, Refunding, AGM | | | 5.000 | % | | | 11/1/33 | | | | 1,290,000 | | | | 1,367,117 | |
Second Lien, Series 2017-2, Refunding, AGM | | | 5.000 | % | | | 11/1/37 | | | | 3,610,000 | | | | 3,715,466 | |
Second Lien, Series 2017-2, Refunding, AGM | | | 5.000 | % | | | 11/1/38 | | | | 2,000,000 | | | | 2,054,184 | |
Cook County, IL, Sales Tax Revenue, Series A, Refunding | | | 4.000 | % | | | 11/15/41 | | | | 1,750,000 | | | | 1,686,117 | |
Illinois State Finance Authority Revenue, Northshore University Health System, Refunding | | | 4.000 | % | | | 8/15/40 | | | | 1,900,000 | | | | 1,836,576 | |
Illinois State Finance Authority, Student Housing & Academic Facilities Revenue, CHF Chicago LLC, University of Illinois Chicago Project | | | 5.000 | % | | | 2/15/50 | | | | 500,000 | | | | 446,804 | |
Illinois State Sports Facilities Authority Revenue, Sport Facilities Project, Series 2019, Refunding, BAM | | | 5.000 | % | | | 6/15/28 | | | | 750,000 | | | | 786,115 | |
Illinois State Toll Highway Authority Revenue, Series A | | | 4.000 | % | | | 1/1/46 | | | | 4,000,000 | | | | 3,834,798 | |
See Notes to Financial Statements.
| | | | |
8 | | | | Western Asset Managed Municipals Fund Inc. 2022 Semi-Annual Report |
Western Asset Managed Municipals Fund Inc.
(Percentages shown based on Fund net assets)
| | | | | | | | | | | | | | | | |
| Security | | Rate | | | Maturity
Date | | | Face
Amount | | | Value | |
Illinois — continued | | | | | | | | | | | | | | | | |
Illinois State, GO: | | | | | | | | | | | | | | | | |
Series 2016 | | | 5.000 | % | | | 1/1/33 | | | $ | 1,500,000 | | | $ | 1,536,158 | |
Series 2016 | | | 5.000 | % | | | 11/1/33 | | | | 2,350,000 | | | | 2,415,789 | |
Series 2016, Refunding | | | 5.000 | % | | | 2/1/29 | | | | 1,660,000 | | | | 1,721,370 | |
Series A | | | 5.000 | % | | | 3/1/34 | | | | 2,000,000 | | | | 2,096,361 | |
Series A | | | 5.000 | % | | | 5/1/36 | | | | 690,000 | | | | 707,180 | |
Series A | | | 5.000 | % | | | 5/1/39 | | | | 2,000,000 | | | | 2,032,134 | |
Series A | | | 5.000 | % | | | 3/1/46 | | | | 1,750,000 | | | | 1,756,369 | |
Series A, Refunding | | | 5.000 | % | | | 10/1/29 | | | | 3,795,000 | | | | 3,983,474 | |
Series A, Refunding | | | 5.000 | % | | | 10/1/30 | | | | 500,000 | | | | 524,526 | |
Series D | | | 5.000 | % | | | 11/1/27 | | | | 2,000,000 | | | | 2,089,154 | |
Series D | | | 5.000 | % | | | 11/1/28 | | | | 750,000 | | | | 782,392 | |
Metropolitan Pier & Exposition Authority, IL, Revenue: | | | | | | | | | | | | | | | | |
McCormick Place Expansion Project, Series A, Refunding | | | 4.000 | % | | | 12/15/42 | | | | 2,750,000 | | | | 2,476,368 | |
McCormick Place Expansion Project, Series A, Refunding | | | 4.000 | % | | | 12/15/47 | | | | 1,500,000 | | | | 1,303,144 | |
McCormick Place Expansion Project, Series A, Refunding | | | 5.000 | % | | | 6/15/50 | | | | 7,150,000 | | | | 7,164,200 | |
Regional Transportation Authority, IL, GO, Series A, Refunding, NATL | | | 6.000 | % | | | 7/1/29 | | | | 4,450,000 | | | | 5,010,672 | |
Total Illinois | | | | | | | | | | | | | | | 92,466,154 | |
Indiana — 2.3% | | | | | | | | | | | | | | | | |
Indiana State Finance Authority Revenue: | | | | | | | | | | | | | | | | |
BHI Senior Living Inc., Series A, Refunding | | | 4.000 | % | | | 11/15/41 | | | | 2,250,000 | | | | 1,801,240 | |
Marion General Hospital, Series A | | | 4.000 | % | | | 7/1/45 | | | | 900,000 | | | | 851,292 | |
Midwestern Disaster Relief, Ohio Valley Electric Corp. Project, Series A | | | 4.250 | % | | | 11/1/30 | | | | 900,000 | | | | 876,331 | |
Private Activity-Ohio River Bridges East End Crossing Project | | | 5.000 | % | | | 7/1/44 | | | | 5,000,000 | | | | 5,060,965 | (c)(e) |
Indianapolis, IN, Local Public Improvement Bond Bank, Courthouse and Jail Project, Series A | | | 4.000 | % | | | 2/1/44 | | | | 2,000,000 | | | | 2,007,521 | |
Valparaiso, IN, Exempt Facilities Revenue, Pratt Paper LLC Project | | | 7.000 | % | | | 1/1/44 | | | | 1,000,000 | | | | 1,027,628 | (c) |
Total Indiana | | | | | | | | | | | | | | | 11,624,977 | |
See Notes to Financial Statements.
| | | | |
| Western Asset Managed Municipals Fund Inc. 2022 Semi-Annual Report | | | | 9 |
Schedule of investments (unaudited) (cont’d)
November 30, 2022
Western Asset Managed Municipals Fund Inc.
(Percentages shown based on Fund net assets)
| | | | | | | | | | | | | | | | |
| Security | | Rate | | | Maturity
Date | | | Face
Amount | | | Value | |
Iowa — 0.8% | | | | | | | | | | | | | | | | |
Iowa State Finance Authority Revenue, Midwestern Disaster Area, Iowa Fertilizer Co. Project, Refunding | | | 5.000 | % | | | 12/1/42 | | | $ | 3,400,000 | | | $ | 3,287,357 | (a)(b) |
Iowa State Tobacco Settlement Authority Revenue, Asset Backed Senior Bonds, Class 1, Series A-2, Refunding | | | 4.000 | % | | | 6/1/49 | | | | 550,000 | | | | 464,018 | |
Total Iowa | | | | | | | | | | | | | | | 3,751,375 | |
Kentucky — 2.4% | | | | | | | | | | | | | | | | |
Kentucky State Economic Development Finance Authority Revenue, Louisville Arena, Louisville Arena Authority Inc., Refunding, AGM | | | 5.000 | % | | | 12/1/45 | | | | 1,000,000 | | | | 1,015,909 | |
Kentucky State PEA, Gas Supply Revenue: | | | | | | | | | | | | | | | | |
Series A | | | 4.000 | % | | | 6/1/26 | | | | 5,000,000 | | | | 4,965,423 | (a)(b) |
Series C | | | 4.000 | % | | | 6/1/25 | | | | 5,800,000 | | | | 5,765,929 | (a)(b) |
Total Kentucky | | | | | | | | | | | | | | | 11,747,261 | |
Louisiana — 1.0% | | | | | | | | | | | | | | | | |
Port New Orleans, LA, Board of Commissioners Revenue, Series B, Refunding, AGM | | | 5.000 | % | | | 4/1/43 | | | | 2,000,000 | | | | 2,037,040 | (c) |
St. John the Baptist Parish, LA, State Revenue: | | | | | | | | | | | | | | | | |
Marathon Oil Corp. Project, Series A-3, Refunding | | | 2.200 | % | | | 7/1/26 | | | | 1,750,000 | | | | 1,608,955 | (a)(b) |
Marathon Oil Corp. Project, Series B-2, Refunding | | | 2.375 | % | | | 7/1/26 | | | | 1,300,000 | | | | 1,200,619 | (a)(b) |
Total Louisiana | | | | | | | | | | | | | | | 4,846,614 | |
Maryland — 0.5% | | | | | | | | | | | | | | | | |
Maryland EDC, Senior Student Housing Revenue, Morgan State University Project | | | 5.000 | % | | | 7/1/50 | | | | 1,150,000 | | | | 1,134,701 | |
Maryland State Stadium Authority Built to Learn Revenue, Series 2021 | | | 4.000 | % | | | 6/1/46 | | | | 1,495,000 | | | | 1,425,261 | |
Total Maryland | | | | | | | | | | | | | | | 2,559,962 | |
Massachusetts — 3.3% | | | | | | | | | | | | | | | | |
Massachusetts State DFA Revenue: | | | | | | | | | | | | | | | | |
Broad Institute Inc., Refunding | | | 5.000 | % | | | 4/1/36 | | | | 1,000,000 | | | | 1,074,617 | |
Milford Regional Medical Center, Series F | | | 5.750 | % | | | 7/15/43 | | | | 500,000 | | | | 504,165 | |
Northeastern University Issue, Refunding | | | 5.000 | % | | | 10/1/44 | | | | 2,000,000 | | | | 2,140,993 | |
UMass Boston Student Housing Project | | | 5.000 | % | | | 10/1/48 | | | | 750,000 | | | | 674,736 | |
Wellforce Issue, Series A, Refunding | | | 5.000 | % | | | 7/1/44 | | | | 500,000 | | | | 500,760 | |
See Notes to Financial Statements.
| | | | |
10 | | | | Western Asset Managed Municipals Fund Inc. 2022 Semi-Annual Report |
Western Asset Managed Municipals Fund Inc.
(Percentages shown based on Fund net assets)
| | | | | | | | | | | | | | | | |
| Security | | Rate | | | Maturity
Date | | | Face Amount | | | Value | |
Massachusetts — continued | | | | | | | | | | | | | | | | |
Massachusetts State Port Authority Revenue: | | | | | | | | | | | | | | | | |
Bosfuel Project, Series A, Refunding | | | 5.000 | % | | | 7/1/49 | | | $ | 1,100,000 | | | $ | 1,116,561 | (c) |
Series A, Refunding | | | 5.000 | % | | | 7/1/36 | | | | 1,700,000 | | | | 1,806,762 | (c) |
Series E | | | 5.000 | % | | | 7/1/46 | | | | 5,480,000 | | | | 5,713,503 | (c) |
Massachusetts State School Building Authority, Sales Tax Revenue, Senior, Series A | | | 5.000 | % | | | 5/15/43 | | | | 3,000,000 | | | | 3,034,420 | (e) |
Total Massachusetts | | | | | | | | | | | | | | | 16,566,517 | |
Michigan — 3.7% | | | | | | | | | | | | | | | | |
Detroit, MI, Downtown Development Authority Revenue, Catalyst Development, Series A, Refunding, AGM | | | 5.000 | % | | | 7/1/48 | | | | 1,000,000 | | | | 1,004,611 | |
Great Lakes, MI, Water Authority Water Supply System Revenue: | | | | | | | | | | | | | | | | |
Senior Lien, Series A | | | 5.000 | % | | | 7/1/46 | | | | 5,500,000 | | | | 5,724,828 | |
Senior Lien, Series C, Refunding | | | 5.000 | % | | | 7/1/35 | | | | 500,000 | | | | 528,355 | |
Kent County, MI, Gerald R. Ford International Airport, GO, Authority Revenue, County Guaranty | | | 5.000 | % | | | 1/1/46 | | | | 1,000,000 | | | | 1,066,230 | (c) |
Michigan State Finance Authority Revenue: | | | | | | | | | | | | | | | | |
Facilities Program, Series 1-A, Refunding | | | 5.250 | % | | | 10/15/47 | | | | 650,000 | | | | 659,080 | |
Local Government Loan Program, Detroit, MI, Water & Sewer Department, Second Lien Local Project, Series C, Refunding | | | 5.000 | % | | | 7/1/33 | | | | 625,000 | | | | 646,002 | |
Local Government Loan Program, Detroit, MI, Water & Sewer Department, Series C-6, Refunding | | | 5.000 | % | | | 7/1/33 | | | | 1,160,000 | | | | 1,190,253 | |
Local Government Loan Program, Detroit, MI, Water & Sewer Department, Series D-2, Refunding | | | 5.000 | % | | | 7/1/34 | | | | 250,000 | | | | 257,841 | |
Tobacco Settlement Asset Backed Senior Bonds, Series B-1, Refunding | | | 5.000 | % | | | 6/1/49 | | | | 325,000 | | | | 324,573 | |
Michigan State Hospital Finance Authority Revenue, Ascension Health Senior Credit Group, Series 2010F-4, Refunding | | | 5.000 | % | | | 11/15/47 | | | | 3,000,000 | | | | 3,103,951 | |
Michigan State Strategic Fund Limited Obligation Revenue, I-75 Improvement Project | | | 5.000 | % | | | 12/31/43 | | | | 1,400,000 | | | | 1,377,920 | (c) |
Royal Oak, MI, Hospital Finance Authority Revenue, Beaumont Health Credit Group, Series D, Refunding | | | 5.000 | % | | | 9/1/39 | | | | 2,500,000 | | | | 2,574,702 | (e) |
Total Michigan | | | | | | | | | | | | | | | 18,458,346 | |
See Notes to Financial Statements.
| | | | |
| Western Asset Managed Municipals Fund Inc. 2022 Semi-Annual Report | | | | 11 |
Schedule of investments (unaudited) (cont’d)
November 30, 2022
Western Asset Managed Municipals Fund Inc.
(Percentages shown based on Fund net assets)
| | | | | | | | | | | | | | | | |
| Security | | Rate | | | Maturity
Date | | | Face
Amount | | | Value | |
Minnesota — 0.3% | | | | | | | | | | | | | | | | |
Western Minnesota Municipal Power Agency Revenue, Series A | | | 5.000 | % | | | 1/1/46 | | | $ | 1,530,000 | | | $ | 1,568,999 | (e) |
Missouri — 0.8% | | | | | | | | | | | | | | | | |
Missouri State HEFA Revenue, Senior Living Facilities, Lutheran Senior Services, Refunding | | | 5.000 | % | | | 2/1/44 | | | | 2,710,000 | | | | 2,600,452 | |
St. Louis County, MO, IDA, Senior Living Facilities Revenue, Friendship Village, St. Louis Obligated Group, Series A | | | 5.000 | % | | | 9/1/38 | | | | 1,250,000 | | | | 1,140,317 | |
Total Missouri | | | | | | | | | | | | | | | 3,740,769 | |
New Jersey — 11.2% | | | | | | | | | | | | | | | | |
New Jersey Institute of Technology, GO, Series A | | | 5.000 | % | | | 7/1/45 | | | | 750,000 | | | | 773,895 | |
New Jersey State EDA Revenue: | | | | | | | | | | | | | | | | |
Private Activity-The Goethals Bridge Replacement Project, AGM | | | 5.125 | % | | | 7/1/42 | | | | 2,500,000 | | | | 2,502,620 | (c) |
School Facilities Construction, Series BBB, Refunding | | | 5.500 | % | | | 6/15/31 | | | | 750,000 | | | | 833,610 | (e) |
School Facilities Construction, Series I, Refunding, State Appropriations (SIFMA Municipal Swap Index Yield + 1.600%) | | | 3.500 | % | | | 3/1/28 | | | | 15,000,000 | | | | 15,006,919 | (b) |
Special Facility, Port Newark Container Terminal LLC Project, Refunding | | | 5.000 | % | | | 10/1/37 | | | | 650,000 | | | | 654,946 | (c) |
Transit Transportation Project, Series A | | | 5.000 | % | | | 11/1/32 | | | | 1,000,000 | | | | 1,088,717 | |
New Jersey State EDA, Lease Revenue, State House Project, Series B | | | 5.000 | % | | | 6/15/43 | | | | 4,000,000 | | | | 4,095,514 | |
New Jersey State EDA, Special Facility Revenue, Continental Airlines Inc. Project | | | 5.250 | % | | | 9/15/29 | | | | 3,000,000 | | | | 3,009,997 | (c) |
New Jersey State Health Care Facilities Financing Authority Revenue: | | | | | | | | | | | | | | | | |
Hackensack Meridian Health, Series A, Refunding | | | 5.000 | % | | | 7/1/38 | | | | 400,000 | | | | 422,571 | |
RWJ Barnabas Health Obligation Group, Series A, Refunding | | | 5.000 | % | | | 7/1/43 | | | | 1,200,000 | | | | 1,226,245 | |
New Jersey State Transportation Trust Fund Authority Revenue: | | | | | | | | | | | | | | | | |
Transportation Program, Series AA | | | 5.250 | % | | | 6/15/43 | | | | 1,500,000 | | | | 1,558,630 | |
Transportation Program, Series AA | | | 5.000 | % | | | 6/15/50 | | | | 5,520,000 | | | | 5,627,925 | |
Transportation Program, Series BB | | | 4.000 | % | | | 6/15/36 | | | | 2,250,000 | | | | 2,207,132 | |
Transportation Program, Series BB | | | 5.000 | % | | | 6/15/44 | | | | 2,000,000 | | | | 2,043,835 | |
Transportation System, Series A, Refunding | | | 5.000 | % | | | 12/15/25 | | | | 1,885,000 | | | | 1,992,220 | |
See Notes to Financial Statements.
| | | | |
12 | | | | Western Asset Managed Municipals Fund Inc. 2022 Semi-Annual Report |
Western Asset Managed Municipals Fund Inc.
(Percentages shown based on Fund net assets)
| | | | | | | | | | | | | | | | |
| Security | | Rate | | | Maturity
Date | | | Face
Amount | | | Value | |
New Jersey — continued | | | | | | | | | | | | | | | | |
Transportation System, Series A, Refunding | | | 5.000 | % | | | 12/15/28 | | | $ | 2,615,000 | | | $ | 2,867,136 | |
New Jersey State Turnpike Authority Revenue, Series G, Refunding | | | 5.000 | % | | | 1/1/35 | | | | 2,675,000 | | | | 2,896,394 | |
New Jersey State, GO, COVID-19 Emergency, Series A | | | 5.000 | % | | | 6/1/28 | | | | 5,500,000 | | | | 6,106,592 | |
Tobacco Settlement Financing Corp., NJ, Revenue, Series A, Refunding | | | 5.250 | % | | | 6/1/46 | | | | 600,000 | | | | 604,552 | |
Total New Jersey | | | | | | | | | | | | | | | 55,519,450 | |
New York — 20.5% | | | | | | | | | | | | | | | | |
Brookhaven, NY, Local Development Corp. Revenue: | | | | | | | | | | | | | | | | |
Long Island Community Hospital Project, Series A | | | 5.000 | % | | | 10/1/31 | | | | 1,280,000 | | | | 1,376,081 | |
Long Island Community Hospital Project, Series A | | | 4.000 | % | | | 10/1/45 | | | | 1,250,000 | | | | 1,161,960 | |
MTA, NY, Dedicated Tax Fund Revenue, Green Bonds, Subseries A-2 | | | 5.000 | % | | | 11/15/47 | | | | 1,500,000 | | | | 1,552,553 | |
MTA, NY, Transportation Revenue: | | | | | | | | | | | | | | | | |
Green Bonds, Series A-2, Refunding | | | 5.000 | % | | | 11/15/24 | | | | 500,000 | | | | 514,518 | |
Green Bonds, Series C-1, Refunding | | | 4.000 | % | | | 11/15/37 | | | | 500,000 | | | | 456,807 | |
Green Bonds, Series D-1 | | | 5.000 | % | | | 11/15/43 | | | | 500,000 | | | | 493,843 | |
Green Bonds, Series E, Refunding | | | 5.000 | % | | | 11/15/30 | | | | 1,500,000 | | | | 1,570,588 | |
Green Bonds, Series E, Refunding | | | 4.000 | % | | | 11/15/45 | | | | 1,250,000 | | | | 1,064,606 | |
Series A-2 | | | 5.000 | % | | | 5/15/30 | | | | 1,800,000 | | | | 1,905,509 | (a)(b) |
Series C-1 | | | 5.000 | % | | | 11/15/33 | | | | 350,000 | | | | 357,051 | |
New York City, NY, GO: | | | | | | | | | | | | | | | | |
Subseries A-1 | | | 5.000 | % | | | 8/1/47 | | | | 2,070,000 | | | | 2,214,210 | |
Subseries F-1 | | | 5.000 | % | | | 3/1/39 | | | | 2,000,000 | | | | 2,179,904 | |
New York City, NY, Industrial Development Agency Revenue: | | | | | | | | | | | | | | | | |
Yankee Stadium Project, Refunding | | | 4.000 | % | | | 3/1/45 | | | | 500,000 | | | | 451,582 | |
Yankee Stadium Project, Refunding, AGM | | | 4.000 | % | | | 3/1/45 | | | | 750,000 | | | | 699,719 | |
New York City, NY, Municipal Water Finance Authority, Water & Sewer System Revenue: | | | | | | | | | | | | | | | | |
Second General Resolution Fiscal 2013, Unrefunded | | | 5.000 | % | | | 6/15/47 | | | | 2,650,000 | | | | 2,671,828 | |
Second General Resolution, Series CC | | | 5.000 | % | | | 6/15/48 | | | | 600,000 | | | | 630,090 | |
Second General Resolution, Series CC-1, Refunding | | | 5.000 | % | | | 6/15/46 | | | | 1,000,000 | | | | 1,035,324 | |
See Notes to Financial Statements.
| | | | |
| Western Asset Managed Municipals Fund Inc. 2022 Semi-Annual Report | | | | 13 |
Schedule of investments (unaudited) (cont’d)
November 30, 2022
Western Asset Managed Municipals Fund Inc.
(Percentages shown based on Fund net assets)
| | | | | | | | | | | | | | | | |
| Security | | Rate | | | Maturity
Date | | | Face
Amount | | | Value | |
New York — continued | | | | | | | | | | | | | | | | |
Subordinated, Second General Resolution Fiscal 2021, Series AA-1, Refunding | | | 4.000 | % | | | 6/15/50 | | | $ | 4,500,000 | | | $ | 4,279,992 | |
New York City, NY, TFA Future Tax Secured Revenue, Subseries F-1 | | | 5.000 | % | | | 5/1/42 | | | | 3,000,000 | | | | 3,164,985 | |
New York State Dormitory Authority Revenue: | | | | | | | | | | | | | | | | |
Non-State Supported Debt, Memorial Sloan-Kettering Cancer Center, Series B-1 | | | 4.000 | % | | | 7/1/51 | | | | 2,000,000 | | | | 1,911,441 | |
Non-State Supported Debt, School District, Series A, AGM | | | 5.000 | % | | | 10/1/29 | | | | 5,000 | | | | 5,598 | (e) |
Non-State Supported Debt, School District, Series A, AGM | | | 5.000 | % | | | 10/1/29 | | | | 3,245,000 | | | | 3,635,842 | |
Series B, Refunding | | | 5.000 | % | | | 2/15/43 | | | | 5,000 | | | | 5,505 | (e) |
New York State Dormitory Authority, Income Tax Revenue, Series B, Refunding | | | 5.000 | % | | | 2/15/41 | | | | 2,995,000 | | | | 3,141,360 | |
New York State Dormitory Authority, Sales Tax Revenue: | | | | | | | | | | | | | | | | |
Bidding Group 4, Series A, Refunding | | | 5.000 | % | | | 3/15/45 | | | | 1,000,000 | | | | 1,053,025 | |
Bidding Group 4, Series E, Refunding | | | 5.000 | % | | | 3/15/44 | | | | 2,000,000 | | | | 2,118,179 | |
New York State Dormitory Authority, State Personal Income Tax Revenue: | | | | | | | | | | | | | | | | |
Bidding Group 4, Series A, Refunding | | | 5.000 | % | | | 3/15/45 | | | | 3,250,000 | | | | 3,462,406 | |
Bidding Group 4, Series A, Refunding | | | 4.000 | % | | | 3/15/46 | | | | 7,240,000 | | | | 6,934,476 | |
New York State Liberty Development Corp., Liberty Revenue: | | | | | | | | | | | | | | | | |
3 World Trade Center Project, Class 1, Refunding | | | 5.000 | % | | | 11/15/44 | | | | 1,750,000 | | | | 1,654,116 | (d) |
7 World Trade Center Project, Class 2, Refunding | | | 3.250 | % | | | 9/15/52 | | | | 3,800,000 | | | | 2,872,435 | |
New York State Liberty Development Corp., Revenue, Goldman Sachs Headquarters | | | 5.500 | % | | | 10/1/37 | | | | 1,485,000 | | | | 1,662,726 | |
New York State Thruway Authority General Revenue, Junior Indebtedness Obligations, Junior Lien, Series B | | | 4.000 | % | | | 1/1/45 | | | | 3,000,000 | | | | 2,826,846 | |
New York State Transportation Development Corp., Special Facilities Revenue: | | | | | | | | | | | | | | | | �� |
Delta Air Lines Inc., LaGuardia Airport Terminals C and D Redevelopment Project | | | 5.000 | % | | | 1/1/33 | | | | 1,750,000 | | | | 1,772,626 | (c) |
Delta Air Lines Inc., LaGuardia Airport Terminals C and D Redevelopment Project | | | 4.375 | % | | | 10/1/45 | | | | 1,500,000 | | | | 1,371,222 | (c) |
John F. Kennedy International Airport Terminal 4 Project, Series C, Refunding | | | 4.000 | % | | | 12/1/41 | | | | 2,160,000 | | | | 1,923,247 | |
See Notes to Financial Statements.
| | | | |
14 | | | | Western Asset Managed Municipals Fund Inc. 2022 Semi-Annual Report |
Western Asset Managed Municipals Fund Inc.
(Percentages shown based on Fund net assets)
| | | | | | | | | | | | | | | | |
| Security | | Rate | | | Maturity
Date | | | Face
Amount | | | Value | |
New York — continued | | | | | | | | | | | | | | | | |
LaGuardia Airport Terminal B Redevelopment Project, Series A | | | 5.000 | % | | | 7/1/41 | | | $ | 1,250,000 | | | $ | 1,252,720 | (c) |
LaGuardia Airport Terminal B Redevelopment Project, Series A | | | 5.000 | % | | | 7/1/46 | | | | 9,250,000 | | | | 9,188,879 | (c) |
New York State Urban Development Corp. Revenue, State Personal Income Tax, Series C | | | 4.000 | % | | | 3/15/45 | | | | 2,500,000 | | | | 2,379,373 | |
Port Authority of New York & New Jersey Revenue: | | | | | | | | | | | | | | | | |
Consolidated Series 194, Refunding | | | 5.000 | % | | | 10/15/41 | | | | 6,400,000 | | | | 6,624,214 | |
Consolidated Series 221 | | | 4.000 | % | | | 7/15/50 | | | | 2,600,000 | | | | 2,340,911 | (c) |
Consolidated Series 221 | | | 4.000 | % | | | 7/15/55 | | | | 1,000,000 | | | | 876,400 | (c) |
Triborough Bridge & Tunnel Authority, NY, Revenue: | | | | | | | | | | | | | | | | |
General-MTA Bridges & Tunnels, Series A | | | 5.000 | % | | | 11/15/49 | | | | 1,250,000 | | | | 1,321,149 | |
General-MTA Bridges & Tunnels, Series A | | | 5.000 | % | | | 11/15/49 | | | | 6,900,000 | | | | 7,327,113 | |
General-MTA Bridges & Tunnels, Series A | | | 4.000 | % | | | 11/15/54 | | | | 1,250,000 | | | | 1,147,469 | |
Senior Lien-MTA Bridges & Tunnels, Series C-1A | | | 5.000 | % | | | 5/15/51 | | | | 4,950,000 | | | | 5,281,121 | |
Total New York | | | | | | | | | | | | | | | 101,871,549 | |
North Carolina — 1.4% | | | | | | | | | | | | | | | | |
Charlotte, NC, Airport Revenue, Charlotte Douglas International Airport, Series A, Refunding | | | 5.000 | % | | | 7/1/49 | | | | 1,750,000 | | | | 1,847,169 | |
Charlotte, NC, Lease Revenue, COP, Convention Facility Project, Series A, Refunding | | | 4.000 | % | | | 6/1/49 | | | | 750,000 | | | | 737,902 | |
North Carolina State Medical Care Commission, Retirement Facilities Revenue: | | | | | | | | | | | | | | | | |
The Forest at Duke Project | | | 4.000 | % | | | 9/1/41 | | | | 500,000 | | | | 432,987 | |
The Forest at Duke Project | | | 4.000 | % | | | 9/1/46 | | | | 715,000 | | | | 593,594 | |
The Forest at Duke Project | | | 4.000 | % | | | 9/1/51 | | | | 1,000,000 | | | | 805,408 | |
North Carolina State Turnpike Authority, Monroe Expressway Toll Revenue: | | | | | | | | | | | | | | | | |
Series A, Refunding | | | 5.000 | % | | | 7/1/47 | | | | 750,000 | | | | 758,827 | |
Series A, Refunding | | | 5.000 | % | | | 7/1/51 | | | | 1,500,000 | | | | 1,514,637 | |
Total North Carolina | | | | | | | | | | | | | | | 6,690,524 | |
Ohio — 2.5% | | | | | | | | | | | | | | | | |
Buckeye, OH, Tobacco Settlement Financing Authority Revenue, Senior Bonds, Series B-2, Refunding | | | 5.000 | % | | | 6/1/55 | | | | 2,400,000 | | | | 2,202,305 | |
See Notes to Financial Statements.
| | | | |
| Western Asset Managed Municipals Fund Inc. 2022 Semi-Annual Report | | | | 15 |
Schedule of investments (unaudited) (cont’d)
November 30, 2022
Western Asset Managed Municipals Fund Inc.
(Percentages shown based on Fund net assets)
| | | | | | | | | | | | | | | | |
| Security | | Rate | | | Maturity
Date | | | Face
Amount | | | Value | |
Ohio — continued | | | | | | | | | | | | | | | | |
JobsOhio Beverage System, Senior Lien, Series A | | | 5.000 | % | | | 1/1/38 | | | $ | 8,000,000 | | | $ | 8,016,517 | (e) |
Ohio State Air Quality Development Authority Revenue: | | | | | | | | | | | | | | | | |
American Electric Co. Project, Series B, Refunding | | | 2.500 | % | | | 10/1/29 | | | | 1,500,000 | | | | 1,329,336 | (a)(b)(c) |
Duke Energy Corp. Project, Series B, Refunding | | | 4.250 | % | | | 6/1/27 | | | | 1,000,000 | | | | 996,039 | (a)(b)(c) |
Total Ohio | | | | | | | | | | | | | | | 12,544,197 | |
Oklahoma — 0.4% | | | | | | | | | | | | | | | | |
Oklahoma State Municipal Power Authority Revenue, Series A, Refunding, AGM | | | 4.000 | % | | | 1/1/47 | | | | 2,000,000 | | | | 1,966,274 | |
Oregon — 0.6% | | | | | | | | | | | | | | | | |
Oregon State Facilities Authority Revenue, Legacy Health Project, Series A, Refunding | | | 5.000 | % | | | 6/1/46 | | | | 2,000,000 | | | | 2,035,395 | |
Port of Portland, OR, Airport Revenue, Portland International Airport, Series C, Refunding | | | 5.000 | % | | | 7/1/24 | | | | 1,000,000 | | | | 1,027,326 | (c) |
Total Oregon | | | | | | | | | | | | | | | 3,062,721 | |
Pennsylvania — 5.5% | | | | | | | | | | | | | | | | |
Commonwealth Financing Authority, PA, Tobacco Master Settlement Payment Revenue Bonds: | | | | | | | | | | | | | | | | |
Series 2018 | | | 5.000 | % | | | 6/1/32 | | | | 250,000 | | | | 272,055 | |
Series 2018 | | | 5.000 | % | | | 6/1/33 | | | | 500,000 | | | | 542,418 | |
Cumberland County, PA, Municipal Authority Revenue: | | | | | | | | | | | | | | | | |
Diakon Lutheran Social Ministries, Refunding | | | 5.000 | % | | | 1/1/30 | | | | 375,000 | | | | 392,402 | (e) |
Diakon Lutheran Social Ministries, Refunding | | | 5.000 | % | | | 1/1/30 | | | | 855,000 | | | | 894,675 | (e) |
Diakon Lutheran Social Ministries, Refunding | | | 5.000 | % | | | 1/1/30 | | | | 1,145,000 | | | | 1,160,976 | |
East Hempfield Township, PA, IDA Revenue, Student Services Inc. Student Housing Project - Millersville University | | | 5.000 | % | | | 7/1/47 | | | | 550,000 | | | | 581,274 | (e) |
Lancaster County Convention Center Authority, Series B | | | 4.750 | % | | | 5/1/53 | | | | 1,000,000 | | | | 1,014,718 | (g) |
Lancaster County, PA, Convention Center Authority Revenue, Series B, Refunding | | | 4.750 | % | | | 5/1/57 | | | | 2,500,000 | | | | 2,517,746 | (g) |
Lancaster County, PA, Hospital Authority Revenue, Penn State Health, Series 2021 | | | 5.000 | % | | | 11/1/46 | | | | 2,750,000 | | | | 2,813,108 | |
See Notes to Financial Statements.
| | | | |
16 | | | | Western Asset Managed Municipals Fund Inc. 2022 Semi-Annual Report |
Western Asset Managed Municipals Fund Inc.
(Percentages shown based on Fund net assets)
| | | | | | | | | | | | | | | | |
| Security | | Rate | | | Maturity
Date | | | Face
Amount | | | Value | |
Pennsylvania — continued | | | | | | | | | | | | | | | | |
Pennsylvania State Higher EFA Revenue, Trustees of University of Pennsylvania, Series A | | | 5.000 | % | | | 2/15/48 | | | $ | 1,250,000 | | | $ | 1,319,172 | |
Pennsylvania State Turnpike Commission Revenue: | | | | | | | | | | | | | | | | |
Series A, Refunding | | | 5.000 | % | | | 12/1/47 | | | | 1,500,000 | | | | 1,575,355 | |
Series A-2 | | | 5.000 | % | | | 12/1/48 | | | | 1,000,000 | | | | 1,036,338 | |
Series B, Refunding | | | 5.250 | % | | | 12/1/47 | | | | 1,200,000 | | | | 1,311,403 | (g) |
Series C, Refunding | | | 4.000 | % | | | 12/1/51 | | | | 2,000,000 | | | | 1,888,587 | |
Subordinated, Series B | | | 5.000 | % | | | 12/1/48 | | | | 2,900,000 | | | | 3,003,829 | |
Philadelphia, PA, Authority for IDR, Lease Revenue, Refunding | | | 5.000 | % | | | 10/1/30 | | | | 1,200,000 | | | | 1,348,545 | |
Philadelphia, PA, SD, GO, Series A, State Aid Withholding | | | 5.000 | % | | | 9/1/33 | | | | 1,755,000 | | | | 1,832,791 | |
Philadelphia, PA, Water & Wastewater Revenue, Series A | | | 5.000 | % | | | 7/1/45 | | | | 1,000,000 | | | | 1,037,519 | (e) |
State Public School Building Authority, PA, Lease Revenue: | | | | | | | | | | | | | | | | |
Philadelphia SD Project, Series A, Refunding, AGM, State Aid Withholding | | | 5.000 | % | | | 6/1/31 | | | | 600,000 | | | | 630,011 | |
Philadelphia SD Project, Series A, Refunding, AGM, State Aid Withholding | | | 5.000 | % | | | 6/1/33 | | | | 1,780,000 | | | | 1,862,288 | |
Total Pennsylvania | | | | | | | | | | | | | | | 27,035,210 | |
Puerto Rico — 5.3% | | | | | | | | | | | | | | | | |
Puerto Rico Commonwealth Aqueduct & Sewer Authority Revenue: | | | | | | | | | | | | | | | | |
Senior Lien, Series A, Refunding | | | 5.000 | % | | | 7/1/47 | | | | 3,700,000 | | | | 3,552,477 | (d) |
Series B, Refunding | | | 5.000 | % | | | 7/1/33 | | | | 1,340,000 | | | | 1,345,513 | (d) |
Puerto Rico Commonwealth, GO: | | | | | | | | | | | | | | | | |
CAB, Restructured, Series A-1 | | | 0.000 | % | | | 7/1/24 | | | | 15,634 | | | | 14,367 | |
CAB, Restructured, Series A-1 | | | 0.000 | % | | | 7/1/33 | | | | 60,471 | | | | 33,194 | |
Restructured, Series A-1 | | | 5.250 | % | | | 7/1/23 | | | | 26,240 | | | | 26,355 | |
Restructured, Series A-1 | | | 5.375 | % | | | 7/1/25 | | | | 52,334 | | | | 53,089 | |
Restructured, Series A-1 | | | 5.625 | % | | | 7/1/27 | | | | 51,860 | | | | 53,117 | |
Restructured, Series A-1 | | | 5.625 | % | | | 7/1/29 | | | | 51,018 | | | | 52,296 | |
Restructured, Series A-1 | | | 5.750 | % | | | 7/1/31 | | | | 49,554 | | | | 50,901 | |
Restructured, Series A-1 | | | 4.000 | % | | | 7/1/33 | | | | 46,990 | | | | 40,944 | |
Restructured, Series A-1 | | | 4.000 | % | | | 7/1/35 | | | | 42,237 | | | | 36,020 | |
Restructured, Series A-1 | | | 4.000 | % | | | 7/1/37 | | | | 36,251 | | | | 30,298 | |
Restructured, Series A-1 | | | 4.000 | % | | | 7/1/41 | | | | 49,287 | | | | 39,613 | |
See Notes to Financial Statements.
| | | | |
| Western Asset Managed Municipals Fund Inc. 2022 Semi-Annual Report | | | | 17 |
Schedule of investments (unaudited) (cont’d)
November 30, 2022
Western Asset Managed Municipals Fund Inc.
(Percentages shown based on Fund net assets)
| | | | | | | | | | | | | | | | |
| Security | | Rate | | | Maturity Date | | | Face Amount | | | Value | |
Puerto Rico — continued | | | | | | | | | | | | | | | | |
Restructured, Series A-1 | | | 4.000 | % | | | 7/1/46 | | | $ | 51,258 | | | $ | 39,589 | |
Subseries CW | | | 0.000 | % | | | 11/1/43 | | | | 221,913 | | | | 101,248 | (b) |
Puerto Rico Electric Power Authority Revenue: | | | | | | | | | | | | | | | | |
Series A | | | 5.000 | % | | | 7/1/42 | | | | 2,230,000 | | | | 1,650,200 | *(h) |
Series A | | | 5.050 | % | | | 7/1/42 | | | | 350,000 | | | | 258,125 | *(h) |
Series XX | | | 5.250 | % | | | 7/1/40 | | | | 3,495,000 | | | | 2,595,037 | *(h) |
Series ZZ, Refunding | | | 5.250 | % | | | 7/1/18 | | | | 1,250,000 | | | | 921,875 | *(i) |
Puerto Rico Sales Tax Financing Corp., Sales Tax Revenue: | | | | | | | | | | | | | | | | |
CAB, Restructured, Series A-1 | | | 0.000 | % | | | 7/1/27 | | | | 960,000 | | | | 773,746 | |
CAB, Restructured, Series A-1 | | | 0.000 | % | | | 7/1/46 | | | | 6,030,000 | | | | 1,519,711 | |
Restructured, Series A-1 | | | 4.550 | % | | | 7/1/40 | | | | 230,000 | | | | 214,206 | |
Restructured, Series A-1 | | | 4.750 | % | | | 7/1/53 | | | | 400,000 | | | | 365,482 | |
Restructured, Series A-1 | | | 5.000 | % | | | 7/1/58 | | | | 3,600,000 | | | | 3,415,719 | |
Restructured, Series A-2 | | | 4.329 | % | | | 7/1/40 | | | | 6,380,000 | | | | 5,779,773 | |
Restructured, Series A-2A | | | 4.550 | % | | | 7/1/40 | | | | 3,550,000 | | | | 3,306,223 | |
Total Puerto Rico | | | | | | | | | | | | | | | 26,269,118 | |
South Carolina — 0.7% | | | | | | | | | | | | | | | | |
South Carolina State Jobs-EDA Hospital Facilities Revenue, Bon Secours Mercy Health Inc., Series A, Refunding | | | 4.000 | % | | | 12/1/44 | | | | 2,000,000 | | | | 1,858,394 | |
South Carolina State Ports Authority Revenue, Series 2018 | | | 5.000 | % | | | 7/1/48 | | | | 1,750,000 | | | | 1,786,114 | (c) |
Total South Carolina | | | | | | | | | | | | | | | 3,644,508 | |
South Dakota — 0.1% | | | | | | | | | | | | | | | | |
South Dakota State HEFA Revenue, Regional Health | | | 5.000 | % | | | 9/1/40 | | | | 500,000 | | | | 512,688 | |
Tennessee — 2.3% | | | | | | | | | | | | | | | | |
Clarksville, TN, Water, Sewer & Gas Revenue, Series A | | | 4.000 | % | | | 2/1/51 | | | | 2,500,000 | | | | 2,358,787 | |
Knox County, TN, Health, Educational & Housing Facility Board Revenue, University Health System Inc., Series A | | | 5.000 | % | | | 9/1/40 | | | | 1,200,000 | | | | 1,213,589 | |
Metropolitan Government of Nashville & Davidson County, TN, Water & Sewer Revenue: | | | | | | | | | | | | | | | | |
Subordinated, Green Bonds, Series A | | | 5.000 | % | | | 7/1/42 | | | | 500,000 | | | | 530,187 | |
See Notes to Financial Statements.
| | | | |
18 | | | | Western Asset Managed Municipals Fund Inc. 2022 Semi-Annual Report |
Western Asset Managed Municipals Fund Inc.
(Percentages shown based on Fund net assets)
| | | | | | | | | | | | | | | | |
| Security | | Rate | | | Maturity Date | | | Face Amount | | | Value | |
Tennessee — continued | | | | | | | | | | | | | | | | |
Subordinated, Series B, Refunding | | | 5.000 | % | | | 7/1/46 | | | $ | 1,000,000 | | | $ | 1,053,080 | |
Tennessee State Energy Acquisition Corp., Natural Gas Revenue, Series 2018 | | | 4.000 | % | | | 11/1/25 | | | | 6,500,000 | | | | 6,471,479 | (a)(b) |
Total Tennessee | | | | | | | | | | | | | | | 11,627,122 | |
Texas — 7.8% | | | | | | | | | | | | | | | | |
Alamo, TX, Regional Mobility Authority, Vehicle Registration Fee Revenue, Senior Lien | | | 5.000 | % | | | 6/15/46 | | | | 1,300,000 | | | | 1,376,052 | (e) |
Arlington, TX, Special Tax Revenue, Senior Lien, Series A, AGM | | | 5.000 | % | | | 2/15/48 | | | | 1,250,000 | | | | 1,301,203 | |
Austin, TX, Airport System Revenue: | | | | | | | | | | | | | | | | |
Series 2022 | | | 5.000 | % | | | 11/15/52 | | | | 1,500,000 | | | | 1,533,553 | (c) |
Series B | | | 5.000 | % | | | 11/15/39 | | | | 2,520,000 | | | | 2,626,147 | (c) |
Central Texas Regional Mobility Authority Revenue, Senior Lien, Series E | | | 4.000 | % | | | 1/1/50 | | | | 3,300,000 | | | | 3,026,317 | |
Forney, TX, ISD, GO, Unlimited Tax School Building Bonds, Series 2019, PSF - GTD | | | 5.000 | % | | | 2/15/49 | | | | 500,000 | | | | 528,442 | |
Grand Parkway Transportation Corp., TX, System Toll Revenue, Convertible CAB, Step bond, Series A, B and C (0.000% to 10/1/23 then 5.500%) | | | 0.000 | % | | | 10/1/36 | | | | 4,000,000 | | | | 4,244,233 | |
Harris County, TX, Cultural Education Facilities Finance Corp., Hospital Revenue, Texas Children’s Hospital, Series B, Refunding | | | 5.000 | % | | | 10/1/31 | | | | 1,250,000 | | | | 1,404,601 | (a)(b) |
Harris County, TX, Health Facilities Development Corp. Revenue, School Health Care System, Series B | | | 5.750 | % | | | 7/1/27 | | | | 845,000 | | | | 907,554 | (f) |
Hays, TX, ISD, GO, Unlimited Tax School Building Bonds, PSF - GTD | | | 4.000 | % | | | 2/15/47 | | | | 1,250,000 | | | | 1,237,805 | |
Houston, TX, Airport System Revenue: | | | | | | | | | | | | | | | | |
Series B-1 | | | 5.000 | % | | | 7/15/30 | | | | 5,500,000 | | | | 5,534,546 | (c) |
Special Facilities, United Airlines Inc., Terminal Improvement Project, Series B-1 | | | 4.000 | % | | | 7/15/41 | | | | 1,500,000 | | | | 1,260,642 | (c) |
Subordinated Lien, Series A, Refunding | | | 4.000 | % | | | 7/1/40 | | | | 2,000,000 | | | | 1,895,612 | (c) |
Houston, TX, Combined Utility System Revenue, First Lien, Series D, Refunding | | | 5.000 | % | | | 11/15/44 | | | | 1,000,000 | | | | 1,028,119 | |
Love Field, TX, Airport Modernization Corp., General Airport Revenue: | | | | | | | | | | | | | | | | |
Series 2017 | | | 5.000 | % | | | 11/1/33 | | | | 120,000 | | | | 124,749 | (c) |
Series 2017 | | | 5.000 | % | | | 11/1/36 | | | | 120,000 | | | | 123,708 | (c) |
See Notes to Financial Statements.
| | | | |
| Western Asset Managed Municipals Fund Inc. 2022 Semi-Annual Report | | | | 19 |
Schedule of investments (unaudited) (cont’d)
November 30, 2022
Western Asset Managed Municipals Fund Inc.
(Percentages shown based on Fund net assets)
| | | | | | | | | | | | | | | | |
| Security | | Rate | | | Maturity Date | | | Face Amount | | | Value | |
Texas — continued | | | | | | | | | | | | | | | | |
New Hope Cultural Education Facilities Finance Corp., TX, Student Housing Revenue, Collegiate Housing College Station, AGM | | | 5.000 | % | | | 4/1/46 | | | $ | 750,000 | | | $ | 753,609 | |
Newark, TX, Higher Education Finance Corp., Education Revenue, TLC Academy, Series A | | | 4.000 | % | | | 8/15/51 | | | | 1,000,000 | | | | 740,435 | |
North Texas Tollway Authority Revenue: | | | | | | | | | | | | | | | | |
Series A, Refunding | | | 5.000 | % | | | 1/1/39 | | | | 825,000 | | | | 856,845 | |
Series B, Refunding | | | 5.000 | % | | | 1/1/40 | | | | 2,000,000 | | | | 2,004,129 | |
Series B, Refunding | | | 5.000 | % | | | 1/1/45 | | | | 2,105,000 | | | | 2,155,025 | |
Port Beaumont, TX, Navigation District Dock and Wharf Facility Revenue, Jefferson Gulf Coast Energy Project, Series A | | | 3.000 | % | | | 1/1/50 | | | | 400,000 | | | | 241,450 | (c)(d) |
Tarrant County, TX, Cultural Education Facilities Finance Corp., Hospital Revenue, Methodist Hospitals of Dallas | | | 4.000 | % | | | 10/1/42 | | | | 1,750,000 | | | | 1,676,002 | |
Texas State Private Activity Bond Surface Transportation Corp. Revenue, Senior Lien, Blueridge Transportation Group LLC | | | 5.000 | % | | | 12/31/45 | | | | 1,600,000 | | | | 1,616,314 | (c) |
Woodloch, TX, Health Facilities Development Corp., Senior Housing Revenue: | | | | | | | | | | | | | | | | |
Inspired Living at Lewisville Project, Series A-1 | | | 6.750 | % | | | 12/1/51 | | | | 500,000 | | | | 301,250 | *(d)(h) |
Subordinated, Inspired Living at Lewisville Project, Series B | | | 10.000 | % | | | 12/1/51 | | | | 150,000 | | | | 7,500 | *(h) |
Total Texas | | | | | | | | | | | | | | | 38,505,842 | |
Utah — 1.5% | | | | | | | | | | | | | | | | |
Salt Lake City, UT, Airport Revenue, Salt Lake City International Airport, Series A | | | 5.000 | % | | | 7/1/43 | | | | 5,250,000 | | | | 5,356,560 | (c) |
Utah State Charter School Finance Authority, Charter School Revenue, Syracuse Arts Academy Project, UT CSCE | | | 5.000 | % | | | 4/15/47 | | | | 1,000,000 | | | | 1,012,354 | |
Utah State Infrastructure Agency, Telecommunications Revenue: | | | | | | | | | | | | | | | | |
Series 2019 | | | 4.000 | % | | | 10/15/39 | | | | 1,000,000 | | | | 864,983 | |
Series 2021 | | | 4.000 | % | | | 10/15/38 | | | | 500,000 | | | | 436,649 | |
Total Utah | | | | | | | | | | | | | | | 7,670,546 | |
Virginia — 2.0% | | | | | | | | | | | | | | | | |
Arlington County, VA, IDA, Hospital Revenue, Virginia Hospital Center, Refunding | | | 5.000 | % | | | 7/1/35 | | | | 700,000 | | | | 759,334 | |
See Notes to Financial Statements.
| | | | |
20 | | | | Western Asset Managed Municipals Fund Inc. 2022 Semi-Annual Report |
Western Asset Managed Municipals Fund Inc.
(Percentages shown based on Fund net assets)
| | | | | | | | | | | | | | | | |
| Security | | Rate | | | Maturity
Date | | | Face
Amount | | | Value | |
Virginia — continued | | | | | | | | | | | | | | | | |
Virginia State Port Authority, Port Facilities Revenue: | | | | | | | | | | | | | | | | |
Series B, Refunding | | | 5.000 | % | | | 7/1/41 | | | $ | 1,100,000 | | | $ | 1,145,166 | (c) |
Series B, Refunding | | | 5.000 | % | | | 7/1/45 | | | | 1,500,000 | | | | 1,557,664 | (c) |
Virginia State Small Business Financing Authority Revenue: | | | | | | | | | | | | | | | | |
National Senior Campuses, Inc., Series A, Refunding | | | 5.000 | % | | | 1/1/32 | | | | 500,000 | | | | 538,296 | |
National Senior Campuses, Inc., Series A, Refunding | | | 5.000 | % | | | 1/1/34 | | | | 300,000 | | | | 321,198 | |
Senior Lien, 95 Express Lanes LLC Project, Refunding | | | 5.000 | % | | | 7/1/35 | | | | 3,000,000 | | | | 3,118,256 | (c) |
Senior Lien, 95 Express Lanes LLC Project, Refunding | | | 5.000 | % | | | 1/1/37 | | | | 1,000,000 | | | | 1,029,930 | (c) |
Senior Lien, I-495 HOT Lanes Project, Refunding | | | 5.000 | % | | | 12/31/47 | | | | 1,250,000 | | | | 1,291,118 | (c) |
Total Virginia | | | | | | | | | | | | | | | 9,760,962 | |
Washington — 1.9% | | | | | | | | | | | | | | | | |
Port of Seattle, WA, Intermediate Lien Revenue: | | | | | | | | | | | | | | | | |
Series 2019 | | | 4.000 | % | | | 4/1/44 | | | | 750,000 | | | | 669,825 | (c) |
Series 2019 | | | 5.000 | % | | | 4/1/44 | | | | 1,500,000 | | | | 1,539,170 | (c) |
Series 2022, Refunding | | | 5.000 | % | | | 8/1/41 | | | | 2,500,000 | | | | 2,612,375 | (c) |
Series C | | | 5.000 | % | | | 5/1/42 | | | | 1,500,000 | | | | 1,532,841 | (c) |
Washington State Health Care Facilities Authority Revenue: | | | | | | | | | | | | | | | | |
Seattle Cancer Care Alliance, Refunding | | | 5.000 | % | | | 12/1/33 | | | | 245,000 | | | | 263,103 | |
Seattle Cancer Care Alliance, Refunding | | | 4.000 | % | | | 12/1/45 | | | | 1,200,000 | | | | 1,089,021 | |
Seattle Cancer Care Alliance, Refunding | | | 5.000 | % | | | 9/1/50 | | | | 1,500,000 | | | | 1,533,258 | |
Total Washington | | | | | | | | | | | | | | | 9,239,593 | |
Wisconsin — 1.1% | | | | | | | | | | | | | | | | |
Mount Pleasant, WI, Tax Increment Revenue, Series A | | | 5.000 | % | | | 4/1/48 | | | | 2,500,000 | | | | 2,580,506 | |
Public Finance Authority, WI, Revenue: | | | | | | | | | | | | | | | | |
Carmelite System Inc., Obligated Group, Series 2020, Refunding | | | 5.000 | % | | | 1/1/40 | | | | 500,000 | | | | 498,273 | |
See Notes to Financial Statements.
| | | | |
| Western Asset Managed Municipals Fund Inc. 2022 Semi-Annual Report | | | | 21 |
Schedule of investments (unaudited) (cont’d)
November 30, 2022
Western Asset Managed Municipals Fund Inc.
(Percentages shown based on Fund net assets)
| | | | | | | | | | | | | | | | |
| Security | | Rate | | | Maturity
Date | | | Face
Amount | | | Value | |
Wisconsin — continued | | | | | | | | | | | | | | | | |
Cone Health, Series A | | | 5.000 | % | | | 10/1/52 | | | $ | 1,500,000 | | | $ | 1,553,473 | |
Public Finance Authority, WI, Student Housing Revenue, University of Hawai’i Foundation Project, Green Bonds, Series A-1 | | | 4.000 | % | | | 7/1/51 | | | | 1,390,000 | | | | 1,012,138 | (d) |
Total Wisconsin | | | | | | | | | | | | | | | 5,644,390 | |
Total Municipal Bonds (Cost — $736,953,961) | | | | | | | | | | | | | | | 726,737,273 | |
| Municipal Bonds Deposited in Tender Option Bond Trust(j) — 3.2% | | | | | | | | | | | | | |
New York — 3.2% | | | | | | | | | | | | | | | | |
New York City, NY, Municipal Water Finance Authority, Water & Sewer System Revenue, Second General Resolution Fiscal 2023, Subseries AA-1 | | | 5.250 | % | | | 6/15/52 | | | | 6,920,000 | | | | 7,619,079 | |
New York State Dormitory Authority, State Personal Income Tax Revenue, General Obligations Bonds, Series A | | | 4.000 | % | | | 3/15/45 | | | | 8,480,000 | | | | 8,164,747 | |
Total New York | | | | | | | | | | | | | | | 15,783,826 | |
Total Municipal Bonds Deposited in Tender Option Bond Trust (Cost — $15,924,663) | | | | | | | | 15,783,826 | |
Total Investments before Short-Term Investments (Cost — $752,878,624) | | | | 742,521,099 | |
| Short-Term Investments — 0.7% | | | | | | | | | | | | | | | | |
| Municipal Bonds — 0.7% | | | | | | | | | | | | | | | | |
Florida — 0.1% | | | | | | | | | | | | | | | | |
Hillsborough County, FL, IDA, Healthcare System Revenue: | | | | | | | | | | | | | | | | |
Baycare Health System, Series B, Refunding, LOC - TD Bank N.A. | | | 1.000 | % | | | 11/1/38 | | | | 200,000 | | | | 200,000 | (k)(l) |
Baycare Health System, Series C, Refunding, LOC - TD Bank N.A. | | | 1.800 | % | | | 11/1/38 | | | | 300,000 | | | | 300,000 | (k)(l) |
Total Florida | | | | | | | | | | | | | | | 500,000 | |
Massachusetts — 0.1% | | | | | | | | | | | | | | | | |
Massachusetts State DFA Revenue, Boston University, Series U-6E, Refunding, LOC - TD Bank N.A. | | | 1.000 | % | | | 10/1/42 | | | | 135,000 | | | | 135,000 | (k)(l) |
Massachusetts State HEFA Revenue, Baystate Medical Center, Series K-1, LOC - TD Bank N.A. | | | 1.000 | % | | | 7/1/39 | | | | 300,000 | | | | 300,000 | (k)(l) |
Total Massachusetts | | | | | | | | | | | | | | | 435,000 | |
See Notes to Financial Statements.
| | | | |
22 | | | | Western Asset Managed Municipals Fund Inc. 2022 Semi-Annual Report |
Western Asset Managed Municipals Fund Inc.
(Percentages shown based on Fund net assets)
| | | | | | | | | | | | | | | | |
| Security | | Rate | | | Maturity
Date | | | Face
Amount | | | Value | |
Mississippi — 0.1% | | | | | | | | | | | | | | | | |
Mississippi State Business Finance Corp., Gulf Opportunity Zone, IDR, Chevron USA Inc. Project, Series K | | | 1.000 | % | | | 11/1/35 | | | $ | 600,000 | | | $ | 600,000 | (k)(l) |
Nevada — 0.1% | | | | | | | | | | | | | | | | |
Nevada State Housing Division, Multi Unit Housing Revenue, Series A, LOC - FNMA, LIQ - FNMA | | | 1.900 | % | | | 4/15/33 | | | | 300,000 | | | | 300,000 | (c)(k)(l) |
New Jersey — 0.0%†† | | | | | | | | | | | | | | | | |
New Jersey State EDA Revenue, South Jersey Gas Co., Series 2006-1, Remarketing, LOC - JPMorgan Chase & Co. | | | 1.850 | % | | | 4/1/36 | | | | 100,000 | | | | 100,000 | (c)(k)(l) |
New York — 0.3% | | | | | | | | | | | | | | | | |
New York City, NY, GO, Subseries I-4, Refunding, LOC - TD Bank N.A. | | | 1.000 | % | | | 4/1/36 | | | | 1,000,000 | | | | 1,000,000 | (k)(l) |
New York City, NY, Municipal Water Finance Authority, Water & Sewer System Revenue, Second General Resolution Fiscal 2009, Subseries BB-1, Refunding, SPA - UBS AG | | | 1.020 | % | | | 6/15/39 | | | | 200,000 | | | | 200,000 | (k)(l) |
Total New York | | | | | | | | | | | | | | | 1,200,000 | |
Oregon — 0.0%†† | | | | | | | | | | | | | | | | |
Oregon State Facilities Authority Revenue, Peacehealth, Series B, Refunding, LOC - TD Bank N.A. | | | 1.000 | % | | | 8/1/34 | | | | 200,000 | | | | 200,000 | (k)(l) |
Pennsylvania — 0.0%†† | | | | | | | | | | | | | | | | |
Lancaster County, PA, Hospital Authority Revenue, Series D, Refunding, LOC - JPMorgan Chase & Co. | | | 1.100 | % | | | 7/1/34 | | | | 100,000 | | | | 100,000 | (k)(l) |
Total Municipal Bonds (Cost — $3,435,000) | | | | | | | | | | | | | | | 3,435,000 | |
See Notes to Financial Statements.
| | | | |
| Western Asset Managed Municipals Fund Inc. 2022 Semi-Annual Report | | | | 23 |
Schedule of investments (unaudited) (cont’d)
November 30, 2022
Western Asset Managed Municipals Fund Inc.
(Percentages shown based on Fund net assets)
| | | | | | | | | | | | |
| Security | | Rate | | | Shares | | | Value | |
| Money Market Funds — 0.0%†† | | | | | | | | | | | | |
Western Asset Premier Institutional Government Reserves, Premium Shares
(Cost — $22,018) | | | 3.749 | % | | | 22,018 | | | $ | 22,018 | (m)(n) |
Total Short-Term Investments (Cost — $3,457,018) | | | | 3,457,018 | |
Total Investments — 150.4% (Cost — $756,335,642) | | | | 745,978,117 | |
Auction Rate Cumulative Preferred Stock, at Liquidation Value — (5.2)% | | | | (25,775,000) | |
Variable Rate Demand Preferred Stock, at Liquidation Value — (43.9)% | | | | (217,575,000) | |
TOB Floating Rate Notes — (1.8)% | | | | | | | | | | | (8,855,000) | |
Other Assets in Excess of Other Liabilities — 0.5% | | | | | | | | | | | 2,105,669 | |
Total Net Assets Applicable to Common Shareholders — 100.0% | | | $ | 495,878,786 | |
See Notes to Financial Statements.
| | | | |
24 | | | | Western Asset Managed Municipals Fund Inc. 2022 Semi-Annual Report |
Western Asset Managed Municipals Fund Inc.
| †† | Represents less than 0.1%. |
| * | Non-income producing security. |
| (a) | Maturity date shown represents the mandatory tender date. |
| (b) | Variable rate security. Interest rate disclosed is as of the most recent information available. Certain variable rate securities are not based on a published reference rate and spread but are determined by the issuer or agent and are based on current market conditions. These securities do not indicate a reference rate and spread in their description above. |
| (c) | Income from this issue is considered a preference item for purposes of calculating the alternative minimum tax (“AMT”). |
| (d) | Security is exempt from registration under Rule 144A of the Securities Act of 1933. This security may be resold in transactions that are exempt from registration, normally to qualified institutional buyers. This security has been deemed liquid pursuant to guidelines approved by the Board of Directors. |
| (e) | Pre-Refunded bonds are generally escrowed with U.S. government obligations and/or U.S. government agency securities. |
| (f) | Bonds are generally escrowed to maturity by government securities and/or U.S. government agency securities. |
| (g) | Securities traded on a when-issued or delayed delivery basis. |
| (h) | The coupon payment on this security is currently in default as of November 30, 2022. |
| (i) | The maturity principal is currently in default as of November 30, 2022. |
| (j) | Represents securities deposited into a special purpose entity, referred to as a Tender Option Bond (“TOB”) trust (Note 1). |
| (k) | Variable rate demand obligations (“VRDOs”) have a demand feature under which the Fund can tender them back to the issuer or liquidity provider on no more than 7 days notice. The interest rate generally resets on a daily or weekly basis and is determined on the specific interest rate reset date by the remarketing agent, pursuant to a formula specified in official documents for the VRDO, or set at the highest rate allowable as specified in official documents for the VRDO. VRDOs are benchmarked to the Securities Industry and Financial Markets Association (“SIFMA”) Municipal Swap Index. The SIFMA Municipal Swap Index is compiled from weekly interest rate resets of tax-exempt VRDOs reported to the Municipal Securities Rulemaking Board’s Short-term Obligation Rate Transparency System. |
| (l) | Maturity date shown is the final maturity date. The security may be sold back to the issuer before final maturity. |
| (m) | Rate shown is one-day yield as of the end of the reporting period. |
| (n) | In this instance, as defined in the Investment Company Act of 1940, an “Affiliated Company” represents Fund ownership of at least 5% of the outstanding voting securities of an issuer, or a company which is under common ownership or control with the Fund. At November 30, 2022, the total market value of investments in Affiliated Companies was $22,018 and the cost was $22,018 (Note 9). |
See Notes to Financial Statements.
| | | | |
| Western Asset Managed Municipals Fund Inc. 2022 Semi-Annual Report | | | | 25 |
Schedule of investments (unaudited) (cont’d)
November 30, 2022
Western Asset Managed Municipals Fund Inc.
| | |
Abbreviation(s) used in this schedule: |
| |
| AGM | | — Assured Guaranty Municipal Corporation — Insured Bonds |
| |
| BAM | | — Build America Mutual — Insured Bonds |
| |
| CAB | | — Capital Appreciation Bonds |
| |
| CDA | | — Communities Development Authority |
| |
| COP | | — Certificates of Participation |
| |
| CSCE | | — Charter School Credit Enhancement |
| |
| DFA | | — Development Finance Agency |
| |
| EDA | | — Economic Development Authority |
| |
| EDC | | — Economic Development Corporation |
| |
| EFA | | — Educational Facilities Authority |
| |
| FNMA | | — Federal National Mortgage Association |
| |
| GO | | — General Obligation |
| |
| GTD | | — Guaranteed |
| |
| HEFA | | — Health & Educational Facilities Authority |
| |
| IDA | | — Industrial Development Authority |
| |
| IDR | | — Industrial Development Revenue |
| |
| ISD | | — Independent School District |
| |
| LIQ | | — Liquidity Facility |
| |
| LOC | | — Letter of Credit |
| |
| MFA | | — Municipal Finance Authority |
| |
| MTA | | — Metropolitan Transportation Authority |
| |
| NATL | | — National Public Finance Guarantee Corporation — Insured Bonds |
| |
| PCFA | | — Pollution Control Financing Authority |
| |
| PEA | | — Public Energy Authority |
| |
| PSF | | — Permanent School Fund |
| |
| SD | | — School District |
| |
| SIFMA | | — Securities Industry and Financial Markets Association |
| |
| SPA | | — Standby Bond Purchase Agreement — Insured Bonds |
| |
| TFA | | — Transitional Finance Authority |
| |
| USD | | — Unified School District |
See Notes to Financial Statements.
| | | | |
26 | | | | Western Asset Managed Municipals Fund Inc. 2022 Semi-Annual Report |
Statement of assets and liabilities (unaudited)
November 30, 2022
| | | | |
| |
| Assets: | | | | |
Investments in unaffiliated securities, at value (Cost — $756,313,624) | | $ | 745,956,099 | |
Investments in affiliated securities, at value (Cost — $22,018) | | | 22,018 | |
Cash | | | 5,262 | |
Interest receivable | | | 10,076,994 | |
Dividends receivable from affiliated investments | | | 338 | |
Prepaid expenses | | | 35,010 | |
Total Assets | | | 756,095,721 | |
| |
| Liabilities: | | | | |
Variable Rate Demand Preferred Stock ($25,000 liquidation value per share; 8,703 shares issued and outstanding) (net of deferred offering costs of $1,231,584) (Note 5) | | | 216,343,416 | |
TOB Floating Rate Notes (Note 1) | | | 8,855,000 | |
Payable for securities purchased | | | 7,003,507 | |
Distributions payable to Common Shareholders | | | 1,691,346 | |
Investment management fee payable | | | 327,200 | |
Directors’ fees payable | | | 19,511 | |
Interest expense payable | | | 17,957 | |
Distributions payable to Auction Rate Cumulative Preferred Stockholders | | | 14,749 | |
Accrued expenses | | | 169,249 | |
Total Liabilities | | | 234,441,935 | |
Series M, T, W, Th and F Auction Rate Cumulative Preferred Stock (1,031 shares authorized and issued at $25,000 per share) (Note 6) | | | 25,775,000 | |
| Total Net Assets Applicable to Common Shareholders | | $ | 495,878,786 | |
| |
| Net Assets Applicable to Common Shareholders: | | | | |
Common stock par value ($0.001 par value; 43,367,851 shares issued and outstanding; 500,000,000 common shares authorized) | | $ | 43,368 | |
Paid-in capital in excess of par value | | | 526,847,334 | |
Total distributable earnings (loss) | | | (31,011,916) | |
| Total Net Assets Applicable to Common Shareholders | | $ | 495,878,786 | |
| |
| Common Shares Outstanding | | | 43,367,851 | |
| |
| Net Asset Value Per Common Share | | $ | 11.43 | |
See Notes to Financial Statements.
| | | | |
| Western Asset Managed Municipals Fund Inc. 2022 Semi-Annual Report | | | | 27 |
Statement of operations (unaudited)
For the Six Months Ended November 30, 2022
| | | | |
| |
| Investment Income: | | | | |
Interest | | $ | 14,797,962 | |
Dividends from affiliated investments | | | 613 | |
Total Investment Income | | | 14,798,575 | |
| |
| Expenses: | | | | |
Investment management fee (Note 2) | | | 2,055,588 | |
Distributions to Variable Rate Demand Preferred Stockholders (Notes 1 and 5) | | | 1,838,360 | |
Liquidity fees (Note 5) | | | 844,851 | |
Directors’ fees | | | 91,650 | |
Transfer agent fees | | | 72,394 | |
Legal fees | | | 70,396 | |
Remarketing fees (Note 5) | | | 55,301 | |
Fund accounting fees | | | 30,989 | |
Rating agency fees | | | 30,658 | |
Amortization of Variable Rate Demand Preferred Stock offering costs (Note 5) | | | 27,721 | |
Audit and tax fees | | | 25,076 | |
Auction agent fees | | | 22,061 | |
Interest expense (Note 1) | | | 14,152 | |
Stock exchange listing fees | | | 11,143 | |
Shareholder reports | | | 9,750 | |
Auction participation fees (Note 6) | | | 7,046 | |
Custody fees | | | 2,094 | |
Insurance | | | 1,952 | |
Miscellaneous expenses | | | 8,186 | |
Total Expenses | | | 5,219,368 | |
Less: Fee waivers and/or expense reimbursements (Note 2) | | | (35) | |
Net Expenses | | | 5,219,333 | |
| Net Investment Income | | | 9,579,242 | |
| |
| Realized and Unrealized Loss on Investments (Notes 1 and 3): | | | | |
Net Realized Loss From Unaffiliated Investment Transactions | | | (12,703,006) | |
Change in Net Unrealized Appreciation (Depreciation) From Unaffiliated Investments | | | (19,751,460) | |
| Net Loss on Investments | | | (32,454,466) | |
Distributions Paid to Auction Rate Cumulative Preferred Stockholders From Net Investment Income (Notes 1 and 6) | | | (393,708) | |
| Decrease in Net Assets Applicable to Common Shareholders From Operations | | $ | (23,268,932) | |
See Notes to Financial Statements.
| | | | |
28 | | | | Western Asset Managed Municipals Fund Inc. 2022 Semi-Annual Report |
Statements of changes in net assets
| | | | | | | | |
For the Six Months Ended November 30, 2022 (unaudited)
and the Year Ended May 31, 2022 | | November 30 | | | May 31 | |
| | |
| Operations: | | | | | | | | |
Net investment income | | $ | 9,579,242 | | | $ | 20,237,063 | |
Net realized loss | | | (12,703,006) | | | | (4,910,749) | |
Change in net unrealized appreciation (depreciation) | | | (19,751,460) | | | | (80,395,764) | |
Distributions paid to Auction Rate Cumulative Preferred Stockholders from net investment income | | | (393,708) | | | | (73,769) | |
Decrease in Net Assets Applicable to Common Shareholders From Operations | | | (23,268,932) | | | | (65,143,219) | |
| | |
| Distributions to Common Shareholders From (Note 1): | | | | | | | | |
Total distributable earnings | | | (10,148,077) | | | | (21,141,829) | |
Decrease in Net Assets From Distributions to Common Shareholders | | | (10,148,077) | | | | (21,141,829) | |
| | |
| Fund Share Transactions: | | | | | | | | |
Net increase from repurchase of Auction Rate Cumulative Preferred Shares (Note 6) | | | 92,500 | | | | — | |
Increase in Net Assets From Fund Share Transactions | | | 92,500 | | | | — | |
Decrease in Net Assets Applicable to Common Shareholders | | | (33,324,509) | | | | (86,285,048) | |
| | |
| Net Assets Applicable to Common Shareholders: | | | | | | | | |
Beginning of period | | | 529,203,295 | | | | 615,488,343 | |
End of period | | $ | 495,878,786 | | | $ | 529,203,295 | |
See Notes to Financial Statements.
| | | | |
| Western Asset Managed Municipals Fund Inc. 2022 Semi-Annual Report | | | | 29 |
Statement of cash flows (unaudited)
For the Six Months Ended November 30, 2022
| | | | |
| |
| Increase (Decrease) in Cash: | | | | |
| Cash Flows from Operating Activities: | | | | |
Net decrease in net assets applicable to common shareholders resulting from operations* | | $ | (22,875,224) | |
Adjustments to reconcile net decrease in net assets resulting from operations to net cash provided (used) by operating activities: | | | | |
Purchases of portfolio securities | | | (158,669,483) | |
Sales of portfolio securities | | | 141,232,269 | |
Net purchases, sales and maturities of short-term investments | | | 14,788,765 | |
Net amortization of premium (accretion of discount) | | | 2,004,640 | |
Decrease in receivable for securities sold | | | 1,545,675 | |
Increase in interest receivable | | | (185,980) | |
Increase in prepaid expenses | | | (13,021) | |
Increase in dividends receivable from affiliated investments | | | (310) | |
Increase in payable for securities purchased | | | 2,906,867 | |
Amortization of preferred stock offering costs | | | 27,721 | |
Decrease in investment management fee payable | | | (27,419) | |
Increase in Directors’ fees payable | | | 593 | |
Increase in interest expense payable | | | 12,331 | |
Decrease in accrued expenses | | | (3,401,784) | |
Net realized loss on investments | | | 12,703,006 | |
Change in net unrealized appreciation (depreciation) of investments | | | 19,751,460 | |
Net Cash Provided in Operating Activities** | | | 9,800,106 | |
| |
| Cash Flows from Financing Activities: | | | | |
Distributions paid on common stock (net of distributions payable) | | | (10,148,077) | |
Distributions paid on Auction Rate Cumulative Preferred Stock (net of distributions payable) | | | (384,267) | |
Repurchase of Auction Rate Cumulative Preferred Stock | | | (1,757,500) | |
Proceeds from TOB Floating Rate Notes | | | 4,615,000 | |
Repayment of TOB Floating Rate Notes | | | (2,120,000) | |
Net Cash Used by Financing Activities | | | (9,794,844) | |
| Net Increase in Cash and Restricted Cash | | | 5,262 | |
| Cash and restricted cash at beginning of period | | | — | |
| Cash and restricted cash at end of period | | $ | 5,262 | |
| * | Does not include distributions paid to Auction Rate Cumulative Preferred Stockholders. |
| ** | Included in operating expenses is $1,821 paid for interest on borrowings and $1,838,360 paid for distributions to Variable Rate Demand Preferred Stockholders. |
| | The following table provides a reconciliation of cash and restricted cash reported within the Statement of Assets and Liabilities that sums to the total of such amounts shown on the Statement of Cash Flows. |
| | | | |
| | | November 30, 2022 | |
| Cash | | $ | 5,262 | |
| Restricted cash | | | — | |
| Total cash and restricted cash shown in the Statement of Cash Flows | | $ | 5,262 | |
See Notes to Financial Statements.
| | | | |
30 | | | | Western Asset Managed Municipals Fund Inc. 2022 Semi-Annual Report |
Financial highlights
|
For a common share of capital stock outstanding throughout each year ended May 31, unless otherwise noted: |
| | | | | | | | | | | | | | | | | | | | | | | | |
| | | 20221,2 | | | 20221 | | | 20211 | | | 20201 | | | 20191 | | | 20181 | |
| | | | | | |
| Net asset value, beginning of period | | $ | 12.20 | | | $ | 14.19 | | | $ | 13.04 | | | $ | 13.75 | | | $ | 13.51 | | | $ | 13.99 | |
| | | | | | |
| Income (loss) from operations: | | | | | | | | | | | | | | | | | | | | | | | | |
Net investment income | | | 0.22 | | | | 0.47 | | | | 0.53 | | | | 0.51 | | | | 0.63 | | | | 0.66 | |
Net realized and unrealized gain (loss) | | | (0.75) | | | | (1.97) | | | | 1.15 | | | | (0.61) | | | | 0.32 | | | | (0.37) | |
Distributions paid to Auction Rate Cumulative Preferred Stockholders from net investment income | | | (0.01) | | | | (0.00) | 3 | | | (0.00) | 3 | | | (0.01) | | | | (0.02) | | | | (0.01) | |
Total income (loss) from operations | | | (0.54) | | | | (1.50) | | | | 1.68 | | | | (0.11) | | | | 0.93 | | | | 0.28 | |
| | | | | | |
| Less distributions to common shareholders from: | | | | | | | | | | | | | | | | | | | | | | | | |
Net investment income | | | (0.23) | 4 | | | (0.48) | | | | (0.53) | | | | (0.60) | | | | (0.70) | | | | (0.76) | |
Net realized gains | | | — | | | | (0.01) | | | | — | | | | — | | | | — | | | | — | |
Total distributions to common shareholders | | | (0.23) | | | | (0.49) | | | | (0.53) | | | | (0.60) | | | | (0.70) | | | | (0.76) | |
| Net increase from repurchase of Auction Rate Cumulative Preferred Shares | | | 0.00 | 3 | | | — | | | | 0.00 | 3 | | | 0.00 | 3 | | | 0.01 | | | | — | |
| | | | | | |
| Net asset value, end of period | | $ | 11.43 | | | $ | 12.20 | | | $ | 14.19 | | | $ | 13.04 | | | $ | 13.75 | | | $ | 13.51 | |
| | | | | | |
| Market price, end of period | | $ | 10.54 | | | $ | 11.13 | | | $ | 13.46 | | | $ | 12.03 | | | $ | 13.73 | | | $ | 12.71 | |
Total return, based on NAV5,6 | | | (4.38) | %7 | | | (10.86) | % | | | 13.09 | %8 | | | (0.89) | %8 | | | 7.23 | %9 | | | 2.01 | % |
Total return, based on Market Price10 | | | (3.14) | % | | | (14.06) | % | | | 16.67 | % | | | (8.35) | % | | | 14.03 | % | | | (2.89) | % |
| | | | | | |
| Net assets applicable to common shareholders, end of period (millions) | | $ | 496 | | | $ | 529 | | | $ | 615 | | | $ | 565 | | | $ | 595 | | | $ | 585 | |
| | | | | | |
| Ratios to average net assets:11 | | | | | | | | | | | | | | | | | | | | | | | | |
Gross expenses | | | 2.08 | %12 | | | 1.34 | % | | | 1.31 | % | | | 1.76 | % | | | 1.85 | % | | | 1.68 | % |
Net expenses13 | | | 2.08 | 12,14 | | | 1.34 | 14 | | | 1.31 | 14 | | | 1.76 | 14 | | | 1.85 | | | | 1.68 | |
Net investment income | | | 3.82 | 12 | | | 3.43 | | | | 3.85 | | | | 3.76 | | | | 4.74 | | | | 4.80 | |
| | | | | | |
| Portfolio turnover rate | | | 19 | % | | | 22 | % | | | 16 | % | | | 32 | % | | | 21 | % | | | 19 | % |
See Notes to Financial Statements.
| | | | |
| Western Asset Managed Municipals Fund Inc. 2022 Semi-Annual Report | | | | 31 |
Financial highlights (cont’d)
|
For a common share of capital stock outstanding throughout each year ended May 31, unless otherwise noted: |
| | | | | | | | | | | | | | | | | | | | | | | | |
| | | 20221,2 | | | 20221 | | | 20211 | | | 20201 | | | 20191 | | | 20181 | |
| | | |
| Supplemental data: | | | | | | | | | | | | | |
Auction Rate Cumulative Preferred Stock at Liquidation Value, End of Period (000s) | | $ | 25,775 | | | $ | 27,625 | | | $ | 27,625 | | | $ | 27,650 | | | $ | 28,050 | | | $ | 32,075 | |
Variable Rate Demand Preferred Stock at Liquidation Value, End of Period (000s) | | $ | 217,575 | | | $ | 217,575 | | | $ | 217,575 | | | $ | 217,575 | | | $ | 217,575 | | | $ | 217,575 | |
Asset Coverage Ratio for Auction Rate Cumulative Preferred Stock and Variable Rate Demand Preferred Stock15 | | | 304 | % | | | 316 | % | | | 351 | % | | | 331 | % | | | 342 | % | | | 334 | % |
Asset Coverage, per $25,000 Liquidation Value per Share of Auction Rate Cumulative Preferred Stock and Variable Rate Demand Preferred Stock15 | | $ | 75,943 | | | $ | 78,956 | | | $ | 87,754 | | | $ | 82,646 | | | $ | 85,598 | | | $ | 83,585 | |
| 1 | Per share amounts have been calculated using the average shares method. |
| 2 | For the six months ended November 30, 2022 (unaudited). |
| 3 | Amount represents less than $0.005 per share. |
| 4 | The actual source of the Fund’s current fiscal year distributions may be from net investment income, return of capital or a combination of both. Shareholders will be informed of the tax characteristics of the distributions after the close of the fiscal year. |
| 5 | Performance figures may reflect compensating balance arrangements, fee waivers and/or expense reimbursements. In the absence of compensating balance arrangements, fee waivers and/or expense reimbursements, the total return would have been lower. Past performance is no guarantee of future results. Total returns for periods of less than one year are not annualized. |
| 6 | The total return calculation assumes that distributions are reinvested at NAV. Past performance is no guarantee of future results. Total returns for periods of less than one year are not annualized. |
| 7 | The total return based on NAV reflects the impact of the repurchase by the Fund of a portion of its Auction Rate Cumulative Preferred Shares at 95% of the per share liquidation preference. Absent this transaction, the total return based on NAV would have been the same. |
| 8 | The total return based on NAV reflects the impact of the repurchase by the Fund of a portion of its Auction Rate Cumulative Preferred Shares at 85% of the per share liquidation preference. Absent this transaction, the total return based on NAV would have been the same. |
| 9 | The total return based on NAV reflects the impact of the repurchase by the Fund of a portion of its Auction Rate Cumulative Preferred Shares at 85% of the per share liquidation preference. Absent this transaction, the total return based on NAV would have been 7.15%. |
| 10 | The total return calculation assumes that distributions are reinvested in accordance with the Fund’s dividend reinvestment plan. Past performance is no guarantee of future results. |
| 11 | Calculated on the basis of average net assets of common stock shareholders. Ratios do not reflect the effect of dividend payments to auction rate cumulative preferred stockholders. |
| 13 | The manager has agreed to waive the Fund’s management fee to an extent sufficient to offset the net management fee payable in connection with any investment in an affiliated money market fund. |
| 14 | Reflects fee waivers and/or expense reimbursements. |
| 15 | Represents value of net assets plus the liquidation value of the auction rate cumulative preferred stock and variable rate demand preferred stock, if any, at the end of the period divided by the liquidation value of the auction rate cumulative preferred stock and variable rate demand preferred stock, if any, outstanding at the end of the period. |
See Notes to Financial Statements.
| | | | |
32 | | | | Western Asset Managed Municipals Fund Inc. 2022 Semi-Annual Report |
Notes to financial statements (unaudited)
1. Organization and significant accounting policies
Western Asset Managed Municipals Fund Inc. (the “Fund”) was incorporated in Maryland and is registered as a non-diversified, closed-end management investment company under the Investment Company Act of 1940, as amended (the “1940 Act”). The Fund’s investment objective is to seek as high a level of current income exempt from federal income tax as is consistent with preservation of capital. When pursuing its investment objective, the Fund seeks to maximize current income exempt from federal income tax as is consistent with preservation of principal.
The Fund follows the accounting and reporting guidance in Financial Accounting Standards Board (“FASB”) Accounting Standard Codification Topic 946, Financial Services - Investment Companies (“ASC 946”). The following are significant accounting policies consistently followed by the Fund and are in conformity with U.S. generally accepted accounting principles (“GAAP”), including, but not limited to, ASC 946. Estimates and assumptions are required to be made regarding assets, liabilities and changes in net assets resulting from operations when financial statements are prepared. Changes in the economic environment, financial markets and any other parameters used in determining these estimates could cause actual results to differ. Subsequent events have been evaluated through the date the financial statements were issued.
(a) Investment valuation. The valuations for fixed income securities (which may include, but are not limited to, corporate, government, municipal, mortgage-backed, collateralized mortgage obligations and asset-backed securities) and certain derivative instruments are typically the prices supplied by independent third party pricing services, which may use market prices or broker/dealer quotations or a variety of valuation techniques and methodologies. The independent third party pricing services typically use inputs that are observable such as issuer details, interest rates, yield curves, prepayment speeds, credit risks/spreads, default rates and quoted prices for similar securities. Investments in open-end funds are valued at the closing net asset value per share of each fund on the day of valuation. If independent third party pricing services are unable to supply prices for a portfolio investment, or if the prices supplied are deemed by the manager to be unreliable, the market price may be determined by the manager using quotations from one or more broker/dealers or at the transaction price if the security has recently been purchased and no value has yet been obtained from a pricing service or pricing broker. When reliable prices are not readily available, such as when the value of a security has been significantly affected by events after the close of the exchange or market on which the security is principally traded, but before the Fund calculates its net asset value, the Fund values these securities as determined in accordance with procedures approved by the Fund’s Board of Directors.
Pursuant to policies adopted by the Board of Directors, the Fund’s manager has been designated as the valuation designee and is responsible for the oversight of the daily valuation process. The Fund’s manager is assisted by the Global Fund Valuation Committee (the “Valuation Committee”). The Valuation Committee is responsible for making fair value determinations, evaluating the effectiveness of the Fund’s pricing policies, and reporting to the Fund’s manager and the Board of Directors. When determining the reliability of third party pricing information for investments owned by the Fund, the Valuation Committee,
| | | | |
| Western Asset Managed Municipals Fund Inc. 2022 Semi-Annual Report | | | | 33 |
Notes to financial statements (unaudited) (cont’d)
among other things, conducts due diligence reviews of pricing vendors, monitors the daily change in prices and reviews transactions among market participants.
The Valuation Committee will consider pricing methodologies it deems relevant and appropriate when making fair value determinations. Examples of possible methodologies include, but are not limited to, multiple of earnings; discount from market of a similar freely traded security; discounted cash-flow analysis; book value or a multiple thereof; risk premium/yield analysis; yield to maturity; and/or fundamental investment analysis. The Valuation Committee will also consider factors it deems relevant and appropriate in light of the facts and circumstances. Examples of possible factors include, but are not limited to, the type of security; the issuer’s financial statements; the purchase price of the security; the discount from market value of unrestricted securities of the same class at the time of purchase; analysts’ research and observations from financial institutions; information regarding any transactions or offers with respect to the security; the existence of merger proposals or tender offers affecting the security; the price and extent of public trading in similar securities of the issuer or comparable companies; and the existence of a shelf registration for restricted securities.
For each portfolio security that has been fair valued pursuant to the policies adopted by the Board of Directors, the fair value price is compared against the last available and next available market quotations. The Valuation Committee reviews the results of such back testing monthly and fair valuation occurrences are reported to the Board of Directors quarterly.
The Fund uses valuation techniques to measure fair value that are consistent with the market approach and/or income approach, depending on the type of security and the particular circumstance. The market approach uses prices and other relevant information generated by market transactions involving identical or comparable securities. The income approach uses valuation techniques to discount estimated future cash flows to present value.
GAAP establishes a disclosure hierarchy that categorizes the inputs to valuation techniques used to value assets and liabilities at measurement date. These inputs are summarized in the three broad levels listed below:
| • | | Level 1 — unadjusted quoted prices in active markets for identical investments |
| • | | Level 2 — other significant observable inputs (including quoted prices for similar investments, interest rates, prepayment speeds, credit risk, etc.) |
| • | | Level 3 — significant unobservable inputs (including the Fund’s own assumptions in determining the fair value of investments) |
The inputs or methodologies used to value securities are not necessarily an indication of the risk associated with investing in those securities.
| | | | |
34 | | | | Western Asset Managed Municipals Fund Inc. 2022 Semi-Annual Report |
The following is a summary of the inputs used in valuing the Fund’s assets carried at fair value:
| | | | | | | | | | | | | | | | |
ASSETS | |
| Description | | Quoted Prices
(Level 1) | | | Other Significant
Observable Inputs
(Level 2) | | | Significant
Unobservable
Inputs (Level 3) | | | Total | |
| Long-Term Investments†: | | | | | | | | | | | | | | | | |
Municipal Bonds | | | — | | | $ | 726,737,273 | | | | — | | | $ | 726,737,273 | |
Municipal Bonds Deposited in Tender Option Bond Trust | | | — | | | | 15,783,826 | | | | — | | | | 15,783,826 | |
| Total Long-Term Investments | | | — | | | | 742,521,099 | | | | — | | | | 742,521,099 | |
| Short-Term Investments†: | | | | | | | | | | | | | | | | |
Municipal Bonds | | | — | | | | 3,435,000 | | | | — | | | | 3,435,000 | |
Money Market Funds | | $ | 22,018 | | | | — | | | | — | | | | 22,018 | |
| Total Short-Term Investments | | | 22,018 | | | | 3,435,000 | | | | — | | | | 3,457,018 | |
| Total Investments | | $ | 22,018 | | | $ | 745,956,099 | | | | — | | | $ | 745,978,117 | |
| † | See Schedule of Investments for additional detailed categorizations. |
(b) Tender option bonds. The Fund may enter into tender option bond (“TOB”) transactions and may invest in inverse floating rate instruments (“Inverse Floaters”) issued in TOB transactions. The Fund may participate either in structuring an Inverse Floater or purchasing an Inverse Floater in the secondary market. When structuring an Inverse Floater, the Fund deposits securities (typically municipal bonds or other municipal securities) (the “Underlying Bonds”) into a special purpose entity, referred to as a TOB trust. The TOB trust generally issues floating rate notes (“Floaters”) to third parties and residual interest, Inverse Floaters, to the Fund. The Floaters issued by the TOB trust have interest rates which reset weekly and provide the holders of the Floaters the option to tender their notes back to the TOB trust for redemption at par at each reset date. The net proceeds of the sale of the Floaters, after expenses, are received by the Fund and may be invested in additional securities. The Inverse Floaters are inverse floating rate debt instruments, as the return on those bonds is inversely related to changes in a specified interest rate. Distributions on any Inverse Floaters paid to the Fund will be reduced or, in the extreme, eliminated as short-term interest rates rise and will increase when such interest rates fall. Floaters issued by a TOB trust may be senior to the Inverse Floaters held by the Fund. The value and market for Inverse Floaters can be volatile, and Inverse Floaters can have limited liquidity.
An investment in an Inverse Floater structured by the Fund is accounted for as a secured borrowing. The Underlying Bonds deposited into the TOB trust are included in the Fund’s Schedule of Investments and a liability for Floaters (TOB floating rate notes) issued by the TOB trust is recognized in the Fund’s Statement of Assets and Liabilities. The carrying amount of the TOB trust’s floating rate note obligations as reported on the Statement of Assets and Liabilities approximates its fair value. Interest income, including amortization, on the Underlying Bonds is recognized in the Fund’s Statements of Operations. Interest paid to holders of the Floaters, as well as other expenses related to administration, liquidity,
| | | | |
| Western Asset Managed Municipals Fund Inc. 2022 Semi-Annual Report | | | | 35 |
Notes to financial statements (unaudited) (cont’d)
remarketing and trustee services of the TOB trust, are recognized in Interest expense in the Fund’s Statement of Operations.
(c) Net asset value. The net asset value (“NAV”) of the Fund’s common stock is determined no less frequently than the close of business on the Fund’s last business day of each week (generally Friday) and on the last business day of the month. It is determined by dividing the value of the net assets available to common stock by the total number of shares of common stock outstanding. For the purpose of determining the NAV per share of the common stock, the value of the Fund’s net assets shall be deemed to equal the value of the Fund’s assets less (1) the Fund’s liabilities including the aggregate liquidation value (i.e., $25,000 per outstanding share) of the Variable Rate Demand Preferred Stock (“VRDPS”), net of deferred offering costs, and (2) the aggregate liquidation value (i.e., $25,000 per outstanding share) of the Auction Rate Cumulative Preferred Stock (“ARCPS”).
(d) Securities traded on a when-issued and delayed delivery basis. The Fund may trade securities on a when-issued or delayed delivery basis. In when-issued and delayed delivery transactions, the securities are purchased or sold by the Fund with payment and delivery taking place in the future in order to secure what is considered to be an advantageous price and yield to the Fund at the time of entering into the transaction.
Purchasing such securities involves risk of loss if the value of the securities declines prior to settlement. These securities are subject to market fluctuations and their current value is determined in the same manner as for other securities.
(e) Cash flow information. The Fund invests in securities and distributes dividends from net investment income and net realized gains, which are paid in cash and may be reinvested at the discretion of shareholders. These activities are reported in the Statements of Changes in Net Assets and additional information on cash receipts and cash payments is presented in the Statement of Cash Flows.
(f) Security transactions and investment income. Security transactions are accounted for on a trade date basis. Interest income (including interest income from payment-in-kind securities), adjusted for amortization of premium and accretion of discount, is recorded on the accrual basis. The cost of investments sold is determined by use of the specific identification method. To the extent any issuer defaults or a credit event occurs that impacts the issuer, the Fund may halt any additional interest income accruals and consider the realizability of interest accrued up to the date of default or credit event.
(g) Distributions to shareholders. Distributions to common shareholders from net investment income of the Fund, if any, are declared quarterly and paid on a monthly basis. The actual source of the Fund’s monthly distribution may be from net investment income, return of capital or a combination of both. Shareholders will be informed of the tax characteristics of the distributions after the close of the fiscal year. The Fund intends to satisfy conditions that will enable interest from municipal securities, which is exempt from federal and certain state income taxes, to retain such tax-exempt status when distributed to the common shareholders of the Fund. Distributions to common shareholders of net realized gains, if any, are taxable and are declared at least annually. Distributions to common
| | | | |
36 | | | | Western Asset Managed Municipals Fund Inc. 2022 Semi-Annual Report |
shareholders of the Fund are recorded on the ex-dividend date and are determined in accordance with income tax regulations, which may differ from GAAP.
Distributions to holders of ARCPS are accrued daily and paid on a weekly basis and are determined as described in Note 6. Distributions to holders of VRDPS are accrued on a daily basis and paid monthly as described in Note 5 and are treated as an operating expense as required by GAAP. For tax purposes, the payments made to the holders of the Fund’s VRDPS are treated as dividends or distributions.
(h) Compensating balance arrangements. The Fund has an arrangement with its custodian bank whereby a portion of the custodian’s fees is paid indirectly by credits earned on the Fund’s cash on deposit with the bank.
(i) Federal and other taxes. It is the Fund’s policy to comply with the federal income and excise tax requirements of the Internal Revenue Code of 1986 (the “Code”), as amended, applicable to regulated investment companies. Accordingly, the Fund intends to distribute its taxable income and net realized gains, if any, to shareholders in accordance with timing requirements imposed by the Code. Therefore, no federal or state income tax provision is required in the Fund’s financial statements.
Management has analyzed the Fund’s tax positions taken on income tax returns for all open tax years and has concluded that as of May 31, 2022, no provision for income tax is required in the Fund’s financial statements. The Fund’s federal and state income and federal excise tax returns for tax years for which the applicable statutes of limitations have not expired are subject to examination by the Internal Revenue Service and state departments of revenue.
(j) Reclassification. GAAP requires that certain components of net assets be reclassified to reflect permanent differences between financial and tax reporting. These reclassifications have no effect on net assets or net asset value per share.
2. Investment management agreement and other transactions with affiliates
Legg Mason Partners Fund Advisor, LLC (“LMPFA”) is the Fund’s investment manager and Western Asset Management Company, LLC (“Western Asset”) is the Fund’s subadviser. LMPFA and Western Asset are indirect, wholly-owned subsidiaries of Franklin Resources, Inc. (“Franklin Resources”).
LMPFA provides administrative and certain oversight services to the Fund. The Fund pays LMPFA an investment management fee, calculated daily and paid monthly, at an annual rate of 0.55% of the Fund’s average daily net assets. For the purposes of calculating the investment management fee, the aggregate liquidation value of the Preferred Stock is not deducted in determining the Fund’s average daily net assets.
LMPFA delegates to Western Asset the day-to-day portfolio management of the Fund. For its services, LMPFA pays Western Asset monthly 70% of the net management fee it receives from the Fund.
| | | | |
| Western Asset Managed Municipals Fund Inc. 2022 Semi-Annual Report | | | | 37 |
Notes to financial statements (unaudited) (cont’d)
The manager has agreed to waive the Fund’s management fee to an extent sufficient to offset the net management fee payable in connection with any investment in an affiliated money market fund (the “affiliated money market fund waiver”).
During the six months ended November 30, 2022, fees waived and/or expenses reimbursed amounted to $35, all of which was an affiliated money market fund waiver.
All officers and one Director of the Fund are employees of Franklin Resources or its affiliates and do not receive compensation from the Fund.
The Fund is permitted to purchase or sell securities, typically short-term variable rate demand obligations, from or to certain other affiliated funds or portfolios under specified conditions outlined in procedures adopted by the Board of Directors. The procedures have been designed to provide assurance that any purchase or sale of securities by the Fund from or to another fund or portfolio that is, or could be considered, an affiliate by virtue of having a common investment manager or subadviser (or affiliated investment manager or subadviser), common Directors and/or common officers complies with Rule 17a-7 under the 1940 Act. Further, as defined under the procedures, each transaction is effected at the current market price. For the six months ended November 30, 2022, such purchase and sale transactions (excluding accrued interest) were $17,585,000 and $26,195,000, respectively.
3. Investments
During the six months ended November 30, 2022, the aggregate cost of purchases and proceeds from sales of investments (excluding short-term investments) were as follows:
| | | | |
| Purchases | | $ | 158,669,483 | |
| Sales | | | 141,232,269 | |
At November 30, 2022, the aggregate cost of investments and the aggregate gross unrealized appreciation and depreciation of investments for federal income tax purposes were substantially as follows:
| | | | | | | | | | | | | | | | |
| | | Cost* | | | Gross
Unrealized
Appreciation | | | Gross
Unrealized
Depreciation | | | Net
Unrealized
Depreciation | |
| Securities | | $ | 747,480,642 | | | $ | 17,258,360 | | | $ | (27,615,885) | | | $ | (10,357,525) | |
| * | Cost of investments for federal income tax purposes includes the value of Inverse Floaters issued in TOB transactions (Note 1). |
4. Derivative instruments and hedging activities
During the six months ended November 30, 2022, the Fund did not invest in derivative instruments.
5. Variable rate demand preferred stock
On March 4, 2015, the Fund completed a private offering of 8,703 shares of Series 1 VRDPS. Net proceeds from the offering were used by the Fund to repurchase outstanding shares of Series M, Series T, Series W, Series TH and Series F ARCPS that had been accepted for
| | | | |
38 | | | | Western Asset Managed Municipals Fund Inc. 2022 Semi-Annual Report |
payment pursuant to the tender offer (see Note 6). Offering costs incurred by the Fund in connection with the VRDPS issuance are being amortized to expense over the life of the VRDPS.
The table below summarizes the key terms of Series 1 of the VRDPS at November 30, 2022.
| | | | | | | | | | | | | | | | |
| Series | | Mandatory
Redemption Date | | | Shares | | | Liquidation
Preference
Per Share | | | Aggregate
Liquidation
Value | |
| Series 1 | | | 3/4/2045 | | | | 8,703 | | | $ | 25,000 | | | $ | 217,575,000 | |
The VRDPS shares are not listed on any securities exchange or automated quotation system. For financial reporting purposes, the VRDPS shares are considered debt of the Fund; therefore, the liquidation value, which approximates fair value of the VRDPS shares, is recorded as a liability on the Statement of Assets and Liabilities.
Holders of VRDPS have the right to tender their VRDPS shares for remarketing at a price equal to the liquidation preference amount plus all accumulated but unpaid dividends and at a date which is no earlier than the seventh day following delivery of the notice to the tender and paying agent. The VRDPS shares include a liquidity feature that allows VRDPS holders to have their shares purchased by the liquidity provider with whom the Fund has contracted in the event of a failed remarketing where purchase orders are not sufficient in number to be matched with the sale orders. The Fund is required to redeem the VRDPS shares owned by the liquidity provider after six months of continuous, unsuccessful remarketing. The Fund pays a monthly remarketing fee at the annual rate of 0.05% of the liquidation value of each VRDPS share outstanding on the first calendar day of the preceding calendar month. These fees are shown as remarketing fees on the Statement of Operations.
Holders of VRDPS are entitled to receive monthly cumulative cash dividends, payable on the first business day of each calendar month, at a variable rate set weekly by the remarketing agent. The dividend rate is generally based upon a spread over a base rate and cannot exceed a maximum rate. In the event of a failed remarketing, the dividend rate will reset to the maximum rate. The maximum rate is determined, in part, based upon the long-term rating assigned to the VRDPS. In the event the Fund fails to make a scheduled dividend payment, all outstanding shares of the VRDPS are subject to mandatory tender.
Subject to certain conditions, the VRDPS shares may be redeemed, in whole or in part, at any time at the option of the Fund. The redemption price per share is equal to the liquidation value per share plus any accumulated but unpaid dividends. The Fund is required to redeem its VRDPS on the mandatory redemption date, March 4, 2045. In addition, the Fund is required to redeem certain of the VRDPS shares if the Fund fails to maintain certain asset coverage and rating agency guidelines.
The Fund is a party to a fee agreement with the liquidity provider that requires monthly payment of an annual liquidity fee. These fees are shown as liquidity fees on the Statement of Operations. The fee agreement between the Fund and the liquidity provider is scheduled to terminate on June 23, 2023. The Fund has the right, which is exercisable 120 to 90 days
| | | | |
| Western Asset Managed Municipals Fund Inc. 2022 Semi-Annual Report | | | | 39 |
Notes to financial statements (unaudited) (cont’d)
prior to the scheduled termination date, to request that the liquidity provider extend the term of the agreement for an additional period. The Fund may also terminate the agreement early. In the event the fee agreement is not renewed or is terminated in advance, and the Fund does not enter into a fee agreement with an alternate liquidity provider, the VRDPS will be subject to mandatory purchase by the liquidity provider prior to the termination of the fee agreement. The Fund is required to redeem any VRDPS purchased by the liquidity provider six months after the purchase date.
The VRDPS ranks senior to the Fund’s outstanding common stock and on parity with any other preferred stock. The Fund may not declare dividends or make other distributions on shares of its common stock unless the Fund has declared and paid full cumulative dividends on the VRDPS, due on or prior to the date of the common stock dividend or distribution, and meets the VRDPS asset coverage and rating agency requirements.
The holders of the VRDPS have one vote per share and vote together with the holders of common stock of the Fund as a single class except on matters affecting only the holders of VRDPS or the holders of common stock. Pursuant to the 1940 Act, holders of the VRDPS have the right to elect two Directors of the Fund, voting separately as a class.
The annualized dividend rate for the VRDPS shares for the six months ended November 30, 2022 was 1.685%. VRDPS shares issued and outstanding remained constant during the six months ended November 30, 2022.
6. Auction rate cumulative preferred stock
As of November 30, 2022, the Fund had 45 shares outstanding of Series M, 252 shares outstanding of Series T, 259 shares outstanding of Series W, 414 shares outstanding of Series Th and 61 shares outstanding of Series F, each of Auction Rate Cumulative Preferred Stock (“ARCPS”).
On January 22, 2015, the Fund announced that it had commenced an issuer tender offer for up to 100% of its outstanding ARCPS at a price equal to 90% of the liquidation preference of $25,000 per share (or $22,500 per share), plus any unpaid dividends accrued through February 27, 2015, the expiration date of the tender offer.
The Fund’s tender offers were conditioned upon the Fund closing on the private offering of VRDPS with an aggregate liquidation preference at least equal to the aggregate liquidation preference of ARCPS accepted for tender.
On March 4, 2015, the Fund announced the final results for its issuer tender offer and all shares that were validly tendered and not withdrawn during the offering period were accepted for payment. The Fund accepted for payment 1,871 Series M ARCPS, 1,717 Series T ARCPS, 1,710 Series W ARCPS, 1,466 Series Th ARCPS and 1,939 Series F ARCPS, which represented 93.55% of outstanding Series M ARCPS, 85.85% of outstanding Series T ARCPS, 85.50% of outstanding Series W ARCPS, 73.30% of outstanding Series Th ARCPS, and 96.95% of outstanding Series F ARCPS. In aggregate, the Fund accepted for payment 8,703 ARCPS, which represented 87.03% of the outstanding ARCPS. The ARCPS that were not tendered remained outstanding.
| | | | |
40 | | | | Western Asset Managed Municipals Fund Inc. 2022 Semi-Annual Report |
In September 2015, the Fund repurchased 14 Series W ARCPS in a private transaction at a price equal to 90% of the liquidation preference of $25,000 per share (or $22,500 per share), plus any unpaid dividends.
On November 27, 2018, the Fund repurchased 80 Series M and 80 Series Th ARCPS in a private transaction at a price equal to 85% of the liquidation preference of $25,000 per share (or $21,250 per share), plus any unpaid dividends.
On January 23, 2019, the Fund repurchased 1 Series M ARCPS in a private transaction at a price equal to 85% of the liquidation preference of $25,000 per share (or $21,250 per share), plus any unpaid dividends.
On November 20, 2019, the Fund repurchased 16 Series Th ARCPS in a private transaction at a price equal to 85% of the liquidation preference of $25,000 per share (or $21,250 per share), plus any unpaid dividends.
On November 17, 2020, the Fund repurchased 1 Series M ARCPS in a private transaction at a price equal to 85% of the liquidation preference of $25,000 per share (or $21,250 per share), plus any unpaid dividends.
On November 16, 2022, the Fund repurchased 2 Series M, 31 Series T, 17 Series W and 24 Series H ARCPS in a private transaction at a price equal to 95% of the liquidation preference of $25,000 per share (or $23,750 per share), plus any unpaid dividends.
The difference between the liquidation preference of the ARCPS and the actual purchase price of the tendered ARCPS was recognized by the Fund in the Statement of Changes in Net Assets as an increase in net assets applicable to common shares resulting from the tender and repurchase of the ARCPS by the Fund.
The ARCPS’ dividends are cumulative at a rate determined at an auction and the dividend period is typically seven days. The dividend rate cannot exceed a certain maximum rate, including in the event of a failed auction, unless the Board of Directors of the Fund authorizes an increased maximum rate. To the extent capital gains and other taxable income are allocated to holders of ARCPS for tax purposes, the Fund will likely have to pay higher dividends to holders of ARCPS to compensate them for the increased tax liability to them resulting from such allocation. Due to failed auctions experienced by the Fund’s ARCPS starting February 14, 2008, the Fund paid the applicable maximum rate, which is calculated using the higher of 110% of the taxable equivalent of the short-term municipal bond rate and 110% of the prevailing 30-days “AA” Financial Composite Commercial Paper Rate. The Fund may pay higher maximum rates if the rating of the Fund’s ARCPS were to be lowered by the rating agencies.
The dividend rates ranged from 1.200% to 4.470 during the six months ended November 30, 2022. At November 30, 2022, the dividend rates in effect were as follows:
| | | | | | | | | | | | | | | | | | | | |
| | | Series M | | | Series T | | | Series W | | | Series Th | | | Series F | |
| Dividend Rate | | | 4.304 | % | | | 4.304 | % | | | 4.304 | % | | | 4.304 | % | | | 4.304 | % |
| | | | |
| Western Asset Managed Municipals Fund Inc. 2022 Semi-Annual Report | | | | 41 |
Notes to financial statements (unaudited) (cont’d)
The ARCPS are redeemable under certain conditions by the Fund, or subject to mandatory redemption (if the Fund is in default of certain coverage requirements) at a redemption price equal to the liquidation preference, which is the sum of $25,000 per share plus accumulated and unpaid dividends.
The Fund is required to maintain certain asset coverages with respect to the ARCPS. If the Fund fails to maintain these coverages and does not cure any such failure within the required time period, the Fund is required to redeem a requisite number of the ARCPS in order to meet the applicable requirement. Additionally, failure to meet the foregoing asset requirements would restrict the Fund’s ability to pay dividends to common stock shareholders.
The holders of the ARCPS have one vote per share and vote together with the holders of common stock of the Fund as a single class except on matters affecting only the holders of preferred stock or the holders of common stock. Pursuant to the 1940 Act, holders of the preferred stock have the right to elect two Directors of the Fund, voting separately as a class.
Citigroup Global Markets Inc. (“CGM”), an indirect wholly-owned subsidiary of Citigroup, Inc., acts as a broker/dealer in connection with the auction of ARCPS. For all previous periods since the ARCPS have been outstanding, the participation fee has been paid at the annual rate of 0.25% of the purchase price of the ARCPS that the broker/dealer places at the auction. However, on August 3, 2009, CGM reduced its participation fee to an annual rate of 0.05% of the purchase price of the ARCPS, in the case of a failed auction. For the six months ended November 30, 2022, CGM earned $7,046 as a participating broker/dealer.
7. Distributions to common shareholders subsequent to November 30, 2022
The following distributions to common shareholders have been declared by the Fund’s Board of Directors and are payable subsequent to the period end of this report:
| | | | | | | | |
| Record Date | | Payable Date | | | Amount | |
| 11/22/2022 | | | 12/1/2022 | | | $ | 0.0390 | |
| 12/22/2022 | | | 12/30/2022 | | | $ | 0.0365 | |
| 1/24/2023 | | | 2/1/2023 | | | $ | 0.0365 | |
| 2/21/2023 | | | 3/1/2023 | | | $ | 0.0365 | |
8. Stock repurchase program
On November 16, 2015, the Fund announced that the Fund’s Board of Directors (the “Board”) had authorized the Fund to repurchase in the open market up to approximately 10% of the Fund’s outstanding common stock when the Fund’s shares are trading at a discount to net asset value. The Board has directed management of the Fund to repurchase shares of common stock at such times and in such amounts as management reasonably believes may enhance stockholder value. The Fund is under no obligation to purchase shares at any specific discount levels or in any specific amounts. During the six months ended November 30, 2022 and the year ended May 31, 2022, the Fund did not repurchase any shares.
| | | | |
42 | | | | Western Asset Managed Municipals Fund Inc. 2022 Semi-Annual Report |
9. Transactions with affiliated company
As defined by the 1940 Act, an affiliated company is one in which the Fund owns 5% or more of the outstanding voting securities, or a company which is under common ownership or control with the Fund. The following company was considered an affiliated company for all or some portion of the six months ended November 30, 2022. The following transactions were effected in such company for the six months ended November 30, 2022.
| | | | | | | | | | | | | | | | | | | | |
| | | Affiliate
Value at
May 31,
2022 | | | Purchased | | | Sold | |
| | Cost | | | Shares | | | Proceeds | | | Shares | |
| Western Asset Premier Institutional Government Reserves, Premium Shares | | $ | 7,485 | | | $ | 3,452,016 | | | | 3,452,016 | | | $ | 3,437,483 | | | | 3,437,483 | |
| | | | | | | | | | | | | | | | |
| (cont’d) | | Realized Gain (Loss) | | | Dividend
Income | | | Net Increase
(Decrease) in
Unrealized
Appreciation
(Depreciation) | | | Affiliate
Value at
November 30,
2022 | |
| Western Asset Premier Institutional Government Reserves, Premium Shares | | | — | | | $ | 613 | | | | — | | | $ | 22,018 | |
10. Deferred capital losses
As of May 31, 2022, the Fund had deferred capital losses of $6,918,219, which have no expiration date, that will be available to offset future taxable capital gains.
11. Recent accounting pronouncement
In March 2020, the Financial Accounting Standards Board (FASB) issued Accounting Standards Update (ASU) No. 2020-04, Reference Rate Reform (Topic 848) – Facilitation of the Effects of Reference Rate Reform on Financial Reporting. In January 2021, the FASB issued ASU No. 2021-01, with further amendments to Topic 848. The amendments in the ASUs provide optional temporary accounting recognition and financial reporting relief from the effect of certain types of contract modifications due to the planned discontinuation of the LIBOR and other interbank-offered based reference rates as of the end of 2021 and 2023. The ASUs are effective for certain reference rate-related contract modifications that occur during the period March 12, 2020 through December 31, 2022. Management has reviewed the requirements and believes the adoption of these ASUs will not have a material impact on the financial statements.
12. Other matters
The outbreak of the respiratory illness COVID-19 (commonly referred to as “coronavirus”) has continued to rapidly spread around the world, causing considerable uncertainty for the global economy and financial markets. The ultimate economic fallout from the pandemic,
| | | | |
| Western Asset Managed Municipals Fund Inc. 2022 Semi-Annual Report | | | | 43 |
Notes to financial statements (unaudited) (cont’d)
and the long-term impact on economies, markets, industries and individual issuers, are not known. The COVID-19 pandemic could adversely affect the value and liquidity of the Fund’s investments and negatively impact the Fund’s performance. In addition, the outbreak of COVID-19, and measures taken to mitigate its effects, could result in disruptions to the services provided to the Fund by its service providers.
* * *
The Fund’s investments, payment obligations, and financing terms may be based on floating rates, such as the London Interbank Offered Rate, or “LIBOR,” which is the offered rate for short-term Eurodollar deposits between major international banks. On March 5, 2021, the ICE Benchmark Administration, the administrator of LIBOR, stated that it will cease the publication of the overnight and one-, three-, six- and twelve-month USD LIBOR settings immediately following the LIBOR publication on Friday, June 30, 2023. All other LIBOR settings, including the one-week and two-month USD LIBOR settings, have ceased publication as of January 1, 2022. There remains uncertainty regarding the nature of any replacement rate and the impact of the transition from LIBOR on the Fund’s transactions and the financial markets generally. As such, the potential effect of a transition away from LIBOR on the Fund or the Fund’s investments cannot yet be determined.
* * *
On February 24, 2022, Russia engaged in military actions in the sovereign territory of Ukraine. The current political and financial uncertainty surrounding Russia and Ukraine may increase market volatility and the economic risk of investing in securities in these countries and may also cause uncertainty for the global economy and broader financial markets. The ultimate fallout and long-term impact from these events are not known. The Fund will continue to assess the impact on valuations and liquidity and will take any potential actions needed in accordance with procedures approved by the Board of Directors.
| | | | |
44 | | | | Western Asset Managed Municipals Fund Inc. 2022 Semi-Annual Report |
Additional shareholder information (unaudited)
Results of annual meeting of shareholders
The Annual Meeting of Shareholders of Western Asset Managed Municipals Fund Inc. was held on October 21, 2022 for the purpose of considering and voting upon the proposals presented at the Meeting. The following table provides information concerning the matters voted upon at the Meeting:
Election of Directors
| | | | | | | | | | | | | | | | | | | | | | | | |
| Nominees | | Common
Shares and Preferred
Shares,
voting
together,
Voted FOR
Election | | | Common
Shares and
Preferred
Shares,
voting
together,
WITHHELD | | | Common
Shares and
Preferred
Shares,
voting
together,
ABSTAIN | | | Preferred
Shares,
Voted FOR
Election | | | Preferred
Shares,
WITHHELD | | | Preferred
Shares
ABSTAIN | |
| Daniel P. Cronin | | | 36,706,739 | | | | 1,010,117 | | | | 327,131 | | | | N/A | | | | N/A | | | | N/A | |
| Eileen A. Kamerick | | | 36,933,747 | | | | 812,903 | | | | 297,337 | | | | N/A | | | | N/A | | | | N/A | |
| Nisha Kumar | | | N/A | | | | N/A | | | | N/A | | | | 8,890 | | | | 0 | | | | 0 | |
At November 30, 2022, in addition to Daniel P. Cronin, Eileen A. Kamerick and Nisha Kumar, the other Directors of the Fund were as follows:
Robert D. Agdern
Carol L. Colman
Paolo M. Cucchi
Jane Trust
Ratification of Selection of Independent Registered Public Accountants
To ratify the selection of PricewaterhouseCoopers LLP (“PwC”) as independent registered public accountants of the Fund for the fiscal year ended May 31, 2023.
| | | | | | |
| FOR | | AGAINST | | ABSTAIN | | BROKER NON-VOTES |
| 37,228,429 | | 526,472 | | 289,086 | | 0 |
| | | | |
| Western Asset Managed Municipals Fund Inc. | | | | 45 |
Dividend reinvestment plan (unaudited)
Unless you elect to receive distributions in cash (i.e., opt-out), all dividends, including any capital gain dividends and return of capital distributions, on your Common Stock will be automatically reinvested by Computershare Trust Company, N.A., as agent for the stockholders (the “Plan Agent”), in additional shares of Common Stock under the Fund’s Dividend Reinvestment Plan (the “Plan”). You may elect not to participate in the Plan by contacting the Plan Agent. If you do not participate, you will receive all cash distributions paid by check mailed directly to you by Computershare Trust Company, N.A., as dividend paying agent.
If you participate in the Plan, the number of shares of Common Stock you will receive will be determined as follows:
(1) If the market price of the Common Stock (plus $0.03 per share commission) on the payment date (or, if the payment date is not a NYSE trading day, the immediately preceding trading day) is equal to or exceeds the net asset value per share of the Common Stock at the close of trading on the NYSE on the payment date, the Fund will issue new Common Stock at a price equal to the greater of (a) the net asset value per share at the close of trading on the NYSE on the payment date or (b) 95% of the market price per share of the Common Stock on the payment date.
(2) If the net asset value per share of the Common Stock exceeds the market price of the Common Stock (plus $0.03 per share commission) at the close of trading on the NYSE on the payment date, the Plan Agent will receive the dividend or distribution in cash and will buy Common Stock in the open market, on the NYSE or elsewhere, for your account as soon as practicable commencing on the trading day following the payment date and terminating no later than the earlier of (a) 30 days after the dividend or distribution payment date, or (b) the payment date for the next succeeding dividend or distribution to be made to the stockholders; except when necessary to comply with applicable provisions of the federal securities laws. If during this period: (i) the market price (plus $0.03 per share commission) rises so that it equals or exceeds the net asset value per share of the Common Stock at the close of trading on the NYSE on the payment date before the Plan Agent has completed the open market purchases or (ii) if the Plan Agent is unable to invest the full amount eligible to be reinvested in open market purchases, the Plan Agent will cease purchasing Common Stock in the open market and the Fund shall issue the remaining Common Stock at a price per share equal to the greater of (a) the net asset value per share at the close of trading on the NYSE on the day prior to the issuance of shares for reinvestment or (b) 95% of the then current market price per share.
Common Stock in your account will be held by the Plan Agent in non-certificated form. Any proxy you receive will include all shares of Common Stock you have received under the Plan. You may withdraw from the Plan (i.e., opt-out) by notifying the Plan Agent in writing at P.O. Box 43006, Providence, RI 02940-3078 or by calling the Plan Agent at 1-888-888-0151. Such withdrawal will be effective immediately if notice is received by the Plan Agent not less than ten business days prior to any dividend or distribution record date; otherwise such
| | | | |
46 | | | | Western Asset Managed Municipals Fund Inc. |
withdrawal will be effective as soon as practicable after the Plan Agent’s investment of the most recently declared dividend or distribution on the Common Stock.
Plan participants who sell their shares will be charged a service charge (currently $5.00 per transaction) and the Plan Agent is authorized to deduct brokerage charges actually incurred from the proceeds (currently $0.05 per share commission). There is no service charge for reinvestment of your dividends or distributions in Common Stock. However, all participants will pay a pro rata share of brokerage commissions incurred by the Plan Agent when it makes open market purchases. Because all dividends and distributions will be automatically reinvested in additional shares of Common Stock, this allows you to add to your investment through dollar cost averaging, which may lower the average cost of your Common Stock over time. Dollar cost averaging is a technique for lowering the average cost per share over time if the Fund’s net asset value declines. While dollar cost averaging has definite advantages, it cannot assure profit or protect against loss in declining markets.
Automatically reinvesting dividends and distributions does not mean that you do not have to pay income taxes due upon receiving dividends and distributions. Investors will be subject to income tax on amounts reinvested under the Plan.
The Fund reserves the right to amend or terminate the Plan if, in the judgment of the Board of Directors, the change is warranted. The Plan may be terminated, amended or supplemented by the Fund upon notice in writing mailed to stockholders at least 30 days prior to the record date for the payment of any dividend or distribution by the Fund for which the termination or amendment is to be effective. Upon any termination, you will be sent cash for any fractional share of Common Stock in your account. You may elect to notify the Plan Agent in advance of such termination to have the Plan Agent sell part or all of your Common Stock on your behalf. Additional information about the Plan and your account may be obtained from the Plan Agent at P.O. Box 43006, Providence, RI 02940-3078 or by calling the Plan Agent at 1-888-888-0151.
| | | | |
| Western Asset Managed Municipals Fund Inc. | | | | 47 |
Western Asset
Managed Municipals Fund Inc.
Directors
Robert D. Agdern
Carol L. Colman
Daniel P. Cronin
Paolo M. Cucchi
Eileen A. Kamerick
Nisha Kumar
Jane Trust
Chairman
Officers
Jane Trust
President and Chief Executive Officer
Christopher Berarducci
Treasurer and Principal Financial Officer
Fred Jensen
Chief Compliance Officer
George P. Hoyt
Secretary and Chief Legal Officer
Thomas C. Mandia
Senior Vice President
Jeanne M. Kelly
Senior Vice President
Western Asset Managed Municipals Fund Inc.
620 Eighth Avenue
47th Floor
New York, NY 10018
Investment manager
Legg Mason Partners Fund Advisor, LLC
Subadviser
Western Asset Management Company, LLC
Custodian
The Bank of New York Mellon
Transfer agent
Computershare Inc.
P.O. Box 43006
Providence, RI 02940-3078
Auction agent
Deutsche Bank
60 Wall Street
New York, NY 10005
Independent registered public accounting firm
PricewaterhouseCoopers LLP
Baltimore, MD
Legal counsel
Simpson Thacher & Bartlett LLP
900 G Street NW
Washington, DC 20001
New York Stock Exchange Symbol
MMU
Legg Mason Funds Privacy and Security Notice
Your Privacy and the Security of Your Personal Information is Very Important to the Legg Mason Funds
This Privacy and Security Notice (the “Privacy Notice”) addresses the Legg Mason Funds’ privacy and data protection practices with respect to nonpublic personal information the Funds receive. The Legg Mason Funds include the Western Asset Money Market Funds sold by the Funds’ distributor, Franklin Distributors, LLC, as well as Legg Mason-sponsored closed-end funds. The provisions of this Privacy Notice apply to your information both while you are a shareholder and after you are no longer invested with the Funds.
The Type of Nonpublic Personal Information the Funds Collect About You
The Funds collect and maintain nonpublic personal information about you in connection with your shareholder account. Such information may include, but is not limited to:
| • | | Personal information included on applications or other forms; |
| • | | Account balances, transactions, and mutual fund holdings and positions; |
| • | | Bank account information, legal documents, and identity verification documentation; and |
| • | | Online account access user IDs, passwords, security challenge question responses. |
How the Funds Use Nonpublic Personal Information About You
The Funds do not sell or share your nonpublic personal information with third parties or with affiliates for their marketing purposes, unless you have authorized the Funds to do so. The Funds do not disclose any nonpublic personal information about you except as may be required to perform transactions or services you have authorized or as permitted or required by law.
The Funds may disclose information about you to:
| • | | Employees, agents, and affiliates on a “need to know” basis to enable the Funds to conduct ordinary business or to comply with obligations to government regulators; |
| • | | Service providers, including the Funds’ affiliates, who assist the Funds as part of the ordinary course of business (such as printing, mailing services, or processing or servicing your account with us) or otherwise perform services on the Funds’ behalf, including companies that may perform statistical analysis, market research and marketing services solely for the Funds; |
| • | | Permit access to transfer, whether in the United States or countries outside of the United States to such Funds’ employees, agents and affiliates and service providers as required to enable the Funds to conduct ordinary business, or to comply with obligations to government regulators; |
| • | | The Funds’ representatives such as legal counsel, accountants and auditors to enable the Funds to conduct ordinary business, or to comply with obligations to government regulators; |
| • | | Fiduciaries or representatives acting on your behalf, such as an IRA custodian or trustee of a grantor trust. |
|
| NOT PART OF THE SEMI-ANNUAL REPORT |
Legg Mason Funds Privacy and Security Notice (cont’d)
Except as otherwise permitted by applicable law, companies acting on the Funds’ behalf, including those outside the United States, are contractually obligated to keep nonpublic personal information the Funds provide to them confidential and to use the information the Funds share only to provide the services the Funds ask them to perform.
The Funds may disclose nonpublic personal information about you when necessary to enforce their rights or protect against fraud, or as permitted or required by applicable law, such as in connection with a law enforcement or regulatory request, subpoena, or similar legal process. In the event of a corporate action or in the event a Fund service provider changes, the Funds may be required to disclose your nonpublic personal information to third parties. While it is the Funds’ practice to obtain protections for disclosed information in these types of transactions, the Funds cannot guarantee their privacy policy will remain unchanged.
Keeping You Informed of the Funds’ Privacy and Security Practices
The Funds will notify you annually of their privacy policy as required by federal law. While the Funds reserve the right to modify this policy at any time, they will notify you promptly if this privacy policy changes.
The Funds’ Security Practices
The Funds maintain appropriate physical, electronic and procedural safeguards designed to guard your nonpublic personal information. The Funds’ internal data security policies restrict access to your nonpublic personal information to authorized employees, who may use your nonpublic personal information for Fund business purposes only.
Although the Funds strive to protect your nonpublic personal information, they cannot ensure or warrant the security of any information you provide or transmit to them, and you do so at your own risk. In the event of a breach of the confidentiality or security of your nonpublic personal information, the Funds will attempt to notify you as necessary so you can take appropriate protective steps. If you have consented to the Funds using electronic communications or electronic delivery of statements, they may notify you under such circumstances using the most current email address you have on record with them.
In order for the Funds to provide effective service to you, keeping your account information accurate is very important. If you believe that your account information is incomplete, not accurate or not current, if you have questions about the Funds’ privacy practices, or our use of your nonpublic personal information, write the Funds using the contact information on your account statements, email the Funds by clicking on the Contact Us section of the Funds’ website at www.franklintempleton.com, or contact the Funds at 1-877-721-1926 for the Western Asset Money Market Funds or 1-888-777-0102 for the Legg Mason-sponsored closed-end funds.
Revised October 2022
|
| NOT PART OF THE SEMI-ANNUAL REPORT |
Legg Mason Funds Privacy and Security Notice (cont’d)
Legg Mason California Consumer Privacy Act Policy
Although much of the personal information we collect is “nonpublic personal information” subject to federal law, residents of California may, in certain circumstances, have additional rights under the California Consumer Privacy Act (“CCPA”). For example, if you are a broker, dealer, agent, fiduciary, or representative acting by or on behalf of, or for, the account of any other person(s) or household, or a financial advisor, or if you have otherwise provided personal information to us separate from the relationship we have with personal investors, the provisions of this Privacy Policy apply to your personal information (as defined by the CCPA).
In addition to the provisions of the Legg Mason Funds Security and Privacy Notice, you may have the right to know the categories and specific pieces of personal information we have collected about you.
You also have the right to request the deletion of the personal information collected or maintained by the Funds.
If you wish to exercise any of the rights you have in respect of your personal information, you should advise the Funds by contacting them as set forth below. The rights noted above are subject to our other legal and regulatory obligations and any exemptions under the CCPA. You may designate an authorized agent to make a rights request on your behalf, subject to the identification process described below. We do not discriminate based on requests for information related to our use of your personal information, and you have the right not to receive discriminatory treatment related to the exercise of your privacy rights.
We may request information from you in order to verify your identity or authority in making such a request. If you have appointed an authorized agent to make a request on your behalf, or you are an authorized agent making such a request (such as a power of attorney or other written permission), this process may include providing a password/passcode, a copy of government issued identification, affidavit or other applicable documentation, i.e. written permission. We may require you to verify your identity directly even when using an authorized agent, unless a power of attorney has been provided. We reserve the right to deny a request submitted by an agent if suitable and appropriate proof is not provided.
For the 12-month period prior to the date of this Privacy Policy, the Legg Mason Funds have not sold any of your personal information; nor do we have any plans to do so in the future.
Contact Information
Address: Data Privacy Officer, 100 International Dr., Baltimore, MD 21202
Email: DataProtectionOfficer@franklintempleton.com
Phone: 1-800-396-4748
Revised October 2022
|
| NOT PART OF THE SEMI-ANNUAL REPORT |
Western Asset Managed Municipals Fund Inc.
Western Asset Managed Municipals Fund Inc.
620 Eighth Avenue
47th Floor
New York, NY 10018
Notice is hereby given in accordance with Section 23(c) of the Investment Company Act of 1940, as amended, that from time to time the Fund may purchase, at market prices, shares of its stock.
The Fund files its complete schedule of portfolio holdings with the Securities and Exchange Commission (“SEC”) for the first and third quarters of each fiscal year as an exhibit to its reports on Form N-PORT. The Fund’s Forms N-PORT are available on the SEC’s website at www.sec.gov. To obtain information on Form N-PORT, shareholders can call the Fund at 1-888-777-0102.
Information on how the Fund voted proxies relating to portfolio securities during the prior 12-month period ended June 30th of each year and a description of the policies and procedures that the Fund uses to determine how to vote proxies related to portfolio transactions are available (1) without charge, upon request, by calling 1-888-777-0102, (2) at www.franklintempleton.com and (3) on the SEC’s website at www.sec.gov.
Quarterly performance, semi-annual and annual reports, current net asset value and other information regarding the Fund may be found on Franklin Templeton’s website, which can be accessed at www.franklintempleton.com. Any reference to Franklin Templeton’s website in this report is intended to allow investors public access to information regarding the Fund and does not, and is not intended to, incorporate Franklin Templeton’s website in this report.
This report is transmitted to the shareholders of Western Asset Managed Municipals Fund Inc. for their information. This is not a prospectus, circular or representation intended for use in the purchase of shares of the Fund or any securities mentioned in this report.
Computershare Inc.
P.O. Box 43006
Providence, RI 02940-3078
WASX010152 1/23 SR22-4455
Not applicable.
| ITEM 3. | AUDIT COMMITTEE FINANCIAL EXPERT. |
Not applicable.
| ITEM 4. | PRINCIPAL ACCOUNTANT FEES AND SERVICES. |
Not applicable.
| ITEM 5. | AUDIT COMMITTEE OF LISTED REGISTRANTS. |
Not applicable.
| ITEM 6. | SCHEDULE OF INVESTMENTS. |
Included herein under Item 1.
| ITEM 7. | DISCLOSURE OF PROXY VOTING POLICIES AND PROCEDURES FOR CLOSED-END MANAGEMENT INVESTMENT COMPANIES. |
Not applicable.
| ITEM 8. | INVESTMENT PROFESSIONALS OF CLOSED-END MANAGEMENT INVESTMENT COMPANIES. |
Not applicable.
| ITEM 9. | PURCHASES OF EQUITY SECURITIES BY CLOSED-END MANAGEMENT INVESTMENT COMPANY AND AFFILIATED PURCHASERS. |
Not applicable.
| ITEM 10. | SUBMISSION OF MATTERS TO A VOTE OF SECURITY HOLDERS. |
Not applicable.
| ITEM 11. | CONTROLS AND PROCEDURES. |
| | (a) | The registrant’s principal executive officer and principal financial officer have concluded that the registrant’s disclosure controls and procedures (as defined in Rule 30a- 3(c) under the Investment Company Act of 1940, as amended (the “1940 Act”)) are effective as of a date within 90 days of the filing date of this report that includes the disclosure required by this paragraph, based on their evaluation of the disclosure controls and procedures required by Rule 30a-3(b) under the 1940 Act and 15d-15(b) under the Securities Exchange Act of 1934. |
| | (b) | There were no changes in the registrant’s internal control over financial reporting (as defined in Rule 30a-3(d) under the 1940 Act) that occurred during the period covered by this report that have materially affected, or are likely to materially affect the registrant’s internal control over financial reporting. |
| ITEM 12. | DISCLOSURE OF SECURITIES LENDING ACTIVITIES FOR CLOSED-END MANAGEMENT INVESTMENT COMPANIES. |
Not applicable.
(a) (1) Not applicable.
Exhibit 99.CODE ETH
(a) (2) Certifications pursuant to section 302 of the Sarbanes-Oxley Act of 2002 attached hereto.
Exhibit 99.CERT
(b) Certifications pursuant to Section 906 of the Sarbanes-Oxley Act of 2002 attached hereto.
Exhibit 99.906CERT
SIGNATURES
Pursuant to the requirements of the Securities Exchange Act of 1934 and the Investment Company Act of 1940, the registrant has duly caused this Report to be signed on its behalf by the undersigned, there unto duly authorized.
Western Asset Managed Municipals Fund Inc.
| | |
| By: | | /s/ Jane Trust |
| | Jane Trust |
| | Chief Executive Officer |
| |
| Date: | | January 25, 2023 |
Pursuant to the requirements of the Securities Exchange Act of 1934 and the Investment Company Act of 1940, this report has been signed below by the following persons on behalf of the registrant and in the capacities and on the dates indicated.
| | |
| By: | | /s/ Jane Trust |
| | Jane Trust |
| | Chief Executive Officer |
| |
| Date: | | January 25, 2023 |
| |
| By: | | /s/ Christopher Berarducci |
| | Christopher Berarducci |
| | Principal Financial Officer |
| |
| Date: | | January 25, 2023 |