Exhibit 99.2
Universal Hospital Services (UHOS) Deutsche Bank High Yield Conference October 4, 2006
2 Forward Looking Statements _ Safe Harbor Statement under the Private Securities Litigation Reform Act of 1995: Universal Hospital Services, Inc. believes statements in this presentation forward in time involve risks and uncertainties. The following factors, among others, could adversely affect our business, operations and financial condition causing our actual results to differ materially from those expressed in any forward-looking statements: our history of net losses and substantial interest expense; our need for substantial cash to operate and expand our business as planned; our substantial outstanding debt and debt service obligations; restrictions imposed by the terms of our debt; a decrease in the number of patients our customers are serving; our ability to effect change in the manner in which healthcare providers traditionally procure medical equipment; the absence of long-term commitments with customers; our ability to renew contracts with group purchasing organizations and integrated delivery networks; changes in reimbursement rates and policies by third-party payors; the impact of health care reform initiatives; the impact of significant regulation of the health care industry and the need to comply with those regulations; difficulties or delays in our continued expansion into certain of our businesses/geographic markets and developments of new businesses/geographic markets; and additional credit risks in increasing business with home care providers and nursing homes, impacts of equipment product recalls or obsolescence; increases in vendor costs that cannot be passed through to our customers; and other Risk Factors as detailed in our annual report on Form 10K for the year ended December 31, 2005, filed with the Securities and Exchange Commission. _ This presentation contains non-GAAP measures as defined by SEC rules. Reconciliations of these measures to the most directly comparable GAAP measures are contained in the appendix.
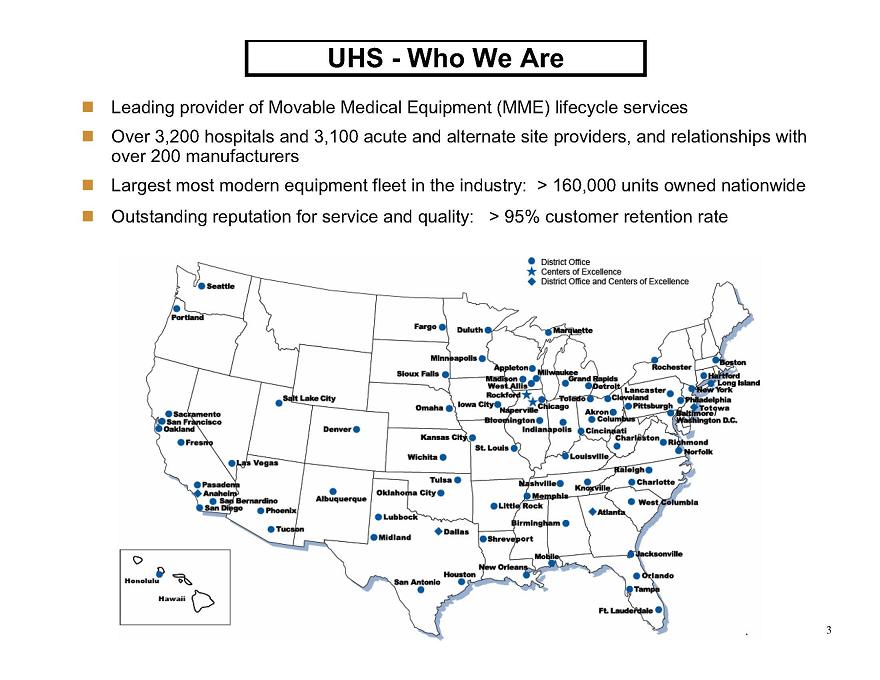
3 _ Leading provider of Movable Medical Equipment (MME) lifecycle services _ Over 3,200 hospitals and 3,100 acute and alternate site providers, and relationships with over 200 manufacturers _ Largest most modern equipment fleet in the industry: > 160,000 units owned nationwide _ Outstanding reputation for service and quality: > 95% customer retention rate UHS - Who We Are
4 _ Ownership Structure at 6/30/06: _ JW Childs Fund 74% _ Halifax Capital Partners 16% _ Management & Other 10% 100% _ Debt Structure at 6/30/06: (millions) _ 10.125% Senior Notes due 2011 $260.0 _ Secured Bank Facility $ 35.7 _ Capital Leases $ 3.7 _ Total Debt $299.4 _ UHS does not have any subsidiaries, thus all of our debt and operating activities are at the corporate level UHS - Who We Are
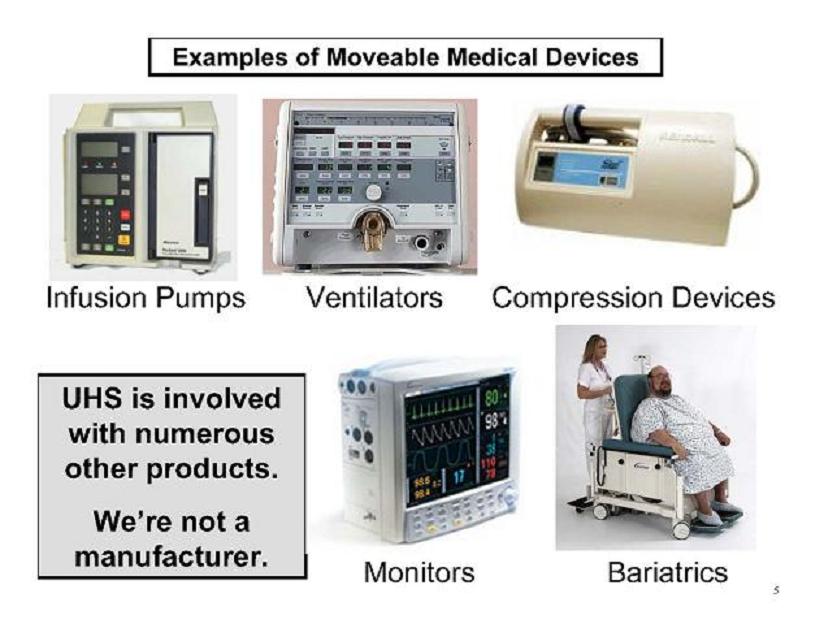
5 Examples of Moveable Medical Devices Infusion Pumps Ventilators Monitors Compression Devices Bariatrics UHS is involved with numerous other products. We’re not a manufacturer.
6 UHS - Then (1939 - 2000): “Equipment Rental Company” Medical Equipment Outsourcing Equipment Rental
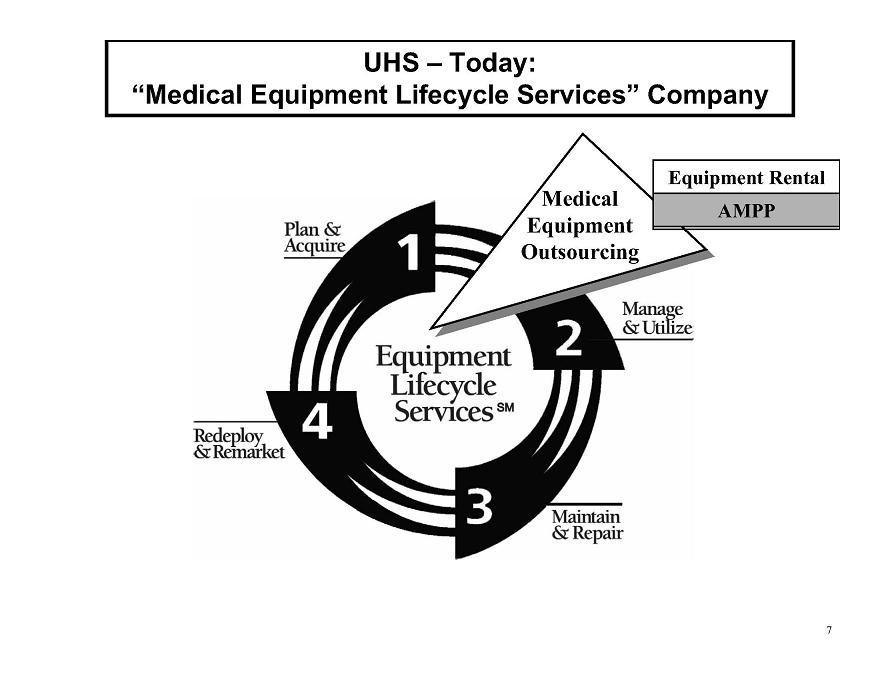
7 UHS - Today: “Medical Equipment Lifecycle Services” Company Medical Equipment Outsourcing Equipment Rental AMPP
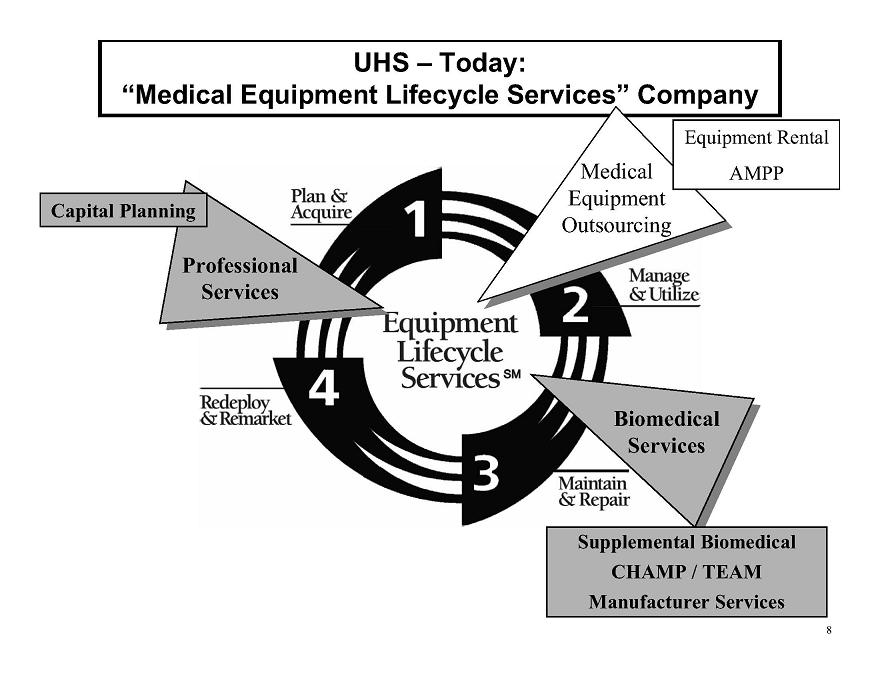
8 UHS - Today: “Medical Equipment Lifecycle Services” Company Professional Services Medical Equipment Outsourcing Biomedical Services Capital Planning Supplemental Biomedical CHAMP / TEAM Manufacturer Services Equipment Rental AMPP
9 UHS - Today: “Medical Equipment Lifecycle Services” Company Professional Services Recovery & Brokerage Medical Equipment Outsourcing Biomedical Services New & Used Equipment Sales Capital Planning Supplemental Biomed CHAMP / TEAM Manufacturer Services Equipment Rental AMPP
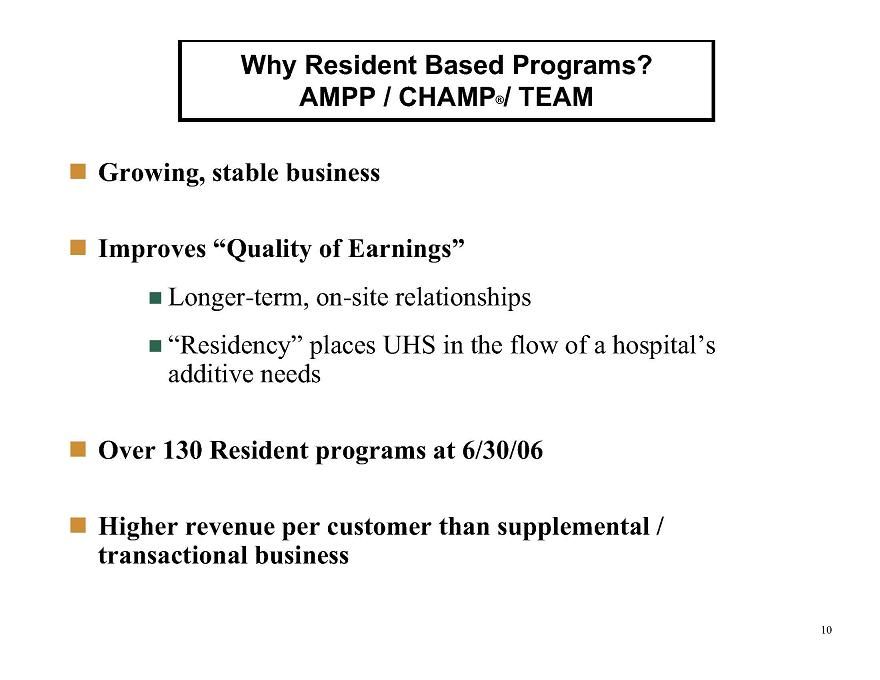
10 Why Resident Based Programs? AMPP / CHAMP / TEAM ® _ Growing, stable business _ Improves “Quality of Earnings” _ Longer-term, on-site relationships _ “Residency” places UHS in the flow of a hospital’s additive needs _ Over 130 Resident programs at 6/30/06 _ Higher revenue per customer than supplemental / transactional business
11 Market Headwinds Gasoline Costs Equipment Recalls Weak Flu Season General Uncertainty
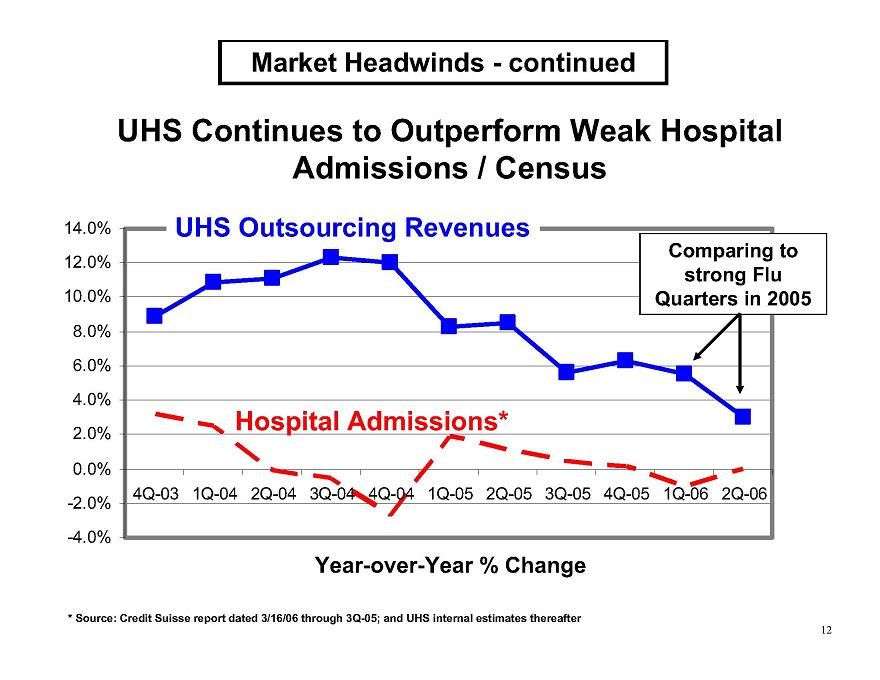
12 -4.0% -2.0% 0.0% 2.0% 4.0% 6.0% 8.0% 10.0% 12.0% 14.0% 4Q-03 1Q-04 2Q-04 3Q-04 4Q-04 1Q-05 2Q-05 3Q-05 4Q-05 1Q-06 2Q-06 UHS Outsourcing Revenues Hospital Admissions* * Source: Credit Suisse report dated 3/16/06 through 3Q-05; and UHS internal estimates thereafter UHS Continues to Outperform Weak Hospital Admissions / Census Year-over-Year % Change Comparing to strong Flu Quarters in 2005 Market Headwinds - continued
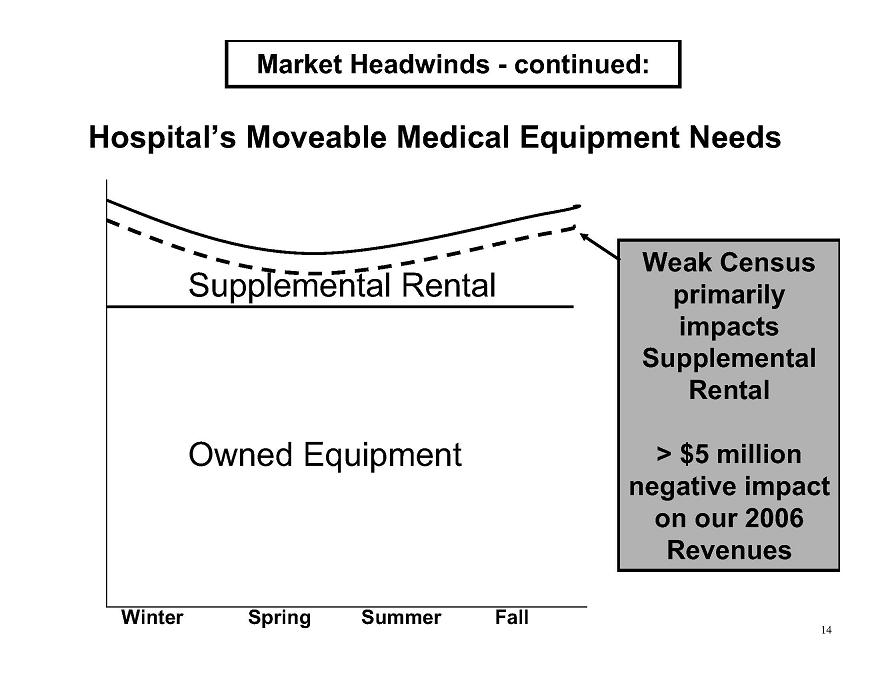
13 Market Headwinds - continued Owned Equipment Supplemental Rental Hospital’s Moveable Medical Equipment Needs Winter Fall Summer Spring Illustrative Total Needs
14 Market Headwinds - continued: Owned Equipment Supplemental Rental Weak Census primarily impacts Supplemental Rental > $5 million negative impact on our 2006 Revenues Winter Fall Summer Spring Hospital’s Moveable Medical Equipment Needs
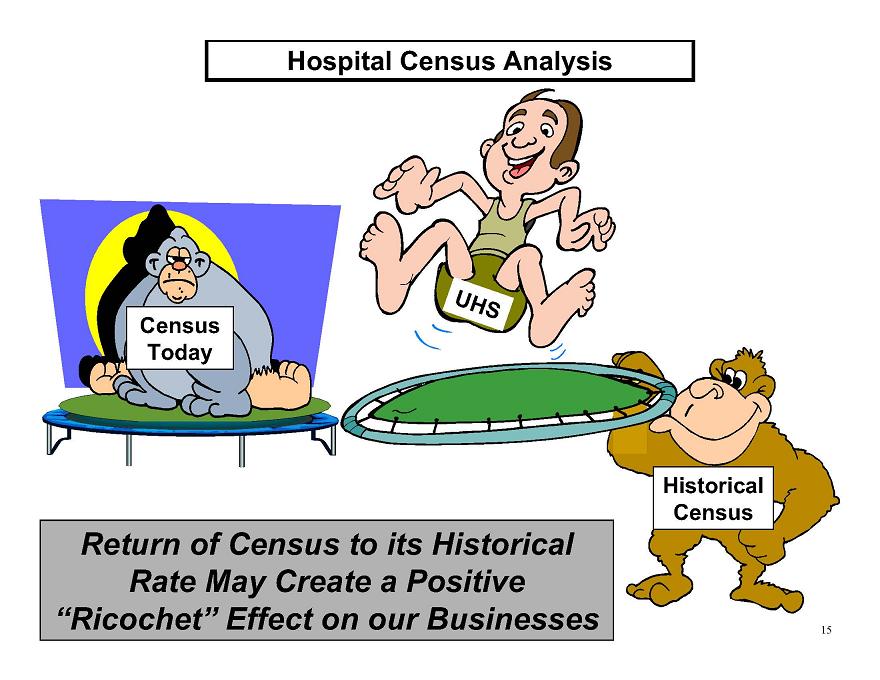
15 Hospital Census Analysis Return of Census to its Historical Rate May Create a Positive “Ricochet” Effect on our Businesses Census Today Historical Census UHS
16 Positive Trends: Lifecycle Adoption Operational Efficiencies
17 Positive Trends - continued: Resident Program Traction Sole-source GPO Agreement
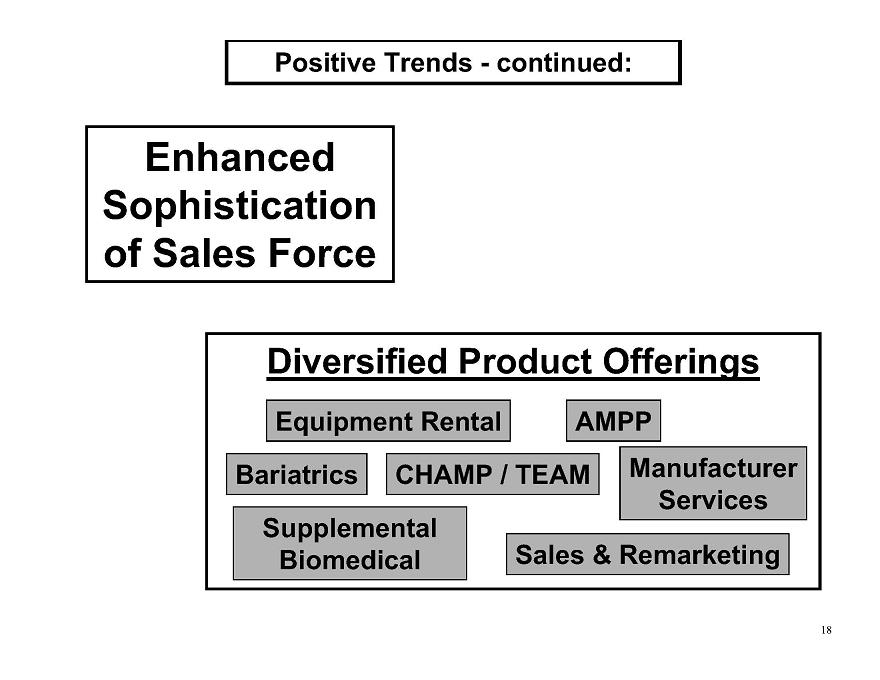
18 Positive Trends - continued: Diversified Product Offerings AMPP Sales & Remarketing Equipment Rental Manufacturer Services CHAMP / TEAM Supplemental Biomedical Bariatrics Enhanced Sophistication of Sales Force
19 Continued Capex Efficiency 0 50 100 150 200 250 1999 2000 2001 2002 2003 2004 2005 LTM JUNE 2006 Sales & Remarketing Services Net Accrual Capex 44% 30% 33% 25% 23% 22% 19% 18% Net Accrual Capex % of Revenues Acquisitions Revenues Refer to Appendix for reconciliation of Net Accrual Capex Outsourcing Positive Trends - continued:
20 2006E Capex Breakout ($ millions) Significant Capex Flexibility Maintenance Capex Growth Capex Mid $20’s Mid $20’s
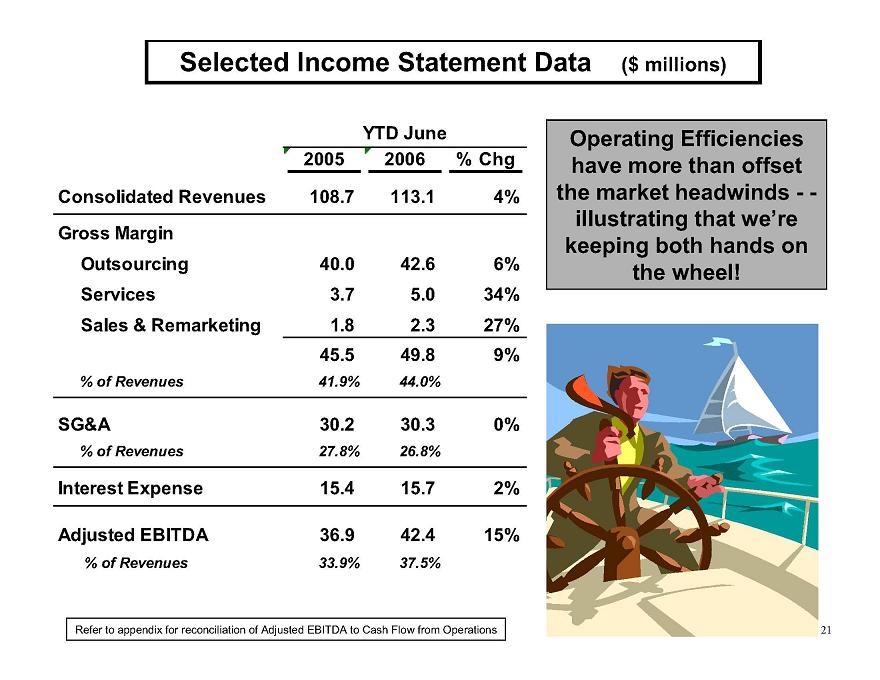
21 Selected Income Statement Data ($ millions) 2005 2006 % Chg Consolidated Revenues 108.7 113.1 4% Gross Margin Outsourcing 40.0 42.6 6% Services 3.7 5.0 34% Sales & Remarketing 1.8 2.3 27% 45.5 49.8 9% % of Revenues 41.9% 44.0% SG&A 30.2 30.3 0% % of Revenues 27.8% 26.8% Interest Expense 15.4 15.7 2% Adjusted EBITDA 36.9 42.4 15% % of Revenues 33.9% 37.5% YTD June Refer to appendix for reconciliation of Adjusted EBITDA to Cash Flow from Operations Operating Efficiencies have more than offset the market headwinds - - illustrating that we’re keeping both hands on the wheel!
22 Adjusted EBITDA Trend ($ millions) $20.0 $30.0 $40.0 $50.0 $60.0 $70.0 $80.0 $90.0 2000 2001 2002 2003 2004 2005 LTM 6/30/06 Refer to Appendix for reconciliation of Adjusted EBITDA to Cash Flow from Operations Consistent Growth in Both Good and Bad Market Settings
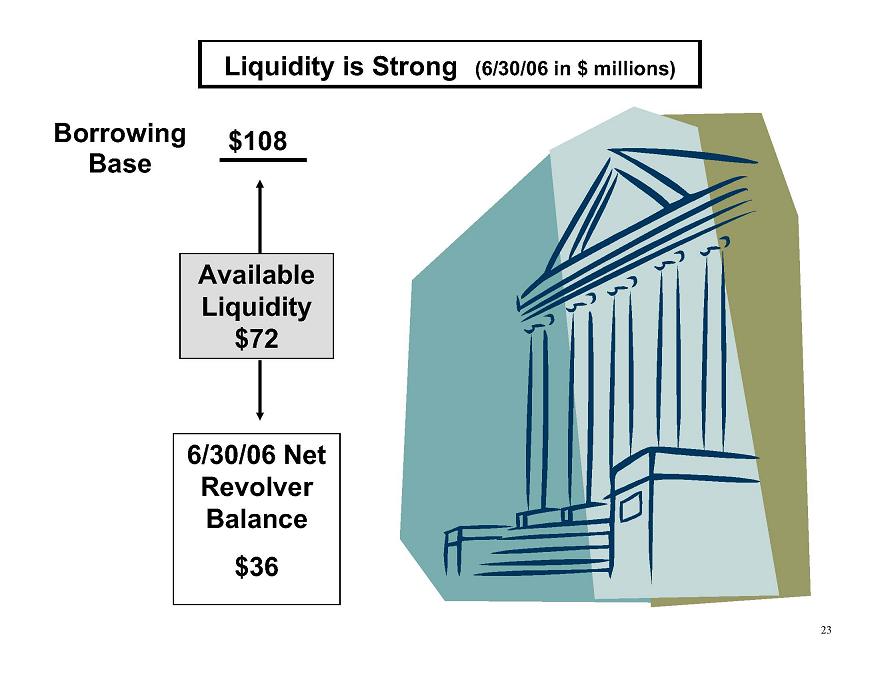
23 Liquidity is Strong (6/30/06 in $ millions) Borrowing Base $108 Available Liquidity $72 6/30/06 Net Revolver Balance $36
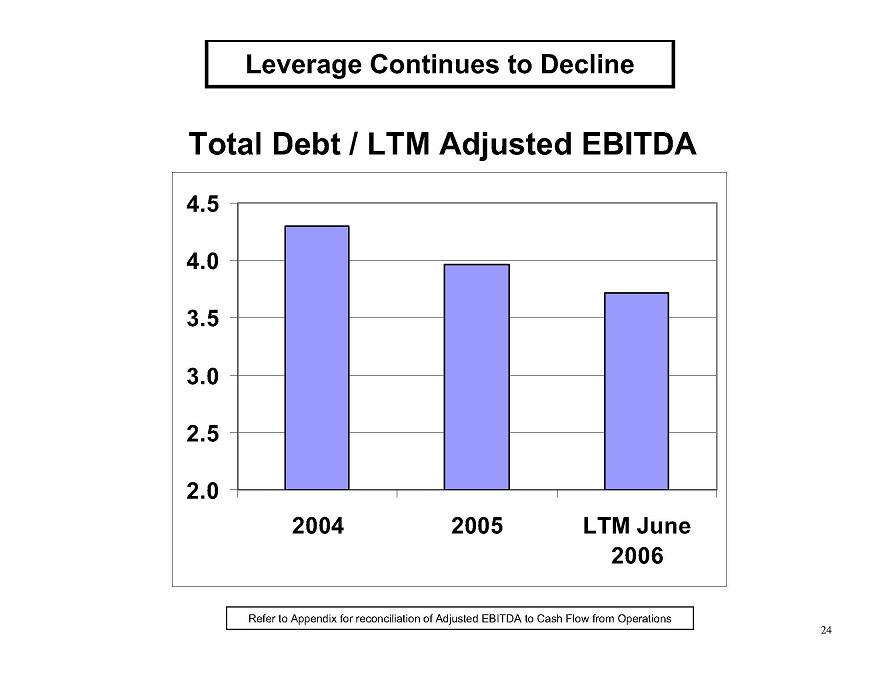
24 Leverage Continues to Decline Total Debt / LTM Adjusted EBITDA 2.0 2.5 3.0 3.5 4.0 4.5 2004 2005 LTM June 2006 Refer to Appendix for reconciliation of Adjusted EBITDA to Cash Flow from Operations
25 Guidance is Unchanged ($ millions) Intra-year variability due to timing of semiannual bond interest payments (~$13 in May and ~ $13 in November) Excludes impact of any acquisitions in 2006 Upper 3’s Total Debt / Adjusted EBITDA AMPP signings and large National Account penetration are the “wild cards” Upper $40’s Net Accrual Capex $79 - $81 2006 E Hospital census, Resident program signings, penetration of new National Accounts, Baxter recall, competitive setting. Adjusted EBITDA Key Drivers Refer to appendix for reconciliation of Adjusted EBITDA to Cash Flow from Operations; and reconciliation of Net Accrual Capex

26 Summary _ UHS’ Goal: _ To extend our position as the leading Medical Equipment Lifecycle Services Company _ We have strategic market positioning _ Excellent customer service reputation for over 65 years! _ Strong relationships with > 6,000 customers _ Competitive advantage _ Large and modern fleet of medical equipment _ National logistics network _ Strong growth opportunities with Equipment Lifecycle Programs _ Resident programs _ Manufacturer relationships _ GPO’s

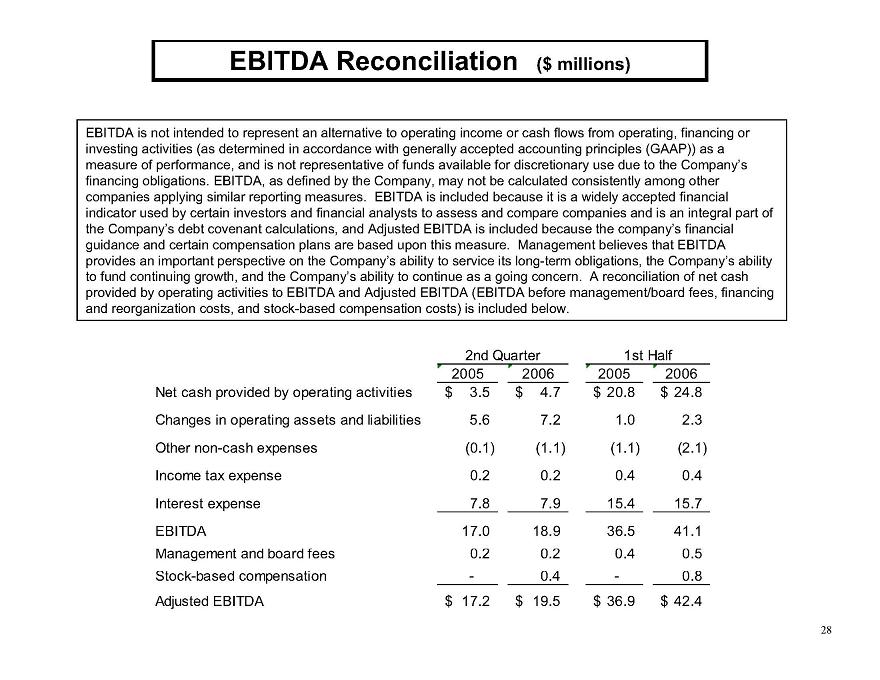
28 EBITDA Reconciliation ($ millions) 2005 2006 2005 2006 Net cash provided by operating activities 3.5 $ 4.7 $ 20.8 $ 24.8 $ Changes in operating assets and liabilities 5.6 7.2 1.0 2.3 Other non-cash expenses (0.1) (1.1) (1.1) (2.1) Income tax expense 0.2 0.2 0.4 0.4 Interest expense 7.8 7.9 15.4 15.7 EBITDA 17.0 18.9 36.5 41.1 Management and board fees 0.2 0.2 0.4 0.5 Stock-based compensation - 0.4 - 0.8 Adjusted EBITDA 17.2 $ 19.5 $ 36.9 $ 42.4 $ 2nd Quarter 1st Half EBITDA is not intended to represent an alternative to operating income or cash flows from operating, financing or investing activities (as determined in accordance with generally accepted accounting principles (GAAP)) as a measure of performance, and is not representative of funds available for discretionary use due to the Company’s financing obligations. EBITDA, as defined by the Company, may not be calculated consistently among other companies applying similar reporting measures. EBITDA is included because it is a widely accepted financial indicator used by certain investors and financial analysts to assess and compare companies and is an integral part of the Company’s debt covenant calculations, and Adjusted EBITDA is included because the company’s financial guidance and certain compensation plans are based upon this measure. Management believes that EBITDA provides an important perspective on the Company’s ability to service its long-term obligations, the Company’s ability to fund continuing growth, and the Company’s ability to continue as a going concern. A reconciliation of net cash provided by operating activities to EBITDA and Adjusted EBITDA (EBITDA before management/board fees, financing and reorganization costs, and stock-based compensation costs) is included below.
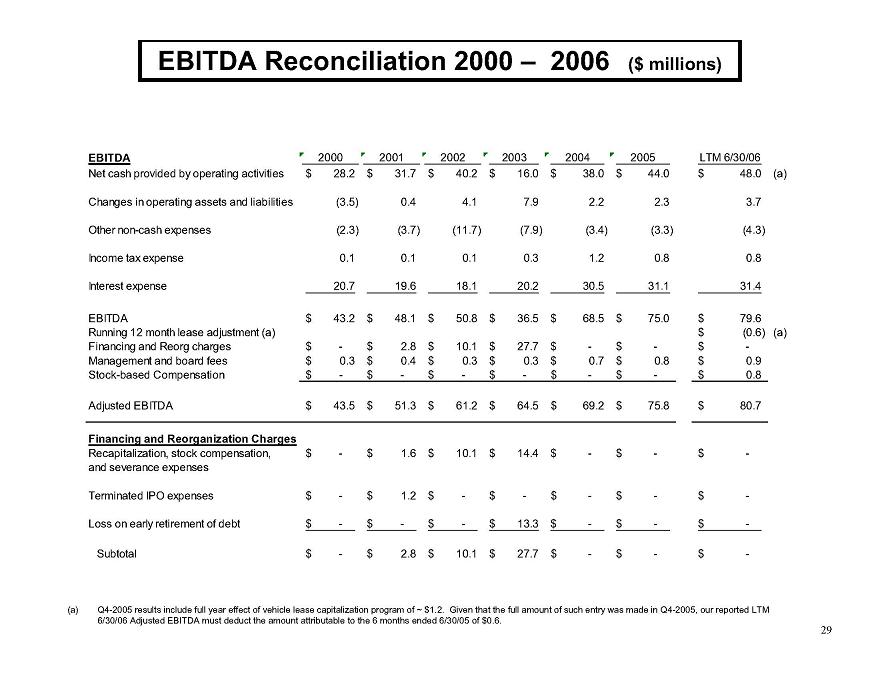
29 EBITDA Reconciliation 2000 - 2006 ($ millions) EBITDA 2000 2001 2002 2003 2004 2005 LTM 6/30/06 Net cash provided by operating activities 28.2 $ 31.7 $ 40.2 $ 16.0 $ 38.0 $ 44.0 $ 48.0 $ (a) Changes in operating assets and liabilities (3.5) 0.4 4.1 7.9 2.2 2.3 3.7 Other non-cash expenses (2.3) (3.7) (11.7) (7.9) (3.4) (3.3) (4.3) Income tax expense 0.1 0.1 0.1 0.3 1.2 0.8 0.8 Interest expense 20.7 19.6 18.1 20.2 30.5 31.1 31.4 EBITDA 43.2 $ 48.1 $ 50.8 $ 36.5 $ 68.5 $ 75.0 $ 79.6 $ Running 12 month lease adjustment (a) (0.6) $ (a) Financing and Reorg charges - $ 2.8 $ 10.1 $ 27.7 $ - $ - $ - $ Management and board fees 0.3 $ 0.4 $ 0.3 $ 0.3 $ 0.7 $ 0.8 $ 0.9 $ Stock-based Compensation - $ - $ - $ - $ - $ - $ 0.8 $ Adjusted EBITDA 43.5 $ 51.3 $ 61.2 $ 64.5 $ 69.2 $ 75.8 $ 80.7 $ Financing and Reorganization Charges Recapitalization, stock compensation, - $ 1.6 $ 10.1 $ 14.4 $ - $ - $ - $ and severance expenses Terminated IPO expenses - $ 1.2 $ - $ - $ - $ - $ - $ Loss on early retirement of debt - $ - $ - $ 13.3 $ - $ - $ - $ Subtotal - $ 2.8 $ 10.1 $ 27.7 $ - $ - $ - $ (a) Q4-2005 results include full year effect of vehicle lease capitalization program of ~ $1.2. Given that the full amount of such entry was made in Q4-2005, our reported LTM 6/30/06 Adjusted EBITDA must deduct the amount attributable to the 6 months ended 6/30/05 of $0.6.
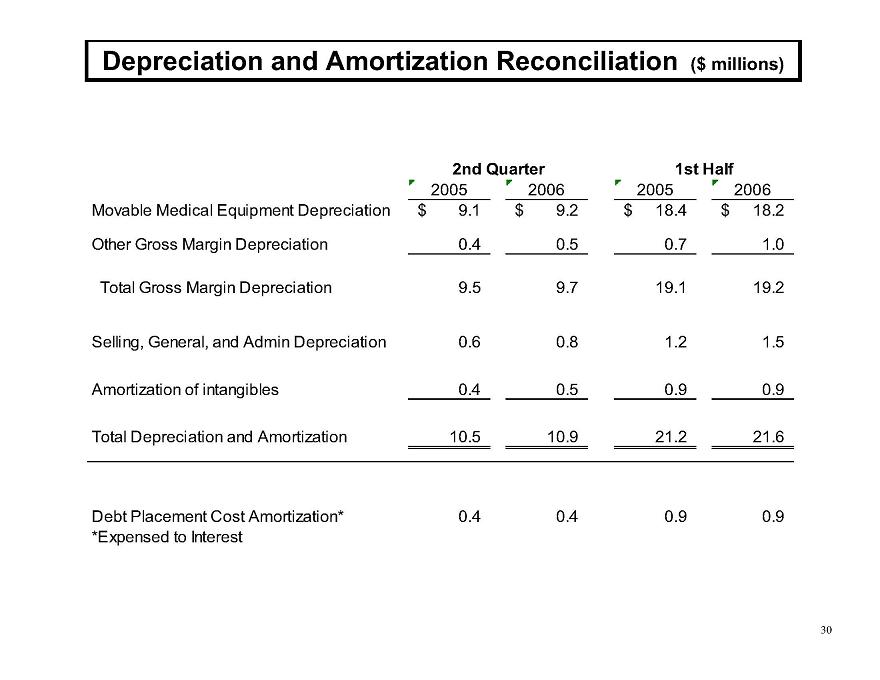
30 Depreciation and Amortization Reconciliation ($ millions) 2005 2006 2005 2006 Movable Medical Equipment Depreciation 9.1 $ 9.2 $ 18.4 $ 18.2 $ Other Gross Margin Depreciation 0.4 0.5 0.7 1.0 Total Gross Margin Depreciation 9.5 9.7 19.1 19.2 Selling, General, and Admin Depreciation 0.6 0.8 1.2 1.5 Amortization of intangibles 0.4 0.5 0.9 0.9 Total Depreciation and Amortization 10.5 10.9 21.2 21.6 Debt Placement Cost Amortization* 0.4 0.4 0.9 0.9 *Expensed to Interest 2nd Quarter 1st Half

31 Accrual Capex Reconciliation ($ millions) 1999 2000 2001 2002 2003 2004 2005 YTD JUNE 2006 LTM JUNE 2006 Cash used in Investing Activities 49.4 31.5 41.5 39.0 36.8 65.2 40.6 21.0 43.7 Less: Acquisitions (6.3) - (7.8) - (1.9) (15.1) (1.1) - (1.1) Less: Other (0.1) 0.1 (0.3) (0.2) (0.2) - - - - Less: MME in A/P prior year (8.4) (3.0) (3.0) (5.9) (6.0) (10.5) (3.8) (5.8) (5.2) Add: MME in A/P current year 3.0 3.0 5.9 6.0 10.5 3.8 5.8 2.1 2.1 Accrual Capex 37.6 31.6 36.4 38.8 39.2 43.4 41.5 17.3 39.5 Acquisitions 6.3 - 7.8 - 1.9 15.1 1.1 - 1.1 Revenues 92.2 106.0 125.6 153.8 171.0 199.6 215.9 113.1 220.5