Exhibit 99.1
Universal Hospital Services (UHOS) UBS Warburg Global Healthcare Conference February 14, 2007
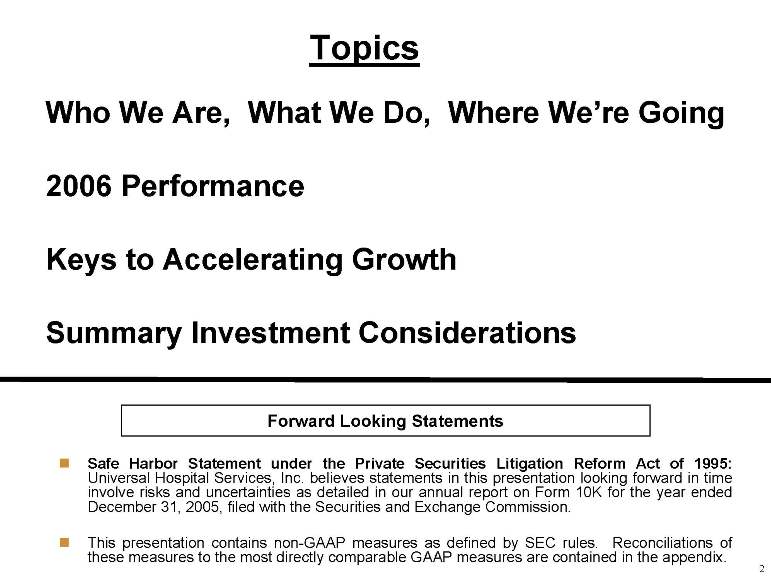
Topics Who We Are, What We Do, Where We’re Going 2006 Performance Keys to Accelerating Growth Summary Investment Considerations Forward Looking Statements⑀⍼Safe Harbor Statement under the Private Securities Litigation Reform Act of 1995:Universal Hospital Services, Inc. believes statements in this presentation looking forward in time involve risks and uncertainties as detailed in our annual reporton Form 10K for the year ended December 31, 2005, filed with the Securities and Exchange Commission. ⑀⍼This presentation contains non-GAAP measures as defined by SEC rules. Reconciliations of these measures to the most directly comparable GAAP measures are contained in the appendix.
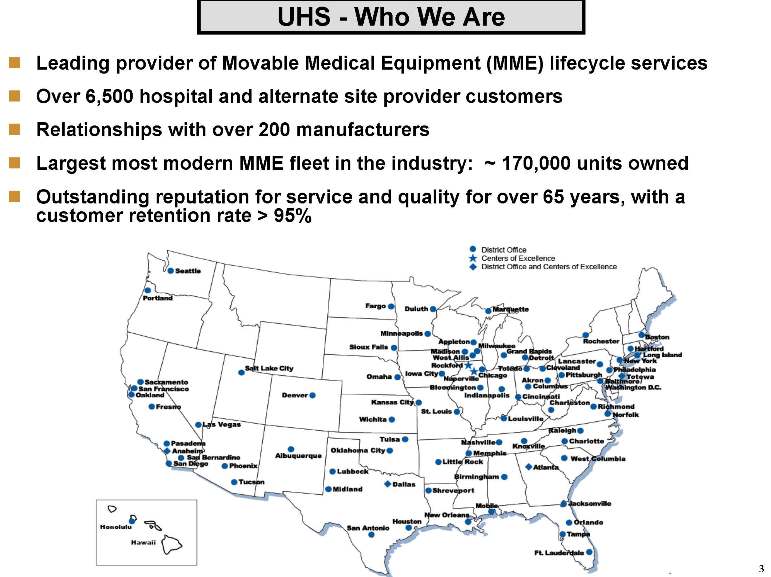
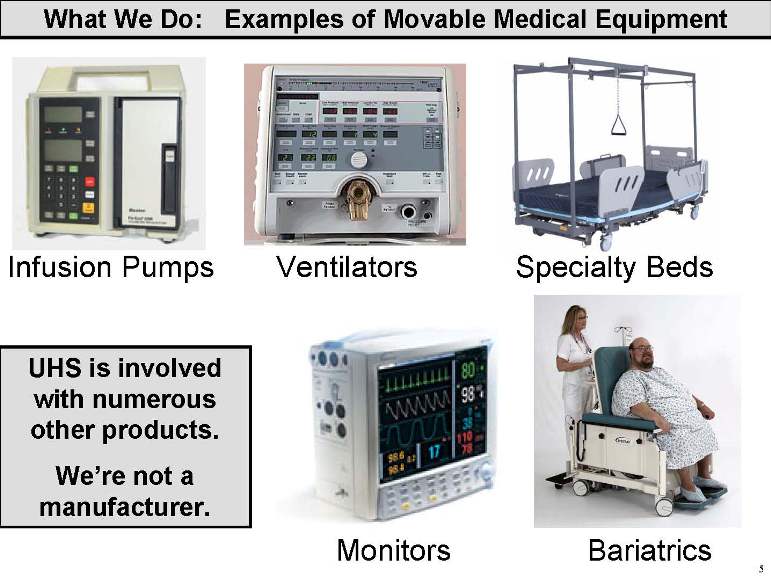
Leading provider of Movable Medical Equipment (MME) lifecycle services⑀⍼Over 6,500 hospital and alternate site provider customers⑀⍼Relationships with over 200 manufacturers⑀⍼Largest most modern MME fleet in the industry: ~ 170,000 units owned⑀⍼Outstanding reputation for service and quality for over 65 years, with a customer retention rate > 95%
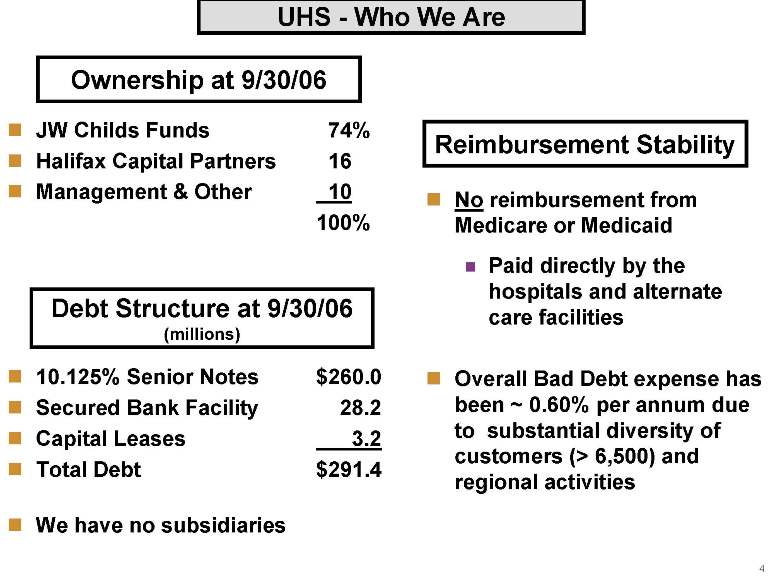
Ownership at 9/30/06 JW Childs Funds 74%⑀⍼Halifax Capital Partners 16⑀⍼Management & Other10 100% Reimbursement Stability Noreimbursement from Medicare or Medicaid⑀⍼Paid directly by the hospitals and alternate care facilities Debt Structure at 9/30/06 (millions) 10.125% Senior Notes $260.0⑀⍼Secured Bank Facility28.2⑀⍼Capital Leases3.2⑀⍼Total Debt$291.4 Overall Bad Debt expense has been ~ 0.60% per annum due to substantial diversi
ty of customers (> 6,500) and regional activities We have no subsidiaries
UHS’ Foundation (1939-2000): “Equipment Rental Company” Medical Equipment Outsourcing Equipment Rental Plan & Acquir
e Manage & Utilize Redeploy & Remarket Maintain & Repair
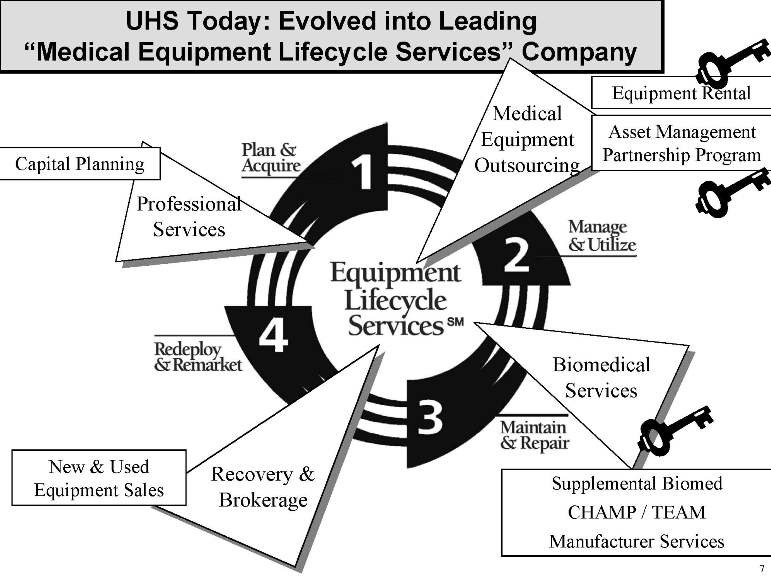
UHS Today: Evolved into Leading “Medical Equipment Lifecycle Services” Company Capital Planning Professional Services Plan & Acquire Medical Equipment Outsourcing Equipment Rental Asset Management Partnership Program Manage & Utilize Biomedical Services Maintain & Repair Supplemental Biomed CHAMP/TEAM Manufacturer Services Recovery & Brokerage New & Used Equipment Sales Redeploy & Remarket
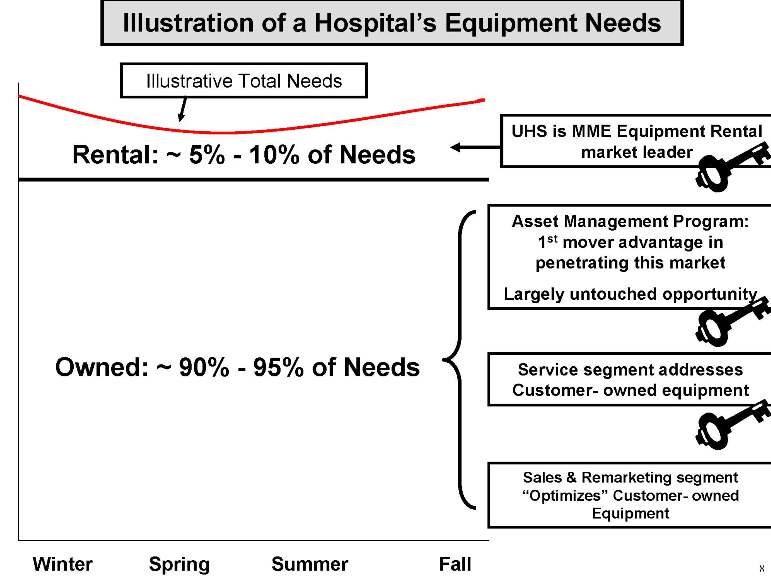
Illustration of a Hospital’s Equipment NeedsOwned: ~ 90% -95% of NeedsRental: ~ 5% -10% of NeedsWinterFallSummerSpringIllustrative Total Needs UHS is MME Equipment Rental market leader Asset Management Program: 1stmover advantage in penetrating this marketLargely untouched opportunitySales Service segment addresses Customer-owned equipment opportunitySales & Remarketing s
egment “Optimizes”Customer-owned Equipment WinterFallSummerSpring Fall
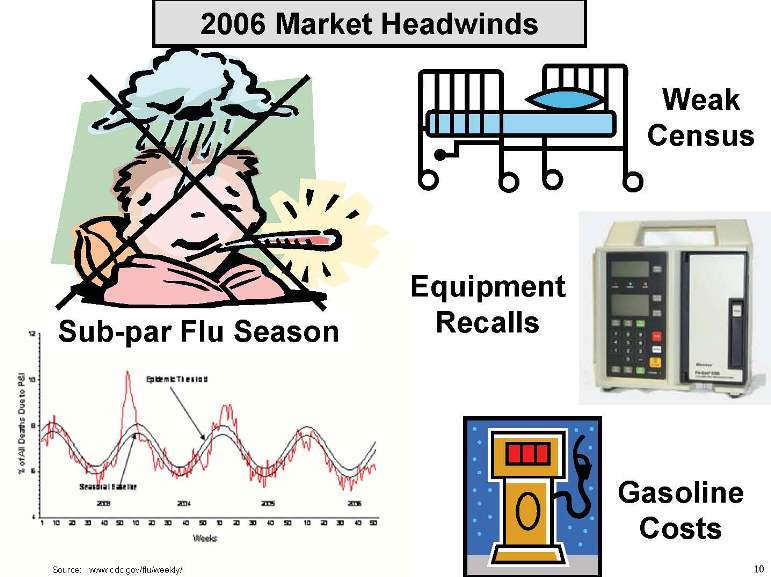
2006 Market Headwinds Sub-par Flu Season Weak Census Equipment Recalls Gasoline Costs
Asset Management Program Traction 12 signings in 2006 New Customer Wins
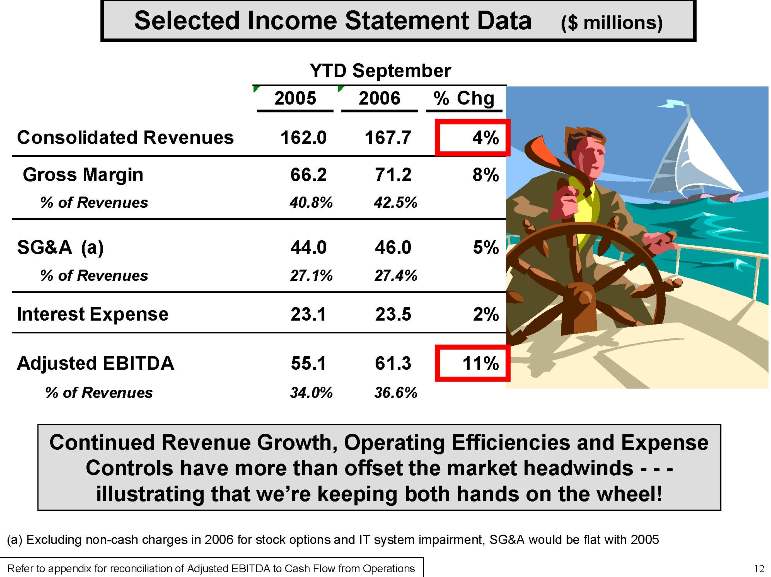
Selected Income Statement Data ($ millions) YTD September 2005 2006 % Chg Consolidated Revenues 162.0 167.7 4% Gross Margin 66.2 71.2 8% % of Revenues 40.8% 42.5% SG&A (a) 44.0 46.0 5% % of Revenues 27.1% 27.4% Interest Expense 23.1 23.5 2% Adjusted EBITDA 55.1 61.3 11% % of Revenues 34.0% 36.6% Continued Revenue Growth, Operating Efficiencies and Expense Controls have more than offset the market headwinds ---illustrating that we’re keeping both hands on the wheel! (a) Excluding non-cash charges in 2006 for stock options and IT system impairment,SG&A would be flat with 2005 Refer to appendix for reconciliation of Adjusted EBITDA to Cash Flow fro
m Operations
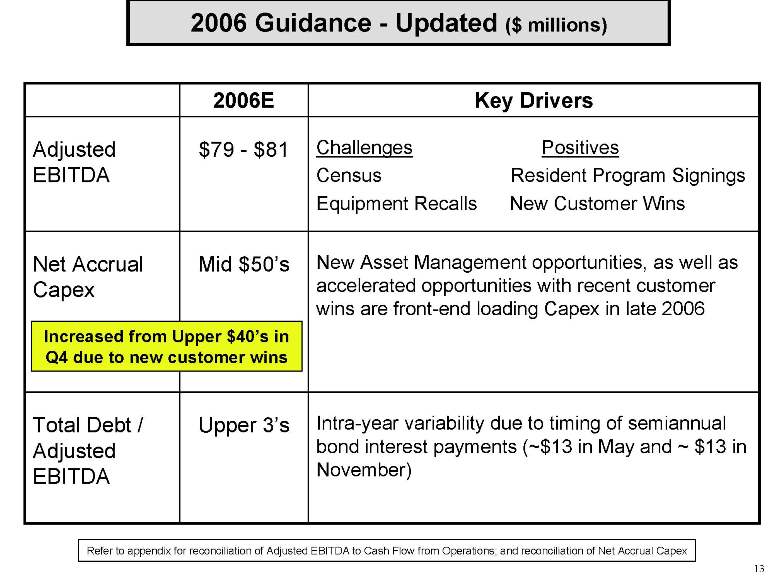
2006 Guidance - Updated ($ millions) 2006E Key Drivers Adjusted EBITDA $79-81 Challenges Positives Census Equipment Recalls Resident Programs Signings New Customer Wins Net Accrual Capex Mid $50’s New Asset Management Opportunities, as well as accelerated opportunities with recent customer wins are front-end Capex in late 2006 Increased from Upper $40’s in Q4 due to new custom
er wins Total Debt/adjusted EBITDA Upper 3’s Intra-year variability due to timing of semiannual bond interest payments (~$13 in May and ~$13 in November) Refer to appendix for reconciliation of Adjusted EBITDA to Cash Flow from Operations; and reconciliation of Net Accrual Capex
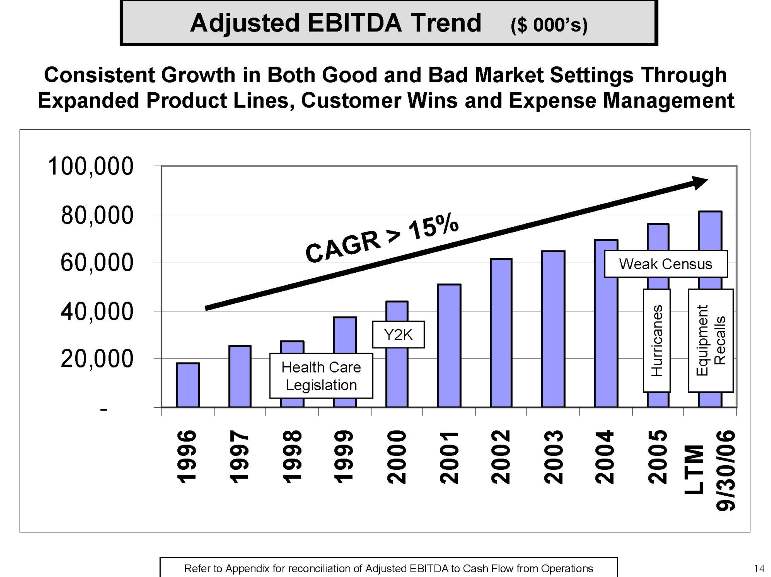
Adjusted EBITDA Trend ($ 000’s) Consistent Growth in Both Good and Bad Market Settings Through Expanded Product Lines, Customer Wins and Expense Management CAGR > 15%Health Care LegislationY2KHurricanesEquipment RecallsWeak Census 100,000 80,000 60,000 40,000 20,000 1996 1997 1998 1999 2000 2001 2002 2003 2004 2005 LTM 9/30/06 Refer to
Appendix for reconciliation of Adjusted EBITDA to Cash Flow from Operations
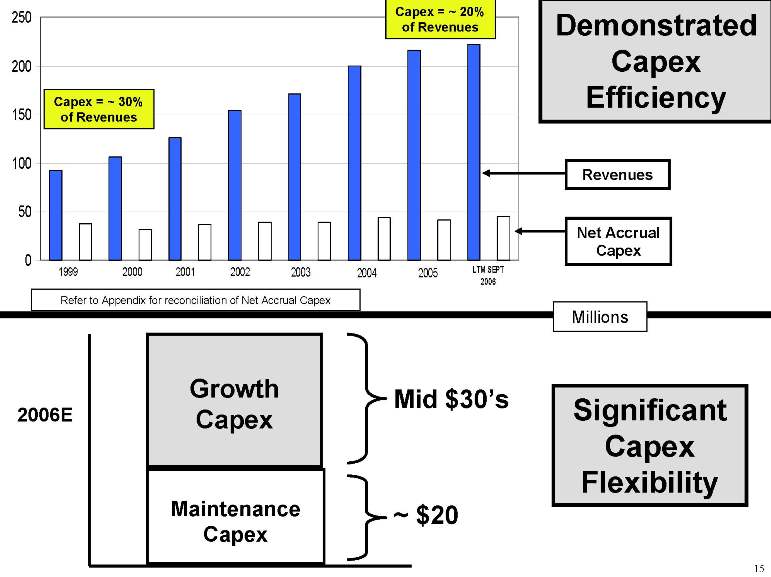
Revenues Net Accrual Capex Significant Capex FlexibilityRefer to Appendix for reconciliation of Net Accrual Capex Capex= ~ 30% of Revenues
Capex= 2006 Demonstrated Capex Efficiency Capex Growth Maintenance Capex Mid $30’s ~ $20 Significant Capex Flexibility
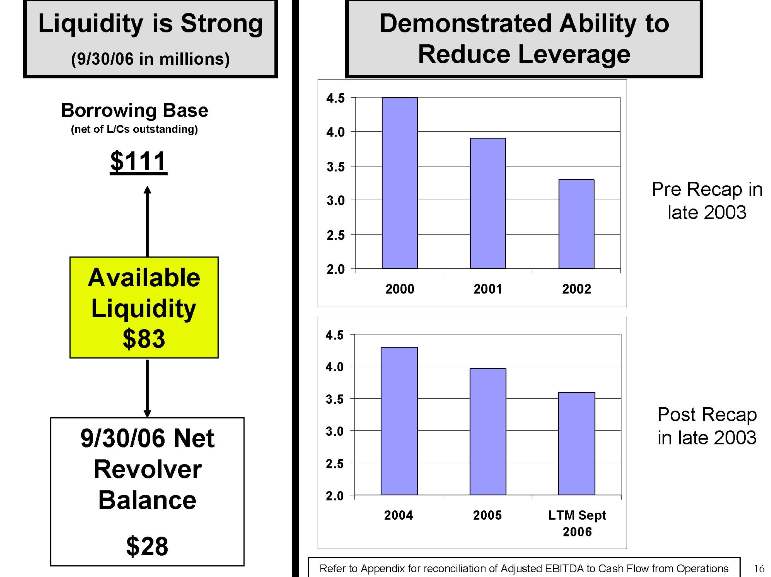
Liquidity is Strong(9/30/06 in millions)2.02.53.03.54.04.5200020012002Borrowing Base(net of L/Cs outstanding)$111Available Liquidity $839/30/06 Net Revolver Balance$28Demonstrated Ability to Reduce LeverageRefer to Appendix for reconciliation of Adjusted EBITDA to Cash Flow from Operations2.02.53.03.54.04.520042005LTM Sept2006Pre Recap in late 2003Post Recap in late 2003
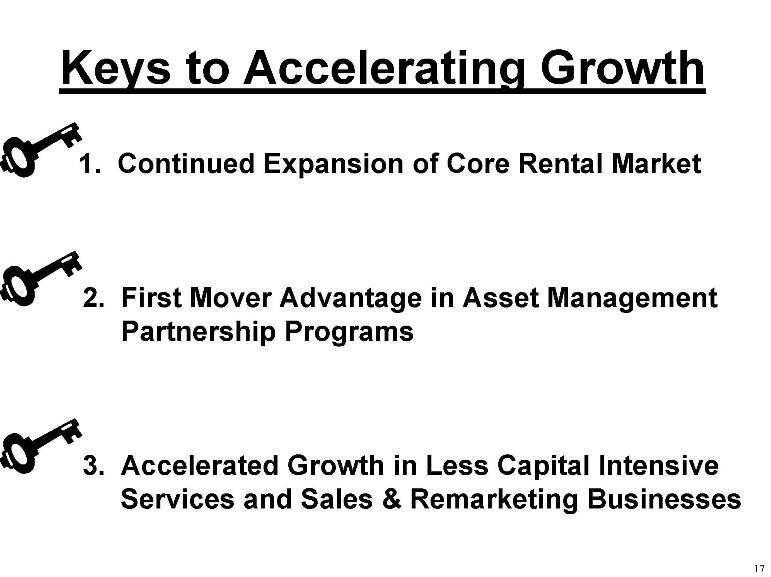
Keys to Accelerating Growth 1. Continued Expansion of Core Rental Market 2.
First Mover Advantage in Asset Management Partnership Programs 3. Accelerated Growth in Less Capital Intensive Services and Sales & Remarketing Businesses
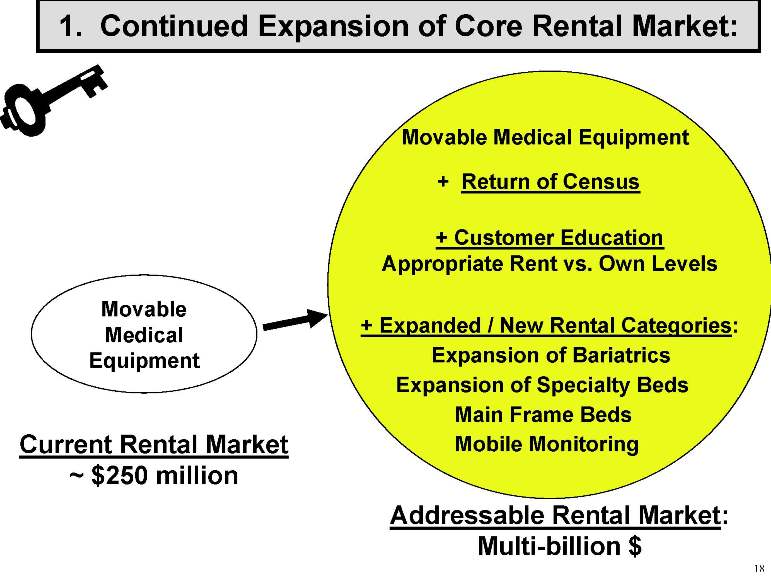
1. Continued Expansion of Core Rental Market: Movable Medical Equipment + Return of Census + Customer Education Appropriate Rent vs. Own Levels + Expanded / New Rental Categories: Expansion of Bariatrics Expansion of Specialty Beds Main Frame Beds Mobile Monitoring Current Rental Market~ $250 million Addressable Rental Market: Multi-billion $
Total Needs-5.00%-4.00%-3.00%-2.00%-1.00%0.00%1.00%2.00%3.00%4.00%5.00%19911992199319941995199619971998199920002001200220032004Q1-2005Q2-2005Q3-2005Q4-2005Q1-2006Q2-2006Q3-2006 Hospital Adjusted Admissions TrendsSource: American Hospital Association Hospital StatsContinued Weak Census setting is primarily felt in Rental UHS estimates that a 1% Change in Census = ~ 4% Change in Rental (i.e., the “Leveraged Impact of Census”) We are poised for an upward “Ricochet”upon Census return Owned: ~ 90% -95% of NeedsRental: ~ 5% -10% of Needs
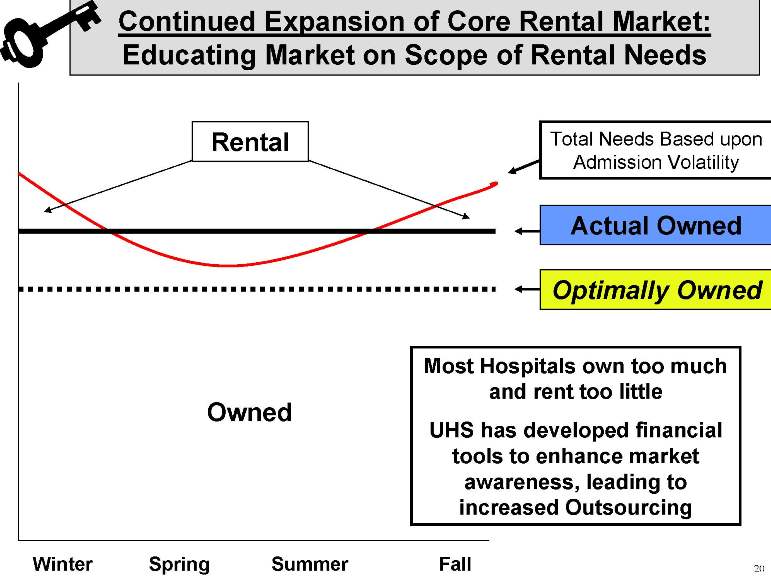
Continued Expansion of Core Rental Market: Educating Market on Scope of Rental Needs Total Needs Based upon Admission Volatility Actually Owned Optimally Owned Owned Most Hospitals own too much and rent too little UHS has developed vinancial tools to enhance market awareness, leading to increased Outsourcing Winter Spring Summer Fall
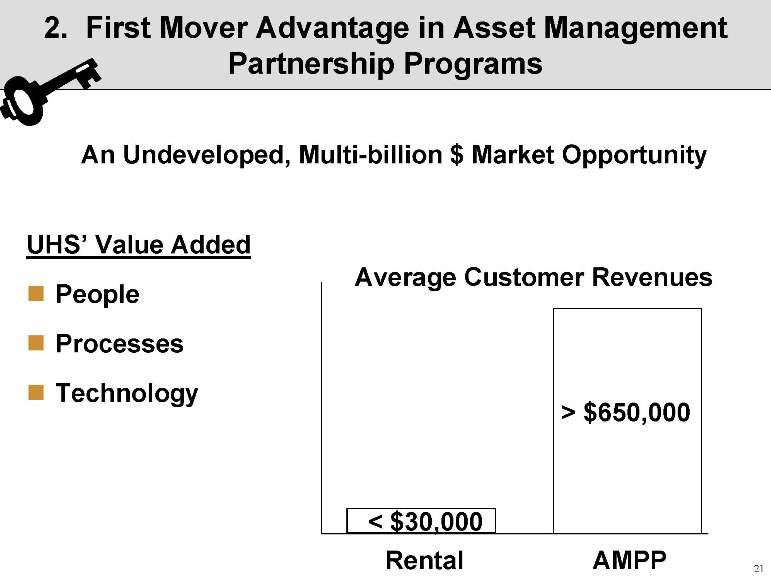
2. First Mover Advantage in Asset Management Partnership Pr
ograms An Undeveloped, Multi-billion $ Market Opportunity UHS’Value Added ⑀⍼People ⑀⍼Processes ⑀⍼Technology Average Customer Revenues Rental AMPP
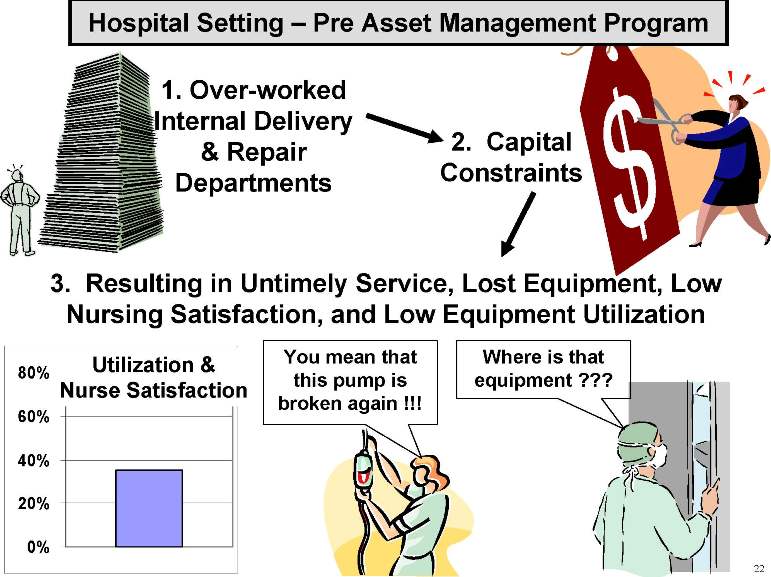
Hospital Setting - Pre Asset Management Program 1. Over-worked Internal Delivery & Repair Departments 2. Capital Constraints 3. Resulting in Untimely Service, Lost Equipment, Low Nursing Satisfaction, and Low Equipment Utilization 80% 60% 40% 20% 0% Utilization & Nurse SatisfactionHospital You mean that this pump is broken again !!! Where is that equipment ???
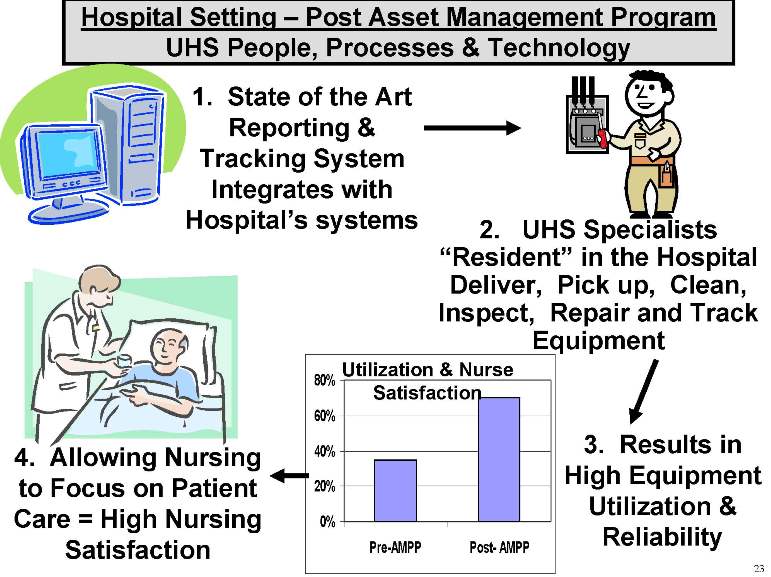
Hospital Setting - Post Asset Management Program UHS People, Processes & Technology 1. State of the Art Reporting & Tracking System Integrates with Hospital’s systemsUtilization 2. UHS Specialists “Resident”in the Hospital Deliver, Pick up, Clean, Inspect, Repair and Track Equipment 3. Results in High Equipment Utilization & Reliability4. Allowing Nurs
ing to Focus on Patient Care = High Nursing Satisfaction Utilization & Nurse Satisfaction
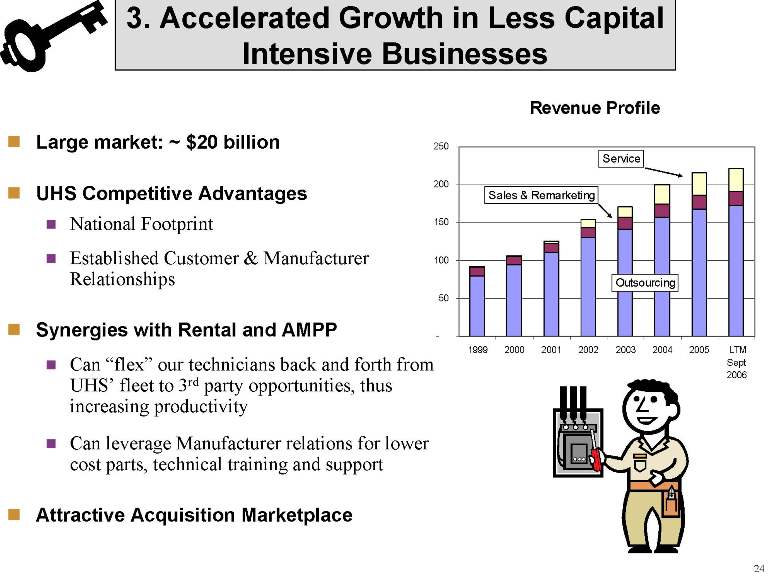
3. Accelerated Growth in Less Capital Intensive Businessess Large market: ~ $20 billion UHS Competitive Advantages⑀⍼National Footprint⑀⍼Established Customer & Manufacturer Relationships Synergies with Rental and AMPP⑀⍼Can “flex”our technicians back and forth from UHS’fleet to 3rdparty opportunities, thus increasing productivity Can leverage Manufacturer relations for lower cost parts, technical training and support Attractive Acquisition MarketplaceRevenue Profile-501001502002501999200020012002200320042005 LTMSept2006OutsourcingServiceSales & Remarketing
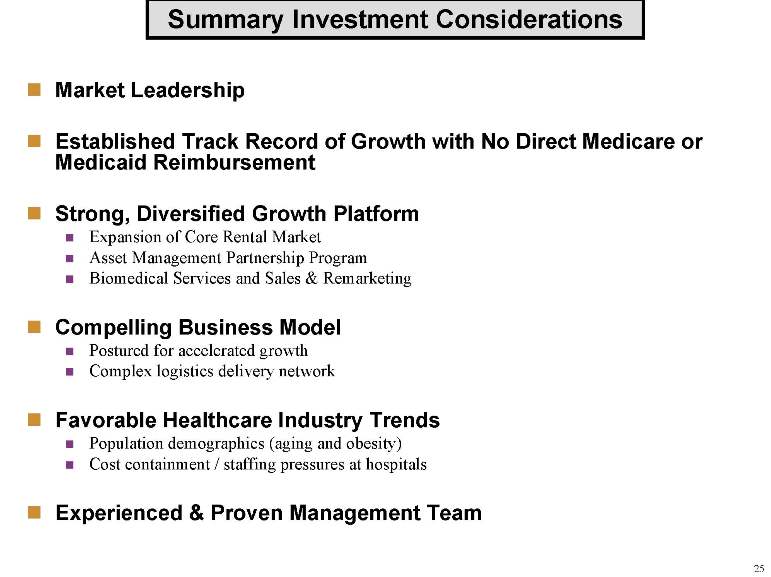
Summary Investment Considerations Market Leadership ⑀⍼Established Track Record of Growth with No Direct Medicare or Medicaid Reimbursement ⑀⍼Strong, Diversified Growth Platform ⑀⍼Expansion of Core Rental Market ⑀⍼Asset Management Partnership Program ⑀⍼Biomedical Services and Sales & Remarketing ⑀⍼Compelling Business Model ⑀⍼Postured for accelerated growth ⑀⍼Complex logistics delivery network ⑀⍼Favorable Healthcare Industry Trends ⑀⍼Population demographics (aging and obesity) ⑀⍼Cost containment / staffing pressures at hospitals ⑀⍼Experienced & Proven Management Team
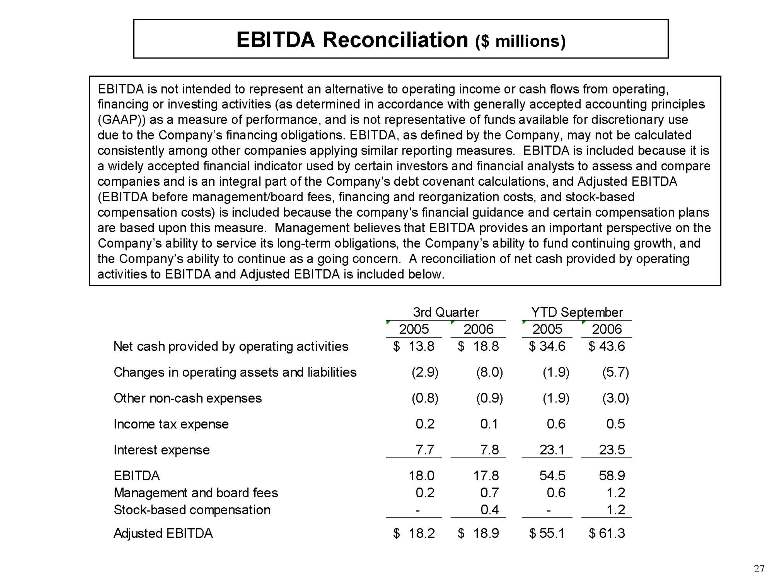
EBITDA Reconciliation ($ millions) EBITDA is not intended to represent an alternative to operating income or cash flows from operating, financing or investing activities (as determined in accordance with generally accepted accounting principles (GAAP)) as a measure of performance, and is not representative of funds available for discretionary use due to the Company’s financing obligations. EBITDA, as defined by the Company, may not be calculated consistently among other companies applying similar reporting measures. EBITDA is included because it is a widely accepted financial indicator used by certain investors and financial analysts to assess and compare companies and is an integral part of the Company’s debt covenant calculations, and Adjusted EBITDA (EBITDA before management/board fees, financing and reorganization costs, and stock-based compensation costs) is included because the company’s financial guidance and certain compensation plans are based upon this measure. Management believes that EBITDA provides an important perspective on the Company’s ability to service its long-term obligations, the Company’s ability to fund continuing growth, and the Company’s ability to continue as a going concern. A reconciliation of net cash provided by operating activities to EBITDA and Adjusted EBITDA is included below. 3rd QuarterYTD September 2005200620052006 Net cash provided by operating activities Activities $3.8$ 18.8$ 34.6$ 43.6$ Changes in operating assets and liabilities(2.9) (8.0) (1.9) (5.7) Other non-cash expenses(0.8) (0.9) (1.9) (3.0) Income tax expense0.2 0.1 0.6 0.5 Interest expense7.7 7.8 23.1 23.5 EBITDA18.0 17.8 54.5 58.9 Management and board fees0.2 0.7 0.6 1.2 Stock-based compensation- 0.4 - 1.2 Adjusted EBITDA $18.2$18.9 $55.1 $61.3
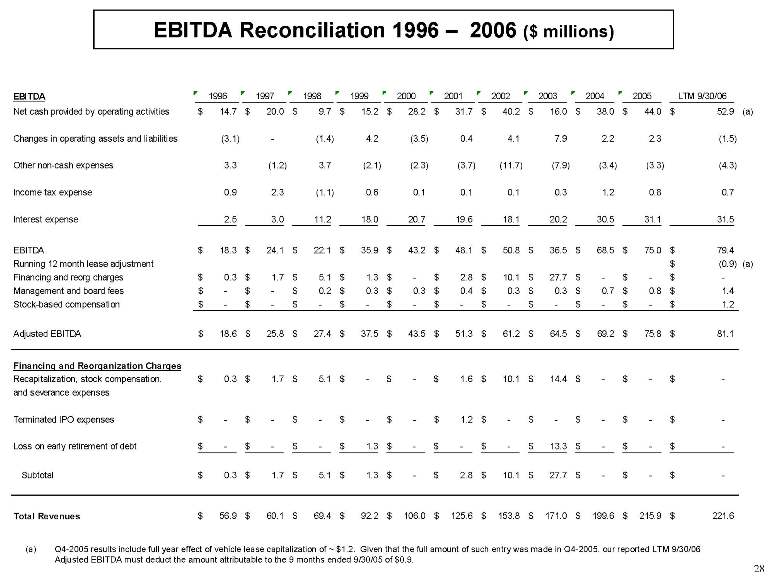
EBITDA Reconciliation 1996 -2006 ($ millions) EBITDA1996199719981999200020012002200320042005LTM 9/30/06Net cash provided by operating activities14.7$ 20.0$ 9.7$ 15.2$ 28.2$ 31.7$ 40.2$ 16.0$ 38.0$ 44.0$ 52.9$ (a)Changes in operating assets and liabilities(3.1) - (1.4) 4.2 (3.5) 0.4 4.1 7.9 2.2 2.3 (1.5) Other non-cash expenses3.3 (1.2) 3.7 (2.1) (2.3) (3.7) (11.7) (7.9) (3.4) (3.3) (4.3) Income tax expense0.9 2.3 (1.1) 0.6 0.1 0.1 0.1 0.3 1.2 0.8 0.7 Interest expense2.5 3.0 11.2 18.0 20.7 19.6 18.1 20.2 30.5 31.1 31.5 EBITDA18.3$ 24.1$ 22.1$ 35.9$ 43.2$ 48.1$ 50.8$ 36.5$ 68.5$ 75.0$ 79.4$ Running 12 month lease adjustment(0.9)$ (a)Financing and reorg charges0.3$ 1.7$ 5.1$ 1.3$ -$ 2.8$ 10.1$ 27.7$ -$ -$ -$ Management and board fees-$ -$ 0.2$ 0.3$ 0.3$ 0.4$ 0.3$ 0.3$ 0.7$ 0.8$ 1.4$ Stock-based compensation-$ -$ -$ -$ -$ -$ -$ -$ -$ -$ 1.2$ Adjusted EBITDA18.6$ 25.8$ 27.4$ 37.5$ 43.5$ 51.3$ 61.2$ 64.5$ 69.2$ 75.8$ 81.1$ Financing and Reorganization ChargesRecapitalization, stock compensation,0.3$ 1.7$ 5.1$ -$ -$ 1.6$ 10.1$ 14.4$ -$ -$ -$ and severance expensesTerminated IPO expenses-$ -$ -$ -$ -$ 1.2$ -$ -$ -$ -$ -$ Loss on early retirement of debt-$ -$ -$ 1.3$ -$ -$ -$ 13.3$ -$ -$ -$ Subtotal0.3$ 1.7$ 5.1$ 1.3$ -$ 2.8$ 10.1$ 27.7$ -$ -$ -$ Total Revenues56.9$ 60.1$ 69.4$ 92.2$ 106.0$ 125.6$ 153.8$ 171.0$ 199.6$ 215.9$ 221.6$ (a)Q4-2005 results include full year effect of vehicle lease capitalization of ~ $1.2. Given that the full amount of such entry was made in Q4-2005, our reported LTM 9/30/06 Adjusted EBITDA must deduct th
e amount attributable to the 9 months ended 9/30/05 of $0.9.
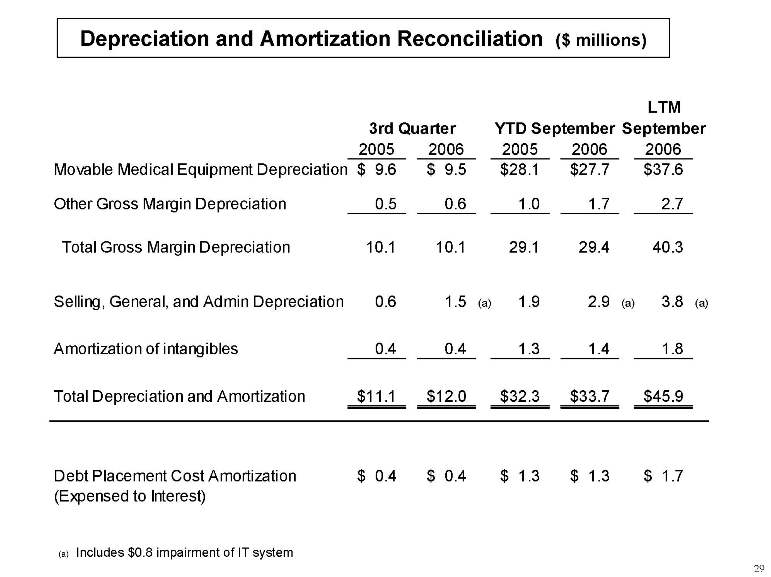
Depreciation and Amortization Reconciliation ($ millions) 3rd QuarterYTD September LTMSeptember20052006200520062006Movable Medical Equipment Depreciation9.6$ 9.5$ 28.1$ 27.7$ 37.6$ Other Gross Margin Depreciation0.5 0.6 1.0 1.7 2.7 Total Gross Margin Depreciation10.1 10.1 29.1 29.4 40.3 Selling, General, and Admin Depreciation0.6 1.5 (a)1.9 2.9 (a)3.8 (a)Amortization of intangibles0.4 0.4 1.3 1.4 1.8 Total Depreciation and Amortization$11.1$ 12.0$ 32.3$ 33.7$ 45.9$ Debt Placement Cost Amortization0.4$ 0.4$ 1.3$ 1.3$ 1.7$ (Expensed to Interest) (a) Includes $0.8 impairment of IT system
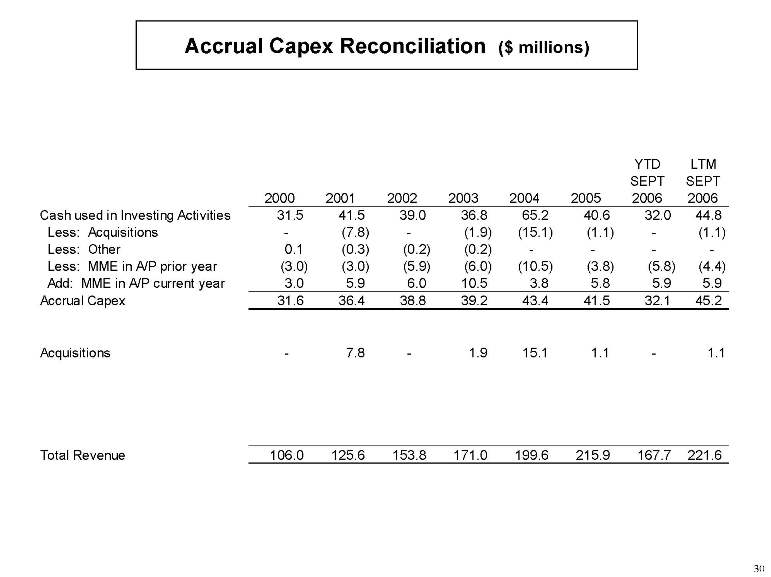
Accrual CapexReconciliation ($ millions) 2000 2001 2002 2003 2004 2005 YTD SEPT 2006 LTM SEPT 2006 Cash used in Investing Activities 31.5 41.5 39.0 36.8 65.2 40.6 32.0 44.8 Less: Acquisitions - (7.8) - (1.9) (15.1) (1.1) - (1.1) Less: Other 0.1 (0.3) (0.2) (0.2) - - - - Less: MME in A/P prior year (3.0) (3.0) (5.9) (6.0 ) (10.5) (3.8) (5.8) (4.4) Add: MME in A/P current year 3.0 5.9 6.0 10.5 3.8 5.8 5.9 5.9 Accrual Capex 31.6 36.4 38.8 39.2 43.4 41.5 32.1 45.2 Acquisitions - 7.8 - 1.9 15.1 1.1 - 1.1 Total Revenue 106.0 125.6 153.8 171.0 199.6 215.9 167.7 221.6