
UHOS Q4 2006 Earnings Teleconference March 20, 2007
Forward Looking Statements _ Safe Harbor Statement under the Private Securities Litigation Reform Act of 1995: Universal Hospital Services, Inc. believes statements in this presentation looking forward in time involve risks and uncertainties. The following factors, among others, could adversely affect our business, operations and financial condition causing our actual results to differ materially from those expressed in any forward-looking statements: our history of net losses and substantial interest expense; our need for substantial cash to operate and expand our business as planned; our substantial outstanding debt and debt service obligations; restrictions imposed by the terms of our debt; a decrease in the number of patients our customers are serving; our ability to effect change in the manner in which healthcare providers traditionally procure medical equipment; the absence of long-term commitments with customers; our ability to renew contracts with group purchasing organizations and integrated delivery networks; changes in reimbursement rates and policies by third-party payors; the impact of health care reform initiatives; the impact of significant regulation of the health care industry and the need to comply with those regulations; difficulties or delays in our continued expansion into certain of our businesses/geographic markets and developments of new businesses/geographic markets; and additional credit risks in increasing business with home care providers and nursing homes, impacts of equipment product recalls or obsolescence; increases in vendor costs that cannot be passed through to our customers; and other Risk Factors as detailed in our annual report on Form 10K for the year ended December 31, 2006, filed with the Securities and Exchange Commission. _ This presentation contains non-GAAP measures as defined by SEC rules. Reconciliations of these measures to the most directly comparable GAAP measures are contained in the appendix.
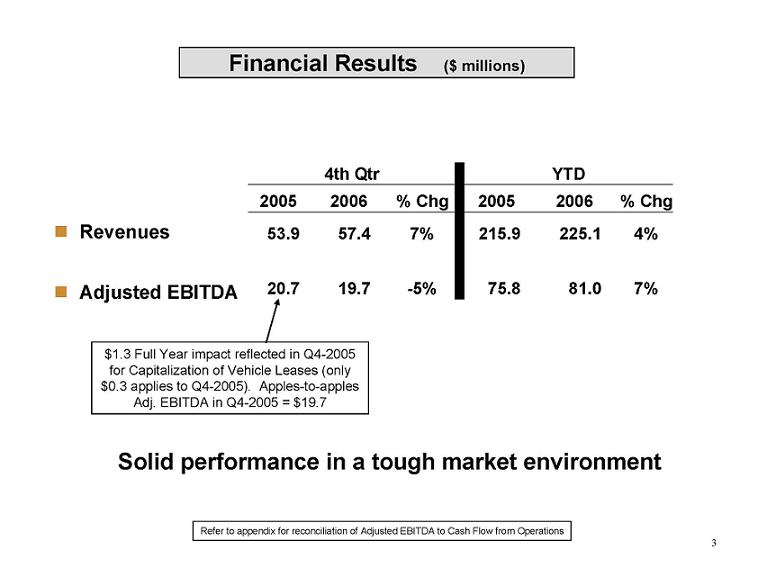
3 Financial Results ($ millions) _ Revenues _ Adjusted EBITDA Refer to appendix for reconciliation of Adjusted EBITDA to Cash Flow from Operations 2005 2006 % Chg 2005 2006 % Chg 53.9 57.4 7% 215.9 225.1 4% 20.7 19.7 -5% 75.8 81.0 7% 4th Qtr YTD Solid performance in a tough market environment $1.3 Full Year impact reflected in Q4-2005 for Capitalization of Vehicle Leases (only $0.3 applies to Q4-2005). Apples-to-apples Adj. EBITDA in Q4-2005 = $19.7
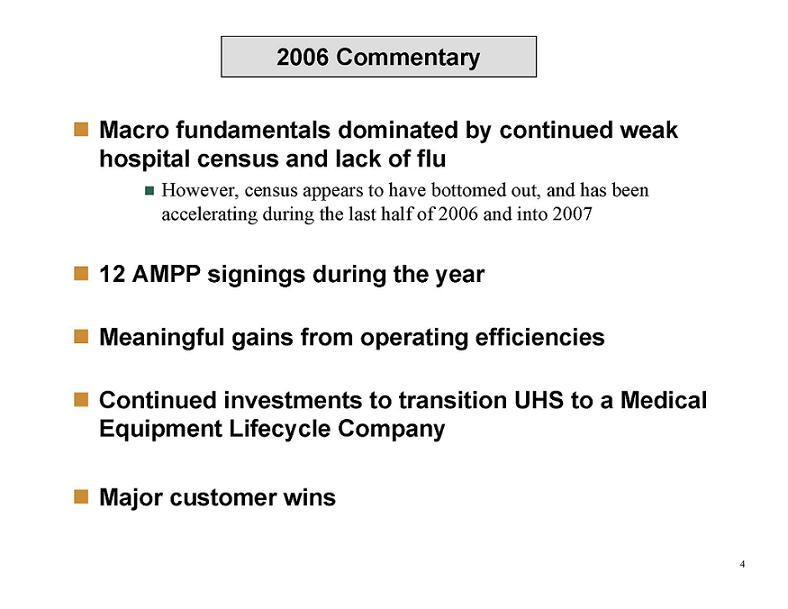
4 Macro fundamentals dominated by continued weak hospital census and lack of flu _ However, census appears to have bottomed out, and has been accelerating during the last half of 2006 and into 2007 _ 12 AMPP signings during the year Meaningful gains from operating efficiencies _ Continued investments to transition UHS to a Medical Equipment Lifecycle Company _ Major customer wins 2006 Commentary
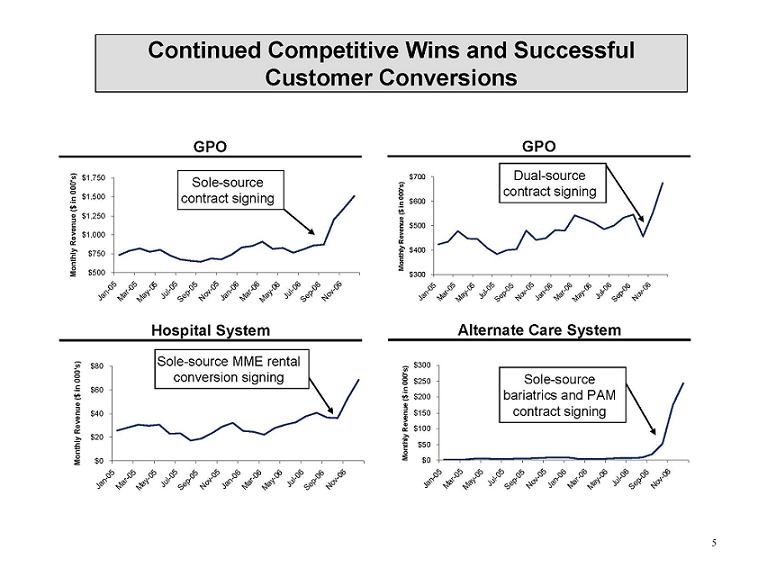
5 Continued Competitive Wins and Successful Customer Conversions GPO GPO Hospital System Alternate Care System Sole-source contract signing Dual-source contract signing Sole-source MME rental conversion signing Sole-source bariatrics and PAM contract signing $300 $400 $500 $600 $700 Jan-05 Mar-05 May-05 Jul-05 Sep-05 Nov-05 Jan-06 Mar-06 May-06 Jul-06 Sep-06 Nov-06 Monthly Revenue ($ in 000's) $500 $750 $1,000 $1,250 $1,500 $1,750 Jan-05 Mar-05 May- 05 Jul-05 Sep-05 Nov-05 Jan-06 Mar-06 May- 06 Jul-06 Sep-06 Nov-06 Monthly Revenue ($ in 000's) $0 $50 $100 $150 $200 $250 $300 Jan-05 Mar-05 May-05 Jul-05 Sep-05 Nov-05 Jan-06 Mar-06 May-06 Jul-06 Sep-06 Nov-06 Monthly Revenue ($ in 000's) $0 $20 $40 $60 $80 Jan-05 Mar-05 May-05 Jul-05 Sep-05 Nov-05 Jan-06 Mar-06 May- 06 Jul- 06 Sep-06 N ov-06 Monthly Revenue ($ in 000's)
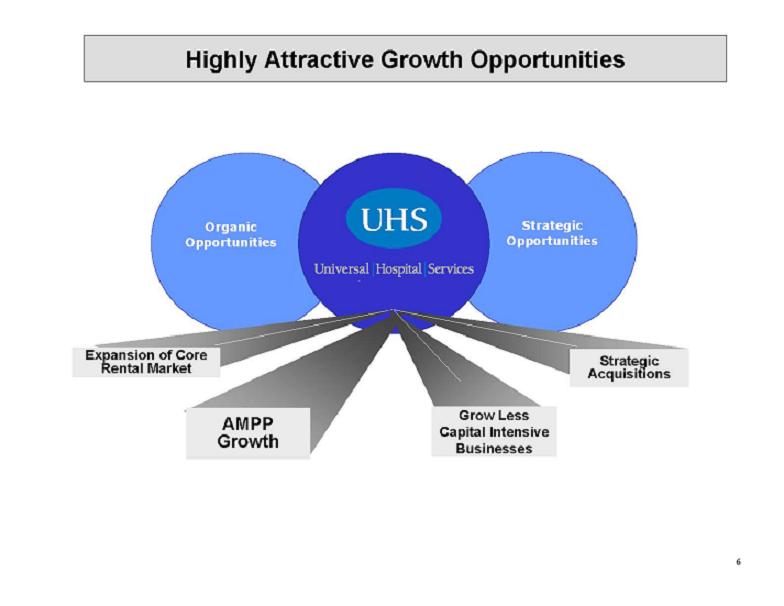
6 Strategic Opportunities Organic Opportunities Highly Attractive Growth Opportunities Expansion of Core Rental Market AMPP Growth Grow Less Capital Intensive Businesses Strategic Acquisitions
7 Implementation / Penetration of New Accounts _ Product Line Expansions _ Continued Drive for More Resident-Based Programs _ Excellent AMPP pipeline _ Continued Operating and Capex Efficiencies _ Acquisitions _ Continued Investments to drive Lifecycle Approach Focus for 2007
8 Intellamed Acquisition Rationale _ UHS agreed to acquire certain assets of Intellamed, a Texas-based medical equipment service company, for ~ $16.5 million (subject to certain adjustments and earn out consideration) _ Scheduled to close in the 2nd Quarter _ To be funded by our Revolver _ Brings > 40 technicians into the UHS family, many of which have high-end specialized technical capabilities in: _ Sterilizers _ Anesthesia _ Low-end Radiology _ Added expertise will allow for education and cross training of our broader Technician base _ Over time this would enable us to “in-house” more of the high end diagnostic work that we currently outsource
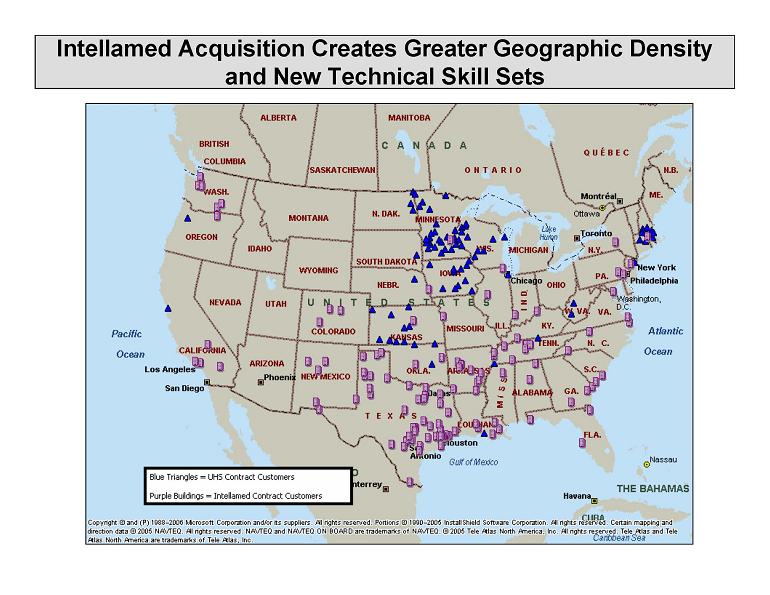
Intellamed Acquisition Creates Greater Geographic Density and New Technical Skill Sets

10 Financial Review
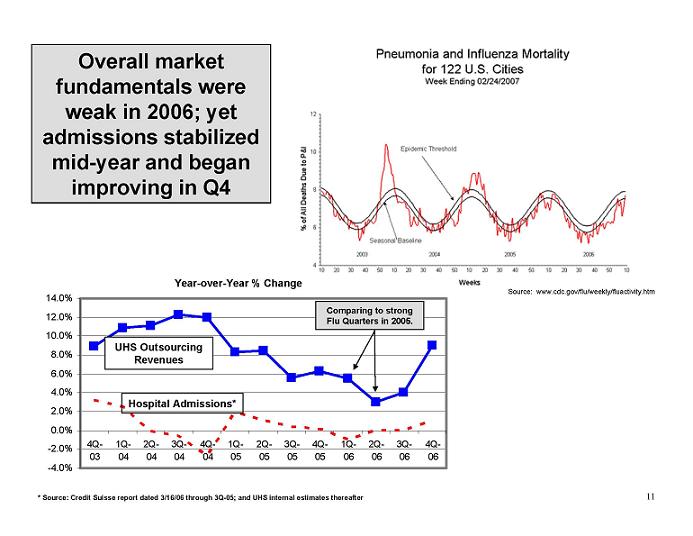
11 -4.0% -2.0% 0.0% 2.0% 4.0% 6.0% 8.0% 10.0% 12.0% 14.0% 4Q- 03 1Q- 04 2Q- 04 3Q- 04 4Q- 04 1Q- 05 2Q- 05 3Q- 05 4Q- 05 1Q- 06 2Q- 06 3Q- 06 4Q- 06 Overall market fundamentals were weak in 2006; yet admissions stabilized mid-year and began improving in Q4 Year-over-Year % Change * Source: Credit Suisse report dated 3/16/06 through 3Q-05; and UHS internal estimates thereafter Comparing to strong Flu Quarters in 2005. Source: www.cdc.gov/flu/weekly/fluactivity.htm UHS Outsourcing Revenues Hospital Admissions*
Equipment Recalls Weak Flu Weak Census Again in 2006, UHS Overcame the Market Hurdles & Continued Growing UHS
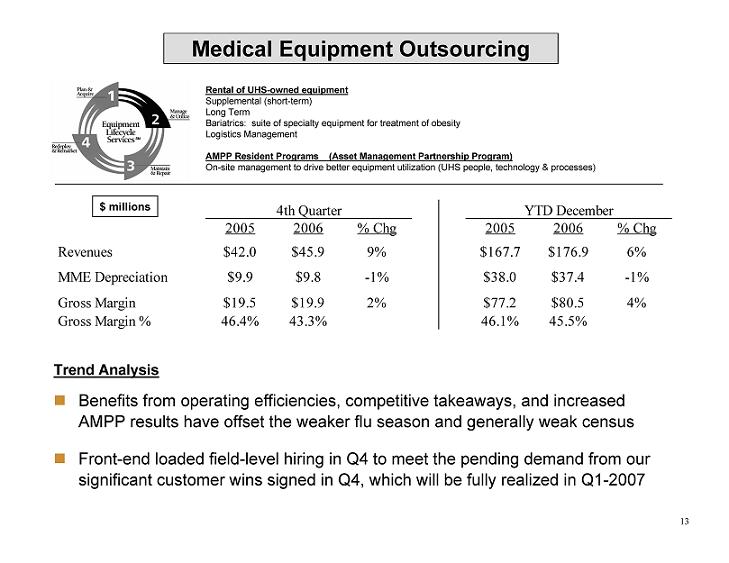
13 2005 2006 % Chg 2005 2006 % Chg Revenues $42.0 $45.9 9% $167.7 $176.9 6% MME Depreciation $9.9 $9.8 -1% $38.0 $37.4 -1% Gross Margin $19.5 $19.9 2% $77.2 $80.5 4% Gross Margin % 46.4% 43.3% 46.1% 45.5% 4th Quarter YTD December $ millions Medical Equipment Outsourcing Trend Analysis _ Benefits from operating efficiencies, competitive takeaways, and increased AMPP results have offset the weaker flu season and generally weak census _ Front-end loaded field-level hiring in Q4 to meet the pending demand from our significant customer wins signed in Q4, which will be fully realized in Q1-2007 Rental of UHS-owned equipment Supplemental (short-term) Long Term Bariatrics: suite of specialty equipment for treatment of obesity Logistics Management AMPP Resident Programs (Asset Management Partnership Program) On-site management to drive better equipment utilization (UHS people, technology & processes)
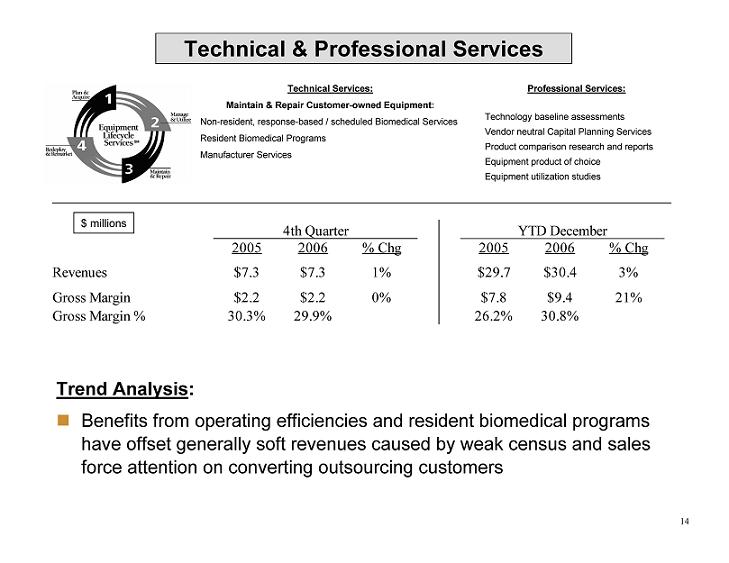
14 2005 2006 % Chg 2005 2006 % Chg Revenues $7.3 $7.3 1% $29.7 $30.4 3% Gross Margin $2.2 $2.2 0% $7.8 $9.4 21% Gross Margin % 30.3% 29.9% 26.2% 30.8% 4th Quarter YTD December $ millions Technical & Professional Services Trend Analysis: _ Benefits from operating efficiencies and resident biomedical programs have offset generally soft revenues caused by weak census and sales force attention on converting outsourcing customers Technical Services: Maintain & Repair Customer-owned Equipment: Non-resident, response-based / scheduled Biomedical Services Resident Biomedical Programs Manufacturer Services Professional Services: Technology baseline assessments Vendor neutral Capital Planning Services Product comparison research and reports Equipment product of choice Equipment utilization studies
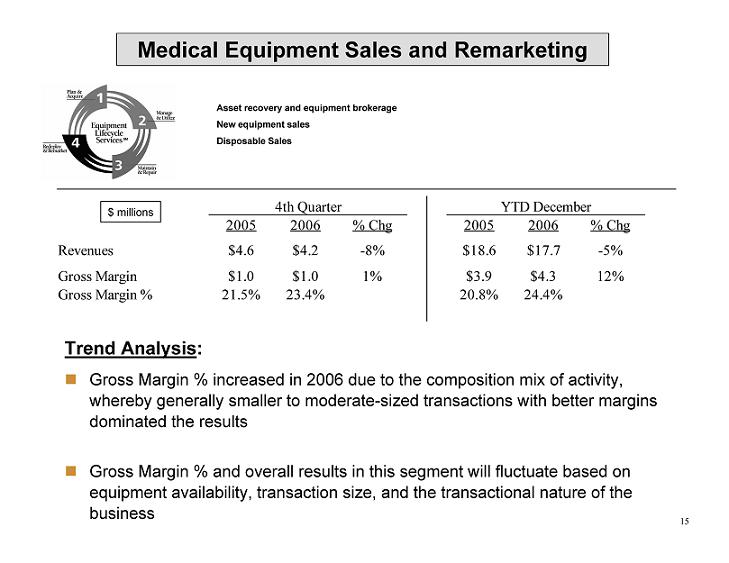
15 2005 2006 % Chg 2005 2006 % Chg Revenues $4.6 $4.2 -8% $18.6 $17.7 -5% Gross Margin $1.0 $1.0 1% $3.9 $4.3 12% Gross Margin % 21.5% 23.4% 20.8% 24.4% 4th Quarter YTD December $ millions Medical Equipment Sales and Remarketing Asset recovery and equipment brokerage New equipment sales Disposable Sales Trend Analysis: _ Gross Margin % increased in 2006 due to the composition mix of activity, whereby generally smaller to moderate-sized transactions with better margins dominated the results _ Gross Margin % and overall results in this segment will fluctuate based on equipment availability, transaction size, and the transactional nature of the business
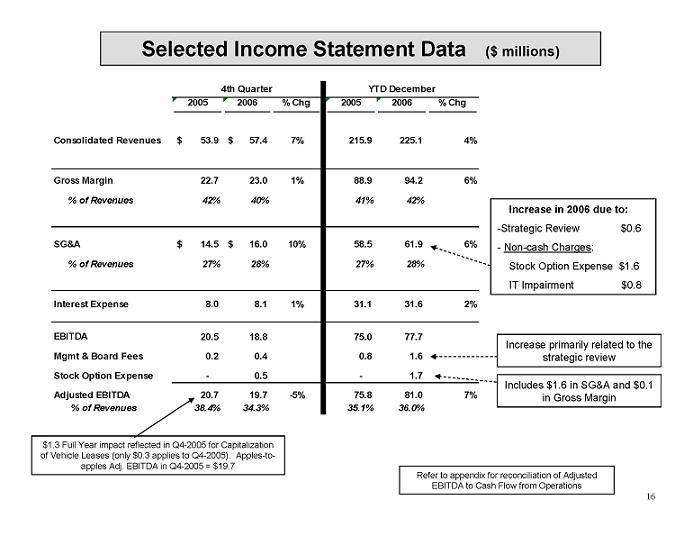
16 Selected Income Statement Data ($ millions) 2005 2006 % Chg 2005 2006 % Chg Consolidated Revenues 53.9 $ 57.4 $ 7% 215.9 225.1 4% Gross Margin 22.7 23.0 1% 88.9 94.2 6% % of Revenues 42% 40% 41% 42% SG&A 14.5 $ 16.0 $ 10% 58.5 61.9 6% % of Revenues 27% 28% 27% 28% Interest Expense 8.0 8.1 1% 31.1 31.6 2% EBITDA 20.5 18.8 75.0 77.7 Mgmt & Board Fees 0.2 0.4 0.8 1.6 Stock Option Expense - 0.5 - 1.7 Adjusted EBITDA 20.7 19.7 -5% 75.8 81.0 7% % of Revenues 38.4% 34.3% 35.1% 36.0% 4th Quarter YTD December Refer to appendix for reconciliation of Adjusted EBITDA to Cash Flow from Operations Increase primarily related to the strategic review Increase in 2006 due to: -Strategic Review $0.6 - Non-cash Charges: Stock Option Expense $1.6 IT Impairment $0.8 Includes $1.6 in SG&A and $0.1 in Gross Margin $1.3 Full Year impact reflected in Q4-2005 for Capitalization of Vehicle Leases (only $0.3 applies to Q4-2005). Apples-toapples Adj. EBITDA in Q4-2005 = $19.7

7 17 Balance Sheet EBITDA Debt Impact 12/31/05 $2.4 $1.3 2006 Actual $6.8 $1.6 2006 Pro Forma $6.8 $3.3 Vehicle Lease Capitalization & Pro Forma Impact (millions) 0 100 200 300 400 500 600 700 Dec- 05 Jan- 06 Feb- 06 Mar- 06 Apr- 06 May- 06 Jun- 06 Jul-06 Aug- 06 Sep- 06 Oct- 06 Nov- 06 Dec- 06 Total # Vehicles # Operating Lease Vehicles # Capital Lease Vehicles Capitalization converts rent expense to Depreciation & interest Step 3: Pro Forma impact: 2006 = $1.7 ($3.3 - $1.6) Step 1: at 12/31/05, tripped FAS 13 on our Truck leases (~ 166 vehicles) Step 2: in Q4-2006, converted the remaining vehicles to capital leases Trucks Mini Vans PT Cruisers Sprinter Vans Step 4: Calculate Pro Forma Adj. EBITDA Actual Adj. EBITDA $ 81.0 Vehicle lease adder 1.7 Pro forma Adj. EBITDA $ 82.7 Refer to appendix for reconciliation of Adjusted EBITDA to Cash Flow from Operations

18 Liquidity Overview – Year Ended Dec 2006 ($ millions) $ Borrowing Base at 12/31/2006 (net of L/Cs outstanding) $120 Available Liquidity $77 12/31/05 Revolver Balance $ 38 12/31/06 Net Revolver Balance $43 Other $2 (a) (a) “Other” comprises Financing Cash Flows which are primarily reduction in checks outstanding and capital lease payments (b) 10.125% Note Interest is paid semi-annually; ~ $13.2 each May 1 and Nov 1, thus we accrued ~ $4 at 12/31/06. Investing Cash Flows $52 (heavy funding in Q4 related to significant customer wins) 10.125% Note Interest Accrual ~ $4 (b) Cash Flow from Operations $ 49 Pro Forma Leverage Calculation – 12/31/06 Total Debt at 12/31/06 $310.2 LTM Pro Forma EBITDA $ 82.7 Pro Forma Leverage 3.8x See prior slide for calculation
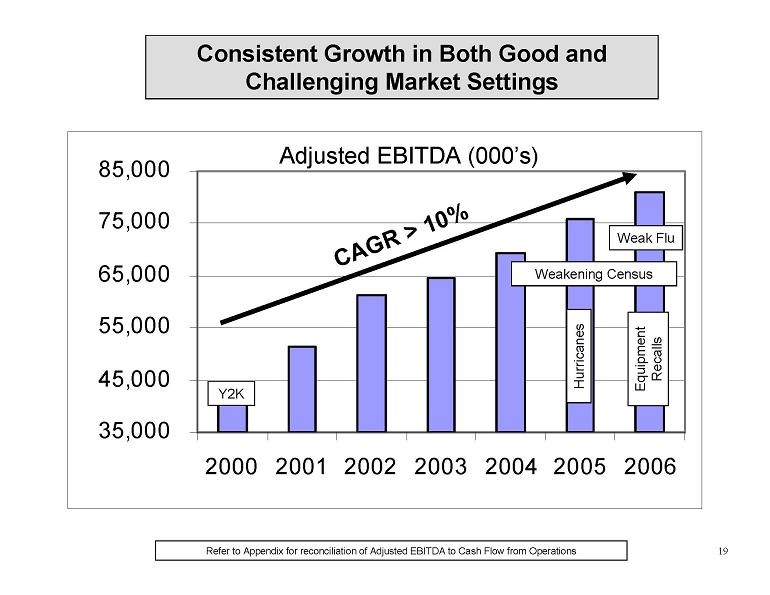
19 35,000 45,000 55,000 65,000 75,000 85,000 2000 2001 2002 2003 2004 2005 2006 Refer to Appendix for reconciliation of Adjusted EBITDA to Cash Flow from Operations Consistent Growth in Both Good and Challenging Market Settings CAGR > 10% Y2K Hurricanes Equipment Recalls Weakening Census Adjusted EBITDA (000’s) Weak Flu
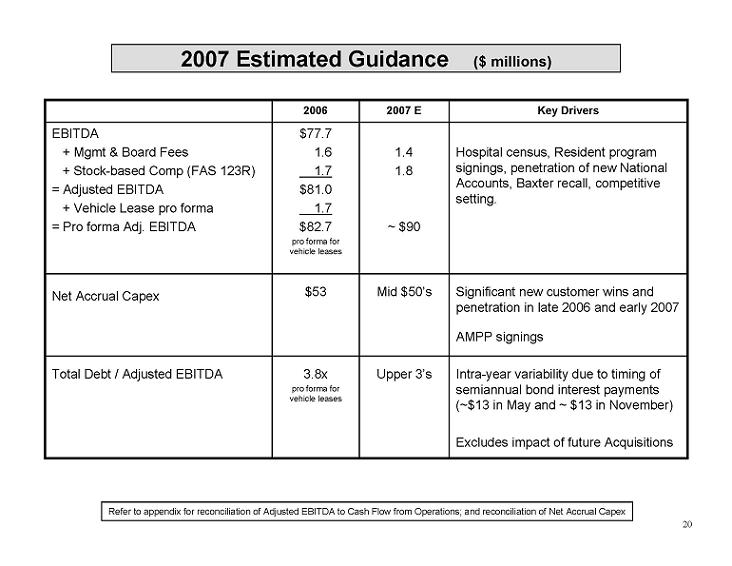
20 2007 Estimated Guidance ($ millions) 3.8x pro forma for vehicle leases $53 $77.7 1.6 1.7 $81.0 1.7 $82.7 pro forma for vehicle leases 2006 Intra-year variability due to timing of semiannual bond interest payments (~$13 in May and ~ $13 in November) Excludes impact of future Acquisitions Upper 3’s Total Debt / Adjusted EBITDA Significant new customer wins and penetration in late 2006 and early 2007 AMPP signings Mid $50’s Net Accrual Capex 1.4 1.8 ~ $90 2007 E Hospital census, Resident program signings, penetration of new National Accounts, Baxter recall, competitive setting. EBITDA + Mgmt & Board Fees + Stock-based Comp (FAS 123R) = Adjusted EBITDA + Vehicle Lease pro forma = Pro forma Adj. EBITDA Key Drivers Refer to appendix for reconciliation of Adjusted EBITDA to Cash Flow from Operations; and reconciliation of Net Accrual Capex
Due to our Numerous Customer Wins in Late 2006, We Expect to Come Out of the Blocks Quickly in 2007 and Continue our Momentum

22 Appendix
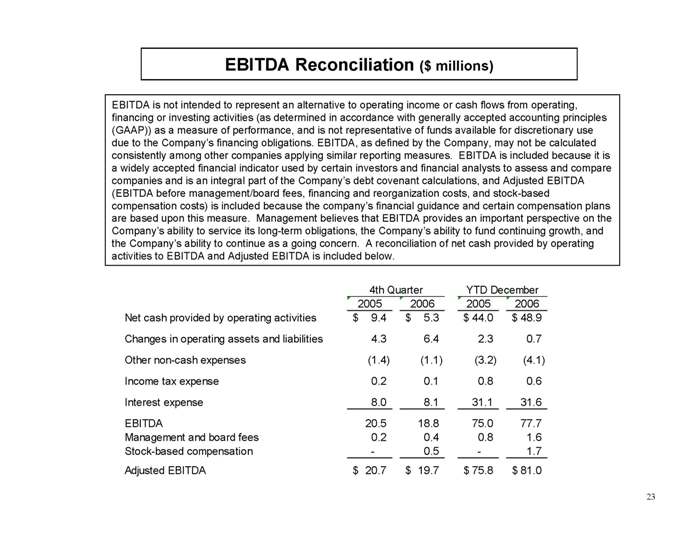
23 EBITDA Reconciliation ($ millions) EBITDA is not intended to represent an alternative to operating income or cash flows from operating, financing or investing activities (as determined in accordance with generally accepted accounting principles (GAAP)) as a measure of performance, and is not representative of funds available for discretionary use due to the Company’s financing obligations. EBITDA, as defined by the Company, may not be calculated consistently among other companies applying similar reporting measures. EBITDA is included because it is a widely accepted financial indicator used by certain investors and financial analysts to assess and compare companies and is an integral part of the Company’s debt covenant calculations, and Adjusted EBITDA (EBITDA before management/board fees, financing and reorganization costs, and stock-based compensation costs) is included because the company’s financial guidance and certain compensation plans are based upon this measure. Management believes that EBITDA provides an important perspective on the Company’s ability to service its long-term obligations, the Company’s ability to fund continuing growth, and the Company’s ability to continue as a going concern. A reconciliation of net cash provided by operating activities to EBITDA and Adjusted EBITDA is included below. 2005 2006 2005 2006 Net cash provided by operating activities 9.4 $ 5.3 $ 44.0 $ 48.9 $ Changes in operating assets and liabilities 4.3 6.4 2.3 0.7 Other non-cash expenses (1.4) (1.1) (3.2) (4.1) Income tax expense 0.2 0.1 0.8 0.6 Interest expense 8.0 8.1 31.1 31.6 EBITDA 20.5 18.8 75.0 77.7 Management and board fees 0.2 0.4 0.8 1.6 Stock-based compensation - 0.5 - 1.7 Adjusted EBITDA 20.7 $ 19.7 $ 75.8 $ 81.0 $ 4th Quarter YTD December
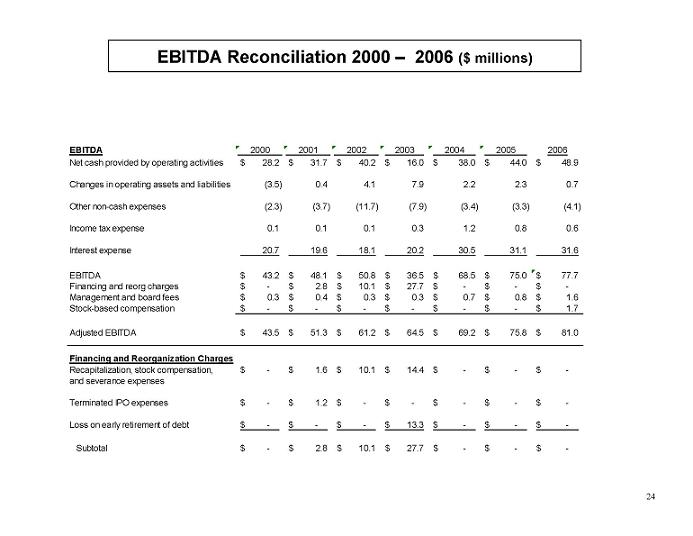
24 EBITDA Reconciliation 2000 – 2006 ($ millions) EBITDA 2000 2001 2002 2003 2004 2005 2006 Net cash provided by operating activities 28.2 $ 31.7 $ 40.2 $ 16.0 $ 38.0 $ 44.0 $ 48.9 $ Changes in operating assets and liabilities (3.5) 0.4 4.1 7.9 2.2 2.3 0.7 Other non-cash expenses (2.3) (3.7) (11.7) (7.9) (3.4) (3.3) (4.1) Income tax expense 0.1 0.1 0.1 0.3 1.2 0.8 0.6 Interest expense 20.7 19.6 18.1 20.2 30.5 31.1 31.6 EBITDA 43.2 $ 48.1 $ 50.8 $ 36.5 $ 68.5 $ 75.0 $ 77.7 $ Financing and reorg charges - $ 2.8 $ 10.1 $ 27.7 $ - $ - $ - $ Management and board fees 0.3 $ 0.4 $ 0.3 $ 0.3 $ 0.7 $ 0.8 $ 1.6 $ Stock-based compensation - $ - $ - $ - $ - $ - $ 1.7 $ Adjusted EBITDA 43.5 $ 51.3 $ 61.2 $ 64.5 $ 69.2 $ 75.8 $ 81.0 $ Financing and Reorganization Charges Recapitalization, stock compensation, - $ 1.6 $ 10.1 $ 14.4 $ - $ - $ - $ and severance expenses Terminated IPO expenses - $ 1.2 $ - $ - $ - $ - $ - $ Loss on early retirement of debt - $ - $ - $ 13.3 $ - $ - $ - $ Subtotal - $ 2.8 $ 10.1 $ 27.7 $ - $ - $ - $
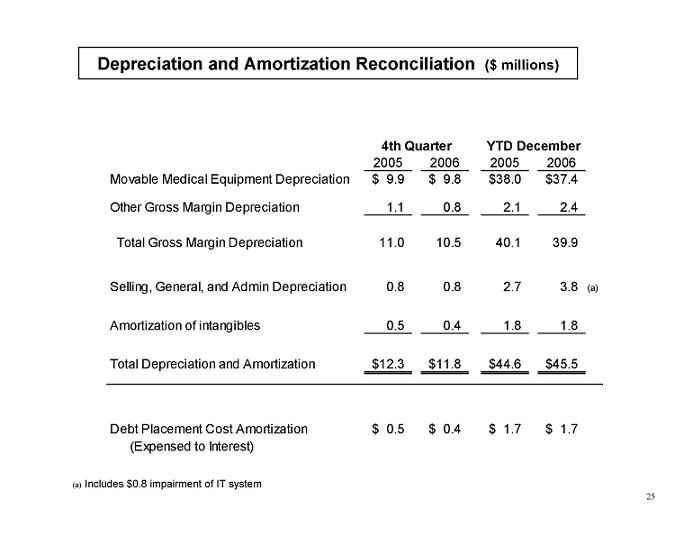
25 Depreciation and Amortization Reconciliation ($ millions) 2005 2006 2005 2006 Movable Medical Equipment Depreciation 9.9 $ 9.8 $ 38.0 $ 37.4 $ Other Gross Margin Depreciation 1.1 0.8 2.1 2.4 Total Gross Margin Depreciation 11.0 10.5 40.1 39.9 Selling, General, and Admin Depreciation 0.8 0.8 2.7 3.8 (a) Amortization of intangibles 0.5 0.4 1.8 1.8 Total Depreciation and Amortization 12.3 $ 11.8 $ 44.6 $ 45.5 $ Debt Placement Cost Amortization 0.5 $ 0.4 $ 1.7 $ 1.7 $ (Expensed to Interest) 4th Quarter YTD December (a) Includes $0.8 impairment of IT system
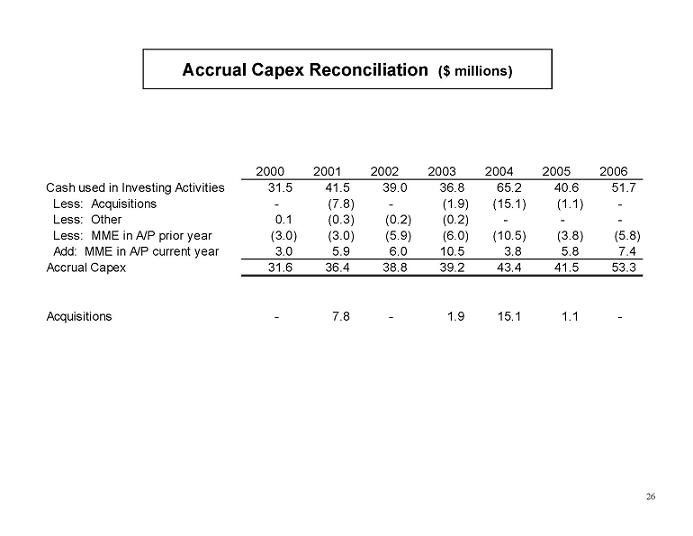
26 Accrual Capex Reconciliation ($ millions) 2000 2001 2002 2003 2004 2005 2006 Cash used in Investing Activities 31.5 41.5 39.0 36.8 65.2 40.6 51.7 Less: Acquisitions - (7.8) - (1.9) (15.1) (1.1) - Less: Other 0.1 (0.3) (0.2) (0.2) - - - Less: MME in A/P prior year (3.0) (3.0) (5.9) (6.0) (10.5) (3.8) (5.8) Add: MME in A/P current year 3.0 5.9 6.0 10.5 3.8 5.8 7.4 Accrual Capex 31.6 36.4 38.8 39.2 43.4 41.5 53.3 Acquisitions - 7.8 - 1.9 15.1 1.1 -