UHOS Q2 2007 Earnings Teleconference August 15, 2007
Forward Looking Statements Safe Harbor Statement under the Private Securities Litigation Reform Act of 1995: Universal Hospital Services, Inc. believes statements in this presentation looking forward in time involve risks and uncertainties. The following factors, among others, could adversely affect our business, operations and financial condition causing our actual results to differ materially from those expressed in any forward-looking statements: our history of net losses and substantial interest expense; our need for substantial cash to operate and expand our business as planned; our substantial outstanding debt and debt service obligations; restrictions imposed by the terms of our debt; a decrease in the number of patients our customers are serving; our ability to effect change in the manner in which healthcare providers traditionally procure medical equipment; the absence of long-term commitments with customers; our ability to renew contracts with group purchasing organizations and integrated delivery networks; changes in reimbursement rates and policies by third-party payors; the impact of health care reform initiatives; the impact of significant regulation of the health care industry and the need to comply with those regulations; difficulties or delays in our continued expansion into certain of our businesses/geographic markets and developments of new businesses/geographic markets; and additional credit risks in increasing business with home care providers and nursing homes, impacts of equipment product recalls or obsolescence; increases in vendor costs that cannot be passed through to our customers; and other Risk Factors as detailed in our quarterly report on Form 10Q for the quarter ended June 30, 2007, filed with the Securities and Exchange Commission. This presentation contains non-GAAP measures as defined by SEC rules. Reconciliations of these measures to the most directly comparable GAAP measures are contained in the appendix.
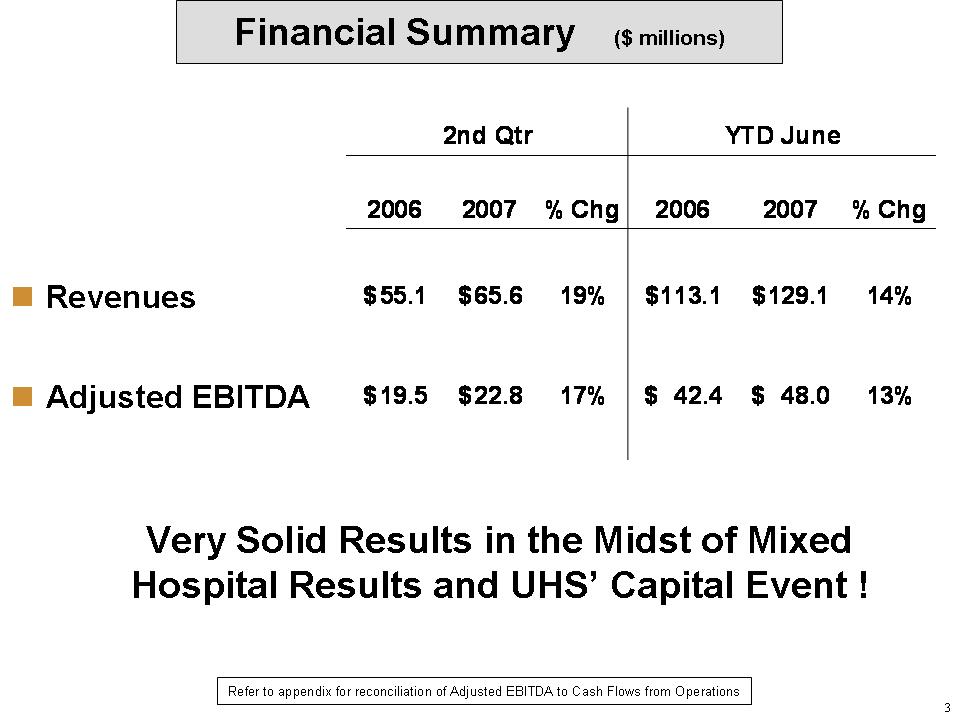
Financial Summary ($ millions) Revenues Adjusted EBITDA Refer to appendix for reconciliation of Adjusted EBITDA to Cash Flows from Operations 2006 2007 % Chg 2006 2007 % Chg 55.1 $ 65.6 $ 19% 113.1 $ 129.1 $ 14% 19.5 $ 22.8 $ 17% 42.4 $ 48.0 $ 13% 2nd Qtr YTD June Very Solid Results in the Midst of Mixed Hospital Results and UHS’ Capital Event
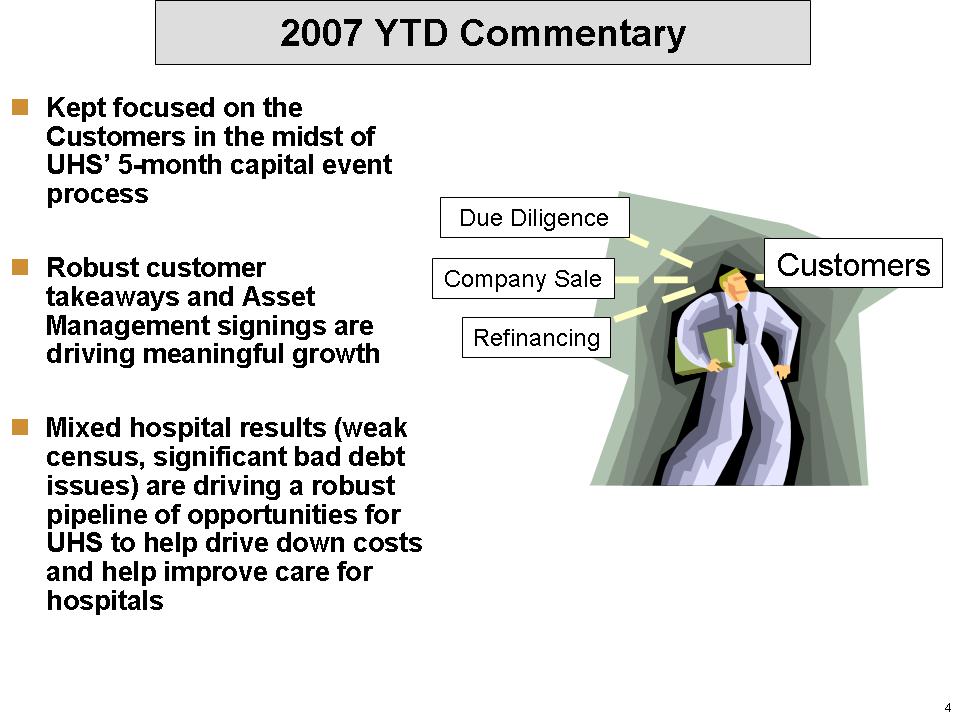
Kept focused on the Customers in the midst of UHS’ 5-month capital event process Robust customer takeaways and Asset Management signings are driving meaningful growth Mixed hospital results (weak census, significant bad debt issues) are driving a robust pipeline of opportunities for UHS to help drive down costs and help improve care for hospitals 2007 YTD Commentary Customers Due Diligence Company Sale Refinancing
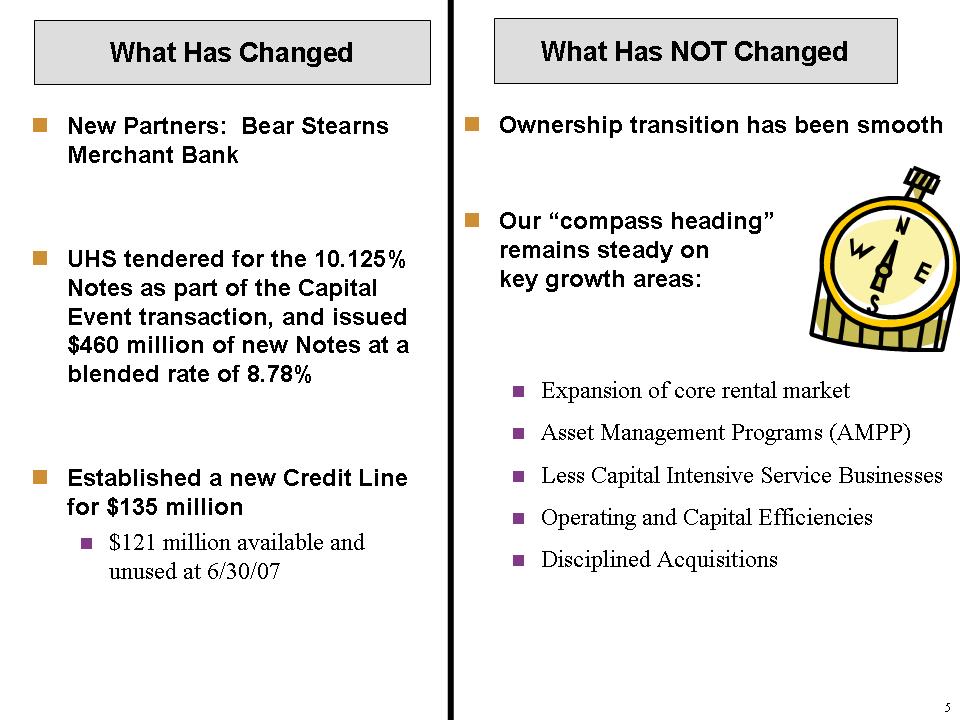
Ownership transition has been smooth Our “compass heading” remains steady on key growth areas: Expansion of core rental market Asset Management Programs (AMPP) Less Capital Intensive Service Businesses Operating and Capital Efficiencies Disciplined Acquisitions What Has NOT Changed What Has Changed New Partners: Bear Stearns Merchant Bank UHS tendered for the 10.125% Notes as part of the Capital Event transaction, and issued $460 million of new Notes at a blended rate of 8.78% Established a new Credit Line for $135 million $121 million available and unused at 6/30/07
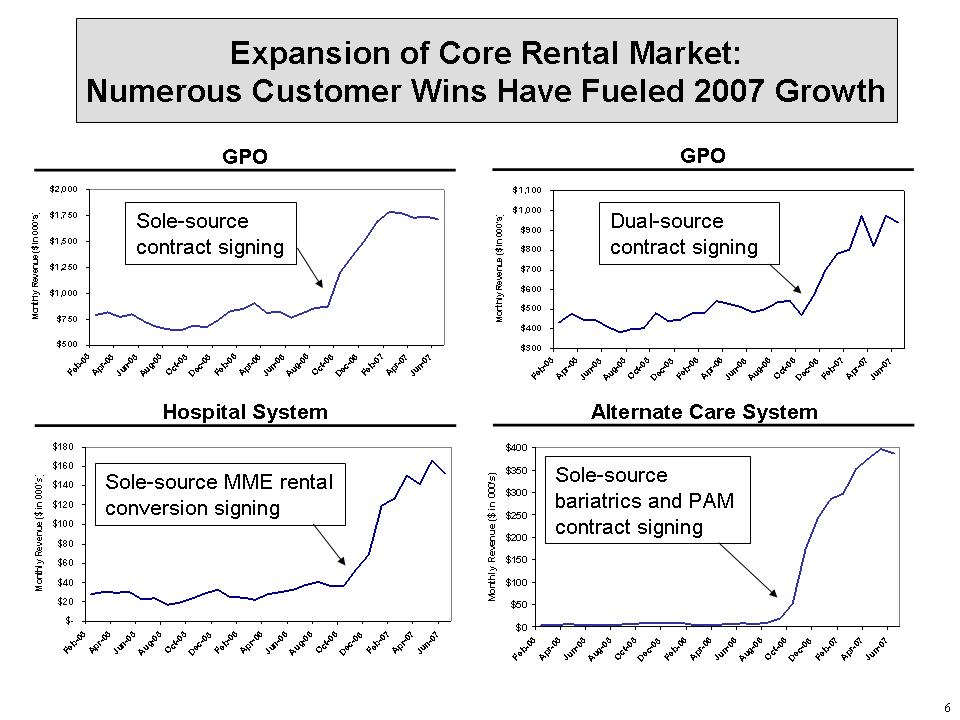
Expansion of Core Rental Market: Numerous Customer Wins Have Fueled 2007 Growth GPO GPO Hospital System Alternate Care System $500 $750 $1,000 $1,250 $1,500 $1,750 $2,000 Feb-05 Apr-05 Jun-05 Aug-05 Oct-05 Dec-05 Feb-06 Apr-06 Jun-06 Aug-06 Oct-06 Dec-06 Feb-07 Apr-07 Jun-07 Monthly Revenue ($ in 000's) $300 $400 $500 $600 $700 $800 $900 $1,000 $1,100 Feb-05 Apr-05 Jun-05 Aug-05 Oct-05 Dec-05 Feb-06 Apr-06 Jun-06 Aug-06 Oct-06 Dec-06 Feb-07 Apr-07 Jun-07 Monthly Revenue ($ in 000's) $-$20 $40 $60 $80 $100 $120 $140 $160 $180 Feb-05 Apr-05 Jun-05 Aug-05 Oct-05 Dec-05 Feb-06 Apr-06 Jun-06 Aug-06 Oct-06 Dec-06 Feb-07 Apr-07 Jun-07 Monthly Revenue ($ in 000's) $0 $50 $100 $150 $200 $250 $300 $350 $400 Feb-05 Apr-05 Jun-05 Aug-05 Oct-05 Dec-05 Feb-06 Apr-06 Jun-06 Aug-06 Oct-06 Dec-06 Feb-07 Apr-07 Jun-07 Monthly Revenue ($ in 000's) Sole-source contract signing Dual-source contract signing Sole-source MME rental conversion signing Sole-source bariatrics and PAM contract signing
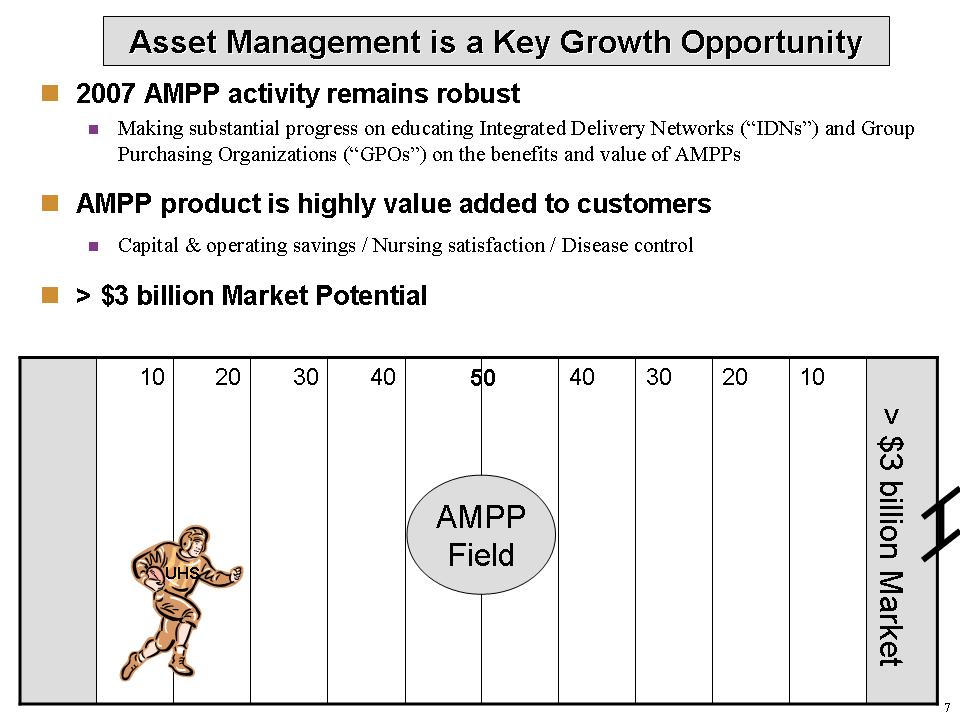
Asset Management is a Key Growth Opportunity 2007 AMPP activity remains robust Making substantial progress on educating Integrated Delivery Networks (“IDNs”) and Group Purchasing Organizations (“GPOs”) on the benefits and value of AMPPs AMPP product is highly value added to customers Capital & operating savings / Nursing satisfaction / Disease control $3 billion Market Potential 10 40 30 20 40 30 20 10 AMPP Field 50 UHS $3 billion Market
Grow Less Capital Intensive Businesses Beds / Stretchers / Support Surfaces Other “capital light” opportunities are Percolating Technical Services Manufacturer Relationships
Significant competitive takeaways in Rental Significant AMPP opportunities Execution on “capital light” deals; more in the works Customers experiencing volume and credit issues - - - - UHS will stay close to customers to provide solutions 2nd Half 2007 Outlook 2nd Half Outlook
Expect the consistency and transparency you’ve seen from us in the past Expect the investments UHS has made in its Equipment Lifecycle strategy to continue to fuel growth for several years Our Focus and Vision for the Future Remain Clear Outlook: 2007 and Beyond
Our accounting department has worked very hard over the past quarter performing all the necessary tasks around the sale We’ll attempt to explain in a simple way the nuances of the key accounting implications of the sale Capital Event & Change of Control Create Substantial Accounting Changes FAS 141 Revaluation of Assets and Liabilities to Market FAS 142 SFAS 133

13 FAS 141 Mandates Revaluation of the Balance Sheet to “Market” upon a Change in Control Q2 2007 impact was $ (0.2) $ (1.4) $ 14.3 $ (17.7) $ 891 $ 265 Total $ (0.2) $ 14.0 $ (0.1) Higher Amortization $ 600 $ 52 Goodwill, Intangibles and Other $ (15.4) $ (1.0) $ (1.0) $ (0.2) Gross Margin Higher Depreciation on Fleet Higher Depreciation on Property Higher Cost on Sales from Fleet Increased Cost of Sales in Inventory (Q2 and Q3 2007) Commentary on Impact of Revaluation $ (1.0) $ 0.3 $ 229 $ 157 Fixed Assets $ (0.2) $ 62 $ 56 Current Assets Adj. EBITDA SG&A 6/30/07 Successor Value 12/31/06 Predecessor Value Category Est. Annualized Impact Acquisition and Revaluation has increased our total assets per GAAP from $265 at 12/31/06 to $928 at 6/30/07 Such Revaluations will impact numerous categories of our financials as illustrated below, including Adjusted EBITDA $ millions Refer to Appendix for reconciliation of Adjusted EBITDA to Cash Flows from Operations
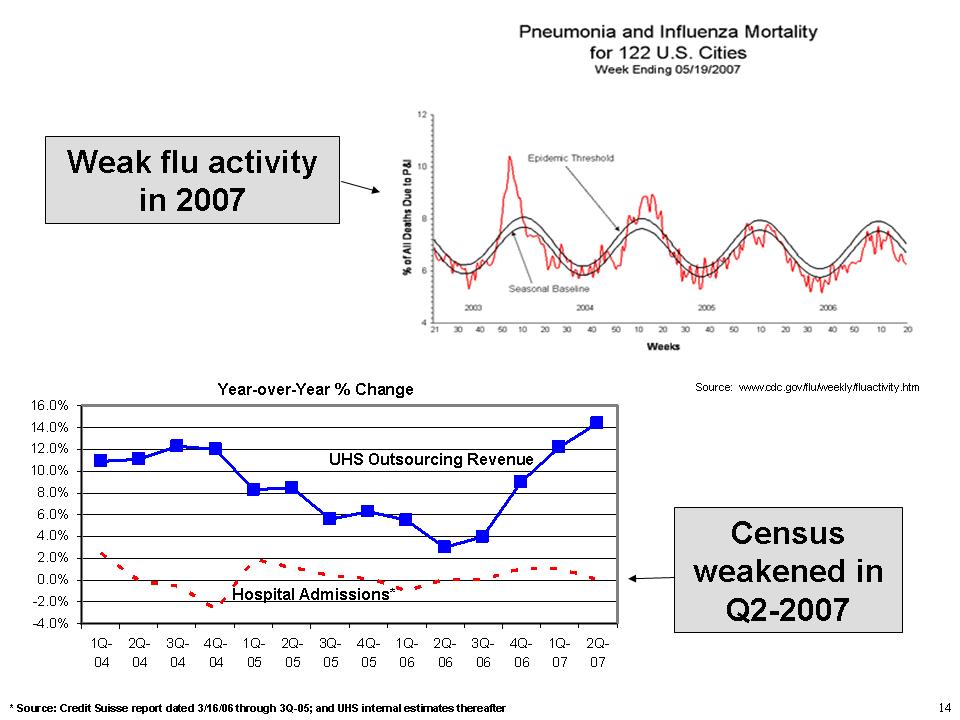
-4.0% -2.0% 0.0% 2.0% 4.0% 6.0% 8.0% 10.0% 12.0% 14.0% 16.0% 1Q- 04 2Q- 04 3Q- 04 4Q- 04 1Q- 05 2Q- 05 3Q- 05 4Q- 05 1Q- 06 2Q- 06 3Q- 06 4Q- 06 1Q- 07 2Q- 07 Weak flu activity in 2007 Source: Credit Suisse report dated 3/16/06 through 3Q-05; and UHS internal estimates thereafter Source: www.cdc.gov/flu/weekly/fluactivity.htmCensus weakened in Q2-2007 Year-over-Year % Change UHS Outsourcing Revenue Hospital Admissions
2006 2007 % Chg 2006 2007 % Chg Revenues 43.2 $ 50.6 $ 17% 88.7 $ 101.6 $ 14% MME Depreciation 9.2 12.9 40% 18.2 23.1 27% Gross Margin per GAAP 19.8 $ 20.6 $ 4% 42.6 $ 44.8 $ 5% Gross Margin % per GAAP 45.9% 40.7% 48.0% 44.1% FAS 141 Impact - 1.5 - 1.5 Gross Margin Pre-FAS 141 19.8 $ 22.1 $ 11% 42.6 $ 46.3 $ 9% Gross Margin % Pre-FAS 141 45.9% 43.7% 48.0% 45.6% 2nd Quarter YTD June $ millions Medical Equipment Outsourcing Trend Analysis Revenues and Gross Margin increased due to the benefits of our significant customer wins and Asset Management signings in late 2006 and YTD 2007 The decline in the Gross Margin % Pre-FAS 141 is partially due to pricing reductions on the group purchasing organization contract signings in late 2006, and a $0.9 million non-cash write-off in Q2 of certain respiratory equipment in our fleet Rental of UHS-owned equipment Supplemental (short-term) Long-Term Bariatrics: suite of specialty equipment for treatment of obesity Rental of Manufacturer-owned equipment AMPP Resident Programs (Asset Management Partnership Program) On-site management to drive better equipment utilization (UHS people, technology & processes)
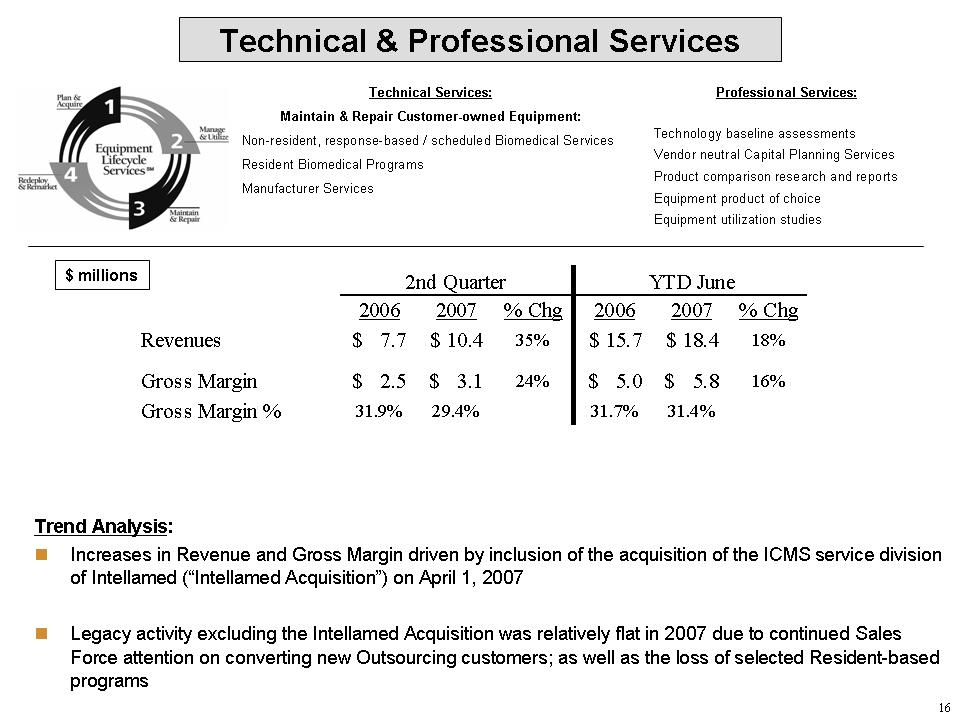
2006 2007 % Chg 2006 2007 % Chg Revenues 7.7 $ 10.4 $ 35% 15.7 $ 18.4 $ 18% Gross Margin 2.5 $ 3.1 $ 24% 5.0 $ 5.8 $ 16% Gross Margin % 31.9% 29.4% 31.7% 31.4% 2nd Quarter YTD June $ millions Technical & Professional Services Trend Analysis: Increases in Revenue and Gross Margin driven by inclusion of the acquisition of the ICMS service division of Intellamed (“Intellamed Acquisition”) on April 1, 2007 Legacy activity excluding the Intellamed Acquisition was relatively flat in 2007 due to continued Sales Force attention on converting new Outsourcing customers; as well as the loss of selected Resident-based programs Technical Services: Maintain & Repair Customer-owned Equipment: Non-resident, response-based / scheduled Biomedical Services Resident Biomedical Programs Manufacturer Services Professional Services: Technology baseline assessments Vendor neutral Capital Planning Services Product comparison research and reports Equipment product of choice Equipment utilization studies
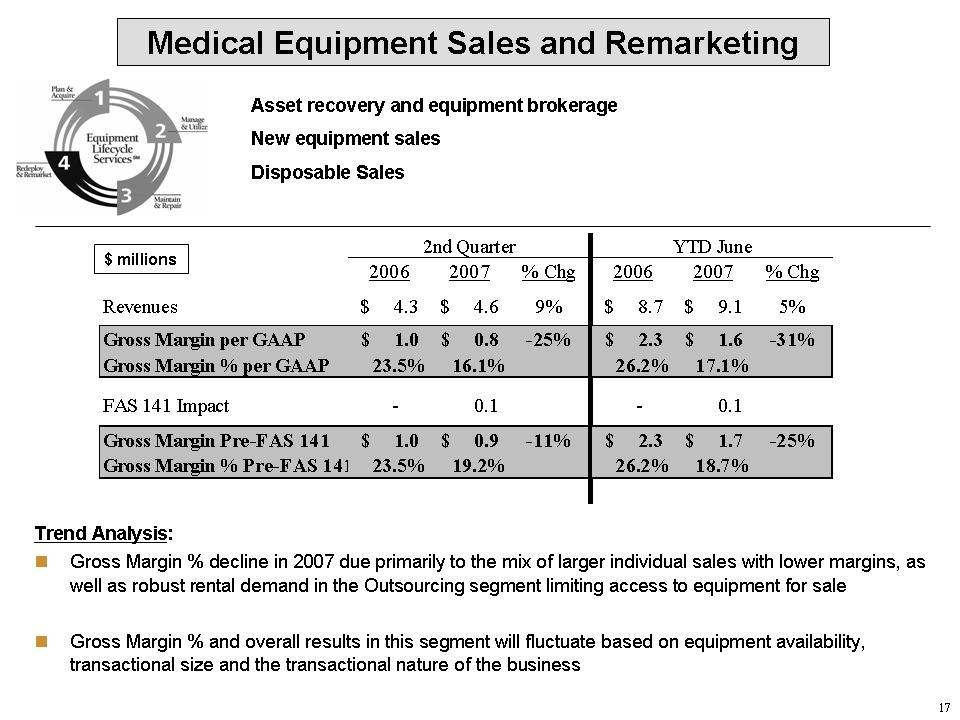
2006 2007 % Chg 2006 2007 % Chg Revenues 4.3 $ 4.6 $ 9% 8.7 $ 9.1 $ 5% Gross Margin per GAAP 1.0 $ 0.8 $ -25% 2.3 $ 1.6 $ -31% Gross Margin % per GAAP 23.5% 16.1% 26.2% 17.1% FAS 141 Impact - 0.1 - 0.1 Gross Margin Pre-FAS 141 1.0 $ 0.9 $ -11% 2.3 $ 1.7 $ -25% Gross Margin % Pre-FAS 141 23.5% 19.2% 26.2% 18.7% 2nd Quarter YTD June $ millions Medical Equipment Sales and Remarketing Asset recovery and equipment brokerage New equipment sales Disposable Sales Trend Analysis: Gross Margin % decline in 2007 due primarily to the mix of larger individual sales with lower margins, as well as robust rental demand in the Outsourcing segment limiting access to equipment for sale Gross Margin % and overall results in this segment will fluctuate based on equipment availability, transactional size and the transactional nature of the business
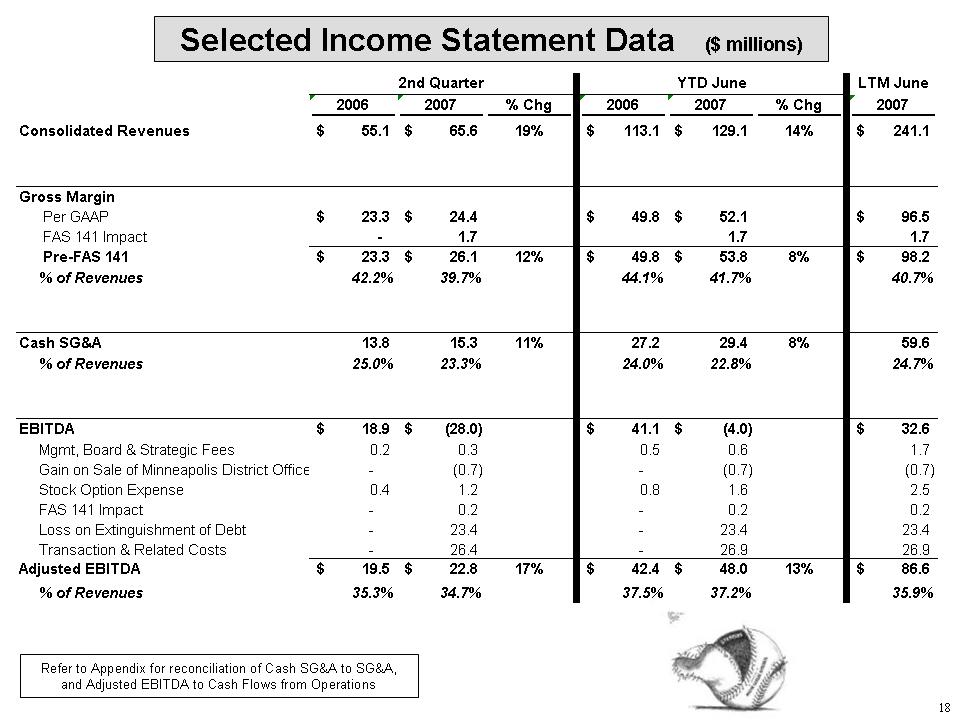
Selected Income Statement Data ($ millions) LTM June 2006 2007 % Chg 2006 2007 % Chg 2007 Consolidated Revenues 55.1 $ 65.6 $ 19% 113.1 $ 129.1 $ 14% 241.1 $ Gross Margin Per GAAP 23.3 $ 24.4 $ 49.8 $ 52.1 $ 96.5 $FAS 141 Impact - 1.7 1.7 1.7 Pre-FAS 141 23.3 $ 26.1 $ 12% 49.8 $ 53.8 $ 8% 98.2 $ % of Revenues 42.2% 39.7% 44.1% 41.7% 40.7% Cash SG&A 13.8 15.3 11% 27.2 29.4 8% 59.6 % of Revenues 25.0% 23.3% 24.0% 22.8% 24.7% EBITDA 18.9 $ (28.0) $ 41.1 $ (4.0) $ 32.6 $ Mgmt, Board & Strategic Fees 0.2 0.3 0.5 0.6 1.7 Gain on Sale of Minneapolis District Office - (0.7) - (0.7) (0.7) Stock Option Expense 0.4 1.2 0.8 1.6 2.5 FAS 141 Impact - 0.2 - 0.2 0.2 Loss on Extinguishment of Debt - 23.4 - 23.4 23.4 Transaction & Related Costs - 26.4 - 26.9 26.9 Adjusted EBITDA 19.5 $ 22.8 $ 17% 42.4 $ 48.0 $ 13% 86.6 $ % of Revenues 35.3% 34.7% 37.5% 37.2% 35.9% 2nd Quarter YTD June Refer to Appendix for reconciliation of Cash SG&A to SG&A, and Adjusted EBITDA to Cash Flows from Operations
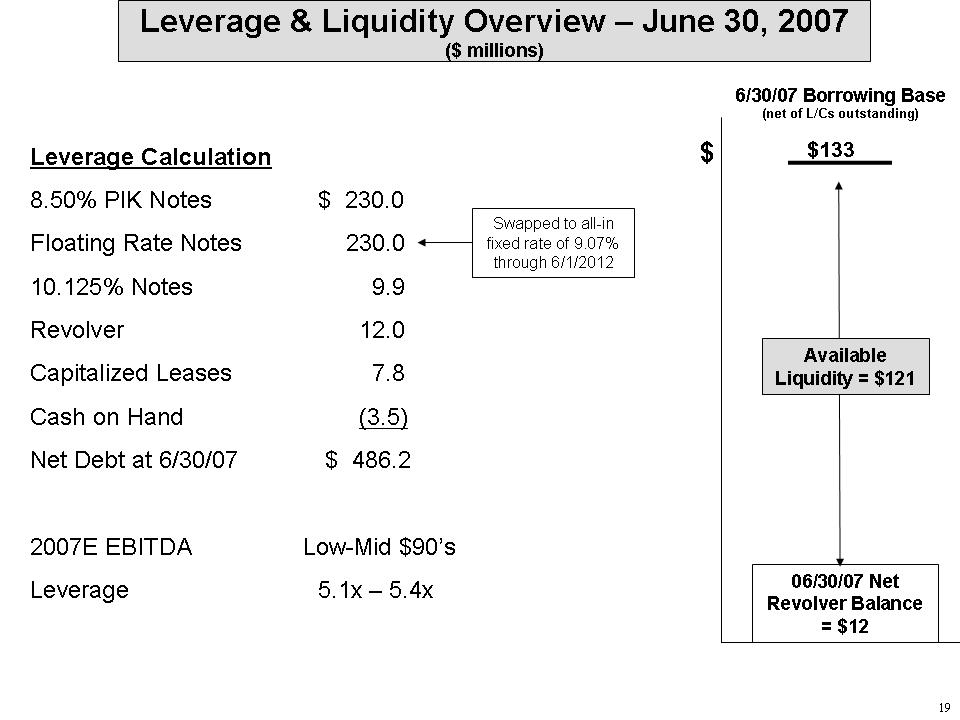
Leverage & Liquidity Overview – June 30, 2007 ($ millions) $ 6/30/07 Borrowing Base (net of L/Cs outstanding) $133 Available Liquidity = $121 06/30/07 Net Revolver Balance = $12 Leverage Calculation 8.50% PIK Notes $ 230.0 Floating Rate Notes 230.0 10.125% Notes 9.9 Revolver 12.0 Capitalized Leases 7.8 Cash on Hand (3.5) Net Debt at 6/30/07 $ 486.2 2007E EBITDA Low-Mid $90’s Leverage 5.1x – 5.4x Swapped to all-in fixed rate of 9.07% through 6/1/2012
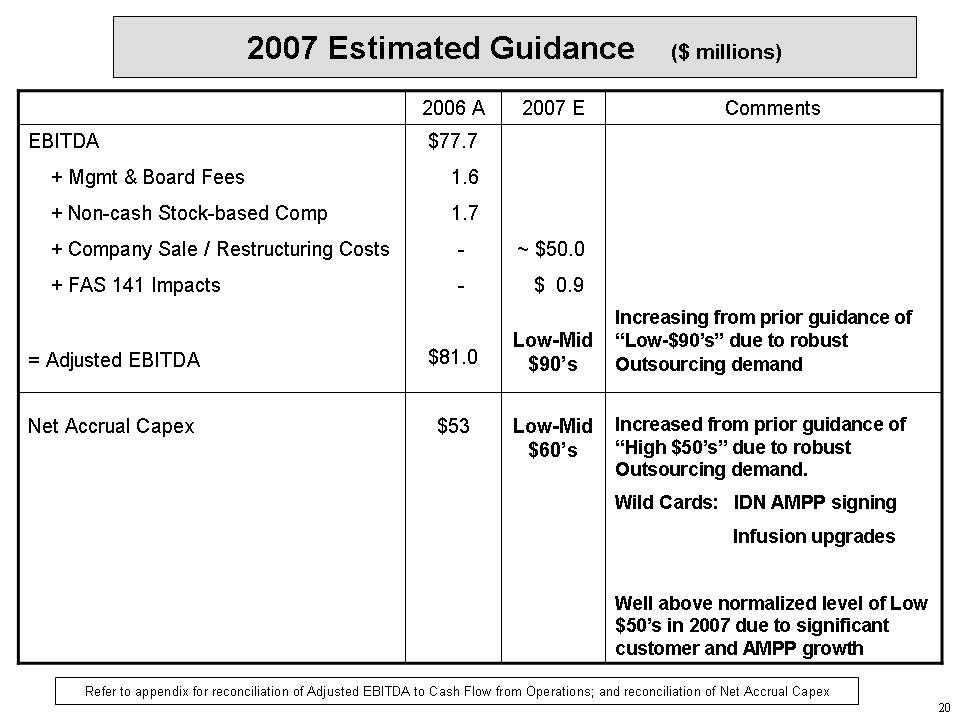
2007 Estimated Guidance ($ millions) $53 $77.7 1.6 1.7 - - $81.0 2006 A Increased from prior guidance of “High $50’s” due to robust Outsourcing demand. Wild Cards: IDN AMPP signing Infusion upgrades Well above normalized level of Low $50’s in 2007 due to significant customer and AMPP growth Low-Mid $60’s Net Accrual Capex $50.0 $ 0.9 Low-Mid $90’s 2007 Increasing from prior guidance of “Low-$90’s” due to robust Outsourcing demand EBITDA + Mgmt & Board Fees + Non-cash Stock-based Comp + Company Sale / Restructuring Costs + FAS 141 Impacts = Adjusted EBITDA Comments Refer to appendix for reconciliation of Adjusted EBITDA to Cash Flow from Operations; and reconciliation of Net Accrual Capex
Selected Reconciliations $(millions) 2nd Quarter YTD June LTM 2006 2007 2006 2007 2007 Gross Margin FAS 141 Impact Depreciation $ - $ 1.5 $ - $ 1.5 $ 1.5 Inventory Adjustment - 0.1 - 0.1 0.1 0.1 Fixed Asset Disposals - 0.1 - 0.1 0.1 Total Gross Margin FAS 141 Impact $ - $ 1.7 $ - $ 1.7 $ 1.7 SG&A per GAAP to Cash SG&A SG&A per GAAP $ 15.4 $ 19.5 $ 30.3 $ 35.3 $ 69.4 Option Expense 2003 Stock Option Program (0.4) (0.8) (0.8) (1.3) (2.0) 2007 Stock Option Program (1.2) (3.0) (2.3) (4.2) (7.4) Deprection & Amortization (1.2) (3.0) (2.3) (4.2) (7.4) Cash SG&A $ 13.8 $ 15.3 $ 27.2 $ 29.4 $ 59.6 Company Sale/Restructuring 2003 Stock Option Program Expense* $ - $ 6.7 $ - $ 6.7 $ 6.7 Accounting, Legal & Investment Banking Advisory Fees - 8.8 - 9.3 9.3 Severance/Relocation - 0.9 - 0.9 0.9 Bridge Commitment Fee - 3.5 - 3.5 3.5 Fees to BSMB - 6.5 - 6.5 6.5 Total Company Sale/Restructuring $ - $ 26.4 $ - $ 26.9 $ 26.9 Loss on Extingusiment of Debt $ - $ 23.4 $ 23.4 $ 23.4 * Expensing of remaining costs related to prior program at transaction close
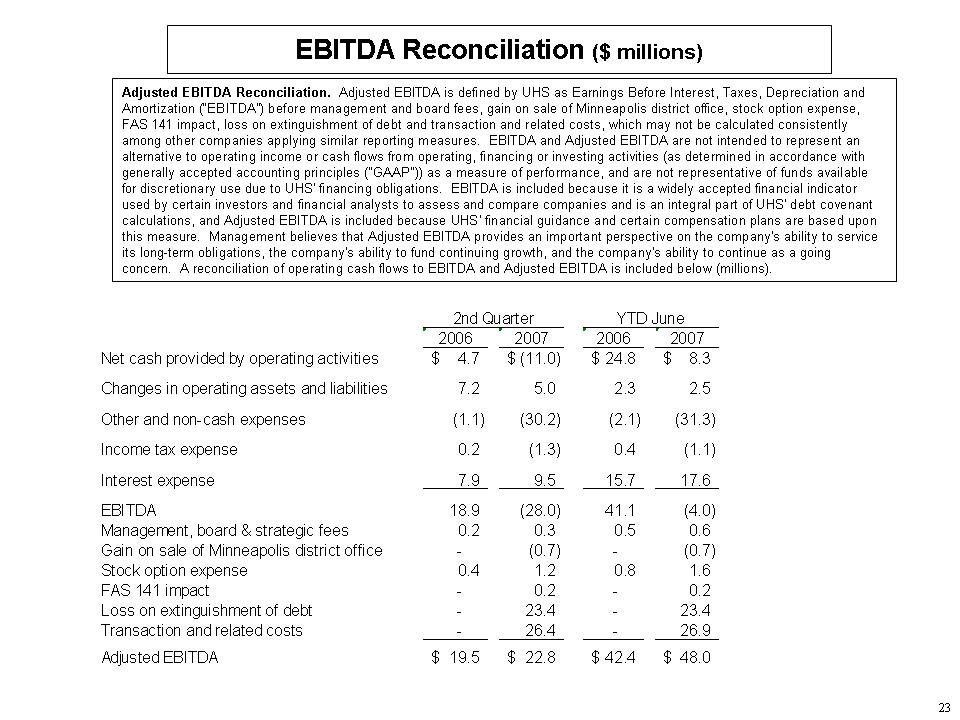
EBITDA Reconciliation ($ millions) Adjusted EBITDA Reconciliation. Adjusted EBITDA is defined by UHS as Earnings Before Interest, Taxes, Depreciation and Amortization (“EBITDA”) before management and board fees, gain on sale of Minneapolis district office, stock option expense, FAS 141 impact, loss on extinguishment of debt and transaction and related costs, which may not be calculated consistently among other companies applying similar reporting measures. EBITDA and Adjusted EBITDA are not intended to represent an alternative to operating income or cash flows from operating, financing or investing activities (as determined in accordance with generally accepted accounting principles ("GAAP")) as a measure of performance, and are not representative of funds available for discretionary use due to UHS' financing obligations. EBITDA is included because it is a widely accepted financial indicator used by certain investors and financial analysts to assess and compare companies and is an integral part of UHS' debt covenant calculations, and Adjusted EBITDA is included because UHS' financial guidance and certain compensation plans are based upon this measure. Management believes that Adjusted EBITDA provides an important perspective on the company's ability to service its long-term obligations, the company's ability to fund continuing growth, and the company's ability to continue as a going concern. A reconciliation of operating cash flows to EBITDA and Adjusted EBITDA is included below (millions). 2006 2007 2006 2007 Net cash provided by operating activities 4.7 $ (11.0) $ 24.8 $ 8.3 $ Changes in operating assets and liabilities 7.2 5.0 2.3 2.5 Other and non-cash expenses (1.1) (30.2) (2.1) (31.3) Income tax expense 0.2 (1.3) 0.4 (1.1) Interest expense 7.9 9.5 15.7 17.6 EBITDA 18.9 (28.0) 41.1 (4.0) Management, board & strategic fees 0.2 0.3 0.5 0.6 Gain on sale of Minneapolis district office - (0.7) - (0.7) Stock option expense 0.4 1.2 0.8 1.6 FAS 141 impact - 0.2 - 0.2 Loss on extinguishment of debt - 23.4 - 23.4 Transaction and related costs - 26.4 - 26.9 Adjusted EBITDA 19.5 $ 22.8 $ 42.4 $ 48.0/font>
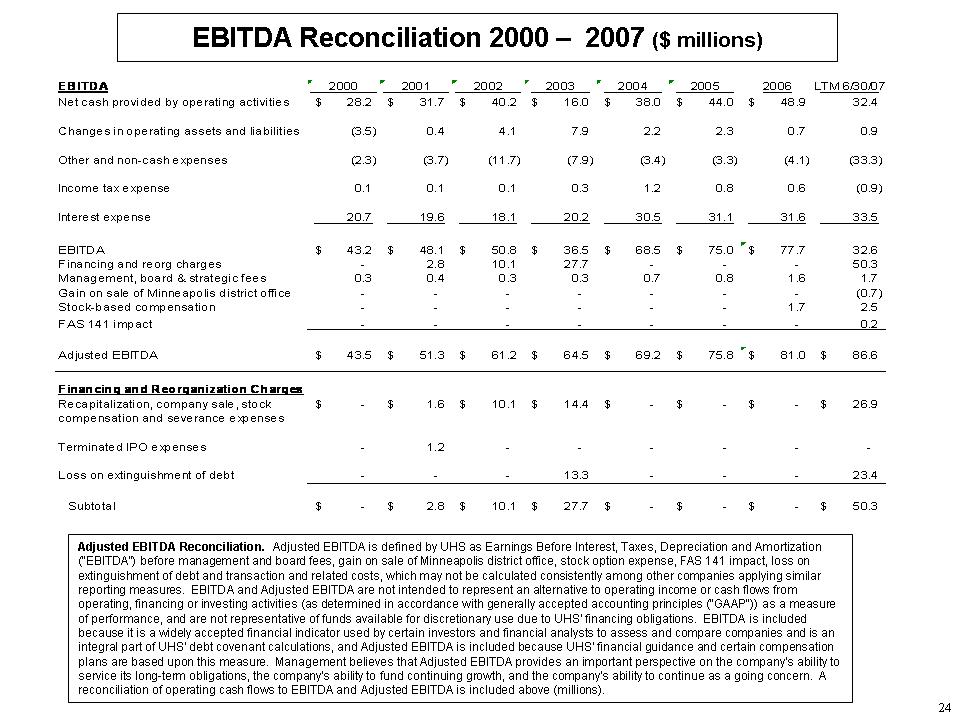
EBITDA Reconciliation 2000 – 2007 ($ millions) EBITDA 2000 2001 2002 2003 2004 2005 2006 LTM 6/30/07 Net cash provided by operating activities 28.2 $ 31.7 $ 40.2 $ 16.0 $ 38.0 $ 44.0 $ 48.9 $ 32.4 Changes in operating assets and liabilities (3.5) 0.4 4.1 7.9 2.2 2.3 0.7 0.9 Other and non-cash expenses (2.3) (3.7) (11.7) (7.9) (3.4) (3.3) (4.1) (33.3) Income tax expense 0.1 0.1 0.1 0.3 1.2 0.8 0.6 (0.9) Interest expense 20.7 19.6 18.1 20.2 30.5 31.1 31.6 33.5 EBITDA 43.2 $ 48.1 $ 50.8 $ 36.5 $ 68.5 $ 75.0 $ 77.7 $ 32.6 Financing and reorg charges - 2.8 10.1 27.7 - - - 50.3 Management, board & strategic fees 0.3 0.4 0.3 0.3 0.7 0.8 1.6 1.7 Gain on sale of Minneapolis district office - - - - - - - (0.7) Stock-based compensation - - - - - - 1.7 2.5 FAS 141 impact - - - - - - - 0.2 Adjusted EBITDA $ 43.5 $ 51.3 $ 61.2 $ 64.5 $ 69.2 $ 75.8 $ 81.0 $ 86.6 $ Financing and Reorganization Charges Recapitalization, company sale, stock - $ 1.6 $ 10.1 $ 14.4 $ - $ - $ - $ 26.9 $ compensation and severance expenses Terminated IPO expenses - 1.2 - - - - - -Loss on extinguishment of debt - - - 13.3 - - - 23.4 Subtotal - $ 2.8 $ 10.1 $ 27.7 $ - $ - $ - $ 50.3 $ Adjusted EBITDA Reconciliation. Adjusted EBITDA is defined by UHS as Earnings Before Interest, Taxes, Depreciation and Amortization (“EBITDA”) before management and board fees, gain on sale of Minneapolis district office, stock option expense, FAS 141 impact, loss on extinguishment of debt and transaction and related costs, which may not be calculated consistently among other companies applying similar reporting measures. EBITDA and Adjusted EBITDA are not intended to represent an alternative to operating income or cash flows from operating, financing or investing activities (as determined in accordance with generally accepted accounting principles ("GAAP")) as a measure of performance, and are not representative of funds available for discretionary use due to UHS' financing obligations. EBITDA is included because it is a widely accepted financial indicator used by certain investors and financial analysts to assess and compare companies and is an integral part of UHS' debt covenant calculations, and Adjusted EBITDA is included because UHS' financial guidance and certain compensation plans are based upon this measure. Management believes that Adjusted EBITDA provides an important perspective on the company's ability to service its long-term obligations, the company's ability to fund continuing growth, and the company's ability to continue as a going concern. A reconciliation of operating cash flows to EBITDA and Adjusted EBITDA is included above (millions). NEED TO UPDATE
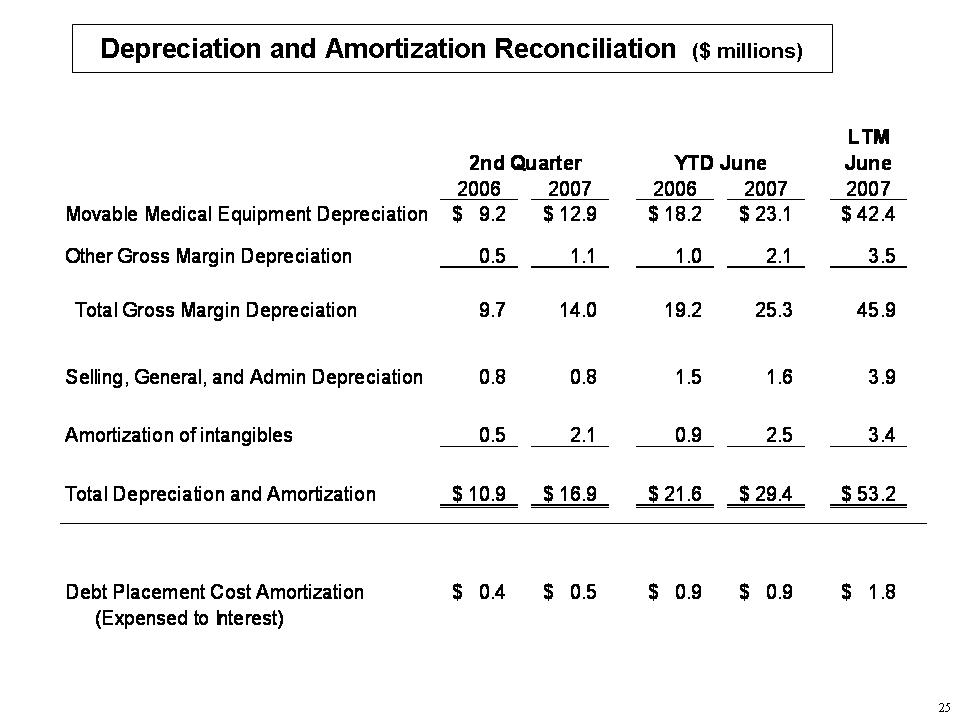
Depreciation and Amortization Reconciliation ($ millions) LTM June 2006 2007 2006 2007 2007 Movable Medical Equipment Depreciation 9.2 $ 12.9 $ 18.2 $ 23.1 $ 42.4 $ Other Gross Margin Depreciation 0.5 1.1 1.0 2.1 3.5 Total Gross Margin Depreciation 9.7 14.0 19.2 25.3 45.9 Selling, General, and Admin Depreciation 0.8 0.8 1.5 1.6 3.9 Amortization of intangibles 0.5 2.1 0.9 2.5 3.4 Total Depreciation and Amortization 10.9 $ 16.9 $ 21.6 $ 29.4 $ 53.2 $Debt Placement Cost Amortization 0.4 $ 0.5 $ 0.9 $ 0.9 $ 1.8 $ (Expensed to Interest) 2nd Quarter YTD June
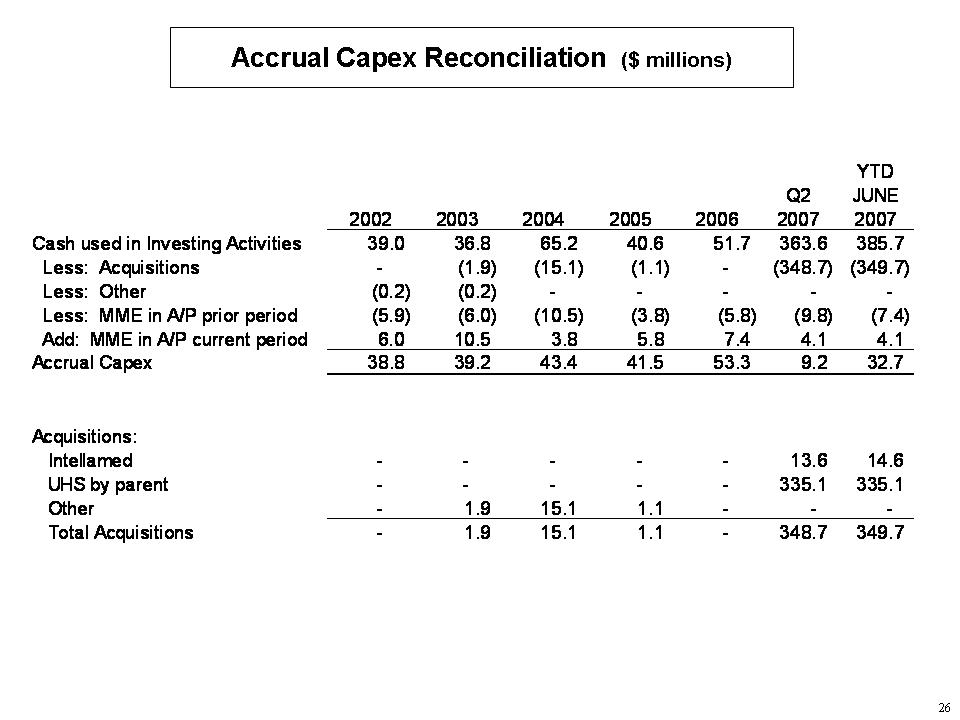
Accrual Capex Reconciliation ($ millions) 2002 2003 2004 2005 2006 Q2 2007 YTD JUNE 2007 Cash used in Investing Activities 39.0 36.8 65.2 40.6 51.7 363.6 385.7 Less: Acquisitions - (1.9) (15.1) (1.1) - (348.7) (349.7) Less: Other (0.2) (0.2) Less: MME in A/P prior period (5.9) (6.0) (10.5) (3.8) (5.8) (9.8) (7.4) Add: MME in A/P current period 6.0 10.5 3.8 5.8 7.4 4.1 4.1 Accrual Capex 38.8 39.2 43.4 41.5 53.3 9.2 32.7 Acquisitions: Intellamed - - - - - 13.6 14.6 UHS by parent - - - - - 335.1 335.1 Other - 1.9 15.1 1.1 - - - Total Acquisitions - 1.9 15.1 1.1 - 348.7 349.7