Exhibit 99.2
UHOS Q3 2007 Earnings Teleconference November 13, 2007
2 Forward Looking Statements Safe Harbor Statement under the Private Securities Litigation Reform Act of 1995: Universal Hospital Services, Inc. believes statements in this presentation looking forward in time involve risks and uncertainties. The following factors, among others, could adversely affect our business, operations and financial condition causing our actual results to differ materially from those expressed in any forward-looking statements: our history of net losses and substantial interest expense; our need for substantial cash to operate and expand our business as planned; our substantial outstanding debt and debt service obligations; restrictions imposed by the terms of our debt; a decrease in the number of patients our customers are serving; our ability to effect change in the manner in which healthcare providers traditionally procure medical equipment; the absence of long-term commitments with customers; our ability to renew contracts with group purchasing organizations and integrated delivery networks; changes in reimbursement rates and policies by third-party payors; the impact of health care reform initiatives; the impact of significant regulation of the health care industry and the need to comply with those regulations; difficulties or delays in our continued expansion into certain of our businesses/geographic markets and developments of new businesses/geographic markets; and additional credit risks in increasing business with home care providers and nursing homes, impacts of equipment product recalls or obsolescence; increases in vendor costs that cannot be passed through to our customers; and other Risk Factors as detailed in our quarterly report on Form 10-Q for the quarter ended September 30, 2007, our quarterly report on Form 10-Q for the quarter ended June 30, 2007, and our Annual Report on Form 10-K for the year ended December 31, 2006; each of which has been filed with the Securities and Exchange Commission. This presentation contains non-GAAP measures as defined by SEC rules. Reconciliations of these measures to the most directly comparable GAAP measures are contained in the appendix.
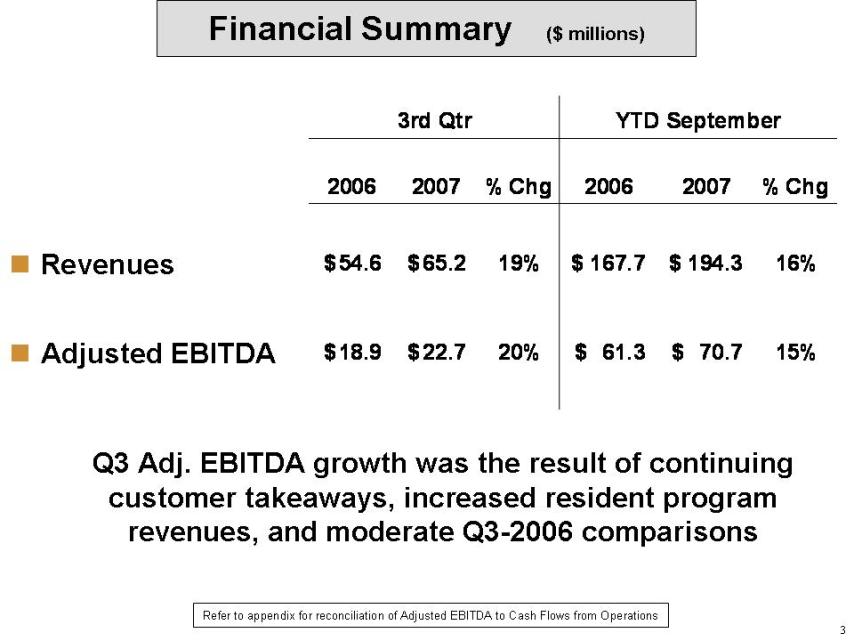
3 Financial Summary ($ millions)Revenues Adjusted EBITDA Refer to appendix for reconciliation of Adjusted EBITDA to Cash Flows from OperationsQ3 Adj. EBITDA growth was the result of continuing customer takeaways, increased resident program revenues, and moderate Q3-2006 comparisons 3rd Qtr YTD September 2006 2007 % Chg 2006 2007 % Chg 2006 % Chg $ 54.6 $ 65.2 19% $ 167.7 $ 194.3 16% $ 18.9 $ 22.7 20% $ 61.3 $ 70.7 15%
3rd Qtr YTD September 2006 2007 % Chg 2006 2007 % Chg 2006 % Chg $ 54.6 $ 65.2 19% $ 167.7 $ 194.3 16% $ 18.9 $ 22.7 20% $ 61.3 $ 70.7 15%
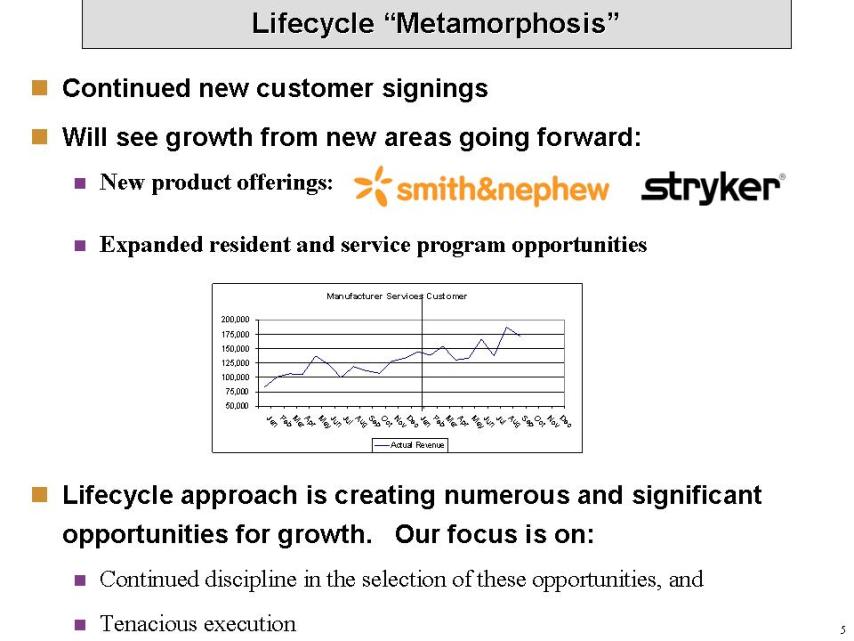
5 Continued new customer signings Will see growth from new areas going forward: New product offerings: Expanded resident and service program opportunities Lifecycle approach is creating numerous and significant opportunities for growth. Our focus is on: Continued discipline in the selection of these opportunities, and Tenacious executionLifecycle “Metamorphosis” stryker smith&nephew
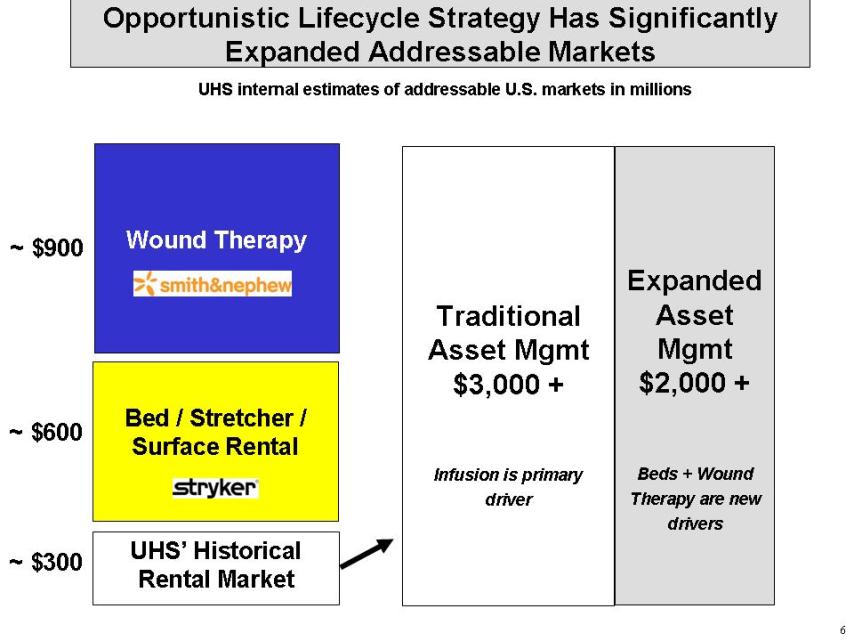
6 opportunistic Lifecycle Strategy Has Significantly Expanded Addressable MarketsUHS’ Historical Rental MarketWound Therapy Bed / Stretcher / Surface Rental~ $300 ~ $900 ~ $600 Traditional Asset Mgmt $3,000 +Infusion is primary driverUHS internal estimates of addressable U.S. markets in millionsExpanded Asset Mgmt $2,000 +Beds + Wound Therapy are new drivers
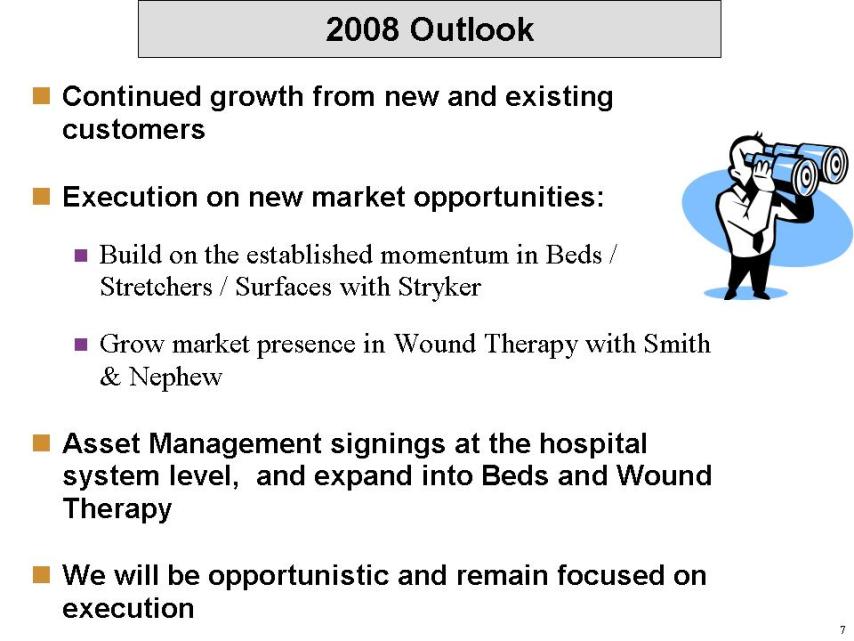
7 Body:Continued growth from new and existing customersExecution on new market opportunities:Build on the established momentum in Beds / Stretchers / Surfaces with StrykerGrow market presence in Wound Therapy with Smith & NephewAsset Management signings at the hospital system level, and expand into Beds and Wound TherapyWe will be opportunistic and remain focused on execution2008 Outlook


9 $ millions Medical Equipment Outsourcing Trend Analysis Revenues and Gross Margin increased due to the benefits of our significant customer wins and Asset Management signings in late 2006 and YTD 2007The YTD decline in the Gross Margin % Pre-FAS 141 is partially due to pricing reductions on the group purchasing organization contract signings in late 2006, and a $0.9 million non-cash write-off in Q2 of certain respiratory equipment in our fleet Rental of UHS-owned equipment Supplemental (short-term)Long-TermBariatrics: suite of specialty equipment for use with obese patientsRental of Manufacturer-owned equipmentAMPP Resident Programs (Asset Management Partnership Program)On-site management to drive better equipment utilization (UHS people, technology & processes) 3rd Quarter YTD September 2006 2007 % Chg 2006 2007 % Chg Revenues $ 42.4 $ 50.0 18% $ 131.1 $ 151.5 16% MME Depreciation 9.5 14.1 49% 27.7 37.3 35% Gross Margin per GAAP $ 18.1 $ 17.6 -3% $ 60.7 $ 62.4 3% Gross Margin % per GAAP 42.7% 35.1% 46.3% 41.1% FAS 141 Depreciation 3.6 5.1 Other FAS 141 Items 0.6 0.6 FAS 141 Impact 4.2 5.7

10$ millionsTechnical & Professional ServicesTrend Analysis:Increases in Revenue and Gross Margin driven by inclusion of the acquisition of the assets of the ICMS service division of Intellamed (“Intellamed Asset Acquisition”) on April 1, 2007Revenues and Gross Margin for our legacy business (excluding the Intellamed Asset Acquisition) were up mid-single digits in 2007 due to continued Sales Force attention on converting new Outsourcing customers; as well as the loss of selected Resident-based programsTechnical Services:Maintain & Repair Customer-owned Equipment: Non-resident, response-based / scheduled Biomedical Services Resident Biomedical ProgramsManufacturer ServicesProfessional Services:Technology baseline assessmentsVendor neutral Capital Planning ServicesProduct comparison research and reportsEquipment product of choice Equipment utilization studies 3rd Quarter YTD September 2006 2007 % Chg 2006 2007 % Chg Revenues $ 7.5 $ 11.1 48% $ 23.1 $ 29.5 28% Gross Margin $ 2.2 $ 2.9 32% $ 7.2 $ 8.7 21% Gross Margin % 29.7% 26.5% 31.1% 29.6% FAS 141 Impact Gross Margin Before FAS 141 $ 2.5 $ 3.1 24% $ 5.0 $ 5.8 16% Gross Margin % Before FAS 141 32.8% 27.5% 21.5% 19.6%
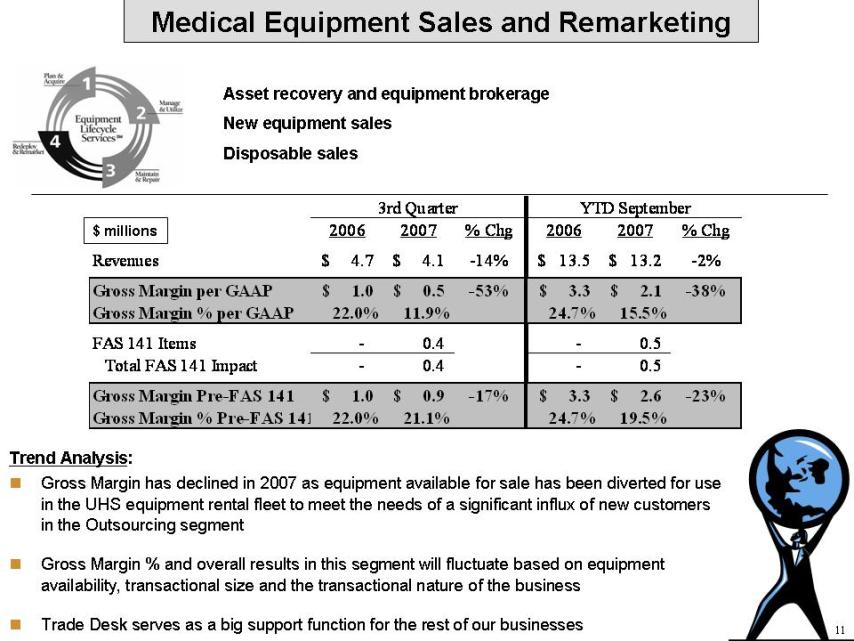
11 $ millions Medical Equipment Sales and Remarketing Asset recovery and equipment brokerage New equipment sales Disposable sales Trend Analysis: Gross Margin has declined in 2007 as equipment available for sale has been diverted for use in the UHS equipment rental fleet to meet the needs of a significant influx of new customers in the Outsourcing segment Gross Margin % and overall results in this segment will fluctuate based on equipment availability, transactional size and the transactional nature of the business Trade Desk serves as a big support function for the rest of our businesses 3rd Quarter YTD September 2006 2007 % Chg 2006 2007 % Chg Revenues $ 4.7 $ 4.1 -14% $ 13.5 $ 13.2 -2% Gross Margin per GAAP $ 1.0 $ 0.5 -53% $ 3.3 $ 2.1 -38% Gross Margin % per GAAP 22.0% 11.9% 24.7% 15.5% FAS 141 Items - 0.4 - 0.5 Total FAS 141 Impact - 0.4 - 0.5 Gross Margin Pre-FAS 141 $ 1.0 $ 0.9 -17% $ 3.3 $ 2.6 -23% Gross Margin % Pre-FAS 141 22.0% 21.1% 24.7% 19.5%
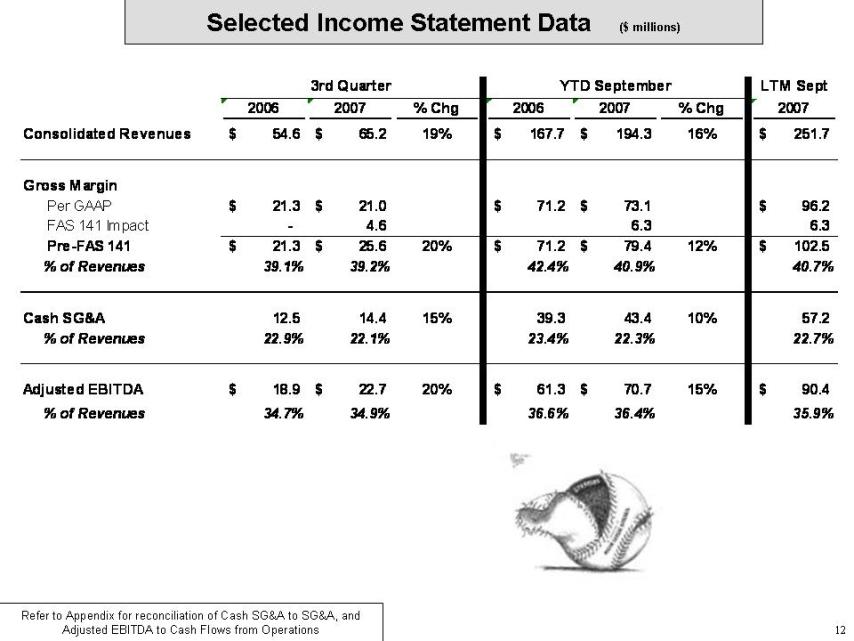
12 Selected Income Statement Data ($ millions) Refer to Appendix for reconciliation of Cash SG&A to SG&A, and Adjusted EBITDA to Cash Flows from Operations 3rd Quarter YTD September LTM Sept 2006 2007 % Chg 2006 2007 % Chg 2007 Consolidated Revenues $ 54.6 $ 65.2 19% $ 167.7 $ 194.3 16% $ 251.7 Gross Margin Per GAAP $ 21.3 $ 21.0 $ 71.2 $ 73.1 $ 96.2 FAS 141 Impact - 4.6 6.3 6.3 Pre-FAS 141 $ 21.3 $ 25.6 20% $ 71.2 $ 79.4 12% $ 102.5 % of Revenues 39.1% 39.2% 42.4% 40.9% 40.7% Cash SG&A 12.5 14.4 15% 39.3 43.4 10% 57.2 % of Revenues 22.9% 22.1% 23.4% 22.3% 22.7% Adjusted EBITDA $ 18.9 $ 22.7 20% $ 61.3 $ 70.7 15% $ 90.4 % of Revenues 34.7% 34.9% 36.6% 36.4% 35.9%

13 Leverage & Liquidity Overview – September 30, 2007 ($ millions) 9/30/07 Borrowing Base $135 Available Liquidity = $133 $2 (LOCs) Leverage Calculation 8.50% PIK Notes $ 230.0 Floating Rate Notes 230.0 10.125% Notes 9.9 Revolver Capitalized Leases 6.8 Net Debt at 9/30/07 $ 476.7 + Accrued Interest 13.9 Net Debt & Accrued Interest $ 490.6 2007E EBITDA Mid $90’s Leverage Low 5’s Swapped to all-in fixed rate of 9.07% through 6/1/2012 Semi-annual Note Interest Payment is Dec 3rd
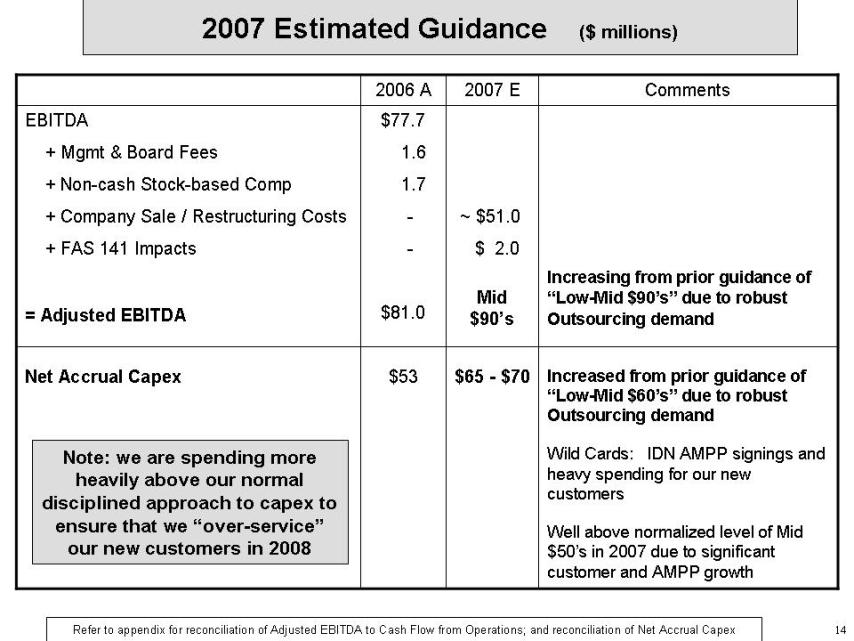
14 2007 Estimated Guidance ($ millions)Refer to appendix for reconciliation of Adjusted EBITDA to Cash Flow from Operations; and reconciliation of Net Accrual CapexNote: we are spending more heavily above our normal disciplined approach to capex to ensure that we “over-service” our new customers in 2008 2006 A 2007 E Comments EBITDA + Mgmt & Board Fees + Non-cash Stock-based Comp + Company Sale / Restructuring Costs + FAS 141 Impacts = Adjusted EBITDA $77.7 1.6 1.7 - - $81.0 ~ $51.0 $ 2.0 Mid $90’s Increasing from prior guidance of “Low-Mid $90’s” due to robust Outsourcing demand Net Accrual Capex $53 $65 - $70 Increased from prior guidance of “Low-Mid $60’s” due to robust Outsourcing demand Wild Cards: IDN AMPP signings and heavy spending for our new customers Well above normalized level of Mid $50’s in 2007 due to significant customer and AMPP growth
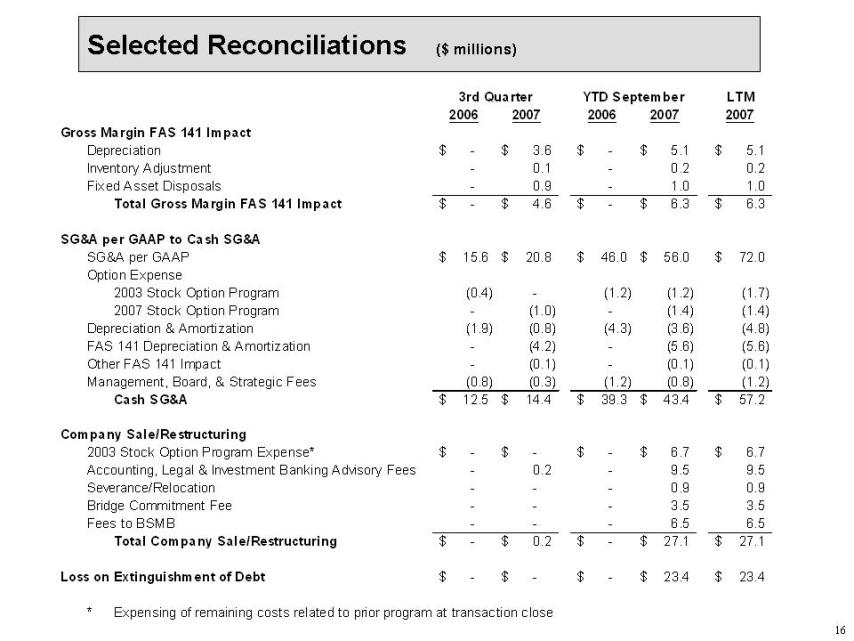
16 Selected Reconciliations ($ millions) 3rd Quarter YTD September LTM 2006 2007 2006 2007 2007 Gross Margin FAS 141 Impact Depreciation $ - $ 3.6 $ - $ 5.1 $ 5.1 Inventory Adjustment - 0.1 - 0.2 0.2 Fixed Asset Disposals - 0.9 - 1.0 1.0 Total Gross Margin FAS 141 Impact $ - $ 4.6 $ - $ 6.3 $ 6.3 SG&A per GAAP to Cash SG&A SG&A per GAAP $ 15.6 $ 20.8 $ 46.0 $ 56.0 $ 72.0 Option Expense 2003 Stock Option Program (0.4) - (1.2) (1.2) (1.7) 2007 Stock Option Program - (1.0) - (1.4) (1.4) Depreciation & Amortization (1.9) (0.8) (4.3) (3.6) (4.8) FAS 141 Depreciation & Amortization - (4.2) - (5.6) (5.6) Other FAS 141 Impact - (0.1) - (0.1) (0.1) Management, Board, & Strategic Fees (0.8) (0.3) (1.2) (0.8) (1.2) Cash SG&A $ 12.5 $ 14.4 $ 39.3 $ 43.4 $ 57.2 Company Sale/Restructuring 2003 Stock Option Program Expense* $ - $ - $ - $ 6.7 $ 6.7 Accounting, Legal & Investment Banking Advisory Fees - 0.2 - 9.5 9.5 Severance/Relocation - - - 0.9 0.9 Bridge Commitment Fee - - - 3.5 3.5 Fees to BSMB - - - 6.5 6.5 Total Company Sale/Restructuring $ - $ 0.2 $ - $ 27.1 $ 27.1 Loss on Extinguishment of Debt $ - $ - $ - $ 23.4 $ 23.4 * Expensing of remaining costs related to prior program at transaction close
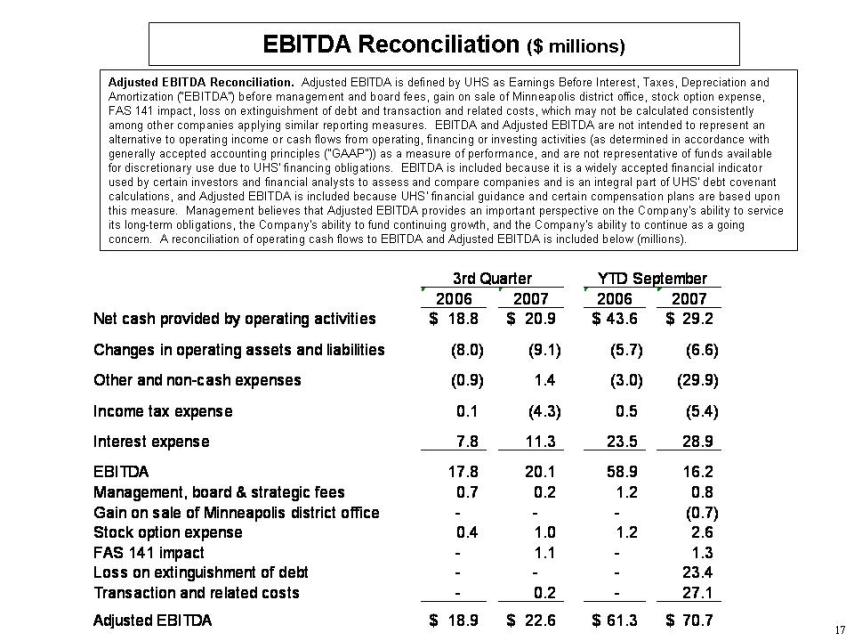
17 EBITDA Reconciliation ($ millions) Adjusted EBITDA Reconciliation. Adjusted EBITDA is defined by UHS as Earnings Before Interest, Taxes, Depreciation and Amortization (“EBITDA”) before management and board fees, gain on sale of Minneapolis district office, stock option expense, FAS 141 impact, loss on extinguishment of debt and transaction and related costs, which may not be calculated consistently among other companies applying similar reporting measures. EBITDA and Adjusted EBITDA are not intended to represent an alternative to operating income or cash flows from operating, financing or investing activities (as determined in accordance with generally accepted accounting principles ("GAAP")) as a measure of performance, and are not representative of funds available for discretionary use due to UHS' financing obligations. EBITDA is included because it is a widely accepted financial indicator used by certain investors and financial analysts to assess and compare companies and is an integral part of UHS' debt covenant calculations, and Adjusted EBITDA is included because UHS' financial guidance and certain compensation plans are based upon this measure. Management believes that Adjusted EBITDA provides an important perspective on the Company's ability to service its long-term obligations, the Company's ability to fund continuing growth, and the Company's ability to continue as a going concern. A reconciliation of operating cash flows to EBITDA and Adjusted EBITDA is included below (millions). 3rd Quarter YTD September 2006 2007 2006 2007 Net cash provided by operating activities $ 18.8 $ 20.9 $ 43.6 $ 29.2 Changes in operating assets and liabilities (8.0) (9.1) (5.7) (6.6) Other and non-cash expenses (0.9) 1.4 (3.0) (29.9) Income tax expense 0.1 (4.3) 0.5 (5.4) Interest expense 7.8 11.3 23.5 28.9 EBITDA 17.8 20.1 58.9 16.2 Management, board & strategic fees 0.7 0.2 1.2 0.8 Gain on sale of Minneapolis district office - - - (0.7) Stock option expense 0.4 1.0 1.2 2.6 FAS 141 impact - 1.1 - 1.3 Loss on extinguishment of debt - - - 23.4 Transaction and related costs - 0.2 - 27.1 Adjusted EBITDA $ 18.9 $ 22.6 $ 61.3 $ 70.7
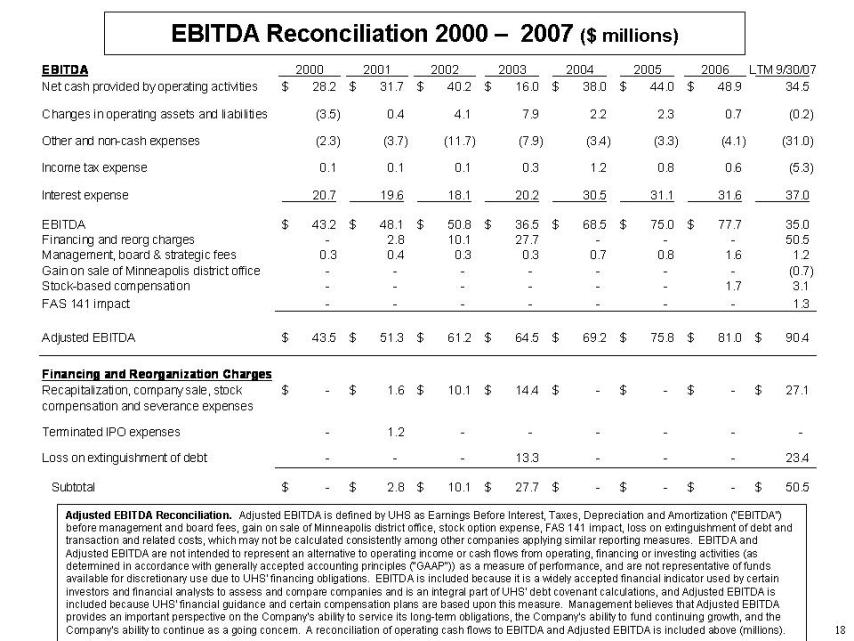
18 EBITDA Reconciliation 2000 – 2007 ($ millions) Adjusted EBITDA Reconciliation. Adjusted EBITDA is defined by UHS as Earnings Before Interest, Taxes, Depreciation and Amortization (“EBITDA”) before management and board fees, gain on sale of Minneapolis district office, stock option expense, FAS 141 impact, loss on extinguishment of debt and transaction and related costs, which may not be calculated consistently among other companies applying similar reporting measures. EBITDA and Adjusted EBITDA are not intended to represent an alternative to operating income or cash flows from operating, financing or investing activities (as determined in accordance with generally accepted accounting principles ("GAAP")) as a measure of performance, and are not representative of funds available for discretionary use due to UHS' financing obligations. EBITDA is included because it is a widely accepted financial indicator used by certain investors and financial analysts to assess and compare companies and is an integral part of UHS' debt covenant calculations, and Adjusted EBITDA is included because UHS' financial guidance and certain compensation plans are based upon this measure. Management believes that Adjusted EBITDA provides an important perspective on the Company's ability to service its long-term obligations, the Company's ability to fund continuing growth, and the Company's ability to continue as a going concern. A reconciliation of operating cash flows to EBITDA and Adjusted EBITDA is included above (millions). EBITDA 2000 2001 2002 2003 2004 2005 2006 LTM 9/30/07 Net cash provided by operating activities $ 28.2 $ 31.7 $ 40.2 $ 16.0 $ 38.0 $ 44.0 $ 48.9 34.5 Changes in operating assets and liabilities (3.5) 0.4 4.1 7.9 2.2 2.3 0.7 (0.2) Other and non-cash expenses (2.3) (3.7) (11.7) (7.9) (3.4) (3.3) (4.1) (31.0) Income tax expense 0.1 0.1 0.1 0.3 1.2 0.8 0.6 (5.3) Interest expense 20.7 19.6 18.1 20.2 30.5 31.1 31.6 37.0 EBITDA $ 43.2 $ 48.1 $ 50.8 $ 36.5 $ 68.5 $ 75.0 $ 77.7 35.0 Financing and reorg charges - 2.8 10.1 27.7 - - - 50.5 Management, board & strategic fees 0.3 0.4 0.3 0.3 0.7 0.8 1.6 1.2 Gain on sale of Minneapolis district office - - - - - - - (0.7) Stock-based compensation - - - - - - 1.7 3.1 FAS 141 impact - - - - - - - 1.3 Adjusted EBITDA $ 43.5 $ 51.3 $ 61.2 $ 64.5 $ 69.2 $ 75.8 $ 81.0 $ 90.4 Financing and Reorganization Charges Recapitalization, company sale, stock $ - $ 1.6 $ 10.1 $ 14.4 $ - $ - $ - $ 27.1 compensation and severance expenses Terminated IPO expenses - 1.2 - - - - - - Loss on extinguishment of debt - - - 13.3 - - - 23.4 Subtotal $ - $ 2.8 $ 10.1 $ 27.7 $ - $ - $ - $ 50.5 Total Revenues $ 106.0 $ 125.6 $ 153.8 $ 171.0 $ 199.6 $ 215.9 $ 225.1 250.4 (a) Includes $1.6 million full year impact related to lease capitalization of our truck and large van fleet 1st Half 2nd Half 4th Qtr 1st Half 3rd Qtr 3rd Qtr 2003 2003 2003 2004 2004 2004 Net cash provided by operating activities 20.7 (4.7) (13.2) 18.5 18.0 18.5 Changes in operating assets and liabilities 4.3 3.2 0.4 1.7 (8.6) 1.7 Other non-cash expenses (0.9) (6.5) (5.9) (0.3) (0.1) (0.3) Current income taxes 0.1 0.1 0.1 0.3 (0.1) 0.3 Interest expense 8.7 11.6 7.2 14.9 7.6 14.9 EBITDA 32.9 3.7 (11.4) 35.2 16.7 35.2 (15.1)
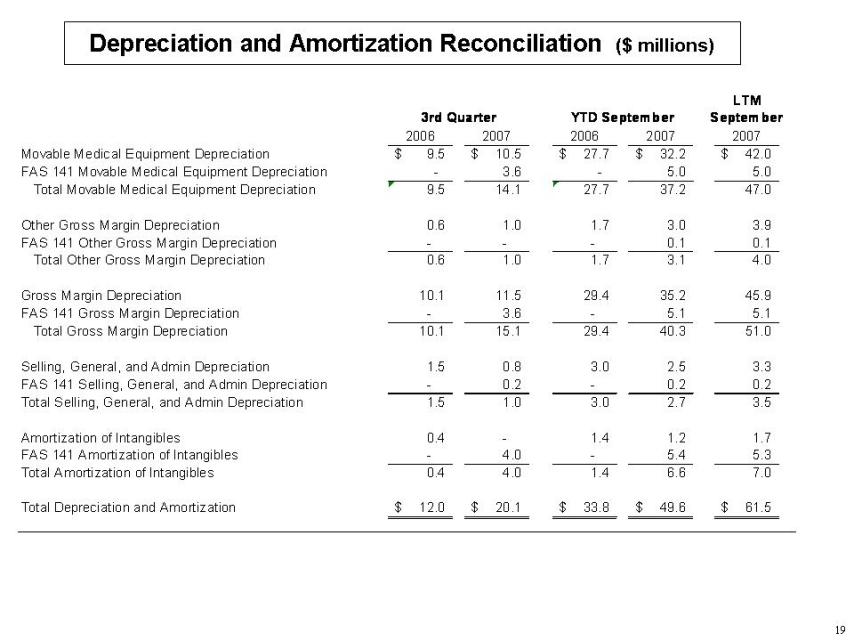
19 Depreciation and Amortization Reconciliation ($ millions) LTM 3rd Quarter YTD September September 2006 2007 2006 2007 2007 Movable Medical Equipment Depreciation $ 9.5 $ 10.5 $ 27.7 $ 32.2 $ 42.0 FAS 141 Movable Medical Equipment Depreciation - 3.6 - 5.0 5.0 Total Movable Medical Equipment Depreciation 9.5 14.1 27.7 37.2 47.0 Other Gross Margin Depreciation 0.6 1.0 1.7 3.0 3.9 FAS 141 Other Gross Margin Depreciation - - - 0.1 0.1 Total Other Gross Margin Depreciation 0.6 1.0 1.7 3.1 4.0 Gross Margin Depreciation 10.1 11.5 29.4 35.2 45.9 FAS 141 Gross Margin Depreciation - 3.6 - 5.1 5.1 Total Gross Margin Depreciation 10.1 15.1 29.4 40.3 51.0 Selling, General, and Admin Depreciation 1.5 0.8 3.0 2.5 3.3 FAS 141 Selling, General, and Admin Depreciation - 0.2 - 0.2 0.2 Total Selling, General, and Admin Depreciation 1.5 1.0 3.0 2.7 3.5 Amortization of Intangibles 0.4 - 1.4 1.2 1.7 FAS 141 Amortization of Intangibles - 4.0 - 5.4 5.3 Total Amortization of Intangibles 0.4 4.0 1.4 6.6 7.0 Total Depreciation and Amortization $ 12.0 $ 20.1 $ 33.8 $ 49.6 $ 61.5
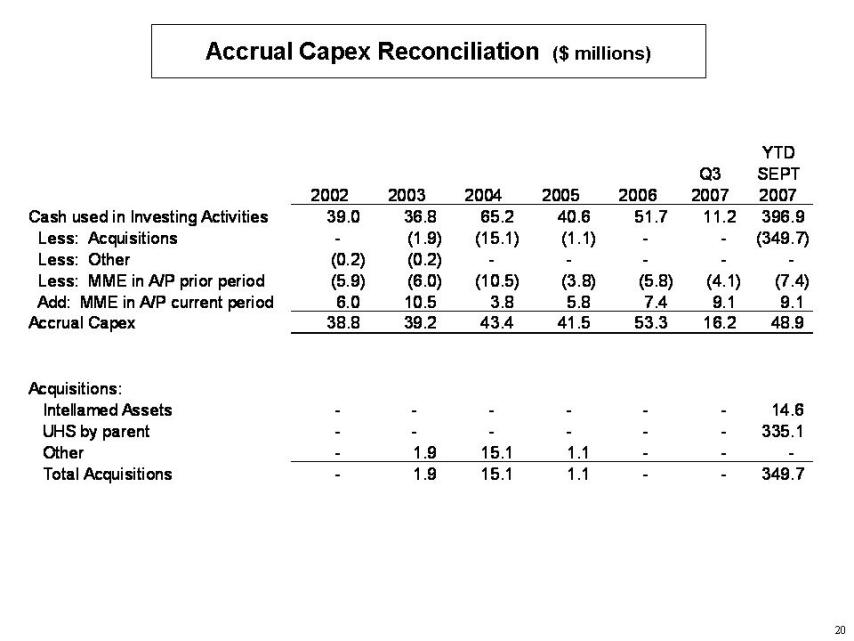
20 Accrual Capex Reconciliation ($ millions) 2002 2003 2004 2005 Cash used in Investing Activities Less: Other (200) (204) - - Less: MME in A/P prior year Add: MME in A/P current year 5,999 3,808 5,778 Accrual Capex Acquisitions - 1,875 1,115 2002 2003 2004 2005 2006 Q3 2007 YTD SEPT 2007 Cash used in Investing Activities 39.0 36.8 65.2 40.6 51.7 11.2 396.9 Less: Acquisitions - (1.9) (15.1) (1.1) - - (349.7) Less: Other (0.2) (0.2) - - - - - Less: MME in A/P prior period (5.9) (6.0) (10.5) (3.8) (5.8) (4.1) (7.4) Add: MME in A/P current period 6.0 10.5 3.8 5.8 7.4 9.1 9.1 Accrual Capex 38.8 39.2 43.4 41.5 53.3 16.2 48.9 Acquisitions: Intellamed Assets - - - - - - 14.6 UHS by parent - - - - - - 335.1 Other - 1.9 15.1 1.1 - - - Total Acquisitions - 1.9 15.1 1.1 - - 349.7