UNITED STATES
SECURITIES AND EXCHANGE COMMISSION
Washington, D. C. 20549
FORM 10-K
(Mark One)
| x | Annual Report pursuant to Section 13 or 15(d) of the Securities Exchange Act of 1934 |
For the fiscal year ended December 31, 2005,
or
| ¨ | Transition report pursuant to Section 13 or 15(d) of the Securities Exchange Act of 1934 |
For the transition period from to .
Commission File Number: 000-20086
UNIVERSAL HOSPITAL SERVICES, INC.
(Exact name of registrant as specified in its charter)
| | |
| Delaware | | 41-0760940 |
(State or other jurisdiction of incorporation or organization) | | (I.R.S. Employer Identification No.) |
7700 France Avenue South, Suite 275
Edina, Minnesota 55435-5228
(Address of principal executive offices, including zip code)
(952) 893-3200
(Registrant’s telephone number, including area code)
Securities registered pursuant to Section 12(b) of the Act: None
Securities registered pursuant to Section 12(g) of the Act: None
Indicate by check mark if the registrant is a well-known seasoned issuer, as defined in Rule 405 of the Securities Act. Yes ¨ No x
Indicate by check mark if the registrant is not required to file reports pursuant to Section 13 or Section 15(d) of the Act. Yes x No ¨
Indicate by check mark whether the registrant (1) has filed all reports required to be filed by Section 13 or 15(d) of the Securities Exchange Act of 1934 during the preceding 12 months (or for such shorter period that the registrant was required to file such reports), and (2) has been subject to such filing requirements for the past 90 days. Yes ¨ No x
Indicate by check mark if disclosure of delinquent filers pursuant to Item 405 of Regulation S-K is not contained herein, and will not be contained, to the best of registrant’s knowledge, in definitive proxy or information statements incorporated by reference in Part III of this Form 10-K or any amendment to this Form 10-K. x
Indicate by check mark whether the Registrant is a large accelerated filer, an accelerated filer, or a non-accelerated filer. See definition of “accelerated filer and large accelerated filer” in Rule 12b-2 of the Exchange Act. (Check one):
Larger accelerated filer ¨ Accelerated filer ¨ Non-accelerated filer x
Indicate by check mark whether the registrant is a shell company (as defined in Rule 12b-2 of the Act). Yes ¨ No x
The number of shares of common stock, $.01 par value, outstanding as of March 26, 2006, was 123,447,269.21.
DOCUMENTS INCORPORATED BY REFERENCE
None.
FORM 10-K TABLE OF CONTENTS
2
PART I
ITEM 1: Business
OUR COMPANY
Universal Hospital Services, Inc. (“we”, “our” or “UHS”) is a leading, nationwide provider of medical equipment outsourcing and services to the health care industry. Our customers include national, regional and local acute care hospitals, alternate site providers (such as nursing homes and home care providers) and medical equipment manufacturers. Our diverse customer base includes more than 3,200 acute care hospitals and approximately 3,100 alternate site providers. We also have extensive and long-standing relationships with over 200 major medical equipment manufacturers and many of the nation’s largest group purchasing organizations (“GPOs”) and integrated delivery networks (“IDNs”). All of our services leverage our nationwide network of 75 offices and more than 65 years of experience managing and servicing all aspects of movable medical equipment. The fees for these services are paid directly by our customers and not through reimbursement from governmental or other third-party payors. We commenced operations in 1939, originally incorporated in Minnesota in 1954 and reincorporated in Delaware in 2001.
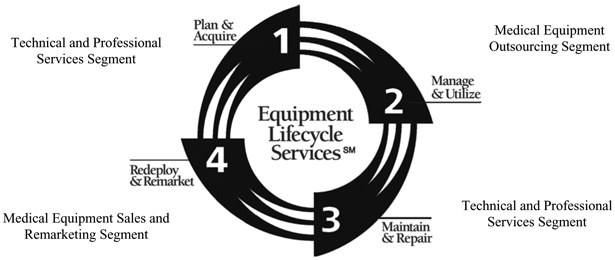
As a leading medical equipment lifecycle services company, we design and offer comprehensive solutions for our customers that increase equipment and staff productivity and support optimal patient care.
Effective January 1, 2004, we began reporting our financial results in three segments to reflect how we manage our business. Our operating segments consist of Medical Equipment Outsourcing, Technical and Professional Services, and Medical Equipment Sales and Remarketing. We evaluate the performance of our operating segments based on gross margin. The accounting policies of the individual operating segments are the same as those of the entire company. Our revenue, profits, and assets for our operating segments for the prior three years are described in “Item 6 – Selected Financial Data.”
3
Medical Equipment Outsourcing Segment- Manage & Utilize
Our flagship business is our Medical Equipment Outsourcing segment, which accounted for $167.7 million, or approximately 77.7%, of our revenues for the year ended December 31, 2005. This segment represented 78.4% and 82.0% of total revenue for the years ended December 31, 2004, and 2003, respectively. We own approximately 161,000 pieces of movable medical equipment, primarily in the categories of respiratory therapy, newborn care, critical care, patient monitors, and bariatric and pressure area management.
We currently provide outsourcing services to more than 3,200 acute care hospitals in the United States, including some of the nation’s premier healthcare institutions. Our re-entry into the bariatric market during the second quarter of 2004 has given us new opportunities with many of our existing customers.
We have contracts in place with many of the leading national GPOs for both the acute care and alternate site markets. We also have agreements directly with national acute care and alternate site providers. We expect much of our future growth in this segment to be driven by our customers outsourcing more of their movable medical equipment needs and taking full advantage of our expanded offering of long-term outsourcing agreements and Asset Management Partnership Programs (“AMPPs”).
In our outsourcing programs we provide our customers with the use of movable medical equipment that we maintain for our customers by performing preventative maintenance, repairs, cleaning and testing, and maintaining certain reporting records. We also provide prompt replacement of any non-working equipment and the flexibility to upgrade equipment as technology changes. We have three primary outsourcing programs:
| | • | | Supplemental and Peak Needs Usage.Our basic outsourcing program is renting patient-ready, movable medical equipment to our customers on a supplemental or peak needs basis. Many of our customers have traditionally owned only the amounts and types of such equipment necessary to service their usual and customary bed census and their typical range of treatment offerings. Our customer rely on us to fulfill many of their equipment needs when they experience a peak in census, do not have the resources to maintain their owned equipment in patient-ready condition, or require equipment for less common treatments. The equipment can be obtained on a daily, monthly or pay-per-use basis. Supplemental and peak needs activity is impacted by changes in hospital patient census and patient acuity which typically fluctuate on a seasonal basis; |
| | • | | Long-Term Outsourcing Agreements.We also offer our customers the opportunity to obtain movable medical equipment through long-term outsourcing agreements. By executing a long-term outsourcing agreement, our customers are able to secure the availability of an identified pool of patient-ready equipment and to pay for it over a number of months, years or on a pay-per-use basis; and |
4
Asset Management Partnership Programs.Our AMPP program allows our customers to outsource the responsibilities and costs of effectively managing movable medical equipment, with the added benefit of enhancing equipment utilization. With UHS asset management, equipment types and quantities are adjusted to meet changes in patient census and acuity. Our employees work at the customers’ sites to integrate our equipment management process and technology tools into the customers’ day-to-day operations. We assume full responsibility for delivering equipment where and when it is needed, removing equipment that is no longer in use and cleaning equipment between every patient use. We also perform required training and “in service” sessions to keep our customers’ staffs fully-trained and knowledgeable about the use and operation of key equipment. Our AMPP programs include management of our equipment at the customer’s facility and/or management of customer-owned equipment. As of December 31, 2005, we had 47 AMPP programs.
Our medical equipment programs enable health care providers to replace the fixed costs of owning and/or leasing medical equipment with variable costs that are more closely related to their revenues and current equipment needs. The increased flexibility and services provided to our customers allows them to:
| | • | | access our extensive data and expertise on the cost, performance, features and functions of all major items of medical equipment; |
| | • | | increase productivity of available equipment; |
| | • | | reduce maintenance and management costs through the use of our technology and knowledgeable outsourcing staff; |
| | • | | increase the productivity and satisfaction of their nursing staff by allowing them to focus on primary patient care responsibilities, leading to lower attrition rates; |
| | • | | reduce equipment obsolescence risk; and |
| | • | | facilitate compliance with regulatory and record keeping requirements and manufacturers’ specifications on tracking and maintenance of medical equipment. |
Technical and Professional Services Segment – Plan & Acquire; Maintain & Repair
Our Technical and Professional Services segment accounted for $29.7 million, or approximately 13.7%, of our revenues for the year ended December 31, 2005. This segment represented 12.8% and 8.6% of total revenue for the years ended December 31, 2004, and 2003, respectively. We leverage our 65 plus years of experience and our extensive equipment database in repairing and maintaining medical equipment. We offer a broad range of inspection, preventative maintenance, repair, logistic and consulting services through our team of over 200 technicians and professionals located in our nationwide network of offices.
Our Technical and Professional Services segment offerings are less capital intensive than our Medical Equipment Outsourcing segment and provide a complementary alternative for customers that wish to own their medical equipment but lack the expertise, funding or scale to perform maintenance, repair and analytical functions.
5
Our technicians are trained and certified on an ongoing basis directly by equipment manufacturers to enable them to be skilled in servicing a wide spectrum of medical equipment. They are required to maintain current certifications, to be cross-trained across equipment lines and to refresh their training on a regular basis. We also operate a quality assurance department to develop and document our own quality standards for our equipment. All equipment maintenance, inspection and repair services are performed to our specifications. We utilize proprietary record keeping software to record these services which meets the applicable standards of the Joint Commission on Accreditation of Healthcare Organizations (“JCAHO”), the National Fire Protection Association (“NFPA”) and the Food and Drug Administration (“FDA”). These maintenance records are available to our customers and to regulatory agencies to verify the maintenance of our equipment throughout its useful life.
Programs
| | • | | Supplemental Maintenance and Repair Services.We provide maintenance and repair services that supplement the customer’s current maintenance management practices on a scheduled and unscheduled basis. As part of these services, we provide service documentation that supports the customer’s regulatory reporting requirements. These maintenance and repair services include fee-for-service arrangements, scheduled maintenance and inspection services, full service maintenance, inspection and repair services and vendor management services in which we manage the manufacturer and/or third part vendors for service delivery, typically on laboratory and radiology equipment. |
| | • | | Resident Programs. We also provide full and part-time resident-based equipment maintenance programs that provide all the benefits of our supplemental maintenance and repair programs but with the addition of onsite UHS employees, coordinated management of subcontractors, and a broad range of equipment management consulting services. We market these programs under the TEAM (“Technical Equipment Asset Management”) and CHAMP® (“Community Hospital Asset Management Program”) names. Through these programs, UHS coordinates the service and maintenance needs of an entire facility for all clinical equipment. |
As of December 31, 2005, we had 84 TEAM and CHAMP® resident programs within this segment.
| | • | | Consulting Services. We provide equipment consulting services as part of our other equipment management programs or as stand alone services. Some examples of our consulting services include technology baseline assessments, product comparison research and equipment utilization studies. |
6
Customers
| | • | | Manufacturers.We provide our services to medical equipment manufacturers that do not have the nationwide support or infrastructure to service their products. Our offerings include logistics and loaner management programs, depot or on-site warranty repair, non-warranty repair, product recall, field upgrades, maintenance or repairs, and onsite installation and in-service education. |
| | • | | Large Hospitals.We provide our services to large hospitals on a supplemental and fully outsourced basis. Our services are requested by in-house hospital biomedical departments on a supplemental basis because of our wealth of experience and expertise with movable medical equipment and to alleviate the increasing workload demands on in-house departments. |
| | • | | Small Hospitals and Critical Access Hospitals.We offer full lifecycle asset management services, including professional and technical services, to small hospitals (those with fewer than 150 beds) and Critical Access Hospitals. Critical Access Hospitals are rural community hospitals that receive cost-based Medicare reimbursement. These customers typically lack the resources to evaluate, acquire, manage, maintain, repair and dispose of medical equipment or technology and draw upon our vast experience in these areas to assist them. Our premier service to these customers is our CHAMP® program. |
| | • | | Alternate Site Providers.We offer our technical and repair services to alternate site providers, such as nursing homes and home care providers. Our nationwide service and repair network allows equipment to be repaired on site, or picked up and repaired in one of our offices. |
While our contracts with GPOs once were solely to provide medical equipment outsourcing services, we have expanded some of our agreements with these organizations to include Technical and Professional Services.
Medical Equipment Sales and Remarketing Segment- Redeploy & Remarket
Our Medical Equipment Sales and Remarketing segment accounted for $18.6 million, or approximately 8.6%, of our revenues for the year ended December 31, 2005. This segment represented 8.8% and 9.4% of total revenue for the years ended December 31, 2004, and 2003, respectively. This segment includes three distinct business activities:
| | • | | Medical Equipment Remarketing and Disposal.We are one of the nation’s largest buyers and sellers of pre-owned movable medical equipment. We also buy, source, remarket and dispose of pre-owned medical equipment for our customers through our Asset Recovery Program. This program provides our customers the ability to sell their unneeded assets for immediate cash or credit. We provide fair market value assessments and buy-out proposals on equipment |
7
the customer intends to traded-in for equipment upgrades so that the customer can evaluate the manufacturer’s offer. Customers can also take advantage of our disposal services, which remove equipment that has no remaining economic value in a safe and environmentally appropriate manner. We educate hospitals on the optimal opportunity to evaluate upgrades based on the changes in technology and market conditions for their current equipment. We also remarket used medical equipment to secondary market buyers.
UHS remarkets used medical equipment to hospitals, alternate care providers, veterinarians and equipment brokers. This segment of our business focuses on providing solutions to customers that have capital budget dollars available. We offer a wide range of equipment from our standard movable medical equipment to diagnostic, ultrasound and x-ray equipment. Total used and fleet equipment sales increased 29.4% over 2004 and we continue to view this as a growth opportunity.
| | • | | Specialty Medical Equipment Sales and Distribution.We use our national infrastructure to provide sales and distribution for manufacturers of specialty medical equipment. Our distribution services include providing demo services and product maintenance services. We act as distributors only for a limited number of products that are particularly suited to our national distribution network, or for those products that fit with our ability to provide technical support. We currently sell equipment in many product lines including, but not limited to, percussion vests, continuous passive motion machines, patient monitors, patient transfer systems and infant security systems. |
| | • | | Disposables Sales.We offer our customers single use disposable items. Most of these items are used in connection with our outsourced equipment. Although we do not view this as a core growth business, we offer these products as a convenience to customers and to complement our full medical equipment lifecycle offerings. |
BUSINESS OPERATIONS
District Offices
We currently operate 75 district offices throughout the United States, which allows us to service customers in all 50 states. Each district office maintains an inventory of equipment and other items tailored to accommodate the needs of individual customers within its geographical area. Should additional or unusual equipment be required by one of our customers, a district office can draw upon the resources of all of our other districts, with access to approximately 161,000 owned pieces of equipment, and is often able to obtain the necessary equipment within 24 hours.
Our district offices are staffed by multi-disciplined teams of sales professionals, service representatives, customer account representatives and biomedical equipment technicians trained to provide the spectrum of services we offer our customers.
8
In late 2005 we combined the former Customer Service and Technical Services organizations into one Operations organization. This move was made to leverage operating efficiencies and further enhance customer service. Most district offices are now staffed with dedicated technicians that perform technical services on UHS-owned and customer-owned equipment. The combination also enables us to offer warranty, non-warranty, upgrades and other services to our healthcare and equipment manufacturer customers.
Centers of Excellence
Our district office network is supported by six strategically located Centers of Excellence that focus on providing more specialized depot technical services on a regional and national basis. Centers of Excellence also provide overflow support and specialized depot service functions for our district offices and customized depot service operations for our manufacturer customers.
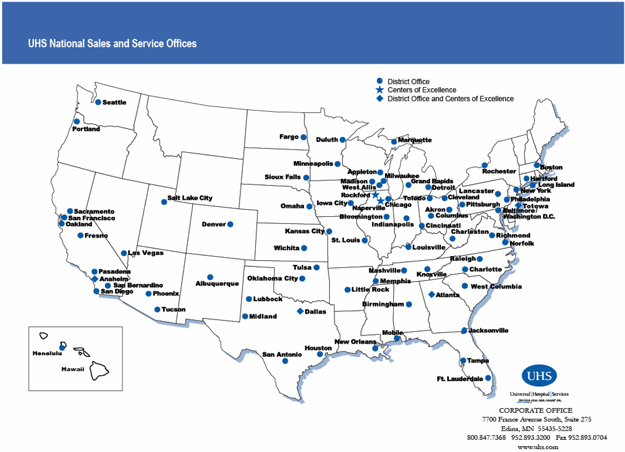
Centralized Functions
Our corporate office is located in Edina, Minnesota. We have centralized many of the key elements of our equipment and service offerings in order to maximize our operating
9
efficiencies and uniformity of service. Some of the critical aspects of our business that we have centralized include contract administration, purchasing, pricing, logistics, and information technology.
Rental Equipment Fleet
We acquire medical equipment to meet our customers’ needs in five primary product areas: respiratory therapy, newborn care, critical care, patient monitors and bariatric and pressure area management. We maintain one of the most technologically advanced equipment fleets in the industry, routinely acquiring new and pre-owned equipment to enhance our fleet. Our specialized equipment portfolio managers evaluate new products each year to keep abreast of current market technology and to determine whether to add new products to our equipment fleet. In making equipment purchases, we consider a variety of factors, including manufacturer credibility, repair and maintenance costs, anticipated user demand, equipment mobility, and anticipated obsolescence. As of December 31, 2005, we owned approximately 161,000 pieces of equipment available for use by our customers.
During 2005, approximately 90% of our movable medical equipment purchases were from over 150 manufacturers and 10% from the used equipment market. Our ten largest manufacturers of movable medical equipment supplied approximately 56% (measured in dollars spent) of our direct movable medical equipment purchases. In 2005, our largest movable medical equipment supplier was Cardinal Health, Inc., which accounted for over 20% of our movable medical equipment purchases.
We seek to ensure availability of equipment at favorable prices. Although we do not generally enter into long-term fixed price contracts with suppliers of our equipment, we may receive price discounts related to the volume of our purchases. The purchase price we pay for equipment generally ranges from $1,000 to $45,000 per item.
OUR STRENGTHS
We believe our business model presents an attractive value proposition to our customers and has resulted in significant growth in recent years. We service customers across the spectrum of the equipment life cycle as a result of our position as one of the industry’s largest purchasers, outsourcers and resellers of movable medical equipment.
We attribute our historical success to, and believe that our potential for future growth comes from, the following strengths:
Unique position in the health care arena. We believe that we are the only national company providing full movable medical equipment lifecycle services to the health care industry. While we have competitors that may offer various stages of the lifecycle, none provide the comprehensive approach to customers that we do. Our extensive and long-standing relationships with more than 3,200 hospitals, approximately 3,100 alternate site providers, over 200 medical equipment manufacturers and the nation’s most prominent GPOs and IDNs present a considerable competitive advantage over our smaller regional competitors.
10
We are uniquely positioned in the health care industry as a result of our:
| | • | | investment in the industry’s largest, most extensive and modern fleet of movable medical equipment; |
| | • | | nationwide infrastructure for service and logistics; |
| | • | | proprietary medical equipment management software and tools; |
| | • | | commitment to customer service that has earned us a reputation as a leader in quality and service in our industry; and |
| | • | | extensive knowledge and experience in acquiring, managing, maintaining and remarketing medical equipment. |
Large, modern equipment fleet. We own and manage an extensive, modern fleet of movable medical equipment, consisting of approximately 161,000 owned units. This modern equipment fleet, along with our quality assurance programs and tools, minimizes obsolescence risk and places us in a leadership position in the areas of quality and patient safety. It also places us in a unique position to service “high end” acute care hospitals, such as teaching, research or specialty institutions that demand the most current technology to satisfy the increasingly complex needs of their patients.
Nationwide infrastructure. We have a broad, nationwide service network coupled with focused and customized operations at the local level. Our extensive network of district offices and Centers of Excellence and our 24-hours-a-day, 365 days-a-year service capabilities enable us to compete effectively for large, national contracts as well as to drive growth regionally and locally.
Proprietary software and asset management tools. We have used our more than 65 years of experience and our extensive database of equipment management information to develop sophisticated software technology and management tools. These tools have allowed us to become a leader in meeting the demands of customers by delivering sophisticated asset management programs that we use to drive cost efficiencies, equipment productivity and patient safety programs. We believe that our continued and significant investment in new tools and technology will help us to maintain our leadership role in the industry.
Superior customer service.We have a long-standing reputation among our customers for service and quality. This reputation is largely due to our customer service culture, which is continuously reinforced through significant investment in hiring and training resources. We strive to seamlessly integrate our employees and service offerings into the operations of our customers. This aggressive focus on customer service has helped us achieve a high customer retention rate.
Proven management team. We have an industry leading management team with an average of approximately 12 years of health care experience. Our management team has
11
successfully supervised the development of our competitive strategy, continually enhanced our service and product offerings, established our nationwide coverage and furthered our reputation as the industry’s service and quality leader.
Industry with favorable fundamentals. Our business benefits from the overall favorable trends in health care in general and our segments in particular. There is a fundamental shift in the needs of hospitals and alternate site providers from supplemental and peak needs supply of movable medical equipment to full equipment lifecycle asset management programs. This move to full outsourcing is not unlike trends in similar services at hospitals including food services, laundry, professional staffing and technology. The strong fundamentals in medical equipment outsourcing are being driven by the following trends:
| | • | | Favorable demographic trends. According to the U.S. Census Bureau, individuals aged 65 and older in the United States comprise the fastest growing segment of the population, and that segment is expected to grow to approximately 40 million by 2010. As a result, over time the number of patients and the volume of hospital admissions are expected to grow. The aging population and increasing life expectancy are increasing demand for health care services. |
| | • | | Increase in obesity.The U.S. population is getting heavier with 42 states now having obesity prevalence rates over 20%, compared to zero states with such rates in 1991 (Source: CDC Obesity Trends 2004). Therefore, health care facilities must be prepared for the needs of obese and morbidly obese patients. |
| | • | | Increased capital and operating expense pressures. As hospitals continue to experience tight capital and operating budgets, and while the cost and complexity of medical equipment increases, we expect that hospitals will increasingly look to us to source these capital equipment needs and manage medical equipment to achieve capital operating expense savings and efficiencies. |
| | • | | Nursing and professional staffing satisfaction. As hospitals continue to experience staffing pressures, we expect that they will increasingly turn to our programs to alleviate medical equipment management duties for nurses and professional staff to increase their overall job satisfaction levels. |
Strong value proposition.With our focus and expertise in medical equipment lifecycle management, we are able to create a strong value proposition for our customers. We provide our customers with the ability to improve their performance with respect to equipment acquisition, efficiency, utilization, management, maintenance, repair and disposal. We also can help our customers improve employee satisfaction, patient safety and regulatory compliance.
No direct reimbursement risk.Many health care providers rely on payment from patients or reimbursement from governmental or other third party payors. Our fees are
12
paid directly by our acute care hospital, alternate site and manufacturer customers rather than through third party payors. Accordingly, our exposure to uncollectible patient or reimbursement receivables or governmental reimbursement changes is reduced, as evidenced by our bad debt expense of approximately 0.4% of total revenues for the year ended December 31, 2005.
GROWTH STRATEGY
Historically, we have experienced significant and sustained organic and strategic growth. Our overall growth strategy is to continue to grow both organically and through strategic acquisitions.
Organic Growth
We believe that the following external and market factors will provide us significant growth opportunities:
| | • | | increasing life expectancy; |
| | • | | increasing patient acuity; |
| | • | | continued increase in the number and sophistication of medical technologies; |
| | • | | increasing cost and staffing pressures in hospitals; and |
| | • | | continuing growth of outsourcing of non-core functions by hospitals, alternate site providers and manufacturers. |
Our organic growth will be driven internally by the following factors:
| | • | | converting transactional rental and biomedical service customers to fully outsourced resident-based programs; |
| | • | | aggressively growing our less capital intensive technical and professional services and equipment sales and remarketing businesses; |
| | • | | increasing the number of hospitals, alternative care facilities and manufacturers to which we provide services; |
| | • | | expanding our relationships with GPOs and other national account customers; and |
| | • | | leveraging our broad range of service offerings to give us opportunities to serve new customers, and to provide new services to existing customers. |
Acquisitions
In recent years, we have made and successfully integrated several strategic acquisitions that have helped us expand our business by increasing our market share in existing markets, adding additional service offerings, and enabling us to penetrate new geographic regions. We intend to continue to pursue a disciplined course of growing our business with complementary acquisitions, and we regularly evaluate potential acquisitions.
COMPETITION
An analysis of our competition as it relates to our three business segments follows:
13
Medical Equipment Outsourcing Segment
We believe that the strongest competition to our outsourcing programs is the traditional purchase and lease alternatives for obtaining movable medical equipment. Currently, many acute care hospitals and alternate site providers view outsourcing primarily as a means of meeting short-term or peak supplemental needs, rather than as a long-term alternative to purchasing or leasing equipment and managing that equipment through its full lifecycle. Although we believe that we can demonstrate the cost-effectiveness of outsourcing patient-ready movable medical equipment and its management in the healthcare setting, we believe that many health care providers will continue to purchase or lease and manage internally a substantial portion of their movable medical equipment until they are educated in the advantages and efficiencies of outsourcing.
We compete with a limited number of national companies. Our largest, national competitor is Hill-Rom, a subsidiary of Hillenbrand Industries. Our other competition consists of regional or local companies and some movable medical equipment manufacturers and dealers that provide equipment outsourcing to augment their movable medical equipment sales. Local and regional companies often have difficulty maintaining equipment fleets with the latest technology available due to capital constraints and are frequently challenged with the lack of a full product offering. Therefore, most of our competitors tend to compete on price. In addition, local and regional companies often do not have the national infrastructure to service the large GPO and IDN systems.
Technical and Professional Services Segment
We face significant and direct competition in the technical and professional services area from many national, regional and local service providers, as well as from manufacturers. In addition, many of our customers choose to perform these functions using their own personnel. We believe that through our nationwide network of highly trained technicians, strong customer relations and extensive equipment database, we offer customers an attractive alternative for performing biomedical repair services on their equipment.
Medical Equipment Sales and Remarketing Segment
In medical equipment sales, we face significant direct competition from a variety of manufacturers and distributors on a nationwide basis. As a result, we are selective in our pursuit of these opportunities. The equipment remarketing market is highly fragmented with low barriers to entry. In addition to manufacturers seeking to control the remarketing and disposal of their own products, we compete with a number of localized or more specialized providers of remarketing and disposal services.
14
EMPLOYEES
We had 1,139 employees as of December 31, 2005, including 1,032 full-time and 107 part-time employees. Of such employees, 119 were sales representatives, 678 were operations personnel, 133 were employed in corporate support functions, and 209 were hospital service personnel.
None of our employees are covered by a collective bargaining agreement, and we have experienced no work stoppages to date. We believe that our relations with our employees are good.
INTELLECTUAL PROPERTY
We use “UHS®”, the UHS logo and “CHAMP®” as service marks in connection with our services and have registered these marks with the United States Patent and Trademark Office. We use the “Equipment Lifecycle Services”sm, and the Equipment Lifecycle Services logo as service marks in connection with our services. We have applied for federal trademark registration of the Equipment Lifecycle Services logo with the United States Patent and Trademark Office. U.S. service mark registrations are generally for a term of 10 years, renewable every 10 years as the mark is used in the regular course of business.
We have a domain name registration for UHS.com, which serves as our main website, and my.UHS.com and myservice.UHS.com, which are web-based tools that provide 24 hour on-demand access to equipment reports for all equipment outsourced or maintained by us.
We have developed proprietary software programs including the Asset Information Management System for Central Services (“AIMS/CS”), Resource for Equipment Documentation System (“REDS”) and Operator Error Identification System (“OEIS”). AIMS/CS is a medical equipment inventory management system that allows customers to track the location and usage of their leased and owned medical equipment using barcodes and hand held laser scanners. Our proprietary REDS and OEIS programs are specifically designed to help customers meet medical equipment documentation and reporting needs under applicable regulations and standards, such as those promulgated by the FDA and JCAHO.
MARKETING
We market our programs primarily through our direct sales force, which consisted of 119 professional sales representatives as of December��31, 2005. In the third quarter of 2004, we separated sales and customer service in the field to provide focused responsibility for each function. During 2005 we reorganized the sales team from three geographic regions (East, Central and West) to two (East and West) and reduced the number of sales divisions from 13 to 12. These changes were made to increase efficiencies by eliminating unnecessary management positions, to balance the regions and divisions more evenly in terms of revenue and to improve customer coverage.
15
We also market through our website, www.uhs.com, participation in numerous national and regional conventions, and placement of articles and advertisements in industry-leading publications.
In our marketing efforts we primarily target key decision makers, such as administrators, chief executive officers and chief financial officers as well as materials managers, department heads and directors of purchasing, nursing and central supply. We also promote our programs and services to hospital, manufacturer and alternate care provider groups and associations.
SEASONALITY/BUSINESS INTERRUPTION
Quarterly operating results are typically affected by seasonal factors. Historically, our first and fourth quarters are the strongest, reflecting increased hospital census and patient acuity during the fall and winter months. Our business can also be impacted by natural disasters, such as hurricanes and earthquakes, which affect our ability to transfer equipment to and from our customers.
REGULATORY MATTERS
Sarbanes-Oxley.
During 2006 we anticipate that we will incur additional expenses related to the management’s report, auditor’s attestation report and other requirements under Section 404 of the Sarbanes-Oxley Act of 2002. We incurred third party costs related to Section 404 compliance totaling $0.2 million and $0.6 million in 2004 and 2005, respectively. On September 21, 2005, the Securities and Exchange Commission (“SEC”) announced that the compliance date for non-accelerated filers (such as UHS) was extended to the first fiscal year ending on or after July 15, 2007.
Regulation of Medical Equipment.
Our customers are subject to documentation and safety reporting regulations and standards with respect to the medical equipment they use, including those established by the FDA, JCAHO, and the NFPA. Some states and municipalities also have similar regulations.
Our REDS and OEIS programs (see description in “Intellectual Property” section of this Form 10-K) are specifically designed to help customers meet documentation and reporting needs under such regulations and standards. We also monitor changes in regulations and standards and work to accommodate the needs of customers by providing specific product and manufacturer information upon request. Manufacturers of medical equipment are subject to regulation by agencies and organizations such as the FDA, Underwriters Laboratories, and the NFPA. We believe that all movable medical equipment we outsource conforms to these regulations.
16
The Safe Medical Devices Act of 1990 (“SMDA”), which amended the Food, Drug and Cosmetic Act (“FDCA”), requires manufacturers, user facilities, and importers of medical devices to report deaths and serious injuries which a device has or may have caused or to which a device has or may have contributed. In addition, the SMDA requires the establishment and maintenance of adverse event files and various other FDA reports. Manufacturers and importers are also required to report certain device malfunctions. We work with our customers to assist them in meeting their reporting obligations under the FDCA, including those requirements added by the SMDA.
As a distributor of medical devices, we are required by the FDCA to maintain device complaint records containing any incident information regarding the identity, quality, durability, reliability, safety, effectiveness or performance of a device. We are required to retain copies of these records for a period of two years from the date of inclusion of the record in the file or for a period of time equivalent to the expected life of the device, whichever is greater, even if we cease to distribute the device. Finally, we are required to provide authorized FDA employees access to copy and verify these records upon their request. We have current compliance records regarding maintenance, repairs, modification, and user-error with respect to all of our equipment.
Besides the FDA, a number of states regulate medical device distributors and wholesalers either through pharmacy or device distributor licensure. Currently, we hold licenses in 12 states. Some licensure regulations and statutes in additional states may apply to our activities. Although our failure to possess such licenses in these states for our existing operations may subject us to certain monetary fines, we do not believe the extent of such fines, in the aggregate, would be material to our liquidity, financial condition or results of operation.
In addition, we are required to provide information to the manufacturer regarding the permanent disposal or any change in ownership of certain categories of medical outsourcing equipment. We believe our medical equipment tracking systems are in material compliance with these regulations.
The Health Insurance Portability and Accountability Act of 1996, (“HIPAA”), applies to certain covered entities, including health plans, health care clearinghouses and health care providers. HIPAA regulations protect individually identifiable health information, including information in an electronic format, by, among other things, setting forth specific standards under which such information may be used and disclosed, furnishing patient rights to obtain and amend their health information, and establishing certain administrative requirements for covered entities.
Because of our self-insured health plans, we are a covered entity under the HIPAA regulations. Also, we may be obligated contractually to comply with certain HIPAA requirements as a business associate of various health care providers. In addition, various state legislatures may enact additional privacy legislation that is not preempted by the federal law, which may impose additional burdens on us. Accordingly, we have made and, as new standards go into effect, we expect to continue to make administrative, operational and information infrastructure changes in order to comply with these rules.
17
Third Party Reimbursement
Our fees are paid directly by our customers rather than through direct reimbursement from private insurers or governmental entities, such as Medicare or Medicaid. We do not bill the patient, the insurer or other third party payors directly for services provided for hospital inpatients or outpatients. Payment to health care providers by third party payors for our services depends substantially upon the reimbursement policies of these payors. Consequently, those policies have a direct effect on the ability of health care providers to pay for our services and an indirect effect on our level of charges. Also, in certain circumstances, third party payors may take regulatory or other action against service providers even though the service provider does not receive direct reimbursement from third party payors.
Hospitals and alternate site providers are facing increased cost containment pressures from public and private insurers and other managed care providers, such as health maintenance organizations, preferred provider organizations and managed fee-for-service plans, as these organizations attempt to reduce the cost and utilization of healthcare services. We believe that these payors have followed or will follow the federal government in limiting reimbursement through preferred provider contracts, discounted fee arrangements and capitated (fixed patient care reimbursement) managed care arrangements. In addition to promoting managed care plans, employers are increasingly self funding their benefit programs and shifting costs to employees through increased deductibles, co-payments and employee contributions. We believe that these cost reduction efforts will place additional pressures on health care providers’ operating margins and will encourage efficient equipment management practices, such as use of our outsourcing and AMPP services.
Liability and Insurance
Although we do not manufacture any medical equipment, our business entails the risk of claims related to the outsourcing, sale and service of medical equipment. In addition, our instruction of hospital employees with respect to the equipment’s use and our professional consulting services are sources of potential claims. We have not suffered a material loss due to a claim; however, any such claim, if made, could have a material adverse effect on our business. We maintain a number of insurance policies including commercial general liability coverage (product and premises liability insurance), automobile liability insurance, worker’s compensation insurance and professional liability insurance. We also maintain excess liability coverage. Our policies are subject to annual renewal. We believe that our current insurance coverage is adequate. Claims exceeding such coverage may be made and we may not be able to continue to obtain liability insurance at acceptable levels of cost and coverage.
18
ITEM 1A: Risk Factors
Our business faces many risks. Any of the risks discussed below, or elsewhere in this Form 10-K or our other filings with the SEC, could have a material impact on our business, financial condition or results of operations. Additional risks and uncertainties not presently known to us or that we currently believe to be immaterial may also impair our business operations.
If the patient census of our customers decreases, the revenues generated by our business could decrease.
Our operating results are dependent in part upon the amount and types of equipment necessary to service our customers’ needs which are heavily influenced by the total number of patients our customers are serving at any time (which we refer to as “patient census”). At times of lower patient census, our customers have a decreased need for our services on a supplemental or peak needs basis. Our operating results can vary depending on, for example, the timing and severity of the cold and flu season, local, regional or national epidemics, and the impact of national catastrophes, as well as other factors affecting patient census.
If we are unable to fund our significant cash needs, we may be unable to expand our business as planned or to service our debt.
We require substantial cash to operate our Medical Equipment Outsourcing programs and service our debt. Our outsourcing programs require us to invest a significant amount of cash in movable medical equipment purchases. To the extent that such expenditures cannot be funded from our operating cash flow, borrowings under our senior secured credit facility or other financing sources, we may not be able to grow as currently planned. We currently expect that over the next 12 months we will invest approximately $45-50 million in new movable medical equipment and other capital expenditures. This estimate is subject to numerous assumptions, including revenue growth, the number of AMPP signings, and any significant changes in GPO contracts. In addition, a substantial portion of our cash flow from operations must be dedicated to servicing our debt and there are significant restrictions on our ability to incur additional indebtedness under the indenture governing our 10.125% senior notes due 2011 and our Amended Credit Agreement.
Primarily because of our debt service obligations and debt refinancing charges, we have had a history of net losses. If we continue to incur net losses, this could result in our inability to finance our business in the future. We had net losses of $19.5 million, $3.6 million and $1.6 million for the years ended 2003, 2004 and 2005, respectively.
19
If we are unable to meet certain financial and operating covenants contained in our Amended Credit Agreement or Senior Notes, our creditors could accelerate the debt or restrict further borrowing.
Our Amended Credit Agreement and our Senior Notes contain financial and operating covenants. (For a summary of the covenants under the Amended Credit Agreement, see “Covenants Under Our Amended Credit Agreement” in Item 7 of this Form 10-K). If we fail to meet these covenants or obtain appropriate waivers, our creditors have a number of remedies including, but not limited to, acceleration of our debt or placement of restrictions on further borrowing.
If we are unable to change the manner in which health care providers traditionally procure medical equipment, we may not be able to achieve significant revenue growth.
We believe that the strongest competition to our outsourcing programs is the traditional purchase or lease alternative for obtaining movable medical equipment. Currently, many acute care hospitals and alternate site providers view outsourcing primarily as a means of meeting short-term or peak supplemental needs, rather than as a long-term, effective and cost efficient alternative to purchasing or leasing equipment. Many health care providers may continue to purchase or lease a substantial portion of their movable medical equipment.
Our competitors may engage in significant price competition or liquidate significant amounts of surplus equipment, thereby decreasing the demand for outsourcing services and possibly causing us to reduce the rates we charge for our services.
In a number of our geographic and product markets, we compete with one principal competitor and various smaller equipment outsourcing companies that compete primarily on the basis of price. These competitors may offer certain customers lower prices depending on utilization levels and other factors. Our largest, national competitor is Hill-Rom, a subsidiary of Hillenbrand Industries. Our competition may engage in competitive practices that may undercut our pricing. In addition, a competitor may liquidate significant amounts of surplus equipment, thereby decreasing the demand for outsourcing services and possibly causing us to reduce the rates we may charge for our services.
We have relationships with certain key suppliers, and adverse developments concerning these suppliers could delay our ability to procure equipment or increase our cost of purchasing equipment.
We purchased movable medical equipment from over 150 manufacturers in 2005. Our ten largest manufacturers of movable medical equipment accounted for approximately 56% of our direct movable medical equipment purchases in 2005. Adverse developments concerning key suppliers or our relationships with them could force us to seek alternative sources for our movable medical equipment or to purchase such equipment on unfavorable terms. A delay in procuring equipment or an increase in the cost to purchase equipment could limit our ability to provide equipment to our customers on a timely and cost-effective basis. If we are unable to have access to parts or if manufacturers do not provide access to equipment manuals or training, we may not be able to provide certain technical and professional services.
20
A substantial portion of our revenues come from customers with whom we do not have long-term commitments and cancellations by or disputes with customers could decrease the amount of revenues we generate, thereby reducing our ability to operate and expand our business.
We derived approximately 67% of our outsourcing revenues for the year ended December 31, 2005, from customers with which we do not have any formal long-term commitment to use our programs. Our customers are generally not obligated to outsource our equipment under long-term commitments. In addition, many of our customers do not sign written agreements with us fixing the rights and obligations of the parties regarding matters such as billing, liability, warranty or use. Therefore, we face risks such as fluctuations in usage, inaccurate or false reporting of usage by customers and disputes over liabilities related to equipment use. We do not have written agreements with some of our AMPP customers for which we provide a substantial portion of the movable medical equipment that they use and provide substantial staffing resources. These arrangements could be terminated by the healthcare provider without notice or payment of any termination fee. A large number of such terminations may adversely affect our ability to generate revenue growth and sufficient cash flows to support our growth plans.
If we are unable to renew our contracts with GPOs or IDNs, we may lose existing customers, thereby reducing the amount of revenues we generate.
Our past revenue growth and our strategy for future growth depends, in part, on access to the new customers granted by our major contracts with GPOs and IDNs. In the past, we have been able to renew such contracts when they are up for renewal. If we are unable to renew our current GPO contracts, we may lose a portion of existing business with the customers who are members of such GPOs.
Although we do not manufacture any medical equipment, our business entails the risk of claims related to the medical equipment that we outsource and service. We may not have adequate insurance to cover a claim, and it may be more expensive or difficult for us to obtain adequate insurance in the future.
We may be liable for claims related to the use of our movable medical equipment or to our maintenance or repair of a customer’s movable medical equipment. Any such claims, if made and upheld, could make our business more expensive to operate and therefore less profitable. We may be subject to claims exceeding our insurance coverage or we may not be able to continue to obtain liability insurance at acceptable levels of cost and coverage. In addition, litigation relating to a claim could adversely affect our existing and potential customer relationships, create adverse public relations and divert management’s time and resources from the operation of the business.
21
Our growth strategy depends in part on our ability to successfully identify and manage our acquisitions and a failure to do so could impede our future revenue growth, thereby weakening our position in the industry with respect to our competitors.
As part of our growth strategy, we intend to pursue acquisitions or other strategic relationships within the health care industry that we believe will enable us to generate revenue growth and enhance our competitive position. During 2005, we acquired substantially all the assets of one business for the purchase price of $1.1 million. Future acquisitions may involve significant cash expenditures that could impede our future revenue growth. In addition, our efforts to execute our acquisition strategy may be affected by our ability to identify suitable candidates and negotiate and close acquisitions. We regularly evaluate potential acquisitions. We may not be successful in acquiring other businesses, and the businesses we do acquire in the future may not ultimately produce returns that justify our related investment.
Acquisitions may involve numerous risks, including:
| | • | | difficulties assimilating personnel and integrating distinct business cultures; |
| | • | | diversion of management’s time and resources from existing operations; |
| | • | | potential loss of key employees or customers of acquired companies; and |
| | • | | exposure to unforeseen liabilities of acquired companies. |
If we are unable to continue to grow through acquisitions, our ability to generate revenue growth and enhance our competitive position may be impaired.
We depend on our sales professionals and service specialists and may lose customers when any of our sales professionals and service specialists leave us.
Our revenue growth has been supported by hiring and developing new sales professionals and service specialists and adding, through acquisitions, established sales professionals and service specialists whose existing customers generally have become our customers. We have experienced and will continue to experience intense competition for these resources. The success of our programs depends on the relationships developed between our sales professionals and service specialists and our customers.
Our cash flow fluctuates during the year because operating income as a percentage of revenue fluctuates with our quarterly operating results and we make semi-annual debt service payments.
Our results of operations have been and can be expected to be subject to quarterly fluctuations. We may experience increased revenues in the first and fourth quarters of the year, depending upon the timing and severity of the cold and flu season and the related increased hospital census and movable medical equipment usage during that season. Because a significant portion of our expenses are relatively fixed over these periods, our operating income as a percentage of revenue tends to increase during the first and fourth quarter of each year. If the cold and flu season is delayed by as little as one month, or is less severe than in prior periods, our quarterly operating results for a current period can vary significantly from prior periods. Our quarterly results can also fluctuate as a result of other factors such as the timing of acquisitions, new AMPP agreements or new office openings. In addition, semi-annual interest payments on our 10.125% senior notes are paid in the second and fourth quarters, thus leading to significant fluctuations in cash flow from operations.
22
Changes in reimbursement rates and policies by third-party payors for medical equipment costs may reduce the rates that providers can pay for our services, thereby requiring us to reduce our rates or putting our ability to collect payments at risk.
Our health care provider customers that pay us directly for the services we provide to them rely on reimbursement from third party payors for a substantial portion of their operating revenue. These third party payors include both governmental payors such as Medicare and Medicaid and private payors such as insurance companies and managed care organizations. There are widespread efforts to control health care costs in the United States by all of these payor groups. These cost containment initiatives have resulted in reimbursement policies based on fixed rates for a particular patient treatment that are unrelated to the providers’ actual costs or require health care providers to provide services on a discounted basis. Consequently, these reimbursement policies have a direct effect on health care providers’ ability to pay us for our services and an indirect effect on our level of charges. Ongoing concerns about rising health care costs may cause more restrictive reimbursement policies to be implemented in the future. Restrictions on the amounts or manner of reimbursements to health care providers may affect the financial strength of our customers and amount our customers are able to pay for our services.
In periods when significant health care reform initiatives were under consideration and uncertainty remained as to their likely outcome, our profits decreased as the cost of doing business increased. If other significant health care reform initiatives occur, they may have a similar, negative effect.
Because the regulatory and political environment for health care significantly influences the capital equipment procurement decisions of health care providers, our ability to generate profits has historically been adversely affected in periods when significant health care reform initiatives were under consideration and uncertainty remained as to their likely outcome.
A portion of our revenues are derived from home care providers and nursing homes, and these health care providers may pose additional credit risks.
Our nursing home and home care customers, may pose additional credit risks since they are generally less financially sound than hospitals. Nursing homes in particular have experienced significant financial problems since the implementation of the Balanced Budget Act of 1997. We may incur losses in the future due to the credit risks, including potential bankruptcy filings, associated with any of these customers.
23
The interests of our major stockholders may conflict with your interests, and these stockholders could cause us to take action that would be against your interests.
J.W. Childs Equity Partners, L.P. (JWC Fund I), J.W. Childs Equity Partners III, L.P. (JWC Fund III), JWC UHS Co-Invest LLC, JWC Fund III Co-Invest LLC, and Halifax Capital Partners, L.P., (Halifax), and their respective affiliates beneficially own shares representing over 90% of our outstanding common equity. Accordingly, these stockholders have the power to elect our board of directors, appoint new management and approve any action requiring a stockholder vote, including amendments to our certificate of incorporation and approving mergers or sales of substantially all of our assets. Such concentration of voting power could have the effect of deterring and preventing a change of control of our company that might otherwise be beneficial to our security holders. The directors so elected will have the authority to make decisions affecting our capital structure, including the issuance of additional indebtedness and the declaration of dividends. Circumstances may occur in which the interests of these equity holders could be in conflict with your interests.
Consolidation in the health care industry may lead to a reduction in the outsourcing rates we charge, thereby decreasing our revenues.
In recent years, many acute care hospitals and alternate site providers have consolidated to create larger health care organizations. We believe that this consolidation trend may continue. Any resulting consolidated health care organization may have greater bargaining power over us, which could lead to a reduction in the outsourcing rates that we are able to charge. A reduction in our outsourcing rates may decrease our revenues.
Our competitors may bundle products and services offered to customers, some of which we do not offer.
If competitors offer their products and services to customers on a combined basis with reduced prices, and we do not offer some of these products or cannot offer them on comparable terms, we may have a competitive disadvantage that will lower the demand for our services.
Our customers operate in a highly regulated environment and the regulations affecting them could lead to additional expenses associated with compliance and licensing, along with penalties resulting from possible violations, thereby increasing our costs and reducing income.
The healthcare industry is required to comply with extensive and complex laws and regulations at the federal, state and local government levels. While the majority of these regulations do not directly apply to us, there are some that do, including the FDCA and certain state pharmaceutical licensing requirements. Although we believe we are in compliance with the FDCA, if the FDA expands the reporting requirements under the FDCA, we may be required to comply with the expanded requirements and may incur substantial additional expenses in doing so. With respect to state licensing requirements, we are currently licensed in 12 states and may be required to be licensed in additional states. Our failure to possess such licenses for our existing operations may subject us to certain additional expenses.
24
Given that our industry is heavily regulated, we may be subject to additional regulatory requirements. If our operations are found to be in violation of any governmental regulations to which we or our customers are subject, we may be subject to the applicable penalty associated with the violation. Any penalties, damages, fines or curtailment of our operations would significantly increase our costs of doing business, thereby leading to difficulty generating sufficient income to support our business. Also, if we are found to have violated certain federal or state laws or regulations regarding Medicare, Medicaid or other governmental funding sources, we could be subject to fines and possible exclusion from participation in federal and state health care programs.
Although we do not manufacture any medical equipment, we own a large fleet of movable medical equipment which may be subject to equipment recalls or obsolescence.
We are required to incur significant expenditures of resources in order to maintain a large and modern equipment fleet. Our equipment may be subject to recalls that could be expensive to implement. We may be required to incur additional costs to repair or replace the equipment at our own expense or we may choose to purchase incremental new equipment from a supplier not affected by the recall. Additionally, our relationship with our customers may be damaged if we cannot promptly replace the equipment that has been recalled.
Our success is dependent, in part, on our ability to respond effectively to changes in technology. Since we maintain a large fleet of equipment, we are subject to the risk of equipment obsolescence. If advancements in technology render a substantial portion of our equipment fleet obsolete, we may experience a decrease in demand for our products which could adversely affect our operating results and cause us to invest in new technology to maintain our market share and operating margins.
We may incur increased vendor costs that we cannot pass through to our customers.
Our customer agreements may include limitations on our ability to increase prices over the term of the agreement. On the other hand, we rely on subcontractors to provide some of the services and we do not always have fixed pricing agreements with these subcontractors. Therefore, we are at risk of incurring increased costs that we are unable to pass through to our customer.
ITEM 1B: Unresolved Staff Comments
None.
ITEM 2: Properties
As of December 31, 2005, we operated 75 full service district offices and six technical service Centers of Excellence. We own our Minneapolis, Minnesota district office facility, consisting of approximately 24,000 square feet of office, warehouse, processing
25
and technical repair space. We lease our other district offices, averaging approximately 5,900 square feet, and our regional service centers. None of our offices is dedicated to a single business segment. Our corporate offices are located at a 41,000 square foot leased facility in Edina, Minnesota.
ITEM 3: Legal Proceedings
From time to time, we may become involved in litigation arising out of operations in the normal course of business. As of December 31, 2005, we were not a party to any pending legal proceedings the adverse outcome of which could reasonably be expected to have a material adverse effect on our operating results, financial position, or cash flows.
ITEM 4: Submission of Matters to a Vote of Security Holders
None.
PART II
ITEM 5: Market for Registrant’s Common Equity, Related Stockholder Matters and Issuer Purchases of Equity Securities
As of March 26, 2006, there were 53 holders of our common stock, par value $.01 per share. There is no established public trading market for our common stock and during 2004 and 2005 we did not declare or pay a cash dividend on any class of our common stock. We intend to retain earnings for use in the operation and expansion of our business and therefore do not anticipate paying any cash dividends in the foreseeable future. Our debt instruments contain certain restrictions on our ability to pay cash dividends on our common stock (See Note 6, “Long Term Debt”, in the audited financial statements included in Item 15 of this Form 10-K, and the information regarding our revolving credit facility contained under the caption “Liquidity and Capital Resources” in Item 7 of this Form 10-K).
Pursuant to the exercise of outstanding options, on November 10, 2005, we sold 416 shares of common stock to a departing employee for the aggregate purchase price of $499.20. Such sale was completed pursuant to the exemption from registration provided under Section 4(2) of the Securities Act of 1933, as amended. The proceeds from the sale of such shares were added to our general funds and used for general corporate purposes.
We did not repurchase any of our equity securities during the fourth quarter of 2005.
ITEM 6: Selected Financial Data
The selected financial data presented below under the captions “Statement of Operations Data,” “Other Financial Data,” “Other Operating Data” and “Balance Sheet Data” for and as of each of the years in the five-year period ended December 31, 2005, are derived from our audited financial statements. The selected financial data presented below is qualified
26
in its entirety by, and should be read in conjunction with, the financial statements and notes thereto and other financial and statistical information included elsewhere in this Form 10-K, including the information contained under the caption “Management’s Discussion and Analysis of Financial Condition and Results of Operations”.
| | | | | | | | | | | | | | | | | | | | |
| | | Years Ended December 31, | |
| | | 2001 | | | 2002 | | | 2003 | | | 2004 | | | 2005 | |
| | | (dollars in thousands) | |
| Statement of Operations Data: | | | | | | | | | | | | | | | | | | | | |
| | | | | |
Total revenues | | $ | 125,635 | | | $ | 153,766 | | | $ | 171,005 | | | $ | 199,600 | | | $ | 215,904 | |
Cost of medical equipment outsourcing, sales and service | | | 67,872 | | | | 82,609 | | | | 95,398 | | | | 113,783 | | | | 127,049 | |
Gross Margin | | | 57,763 | | | | 71,157 | | | | 75,607 | | | | 85,817 | | | | 88,855 | |
| | | | | | | | | | | | | | | | | | | | |
Selling, general and administrative: | | | | | | | | | | | | | | | | | | | | |
Recapitalization, stock compensation and severance | | | 1,553 | | | | 10,099 | | | | 14,385 | | | | — | | | | — | |
Terminated initial public offering expenses | | | 1,241 | | | | — | | | | — | | | | — | | | | — | |
Other selling, general and administrative. | | | 38,837 | | | | 43,053 | | | | 46,956 | | | | 57,713 | | | | 58,455 | |
| | | | | | | | | | | | | | | | | | | | |
Total selling, general and administrative | | | 41,631 | | | | 53,152 | | | | 61,341 | | | | 57,713 | | | | 58,455 | |
| | | | | | | | | | | | | | | | | | | | |
Operating income | | | 16,132 | | | | 18,005 | | | | 14,266 | | | | 28,104 | | | | 30,400 | |
Interest expense | | | 19,635 | | | | 18,126 | | | | 20,245 | | | | 30,508 | | | | 31,127 | |
Loss on early retirement of debt | | | — | | | | — | | | | 13,272 | | | | — | | | | — | |
| | | | | | | | | | | | | | | | | | | | |
Loss before income taxes | | | (3,503 | ) | | | (121 | ) | | | (19,251 | ) | | | (2,404 | ) | | | (727 | ) |
Income tax expense | | | 56 | | | | 97 | | | | 275 | | | | 1,188 | | | | 842 | |
| | | | | | | | | | | | | | | | | | | | |
Net loss(4) | | $ | (3,559 | ) | | $ | (218 | ) | | $ | (19,526 | ) | | $ | (3,592 | ) | | $ | (1,569 | ) |
| | | | | | | | | | | | | | | | | | | | |
| |
| | | Years Ended December 31, | |
| | | 2001 | | | 2002 | | | 2003 | | | 2004 | | | 2005 | |
| | | (dollars in thousands) | |
| Other Financial Data: | | | | | | | | | | | | | | | | | | | | |
Net cash provided by operating activities | | $ | 31,696 | | | $ | 40,186 | | | $ | 15,957 | | | $ | 37,966 | | | $ | 43,963 | |
Net cash used in investing activities | | | (41,511 | ) | | | (38,956 | ) | | | (36,770 | ) | | | (65,150 | ) | | | (40,631 | ) |
Net cash provided by (used in) financing activities | | | 9,815 | | | | (1,230 | ) | | | 20,813 | | | | 27,184 | | | | (3,332 | ) |
| Other Operating Data: | | | | | | | | | | | | | | | | | | | | |
Movable medical equipment (approximate number of units at end of period) | | | 127,000 | | | | 138,000 | | | | 144,000 | | | | 150,000 | | | | 161,000 | |
Offices (at end of period) | | | 62 | | | | 65 | | | | 69 | | | | 75 | | | | 75 | |
Number of total customers (at end of period) | | | 5,570 | | | | 5,880 | | | | 5,950 | | | | 6,250 | | | | 6,300 | |
| | | | | |
Depreciation and amortization | | $ | 31,978 | | | $ | 32,775 | | | $ | 35,532 | | | $ | 42,097 | | | $ | 46,327 | |
EBITDA(1)(2) | | | 48,110 | | | | 50,781 | | | | 36,525 | | | | 68,459 | | | | 74,984 | |
27
| | | | | | | | | | | | | | | | | | | | |
| | | As of December 31, | |
| | | 2001 | | | 2002 | | | 2003 | | | 2004 | | | 2005 | |
| | | (dollars in thousands) | |
| Balance Sheet Data: | | | | | | | | | | | | | | | | | | | | |
Working capital (3) | | $ | 8,416 | | | $ | 10,043 | | | $ | 8,575 | | | $ | 17,198 | | | $ | 19,379 | |
Total assets | | | 196,214 | | | | 202,136 | | | | 220,219 | | | | 246,407 | | | | 249,185 | |
Total debt | | | 204,441 | | | | 200,806 | | | | 271,082 | | | | 297,302 | | | | 300,480 | |
Shareholders’ deficiency | | | (54,297 | ) | | | (55,358 | ) | | | (89,903 | ) | | | (93,058 | ) | | | (96,799 | ) |
| (1) | EBITDA is defined as earnings before interest expense, income taxes, depreciation and amortization. Management understands that some industry analysts and investors consider EBITDA as a supplementary non-GAAP financial measure useful in analyzing a company’s ability to service debt. EBITDA, however, is not a measure of financial performance under GAAP and should not be considered as an alternative to, or more meaningful than, net income as a measure of operating performance or to cash flows from operating, investing or financing activities or as a measure of liquidity. Since EBITDA is not a measure determined in accordance with GAAP and is thus susceptible to varying interpretations and calculations, EBITDA, as presented, may not be comparable to other similarly titled measures of other companies. EBITDA does not represent an amount of funds that is available for management’s discretionary use. See note 2 for a reconciliation of net cash provided by operating activities to EBITDA. |
| (2) | The following is a reconciliation of net cash provided by operating activities to EBITDA: |
| | | | | | | | | | | | | | | | | | | | |
| | | Years Ended December 31, (dollars in thousands) | |
| | | 2001 | | | 2002 | | | 2003 | | | 2004 | | | 2005 | |
Net cash provided by operating activities | | $ | 31,696 | | | $ | 40,186 | | | $ | 15,957 | | | $ | 37,966 | | | $ | 43,963 | |
Changes in operating assets and liabilities | | | 434 | | | | 4,122 | | | | 7,916 | | | | 2,245 | | | | 2,327 | |
Other non-cash expenses | | | (3,711 | ) | | | (11,750 | ) | | | (7,867 | ) | | | (3,448 | ) | | | (3,275 | ) |
Income tax expense | | | 56 | | | | 97 | | | | 275 | | | | 1,188 | | | | 842 | |
Interest expense | | | 19,635 | | | | 18,126 | | | | 20,244 | | | | 30,508 | | | | 31,127 | |
| | | | | | | | | | | | | | | | | | | | |
EBITDA | | $ | 48,110 | | | $ | 50,781 | | | $ | 36,525 | | | $ | 68,459 | | | $ | 74,984 | |
| (3) | Represents total current assets (excluding cash and cash equivalents) less total current liabilities, excluding current portion of long-term debt. |
| (4) | Effective January 1, 2002, we adopted Statement of Financial Accounting Standard No. 142, “Goodwill and Other Intangible Assets.” This standard discontinued the amortization of goodwill and indefinite lived intangible assets effective January 1, 2002. The pro forma amounts shown below reflect the effect of retroactive application of the non-amortization of goodwill as if this method of accounting had been in effect in the periods prior to adoption (2002), in thousands as follows: |
| | | | |
| | | 2001 | |
Net loss as reported | | $ | (3,559 | ) |
Effect of goodwill amortization | | | 2,731 | |
Net loss as adjusted | | $ | (828 | ) |
28
Segment Information
| | | | | | | | | | | | | | | |
| | | Year Ended December 31, 2005 (dollars in thousands) |
| | | Medical Equipment Outsourcing | | Technical and Professional Services | | Medical Equipment Sales & Remarketing | | Corporate and Unallocated | | Total |
Revenues | | $ | 167,687 | | $ | 29,654 | | $ | 18,563 | | $ | — | | $ | 215,904 |
Cost of Revenue | | | 52,499 | | | 21,878 | | | 14,706 | | | — | | | 89,083 |
Movable Medical Equipment Depreciation | | | 37,966 | | | — | | | — | | | — | | | 37,966 |
| | | | | | | | | | | | | | | |
Gross Margin | | $ | 77,222 | | $ | 7,776 | | $ | 3,857 | | $ | — | | $ | 88,855 |
| | | | | | | | | | | | | | | |
Total Assets | | $ | 40,467 | | $ | 2,496 | | $ | 3,850 | | $ | 202,372 | | $ | 249,185 |
| |
| | | Year Ended December 31, 2004 (dollars in thousands) |
| | | Medical Equipment Outsourcing | | Technical and Professional Services | | Medical Equipment Sales & Remarketing | | Corporate and Unallocated | | Total |
Revenues | | $ | 156,490 | | $ | 25,491 | | $ | 17,619 | | $ | — | | $ | 199,600 |
Cost of Revenue | | | 47,178 | | | 17,295 | | | 13,307 | | | — | | | 77,780 |
Movable Medical Equipment Depreciation | | | 36,003 | | | — | | | — | | | — | | | 36,003 |
| | | | | | | | | | | | | | | |
Gross Margin | | | 73,309 | | $ | 8,196 | | $ | 4,312 | | $ | — | | $ | 85,817 |
| | | | | | | | | | | | | | | |
Total Assets | | $ | 41,070 | | $ | 3,199 | | $ | 3,858 | | $ | 198,280 | | $ | 246,407 |
| |
| | | Year Ended December 31, 2003 (dollars in thousands) |
| | | Medical Equipment Outsourcing | | Technical and Professional Services | | Medical Equipment Sales & Remarketing | | Corporate and Unallocated | | Total |
Revenues | | $ | 140,233 | | $ | 14,662 | | $ | 16,110 | | $ | — | | $ | 171,005 |
Cost of Revenue | | | 42,427 | | | 9,306 | | | 11,554 | | | — | | | 63,287 |
Movable Medical Equipment Depreciation | | | 32,111 | | | — | | | — | | | — | | | 32,111 |
| | | | | | | | | | | | | | | |
Gross Margin | | $ | 65,695 | | $ | 5,356 | | $ | 4,556 | | $ | — | | $ | 75,607 |
| | | | | | | | | | | | | | | |
Total Assets | | $ | 33,459 | | $ | 206 | | $ | 3,866 | | $ | 182,688 | | $ | 220,219 |
Segment assets for the three operating business segments (excluding Corporate and Unallocated) primarily include goodwill and intangible assets. Corporate and Unallocated contains all other UHS assets.
Subsequent Events
On March 29, 2006, the board of directors approved the offering of options to purchase 209,500 shares under the 2003 Stock Option Plan to certain employees on March 31, 2006.
29
Item 7: Management’s Discussion and Analysis of Financial Condition and Results of Operations
OVERVIEW
We are a leading nationwide provider of medical equipment outsourcing and services to the health care industry, including national, regional and local acute care hospitals and alternate site providers, such as nursing homes and home care providers. We service customers across the spectrum of the equipment life cycle as a result of our position as the industry’s largest purchaser, outsourcer and reseller of movable medical equipment. Our diverse customer base includes more than 3,200 acute care hospitals and approximately 3,100 alternate site providers. We also have extensive and long-standing relationships with over 200 major medical equipment manufacturers and many of the nation’s largest GPOs and IDNs. Our service offerings fall into three segments: Medical Equipment Outsourcing, Technical and Professional Services, and Medical Equipment Sales and Remarketing. All of our services leverage our nationwide logistics network and our more than 65 years of experience managing and servicing all aspects of movable medical equipment. These services are paid for by our customers and not directly through reimbursement from governmental or other third-party payors.
CRITICAL ACCOUNTING POLICIES
The preparation of consolidated financial statements in conformity with accounting principles generally accepted in the United States of America requires management to make certain estimates and assumptions that affect the reported amounts of assets and liabilities and disclosure of contingent assets and liabilities at the date of the financial statements and the reported amounts of revenues and expenses during the reporting period. Management bases these estimates on historical experience and other assumptions believed to be reasonable under the circumstances. However, actual results could differ from these estimates. Management believes the critical accounting policies and areas that require more significant judgments and estimates used in the preparation of our consolidated financial statements to be:
| | • | | Allowance for doubtful accounts; |
| | • | | Useful lives assigned to long-lived and intangible assets; |
| | • | | Recoverability of long-lived and intangible assets, including goodwill; |
| | • | | Measurement of our pension benefit obligation; |
| | • | | Self-insurance reserves for worker’s compensation and auto insurance plans; |
| | • | | Provisions for inventory and equipment obsolescence; and |
| | • | | Various other commitments and contingencies. |
We estimate the allowance for doubtful accounts considering a number of factors, including:
| | • | | aging of the accounts receivable; and |
| | • | | specific information obtained by us on the condition and the current creditworthiness of our customers. |
30
If the financial conditions of our customers were to deteriorate and affect the ability of our customers to make payments on their accounts, we may be required to increase our allowance by recording additional bad debt expense. Likewise, should the financial condition of our customers improve and result in payments or settlements of previously reserved amounts, we may be required to record a reduction in bad debt expense to reverse the recorded allowance.
Depreciation and amortization are recognized using the straight-line method over the estimated useful life of the long-lived asset and intangible asset. We estimate useful lives based on historical data and industry trends. We periodically reassess the estimated useful lives of our long-lived and intangible assets. Changes to estimated useful lives would impact the amount of depreciation and amortization expense recorded in earnings and potentially require us to record an impairment charge.
We review long-lived and intangible assets, including goodwill, for impairment annually, or at any time events or circumstances indicate that the carrying value of such assets may not be fully recoverable. For long-lived assets and amortizable intangible assets, an impairment is evaluated based on the sum of undiscounted estimated future cash flows expected to result from use of the assets compared to its carrying value. For goodwill, an impairment is evaluated based on the fair value of each reporting unit. If an impairment is recognized, the carrying value of the impaired asset is reduced to its fair value based on discounted estimated future cash flows. As of January 1, 2006, no goodwill impairment has been recognized in 2005, 2004, or 2003.
The measurement of our pension benefit obligation is dependent on a variety of assumptions determined by management and used by our actuaries. These assumptions affect the amount and timing of future contributions and expenses.
The assumptions used in developing the required estimates include discount rate, expected return or earnings on assets, retirement rates and mortality rates. We assume no changes in projected salary costs as the benefits under the plan were frozen in 2002. For year-end 2005, the discount rate assumption is determined by considering the average of bond yield curves constructed from a large population of high-quality, non-callable, corporate bond issues with maturity dates of six months to thirty years. Bond issues in the population are rated no less than Aa by Moody’s Investor Services or AA by Standard & Poors. A single equivalent discount rate reflects the matching of the plan liability cash flows to the yield curve. Prior to 2005, the discount rate assumption was based on the investment yields available at year-end on corporate long-term bonds rated no less than Aa by Moody’s Investor Services or AA by Standard & Poors.
The expected return on plan assets reflects asset allocations, investment strategies and the views of investment managers over a long-term perspective. Retirement and mortality rates are based on anticipated future plan experience. The effects of actual results differing from our assumptions are accumulated and amortized over future periods and, therefore, generally affect our recognized expense in future periods. Our unrecognized
31
actuarial loss on our pension plan has grown to $5,180 primarily due to the lowering of the discount rate in recent years. Significant differences in actual experience or significant changes in assumptions may materially affect pension obligations.
In determining our pension obligations for 2005, our discount rates decreased from 5.75 percent at year-end 2004 to 5.50 percent while we also updated our mortality assumptions to better reflect recent trends. The decrease in the discount rate, lower expected returns on plan assets from 8.50% to 8.00%, and updated mortality rates are expected to result in higher pension expense in 2006; however, given current assumptions, pension expense should be lower in future periods due to freezing plan benefits in 2002.
We estimate our liability for worker’s compensation and auto self-insurance plans by applying insurance industry standard loss development factors to projected and experienced claims information. Significant changes in claims activity would have a direct impact on the amount of expense we recognize in association with these self-insurance programs.
We maintain a provision for inventory obsolescence to reflect the potential for equipment and supply obsolescence due to equipment recalls, new product introductions, manufacturer defects and other events which may impact the value of inventory items. We determine this provision by analyzing inventory use regularly and assigning reserve percentages based upon inventory turnover and manufacturer activities related to new product introductions. Significant product recalls and/or next generation technology introductions may cause a portion of our inventory to become obsolete. Such activity would lead to increased expense related to inventory obsolescence.
In the normal course of business, we make estimates of potential future loss accruals related to legal, tax, vehicle lease loss and pension matters. These accruals require the use of management’s judgment on the outcome of various issues. Management’s estimates for these items are based on the best available evidence, but due to changes in facts and circumstances, the ultimate outcomes of these accruals could be different than management estimates.
ACQUISITIONS
As part of our growth strategy, we regularly review and evaluate potential acquisition opportunities.
On March 24, 2004, we completed the acquisition of Affiliated Clinical Engineering Services, Inc. (“ACES”), located in Boston, Massachusetts. The purchase price was approximately $4.2 million.
On April 15, 2004, we completed the acquisition of certain assets from Galaxy Medical Products, Inc., headquartered in Akron, Ohio. The purchase price was approximately $4.9 million.
32
On May 4, 2004, we completed the acquisition of substantially all of the assets of Advanced Therapeutics of Wisconsin, Inc., headquartered in Milwaukee, Wisconsin. The purchase price was approximately $5.1 million.
On August 31, 2004, we completed the acquisition of certain assets of Cardinal Health 200, Inc., headquartered in Naperville, Illinois. The purchase price was approximately $0.9 million.
On December 22, 2005, we completed the acquisition of substantially all the assets of Innovative Healthcare Solutions, Inc., headquartered in Esko, Minnesota. The purchase price was approximately $1.1 million.
We financed the above acquisitions with borrowings under our available credit facilities.
33
RESULTS OF OPERATIONS
The following table provides information on the percentages of certain items of selected financial data compared to total revenues and also indicates the percentage increase or decrease of this information over the prior comparable period.
| | | | | | | | | | | | | | | |
| | | Percentage of Total Revenues | | | Percentage Increase (Decrease) | |
| | | Years Ended December 31, | | | Year Ended 2004 over Year Ended 2003 | | | Year
Ended
2005 over
Year
Ended 2004 | |
| | | 2003 | | | 2004 | | | 2005 | | | |
Revenues: | | | | | | | | | | | | | | | |
Medical equipment outsourcing | | 82.0 | % | | 78.4 | % | | 77.7 | % | | 11.6 | % | | 7.2 | % |
Technical and professional services | | 8.6 | | | 12.8 | | | 13.7 | | | 73.9 | | | 16.3 | |
Medical equipment sales and remarketing | | 9.4 | | | 8.8 | | | 8.6 | | | 9.4 | | | 5.4 | |
| | | | | | | | | | | | | | | |
Total revenues | | 100.0 | | | 100.0 | | | 100.0 | | | 16.7 | | | 8.2 | |
Cost of outsourcing and sales: | | | | | | | | | | | | | | | |
Cost of equipment outsourcing | | 24.8 | | | 23.6 | | | 24.3 | | | 11.2 | | | 11.3 | |
Movable medical equipment depreciation | | 18.8 | | | 18.0 | | | 17.6 | | | 12.1 | | | 5.5 | |
Cost of technical and professional services | | 5.4 | | | 8.7 | | | 10.1 | | | 85.9 | | | 26.5 | |
Cost of medical equipment sales and remarketing | | 6.8 | | | 6.7 | | | 6.8 | | | 15.2 | | | 10.5 | |
| | | | | | | | | | | | | | | |
Gross margin | | 44.2 | | | 43.0 | | | 41.2 | | | 13.5 | | | 3.5 | |
Selling, general and administrative: | | | | | | | | | | | | | | | |
Recapitalization, stock compensation and severance expenses | | 8.4 | | | — | | | — | | | — | | | — | |
Other selling, general and administrative | | 27.5 | | | 28.9 | | | 27.1 | | | 22.9 | | | 1.3 | |
| | | | | | | | | | | | | | | |
Total selling, general and administrative | | 35.9 | | | 28.9 | | | 27.1 | | | (5.9 | ) | | 1.3 | |
Interest expense | | 11.8 | | | 15.3 | | | 14.4 | | | 50.7 | | | 2.0 | |
Loss on early retirement of debt | | 7.8 | | | — | | | — | | | — | | | — | |
| | | | | | | | | | | | | | | |
Loss before income taxes | | (11.3 | ) | | (1.2 | ) | | (0.3 | ) | | — | | | — | |
| | | | | | | | | | | | | | | |
Income taxes | | 0.2 | | | 0.6 | | | 0.3 | | | — | | | — | |
| | | | | | | | | | | | | | | |
Net loss | | (11.4 | )% | | (1.8 | )% | | (0.6 | )% | | — | | | — | |
| | | | | | | | | | | | | | | |
Comparison of the year ended December 31, 2005, to the year ended December 31, 2004
Medical Equipment Outsourcing – Manage & Utilize
| | | | | | | | | | | | | | |
| | | Year ended December 31, | | | | |
(dollars in thousands) | | 2005 | | | 2004 | | | Change | | % Change | |
Total Revenue | | $ | 167,687 | | | $ | 156,490 | | | $ | 11,197 | | 7.2 | % |
Cost of Revenue | | | 52,499 | | | | 47,178 | | | | 5,321 | | 11.3 | |
Movable Medical Equipment Depreciation | | | 37,966 | | | | 36,003 | | | | 1,963 | | 5.5 | |
| | | | | | | | | | | | | | |
Gross Margin | | $ | 77,222 | | | $ | 73,309 | | | $ | 3,913 | | 5.3 | % |
| | | | |
Gross Margin % | | | 46.1 | % | | | 46.8 | % | | | | | | |
Total revenue in the Medical Equipment Outsourcing segment rose $11.2 million, or 7.2%, to $167.7 million in 2005. This increase was driven by growth in our acute care customer base, increased activity in our AMPP customers, and incremental business from new and existing technology in our fleet, offsetting weak hospital census and the impacts of equipment recalls.
34
Total cost of revenue in the segment rose $5.3 million, or 11.3%, to $52.5 million in 2005. This increase is primarily attributable to higher employee-related costs of $1.5 million due to increased headcount, worker’s compensation costs and higher benefits costs. Facilities and occupancy expenses rose $1.2 million in association with office expansions and relocations as well as higher utility rates. Other increases in this area include repair expenses of $1.2 million, gasoline and other fleet expenses of $0.6 million, freight expenses of $0.6 million and other unfavorable cost variances of $0.2 million, all primarily driven by increased business activity.
Movable medical equipment depreciation increased $2.0 million, or 5.5%, to $38.0 million in 2005. This increase primarily reflects an increase in the average total value of rental equipment during the year.
Gross margin from the Medical Equipment Outsourcing segment for the year ended December 31, 2005, was $77.2 million, representing a $3.9 million, or 5.3% increase from medical equipment outsourcing gross margin of $73.3 million for 2004. Gross margin percentage for the Medical Equipment Outsourcing segment decreased from 46.8% in 2004 to 46.1% in 2005. This decrease is primarily attributable to higher employee-related, repair, occupancy and fleet costs and weak hospital census.
Technical and Professional Services – Plan & Acquire/Maintain & Repair
| | | | | | | | | | | | | | | |
| | | Year ended December 31, | | | | |
(dollars in thousands) | | 2005 | | | 2004 | | | Change | | | % Change | |
Total Revenue | | $ | 29,654 | | | $ | 25,491 | | | $ | 4,163 | | | 16.3 | % |
Cost of Revenue | | | 21,878 | | | | 17,295 | | | | 4,583 | | | 26.5 | |
| | | | | | | | | | | | | | | |
Gross Margin | | $ | 7,776 | | | $ | 8,196 | | | $ | (420 | ) | | (5.1 | )% |
| | | | |
Gross Margin % | | | 26.2 | % | | | 32.2 | % | | | | | | | |
Total revenue in the Technical and Professional Services segment rose $4.2 million, or 16.3%, to $29.7 million in 2005. This revenue increase resulted from growth in our supplemental, or response-based, business of $2.6 million and manufacturer services business of $0.4 million. These product lines are transactional in nature and such results reflect increased customer demand. We also experienced growth in our resident-based programs of $1.2 million, reflecting higher resident program count and increased activity at existing customers. Fiscal 2005 also benefited from a full year of contribution from the acquisition of ACES, which was not represented in the first quarter of 2004.
35
Total cost of revenue in the segment rose $4.6 million, or 26.5%, to $21.9 million in 2005. This increase is primarily attributable to greater average technician headcount generating higher employee-related costs of $3.0 million and higher repair costs of $1.6 million.
Gross margin from the Technical and Professional Services segment for the year ended December 31, 2005, totaled $7.8 million, representing a $0.4 million, or 5.1%, decrease from technical and professional services gross margin of $8.2 million for 2004. Gross margin percentage for the Technical and Professional Services segment decreased from 32.2% in 2004 to 26.2% in 2005. This decrease is primarily due to increased competition, in addition to the loss of revenue from a financially-distressed customer during 2005 and increased staffing costs related to the building of our equipment lifecycle services platform. We believe margin levels experienced in 2004 are not sustainable going forward due to increased competition.
Medical Equipment Sales and Remarketing – Redeploy & Remarket
| | | | | | | | | | | | | | | |
| | | Year ended December 31, | | | | |
(dollars in thousands) | | 2005 | | | 2004 | | | Change | | | % Change | |
Total Revenue | | $ | 18,563 | | | $ | 17,619 | | | $ | 944 | | | 5.4 | % |
Cost of Revenue | | | 14,706 | | | | 13,307 | | | | 1,399 | | | 10.5 | |
| | | | | | | | | | | | | | | |
Gross Margin | | $ | 3,857 | | | $ | 4,312 | | | $ | (455 | ) | | (10.6 | )% |
| | | | |
Gross Margin % | | | 20.8 | % | | | 24.5 | % | | | | | | | |
Total revenue in the Medical Equipment Sales and Remarketing segment rose $0.9 million, or 5.4%, to $18.6 million in 2005. This increase was caused by higher new equipment sales of $1.1 million and higher fleet and used equipment sales of $1.6 million, partially offset by reduced sales of disposable items of $1.8 million. These results are consistent with our strategy to reduce activity with disposable products and continue to grow new and used equipment sales.
Total cost of revenue in the segment rose $1.4 million, or 10.5%, to $14.7 million in 2005. This increase is primarily attributable to higher costs of new equipment sales of $1.7 million, used and brokerage equipment of $1.0 million and repair and logistic costs of $0.3 million partially offset by reduced costs of disposable goods sold of $1.6 million.
Gross margin from the Medical Equipment Sales and Remarketing segment for the year ended December 31, 2005, was $3.9 million, representing a $0.4 million or 10.6% decrease from Medical Equipment Sales and Remarketing gross margin of $4.3 million for the same period of 2004. Gross margin percentage for the Medical Equipment Sales and Remarketing segment decreased from 24.5% in 2004 to 20.8% in 2005. Margins in this segment will fluctuate based on equipment mix and used equipment availability, which was constrained in the first quarter of 2005 by robust demand in our outsourcing
36
segment where for-sale inventory was converted to our rental fleet. Additionally, a recall of Baxter’s Colleague infusion pump line resulted in higher rental utilization of older infusion pump models which typically would have been sold.
Selling, General and Administrative Expenses
Selling, general and administrative expenses increased $0.7 million, or 1.3%, to $58.5 million in 2005 primarily attributable to recruiting, relocation and severance costs related to the realignment of our sales and operations organizations of $0.7 million. Increases in other expenses in this area were mitigated by the effects of continuous improvement efforts and cost controls implemented during the second half of 2005 that resulted in reduced employee-related and travel expenses. Selling, general and administrative expenses as a percentage of total revenue decreased to 27.1% in 2005 from 28.9% for 2004.
Interest Expense
Interest expense rose $0.6 million, or 2.0%, to $31.1 million in 2005. The increase in interest expense reflects increased borrowing as well as higher interest rates. Average total borrowings in 2005 increased to $298.6 million from $288.2 million for 2004, primarily due to the timing of the acquisitions in the first half of 2004. Our average effective interest rate on variable rate debt increased from 5.5% to 6.6% during 2005.
Income Taxes
Tax expense for 2005 was $0.8 million versus $1.2 million for 2004. Income tax expense relates primarily to valuation allowances established for net operating losses not recognized as well as minimum state taxes.
Net Loss
Net loss improved $2.0 million, or 56.3%, to $1.6 million in 2005. The improvement is primarily due to increased revenue generating higher gross margin of $3.0 million partially offset by increased selling, general and administrative costs of $0.7 million and interest expense of $0.6 million. Net loss in 2005 was also impacted by increased worker’s compensation and auto insurance costs of $0.7 million offset by lower income tax expense of $0.4 million.
EBITDA
EBITDA for the year ended December 31, 2005, was $75.0 million, representing a $6.5 million, or 9.5%, increase from $68.5 million for the same period of 2004. This increase resulted primarily from increased revenue generating higher gross margin of $3.0 million. EBITDA also benefited by $1.2 million related to the recording of certain qualified leased vehicles as capital leases.
37
EBITDA is defined as earnings before interest expense, income taxes, depreciation and amortization. Management understands that some industry analysts and investors consider EBITDA as a supplementary non-GAAP financial measure useful in analyzing a company’s ability to service debt. EBITDA, however, is not a measure of financial performance under GAAP and should not be considered as an alternative to, or more meaningful than, net income as a measure of operating performance or to cash flows from operating, investing or financing activities or as a measure of liquidity. Since EBITDA is not a measure determined in accordance with GAAP and is thus susceptible to varying interpretations and calculations, EBITDA, as presented, may not be comparable to other similarly titled measures of other companies. EBITDA does not represent an amount of funds that is available for management’s discretionary use.
For a reconciliation of EBITDA to net cash provided by operating activities, see note (2) under “Item 6 -Selected financial data.”
Comparison of the year ended December 31, 2004, to the year ended December 31, 2003
Medical Equipment Outsourcing – Manage & Utilize
| | | | | | | | | | | | | | |
| | | Year ended December 31, | | | | |
(dollars in thousands) | | 2004 | | | 2003 | | | Change | | % Change | |
Total Revenue | | $ | 156,490 | | | $ | 140,233 | | | $ | 16,257 | | 11.6 | % |
Cost of Revenue | | | 47,178 | | | | 42,427 | | | | 4,751 | | 11.2 | |
Movable Medical Equipment Depreciation | | | 36,003 | | | | 32,111 | | | | 3,892 | | 12.1 | |
| | | | | | | | | | | | | | |
Gross Margin | | $ | 73,309 | | | $ | 65,695 | | | $ | 7,614 | | 11.6 | % |
| | | | |
Gross Margin % | | | 46.8 | % | | | 46.8 | % | | | | | | |
Medical equipment outsourcing revenues for the year ended December 31, 2004, were $156.5 million, representing a $16.3 million, or 11.6%, increase from medical equipment outsourcing revenues of $140.2 million for the same period of 2003. This growth was driven primarily by continued penetration of existing customers, a 5.0% increase in total customers, our re-entry into the bariatrics marketplace, the acquisitions of certain assets of Galaxy Medical Products, Inc. and Advanced Therapeutics of Wisconsin, Inc., and increased revenue from the net addition of two new AMPP programs.
Cost of medical equipment outsourcing for the year ended December 31, 2004, was $47.2 million, representing a $4.8 million, or 11.2%, increase from cost of medical equipment outsourcing of $42.4 million for 2003. This increase was driven by an increase in delivery and processing costs of $2.7 million as well as higher supply costs associated with increased volume.
38
Movable medical equipment depreciation for the year ended December 31, 2004, was $36.0 million, representing a $3.9 million, or 12.1%, increase from movable medical equipment depreciation of $32.1 million for the same period of 2003. This increase was a result of current year movable medical equipment additions of $41.3 million.
Gross margin from the Medical Equipment Outsourcing segment for the year ended December 31, 2004, was $73.3 million, representing a $7.6 million, or 11.6%, increase from medical equipment outsourcing gross margin of $65.7 million for the same period of 2003. Gross margin percentage for the Medical Equipment Outsourcing segment was 46.8% for both 2003 and 2004.
Technical and Professional Services – Plan & Acquire/Maintain & Repair
| | | | | | | | | | | | | | |
| | | Year ended December 31, | | | | |
(dollars in thousands) | | 2004 | | | 2003 | | | Change | | % Change | |
Total Revenue | | $ | 25,491 | | | $ | 14,662 | | | $ | 10,829 | | 73.9 | % |
Cost of Revenue | | | 17,295 | | | | 9,306 | | | | 7,989 | | 85.9 | |
| | | | | | | | | | | | | | |
Gross Margin | | $ | 8,196 | | | $ | 5,356 | | | $ | 2,840 | | 53.0 | % |
| | | | |
Gross Margin % | | | 32.2 | % | | | 36.5 | % | | | | | | |
Technical and professional service revenues for the year ended December 31, 2004, were $25.5 million, representing a $10.8 million, or 73.9%, increase from service revenues of $14.7 million for the same period of 2003. This growth was driven by our increased focus on providing additional services to our existing equipment outsourcing customers and equipment manufacturers and the acquisitions of Affiliated Clinical Engineering Services, Inc. and certain assets of Cardinal Health 200, Inc.
Cost of technical and professional services for the year ended December 31, 2004, totaled $17.3 million, representing an $8.0 million, or 85.9%, increase from cost of technical and professional services of $9.3 million for the same period of 2003. This increase was primarily driven by increased volume and the acquisition of the lower margin ACES business.
Gross margin from the Technical and Professional Services segment for the year ended December 31, 2004, totaled $8.2 million, representing a $2.8 million, or 53.0%, increase from technical and professional services gross margin of $5.4 million for 2003. Gross margin percentage for the Technical and Professional Services segment decreased to 32.2% in 2004 from 36.5% in 2003.
39
Medical Equipment Sales and Remarketing – Redeploy & Remarket
| | | | | | | | | | | | | | | |
| | | Year ended December 31, | | | | |
(dollars in thousands) | | 2004 | | | 2003 | | | Change | | | % Change | |
Total Revenue | | $ | 17,619 | | | $ | 16,110 | | | $ | 1,509 | | | 9.4 | % |
Cost of Revenue | | | 13,307 | | | | 11,554 | | | | 1,753 | | | 15.2 | |
| | | | | | | | | | | | | | | |
Gross Margin | | $ | 4,312 | | | $ | 4,556 | | | $ | (244 | ) | | (5.4 | )% |
| | | | |
Gross Margin % | | | 24.5 | % | | | 28.3 | % | | | | | | | |
Medical equipment sales and remarketing revenues for the year ended December 31, 2004, were $17.6 million, representing a $1.5 million, or 9.4%, increase from sales of supplies and equipment, and other of $16.1 million for the same period of 2003. Growth in this segment relates to a $2.5 million increase in equipment sales offset by a $1.0 million decline in sales of disposable goods.
Cost of medical equipment sales and remarketing for the year ended December 31, 2004, was $13.3 million, representing a $1.7 million or 15.2% increase from cost of medical equipment sales and remarketing of $11.6 million for the same period of 2003. This increase was driven by increased sales volume coupled with a shift toward lower margin products and continued rationalization of disposable sales. Cost of equipment sales and remarketing represented 75.5% and 71.7% of segment revenues for the years ended December 31, 2004, and December 31, 2003, respectively.
Gross margin from the Medical Equipment Sales and Remarketing segment for the year ended December 31, 2004, was $4.3 million, representing a $0.3 million or 5.4% decrease from Medical Equipment Sales and Remarketing gross margin of $4.6 million for the same period of 2003. Gross margin percentage for the Medical Equipment Sales and Remarketing segment decreased from 28.3% to 24.5% in 2004.
Selling, General and Administrative Expenses
Other selling, general and administrative expenses for the year ended December 31, 2004, were $57.7 million, representing a $10.7 million, or 22.9%, increase from $47.0 million for the same period of 2003. Other selling, general and administrative expenses as a percentage of total revenue increased to 28.9% from 27.5% for the same period of 2003 as a result of higher spending to transition UHS from a focus on supplemental rental to a full medical equipment lifecycle company. These expenses include increases of $4.9 million of costs related to strengthening our corporate infrastructure, $4.6 million in costs related to upgrading and separating our sales and customer service organizations, $0.7 million in other intangible amortization, and $0.4 million in facilities costs associated with office relocations.
In 2003, we recorded a $14.4 million charge related to the recapitalization that occurred on October 17, 2003. (For a summary of the recapitalization, see Item 6 of our Form 10-K for the fiscal year ended December 31, 2003.) Recapitalization expenses consisted primarily of compensation expenses associated with the purchase of vested stock options of $11.3 million and miscellaneous fees and expenses of approximately $2.5 million and severance expense of $0.6 million.
40
Interest Expense
Interest expense for the year ended December 31, 2004, was $30.5 million, representing a $10.3 million, or 50.7%, increase from interest expense of $20.2 million for the same period of 2003. This increase is attributable to a full year of interest expense related to our 10.125% senior notes due 2011 that were issued in November 2003 as well as increased borrowings under our senior secured credit facility. Total average borrowings increased to $288.2 million in 2004 from $218.9 million in 2003.
Loss on Early Retirement of Debt
In connection with the 2003 recapitalization we incurred a $13.3 million loss on early retirement of debt. Of this $13.3 million, $6.9 million related to the call premium associated with the early redemption of 10.25% senior notes due 2008 and $6.4 million for the write-off of unamortized deferred financing costs associated with the retired debt. We incurred no such charges in 2004.
Income Taxes
Tax expense for 2004 was $1.2 million, representing an increase of $0.9 million, or 332.0%, from income tax expense of $0.3 million for the same period of 2003. Income tax expense relates primarily to valuation allowances established for net operating losses not recognized as well as minimum state taxes.
Net Loss
We incurred a net loss of $3.6 million in 2004, representing a $15.9 million decrease from the net loss of $19.5 million in 2003. The decreased net loss is attributable to the absence of $27.7 million of charges associated with the November 2003 recapitalization, partially offset by higher interest expenses also associated with the recapitalization and higher income tax expense.
EBITDA
EBITDA for the year ended December 31, 2004, was $68.5 million, representing a $32.0 million, or 88%, increase from $36.5 million for the same period of 2003. This increase is due to revenue growth, generating higher gross margin of $10.2 million and the absence of $27.7 million of recapitalization costs in 2004.
For a reconciliation of EBITDA to net cash provided by operating activities, see note (2) under “Item 6 -Selected financial data.”
41
LIQUIDITY AND CAPITAL RESOURCES
Amended and Restated Credit Agreement
General
On May 26, 2005, we entered into an Amended and Restated Credit Agreement (“Amended Credit Agreement”) with a bank group led by General Electric Capital Corporation. The Amended Credit Agreement increases the aggregate amount we may obtain under revolving loans, reduces the applicable borrowing spreads, extends the maturity date, and modifies the financial covenants to provide more operating flexibility.
Under the terms of the Amended Credit Agreement, the aggregate amount we may obtain under our revolving loans increased from $100 million to $125 million. Availability under the Amended Credit Agreement as of December 31, 2005, was approximately $73 million, representing our borrowing base of approximately $113 million less borrowings of $38 million and outstanding letters of credit of $2 million at that date. Borrowings under the Amended Credit Agreement are collateralized by substantially all of our assets.
Amounts borrowed under the Amended Credit Agreement generally bear interest on a LIBOR-based formula. The interest rate currently is 2.25 percentage points over LIBOR with the interest rate margin subject to change based upon quarterly leverage ratios. Amounts previously outstanding under the prior credit agreement generally bore interest at a rate of 3.00 percentage points over LIBOR. The terms of the Amended Credit Agreement also extended the maturity from October 2008 to May 2010. Amounts borrowed under the Amended Credit Agreement are due at the end of the five year term.
The Amended Credit Agreement contains certain covenants, including restrictions and limitations on dividends, liens, leases, incurrence or guarantees of debt, transactions with affiliates, investments or loans, and mergers, acquisitions, consolidations and asset sales. Furthermore, we are required to maintain compliance with certain financial covenants, including a maximum senior debt leverage ratio and a minimum interest coverage ratio. As of December 31, 2005, we were in compliance with all covenants under the Amended Credit Agreement. (See “Covenants Under Our Amended Credit Agreement” below.)
Covenants Under Our Amended Credit Agreement
Our senior secured credit facility provided under our Amended Credit Agreement is secured by substantially all of our assets and the assets of some of our future subsidiaries, if any, and by a pledge of all of the capital stock of some of our future subsidiaries, if any. Our ability to borrow under the senior secured credit facility is governed by a borrowing base composed of certain of our accounts receivable and equipment inventory.
Our senior secured credit facility contains affirmative covenants relating to prepayment of our loans upon the occurrence of certain events; access to records and personnel; payment of taxes; delivery of financial statements and reports and agreements with landlords; maintenance of corporate existence and conduct of business; payment of obligations; maintenance of books and records, insurance and rights to intellectual property; compliance with laws, including environmental laws and permits; and indemnification of the lenders under the credit facility for certain claims made against them relating to the credit facility.
42
The senior credit facility also contains negative covenants which restrict and limit our ability and the ability of our future subsidiaries (we currently have no subsidiaries), if any, with respect to, among other things:
| | • | | Entering into merger or similar transactions. We and our subsidiaries are generally precluded from forming or acquiring any subsidiary, entering into any merger or acquiring all or substantially all of the assets or stock of any other entity, subject to certain limited exceptions. If we or a subsidiary are permitted to form a subsidiary, that subsidiary will be required to guarantee our obligations under our senior secured credit facility. |
| | • | | Making investments, loans and advances. We and our subsidiaries are generally not permitted to have or make investments, or to have or make loans or advances, in any other entity other than: |
| | • | | extensions of credit in the ordinary course of business; |
| | • | | investments in certain cash equivalent investments, including, without limitation, certain securities maturing within 360 days that are issued or fully guaranteed by the United States government, certain certificates of deposit, eurodollar time deposits and bank deposits, certain repurchase obligations of lenders under our senior secured credit facility and other qualified parties, certain commercial paper, certain securities backed by standby letters of credit and certain specified shares of money market mutual or similar funds; |
| | • | | loans and advances to our or any of our subsidiaries’ officers and employees for travel, entertainment and relocation expenses in the ordinary course of business not to exceed $2,000,000; |
| | • | | investments by us in any of our subsidiaries, and investments among our subsidiaries in each other; |
| | • | | specified investments held by us on May 26, 2005; |
| | • | | specified intercompany indebtedness; |
| | • | | investments (including, without limitation, debt obligations) that we and our subsidiaries receive in connection with the bankruptcy proceedings of our suppliers and customers and in settlement of other disputes arising in the ordinary course of business; |
| | • | | promissory notes we acquire in connection with specified asset sales; |
43
| | • | | certain permitted acquisitions; and |
| | • | | other additional investments entered into by us and our subsidiaries not exceeding $1,000,000 at any time outstanding. |
| | • | | Incurring indebtedness. We and our subsidiaries are generally only entitled to incur or have debt to the extent such debt is: |
| | • | | secured by purchase money security interests and capital leases permitted under our senior secured credit facility; |
| | • | | incurred under the senior secured credit facility; |
| | • | | outstanding under the indenture governing the notes in an amount not to exceed $325 million; |
| | • | | related to unfunded pension fund and other employee benefit plan obligations to the extent they are permitted to remain unfunded under applicable law; |
| | • | | specified existing indebtedness: (a) owed by us to any of our subsidiaries which is also a guarantor under our senior secured credit facility or (b) owed by any of our subsidiaries to us or any other guarantor under the senior secured credit facility; |
| | • | | incurred under any interest rate agreements or similar agreements; |
| | • | | owed to another entity arising in connection with an acquisition permitted under our senior secured credit facility, not to exceed $10 million at any time outstanding and subject to other specified limitations; |
| | • | | subordinated debt which we owe to JWC Fund I, JWC Fund III or Halifax; and |
| | • | | additional indebtedness owed by us and our subsidiaries not exceeding $4,000,000 in aggregate principal amount at any time outstanding. |
In addition, neither we nor any of our subsidiaries are permitted to incur any indebtedness (other than our obligations under our senior secured credit facility) under any “Credit Facilities” (as defined in the indenture governing the notes), and we and our subsidiaries are prohibited from repaying any amount in respect to certain specified indebtedness.
44
| | • | | Entering into affiliate transactions. We and our subsidiaries are generally not permitted to enter into transactions with any affiliates that are not on an arm’s length basis. However, this restriction does not apply to: |
| | • | | advances to our or our subsidiaries’ officers or employees to the extent permitted; |
| | • | | restricted payments (including dividends and other distributions) to the extent permitted; |
| | • | | transactions between us and our subsidiaries to the extent permitted; |
| | • | | employment arrangements entered into in the ordinary course of business with our and our subsidiaries’ members of the board of directors and officers; |
| | • | | our stockholders’ agreement; and |
| | • | | the payment of management fees to the extent permitted. |
| | • | | Changing our capital structure or the nature of our business. We and our subsidiaries are generally not permitted to: |
| | • | | make any changes in any of our business objectives or operations that could in any way adversely affect the repayment of loans or any of our other obligations under our senior secured credit facility or otherwise be reasonably expected to have a material adverse effect; |
| | • | | make any change in our capital structure, including the issuance or sale of any shares of stock, warrants or other securities convertible into stock, with limited exceptions; |
| | • | | amend our charter or bylaws in a manner that would adversely affect General Electric Capital Corporation or the lenders under our senior secured credit facility or our ability to repay our obligations under our senior secured credit facility; and |
| | • | | engage in any business other than the business we are currently engaged in and other related businesses, including, without limitation, the leasing of medical equipment. |
| | • | | Incurring guaranteed indebtedness. Subject to limited exceptions, neither we nor our subsidiaries are permitted to have or incur guaranteed indebtedness except to the extent such indebtedness is: |
| | • | | incurred by endorsement of items of payment for deposit to our or any of our subsidiaries’ general account; |
45
| | • | | guaranteed indebtedness incurred for the benefit of us or any of our subsidiaries if the primary obligation is expressly permitted by our senior secured credit facility; |
| | • | | certain specified guaranteed indebtedness in existence on May 26, 2005; |
| | • | | any guaranty or other similar agreement in favor of General Electric Capital Corporation in connection with the transactions contemplated by our senior secured credit facility; and |
| | • | | any unsecured guaranty or other similar agreement in favor of the holders of the initial notes, to the extent required by the indenture governing the notes. |
| | • | | Granting liens. We and our subsidiaries are generally only entitled to grant liens, or permit them to exist, to the extent such liens are: |
| | • | | for taxes or assessments or other governmental charges not yet due and payable or which are being contested in accordance with the terms of our senior secured credit facility; |
| | • | | pledges or deposits of money securing statutory obligations under workmen’s compensation, unemployment insurance, social security or public liability laws or similar legislation (excluding liens under ERISA); |
| | • | | pledges or deposits of money which secure bids, tenders, contracts (other than contracts for the payment of money) or leases to which we or any of our subsidiaries are a party as lessee made in the ordinary course of business; |
| | • | | inchoate and unperfected workers’, mechanics’ or similar liens arising in the ordinary course of business, so long as they attach only to equipment, fixtures and/or real estate; |
| | • | | carriers’, warehousemen’s, suppliers’ or other similar possessory liens arising in the ordinary course of business and securing liabilities in an outstanding aggregate amount not in excess of $250,000, so long as such liens attach only to inventory; |
| | • | | deposits securing surety, appeal or customs bonds in proceedings to which we or any of our subsidiaries are a party; |
46
| | • | | any attachment or judgment lien not constituting an event of default under our senior secured credit facility; |
| | • | | zoning restrictions, easements, licenses or other restrictions on the use of any real estate or other minor irregularities with respect to title to real estate, subject to certain limitations; |
| | • | | presently existing or future liens in favor of General Electric Capital Corporation, on behalf of the lenders under our senior secured credit facility; |
| | • | | licenses, leases or subleases granted to other persons not interfering in any material respect with our business or any of our subsidiaries’ businesses; |
| | • | | bankers’ liens, rights of setoff and similar liens incurred on deposits made in the ordinary course of business; |
| | • | | liens arising from precautionary UCC financing statements regarding operating leases; |
| | • | | specified liens in existence on May 26, 2005; |
| | • | | liens created by conditional sale or other title retention agreements (including capital leases) or in connection with purchase money indebtedness with respect to certain equipment and fixtures acquired by us or any of our subsidiaries in the ordinary course of business, involving the incurrence of not more than $10 million and subject to specified exceptions; and |
| | • | | other liens securing indebtedness not in excess of $500,000 at any time outstanding. |
In addition, we and our subsidiaries which become guarantors of the senior secured credit facility are prohibited from entering into any agreement which would prevent us from granting a lien to secure the obligations under the senior secured credit facility, subject to certain exceptions.
| | • | | Selling stock and assets. We and our subsidiaries are generally not permitted to dispose of any of our property, business or assets (including, without limitation, receivables and leasehold interests), or in the case of any of our subsidiaries, such subsidiary may not issue or sell any shares of such subsidiary’s capital stock to any person other than to us or any of our wholly-owned subsidiaries, except for: |
| | • | | the disposition of inventory, equipment and leases in the ordinary course of business, other than obsolete or worn out property; |
47
| | • | | the disposition of obsolete or worn out property in the ordinary course of business for proceeds consisting of not less than (a) 75% cash and (b) indebtedness evidenced by promissory notes; |
| | • | | other dispositions of assets not described above for proceeds consisting of not less than (a) 75% cash and (b) indebtedness evidenced by promissory notes, subject to certain dollar amounts provided that such sales shall not exceed $5 million in any fiscal year; |
| | • | | the lease by us and our subsidiaries (as lessee) and license of real or personal property in the ordinary course of business (so long as such lease is not a capital lease not otherwise permitted by our senior secured credit facility); |
| | • | | specified investments, acquisitions and transfers or dispositions of properties; |
| | • | | the sale or discount of accounts receivable arising in the ordinary course of business in connection with the collection of such receivables; |
| | • | | certain other identified acquisitions and sale-leaseback transactions; |
| | • | | the disposition of real estate by us or any of our subsidiaries; |
| | • | | the sale or issuance of any of our subsidiaries’ capital stock to us or any of our other wholly-owned subsidiaries; and |
| | • | | dispositions of property to us or to any of our wholly-owned subsidiaries. |
| | • | | Engaging in sale-leaseback or similar transactions. Neither we nor any of our subsidiaries are permitted to engage in any sale-leaseback, synthetic lease or similar transaction involving any of our assets unless: |
| | • | | each such sale-leaseback, synthetic lease and each such similar transaction is an arms-length transaction; and |
| | • | | the aggregate consideration we and our subsidiaries receive in connection with the disposition of certain rental equipment, wholesale inventory, repair or replacement parts purchased by us or any of our subsidiaries pursuant to such transactions does not exceed $3,000,000. |
| | • | | Canceling our indebtedness. We and our subsidiaries are not permitted to cancel any debt owing to us, except for reasonable consideration negotiated on an arm’s length basis and in the ordinary course of business. |
48
| | • | | Paying dividends or making other distributions. We and our subsidiaries are generally not permitted to pay dividends or make other distributions except: |
| | • | | dividends and distributions paid to us by any of our subsidiaries; |
| | • | | employee loans and advances permitted under our senior secured credit facility; |
| | • | | payments of management fees pursuant to the management agreements we are party to with J.W. Childs Associates, L.P. and the general partner of Halifax, subject to certain dollar amounts and other limitations; |
| | • | | the redemption or repurchase for fair value in cash of our stock (or options to purchase capital stock) from any of our employees upon the death, disability, retirement or other termination of such employee, subject to certain dollar amounts and other limitations; and |
| | • | | dividends or other distributions in the form of, or with respect to, certain subordinated promissory notes issued to JWC Fund I, JWC Fund III or Halifax, to the extent permitted to be issued pursuant our senior secured credit facility. |
In addition, neither we nor any of our subsidiaries may enter into an agreement or other obligation (other than our senior secured credit facility, the related loan documents and the indenture governing the notes) which could prohibit or require the consent of any person with respect to the payment of dividends or distributions or the making or repayment of intercompany loans by one of our subsidiaries to us.
| | • | | Engaging in speculative transactions. We and our subsidiaries are not permitted to engage in any transaction involving commodity options, futures contracts or similar transactions, except to hedge against fluctuations in commodities prices, the values of foreign currencies receivable, interest swaps, caps or collars. |
| | • | | Amending the terms of our subordinated debt and certain agreements. In general, neither we nor any of our subsidiaries are permitted to amend the following: |
| | • | | the terms of any subordinated debt if the effect of such amendment is to (a) increase the interest rate to the extent interest is payable in cash; (b) change the due dates of principal or interest payments; (c) change any default or event of default provision unless by deletion or making it less restrictive, or any redemption or prepayment provision other than to extend the date therefore or reduce premiums payable in connection therewith: (d) add any covenant; (e) grant any collateral to secure payment; (f) grant any security; or (g) change any other term resulting in a material increase in the obligations thereunder; |
49
| | • | | the terms of the indenture governing the notes, subject to certain exceptions; and |
| | • | | certain other agreements, including, without limitation, certain stock purchase agreements and repurchase agreements, our stockholders’ agreement, or the management agreements we are party to with J.W. Childs Associates, L.P. and the general partner of Halifax, in each case subject to certain exceptions. |
| | • | | Changing our name, location or fiscal year. We and our subsidiaries are prohibited from changing our name, certain other aspects of our corporate identity or locations of collateral securing our obligations under the senior credit facility and records pertaining to such collateral, in each case without 30 days notice to General Electric Capital Corporation. We and our subsidiaries are also prohibited from changing our fiscal year end from December 31. |
In addition, our senior secured credit facility requires that we comply with the following financial covenants:
| | • | | Minimum interest coverage ratio. We and our subsidiaries must maintain on a consolidated basis at each date set forth below, a ratio of EBITDA (as defined in our Amended Credit Agreement) to interest expense (as defined in our Amended Credit Agreement) of not less than 2.00 to 1.0 for the twelve-month periods ending on each June 30, September 30, December 31 and March 31. Our interest coverage ratio for the twelve-month period ended on December 31, 2005, was 2.6 to 1.0. |
| | • | | Maximum total senior secured leverage ratio. We and our subsidiaries must maintain on a consolidated basis at each date set forth below, a ratio of funded senior secured debt (as defined in our Amended Credit Agreement) to EBITDA (as defined in our Amended Credit Agreement) of not more than 2.0 to 1.0 as of, and for, each of the twelve-month periods ending on each June 30, September 30, December 31 and March 31. Our total senior secured leverage ratio for the twelve-month period ended on December 31, 2005, was 0.6 to 1.0. |
Senior Notes
On May 14, 2004, we exchanged our $260 million in outstanding 10.125% series A senior notes due 2011, which we refer to as the initial notes, for $260 million in registered 10.125% series B notes due 2011, which we refer to as the exchange notes. The terms of the exchange notes are identical to the terms of the initial notes except that the exchange notes are registered under the Securities Act of 1933, and therefore are freely transferable, subject to certain restrictions. The exchange notes evidence the same
50
indebtedness as the initial notes. Interest on the notes is payable on May 1 and November 1 of each year. As of December 31, 2005, we had outstanding $260 million of our senior notes. The indenture governing our notes contains restrictions on our ability to engage in certain activities and limitations on capital expenditures. (See “Covenants Under the Indenture Governing the Senior Notes” below and Exhibit 4.2 to the Quarterly Report on form 10-Q of Universal Hospital Services, Inc. for the quarter ended June 30, 2005.)
Covenants Under the Indenture Governing the Senior Notes
The indenture governing our notes contains covenants limiting our ability to incur additional debt; pay cash dividends or distributions on our capital stock or repurchase our capital stock or subordinated debt; issue redeemable stock or preferred stock; issue stock of subsidiaries; make certain investments; transfer or sell assets; create liens on our assets to secure debt; enter into transactions with affiliates; and merge or consolidate with another company. These covenants are subject to a number of important limitations and exceptions. See “Description of Notes — Certain Covenants” in Amendment Number 5 to Form S-4 filed on April 15, 2004.
Liquidity
Our principal sources of liquidity are expected to be cash flows from operating activities and borrowings under our senior secured credit facility. It is anticipated that our principal uses of liquidity will be to fund capital expenditures related to purchases of movable medical equipment, provide working capital, meet debt service requirements and finance our strategic plans.
We require substantial cash to grow our Medical Equipment Outsourcing programs and service our debt. Our outsourcing programs require us to invest a significant amount of cash in movable medical equipment purchases. To the extent that such expenditures cannot be funded from our operating cash flow, borrowings under our senior secured credit facility or other financing sources, we may not be able to conduct our business or grow as currently planned. We currently expect that over the next 12 months, we will invest approximately $45-50 million in new movable medical equipment and other capital expenditures. This estimate is subject to numerous assumptions, including revenue growth and the number of AMPP signings.
The following table sets forth selected historical information regarding our cash flows:
| | | | | | | | | | | | |
| | | Years Ended December 31, | |
| | | 2003 | | | 2004 | | | 2005 | |
| | | (in thousands) | |
Net cash provided by operating activities | | $ | 15,957 | | | $ | 37,966 | | | $ | 43,963 | |
Net cash used in investing activities | | | (36,770 | ) | | | (65,150 | ) | | | (40,631 | ) |
Net cash provided by (used in) financing activities | | | 20,813 | | | | 27,184 | | | | (3,332 | ) |
51
Net cash provided by operating activities during the year ended December 31, 2005, was $44.0 million compared to $38.0 million in the same period in 2004. This increase was primarily attributable to decreased net loss due to increased revenue generating $3.0 million higher gross margin. Net cash used in investing activities during the year ended December 31, 2005, was $40.6 million, compared to $65.2 million in the same period in 2004. This decrease was primarily due to the $14.0 million reduction in acquisitions and reduced cash payments on net equipment purchases of $9.7 million. Net cash used in financing activities during the year ended December 31, 2005, was $3.3 million, compared to net cash provided by financing activities of $27.2 million in the same period in 2004. This change was primarily attributable to decreased net borrowings under our Amended Credit Agreement of $25.4 million due to the acquisitions and capital expenditures made during 2004, and a $2.2 million reduction in our book overdraft. Changes in book overdraft relate to changes in checks outstanding.
Net cash provided by operating activities during the year ended December 31, 2004, was $38.0 million compared to $16.0 million in the same period in 2003. This increase was primarily due to a decreased net loss due to the absence of $27.7 million of charges related to the recapitalization in 2003. Net cash used in investing activities during the year ended December 31, 2004, was $65.2 million, compared to $36.8 million in the same period in 2003. This increase was due to increased capital expenditures and the acquisitions of Affiliated Clinical Engineering Services, Inc., certain assets of Galaxy Medical Products, Inc., substantially all of the assets of Advanced Therapeutics of Wisconsin, Inc., and certain assets of Cardinal Health 200, Inc. Net cash provided by financing activities during the year ended December 31, 2004, was $27.2 million, compared to $20.8 million during the same period in 2003. This increase was primarily due to increased borrowings under our Amended Credit Agreement.
Off-Balance Sheet Arrangements
As part of our ongoing business, we do not participate in transactions that generate relationships with unconsolidated entities or financial partnerships, such as entities often referred to as structured finance or special purpose entities (“SPE”), which would have been established for the purpose of facilitating off-balance sheet arrangements or other contractually narrow or limited purposes. As of December 31, 2005, we do not have any unconsolidated SPE transactions.
Contractual Obligations
The following is a summary as of December 31, 2005, of our future contractual obligations (in thousands):
| | | | | | | | | | | | | | | |
| | | Payments due by period |
Contractual Obligations1 | | Total | | 2006 | | 2007-2008 | | 2009-2010 | | 2011 and beyond |
Long-term Debt Obligations | | $ | 300,914 | | $ | 1,140 | | $ | 1,551 | | $ | 38,223 | | $ | 260,000 |
Interest on Senior Notes | | | 153,563 | | | 26,325 | | | 52,650 | | | 52,650 | | | 21,938 |
Operating Lease Obligations | | | 24,276 | | | 4,869 | | | 7,957 | | | 5,324 | | | 6,126 |
Purchase Obligations | | | 7,960 | | | 7,960 | | | — | | | — | | | — |
| | | | | | | | | | | | | | | |
Total contractual obligations | | $ | 486,713 | | $ | 40,294 | | $ | 62,158 | | $ | 96,197 | | $ | 288,064 |
| | | | | | | | | | | | | | | |
Other commercial commitments: | | | | | | | | | | | | | | | |
Stand by letter of credit | | $ | 2,342 | | | — | | | — | | | — | | | — |
| | | | | | | | | | | | | | | |
| 1 | For 2006, we do not have any significant statutory or contractual funding requirements for our qualified non-contributory defined benefit pension plan. We cannot reasonably determine the exact timing or amount of payments to meet any future funding requirements under the plan. |
52
Other long-term liabilities reflected on the balance sheet is our estimate of the financial guarantee we have provided to the lessor of our automobile and van fleet of approximately 392 vehicles. We are financially obligated to reimburse the lessor for any shortfalls between their book value and actual cash proceeds received when we dispose of a vehicle after factoring in a lessor guaranteed residual. The present value of the estimated payments has been recorded on our Balance Sheet as a prepaid expense and a liability which will be amortized over the expected life of the vehicles.
Based on the level of operating performance expected in 2006, we believe our cash from operations, together with additional borrowings under our Amended Credit Agreement, will meet our liquidity needs for the foreseeable future, exclusive of any borrowings that we may make to finance potential acquisitions. However, if during that period or thereafter we are not successful in generating sufficient cash flows from operations or in raising additional capital when required in sufficient amounts and on terms acceptable to us, our business could be adversely affected. Availability under our Amended Credit Agreement as of December 31, 2005, was approximately $73 million, representing our borrowing base of $113 million, net of outstanding letters of credit of $2 million and borrowings of $38 million at that date.
Our expansion and acquisition strategy may require substantial capital. Sufficient funding for such acquisitions may not be available under our existing revolving credit facility, and we may not be able to raise any necessary additional funds through bank financing or the issuance of equity or debt securities on terms acceptable to us, if at all.
RECENT ACCOUNTING PRONOUNCEMENTS
In December 2004, the Financial Accounting Standards Board (“FASB”) issued Statement of Financial Accounting Standards (“SFAS”) No. 123 (revised 2004),Share-BasedPayments, which is a revision of SFAS No. 123 and supersedes APB Opinion No. 25. SFAS No. 123R requires that all share-based payments to employees, including grants of employee stock options, to be valued at the fair value on the date of grant, and to be expensed over the applicable vesting period. We plan to adopt SFAS No. 123R in the first quarter of 2006. We believe based on our current Black-Scholes option value assumptions, our stock compensation expense for the first quarter of 2006 will be $0.4 million to $0.5 million.
53
In March 2005, the FASB issued FASB Interpretation No. 47, an interpretation of SFAS No. 143,Accounting for Asset Retirement Obligations. FIN 47 states that the term conditional asset retirement obligation refers to an unconditional, legal obligation to perform an asset retirement obligation activity in which the timing and/or method of settlement are uncertain and conditional on a future event. If sufficient information exists for fair value measurement of the obligation, FIN 47 requires us to recognize a liability when incurred. We adopted FIN 47 in the fourth quarter of 2005. The adoption of FIN 47 did not have a material impact on the results of operations.
FORWARD LOOKING STATEMENTS
Safe Harbor Statement under the Private Securities Litigation Reform Act of 1995
We believe statements in this Annual Report on Form 10-K looking forward in time involve risks and uncertainties. The following factors, among others, could adversely affect our business, operations and financial condition causing our actual results to differ materially from those expressed in any forward-looking statements: our history of net losses and substantial interest expense; our need for substantial cash to operate and expand our business as planned; our substantial outstanding debt and debt service obligations; restrictions imposed by the terms of our debt; a decrease in the number of patients our customers are serving; our ability to effect change in the manner in which healthcare providers traditionally procure medical equipment; the absence of long-term commitments with customers; our ability to renew contracts with group purchasing organizations and integrated delivery networks; changes in reimbursement rates and policies by third-party payors; the impact of health care reform initiatives; the impact of significant regulation of the health care industry and the need to comply with those regulations; difficulties or delays in our continued expansion into certain of our businesses/geographic markets and developments of new businesses/geographic markets; and additional credit risks in increasing business with home care providers and nursing homes, impacts of equipment product recalls or obsolescence; increases in vendor costs that cannot be passed through to our customers; and other Risk Factors as set forth herein.
We undertake no obligation, and specifically decline any obligation, to publicly update or revise any forward-looking statements, whether as a result of new information, future events or otherwise. In light of these risks, uncertainties and assumptions, the forward-looking events included in this Annual Report on Form 10-K might not occur.
ITEM 7A: Quantitative and Qualitative Disclosures about Market Risk
Our primary exposure to market risk is interest rate risk associated with our debt instruments. We use both fixed and variable rate debt as sources of financing. As of December 31, 2005, we had approximately $298.1 million of total debt outstanding, of which $38.1 million was bearing interest at variable rates approximating 6.6%. A 1.0 percentage point change in interest rates on variable rate debt would have resulted in interest expense fluctuating approximately $0.4 million, $0.3 million and $0.1 million for the years ended 2005, 2004 and 2003, respectively. As of December 31, 2005, we had no other material exposure to market risk.
54
We have not, and do not plan to, enter into any derivative financial instruments for trading or speculative purposes.
ITEM 8: Financial Statements and Supplementary Data
The following table sets forth certain unaudited quarterly financial data for 2005 and 2004. In our opinion, this unaudited information has been prepared on the same basis as the audited information and includes all adjustments (consisting only of normal recurring adjustments) necessary to present fairly the information set forth therein. The operating results for any one quarter are not necessarily indicative of results for any future period.
Selected Quarterly Financial Information
(Unaudited)
(dollars in thousands)
| | | | | | | | | | | | | | | | |
| | | Year Ended December 31, 2005 | |
| | | March 31 | | | June 30 | | | September 30 | | | December 31 | |
Total revenues | | $ | 55,271 | | | $ | 53,398 | | | $ | 53,363 | | | $ | 53,872 | |
Gross margin | | $ | 23,680 | | | $ | 21,834 | | | $ | 20,645 | | | $ | 22,696 | |
Gross margin % | | | 42.8 | % | | | 40.9 | % | | | 38.7 | % | | | 42.1 | % |
Net income (loss) | | $ | 971 | | | $ | (1,522 | ) | | $ | (1,057 | ) | | $ | 39 | |
Net cash provided by operating activities | | | 17,334 | | | $ | 3,451 | | | $ | 13,847 | | | $ | 9,331 | |
Net cash used in investing activities | | | (10,077 | ) | | | (7,835 | ) | | | (9,914 | ) | | | (12,805 | ) |
Net cash (used in) provided by financing activities | | $ | (4,258 | ) | | $ | 1,385 | | | $ | (3,933 | ) | | $ | 3,474 | |
| |
| | | Year Ended December 31, 2004 | |
| | | March 31 | | | June 30 | | | September 30 | | | December 31 | |
Total revenues | | $ | 48,997 | | | $ | 49,289 | | | $ | 49,608 | | | $ | 51,706 | |
Gross margin | | $ | 22,147 | | | $ | 21,246 | | | $ | 20,404 | | | $ | 22,020 | |
Gross margin % | | | 45.2 | % | | | 43.1 | % | | | 41.1 | % | | | 42.6 | % |
Net income (loss) | | $ | 1,358 | | | $ | (632 | ) | | $ | (988 | ) | | $ | (3,330 | ) |
Net cash provided by operating activities | | | 17,989 | | | | 544 | | | | 18,601 | | | | 832 | |
Net cash used in investing activities | | | (22,822 | ) | | | (17,298 | ) | | | (11,323 | ) | | | (13,707 | ) |
Net cash provided by (used in) financing activities | | $ | 4,833 | | | $ | 16,754 | | | $ | (7,278 | ) | | $ | 12,875 | |
The Report of the Independent Registered Public Accounting Firm, Financial Statements and Schedules are set forth on pages F-1 to F-25 of this report.
ITEM 9: Changes in and Disagreements with Accountants on Accounting and Financial Disclosure
None.
55
ITEM 9A: Controls and Procedures
Under the supervision and with the participation of our management, including our chief executive officer and chief financial officer, we evaluated the effectiveness of the design and operation of our disclosure controls and procedures (as defined in Rule 13a-15(e) or 15d-15(e) under the Securities Exchange Act of 1934 (the “Exchange Act”)). Based upon that evaluation, our chief executive officer and chief financial officer concluded that, as of the end of the period covered by this report, our disclosure controls and procedures were effective.
During the fiscal quarter ended December 31, 2005, there has been no change in our internal control over financial reporting (as defined in Rule 13a-15(f) or 15d-15(f) under the Exchange Act) that has materially affected, or is reasonably likely to materially affect, our internal control over financial reporting.
ITEM 9B: Other Information
On March 31, 2006, we offered to amend all the stock option agreements under our 2003 Stock Option Plan. This offer was extended to all option holders, including the following executive officers: Messrs Blackford, Clevenger, Schiesl, Kuck and Singer. The stock option agreement provides for accelerated vesting of all performance based options if certain of our investors receive a net cash return equal to or exceeding the thresholds set forth in the agreement. The amended stock option agreement lowers some of these thresholds, extends the thresholds for two more years, and adds new thresholds which, if met, would provide for at least 50% vesting of the performance based options. The revised form of Non-Qualified Stock Option Agreement for the 2003 Stock Option Plan is set forth in Exhibit 10.13 to this Form 10-K.
We amended the 2005 Executive Incentive Plan Target (as previously filed as Exhibit 10.18 to our Annual Report on Form 10-K for the fiscal year ended December 31, 2004) for Mr. Singer by increasing the bonus otherwise payable under the plan by $10,000.
56
PART III
ITEM 10: Directors and Executive Officers of the Registrant
EXECUTIVE OFFICERS AND DIRECTORS
The following table sets forth the ages and the current positions of our executive officers and directors as of March 30, 2006.
| | | | |
Name | | Age | | Position |
David E. Dovenberg | | 61 | | Chairman of the Board of Directors |
Gary D. Blackford | | 48 | | President and Chief Executive Officer and Director |
Rex T. Clevenger | | 48 | | Senior Vice President and Chief Financial Officer |
Walter T. Chesley | | 51 | | Senior Vice President, Human Resources |
Timothy W. Kuck | | 48 | | Senior Vice President, Operations |
David G. Lawson | | 49 | | Senior Vice President, Technology, Marketing and Facilities |
Joseph P. Schiesl | | 54 | | Senior Vice President, Sales |
Jeffrey L. Singer | | 44 | | Senior Vice President, Asset Optimization |
Andrew P. Weaver | | 42 | | Controller and Chief Accounting Officer |
Michael N. Cannizzaro | | 56 | | Director |
David W. Dupree | | 53 | | Director |
Steven G. Segal | | 45 | | Director |
Mark J. Tricolli | | 34 | | Director |
Brent D. Williams | | 38 | | Director |
Edward D. Yun | | 38 | | Director |
Samuel B. Humphries | | 63 | | Advisory Director |
David E. Dovenberg has been Chairman of our Board since 2001 and became Non-Executive Chairman on January 1, 2004. Mr. Dovenberg was our President and Chief Executive Officer from 1998 to 2002. He joined us in 1988 as Vice President, Finance and Chief Financial Officer and served in this role until 1998. Prior to joining us, he had been with The Prudential Insurance Company of America since 1969. From 1979 to 1988, he was a regional Vice President in the area of corporate investments in private placements for Prudential Capital Corporation. He is also a member of the Board of Directors of Lund International Holdings, Inc., a manufacturer of appearance accessories for light trucks, sport utility vehicles and vans. He holds a Bachelor of Arts degree from Gustavus Adolphus College and a Master’s degree in Economics from the University of Minnesota.
Gary D. Blackfordhas been President, Chief Executive Officer and a member of the Board of Directors since 2002. Prior to joining us, Mr. Blackford was Chief Executive Officer for Curative Health Services from September 2001 to March 2002 and, prior to that, for Shop for School.com, Inc. from June 1999 to June 2001. He also served as Chief Operating Officer of Value Rx from 1994 to 1996 and as Chief Operating Officer and Chief Financial Officer of MedIntel from 1993 to 1994. Mr. Blackford holds a Bachelors
57
of Business Administration degree from the University of Iowa, a Juris Doctor degree from Creighton University and Certified Public Accountant certificate. He is a member of the Board of Directors of Genezen Healthcare, Inc., a privately held provider of specialty pharmaceutical services based in Dallas, Texas; and a member of the board of the Twin Cities Ronald McDonald Charities, a non-profit corporation dedicated to helping families live with a child’s serious illness. Mr. Blackford was a member of the board of Compex Technologies, Inc. (NASDAQ: CMPX), a global provider of electro therapy products, until its merger with Encore Medical (NASDAQ: ENMC) in February of 2006.
Rex T. Clevengerjoined us in 2004 as Senior Vice President and Chief Financial Officer. He has over 25 years of financial operations and capital markets experience including extensive capital attraction, corporate finance and planning roles as Senior Vice President, Finance for Reliant Resources, Inc. (NYSE: RRI) in Houston from 2000 to 2004, and with privately held Koch Industries in Wichita and Singapore from 1994 to 2000. He also worked in commercial and investment banking roles in Houston and New York, and as a Certified Public Accountant for Arthur Andersen. He is a graduate of the University of Missouri and holds a Bachelor of Science degree in Business Administration.
Walter T. Chesleyjoined us in 2003 as our Senior Vice President, Human Resources. He has over 25 years of human resources experience, most recently with Children’s Hospitals and Clinics, the largest pediatric health care provider in the upper Midwest, where he was Vice President, Human Resources and Chief Administrative Officer from 2000 to 2003. From 1997 to 2000, Mr. Chesley was Vice President, Human Resources for Ceridian Corporation, a leading provider of human resources management, payroll outsourcing, tax filing and benefits administration services. Prior to that, he was Assistant Vice President of the Dun & Bradstreet Corporation and Reuben H. Donnelley directory publishing division. Mr. Chesley has a Bachelor of Science degree in Communications and Public Relations from Boston University and a Juris Doctor degree from the American University Washington College of Law.
Timothy W. Kuckjoined us in 2004 as the Vice President of the Central Region. Since October of 2005, Mr. Kuck has been the Senior Vice President of Operations. He has over 20 years of progressive managerial growth in sales, operation, finance and corporate administration. Prior to joining us, Mr. Kuck held the positions of Regional Vice President (1999-2003) and Chief Financial Officer & Secretary (1997-1999) at G&K Services, Inc. Between the years of 1995-1997 at First Data Corporation, which acquired Employee Benefit Plans, Inc., he held the titles of President of EBPLife Insurance Company and Senior Vice President of First Health. During Mr. Kuck’s tenure at Employee Benefit Plans, he held the positions of Chief Financial Officer & Secretary (1993-1995), President of EBPLife Insurance Company (1991-1997) and General Counsel & Secretary (1991-1993). Mr. Kuck also served as an Attorney at Popham, Haik, Schnobrich & Kaufman, Ltd., in Minneapolis, Minnesota from 1984-1991. Mr. Kuck holds a Juris Doctor degree from the University of Minnesota Law School and a Bachelor of Arts degree from Augustana College in South Dakota. Mr. Kuck also has a Certified Public Accountant certification.
58
David G. Lawson has been Senior Vice President of Technology, Marketing and Facilities since 2002. He has over 20 years of technology experience, 12 of those in the healthcare/financial services industries with ValueRx, EBP Healthplans, North Central Life Insurance, Norwest Technical and Curative Health Services. He was Chief Administrative Officer of Curative Health Services from October 2001 to March 2002. Prior to that, he was Chief Operating Officer and Chief Technology Officer for Shop for School.com, Inc. from April 1999 to September 2001. Prior to that, he was Chief Information Officer of ValueRx from December 1995 to April 1998. Early in his career he spent four years as a management consultant with Deloitte and Touche and five years with Best Products Limited. He holds a Bachelor of Science degree in Hospital Administration from Concordia College.
Joseph P. Schieslhas been Senior Vice President, Sales since 2003. Mr. Schiesl has over 25 years of experience in health care services businesses. Prior to joining us, Mr. Schiesl was Chief Executive Officer of Thinking Networks, Inc., an internet protocol software services start-up from February 2001 to December 2001. Prior to that, Mr. Schiesl was President of ViTec, Inc., an e-health software services company, from April 1999 to August 2000. From December 1995 to April 1998, Mr. Schiesl was President, Pharmacy Benefit Management Services of ValueRx. Prior to tenure at ValueRx, Mr. Schiesl was Executive Vice President at MedIntel Systems. Earlier in his career, Mr. Schiesl spent two years with Diversified Pharmaceutical Services and 19 years at CyCare Systems. He holds a Bachelor of Arts in Economics from Loras College.
Jeffrey L. Singer has been Senior Vice President, Asset Optimization since 2003. From 1999 to 2003, he was Vice President, Purchasing and Logistics and prior to that was Vice President of Alternate Care—West from 1998 to 1999. Prior to joining us, he was Chief Executive Officer of Home Care Instruments, Inc. from 1991 to 1998, and held various other positions at HCI from 1986 to 1991. He holds a Bachelor of Science in Marketing and Logistics.
Andrew P. Weaver has been Controller and Chief Accounting Officer since 2004. Mr. Weaver has resigned, effective April 3, 2006. Prior to joining us, he had over 15 years of experience in a variety of accounting, corporate finance and treasury financial management roles at Reliant Resources from 1999 to 2004, The Coca-Cola Company from 1995 to 1998 and The Minute Maid Division of The Coca-Cola Company from 1987 to 1995. He has a Bachelor of Business Administration degree and a Master’s degree in Finance from Texas A&M University, and is a Certified Public Accountant.
Michael N. Cannizzaro has been a director since May 2001. He has been an Operating Partner of J.W. Childs Associates, L.P. since 2001. Prior to that, he was President and Chief Executive Officer of Beltone Electronics Corporation from 1998 to 2000. Prior to that, he was President of Caremark International’s Prescription Service Division from 1994 to 1997; Vice President, Business Development of Caremark’s Nephrology Service
59
Division from April 1994 to September 1994; and President of Leica North America from 1993 to 1994. Prior to that, he held numerous positions in general management at Baxter Healthcare Corporation from 1976 to 1993, including the position of President of various divisions. He was the Chairman and Chief Executive Officer of National Nephrology Associates, Inc. (“NNA”) from May 2003 until April 2004. He was a director of NNA from July 1999 until April 2004. He is currently Chairman of Insight Health Services Corp., Vice Chairman of Sheridan Healthcare Corp., and Chairman of Ion Health Corp.
David W. Dupree became a Director on October 17, 2003. He is the Chief Executive Officer and a Managing Director of The Halifax Group, which he co-founded in January 1999. Prior to joining The Halifax Group, Mr. Dupree was a Managing Director and Partner with The Carlyle Group, a global investment firm located in Washington, D.C. Prior to joining The Carlyle Group in 1992, Mr. Dupree was a Principal in Corporate Finance with Montgomery Securities and prior to that, he was Co-Head of Equity Private Placements at Alex.Brown & Sons Incorporated. Mr. Dupree earned a B.S. from The University of North Carolina at Chapel Hill and received his M.B.A. from the Graduate School of Management at Wake Forest University, where he is the Chairman of the Board of Visitors. Mr. Dupree serves as a Trustee for St. Patrick’s Episcopal School in Washington, D.C. where he is also Chairman of the Finance Committee. Mr. Dupree currently serves on the Boards of Directors of Insight Health Services Corp., Iasis Healthcare, PolyPipe, Inc., Whole Foods Markets, Inc. (NASDAQ: WFMI), EFO Capital Management, and on the Board of Trustees for Wake Forest University. In recent years, Mr. Dupree served on the Boards of Meineke Car Care Centers, Inc., Soil Safe, Inc., National Packaging Solutions Group, and Pharmaceutical Research Associates International, Inc.
Steven G. Segal has been a director since February 1998. He is a founding Partner of J.W. Childs Associates, L.P. and has been at J.W. Childs since 1995. Prior to that time, he was an executive at Thomas H. Lee Company from 1987, most recently holding the position of Managing Director. He is also a director of The NutraSweet Company, Insight Health Services Corp., MAAX Inc., and Round Grille, Inc. (d/b/a FiRE + iCE).
Mark J. Tricolli became a director on October 17, 2003. He is a Vice President of J.W. Childs Associates, L.P. and has been at J.W. Childs since July 2000. Prior to that, he was an Associate in the Merchant Banking Division of Goldman, Sachs & Co. from August 1999 to June 2000. Prior to that, he was pursuing a degree in business school from 1997 to 1999. During the summer of 1998, he worked at Donaldson, Lufkin & Jenrette. He is also a director of InSight Health Services Corp., JA Holdings, Inc., Sheridan Holdings, Inc. and Ion Health Holdings, Inc. Mr. Tricolli was also a director of Equinox Holdings, Inc., until its sale in February 2006.
Brent D. Williams became a director on October 17, 2003. He is a Managing Director of The Halifax Group, L.L.C. and has been with The Halifax Group since its formation in October 1999. Prior to joining The Halifax Group, he was a Director in PaineWebber’s Merchant Banking Division, which he helped to establish, from January 1999 to
60
September 1999. Prior to that, he was a Director in PaineWebber’s Investment Banking division from August 1995 to December 1998. He joined PaineWebber from Smith Barney Inc. He is also a director of Maverick Healthcare Group and PolyPipe, Inc., and is an advisory board member of the Center For Private Equity Finance at the University of Texas at Austin.
Edward D. Yun has been a director since February 1998. He is a Partner of J.W. Childs Associates, L.P. and has been at J.W. Childs since 1996. From 1994 until 1996 he was an Associate at DLJ Merchant Banking, Inc. He is also a director of Pan Am International Flight Academy, Inc., Insight Health Services Corp., JA Holdings, Inc., Sheridan Holdings, Inc., and Ion Health Holdings, Inc. Mr. Yun was also a director of Equinox Holdings, Inc., until its sale in February 2006.
Samuel B. Humphries became an advisory director on October 17, 2003, and in such capacity, does not vote on matters before the board of directors. Mr. Humphries served as a director from 1991 to February 1998 and from April 1998 until October 17, 2003. Mr. Humphries is President and Chief Executive Officer of Uroplasty, Inc., a medical device company. Most recently he was a founding partner of Ascent Medical Technology Fund, L.P. a venture capital fund. Mr. Humphries has over 25 years of healthcare and medical device experience. As President and CEO of American Medical Systems from 1998 to 1999, he was an investor and part of an LBO spin-off from Pfizer, Inc. Before joining AMS, Mr. Humphries was President and CEO of Optical Sensors, Inc., a medical device start-up company, from 1991 to 1998 where he guided the company from start-up through an IPO. Prior to OSI, Mr. Humphries was at AMS during its formative years where he served first as Vice President of World Wide Sales and Marketing, and then as President and CEO. Earlier, he was with the Medical Systems Group of the General Electric Company where he was initially District Sales Manager and then promoted to National Sales Manager of the Critical Care Patient Monitoring Business. Mr. Humphries has served on numerous private and public Boards of Directors, and served on the Board of Directors of the Health Industry Manufacturers Association (HIMA, now AdvaMed). In addition to serving as a director of Uroplasty, he also serves on the Board of Directors of Enova Medical and Criticare Systems, Inc. Mr. Humphries earned a B.S. in Economics and Marketing from the University of Kentucky.
BOARD COMMITTEES
Compensation Committee.
Our board of directors has a compensation committee consisting of certain of our directors. The members of the compensation committee are David W. Dupree, Samuel B. Humphries and Edward D. Yun. Mr. Humphries is the chairman but, as an advisory director, does not vote on matters before such committee. Our compensation committee makes recommendations to the board of directors concerning executive compensation and administers our stock option plans.
61
Audit Committee.
Our audit committee consists of Samuel B. Humphries, Mark J. Tricolli and Brent D. Williams. Mr. Humphries is the chairman but, as an advisory director, does not vote on matters before such committee. Action taken by our audit committee is required to be taken by unanimous vote. Our audit committee is responsible for reviewing the adequacy of our system of internal accounting controls; reviewing the results of the independent registered public accounting firm’s annual audit, including reviewing the independent registered public accounting firm’s required communication on any significant adjustments, management judgments and estimates, new accounting policies and disagreements with management; reviewing our audited financial statements and discussing the statements with management; reviewing the audit reports submitted by the independent registered public accounting firm; and the performance of our independent registered public accounting firm and annually recommending independent registered public accounting firms; adopting and annually assessing our charter; and preparing such reports or statements as may be required by securities laws.
Under current rules of public trading markets, such as NASDAQ and the New York Stock Exchange, our current audit committee would not be deemed to be comprised solely of independent directors since one of our audit committee members is associated with JWC Fund I and JWC Fund III, and one of our audit committee members is associated with Halifax. Our board of directors has determined that the audit committee does not have an “audit committee financial expert” as that term is defined in the SEC regulations because our board of directors did not believe that any of the members of the audit committee met the specific qualifications of an “audit committee financial expert.” However, our board of directors has determined that all of the members of the audit committee are able to read and understand fundamental financial statements and that our audit committee has the financial sophistication and valuable business knowledge necessary to fulfill the duties and the obligations of the audit committee. Our board of directors has concluded that the appointment of an additional director to the audit committee is not necessary at this time.
Executive Committee.
The executive committee of our board of directors consists of four of our directors. The members of the executive committee are Gary D. Blackford, David E. Dovenberg, David W. Dupree and Steven G. Segal. Mr. Dovenberg is the chairman. Our executive committee is responsible for such matters as our board of directors may determine from time to time.
Mergers and Acquisitions Committee.
The mergers and acquisitions committee of our board of directors was created in 2004 and consists of Mark Tricolli, Brent D. Williams and Edward D. Yun. Our mergers and acquisitions committee is responsible for reviewing and approving acquisitions in which the total consideration is less than $6,000,000.
62
LIMITATION ON LIABILITY AND INDEMNIFICATION MATTERS
Delaware law and our certificate of incorporation and bylaws provide that we shall, under certain circumstances and subject to certain limitations, indemnify any person made or threatened to be made a party to a proceeding by reason of that person’s former or present official capacity with us against judgments, penalties, fines, settlements and reasonable expenses. Any such person also is entitled, subject to limitations, to payment or reimbursement of reasonable expenses in advance of the final disposition of the proceeding.
Pursuant to provisions of the Delaware General Corporation Law, we have adopted provisions in our certificate of incorporation that provide that our directors shall not be personally liable to us or our stockholders for monetary damages for a breach of fiduciary duty as a director, subject to exceptions.
At present, we are aware of no pending litigation or proceeding involving any of our directors, officers, employees or agents where indemnification will be required or permitted. We are not aware of any threatened litigation or proceeding that might result in a claim for indemnification.
CODE OF CONDUCT
We have adopted a code of conduct for all employees, directors and officers, and a code of ethics for our Chief Executive Officer and senior financial officers. Our code of conduct and code of ethics can be found at our internet website,www.uhs.com. We intend to satisfy the disclosure requirement under Item 5.05 of Form 8-K regarding an amendment to, or waiver from, a provision of our code of ethics by posting such information on our website at the address specified above.
63
ITEM 11: Executive Compensation
DIRECTOR COMPENSATION
Except for Mr. Dovenberg, neither directors who are employees nor directors who are affiliated with JWC Fund I or Halifax receive any compensation directly for serving on our board of directors. Our advisory director is entitled to receive a $5,000 retainer per quarter, $1,000 for each meeting of our board of directors attended in person, $500 for each meeting of our board of directors attended telephonically, $500 for each committee meeting attended and $1,250 per quarter for serving as the chairman of our audit committee. In addition, our advisory director received a grant of stock options to purchase 72,000 shares of our common stock under our 2003 Stock Option Plan. Mr. Dovenberg receives compensation for serving on our board of directors as described under “Employment Agreements” below.
SUMMARY COMPENSATION TABLE
The following table sets forth cash and non-cash compensation for each of the last three fiscal years awarded to or earned by our Chief Executive Officer and each of our four other most highly compensated executive officers during fiscal year 2005.
| | | | | | | | | | |
| | | Annual compensation | | Long-Term Compensation Awards | | All Other Compensation (3)($) |
Name and principal position | | Year | | Salary($) | | Bonus(1) ($) | | Securities Underlying Options (2)(#) | |
Gary D. Blackford | | 2005 | | 362,803 | | 308,390 | | 0 | | 8,163 |
President and Chief | | 2004 | | 342,782 | | 171,900 | | 5,602,897 | | 7,733 |
Executive Officer | | 2003 | | 326,932 | | 159,543 | | 0 | | 377,817 |
| | | | | |
Rex T. Clevenger | | 2005 | | 282,034 | | 183,327 | | 0 | | 10,993 |
Senior Vice President | | 2004 | | 137,500 | | 89,400 | | 1,000,000 | | 88,062 |
and Chief Financial Officer (4) | | | | | | | | | | |
| | | | | |
Joseph P. Schiesl | | 2005 | | 246,138 | | 159,998 | | 0 | | 5,538 |
Senior Vice President, | | 2004 | | 239,692 | | 91,900 | | 1,250,000 | | 5,402 |
Sales (5) | | 2003 | | 198,883 | | 83,781 | | 0 | | 84, 448 |
| | | | | |
Timothy W. Kuck | | 2005 | | 186,229 | | 114,137 | | 500,000 | | 4,190 |
Senior Vice President, Operations (6) | | 2004 | | 160,192 | | 52,000 | | 350,000 | | 18,434 |
| | | | | |
Jeffrey L. Singer | | 2005 | | 176,399 | | 115,843 | | 0 | | 7,938 |
Senior Vice President, | | 2004 | | 171,669 | | 60,800 | | 750,000 | | 7,736 |
Asset Optimization | | 2003 | | 160,966 | | 84,000 | | | | 511,851 |
| (1) | The amounts shown in this column represent annual bonuses earned for the fiscal year indicated. Such bonuses are paid approximately three months after the end of such fiscal year. |
64
| (2) | The stock options shown in this column were all granted pursuant to our 2003 stock option plan. |
| (3) | The amounts shown in this column for 2005 represent our contributions for the named executive officers to the UHS Employees’ Long Term Savings Plan (LTSP). |
| (4) | Mr. Clevenger joined us as Senior Vice President and Chief Financial Officer in June 2004 |
| (5) | Mr. Schiesl joined us as Senior Vice President, Sales in February 2003. |
| (6) | Mr. Kuck joined us as Regional Vice President Sales, Central Region, in January 2004. |
OPTIONS GRANTS IN LAST FISCAL YEAR
During the year ended December 31, 2005, we granted stock options to our named executive officers as set forth in the following table:
Option Grants in Last Fiscal Year
| | | | | | | | | | | | | | |
| | | Number of Securities Underlying Options Granted(#) | | % of Total Options Granted to Employees in Fiscal Year | | Exercise Price ($ /Share) | | Expiration Date | | Potential Realizable Value at Assumed Annual Rates of Stock Price Appreciation for Options Term |
Name | | | | | | 5% | | 10% |
Gary D. Blackford | | | | | | | | | | | | | | |
Rex T. Clevenger | | | | | | | | | | | | | | |
Joseph P. Schiesl | | | | | | | | | | | | | | |
Timothy W. Kuck | | 500,000 | | 37.53 | | 1.33 | | 10/31/2015 | | $ | 418,214.93 | | $ | 1,059,838.74 |
Jeffrey L. Singer | | | | | | | | | | | | | | |
The options shown in the above table were granted at an exercise price equal to the fair market value of our common stock on the date of grant and will expire 10 years from the date of grant, unless earlier terminated. Options granted to the named executive officers during fiscal 2005 vest based on performance (“Target Vesting Options”) and time (“Fixed Vesting Options”). One fourth of the Fixed Vesting Options vest on November 1
65
of 2006, 2007, 2008 and 2009, subject to acceleration upon certain events. One fifth of the Target Vesting Options vest on each of the following dates, if certain performance targets are attained and subject to acceleration upon certain events: December 31st of 2006, 2007, 2008, 2009, and 2010. In certain circumstances, the Target Vesting Options fully vest 8 years after the grant date.
During fiscal 2005, we granted options to purchase a total of 1,332,400 shares of common stock to our employees.
Potential realizable values are calculated by:
| | • | | Multiplying the number of shares of common stock subject to a given option by the market price on the date of the grant; |
| | • | | Assuming that the amount derived from that calculation compounds at the annual 5% or 10% rates shown in the table for the entire ten-year term of the option; and |
| | • | | Subtracting from that result the total option exercise price. |
The 5% and 10% assumed annual rates of stock price appreciation are required by the rules of the Securities and Exchange Commission and do not reflect our estimate or projection of future common stock prices.
OPTION EXERCISES IN LAST FISCAL YEAR AND FISCAL YEAR-END OPTION VALUES
The following table sets forth the number and value of options exercised by our named executive officers during the fiscal year ended December 31, 2005, as well as the number and value of securities underlying unexercised options held as of December 31, 2005.
Aggregated Option Exercises in Last Fiscal Year and Fiscal Year-End Option Values
| | | | | | | | | | | | | | |
| | | Number of Shares Acquired on Exercise | | Value Realized ($) | | Numbers of Shares Underlying Unexercised Options at Fiscal Year-End | | Value of Unexercised In-the Money Options at Fiscal Year-End(1) |
Name | | | | Exercisable | | Unexercisable | | Exercisable | | Unexercisable |
Gary D. Blackford | | — | | — | | 933,812 | | 4,669,085 | | $ | 308,158 | | $ | 1,540,798 |
Rex T. Clevenger | | — | | — | | 83,333 | | 916,667 | | | 27,500 | | | 302,500 |
Joseph P. Schiesl | | — | | — | | 208,332 | | 1,041,668 | | | 68,750 | | | 343,750 |
Timothy W. Kuck | | — | | — | | 50,000 | | 800,000 | | | 14,833 | | | 80,667 |
Jeffrey L. Singer | | — | | — | | 125,000 | | 625,000 | | | 41,250 | | | 206,250 |
| (1) | The value of the unexercised options is determined by multiplying the number of shares underlying the options by the difference between the exercise price of the options and the fair market value of our common stock of $1.33 per share as of December 31, 2005. |
66
PENSION PLAN
The following table sets forth various estimated maximum annual pension benefits under our qualified non-contributory defined benefit pension plan, on a straight life annuity basis, based upon Social Security benefits now available, assuming retirement at age 65 at various levels of compensation and specified remuneration and years of credited service. Amounts shown are subject to Social Security offset.
| | | | | | | | | | | | |
| Remuneration | | Years of Credited Service |
| | | 5 | | 10 | | 20 | | 30 |
| $100,000 | | $ | 6,008 | | $ | 12,016 | | $ | 24,032 | | $ | 30,040 |
| $125,000 | | | 8,008 | | | 16,016 | | | 32,032 | | | 40,040 |
| $150,000 | | | 10,008 | | | 20,016 | | | 40,032 | | | 50,040 |
| $200,000 | | | 14,008 | | | 28,016 | | | 56,032 | | | 70,040 |
| $300,000 | | | 14,008 | | | 28,016 | | | 56,032 | | | 70,040 |
A participant’s remuneration covered by the pension plan is his or her average salary (as reported in the Summary Compensation Table) for the five consecutive plan years in which the employee received his or her highest average compensation, subject to IRS limits. As of December 31, 2005, Mr. Singer had 4.4 years of credited service under the pension plan. None of the other named executive officers are covered by the pension plan.
Future benefit accruals for all participants were frozen as of December 31, 2002. Additional service or compensation changes of participants after that date are not considered for purposes of computing participant accrued benefit, however, accumulated service after December 31, 2002, continues to be taken into account for purposes of determining a participant’s vested interest and entitlement to an early retirement subsidy and certain death benefits.
EMPLOYMENT AGREEMENTS
We have an employment agreement with Gary D. Blackford expiring on June 30, 2006, subject to automatic one-year renewals thereafter, unless terminated by either party. Under the agreement, Mr. Blackford is entitled to an annual base salary of $310,000, subject to annual adjustment by the board of directors and a bonus of up to 160% of his annual base salary based on achievement of financial targets. If Mr. Blackford’s employment is terminated by reason of death or disability, Mr. Blackford, or his legal representatives, will be entitled to continued payments of salary and benefits for a 12-month period from the date of termination. If Mr. Blackford’s employment is terminated for cause or he resigns without good reason (as defined in the agreement), he will not be entitled to any benefits or payments that would otherwise be due to him under the agreement, other than payments for services previously rendered. We will continue to pay Mr. Blackford his base salary and provide his benefits for a period of 12 months (or 24 months in the event of a “Change in Control” as described below) from the date of
67
termination plus a lump sum payment equal to 72% of his base salary in effect at the time of termination in the event that his employment is:
| | • | | terminated by us without cause or by him for good reason (as defined in the agreement); |
| | • | | terminated by us without cause or he resigns for good reason (as defined in the agreement) within six months prior to, or 24 months following a “Change of Control,” or terminated by him for any reason during the 30-day period following the six month anniversary of such Change of Control; or |
| | • | | not renewed on expiration of the initial term of the employment agreement or the first one-year renewal term. |
“Change of Control” is defined substantially as set forth below. The agreement also provides that if Mr. Blackford receives payments under the agreement that would subject him to any federal excise tax due under Sections 280G and 4999 of the Internal Revenue Code, then he will also receive a cash “gross-up” payment so that he will be in the same net after-tax position that he would have been in had such excise tax not been applied.
We have an employment agreement with Joseph P. Schiesl. Under the agreement, Mr. Schiesl is entitled to an annual base salary of $230,000, subject to annual adjustments based on board of directors review, a bonus based on achievement of financial targets and stock options that vest upon achievement of financial measures. If Mr. Schiesl’s employment is terminated by reason of his death or disability, Mr. Schiesl, or his legal representatives, will be entitled to continued payments of salary and benefits for a 12-month period from the date of termination. If Mr. Schiesl’s employment is terminated for cause or he resigns without good reason (as defined in the employment agreement), he will not be entitled to any benefits or payments that would otherwise be due to him under the employment agreement, other than payments for services previously rendered. We will continue to pay Mr. Schiesl his base salary and provide his benefits for a period of 12 months from the date of termination plus a lump sum payment equal to the amount of the bonus that would have been payable to Mr. Schiesl during such year of termination had we achieved 100% of the applicable financial targets for such year, in the event that his employment is:
| | • | | terminated by us without cause or by him for good reason (as defined in the agreement); or |
| | • | | terminated by us without cause or he resigns for good reason (as defined in the agreement) within six months prior to, or 24 months following, a “Change of Control” (substantially as defined below) or terminated by him for any reason during the 30-day period following the six month anniversary of such Change of Control. |
68
We have an employment agreement with Walter T. Chesley. The terms of Mr. Chesley’s employment agreement are substantially identical to those of Mr. Schiesl’s employment agreement, except that Mr. Chesley is entitled to an annual base salary of $170,000.
We have an employment agreement with Rex T. Clevenger. The terms of Mr. Clevenger’s employment agreement are substantially identical to those of Mr. Schiesl’s and Mr. Chesley’s, except Mr. Clevenger is entitled to the following:
| | • | | an annual base salary of $275,000 with pro rated guaranteed bonus of approximately $90,000 in 2004; |
| | • | | under a Change of Control, continuation of base salary benefits for 18 months from the date of termination and 150% of target bonus, subject to the terms of the employment agreement; and |
| | • | | an option grant for the purchase of 1,000,000 shares of our stock pursuant to our 2003 Stock Option Plan; |
We have an agreement with Mr. Dovenberg, effective January 1, 2004, pursuant to which Mr. Dovenberg is Non-Executive Chairman of the Board. Under this agreement, Mr. Dovenberg is entitled to an annual base salary of $150,000 for the 2004 fiscal year, $125,000 for the 2005 fiscal year and $100,000 for the 2006 fiscal year and until the earlier of the termination of his employment or June 2009. In February 2005, the board agreed to maintain the annual base salary at $150,000 in 2005. In February 2006, the board agreed to maintain the annual base salary at $150,000 in 2006. In addition, Mr. Dovenberg was granted options to purchase 240,000 shares of our common stock. While Mr. Dovenberg is not entitled to receive any bonus under this employment agreement, the board approved payment of a bonus of approximately $29,497 for 2004 and $25,000 for 2005. If Mr. Dovenberg’s employment is terminated by reason of disability or without cause (as defined in the agreement), Mr. Dovenberg, or his legal representatives, will be entitled to an annual payment of $100,000 from the date of termination through June 30, 2009. If Mr. Dovenberg’s employment is terminated for cause, by reason of death or following a “Change of Control” by an unrelated third party, he will not be entitled to any benefits or payments that would otherwise be due to him under the agreement, other than payments for services previously rendered. In addition, this agreement contains confidentiality, noncompetition and nonsolicitation provisions.
“Change of Control” is defined in the agreement to include the acquisition (other than by us, JWC Fund I, a fiduciary holding securities under our employee benefit plans, or by a subsidiary or other corporation owned by our stockholders in the same proportions as their ownership of our stock) of substantially all of our assets or of beneficial ownership of securities representing more than 50% of our combined voting power or, prior to a public offering, more than 50% of our outstanding shares of common stock.
SEVERANCE PLAN
We have adopted a severance plan for the President and each Senior Vice President and Vice President, Controller and General Counsel (excluding Mr. Dovenberg, Mr. Blackford, Mr. Chesley, Mr. Clevenger, Mr. Schiesl, and each other executive whose severance arrangements are contained in his employment agreement), which entitles them
69
to certain payments in the event of a termination of employment with us, excluding termination for cause and voluntary resignation other than for good reason (as defined in the plan). Upon a qualifying termination, the executive will continue to receive, as severance, payment of his or her base salary and a lump sum payment for Cobra premiums for the extension of medical and dental benefits for 12 months. If the executive finds other employment prior to the 12 month anniversary of termination, the base salary will be reduced by the value of the compensation received from the new employer during that 12-month period and the medical and dental benefits will be discontinued if comparable benefits are provided by the new employer through the end of that 12-month period. Except for the Controller and General Counsel, if the executive’s termination was due to resignation for good cause, the executive will also receive a prorated portion of the bonus earned for the then current fiscal year. The severance payments are subject to the executive’s execution of a general release and other agreements containing confidentiality, noncompetition and nonsolicitation obligations. As long as Mr. Dovenberg’s, Mr. Blackford’s, Mr. Chesley’s, Mr. Clevenger’s and Mr. Schiesl’s employment agreements are still in force, their respective severance arrangements are included in their employment agreement rather than being governed by the severance plan. The severance plan may be modified by our Chief Executive Officer and our board of directors.
2003 STOCK OPTION PLAN
In connection with the recapitalization and our repurchase of all of our outstanding options previously issued under the 1998 stock option plan which we terminated on December 8, 2003, we adopted a new stock option plan under which we began issuing options in 2004. The 2003 stock option plan provides for the grant of incentive stock options to any of our full or part-time employees, including officers and directors who are also employees. The exercise price for the incentive stock options equals the estimated fair market value of our common stock on the date such options are granted, as determined by our board of directors. We may also grant stock options to non-employee directors and consultants or independent contractors providing services to us. The exercise price for the nonqualifying options will generally be equal to the fair market value of our common stock on the date such options are granted, as determined by our board of directors; however, the board will have discretion to issue such options at exercise prices lower than fair market value. The plan is administered by the compensation committee of our board of directors. Under the plan, the committee has the authority to select the persons to whom awards are granted, to determine the exercise price, if any, and the number of shares of common stock covered by such awards, and to set other terms and conditions of awards, including any vesting schedule. Our board of directors is permitted to amend, alter, suspend, discontinue or terminate the plan at any time, and the committee or the board is permitted to amend or terminate any outstanding award, except that an outstanding award may not be amended or terminated without the holder’s consent if such amendment or termination would adversely affect the rights of the holder.
While the terms of the options to be granted under this plan will be determined at the
70
time of grant, our employee stock options issued in 2005 will expire ten years after grant and are comprised of two general types: (1) options with fixed vesting schedules and (2) options that vest upon the achievement of established performance targets.
COMPENSATION COMMITTEE INTERLOCKS AND INSIDER PARTICIPATION
Our board of directors has a compensation committee consisting of certain of our directors. The members of the compensation committee are David W. Dupree, Samuel B. Humphries and Edward D. Yun. Mr. Humphries is the chairman but, as an advisory director, does not vote on matters before such committee.
Mr. Yun became a member of our compensation committee on October 17, 2003. Mr. Yun is a party to the stockholders’ agreement we entered into in connection with the recapitalization. Mr. Yun is also an affiliate of JWC Fund I and JWC Fund III, which are also parties to that stockholders’ agreement. JWC Fund III entered into a stock purchase agreement with us. Mr. Yun is also an affiliate of J.W. Childs Associates, L.P., which has entered into a management agreement with us.
Mr. Dupree, who became a member of our compensation committee on October 17, 2003, is an affiliate of Halifax, which, in connection with the recapitalization, entered into a stock purchase agreement with us and also entered into the new stockholders’ agreement with us on October 17, 2003. In addition, the general partner of Halifax entered into a management agreement with us on October 17, 2003.
For a further description of the transactions between the foregoing members of our compensation committee, their affiliates and us, see Item 13 of this Annual Report on Form 10-K.
ITEM 12: Security Ownership of Certain Beneficial Owners and Management and Related Stockholder Matters
SECURITY OWNERSHIP OF CERTAIN BENEFICIAL OWNERS AND MANAGEMENT
The following table shows information known to us with respect to the beneficial ownership of our common stock as of March 1, 2006, by
| • | | each person (or group of affiliated persons) known by us to be the owner of more than 5% of our outstanding common stock; |
| • | | each of our directors and our advisory director; |
| • | | each of our executive officers listed in the summary compensation table; and |
| • | | all of our directors and executive officers and our advisory director as a group. |
71
Beneficial ownership is determined in accordance with rules of the SEC, and includes generally voting power and/or investment power with respect to securities. Unless otherwise indicated, the principal address of each of the stockholders below is c/o Universal Hospital Services, Inc.
| | | | | |
Beneficial owner | | Number of shares beneficially owned(1) | | Percentage of shares beneficially owned | |
Steven G. Segal(2)(3) | | 91,837,882 | | 74.4 | % |
Michael N. Cannizzaro(2)(3) | | 91,837,882 | | 74.4 | % |
Edward D. Yun(2)(3) | | 91,837,882 | | 74.4 | % |
Mark J. Tricolli(2)(3) | | 91,837,882 | | 74.4 | % |
J.W. Childs Equity Partners, L.P(2)(14) | | 52,859,339 | | 42.8 | % |
JWC UHS Co-invest LLC(2) | | 3,978,543 | | 3.2 | % |
JWC Co-invest III LLC(2) | | 737,531 | | * | |
David E. Dovenberg(4) | | 6,730,724 | | 5.5 | % |
David W. Dupree(5)(6) | | 20,050,000 | | 16.2 | % |
Brent D. Williams(6)(7) | | 20,000,000 | | 16.2 | % |
Timothy W. Kuck (8) | | 150,000 | | * | |
Gary D. Blackford(9) | | 2,479,272 | | 2.0 | % |
Samuel B. Humphries (10) | | 296,484 | | * | |
J.W. Childs Equity Partners III, L.P.(2) | | 34,262,469 | | 27.8 | % |
Jeffrey Singer (11) | | 1,237,680 | | 1 | % |
Rex T. Clevenger (12) | | 83,333 | | * | |
Joseph S. Schiesl (13) | | 347,932 | | * | |
Halifax Capital Partners, L.P.(5) | | 20,000,000 | | 16.2 | % |
All officers, directors and advisory directors as a group (16 persons) (15) | | 123,646,638 | | 98.8. | % |
| (1) | Except as indicated by footnote, the persons named in the table above have the sole voting and investment power with respect to all shares of common stock shown as beneficially owned by them. |
| (2) | The address for these stockholders is c/o J.W. Childs Associates, L.P., 111 Huntington Avenue, Boston, Massachusetts 02199-7610. |
| (3) | Includes 52,859,339 shares of common stock held by J.W. Childs Equity Partners, L.P., 34,262,469 shares of common stock held by J.W. Childs Equity Partners III, L.P., 737,531 shares of common stock held by JWC Fund III Co-invest LLC and 3,978,543 shares held by JWC UHS Co-invest LLC which this stockholder may be deemed to beneficially own by virtue of his position with J.W. Childs Associates, L.P., an affiliate of J.W. Childs Equity Partners, L.P, J.W. Childs Equity Partners III, L.P., JWC Fund III Co-invest LLC and JWC UHS Co-invest LLC. |
| (4) | Includes 98,000 shares of common stock held by Mr. Dovenberg’s son, 44,000 shares of common stock held by Mr. Dovenberg’s daughter, 2,777,092 shares of common stock held by Mr. Dovenberg’s wife, 11,000 shares of common stock held by Mr. Dovenberg’s sister-in-law, 20,000 shares of common stock held by Mr. Dovenberg’s son-in–law, 20,000 shares of common stock held by Mr. Dovenberg’s daughter-in-law for which Mr. |
72
Dovenberg has an irrevocable proxy, which may be deemed to be beneficially owned by Mr. Dovenberg, and options to purchase 40,000 shares of common stock that are exercisable or become exercisable within 60 days of December 31, 2005.
| (5) | The address for these stockholders is c/o The Halifax Group, 1133 Connecticut Avenue, N.W., Suite 725, Washington, D.C. 20036. |
| (6) | Includes 20,000,000 shares of common stock held by Halifax Capital Partners, L.P., which this stockholder may be deemed to beneficially own by virtue of his position with The Halifax Group L.L.C. |
| (7) | The address for this stockholder is c/o The Halifax Group, 200 Crescent Court, Suite 1040, Dallas, Texas 75201. |
| (8) | Includes options to purchase 50,000 shares of common stock that are exercisable or become exercisable within 60 days of March 1, 2006. |
| (9) | Includes 670,460 shares of common stock held by Mr. Blackford’s wife, which may be deemed to be beneficially owned by Mr. Blackford, and options to purchase 933,812 shares of common stock that are exercisable or become exercisable within 60 days of December 31, 2005. |
| (10) | Includes options to purchase 36,000 shares of common stock that are exercisable or become exercisable within 60 days of March 1, 2006. |
| (11) | Includes options to purchase 125,000 shares of common stock that are exercisable or become exercisable within 60 days of March 1, 2006. |
| (12) | Includes options to purchase 83,333 shares of common stock that are exercisable or become exercisable within 60 days of March 1, 2006. |
| (13) | Includes options to purchase 208,332 shares of common stock that are exercisable or become exercisable within 60 days of March 1, 2006. |
| (14) | On December 2, 2003, J.W. Childs Equity Partners, LP pledged all its shares of common stock to Citibank, N.A. to secure a $10 million term loan. Operation of the pledge could result in a change in control. |
| (15) | Includes options to purchase 1,734,808 shares of common stock that are exercisable or become exercisable within 60 days of February 23, 2006. |
EQUITY COMPENSATION PLANS
The following table summarizes as of December 31, 2005, the shares of our common stock subject to outstanding awards or available for future awards under our equity compensation plans and arrangements.
73
| | | | | | | | |
Plan Category | | Number of Securities to be Issued Upon Exercise of Outstanding Options, Warrants and Rights | | Weighted-average Exercise Price of Outstanding Options, Warrants and Rights | | Number of Securities Remaining Available for Future Issuance under Equity Compensation Plans (excluding shares reflected in the first column) | |
Equity Compensation Plans Approved by Security Holders | | 15,067,297 | | $ | 1.04 | | 2,053,394 | (1) |
| | | |
Equity Compensation Plans Not Approved by Security Holders | | — | | | — | | — | |
| | | | | | | | |
Total | | 15,067,297 | | $ | 1.04 | | 2,053,394 | |
| | | | | | | | |
| (1) | Represents shares remaining available under our 2003 stock option plan. |
ITEM 13: Certain Relationships and Related Transactions
STOCKHOLDERS’ AGREEMENT
In connection with the recapitalization, on October 17, 2003, our former stockholders’ agreement was amended and restated. The stockholders of our recapitalized company, including each executive officer, director and employee who owns common stock, are parties to that agreement. The amended and restated stockholders’ agreement, among other things:
| | • | | restricts the ability of certain stockholders to transfer their shares; |
| | • | | gives stockholders certain rights of first refusal with respect to the share; |
| | • | | after October 17, 2008, gives certain stockholders the right to cause us to consummate a sale constituting a change in control if such sales constitute a minimum return on investment; and |
| | • | | provides the stockholders with certain “tag along”, “drag along” and “piggyback” registration rights. (For a copy of the Joint Stockholders’ Agreement, see Exhibit 4.5 to our Annual Report on Form 10-K of for the fiscal year ended December 31, 2003.) |
MANAGEMENT AGREEMENTS
We are a party to a management agreement with J.W. Childs Associates, L.P. under which we are obligated to pay J.W. Childs Associates, L.P. an annual management fee of $360,000 in consideration of its ongoing provision of certain consulting and management advisory services. Payments under this management agreement may be made only to the extent permitted by our senior secured credit facility and the indenture governing the notes. Mr. Segal and Mr. Yun are Partners, Mr. Cannizzaro is an Operating Partner, and Mr. Tricolli is a Vice President of J.W. Childs Associates, L.P.
74
In addition, in connection with the 2003 recapitalization, we entered into a management agreement with Halifax GenPar, L.P., the general partner of Halifax, pursuant to which we will pay to Halifax GenPar, L.P. an annual management fee of $120,000 in consideration of its ongoing provision of certain consulting and management advisory services. Payments under this management agreement may be made only to the extent permitted by our senior secured credit facility and the indenture governing the notes. Mr. Dupree and Mr. Williams are Managing Directors of The Halifax Group.
ITEM 14: Principal Accountant Fees and Services
The following table presents fees for professional services rendered by PricewaterhouseCoopers LLP for the audit of our annual financial statements for the fiscal years ended December 31, 2004, and December 31, 2005, and fees billed for other services rendered by PricewaterhouseCoopers LLP during those periods.
| | | | | | |
Types of Fees | | 2004 | | 2005 |
Audit Fees (1) | | $ | 295,396 | | $ | 198,789 |
Audit-Related Fees(2) | | | 20,598 | | | 58,411 |
Tax Fees (3) | | | 43,000 | | | 76,500 |
All Other Fees (4) | | | — | | | 2,459 |
| (1) | Audit fees consist of services rendered for the audit of the annual financial statements, including required quarterly reviews, statutory and regulatory filings or engagements and services that generally only the auditor can reasonably be expected to provide. |
| (2) | Audit-related fees were for assurance and related services related to employee benefit plan and consultations concerning financial accounting and reporting standards. |
| (3) | Tax fees are for professional services rendered for tax compliance, tax advice and tax planning. |
| (4) | All other fees are for services other than those in the previous categories. |
All decisions regarding selection of independent registered public accounting firms and approval of accounting services and fees are made by our Audit Committee in accordance with the provisions of the Sarbanes-Oxley Act of 2002 and related SEC rules. There are no exceptions to the policy of securing prior approval by our Audit Committee for any service provided by our independent registered public accounting firm.
75
PART IV
ITEM 15: Exhibits and Financial Statement Schedules
| (a) | The following documents are filed as part of this Report: |
Report of Independent Registered Public Accounting Firm
Balance Sheets as of December 31, 2005 and 2004
Statements of Operations for the years ended December 31, 2005, 2004, and 2003
Statements of Shareholders’ (Deficiency) Equity and Other Comprehensive Loss for the years ended December 31, 2005, 2004, and 2003
Statements of Cash Flows for the years ended December 31, 2005, 2004, and 2003
Notes to Financial Statements
| | 2. | Financial Statement Schedule required to be filed by Item 8 and Paragraph (c) of this Item 15. |
Schedule II -Valuation and Qualifying Accounts
All other supplemental financial schedules are omitted as not applicable or not required under the rules of Regulation S-X or the information is presented in the financial statements or notes thereto.
| | |
| Number | | Description |
| 3.1a | | Certificate of Amendment to Certificate of Incorporation of Universal Hospital Services, Inc.* |
| |
| 3.1b | | Certificate of Incorporation of Universal Hospital Services, Inc. ** |
| |
| 3.2a | | Amended and Restated Bylaws of Universal Hospital Services, Inc.* |
| |
| 3.3 | | Certification of Elimination of Series B 13% Cumulative Accruing Pay-In-Kind Preferred Stock of Universal Hospital Services, Inc.*** |
| |
| 4.1 | | Form of certificate of common stock** |
76
| | | | |
| Number | | Description |
| |
| 4.2 | | Indenture, dated as of October 17, 2003, by and between Universal Hospital Services, Inc. and Wells Fargo Bank, National Association, as Trustee, relating to the registrant’s 10.125% Senior Notes due 2011 (including Form of Note).* |
| |
| 4.3 | | Form of Amended and Restated Stockholders’ Agreement, dated October 17, 2003, by and among Universal Hospital Services, Inc., J.W. Childs Equity Partners III, L.P., JWC Fund III Co-invest LLC, Halifax Capital Partners, L.P. and the other stockholders of Universal Hospital Services, Inc.* |
| |
| 4.4 | | Exchange and Registration Rights Agreement, dated as of October 17, 2003, among Universal Hospital Services, Inc., Goldman, Sachs & Co,. Credit Suisse First Boston LLC, CIBC World Markets Corp. and Jefferies & Company, Inc.**** |
| |
| 4.5 | | 10.125% Senior Notes due 2011 in the aggregate principal amount of $259,880,000.**** |
| |
| 4.6 | | 10.125% Senior Note due 2011 in the aggregate principal amount of $120,000.**** |
| |
| 4.7 | | Blanket Issuer Letter of Representations, dated as of October 17, 2003, among Universal Hospital Services, Inc., Wells Fargo Bank, National Association and the Depository Trust Company.**** |
| |
| 10.1 | | Stock Purchase Agreement, dated as of September 26, 2003, among Universal Hospital Services, Inc., J.W. Childs Equity Partners III, L.P., JWC Fund III Co-invest LLC and Halifax Capital Partners, L.P.* |
| |
| 10.2 | | Amendment No. 1, dated October 17, 2003, to the Stock Purchase Agreement, dated as of September 26, 2003, among Universal Hospital Services, Inc., J.W. Childs Equity Partners III, L.P., JWC Fund III Co-invest LLC and Halifax Capital Partners, L.P.* |
| |
| 10.3 | | Joinder Agreements to Stock Purchase Agreement executed October 28, 2003.* |
| |
| 10.4 | | 2003 Stock Option Plan of Universal Hospital Services, Inc.****+ |
| |
| 10.5 | | Executive Severance Pay Plan dated February 1, 2005+ |
| |
| 10.6 | | Employment Agreement, dated as of June 25, 2002, between Universal Hospital Services, Inc. and Gary D. Blackford*****+ |
| |
| 10.7 | | Employment Agreement, dated as of February 14, 2003, between Universal Hospital Services, Inc. and Joseph P. Schiesl.***+ |
| |
| 10.8 | | Employment Agreement, dated as of February 25, 2003 between Universal Hospital Services, Inc. and Walter T. Chesley.***+ |
| |
| 10.9 | | Employment Agreement between Universal Hospital Services, Inc. and David E. Dovenberg, dated October 17, 2003.*+ |
| |
| 10.10 | | Employment Agreement between Universal Hospital Services, Inc. and Rex T. Clevenger, dated June 15, 2004.***+ |
| |
| 10.11 | | 2006 Executive Incentive Plan Targets+ |
| |
| 10.12 | | Amended and Restated Credit Agreement dated as of May 26, 2005, among Universal Hospital Services, Inc., as Borrower, the other credit parties signatory thereto, as Credit Parties, the lenders signatory thereto from time to time, as Lenders, and General Electric Capital Corporation, as Agent, Administrative Agent, Collateral Agent and Lender, and GECC Capital Markets Group, Inc. as Sole Lead Arranger and Sole Bookrunner.****** |
77
| | |
| Number | | Description |
| |
| 10.13 | | Form of Non-Qualified Stock Option Agreement for the 2003 Stock Option Plan.+ |
| |
| 12.1 | | Statement regarding the computation of ratio of earnings to fixed charges. |
| |
| 31.1 | | Certification of Principal Executive Officer Pursuant to Section 302 of the Sarbanes-Oxley Act of 2002. |
| |
| 31.2 | | Rule 13a-14(a)/15d-14(a) Certification of Principal Financial Officer Pursuant to Section 302 of the Sarbanes-Oxley Act of 2002. |
| |
| 32.1 | | Certification of Gary D. Blackford Pursuant to Section 906 of the Sarbanes-Oxley Act of 2002. |
| |
| 32.2 | | Certification of Rex T. Clevenger Pursuant to Section 906 of the Sarbanes-Oxley Act of 2002. |
| * | Previously filed as an Exhibit to the Quarterly Report on Form 10-Q of Universal Hospital Services, Inc. for the fiscal quarter ended September 30, 2003, and incorporated by reference herein. |
| ** | Previously filed as an Exhibit to Form S-1/A filed on September 5, 2001, and incorporated by reference herein. |
| *** | Previously filed as an Exhibit to the Quarterly Report on Form 10-Q of Universal Hospital Services, Inc. for the fiscal quarter ended June 30, 2004. |
| **** | Previously filed as an Exhibit to the Registrant’s Registration Statement on Form S-4 (File No. 333-111606) and incorporated by reference herein. |
| ***** | Previously filed as an Exhibit to Form 10-Q filed on August 14, 2002. |
| ****** | Previously filed as an Exhibit to the Current Report on Form 8-K of Universal Hospital Services, Inc. dated May 26, 2005. |
| + | Management contracts or compensatory plans or arrangements. |
78
SIGNATURES
Pursuant to the requirements of Section 13 or 15(d) of the Securities Exchange Act of 1934, the registrant has duly caused this report to be signed on its behalf by the undersigned thereunto duly authorized on March 29, 2006.
| | |
| UNIVERSAL HOSPITAL SERVICES, INC. |
| |
| By | | /s/ Gary D. Blackford |
| | Gary D. Blackford |
| | President and Chief Executive Officer |
Pursuant to the requirements of the Securities Exchange Act of 1934, this report has been signed by the following persons on behalf of the registrant and in the capacities indicated on March 29, 2006.
| | |
/s/ Gary D. Blackford | | President and Chief Executive Officer |
| Gary D. Blackford | | (Principal Executive Officer) |
| |
/s/ Rex T. Clevenger | | Senior Vice President and Chief Financial Officer |
| Rex T. Clevenger | | (Principal Financial Officer) |
| |
/s/ Andrew P. Weaver | | Controller and Chief Accounting Officer |
| Andrew P. Weaver | | (Principal Accounting Officer) |
| |
/s/ David E. Dovenberg | | Chairman of the Board of Directors and |
| David E. Dovenberg | | Non-Executive Chairman |
| |
/s/ Michael N. Cannizzaro | | Director |
| Michael N. Cannizzaro | | |
| |
/s/ David W. Dupree | | Director |
| David W. Dupree | | |
| |
/s/ Steven G. Segal | | Director |
| Steven G. Segal | | |
| |
/s/ Mark J. Tricolli | | Director |
| Mark J. Tricolli | | |
| |
/s/ Brent D. Williams | | Director |
| Brent D. Williams | | |
| |
/s/ Edward D. Yun | | Director |
| Edward D. Yun | | |
79
SUPPLEMENTAL INFORMATION TO BE FURNISHED WITH REPORTS FILED PURSUANT TO SECTION 15(d) OF THE ACT BY REGISTRANTS WHICH HAVE NOT REGISTERED SECURITIES PURSUANT TO SECTION 12 OF THE ACT
No annual report relating to the fiscal year ended December 31, 2005 or proxy statement with respect to any annual or other meeting of security holders has been sent to security holders, nor will such information be sent to security holders.
Universal Hospital Services, Inc.
Financial Statements
December 31, 2005 and 2004
Universal Hospital Services, Inc.
Index
December 31, 2005 and 2004
Report of Independent Registered Public Accounting Firm
To the Board of Directors and Shareholders of
Universal Hospital Services, Inc.
In our opinion, the financial statements listed in the index appearing under Item 15(a)(1) present fairly, in all material respects, the financial position of Universal Hospital Services, Inc. (the “Company”) at December 31, 2005 and 2004, and the results of its operations and its cash flows for each of the three years in the period ended December 31, 2005, in conformity with accounting principles generally accepted in the United States of America. In addition, in our opinion, the financial statement schedule listed in the index appearing under Item 15(a)(2) presents fairly, in all material respects, the information set forth therein when read in conjunction with the related financial statements. These financial statements and financial statement schedule are the responsibility of the Company’s management. Our responsibility is to express an opinion on these financial statements and financial statement schedule based on our audits. We conducted our audits of these statements in accordance with the standards of the Public Company Accounting Oversight Board (United States). Those standards require that we plan and perform the audit to obtain reasonable assurance about whether the financial statements are free of material misstatement. An audit includes examining, on a test basis, evidence supporting the amounts and disclosures in the financial statements, assessing the accounting principles used and significant estimates made by management, and evaluating the overall financial statement presentation. We believe that our audits provide a reasonable basis for our opinion.
PricewaterhouseCoopers LLP
Minneapolis Minnesota
March 17, 2006
F-1
Universal Hospital Services, Inc.
Balance Sheets
December 31, 2005 and 2004
| | | | | | | | |
(in thousands of dollars, except share amounts) | | 2005 | | | 2004 | |
Assets | | | | | | | | |
Current assets | | | | | | | | |
Accounts receivable, net | | $ | 41,865 | | | $ | 40,644 | |
Inventories | | | 5,117 | | | | 5,229 | |
Deferred income taxes | | | 4,111 | | | | 2,449 | |
Other current assets | | | 2,375 | | | | 3,458 | |
| | | | | | | | |
Total current assets | | | 53,468 | | | | 51,780 | |
| | |
Property and equipment, net | | | | | | | | |
Movable medical equipment, net | | | 126,775 | | | | 125,987 | |
Property and office equipment, net | | | 12,695 | | | | 10,042 | |
| | | | | | | | |
Total property and equipment, net | | | 139,470 | | | | 136,029 | |
| | |
Intangible assets | | | | | | | | |
Goodwill | | | 37,062 | | | | 37,062 | |
Other, primarily deferred financing costs, net | | | 9,434 | | | | 10,471 | |
Other intangibles, net | | | 9,751 | | | | 11,065 | |
| | | | | | | | |
Total assets | | $ | 249,185 | | | $ | 246,407 | |
| | | | | | | | |
Liabilities and Shareholders’ (Deficiency) Equity | | | | | | | | |
Current liabilities | | | | | | | | |
Current portion of long-term debt | | $ | 1,084 | | | $ | 328 | |
Book overdrafts | | | 2,480 | | | | 4,691 | |
Accounts payable | | | 14,393 | | | | 13,406 | |
Accrued compensation | | | 8,895 | | | | 9,276 | |
Accrued interest | | | 4,481 | | | | 4,615 | |
Other accrued expenses | | | 3,840 | | | | 2,594 | |
| | | | | | | | |
Total current liabilities | | | 35,173 | | | | 34,910 | |
| | |
Long-term debt, less current portion | | | 299,396 | | | | 296,974 | |
Pension liability | | | 5,249 | | | | 3,644 | |
Deferred income taxes | | | 6,166 | | | | 3,937 | |
| | |
Commitments and contingencies (Note 7) | | | | | | | | |
| | |
Shareholders’ (deficiency) equity | | | | | | | | |
Common stock, $0.01 par value; 500,000,000 shares authorized, 123,438,105 and 123,430,613 shares issued and outstanding at December 31, 2005 and 2004, respectively | | | 1,234 | | | | 1,234 | |
Additional paid-in capital | | | 820 | | | | 760 | |
Accumulated deficit | | | (93,579 | ) | | | (92,010 | ) |
Deferred compensation | | | (94 | ) | | | (62 | ) |
Accumulated other comprehensive loss | | | (5,180 | ) | | | (2,980 | ) |
| | | | | | | | |
Total shareholders’ (deficiency) equity | | | (96,799 | ) | | | (93,058 | ) |
| | | | | | | | |
Total liabilities and shareholders’ (deficiency) equity | | $ | 249,185 | | | $ | 246,407 | |
| | | | | | | | |
The accompanying notes are an integral part of these financial statements.
F-2
Universal Hospital Services, Inc.
Statements of Operations
Years Ended December 31, 2005, 2004 and 2003
| | | | | | | | | | | | |
(in thousands of dollars) | | 2005 | | | 2004 | | | 2003 | |
Revenues | | | | | | | | | | | | |
Medical equipment outsourcing | | $ | 167,687 | | | $ | 156,490 | | | $ | 140,233 | |
Technical and professional services | | | 29,654 | | | | 25,491 | | | | 14,662 | |
Medical equipment sales and remarketing | | | 18,563 | | | | 17,619 | | | | 16,110 | |
| | | | | | | | | | | | |
Total revenues | | | 215,904 | | | | 199,600 | | | | 171,005 | |
| | | | | | | | | | | | |
Costs of medical equipment outsourcing, technical and professional services and medical equipment sales and remarketing | | | | | | | | | | | | |
Cost of medical equipment outsourcing | | | 52,499 | | | | 47,178 | | | | 42,427 | |
Movable medical equipment depreciation | | | 37,966 | | | | 36,003 | | | | 32,111 | |
Cost of technical and professional services | | | 21,878 | | | | 17,295 | | | | 9,306 | |
Cost of medical equipment sales and remarketing | | | 14,706 | | | | 13,307 | | | | 11,554 | |
| | | | | | | | | | | | |
Total costs of medical equipment outsourcing, technical and professional services and medical equipment sales and remarketing | | | 127,049 | | | | 113,783 | | | | 95,398 | |
| | | | | | | | | | | | |
Gross margin | | | 88,855 | | | | 85,817 | | | | 75,607 | |
| | | | | | | | | | | | |
Selling, general and administrative | | | | | | | | | | | | |
Recapitalization, stock compensation and severance expenses | | | — | | | | — | | | | 14,385 | |
Other selling, general and administrative | | | 58,455 | | | | 57,713 | | | | 46,956 | |
| | | | | | | | | | | | |
Total selling, general and administrative | | | 58,455 | | | | 57,713 | | | | 61,341 | |
| | | | | | | | | | | | |
Operating income | | | 30,400 | | | | 28,104 | | | | 14,266 | |
| | | |
Interest expense | | | 31,127 | | | | 30,508 | | | | 20,245 | |
Loss on early retirement of debt | | | — | | | | — | | | | 13,272 | |
| | | | | | | | | | | | |
Loss before income taxes | | | (727 | ) | | | (2,404 | ) | | | (19,251 | ) |
Provision for income taxes | | | 842 | | | | 1,188 | | | | 275 | |
| | | | | | | | | | | | |
Net loss | | $ | (1,569 | ) | | $ | (3,592 | ) | | $ | (19,526 | ) |
| | | | | | | | | | | | |
The accompanying notes are an integral part of these financial statements.
F-3
Universal Hospital Services, Inc.
Statements of Shareholders’ (Deficiency) Equity and Other Comprehensive Loss
Years Ended December 31, 2005, 2004 and 2003
| | | | | | | | | | | | | | | | | | | | | | | | |
(in thousands of dollars, except share amounts) | | Common
Stock | | | Additional
Paid-in
Capital | | | Accumulated
Deficit | | | Deferred
Compensation | | | Accumulated
Other
Comprehensive
Loss | | | Total
Shareholders’
(Deficiency)
Equity | |
Balances at December 31, 2002 | | $ | 1,367 | | | $ | 5,770 | | | $ | (60,107 | ) | | $ | (657 | ) | | $ | (1,732 | ) | | $ | (55,359 | ) |
| | | | | | |
Issuance of 275,535 shares of common stock | | | 3 | | | | 48 | | | | — | | | | — | | | | — | | | | 51 | |
Accretion of common stock subject to put | | | — | | | | (1,132 | ) | | | — | | | | — | | | | — | | | | (1,132 | ) |
Preferred stock dividends | | | — | | | | — | | | | (1,072 | ) | | | — | | | | — | | | | (1,072 | ) |
Accretion of detachable warrants issued in connection with preferred stock | | | — | | | | — | | | | (87 | ) | | | — | | | | — | | | | (87 | ) |
Amortization of deferred compensation | | | — | | | | — | | | | — | | | | 170 | | | | — | | | | 170 | |
Redemption of detachable warrants | | | — | | | | (2,938 | ) | | | — | | | | — | | | | — | | | | (2,938 | ) |
Cancellation of common stock subject to put | | | — | | | | 12,708 | | | | — | | | | — | | | | — | | | | 12,708 | |
Issuance of 56,222,200 shares of common stock pursuant to the recapitalization (Note 2) | | | 562 | | | | 55,660 | | | | — | | | | — | | | | — | | | | 56,222 | |
Repurchase of 69,965,845 shares of common stock pursuant to the recapitalization (Note 2) | | | (699 | ) | | | (69,266 | ) | | | — | | | | — | | | | — | | | | (69,965 | ) |
Repurchase of stock options | | | — | | | | (850 | ) | | | (7,093 | ) | | | 487 | | | | — | | | | (7,456 | ) |
Repurchase of 494,770 shares of common stock | | | (5 | ) | | | — | | | | (490 | ) | | | — | | | | — | | | | (495 | ) |
Net loss | | | — | | | | — | | | | (19,526 | ) | | | — | | | | — | | | | | |
Unrealized loss on minimum pension liability adjustment | | | — | | | | — | | | | — | | | | — | | | | (1,024 | ) | | | | |
Comprehensive loss | | | | | | | | | | | | | | | | | | | | | | | (20,550 | ) |
| | | | | | | | | | | | | | | | | | | | | | | | |
Balances at December 31, 2003 | | | 1,228 | | | | — | | | | (88,375 | ) | | | — | | | | (2,756 | ) | | | (89,903 | ) |
| | | | | | |
Repurchase of 43,344 shares of common stock | | | (1 | ) | | | — | | | | (43 | ) | | | — | | | | — | | | | (44 | ) |
Issuance of 704,995 shares of common stock | | | 7 | | | | 698 | | | | — | | | | — | | | | — | | | | 705 | |
Deferred compensation | | | — | | | | 62 | | | | — | | | | (62 | ) | | | — | | | | — | |
Net loss | | | — | | | | — | | | | (3,592 | ) | | | — | | | | — | | | | | |
Unrealized loss on minimum pension liability adjustment | | | — | | | | — | | | | — | | | | — | | | | (224 | ) | | | | |
Comprehensive loss | | | | | | | | | | | | | | | | | | | | | | | (3,816 | ) |
| | | | | | | | | | | | | | | | | | | | | | | | |
Balances at December 31, 2004 | | | 1,234 | | | | 760 | | | | (92,010 | ) | | | (62 | ) | | | (2,980 | ) | | | (93,058 | ) |
F-4
Universal Hospital Services, Inc.
Statements of Shareholders’ (Deficiency) Equity and Other Comprehensive Loss
Years Ended December 31, 2005, 2004 and 2003
| | | | | | | | | | | | | | | | | | | | | | |
(in thousands of dollars, except share amounts) | | Common
Stock | | Additional
Paid-in
Capital | | Accumulated
Deficit | | | Deferred
Compensation | | | Accumulated
Other
Comprehensive
Loss | | | Total
Shareholders’
(Deficiency)
Equity | |
Balances at December 31, 2004 | | | 1,234 | | | 760 | | | (92,010 | ) | | | (62 | ) | | | (2,980 | ) | | | (93,058 | ) |
| | | | | | |
Issuance of 7,492 shares of common stock | | | — | | | 8 | | | — | | | | — | | | | — | | | | 8 | |
Deferred compensation | | | — | | | 52 | | | — | | | | (32 | ) | | | — | | | | 20 | |
Net loss | | | — | | | — | | | (1,569 | ) | | | — | | | | — | | | | | |
Unrealized loss on minimum pension liability adjustment | | | — | | | — | | | — | | | | — | | | | (2,200 | ) | | | | |
Compensation loss | | | | | | | | | | | | | | | | | | | | | (3,769 | ) |
| | | | | | | | | | | | | | | | | | | | | | |
Balances at December 31, 2005 | | $ | 1,234 | | $ | 820 | | $ | (93,579 | ) | | $ | (94 | ) | | $ | (5,180 | ) | | $ | (96,799 | ) |
| | | | | | | | | | | | | | | | | | | | | | |
The accompanying notes are an integral part of these financial statements.
F-5
Universal Hospital Services, Inc.
Statements of Cash Flows
Years Ended December 31, 2005, 2004 and 2003
| | | | | | | | | | | | |
(in thousands of dollars) | | 2005 | | | 2004 | | | 2003 | |
Cash flows from operating activities | | | | | | | | | | | | |
Net loss | | $ | (1,569 | ) | | $ | (3,592 | ) | | $ | (19,526 | ) |
Adjustments to reconcile net loss to net cash provided by operating activities | | | | | | | | | | | | |
Depreciation | | | 42,804 | | | | 39,217 | | | | 34,401 | |
Amortization of deferred financing costs and other intangibles | | | 3,523 | | | | 2,880 | | | | 1,131 | |
Accretion of bond discount | | | — | | | | — | | | | 415 | |
Provision for doubtful accounts | | | 927 | | | | 984 | | | | 762 | |
Provision for inventory obsolescence | | | 677 | | | | 509 | | | | 462 | |
Noncash stock-based compensation | | | 20 | | | | — | | | | 170 | |
(Gain) loss on sales and disposals of equipment | | | (659 | ) | | | (892 | ) | | | 181 | |
Loss on early retirement of debt | | | — | | | | — | | | | 5,877 | |
Deferred income taxes | | | 567 | | | | 1,103 | | | | — | |
Changes in operating assets and liabilities, net of impact of acquisitions | | | | | | | | | | | | |
Accounts receivable | | | (1,999 | ) | | | (5,416 | ) | | | (4,800 | ) |
Inventories and other operating assets | | | 520 | | | | (2,862 | ) | | | (1,216 | ) |
Accounts payable and accrued expenses | | | (848 | ) | | | 6,035 | | | | (1,900 | ) |
| | | | | | | | | | | | |
Net cash provided by operating activities | | | 43,963 | | | | 37,966 | | | | 15,957 | |
| | | | | | | | | | | | |
Cash flows from investing activities | | | | | | | | | | | | |
Rental equipment purchases | | | (38,096 | ) | | | (47,118 | ) | | | (33,715 | ) |
Property and office equipment purchases | | | (4,022 | ) | | | (6,102 | ) | | | (3,307 | ) |
Proceeds from disposition of rental equipment | | | 2,602 | | | | 3,174 | | | | 2,331 | |
Acquisitions | | | (1,115 | ) | | | (15,104 | ) | | | (1,875 | ) |
Other | | | — | | | | — | | | | (204 | ) |
| | | | | | | | | | | | |
Net cash used in investing activities | | | (40,631 | ) | | | (65,150 | ) | | | (36,770 | ) |
| | | | | | | | | | | | |
Cash flows from financing activities | | | | | | | | | | | | |
Proceeds under revolving credit facility agreements | | | 98,557 | | | | 113,041 | | | | 70,500 | |
Payments under revolving credit facility agreements | | | (97,741 | ) | | | (86,866 | ) | | | (128,714 | ) |
Proceeds from issuance of senior notes | | | — | | | | — | | | | 260,000 | |
Redemption of senior notes | | | — | | | | — | | | | (135,000 | ) |
Payments under capital lease obligations | | | (1,089 | ) | | | — | | | | — | |
Proceeds from issuance of common stock, net of issuance costs | | | 8 | | | | 705 | | | | 56,273 | |
Repurchase of common stock and options | | | — | | | | (44 | ) | | | (77,916 | ) |
Redemption of Series B preferred stock | | | — | | | | — | | | | (13,769 | ) |
Payment of deferred financing costs | | | (856 | ) | | | (453 | ) | | | (11,740 | ) |
Change in book overdraft | | | (2,211 | ) | | | 801 | | | | 1,179 | |
| | | | | | | | | | | | |
Net cash (used in) provided by financing activities | | | (3,332 | ) | | | 27,184 | | | | 20,813 | |
| | | | | | | | | | | | |
Net change in cash and cash equivalents | | | — | | | | — | | | | — | |
Cash and cash equivalents | | | | | | | | | | | | |
Beginning of period | | | — | | | | — | | | | — | |
| | | | | | | | | | | | |
End of period | | $ | — | | | $ | — | | | $ | — | |
| | | | | | | | | | | | |
Supplemental cash flow information | | | | | | | | | | | | |
Interest paid | | $ | 29,355 | | | $ | 29,812 | | | $ | 18,841 | |
Income taxes paid (received) | | | 85 | | | | (98 | ) | | | 348 | |
The accompanying notes are an integral part of these financial statements.
F-6
Universal Hospital Services, Inc.
Notes to Financial Statements
December 31, 2005 and 2004
(in thousands of dollars)
| 1. | Description of Business |
Universal Hospital Services, Inc. (the “Company” or “UHS”) is a nationwide provider of services to the health care industry. The Company’s services fall into three general categories: medical equipment outsourcing, technical and professional services, and medical equipment sales and remarketing.
| 2. | Significant Accounting Policies |
Cash and Cash Equivalents
The Company considers all highly liquid investments purchased with an original maturity of three months or less to be cash equivalents.
Accounts Receivable and Allowance for Doubtful Accounts
Trade accounts receivable are recorded at the invoiced amount. The Company performs initial and ongoing credit evaluations of its customers and maintains allowances for potential credit losses. The allowance for doubtful accounts is based on historical loss experience and estimated exposure on specific trade receivables.
Inventories
Inventories consist of supplies and equipment held for resale and are valued at the lower of cost or market. Cost is determined by the average cost method, which approximates the first-in, first-out (“FIFO”) method.
Movable Medical Equipment
Depreciation of movable medical equipment is provided on the straight-line method over the equipment’s estimated useful life of generally four to seven years. The cost and accumulated depreciation of movable medical equipment retired or sold is eliminated from their respective accounts and the resulting gain or loss is recorded as gain or loss on sales of supplies and equipment.
Property and Office Equipment
Property and office equipment includes land, buildings, leasehold improvements and office equipment.
Depreciation and amortization of property and office equipment is provided on the straight-line method over estimated useful lives of 30 years for buildings, the lesser of the remaining useful life or lease term for leasehold improvements, and 3 to 10 years for shop and office equipment. The cost and accumulated depreciation or amortization of property and equipment retired or sold is eliminated from their respective accounts and the resulting gain or loss is recorded in other selling, general and administrative.
F-7
Universal Hospital Services, Inc.
Notes to Financial Statements
December 31, 2005 and 2004
(in thousands of dollars)
Goodwill
Goodwill is the excess of cost of an acquired entity over the amounts assigned to assets acquired and liabilities assumed in a business combination. Goodwill is tested for impairment on an annual basis or at the time of a triggering event. Fair values are estimated based on the Company’s best estimate of the expected present value of future cash flows compared with the corresponding carrying value of the reporting unit, including goodwill. The Company’s reporting units are its three operating segments. The Company performs its annual goodwill impairment testing during its first quarter, the most recent of which indicated no impairment of goodwill.
Other Intangible Assets
Other intangible assets primarily include customer relationships and noncompete agreements, typically associated with acquisitions. Other intangible assets are amortized on a straight-line basis over their estimated economic lives of three to ten years that result in a weighted-average useful life of six and seven years at December 31, 2005 and 2004, respectively. The straight-line method of amortization reflects an appropriate allocation of the cost of the intangible assets to earnings in proportion to the amount of economic benefits obtained by the Company in each reporting period.
Long-Lived Assets
The Company periodically reviews its long-lived assets for impairment and assesses whether significant events or changes in business circumstances indicate that the carrying value of the assets may not be recoverable. An impairment loss is recognized when the carrying amount of an asset exceeds the anticipated future undiscounted cash flows expected to result from the use of the asset and its eventual disposition. The amount of the impairment loss to be recorded, if any, is calculated by the excess of the asset’s carrying value over its fair value.
Deferred Financing Costs
Deferred financing costs associated with issuing debt are deferred and amortized over the related terms using the straight-line method, which approximates the effective interest rate method. Accumulated amortization was $3,857 and $2,100 at December 31, 2005 and 2004, respectively.
Revenue Recognition
Movable medical equipment is outsourced on both short-term and long-term arrangements, and outsourced revenue is recorded in income as equipment is utilized based on an agreed rate per use or time period. Any changes to the rate are billed on a prospective basis. Technical and professional services revenue is recognized as services are provided. Medical equipment sales and remarketing are recorded at the time of shipment or change of ownership.
Income Taxes
Deferred income taxes are computed using the asset and liability method, such that deferred tax assets and liabilities are recognized for the expected future tax consequences of temporary differences between financial reporting amounts and the tax bases of existing assets and liabilities based on currently enacted tax laws and tax rates in effect for the periods in which the differences are expected to reverse. Income tax expense is the tax payable for the period plus the change during the period in deferred income taxes. Valuation allowances are established when necessary to reduce deferred tax assets to the amount expected to be realized.
F-8
Universal Hospital Services, Inc.
Notes to Financial Statements
December 31, 2005 and 2004
(in thousands of dollars)
Fair Value of Financial Instruments
The Company considers that the carrying amount of financial instruments, including accounts receivable, accounts payable, accrued liabilities and notes payable, approximates fair value due to their short maturities. Interest on notes payable is payable at rates which approximate fair value. The fair value of the senior notes, based on the quoted market price for the same or similar issues of debt, is approximately $268,125 and $269,438 at December 31, 2005 and 2004, respectively.
Segment Information
The Company’s business is managed and internally reported as three segments.
Stock-Based Compensation
The Company measures compensation expense for its stock-based compensation plan using the intrinsic value method under APB 25. Accordingly, compensation cost for stock options granted to employees is measured as the excess, if any, of the value of the Company’s stock at the date of the grant over the amount an employee must pay to acquire the stock. Had compensation cost for the Company’s stock option plans been determined based on the fair value at the grant date for awards, the Company’s net income would have changed to the pro forma amounts indicated below:
| | | | | | | | | | | | |
| | | 2005 | | | 2004 | | | 2003 | |
Net loss, as reported | | $ | (1,569 | ) | | $ | (3,592 | ) | | $ | (19,526 | ) |
Add: Stock-based employee compensation included in reported net income | | | 20 | | | | — | | | | 11,288 | |
Less: Total stock-based employee compensation expense under fair value-based method | | | (1,583 | ) | | | (516 | ) | | | (11,288 | ) |
| | | | | | | | | | | | |
Pro forma net loss | | $ | (3,132 | ) | | $ | (4,108 | ) | | $ | (19,526 | ) |
| | | | | | | | | | | | |
Note 12 to the financial statements contains the significant assumptions used in determining the underlying fair value of options.
Comprehensive Loss
Components of comprehensive loss for the Company include net loss and minimum pension liability adjustments. These amounts are presented in the Statements of Shareholders’ (Deficiency) Equity and Other Comprehensive Loss.
Use of Estimates
The preparation of financial statements in conformity with accounting principles generally accepted in the United States of America requires management to make estimates and assumptions that affect the reported amounts of assets and liabilities and disclosure of contingent assets and liabilities at the date of the financial statements and the reported amounts of revenues and expenses during the reporting period. Actual results could differ from those estimates.
F-9
Universal Hospital Services, Inc.
Notes to Financial Statements
December 31, 2005 and 2004
(in thousands of dollars)
Recent Accounting Pronouncements
In December 2004, the Financial Accounting Standards Board (“FASB”) issued Statement of Financial Accounting Standards (“SFAS”) No. 123 (revised 2004),Share-Based Payment, which is a revision of SFAS No. 123 and supersedes APB Opinion No. 25. SFAS No. 123R requires that all share-based payments to employees, including grants of employee stock options, to be valued at the fair value on the date of grant, and to be expensed over the applicable vesting period. The Company plans to adopt SFAS No. 123R beginning in the first quarter of 2006. The Company believes based on its current Black-Scholes option value assumptions, its stock compensation expense for the first quarter of 2006 will be $400 to $500.
In March 2005, the FASB issued FASB Interpretation No. 47, an interpretation of SFAS No. 143,Accounting for Asset Retirement Obligations. Fin 47 states that the term conditional asset retirement obligation refers to an unconditional, legal obligation to perform an asset retirement obligation activity in which the timing and/or method of settlement are uncertain and conditional on a future event. If sufficient information exists for fair value measurement of the obligation, FIN 47 requires the Company to recognize a liability when incurred. The Company adopted FIN 47 in the fourth quarter of 2005. The adoption of FIN 47 did not have a material impact on the results of operations.
On December 22, 2005, the Company completed an acquisition of substantially all the assets of Innovative Healthcare Solutions, Inc., headquartered in Esko, Minnesota. The purchase price was approximately $1,115. This acquisition was accounted for using the purchase method. Accordingly, the purchase price was allocated to assets acquired based on their estimated fair values and consisted of equipment of $650 and intangible assets of $465. The operations of the acquired entity have been included in the Company’s outsourcing segment results of operations since the date of acquisition. Historical results of operations of the acquired entity are not material.
The following acquisitions of 2004 related to the medical equipment outsourcing segment:
| | • | | On April 15, 2004, the Company completed an acquisition of certain assets from Galaxy Medical Products, Inc., headquartered in Akron, Ohio. The purchase price was approximately $4,900. |
| | • | | On May 4, 2004, the Company completed an acquisition of substantially all of the assets of Advanced Therapeutics of Wisconsin, Inc., headquartered in Milwaukee, Wisconsin. The purchase price was approximately $5,100. |
The following acquisitions of 2004 related to the technical and professional services segment:
| | • | | On March 24, 2004, the Company completed an acquisition of certain assets from Affiliated Clinical Engineering Services, located in Boston, Massachusetts. The purchase price was approximately $4,200. |
F-10
Universal Hospital Services, Inc.
Notes to Financial Statements
December 31, 2005 and 2004
(in thousands of dollars)
| | • | | On August 31, 2004, the Company completed an acquisition of certain assets of Cardinal Health 200, Inc., headquartered in Naperville, Illinois. The purchase price was approximately $900. |
The Company acquired the assets of these companies in order to expand its customer base and service offerings. The purchase prices of these acquisitions were determined based on evaluations of the assets, and liabilities assumed, cash flow potential and comparable prices for similar businesses. The acquisitions were financed by borrowings under the Company’s revolving credit facility.
The 2004 acquisitions were accounted for using the purchase method. Accordingly, the respective purchase prices were allocated to assets and liabilities based on their estimated fair values. The estimated fair values of assets and liabilities acquired are as follow:
| | | | |
Accounts receivable | | $ | 2,608 | |
Prepaids | | | 218 | |
Inventories | | | 706 | |
Movable medical equipment | | | 1,284 | |
Goodwill | | | 714 | |
Other intangibles | | | 11,009 | |
Other assets | | | 13 | |
Accounts payable and other liabilities | | | (561 | ) |
Deferred revenues | | | (887 | ) |
| | | | |
| | $ | 15,104 | |
| | | | |
The operations of the above acquired companies have been included in the Company’s results of operations since the date of the respective acquisitions.
The following summarizes pro forma results of operations, assuming the 2004 acquisitions noted above occurred at January 1, 2003:
| | | | | | | | |
| | | 2004 | | | 2003 | |
Total revenues | | $ | 203,792 | | | $ | 183,884 | |
Net loss | | | (3,117 | ) | | | (17,972 | ) |
The Company typically does not maintain cash balances at its principal bank under a policy whereby the net amount of collected balances and cleared checks is, at the Company’s option, applied to or drawn from a revolving credit facility on a daily basis.
F-11
Universal Hospital Services, Inc.
Notes to Financial Statements
December 31, 2005 and 2004
(in thousands of dollars)
| 5. | Selected Financial Statement Information |
Accounts Receivable, Net
Accounts receivable, net at December 31, consists of the following:
| | | | | | | | |
| | | 2005 | | | 2004 | |
Accounts receivable | | $ | 43,215 | | | $ | 42,144 | |
Less: Allowance for doubtful accounts | | | (1,350 | ) | | | (1,500 | ) |
| | | | | | | | |
| | $ | 41,865 | | | $ | 40,644 | |
| | | | | | | | |
Property and Equipment, Net
Property and equipment, net at December 31, consists of the following:
| | | | | | | | |
| | | 2005 | | | 2004 | |
Movable medical equipment | | $ | 330,364 | | | $ | 304,780 | |
Less: Accumulated depreciation | | | (203,589 | ) | | | (178,793 | ) |
| | | | | | | | |
Movable medical equipment, net | | | 126,775 | | | | 125,987 | |
| | | | | | | | |
Land | | | 120 | | | | 120 | |
Buildings and leasehold improvements | | | 5,404 | | | | 4,546 | |
Office equipment and vehicles | | | 23,365 | | | | 16,118 | |
| | | | | | | | |
| | | 28,889 | | | | 20,784 | |
| | |
Less: Accumulated depreciation and amortization | | | (16,194 | ) | | | (10,742 | ) |
| | | | | | | | |
Property and office equipment, net | | | 12,695 | | | | 10,042 | |
| | | | | | | | |
Total property and equipment, net | | $ | 139,470 | | | $ | 136,029 | |
| | | | | | | | |
Goodwill
The changes in the carrying amount of goodwill by reporting segment consist of the following:
| | | | | | | | | | | | |
| | | Medical
Equipment
Outsourcing | | Technical
and
Professional
Services | | Medical
Equipment
Sales and
Remarketing | | Total
Company |
Balances at December 31, 2003 | | $ | 32,470 | | $ | 111 | | $ | 3,767 | | $ | 36,348 |
Goodwill acquired during the year | | | 690 | | | 24 | | | — | | | 714 |
| | | | | | | | | | | | |
Balances at December 31, 2004 | | | 33,160 | | | 135 | | | 3,767 | | | 37,062 |
Goodwill acquired during the year | | | — | | | — | | | — | | | — |
| | | | | | | | | | | | |
Balances at December 31, 2005 | | $ | 33,160 | | $ | 135 | | $ | 3,767 | | $ | 37,062 |
| | | | | | | | | | | | |
F-12
Universal Hospital Services, Inc.
Notes to Financial Statements
December 31, 2005 and 2004
(in thousands of dollars)
Other Intangible Assets, Net
Other intangible assets, net at December 31, consist of the following:
| | | | | | | | | | | | | | | | | | |
| | | 2005 | | 2004 |
| | | Carrying
Amount | | Accumulated
Amortization | | Net | | Carrying
Amount | | Accumulated
Amortization | | Net |
Customer relationships | | $ | 11,700 | | $ | 2,599 | | $ | 9,101 | | $ | 11,235 | | $ | 1,180 | | $ | 10,055 |
Noncompetes | | | 1,320 | | | 670 | | | 650 | | | 1,320 | | | 310 | | | 1,010 |
| | | | | | | | | | | | | | | | | | |
| | $ | 13,020 | | $ | 3,269 | | $ | 9,751 | | $ | 12,555 | | $ | 1,490 | | $ | 11,065 |
| | | | | | | | | | | | | | | | | | |
Total amortization expense related to intangible assets for the years ended December 31, 2005, 2004 and 2003, was $1,779, $1,136 and $275, respectively.
At December 31, 2005, future estimated amortization expense related to intangible assets will be:
| | | |
2006 | | $ | 1,772 |
2007 | | | 1,662 |
2008 | | | 1,602 |
2009 | | | 1,040 |
2010 | | | 786 |
Thereafter | | | 2,889 |
| | | |
| | $ | 9,751 |
| | | |
The future amortization expense is an estimate. Actual amounts may change from such estimated amounts due to additional intangible asset acquisitions, potential impairment, accelerated amortization, or other events.
Noncash Investing and Financing Transactions
Rental equipment purchases included in accounts payable at December 31, 2005, 2004 and 2003, were $5,778, $3,808 and $10,503, respectively.
Accrued dividends at December 31, 2005, 2004 and 2003, were $0, $0 and $1,072, respectively.
Amortization of bond discount was $0, $0 and $415 for the years ended December 31, 2005, 2004 and 2003, respectively.
Accretion of discount on Series B, 13% Cumulative Accruing Pay-In-Kind Stock was $0, $0 and $87 for the years ended December 31, 2005, 2004 and 2003, respectively.
Accretion of common stock subject to put was $0, $0 and $1,132 for the years ended December 31, 2005, 2004 and 2003, respectively.
Capital leases recorded for vehicle purchases were $3,450 for the year ended December 31, 2005.
F-13
Universal Hospital Services, Inc.
Notes to Financial Statements
December 31, 2005 and 2004
(in thousands of dollars)
Long-term debt at December 31 consists of the following:
| | | | | | | | |
| | | 2005 | | | 2004 | |
10.125% senior notes | | $ | 260,000 | | | $ | 260,000 | |
Revolving credit facility | | | 38,106 | | | | 36,974 | |
Capital lease obligations | | | 2,374 | | | | 328 | |
| | | | | | | | |
| | | 300,480 | | | | 297,302 | |
Less: Current portion of long-term debt | | | (1,084 | ) | | | (328 | ) |
| | | | | | | | |
Total long-term debt | | $ | 299,396 | | | $ | 296,974 | |
| | | | | | | | |
The 10.125% Senior Notes (“Senior Notes”) mature on November 1, 2011. Interest on the Senior Notes accrues at the rate of 10.125% per annum and is payable semiannually on each May 1 and November 1. The Senior Notes are redeemable, at the Company’s option, in whole or in part, on or after November 1, 2007, at specified redemption prices plus accrued interest to the date of redemption. At any time upon an equity offering before November 1, 2006, as defined in the agreement, the Company can redeem up to 35% of the Senior Notes, at a purchase price equal to 110.125% of the principal amount plus accrued interest to the dates of purchase. In addition, the Senior Notes have a change of control provision which gives each holder the right to require the Company to purchase all or a portion of such holders’ Senior Notes upon a change in control, as defined in the agreement, at a purchase price equal to 101% of the principal amount plus accrued interest to the date of purchase. The Senior Notes have covenants that restrict the incurrence of additional debt, the payment of dividends and the issuance of preferred stock. The Senior Notes are uncollateralized.
On May 26, 2005, the Company entered into an Amended and Restated Credit Agreement (“Amended Credit Agreement”) with a consortium of banks. The Amended Credit Agreement increases the aggregate amount the Company may obtain under revolving loans, reduces the applicable borrowing spreads, extends the maturity date, and modifies the financial covenants to provide more operating flexibility.
Under the terms of the Amended Credit Agreement, the aggregate amount the Company may obtain under the revolving loans increased from $100,000 to $125,000 and terminates on May 26, 2010. The Amended Credit Agreement allows for up to $5,000 of the facility is available for letters of credit. Availability under the Amended Credit Agreement as of December 31, 2005, was approximately $73,000, representing our borrowing base of approximately $113,000 less borrowings of $38,000 and outstanding letters of credit of $2,000 at that date. Borrowings under the agreement are collateralized by substantially all the assets of the Company.
F-14
Universal Hospital Services, Inc.
Notes to Financial Statements
December 31, 2005 and 2004
(in thousands of dollars)
Amounts borrowed under the Amended Credit Agreement generally bear interest on a LIBOR-based and index-rate formula. The interest rates at December 31, 2005 were 2.25% over LIBOR (4.39%) and 1.00% over the Index Rate (7.25%) with the interest rate margin subject to change based upon quarterly leverage ratios. Interest on borrowings is paid monthly or as defined by the agreement. In addition, the Amended Credit Agreement also provides that a commitment fee of .375% per annum is payable on the unutilized amount of the facility. Amounts previously outstanding under the prior credit agreement generally bore interest at a rate of 3.00% over LIBOR and 1.75% over the Index Rate. The terms of the Amended Credit Agreement also extended the maturity from October 2008 to May 2010. Amounts borrowed under the Amended Credit Agreement are due at the end of the five year term.
The Amended Credit Agreement contains certain covenants, including restrictions and limitations on dividends, liens, leases, incurrence or guarantees of debt, transactions with affiliates, investments or loans, and mergers, acquisitions, consolidations and asset sales. Furthermore, the Company is required to maintain compliance with certain financial covenants, including a maximum senior debt leverage ratio and a minimum interest coverage ratio. The Amended Credit Agreement also contains cross-default provisions and subjective acceleration clauses under which the bank may declare an event of default. The Amended Credit Agreement also prohibits the Company from prepaying the Senior Notes.
In the fourth quarter of 2005, the Company capitalized certain vehicles which had been previously recorded as operating leases. The recording of vehicles as capital leases resulted in an increase in the Company’s property and office equipment of $2,503 and an increase in total long-term debt of $2,361. The impact on the Statement of Cash Flows for recording the capital leases in the fourth quarter was an increase in net cash provided by operating activities of $1,089 for increased depreciation expense and an increase in cash used in financing activities of $1,089 for payments under capital lease obligations. Management determined that the impact of not recording the vehicles as capital leases in previous periods presented was not material.
Future minimum lease payments under capital lease agreements are as follows:
| | | | |
2006 | | $ | 1,140 | |
2007 | | | 884 | |
2008 | | | 667 | |
2009 | | | 112 | |
2010 | | | 5 | |
| | | | |
Total minimum lease payments | | | 2,808 | |
| |
Less: Amount representing interest | | | (447 | ) |
| | | | |
Capital lease obligations | | | 2,361 | |
| |
Less: Current portion | | | (1,084 | ) |
| | | | |
Capital lease obligation, less current portion | | $ | 1,277 | |
| | | | |
F-15
Universal Hospital Services, Inc.
Notes to Financial Statements
December 31, 2005 and 2004
(in thousands of dollars)
| 7. | Commitments and Contingencies |
Rental expenses were approximately $8,066, $7,963 and $7,100 for the years ended December 31, 2005, 2004 and 2003, respectively. At December 31, 2005, the Company is committed under various noncancellable operating leases for regional sales and service offices, corporate facilities and vehicles with minimum annual rental commitments of the following:
| | | |
2006 | | $ | 4,562 |
2007 | | | 4,139 |
2008 | | | 3,462 |
2009 | | | 2,950 |
2010 | | | 2,373 |
Thereafter | | | 6,126 |
| | | |
| | $ | 23,612 |
| | | |
The Company, in the ordinary course of business, could be subject to liability claims related to employees and the equipment that it rents and services. Asserted claims are subject to many uncertainties and the outcome of individual matters is not predictable with assurance. While the ultimate resolution of these actions may have an impact on the Company’s financial results for a particular reporting period, management believes that any such resolution would not have a material adverse effect on the financial position, results of operations, or cash flows of the Company.
Management Agreement
The Company is a party to management agreements with J. W. Childs Associates, L.P. (an affiliate of Childs) (“Childs Associates”) and Halifax Capital Partners, L.P. (“Halifax”) (together “Equity Sponsors”) pursuant to which the Company pays the Equity Sponsors an annual management fee totaling $480 in consideration of the Equity Sponsors’ ongoing provision of certain consulting and management advisory services. Payments under these management agreements may be made only to the extent permitted by the Revolving Credit Facility and the Senior Notes. The management agreements are for five-year terms and are automatically renewable for successive extension terms of one year, unless the Equity Sponsors give notice of termination. The Equity Sponsors have agreed to terminate the agreement upon the completion of an initial public offering.
The Company has a noncontributory defined benefit pension plan. Plan benefits are to be paid to eligible employees at retirement based primarily on years of credited service and on participants’ compensation. The Company uses a December 31 measurement date. Effective December 31, 2002, the Company froze the benefits under the plan.
F-16
Universal Hospital Services, Inc.
Notes to Financial Statements
December 31, 2005 and 2004
(in thousands of dollars)
Change in Benefit Obligation
| | | | | | | | | | | | |
| | | 2005 | | | 2004 | | | 2003 | |
Benefit obligation at beginning of year | | $ | 15,900 | | | $ | 15,035 | | | $ | 12,662 | |
Interest cost | | | 950 | | | | 877 | | | | 888 | |
Actuarial loss | | | 1,995 | | | | 526 | | | | 1,951 | |
Benefits paid | | | (611 | ) | | | (538 | ) | | | (466 | ) |
| | | | | | | | | | | | |
Benefit obligation at end of year | | $ | 18,234 | | | $ | 15,900 | | | $ | 15,035 | |
| | | | | | | | | | | | |
Change in Plan Assets
| | | | | | | | | | | | |
| | | 2005 | | | 2004 | | | 2003 | |
Fair value of plan assets at beginning of year | | $ | 12,244 | | | $ | 11,177 | | | $ | 7,792 | |
Actual gain on plan assets | | | 547 | | | | 1,188 | | | | 1,707 | |
Benefits paid | | | (611 | ) | | | (538 | ) | | | (466 | ) |
Employer contribution | | | 805 | | | | 417 | | | | 2,144 | |
| | | | | | | | | | | | |
Fair value of plan assets at end of year | | $ | 12,985 | | | $ | 12,244 | | | $ | 11,177 | |
| | | | | | | | | | | | |
| | | |
| | | 2005 | | | 2004 | | | 2003 | |
Funded status | | $ | (5,249 | ) | | $ | (3,656 | ) | | $ | (3,857 | ) |
Unrecognized net actuarial loss | | | 5,180 | | | | 2,980 | | | | 2,756 | |
| | | | | | | | | | | | |
Accrued benefit liability | | $ | (69 | ) | | $ | (676 | ) | | $ | (1,101 | ) |
| | | | | | | | | | | | |
Amounts recognized in the statement of financial position | | | | | | | | | | | | |
Accrued benefit cost | | $ | (5,249 | ) | | $ | (3,656 | ) | | $ | (3,857 | ) |
Accumulated other comprehensive loss | | | 5,180 | | | | 2,980 | | | | 2,756 | |
| | | | | | | | | | | | |
Net amount recognized | | $ | (69 | ) | | $ | (676 | ) | | $ | (1,101 | ) |
| | | | | | | | | | | | |
The accumulated benefit obligations in excess of plan assets at December 31 are as follows:
| | | | | | | | | |
| | | 2005 | | 2004 | | 2003 |
Projected benefit obligation | | $ | 18,234 | | $ | 15,900 | | $ | 15,035 |
Accumulated benefit obligation | | | 18,234 | | | 15,900 | | | 15,035 |
Fair value of plan assets | | | 12,985 | | | 12,244 | | | 11,178 |
At December 31, 2005, 2004 and 2003, the accumulated benefit obligations exceed the fair value of plan assets. Therefore, the Company recognized an additional minimum pension obligation in comprehensive loss of $2,200, $224 and $1,024 for 2005, 2004 and 2003, respectively.
F-17
Universal Hospital Services, Inc.
Notes to Financial Statements
December 31, 2005 and 2004
(in thousands of dollars)
Plan Assets
Plan asset allocations at December 31 are as follows:
| | | | | | | | | | | | |
Asset Category | | Target
Allocation | | | 2005 | | | 2004 | | | 2003 | |
Equity securities | | 70 | % | | 69 | % | | 73 | % | | 71 | % |
Debt securities | | 30 | | | 31 | | | 27 | | | 28 | |
Other | | — | | | — | | | — | | | 1 | |
| | | | | | | | | | | | |
| | 100 | % | | 100 | % | | 100 | % | | 100 | % |
| | | | | | | | | | | | |
The pension plan assets are invested with the objective of maximizing long-term returns while minimizing material losses in order to meet future benefit obligations when they come due.
The Company utilizes an investment approach with a mix of equity and debt securities used to maximize the long-term return on plan assets. Risk tolerance is established through consideration of plan liabilities, funded status and corporate financial condition. The investment portfolio consists of a diversified blend of mutual funds and fixed-income investments. Investment risk is measured and monitored on an ongoing basis through quarterly investment portfolio reviews and annual asset and liability reviews.
Contributions
During 2005, 2004 and 2003, the Company contributed $805, $417 and $2,144, respectively, in contributions to the defined benefit pension plan. There are no contributions required to be made to the pension plan for 2006.
Estimated Future Benefit Payments
The following benefit payments are expected to be paid:
| | | |
2006 | | $ | 600 |
2007 | | | 600 |
2008 | | | 600 |
2009 | | | 700 |
2010 | | | 700 |
2011 to 2015 | | | 3,900 |
| | | |
| | $ | 7,100 |
| | | |
Net Periodic Benefit Cost
Components of net periodic benefit cost are as follows:
| | | | | | | | | | | | |
| | | 2005 | | | 2004 | | | 2003 | |
Interest cost | | $ | 950 | | | $ | 877 | | | $ | 888 | |
Expected return on plan assets | | | (986 | ) | | | (943 | ) | | | (791 | ) |
Recognized net actuarial loss | | | 234 | | | | 57 | | | | 10 | |
Net periodic benefit cost | | $ | 198 | | | $ | (9 | ) | | $ | 107 | |
F-18
Universal Hospital Services, Inc.
Notes to Financial Statements
December 31, 2005 and 2004
(in thousands of dollars)
Plan Assumptions
The following weighted-average assumptions were used as follows:
| | | | | | | | | |
| | | 2005 | | | 2004 | | | 2003 | |
Weighted-average actuarial assumptions used to determine benefit obligations as of December 31 | | | | | | | | | |
Discount rate | | 5.50 | % | | 5.75 | % | | 6.25 | % |
Expected return on assets | | 8.00 | % | | 8.50 | % | | 8.50 | % |
| | | |
Weighted-average assumptions used to determine net periodic benefit cost | | | | | | | | | |
Discount rate | | 5.75 | % | | 6.25 | % | | 6.75 | % |
Expected return on assets | | 8.50 | % | | 8.50 | % | | 8.50 | % |
Rate of compensation increase | | None | | | None | | | None | |
These assumptions are reviewed on an annual basis. In determining the expected return on plan asset assumption, the Company evaluates the long-term returns earned by the plan, the mix of investments that comprise plan assets and forecasts of future long-term investment returns.
The Company also sponsors a defined contribution plan, which qualifies under Section 401(k) of the Internal Revenue Code and covers substantially all of the Company’s employees. Employees may contribute annually up to 25% of their base compensation either before tax (subject to Internal Revenue Service limitation), or after tax. The Company contributes 75% of the first 6% of base compensation that an employee contributes. For the years ended December 31, 2005, 2004 and 2003, approximately $1,677, $1,568 and $1,214, respectively, was expensed as contributions to the Plan.
The Company is self-insured for employee health care and workers’ compensation costs. The Company is liable for claims up to $130 per family per plan year and aggregate claims up to 125% of expected claims per plan year. The Company is liable for workers’ compensation claims up to $250 per individual claim. Self-insurance costs are accrued based upon the aggregate of the liability for reported claims and an actuarially determined estimated liability for claims incurred but not reported.
The provision for income taxes consists of the following:
| | | | | | | | | |
| | | 2005 | | 2004 | | 2003 |
State, payable | | $ | 275 | | $ | 85 | | $ | 275 |
Deferred | | | 567 | | | 1,103 | | | — |
| | | | | | | | | |
| | $ | 842 | | $ | 1,188 | | $ | 275 |
| | | | | | | | | |
F-19
Universal Hospital Services, Inc.
Notes to Financial Statements
December 31, 2005 and 2004
(in thousands of dollars)
Reconciliations between the Company’s effective income tax rate and the U.S. statutory rate follow:
| | | | | | | | | |
| | | 2005 | | | 2004 | | | 2003 | |
Statutory U.S. Federal income tax rate | | (34.0 | )% | | (34.0 | )% | | (35.0 | )% |
State income taxes, net of U.S. Federal income tax benefit | | (5.5 | ) | | (4.7 | ) | | (4.7 | ) |
Valuation allowance | | 117.5 | | | 84.6 | | | 39.7 | |
Minimum state taxes | | 37.8 | | | 3.5 | | | 1.4 | |
| | | | | | | | | |
Effective income tax rate | | 115.8 | % | | 49.4 | % | | 1.4 | % |
| | | | | | | | | |
The components of the Company’s overall deferred tax assets and liabilities at December 31, 2005 and 2004, are as follows:
| | | | | | | | |
| | | 2005 | | | 2004 | |
Deferred tax assets | | | | | | | | |
Accounts receivable | | $ | 533 | | | $ | 593 | |
Accrued and deferred compensation and pension | | | 2,754 | | | | 1,386 | |
Inventories | | | 305 | | | | 290 | |
Other assets | | | 512 | | | | 827 | |
Net operating loss carryforwards | | | 28,971 | | | | 28,868 | |
| | | | | | | | |
Deferred tax assets | | | 33,075 | | | | 31,964 | |
| | |
Valuation allowance | | | (9,734 | ) | | | (8,675 | ) |
| | | | | | | | |
Net deferred tax assets | | | 23,341 | | | | 23,289 | |
| | |
Deferred tax liabilities | | | | | | | | |
Accelerated depreciation and amortization | | | 25,396 | | | | 24,777 | |
| | | | | | | | |
Total deferred tax liabilities | | | 25,396 | | | | 24,777 | |
| | | | | | | | |
Net deferred tax liability | | $ | (2,055 | ) | | $ | (1,488 | ) |
| | | | | | | | |
At December 31, 2005, the Company had available unused net operating loss carryforwards of approximately $73,000. The net operating loss carryforwards will expire at various dates through 2024.
Under Internal Revenue Code of 1986, certain corporate stock transactions into which the Company has entered or may enter in the future could limit the amount of net operating loss carryforwards which may be utilized on an annual basis to offset taxable income in future periods.
F-20
Universal Hospital Services, Inc.
Notes to Financial Statements
December 31, 2005 and 2004
(in thousands of dollars)
In October 2003, the Company amended its Articles of Incorporation to include, among other things, the authorization to issue 7,000,000 shares of preferred stock, $0.01 par value per share, from time to time in one or more classes or series. There were no shares issued as of December 31, 2005 and 2004.
In connection with the recapitalization (Note 14), the Company redeemed all of the Series B Preferred Stock, along with the warrant to purchase shares of the Company’s stock.
Prior to the recapitalization, the Company’s amended Articles of Incorporation authorized the issuance of up to 7,000,000 shares of preferred stock, $0.01 par value, with such designations rights and preferences as the Board of Directors of the Company may have determined. The amended Articles of Incorporation stated that 6,965,000 shares were undesignated with the remaining shares being designated to the Series A, 12% Cumulative Convertible Accruing Pay-In-Kind Preferred Stock, and Series B, 13% Cumulative Accruing Pay-In-Kind Preferred Stock.
On December 18, 1998, the Company issued 6,246 shares of Series B 13% Cumulative Accruing Pay-In-Kind Preferred Stock (“Series B Preferred Stock”). The holder of Series B Preferred Stock had no voting rights, and accrued pay-in-kind dividends at the rate of 13% per annum. The Series B Preferred Stock had a mandatory redemption date of the earlier of a change in control as defined, or August 17, 2008, at a redemption price of $1,000 per share plus an amount in cash equal to all dividends outstanding per share. The Series B Preferred Stock could be redeemed by the Company at any time at redemption prices of $1,025 to $1,050 as defined in the Agreement, plus an amount in cash equal to all dividends outstanding per share. In addition, purchasers of the Series B Preferred Stock received a warrant to purchase 2,940,000 shares of the Company’s common stock for $.01 per share. The warrant was exercisable immediately and expired on August 17, 2008.
The estimated fair value of the warrant of $1,000 had increased additional paid-in capital and had been reflected as a discount to the carrying value of the Series B Preferred Stock. The discount was being amortized as an additional dividend using the effective interest method over the term of the Series B Preferred Stock.
Stock Splits
On December 8, 2003, the Company’s Board of Directors approved an 11-for-1 stock split effected in the form of a dividend. In addition, the Company amended its Articles of Incorporation to include, among other things, an increase to 500,000,000 of the Company’s authorized shares of common stock. All share information has been retroactively restated to reflect the stock split.
Shareholders’ Agreement
In connection with the recapitalization, certain management shareholders (as defined) and the equity sponsors entered into a shareholders’ agreement (the Shareholders’ Agreement”) with the Company. The Shareholders’ Agreement was amended and restated. The amended and restated Shareholders’ Agreement, among other things: (i) restricts the ability of certain shareholders of the Company to transfer their shares of the Company’s common stock; (ii) gives shareholders of the
F-21
Universal Hospital Services, Inc.
Notes to Financial Statements
December 31, 2005 and 2004
(in thousands of dollars)
Company certain rights of first refusal with respect to shares of common stock; (iii) after October 17, 2008, gives certain Equity Sponsors and their affiliates the right to cause the Company to consummate a sale constituting a change of control if such sales constitutes a minimum return on investment, as defined in the agreement; and (iv) provides the shareholders with certain “tag-along, “drag-along,” and “piggyback” registration rights, as defined.
In February 1998, the Company’s Board of Directors adopted the 1998 Stock Option Plan (the “1998 Plan”). Under the 1998 Plan, the Company could grant incentive stock options and stock options and performance awards to the Company’s employees. A total of 42,000,000 shares were reserved for issuance under the 1998 Plan. Options granted under the 1998 Plan vested in whole or in part within five years from the date granted based on the achievement of certain financial targets. Any unvested options vested eight years following the date of grant, expiring ten years after the grant date. Options were generally granted with option prices based on the estimated fair market value of the Company’s common stock at date of grant as determined by the Company’s Board of Directors.
In connection with the recapitalization (Note 14), the 1998 Plan was terminated, with all options outstanding under the plan being repurchased or terminated. During the year ended December 31, 2003, the Company recognized $11,288 of stock compensation expense related to the repurchase of these stock options.
On December 8, 2003, the Company adopted the 2003 Stock Option Plan (“2003 Plan”). Under the 2003 Plan, the Company may grant incentive stock options and stock options and performance awards to the Company’s employees and consultants or independent contractors. A total of 17,120,691 shares are reserved for issuance under the 2003 Plan. Options granted under the plan will vest in whole or in part within four years from the date of grant for certain grants upon the achievement of certain financial targets or in any case after eight years. Options are generally granted with option prices based on the estimated fair market values of the Company’s common stock at the date of grant, as determined by the Company’s Board of Directors.
Stock option activity with respect to the 2003 and 1998 Plans for the years ended December 31 is as follows:
| | | | | | | | | |
| | | 2003 Plan | | | 1998 Plan | |
Shares | | 2005 | | | 2004 | | | 2003 | |
Granted | | 1,332,400 | | | 15,453,460 | | | 5,400,000 | |
Exercised | | (7,492 | ) | | (4,995 | ) | | (275,535 | ) |
Terminated | | (781,003 | ) | | (926,073 | ) | | (6,817,665 | ) |
Repurchased | | — | | | — | | | (31,170,672 | ) |
| | | | | | | | | |
At December 31 | | | | | | | | | |
Outstanding | | 15,066,297 | | | 14,522,392 | | | — | |
| | | | | | | | | |
Exercisable | | 2,206,315 | | | 1,096,432 | | | — | |
| | | | | | | | | |
F-22
Universal Hospital Services, Inc.
Notes to Financial Statements
December 31, 2005 and 2004
(in thousands of dollars)
| | | | | | | | | |
Weighted-Average Exercise Price Per Share | | 2003 Plan | | 1998 Plan |
| | 2005 | | 2004 | | 2003 |
Granted | | $ | 1.33 | | $ | 1.01 | | $ | 1.14 |
Exercised | | $ | 1.01 | | $ | 1.00 | | $ | 0.18 |
Terminated | | $ | 1.07 | | $ | 1.00 | | $ | 0.21 |
Repurchased | | | — | | | — | | $ | 0.50 |
At December 31 | | | | | | | | | |
Outstanding | | $ | 1.04 | | $ | 1.01 | | | — |
Exercisable | | $ | 1.01 | | $ | 1.00 | | | — |
Options outstanding and exercisable at December 31, 2005, are as follows:
| | | | | | | | | | | | | |
| | | Options Outstanding | | Options Exercisable |
Range of Exercise Prices | | Shares | | Remaining
Weighted
Average
Contractual
Life (Years) | | Weighted
Average
Exercise
Price | | Shares | | Weighted
Average
Exercise
Price |
| $ | 1.00 | | 13,037,397 | | 8.36 | | $ | 1.00 | | 2,148,190 | | $ | 1.00 |
| $ | 1.20 | | 697,500 | | 8.75 | | $ | 1.20 | | 58,125 | | $ | 1.20 |
| $ | 1.33 | | 1,331,400 | | 9.75 | | $ | 1.33 | | — | | $ | 1.33 |
The weighted-average grant-date fair value of options granted under the plans during 2005, 2004 and 2003 was $0.75, $0.64 and $0.42, respectively. The weighted-average grant-date fair value of options was determined by using the fair value of each option grant on the date of grant, utilizing the Black-Scholes option-pricing model and the following key assumptions:
| | | | | | | | | |
| | | 2005 | | | 2004 | | | 2003 | |
Risk-free interest rates | | 4.57 | % | | 4.53% to 5.10 | % | | 2.97% to 3.96 | % |
Expected life | | 8 years | | | 10 years | | | 10 years | |
Expected volatility | | 44.30 | % | | 45.00 | % | | 45.00 | % |
Expected dividends | | None | | | None | | | None | |
Effective January 1, 2004, Company operated in three reportable segments. Previously, the Company was managed and internally reported as one operating segment.
Medical equipment outsourcing provides customers with the use of movable medical equipment and the Company maintains the equipment for customers by performing preventative maintenance, repairs, cleaning and testing, and maintaining certain reporting records.
F-23
Universal Hospital Services, Inc.
Notes to Financial Statements
December 31, 2005 and 2004
(in thousands of dollars)
Technical and professional services offers a broad range of inspection, preventative maintenance, repair, logistic and consulting services through the Company’s team of over 200 technicians and professionals located in its nationwide network of offices.
Medical equipment sales and remarketing buys, sources, remarkets and disposes of pre-owned medical equipment for its customers through the Company’s Asset Recovery Program; provides sales and distribution of specialty medical equipment; and offers its customers disposable items that are used on a single use basis.
The Company identifies its segments based on its organizational structure and its internal reporting.
| | | | | | | | | | | | | | | |
| | | Net Sales | | Gross
Margin | | Assets | | Amortization
and
Depreciation | | Capital
Expenditures |
Medical equipment outsourcing | | | | | | | | | | | | | | | |
2005 | | $ | 167,687 | | $ | 77,222 | | $ | 40,467 | | $ | 1,069 | | $ | — |
2004 | | | 156,490 | | | 73,309 | | | 41,070 | | | 619 | | | — |
2003 | | | 140,233 | | | 65,695 | | | 33,459 | | | 260 | | | — |
| | | | | |
Technical and professional services | | | | | | | | | | | | | | | |
2005 | | | 29,654 | | | 7,776 | | | 2,496 | | | 703 | | | — |
2004 | | | 25,491 | | | 8,196 | | | 3,199 | | | 509 | | | — |
2003 | | | 14,662 | | | 5,356 | | | 206 | | | 7 | | | — |
| | | | | |
Medical equipment sales and remarketing | | | | | | | | | | | | | | | |
2005 | | | 18,563 | | | 3,857 | | | 3,850 | | | 8 | | | — |
2004 | | | 17,619 | | | 4,312 | | | 3,858 | | | 8 | | | — |
2003 | | | 16,110 | | | 4,556 | | | 3,866 | | | 8 | | | — |
| | | | | |
Corporate and unallocated | | | | | | | | | | | | | | | |
2005 | | | — | | | — | | | 202,372 | | | 44,547 | | | 40,631 |
2004 | | | — | | | — | | | 198,280 | | | 40,961 | | | 53,219 |
2003 | | | — | | | — | | | 182,688 | | | 35,257 | | | 37,022 |
| | | | | |
Total Company | | | | | | | | | | | | | | | |
2005 | | | 215,904 | | | 88,855 | | | 249,185 | | | 46,327 | | | 40,631 |
2004 | | | 199,600 | | | 85,817 | | | 246,407 | | | 42,097 | | | 53,219 |
2003 | | | 171,005 | | | 75,607 | | | 220,219 | | | 35,532 | | | 37,022 |
Gross margin represents net revenues less total direct costs.
F-24
Universal Hospital Services, Inc.
Notes to Financial Statements
December 31, 2005 and 2004
(in thousands of dollars)
Segment assets for the three operating business segments (excluding Corporate and Unallocated) primarily includes goodwill and intangible assets. Assets included in Corporate and Unallocated contains all other Company assets.
| 14. | Recapitalization, Financings and Related Transactions |
On October 17, 2003, the Company completed an equity recapitalization, new financing and related transactions, all referred to as the recapitalization. In connection with the recapitalization, the Company:
| | • | | Issued $260,000 of 10.125% senior notes due 2011. |
| | • | | Borrowed approximately $11,000 under a new revolving credit facility providing up to $100,000 in available revolving borrowings. |
| | • | | Sold an aggregate of 56,147,200 shares of the Company’s newly issued common stock for $1.00 per share. |
| | • | | Repurchased all of the Company’s outstanding 10.250% senior notes due 2008, totaling $135,000. |
| | • | | Repaid the outstanding principal balance of approximately $70,300 under the Company’s existing revolving credit facility. |
| | • | | Recorded a charge of approximately $13,300 for the early retirement of debt, including a prepayment penalty of $6,900, the write-off of related deferred financing costs of $5,900 and the write-off of $500 unamortized discount of Series B Cumulative Accruing Pay-In-Kind Stock. |
| | • | | Repurchased all of the Company’s outstanding Series B Cumulative Accruing Pay-In-Kind Stock and detachable warrants exercisable into 2,940,000 shares of common stock, for approximately $13,800. |
| | • | | Repurchased 69,965,845 shares of the Company’s common stock for $1.00 per share. |
| | • | | Repurchased options exercisable into 31,170,672 of the Company’s common stock for approximately $18,700, of which $7,500 had been previously expensed as stock compensation costs. |
| | • | | Paid fees and expenses of approximately $14,200 related to the recapitalization of which approximately $11,700 was capitalized as deferred financing cost and the remaining $2,600 being expensed as recapitalization costs. |
The recapitalization did not result in an accounting change in control; accordingly, all assets and liabilities have continued to be recorded at historical cost.
F-25
Universal Hospital Services, Inc.
Schedule II- Valuation and Qualifying Accounts
| | | | | | | | | | | | | | | |
| | | Balance at beginning of period | | Additions | | Deductions from reserves | | Balance at end
of period |
Description | | | Charged to costs and expense | | Charged to other accounts | | |
Allowance for doubtful accounts | | | | | | | | | | | | | | | |
Year ended December 31, 2005 | | $ | 1,500,000 | | $ | 926,766 | | $ | 155,862 | | $ | 1,232,628 | | $ | 1,350,000 |
Year ended December 31, 2004 | | | 1,750,000 | | | 984,425 | | | 25,804 | | | 1,260,229 | | | 1,500,000 |
Year ended December 31, 2003 | | | 1,800,000 | | | 762,292 | | | 75,594 | | | 887,886 | | | 1,750,000 |
| | | | | |
Allowance for inventory obsolescence | | | | | | | | | | | | | | | |
Year ended December 31, 2005 | | | 520,401 | | | 676,946 | | | | | | 635,633 | | | 561,714 |
Year ended December 31, 2004 | | | 268,671 | | | 509,079 | | | | | | 257,349 | | | 520,401 |
Year ended December 31, 2003 | | | 215,000 | | | 462,253 | | | | | | 408,582 | | | 268,671 |
| | | | | |
Income Tax Valuation Allowance | | | | | | | | | | | | | | | |
Year ended December 31, 2005 | | | 8,675,000 | | | 1,059,000 | | | | | | | | | 9,734,000 |
Year ended December 31, 2004 | | | 6,898,000 | | | 1,777,000 | | | | | | | | | 8,675,000 |
Year ended December 31, 2003 | | | 2,061,000 | | | 4,837,000 | | | | | | | | | 6,898,000 |