UNITED STATES
SECURITIES AND EXCHANGE COMMISSION
Washington, D.C. 20549
FORM N-CSR
CERTIFIED SHAREHOLDER REPORT OF REGISTERED
MANAGEMENT INVESTMENT COMPANIES
Investment Company Act file number | 811-06637 | |||||||
| ||||||||
The UBS Funds | ||||||||
(Exact name of registrant as specified in charter) | ||||||||
| ||||||||
One North Wacker Drive, Chicago, IL |
| 60606-2807 | ||||||
(Address of principal executive offices) |
| (Zip code) | ||||||
| ||||||||
Tammie Lee, Esq. UBS Asset Management 1285 Avenue of the Americas New York, NY 10019 | ||||||||
(Name and address of agent for service) | ||||||||
| ||||||||
Copy to: | ||||||||
Bruce Leto, Esq. Stradley Ronon Stevens & Young, LLP 2600 One Commerce Square Philadelphia, PA 19103-7098 | ||||||||
| ||||||||
Registrant’s telephone number, including area code: | 212-821-3000 |
| ||||||
| ||||||||
Date of fiscal year end: | June 30 |
| ||||||
| ||||||||
Date of reporting period: | June 30, 2017 |
| ||||||
Item 1. Reports to Stockholders.

The UBS Funds
Annual Report | June 30, 2017
Table of contents | |||||||
President's letter | 1 | ||||||
Market commentary | 3 | ||||||
UBS Dynamic Alpha Fund | 5 | ||||||
UBS Global Allocation Fund | 23 | ||||||
UBS International Sustainable Equity Fund | 36 | ||||||
UBS U.S. Large Cap Equity Fund | 44 | ||||||
UBS U.S. Small Cap Growth Fund | 53 | ||||||
UBS Total Return Bond Fund | 62 | ||||||
UBS Municipal Bond Fund | 76 | ||||||
Explanation of expense disclosure | 86 | ||||||
Statement of assets and liabilities | 90 | ||||||
Statement of operations | 98 | ||||||
Statement of changes in net assets | 102 | ||||||
Financial highlights | 106 | ||||||
Notes to financial statements | 120 | ||||||
Report of independent registered public accounting firm | 149 | ||||||
Federal tax information | 150 | ||||||
General information | 151 | ||||||
Board approval of investment advisory agreements | 152 | ||||||
Trustee and officer information | 156 | ||||||
This page intentionally left blank.
President's letter
August 18, 2017
Dear Shareholder,
Many of the investment themes that have driven markets over the past several quarters are still in place—with some important differences having developed in the first half of 2017. Global markets continue to rise led by positive economic indicators, but are complicated by central bank actions to reverse the accommodative policies of the past several years. In the United States, the defining investment narrative of Donald Trump's presidency has shifted from having been unambiguously supportive at the beginning of his term to highly uncertain after the first six months. Financial markets in the developed world have recently enjoyed a very smooth growth path. However, potential eruptions of volatility could be spurred by central bank action in their return to a more normal policy stance; by risks posed by the gap between the market's expectation of pro-growth legislation and the reality of what lawmakers are able to deliver; or by unanticipated geopolitical events that have heretofore not significantly altered equity markets' upward march. At UBS Asset Management, we are constantly monitoring the investment landscape and we believe that the potential for a more uneven growth path makes diversification and long-term planning more pertinent for today's investors.
For central banks in the developed world, returning to normal policies from the highly accommodative measures instituted after the 2008—2009 financial crisis will likely be a delicate balancing act. Move too rapidly and central bank policy changes could dampen economic growth. On the other side, reluctance to move quickly enough could have the unintended effect of inflating a bubble in risk assets. While we believe that central banks will take a moderate and thoughtful approach to policy normalization, it remains to be seen how and when financial markets will find their way back to smooth functioning after having become accustomed to unorthodox central bank interventions. Coupled with ongoing uncertainties around the Trump administration's ability to implement pro-growth legislation in the United States, unsettled geopolitical concerns and some key elections in European countries, we believe that we are entering a new market phase. Asset prices and volatility could become increasingly dependent on the policy successes and failures of both central banks and national governments.
Against the backdrop of a policy-driven market, we see a shift toward portfolio manager skills playing a much greater role in generating returns for investors. As central banks move toward historical policy norms, we expect the price of equities to rise more slowly. But decelerating equity markets can also create value opportunities and skilled portfolio managers can use an investment's fundamental measures to exploit temporary price distortions and create excess returns. Active managers with a long-term view and the ability to look through short-term noise have the unique opportunity to find investments that can perform strongly, even if the overall market disappoints. We continue to believe that there are compelling opportunities across global asset classes and that the right strategies in the hands of skilled investment professionals have the power to deliver better investment outcomes for our clients. At UBS Asset Management, we embrace the responsibility of helping our clients meet their financial objectives and thank you for your continued trust in our skill and commitment to serve you.
1
President's letter
Sincerely,

Mark E. Carver
President
The UBS Funds
Managing Director
UBS Asset Management (Americas) Inc.
The views expressed are those of UBS Asset Management (Americas) Inc. as of August 18, 2017. The views are subject to change based on market conditions; they are not intended to predict or guarantee the future performance of the markets, any individual security or market segment, or any UBS mutual fund.
Mutual funds are sold by prospectus only. You should read it carefully and consider a fund's investment objectives, risks, charges, expenses and other important information contained in the prospectus before investing. A prospectus or summary prospectus for the funds can be obtained from your financial advisor, by calling UBS Funds at 800-647 1568 or by visiting our web site at www.ubs.com/am-us.
2
The markets in review
The global economic expansion continues
The US economy continued to expand, albeit at a relatively modest pace, during the 12 months ended June 30, 2017. Looking back, the US Commerce Department reported that gross domestic product ("GDP") grew at a revised 2.2% seasonally adjusted annualized rate during the second quarter of 2016. GDP growth then improved to a revised 2.8% rate during the third quarter of 2016—the strongest reading since the first quarter of 2015. GDP growth then moderated to a revised 1.8% rate during the fourth quarter of 2016 and a 1.2% rate during the first quarter of 2017. Finally, second quarter 2017 GDP grew at a 2.6% rate based on the US Commerce Department's initial estimate.1
Prior to the beginning of the reporting period, after taking its first step toward normalizing monetary policy in late 2015, the US Federal Reserve Board ("Fed") kept the federal funds rate unchanged until December 2016, when it increased rates by 0.25% to a range between 0.50% and 0.75%. After keeping rates unchanged at its first meeting in 2017, the Fed again raised rates 0.25% to a range between 0.75% and 1.00% at its meeting in March 2017, and then to a range between 1.00% and 1.25% at its meeting in June 2017. In its statement following the June meeting, the Fed indicated that it may begin to reduce its balance sheet later in the year, saying, "The Committee currently expects to begin implementing a balance sheet normalization program this year, provided that the economy evolves broadly as anticipated."
From a global perspective, the International Monetary Fund's ("IMF") April 2017 World Economic Outlook Update said, "Global economic activity is picking up with a long-awaited cyclical recovery in investment, manufacturing, and trade...If confidence and market sentiment remain strong, short-term growth could indeed surprise on the upside. But these positive developments should not distract from binding structural impediments to a stronger recovery and a balance of risks that remains tilted to the downside, especially over the medium term." From a regional perspective, the IMF projects 2017 growth in the eurozone will be 1.7%, the same as in 2016. Japan's economy is forecast to grow 1.2% in 2017, compared to 1.0% in 2016. Finally, the IMF projects that overall growth in emerging markets countries will increase to 4.5% in 2017, versus 4.1% in 2016.
Global equities generated strong results
While there were periods of volatility, the global equity market generated strong results during the reporting period as a whole. After a strong start, equites then experienced a setback in October 2016 given uncertainties surrounding the US elections. However, US equities rallied sharply following the elections given expectations for improving growth under the Trump administration. International equities largely followed the same pattern, as they rallied amid signs of improving growth and continued monetary policy accommodation. All told, the US stock market, as measured by the S&P 500 Index,2 gained 17.90% for the 12 months ended June 30, 2017. International developed equities, as measured by the MSCI EAFE Index (net),3 rose 20.27% during the reporting period, while emerging markets equities, as measured by the MSCI Emerging Markets Index (net),4 gained 23.75%.
1 Based on the Commerce Department's initial estimate announced on July 28, 2017, after the reporting period had ended.
2 The S&P 500 Index is an unmanaged, weighted index composed of 500 widely held common stocks varying in composition and is not available for direct investment. Investors should note that indices do not reflect the deduction of fees and expenses.
3 The MSCI EAFE Index (net) is an index of stocks designed to measure the investment returns of developed economies outside of North America. Net total return indices reinvest dividends after the deduction of withholding taxes, using a tax rate applicable to non-resident institutional investors who do not benefit from double taxation treaties. The index is constructed and managed with a view to being fully investable from the perspective of international institutional investors. Investors should note that indices do not reflect the deduction of fees and expenses.
4 The MSCI Emerging Markets Index (net) is a market capitalization-weighted index composed of different emerging market countries in Europe, Latin America, and the Pacific Basin. Net total return indices reinvest dividends after the deduction of withholding taxes, using a tax rate applicable to non-resident institutional investors who do not benefit from double taxation treaties. The index is constructed and managed with a view to being fully investable from the perspective of international institutional investors. Investors should note that indices do not reflect the deduction of fees and expenses.
3
The markets in review
The fixed income market generated mixed results
The global fixed income market posted mixed results during the reporting period. In the US, Treasury yields moved sharply higher after the November elections as investors anticipated an uptick in growth and inflation. Additionally, Fed rate hikes pressured the shorter end of the yield curve. However, after peaking in mid-March 2017, yields moved lower amid skepticism about the Trump administration's growth initiatives. For the fiscal year as a whole, the yield on the US 10-year Treasury rose from 1.49% to 2.31% (bond yields and prices move in the opposite direction). The overall US bond market, as measured by the Bloomberg Barclays US Aggregate Index,5 returned -0.31% for the 12 months ended June 30, 2017. Returns of riskier fixed income securities were greater. High yield bonds, as measured by the BofA Merrill Lynch US High Yield Cash Pay Constrained Index6 gained 12.74% during the reporting period. Elsewhere, emerging markets debt, as measured by the J.P. Morgan Emerging Markets Bond Index Global (EMBI Global),7 rose 5.52%.
5 The Bloomberg Barclays US Aggregate Index is an unmanaged broad based index designed to measure the US dollar-denominated, investment-grade, taxable bond market. The index includes bonds from the Treasury, government-related, corporate, mortgage-backed, asset-backed and commercial mortgage-backed sectors. Investors should note that indices do not reflect the deduction of fees and expenses.
6 The BofA Merrill Lynch US High Yield Cash Pay Constrained Index is an unmanaged index of publicly placed, non-convertible, coupon-bearing US dollar denominated, below investment grade corporate debt with a term to maturity of at least one year. The index is market capitalization weighted, so that larger bond issuers have a greater effect on the index's return. However, the representation of any single bond issuer is restricted to a maximum of 2% of the total index. Investors should note that indices do not reflect the deduction of fees and expenses.
7 The J.P. Morgan Emerging Markets Bond Index Global (EMBI Global) is an unmanaged index which is designed to track total returns for US dollar denominated debt instruments issued by emerging market sovereign and quasi-sovereign entities: Brady bonds, loans and Eurobonds. Investors should note that indices do not reflect the deduction of fees and expenses.
4
UBS Dynamic Alpha Fund
Portfolio performance
For the 12 months ended June 30, 2017, Class A shares of UBS Dynamic Alpha Fund (the "Fund") returned 5.84% (Class A shares returned 0.00% after the deduction of the maximum sales charge), while Class P shares returned 6.05%. For purposes of comparison, the BofA Merrill Lynch US Treasury 1-5 Year Index returned -0.53% during the same time period, the MSCI World Index (net) returned 18.20%, and the Citigroup One-Month US Treasury Bill Index returned 0.42%. (Class P shares have lower expenses than other share classes of the Fund.)
Returns for all share classes over various time periods are shown on page 7; please note that these returns do not reflect the deduction of taxes that a shareholder would pay on Fund distributions or the redemption of Fund shares, while the Index returns do not reflect the deduction of fees and expenses.)
The Fund produced a positive absolute return during the reporting period, driven by both market and currency allocation decisions.
During the reporting period, we used derivatives for risk management purposes and as a tool to help enhance returns across various strategies. With respect to our active currency strategy, utilizing currency forwards had a direct positive impact on Fund performance.1 We used a variety of equity and fixed income futures and swaps to implement our market allocation strategy. Derivatives were just one tool, among others, that we used to implement our market allocation strategy. These derivatives, in aggregate, added to performance during the reporting period.
Portfolio performance summary2
What worked:
• Overall, the Fund's equity positioning was positive for returns.
– The Fund's long exposure to global equities (US, developed ex-US and emerging markets) contributed to performance over the reporting period. A number of equity markets have reached their all-time highs amid improving economic data and resurgent investor confidence.
– The Fund benefited from certain relative value trades, such as being long developed ex-US equities versus US equities and long eurozone banks versus European large-cap equities, as well as broad emerging markets versus US equities. Developed ex-US equities strengthened amid a reduction in geopolitical risks and further commitments to accommodative monetary policy.
• Overall, the Fund's fixed income positions were positive for performance.
– The Fund's preference for global corporate bonds and European high yield bonds added value.
– The Fund benefited from certain relative value trades, such as long German bunds versus French government bonds, long US Treasury Inflation-Protected Securities ("TIPS") versus US Treasuries and long 10-year US treasuries versus German 10-year bunds.
1 Active currency strategy refers to those positions explicitly implemented by the portfolio manager in an effort to generate alpha and does not include the currency contracts utilized by the Fund for hedging purposes.
2 For a detailed commentary on the market environment in general during the reporting period, see pages 3-4.
5
UBS Dynamic Alpha Fund
• Overall, the portfolio's active currency strategy was beneficial for results.
– The Fund's long positions in the euro relative to the US dollar, long Australian dollar relative to the New Zealand dollar, long Mexican peso relative to the US dollar and long euro versus the Swiss franc all contributed to performance.
– The Fund's long position in the Indian rupee relative to the Korean won proved beneficial for performance. The rupee was more resilient during this volatile time period amid interventions by the Reserve Bank of India and strong macro fundamentals.
What didn't work:
• Certain equity positions detracted from results.
– A preference for emerging markets minimum volatility equities over broad emerging markets equities detracted from performance.
– Our long Spanish versus Italian equities detracted from performance toward the end of 2016.
– Long-forgotten value stocks performed strongly following the US election outcome, but have since reverted back to underperforming growth stocks and the capitalization-weighted index, as evidenced by the negative performance of our long Russell 1000 Value position versus the S&P 500.
• Certain fixed income positions detracted from results.
– The Fund's long exposure to Australian duration detracted from results as the economy fared better than expected given lower commodity prices. This resulted in fewer rate cuts than expected.
– The Fund's performance was negatively impacted by certain relative value trades, such as long positions in US Treasuries versus Italian government bonds. US Treasury yields rose sharply in the last two months of the year amid greater inflation expectations and a revision in anticipated moves by the US Federal Reserve Board.
• Certain currency trades performed poorly during the reporting period.
– A detractor from performance was the Fund's long position in the Mexican peso relative to the Canadian dollar. Despite solid fundamentals, the peso struggled amid protectionist and trade concerns after the result of the US presidential election.
– The Fund's long exposure to the Japanese yen relative to the euro did not fare well over the first six months of the year since it was introduced. The euro has appreciated following European elections and potential hikes hinted at by the European Central Bank.
This letter is intended to assist shareholders in understanding how the Fund performed during the 12 months ended June 30, 2017. The views and opinions in the letter were current as of August 18, 2017. They are not guarantees of future performance or investment results and should not be taken as investment advice. Investment decisions reflect a variety of factors, and we reserve the right to change our views about individual securities, sectors and markets at any time. As a result, the views expressed should not be relied upon as a forecast of the Fund's future investment intent. We encourage you to consult your financial advisor regarding your personal investment program.
Mutual funds are sold by prospectus only. You should read it carefully and consider a fund's investment objectives, risks, charges, expenses and other important information contained in the prospectus before investing. Prospectuses for most of our funds can be obtained from your financial advisor, by calling UBS Funds at 800-647 1568 or by visiting our website at www.ubs.com/am-us.
6
UBS Dynamic Alpha Fund
Average annual total returns for periods ended 06/30/17 (unaudited)
1 year | 5 years | 10 years | |||||||||||||
Before deducting maximum sales charge | |||||||||||||||
Class A1 | 5.84 | % | 2.31 | % | 1.38 | % | |||||||||
Class C2 | 4.84 | 1.50 | 0.60 | ||||||||||||
Class P3 | 6.05 | 2.54 | 1.66 | ||||||||||||
After deducting maximum sales charge | |||||||||||||||
Class A1 | 0.00 | % | 1.16 | % | 0.81 | % | |||||||||
Class C2 | 3.84 | 1.50 | 0.60 | ||||||||||||
BofA Merrill Lynch US Treasury 1-5 Year Index4 | (0.53 | ) | 0.87 | 2.65 | |||||||||||
MSCI World Index (net)5 | 18.20 | 11.38 | 3.97 | ||||||||||||
Citigroup One-Month US Treasury Bill Index6 | 0.42 | 0.12 | 0.43 | ||||||||||||
The annualized gross and net expense ratios, respectively, for each class of shares as in the October 28, 2016 prospectuses were as follows: Class A—1.46% and 1.36%; Class C—2.24% and 2.11%; Class P—1.23% and 1.11%. Net expenses reflect fee waivers and/or expense reimbursements, if any, pursuant to an agreement that is in effect to cap the expenses. The Trust, with respect to the Fund, and UBS Asset Management (Americas) Inc., the Fund's investment advisor ("UBS AM (Americas)" or the "Advisor"), have entered into a written agreement pursuant to which the Advisor has agreed to waive a portion of its management fees and/or to reimburse expenses (excluding expenses incurred through investment in other investment companies, interest, taxes, brokerage commissions, extraordinary expenses, and dividend expense and security loan fees for securities sold short) to the extent necessary so that the Fund's ordinary operating expenses (excluding expenses incurred through investment in other investment companies, interest, taxes, brokerage commissions, extraordinary expenses, and dividend expense and security loan fees for securities sold short), through the period ending October 27, 2017, do not exceed 1.35% for Class A shares, 2.10% for Class C shares and 1.10% for Class P shares. Pursuant to the written agreement, the Advisor is entitled to be reimbursed for any fees it waives and expenses it reimburses to the extent such reimbursement can be made during the three years following the period during which such fee waivers and expense reimbursements were made, provided that the reimbursement of the Advisor by the Fund will not cause the Fund to exceed any applicable expense limit that is in place for the Fund. The fee waiver/expense reimbursement agreement may be terminated by the Fund's Board of Trustees at any time and also will terminate automatically upon the expiration or termination of the Fund's advisory contract with the Advisor. Upon termination of the fee waiver/expense reimbursement agreement, however, UBS AM (Americas)'s three year recoupment rights will survive.
1 Maximum sales charge for Class A shares is 5.5%. Class A shares bear ongoing 12b-1 service fees.
2 Maximum contingent deferred sales charge for Class C shares is 1% imposed on redemptions and is reduced to 0% after one year. Class C shares bear ongoing 12b-1 distribution and service fees.
3 Class P shares do not bear initial or contingent deferred sales charges or ongoing 12b-1 service and distribution fees, but Class P shares held through advisory programs may be subject to a program fee, which, if included, would have reduced performance.
4 The BofA Merrill Lynch US Treasury 1-5 Year Index is an unmanaged index designed to track US Treasury securities with maturities between 1 and 5 years. Investors should note that indices do not reflect the deduction of fees and expenses.
5 The MSCI World Index (net) is a free float-adjusted market capitalization weighted index that is designed to measure the equity market performance of developed markets. Net total return indices reinvest dividends after the deduction of withholding taxes, using a tax rate applicable to non-resident institutional investors who do not benefit from double taxation treaties. The index is constructed and managed with a view to being fully investable from the perspective of international institutional investors. Investors should note that indices do not reflect the deduction of fees and expenses.
6 The Citigroup One-Month US Treasury Bill Index is an unmanaged index representing monthly return equivalents of yield averages of the last one month Treasury Bill issue. Investors should note that indices do not reflect the deduction of fees and expenses.
Prior to August 3, 2015, a 1% redemption fee was imposed on sales or exchanges of any class of shares of the Fund made during the specified holding period.
Past performance does not predict future performance, and the performance information provided does not reflect the deduction of taxes that a shareholder would pay on Fund distributions or the redemption of Fund shares. The return and principal value of an investment will fluctuate, so that an investor's shares, when redeemed, may be worth more or less than their original cost. Performance results assume reinvestment of all dividends and capital gain distributions at net asset value on the ex-dividend dates. Current performance may be higher or lower than the performance data quoted. For month-end performance figures, please visit www.ubs.com/us-mutualfundperformance.
7
UBS Dynamic Alpha Fund
Illustration of an assumed investment of $10,000 in Class A shares (adjusted for 5.5% maximum sales charge) and $5,000,000 in Class P shares (unaudited)
The following two graphs depict the performance of UBS Dynamic Alpha Fund Class A and Class P shares versus the BofA Merrill Lynch US Treasury 1-5 Year Index, the MSCI World Index (net) and the Citigroup One-Month US Treasury Bill Index over the 10 years ended June 30, 2017. The performance of Class C shares will vary based upon the different class specific expenses and sales charges. The performance provided does not reflect the deduction of taxes that a shareholder would pay on Fund distributions or the redemption of Fund shares. Past performance is no guarantee of future results. Share price and returns will vary with market conditions; investors may realize a gain or loss upon redemption.
UBS Dynamic Alpha Fund Class A vs. BofA Merrill Lynch US Treasury 1-5 Year Index, MSCI World Index (net) and Citigroup One-Month US Treasury Bill Index
Wealth value with dividends reinvested. Initial investment for Class A Shares as of June 30, 2007 = $9,450
The Fund's growth of an assumed $10,000 investment is adjusted for the maximum sales charge of 5.5%.

UBS Dynamic Alpha Fund Class P vs. BofA Merrill Lynch US Treasury 1-5 Year Index, MSCI World Index (net) and Citigroup One-Month US Treasury Bill Index
Wealth value with dividends reinvested. Initial investment for Class P Shares as of June 30, 2007 = $5,000,000

Past performance does not predict future performance, and the performance information provided does not reflect the deduction of taxes that a shareholder would pay on Fund distributions or the redemption of Fund shares. The return and principal value of an investment will fluctuate, so that an investor's shares, when redeemed, may be worth more or less than their original cost. Performance results assume reinvestment of all dividends and capital gain distributions at net asset value on the ex-dividend dates. Current performance may be higher or lower than the performance data quoted. For month-end performance figures, please visit www.ubs.com/us-mutualfundperformance.
8
UBS Dynamic Alpha Fund
Portfolio statistics—June 30, 2017 (unaudited)1
Top ten holdings
| Percentage of net assets | |||||||
| U.S. Treasury Note, 1.000%, 09/15/17 | 14.4 | % | |||||
| U.S. Treasury Note, 0.750%, 10/31/17 | 13.2 | ||||||
| JPMorgan Chase & Co., 3.200%, 01/25/23 | 0.8 | ||||||
| Citigroup, Inc., 3.875%, 10/25/23 | 0.5 | ||||||
| Goldman Sachs Group, Inc. (The), 2.000%, 07/27/23 | 0.5 | ||||||
| Morgan Stanley, 2.500%, 04/21/21 | 0.4 | ||||||
| Bank of America Corp., 3.875%, 08/01/25 | 0.4 | ||||||
| GE Capital International Funding Co. Unlimited Co., 4.418%, 11/15/35 | 0.4 | ||||||
| Adani Abbot Point Terminal Pty. Ltd., 6.750%, 11/01/18 | 0.3 | ||||||
| alstria office REIT-AG, 2.250%, 03/24/21 | 0.3 | ||||||
Total | 31.2 | % | |||||
Top five issuer breakdown by country or territory of origin
| Percentage of net assets | |||||||
United States | 49.2 | % | |||||
United Kingdom | 5.7 | ||||||
Netherlands | 3.8 | ||||||
Australia | 2.9 | ||||||
France | 1.8 | ||||||
Total | 63.4 | % | |||||
1 The Fund's portfolio is actively managed and its composition will vary over time.
9
UBS Dynamic Alpha Fund
Industry diversification—June 30, 2017 (unaudited)1,2
| Bonds Corporate bonds | Percentage of net assets | ||||||
Air freight & logistics | 0.13 | % | |||||
Automobiles | 0.10 | ||||||
Banks | 8.64 | ||||||
Beverages | 1.39 | ||||||
Biotechnology | 0.78 | ||||||
Capital markets | 2.15 | ||||||
Chemicals | 0.55 | ||||||
Commercial services & supplies | 0.15 | ||||||
Communications equipment | 0.15 | ||||||
Construction & engineering | 0.69 | ||||||
Consumer finance | 0.43 | ||||||
Diversified financial services | 1.15 | ||||||
Diversified telecommunication services | 2.70 | ||||||
Electric utilities | 2.88 | ||||||
Electrical equipment | 0.08 | ||||||
Energy equipment & services | 0.23 | ||||||
Equity real estate investment trusts (REITs) | 0.77 | ||||||
Food & staples retailing | 0.29 | ||||||
Food products | 0.45 | ||||||
Gas utilities | 0.84 | ||||||
Health care equipment & supplies | 0.43 | ||||||
Health care providers & services | 0.70 | ||||||
Hotels, restaurants & leisure | 0.07 | ||||||
Household products | 0.60 | ||||||
Independent power and renewable electricity producers | 0.24 | ||||||
Industrial conglomerates | 0.54 | ||||||
Insurance | 3.88 | ||||||
Internet software & services | 0.36 | ||||||
Life sciences tools & services | 0.08 | ||||||
Machinery | 0.13 | ||||||
Media | 1.52 | ||||||
Metals & mining | 0.66 | ||||||
Multi-utilities | 0.62 | ||||||
Oil, gas & consumable fuels | 4.57 | ||||||
Pharmaceuticals | 1.78 | ||||||
Real estate management & development | 0.20 | ||||||
Road & rail | 0.51 | ||||||
Semiconductors & semiconductor equipment | 0.36 | ||||||
Software | 0.47 | ||||||
Specialty retail | 0.17 | ||||||
Technology hardware, storage & peripherals | 0.60 | ||||||
Tobacco | 0.99 | ||||||
Transportation infrastructure | 0.42 | ||||||
Water utilities | 0.54 | ||||||
Wireless telecommunication services | 0.59 | ||||||
Total corporate bonds | 45.58 | % | |||||
Bonds—(Continued) | Percentage of net assets | ||||||
Asset-backed security | 0.04 | % | |||||
Collateralized debt obligation | 0.003 | ||||||
Collateralized mortgage obligation | 0.003 | ||||||
Non-U.S. government obligation | 0.12 | ||||||
U.S. treasury obligations | 27.59 | ||||||
Total bonds | 73.33 | % | |||||
Exchange traded fund | 4.69 | ||||||
Short-term investments | 14.25 | ||||||
Investment of cash collateral from securities loaned | 5.09 | ||||||
Total investments | 97.36 | % | |||||
Cash and other assets, less liabilities | 2.64 | ||||||
Net assets | 100.00 | % | |||||
1 Figures represent the breakdown of direct investments of UBS Dynamic Alpha Fund. Figures would be different if a breakdown of the underlying investment companies and exchange traded funds was included.
2 The Fund's portfolio is actively managed and its composition will vary over time.
3 Amount represents less than 0.005%.
10
UBS Dynamic Alpha Fund
Portfolio of investments
June 30, 2017
| Face amount | Value | ||||||||||
Bonds: 73.33% | |||||||||||
Corporate bonds: 45.58% | |||||||||||
Australia: 2.94% | |||||||||||
| Adani Abbot Point Terminal Pty. Ltd., 6.750%, due 11/01/181 | AUD | 700,000 | $ | 539,714 | |||||||
| APT Pipelines Ltd., 4.200%, due 03/23/251 | $ | 20,000 | 20,648 | ||||||||
4.200%, due 03/23/252 | 250,000 | 258,101 | |||||||||
| Aurizon Network Pty. Ltd., 2.000%, due 09/18/241 | EUR | 220,000 | 259,565 | ||||||||
| Australia & New Zealand Banking Group Ltd., 4.500%, due 03/19/241 | $ | 250,000 | 261,172 | ||||||||
| Australia Pacific Airports Melbourne Pty. Ltd., 1.750%, due 10/15/241 | EUR | 150,000 | 178,837 | ||||||||
| BHP Billiton Finance USA Ltd., 5.000%, due 09/30/43 | $ | 90,000 | 104,289 | ||||||||
| National Australia Bank Ltd., 2.000%, due 11/12/241,3 | EUR | 250,000 | 292,176 | ||||||||
| Optus Finance Pty. Ltd., 4.625%, due 10/15/191 | $ | 200,000 | 209,583 | ||||||||
| Origin Energy Finance Ltd., 2.500%, due 10/23/201 | EUR | 325,000 | 394,407 | ||||||||
5.450%, due 10/14/211 | $ | 235,000 | 253,723 | ||||||||
| QBE Insurance Group Ltd., 2.400%, due 05/01/181 | 205,000 | 205,119 | |||||||||
6.750%, due 12/02/441,3 | 395,000 | 440,129 | |||||||||
| Santos Finance Ltd., 8.250%, due 09/22/703 | EUR | 155,000 | 178,561 | ||||||||
| Scentre Group Trust 1, 1.375%, due 03/22/231 | 200,000 | 233,642 | |||||||||
1.500%, due 07/16/201 | 150,000 | 176,712 | |||||||||
| SGSP Australia Assets Pty. Ltd., 2.000%, due 06/30/221 | 125,000 | 150,394 | |||||||||
3.250%, due 07/29/261 | $ | 200,000 | 196,315 | ||||||||
| Telstra Corp. Ltd., 4.800%, due 10/12/211 | 120,000 | 131,253 | |||||||||
| Transurban Finance Co. Pty. Ltd., 1.875%, due 09/16/241 | EUR | 100,000 | 118,858 | ||||||||
| Westpac Banking Corp., 2.800%, due 01/11/22 | $ | 85,000 | 86,226 | ||||||||
Total Australia corporate bonds | 4,689,424 | ||||||||||
Belgium: 0.60% | |||||||||||
| AG Insurance SA, 3.500%, due 06/30/471,3 | EUR | 200,000 | 239,851 | ||||||||
| Anheuser-Busch InBev SA/NV, 0.875%, due 03/17/221 | 280,000 | 326,334 | |||||||||
1.500%, due 03/17/251 | 240,000 | 283,948 | |||||||||
| RESA SA, 1.000%, due 07/22/261 | 100,000 | 110,962 | |||||||||
Total Belgium corporate bonds | 961,095 | ||||||||||
Bermuda: 0.13% | |||||||||||
| Bacardi Ltd., 2.750%, due 07/03/231 | 170,000 | 214,094 | |||||||||
| Face amount | Value | ||||||||||
Brazil: 0.15% | |||||||||||
| Vale SA, 5.625%, due 09/11/42 | $ | 245,000 | $ | 232,750 | |||||||
Canada: 0.95% | |||||||||||
| Bank of Montreal, 6.020%, due 05/02/18 | CAD | 220,000 | 176,153 | ||||||||
| Bell Canada, Inc., 4.750%, due 09/29/44 | 50,000 | 42,034 | |||||||||
| Canadian Natural Resources Ltd., 2.950%, due 01/15/23 | $ | 125,000 | 123,988 | ||||||||
3.850%, due 06/01/27 | 135,000 | 134,224 | |||||||||
4.950%, due 06/01/47 | 50,000 | 50,814 | |||||||||
| Cenovus Energy, Inc., 4.250%, due 04/15/272 | 160,000 | 152,436 | |||||||||
| Nexen Energy ULC, 6.400%, due 05/15/37 | 165,000 | 210,571 | |||||||||
| Royal Bank of Canada, 2.980%, due 05/07/191 | CAD | 160,000 | 126,365 | ||||||||
| Suncor Energy, Inc., 6.500%, due 06/15/38 | $ | 205,000 | 262,802 | ||||||||
| TELUS Corp., 3.750%, due 01/17/25 | CAD | 55,000 | 44,718 | ||||||||
| Yamana Gold, Inc., 4.950%, due 07/15/24 | $ | 185,000 | 186,916 | ||||||||
Total Canada corporate bonds | 1,511,021 | ||||||||||
Cayman Islands: 0.91% | |||||||||||
| Hutchison Whampoa International 09 Ltd., 7.625%, due 04/09/191 | 125,000 | 136,406 | |||||||||
| Noble Holding International Ltd., 7.700%, due 04/01/25 | 110,000 | 84,425 | |||||||||
| Phoenix Group Holdings, 4.125%, due 07/20/221 | GBP | 250,000 | 336,975 | ||||||||
| Tencent Holdings Ltd., 3.375%, due 05/02/192 | $ | 200,000 | 204,569 | ||||||||
| Thames Water Utilities Cayman Finance Ltd., 5.375%, due 07/21/253 | GBP | 90,000 | 117,502 | ||||||||
| Transocean, Inc., 6.800%, due 03/15/384 | $ | 140,000 | 102,200 | ||||||||
| XLIT Ltd., 3.250%, due 06/29/473 | EUR | 200,000 | 225,003 | ||||||||
5.250%, due 12/15/43 | $ | 85,000 | 96,472 | ||||||||
| Yorkshire Water Services Bradford Finance Ltd., 3.750%, due 03/22/461,3 | GBP | 100,000 | 139,360 | ||||||||
Total Cayman Islands corporate bonds | 1,442,912 | ||||||||||
Curacao: 0.05% | |||||||||||
| Teva Pharmaceutical Finance IV BV, 3.650%, due 11/10/21 | $ | 75,000 | 77,438 | ||||||||
Czech Republic: 0.08% | |||||||||||
| NET4GAS sro, 2.500%, due 07/28/211 | EUR | 100,000 | 121,914 | ||||||||
11
UBS Dynamic Alpha Fund
Portfolio of investments
June 30, 2017
| Face amount | Value | ||||||||||
Bonds—(Continued) | |||||||||||
Corporate bonds—(Continued) | |||||||||||
Denmark: 0.09% | |||||||||||
| DONG Energy A/S, 3.000%, due 11/06/30151,3 | EUR | 115,000 | $ | 136,995 | |||||||
Finland: 0.42% | |||||||||||
| Elenia Finance OYJ, 2.875%, due 12/17/201 | 230,000 | 282,632 | |||||||||
| Teollisuuden Voima OYJ, 2.500%, due 03/17/211 | 125,000 | 149,206 | |||||||||
4.625%, due 02/04/191 | 195,000 | 237,484 | |||||||||
Total Finland corporate bonds | 669,322 | ||||||||||
France: 1.80% | |||||||||||
| APRR SA, 2.250%, due 01/16/201 | 200,000 | 240,376 | |||||||||
| Arkema SA, 1.500%, due 01/20/251 | 100,000 | 117,337 | |||||||||
| AXA SA, 3.375%, due 07/06/471,3 | 100,000 | 121,421 | |||||||||
| Banque Federative du Credit Mutuel SA, 3.000%, due 09/11/251 | 100,000 | 123,203 | |||||||||
| BNP Paribas SA, 2.700%, due 08/20/18 | $ | 170,000 | 171,933 | ||||||||
2.875%, due 03/20/261,3 | EUR | 115,000 | 139,226 | ||||||||
| Credit Agricole SA, 1.875%, due 12/20/261 | 100,000 | 116,485 | |||||||||
| Credit Logement SA, 0.819%, due 09/16/171,3,5 | 150,000 | 140,998 | |||||||||
| Electricite de France SA, 5.594%, due 01/22/242,3,5 | $ | 180,000 | 185,355 | ||||||||
6.950%, due 01/26/392 | 95,000 | 126,379 | |||||||||
| Engie SA, 4.750%, due 07/10/211,3,5 | EUR | 200,000 | 255,842 | ||||||||
| Orange SA, 5.875%, due 02/07/221,3,5 | GBP | 170,000 | 244,741 | ||||||||
| RTE Reseau de Transport d'Electricite SA, 1.000%, due 10/19/261 | EUR | 100,000 | 112,029 | ||||||||
| Sanofi, 0.000%, due 01/13/201 | 300,000 | 342,046 | |||||||||
| TDF Infrastructure SAS, 2.875%, due 10/19/221 | 100,000 | 124,192 | |||||||||
| TOTAL SA, 2.625%, due 02/26/251,3,5 | 165,000 | 186,570 | |||||||||
| Transport et Infrastructures Gaz France SA, 2.200%, due 08/05/251 | 100,000 | 121,365 | |||||||||
Total France corporate bonds | 2,869,498 | ||||||||||
Germany: 0.87% | |||||||||||
| Allianz SE, 4.750%, due 10/24/231,3,5 | 100,000 | 131,340 | |||||||||
| alstria office REIT-AG, 2.250%, due 03/24/211 | 400,000 | 482,567 | |||||||||
| Deutsche Bank AG, 1.875%, due 02/28/201 | GBP | 200,000 | 261,341 | ||||||||
| Face amount | Value | ||||||||||
| Henkel AG & Co. KGaA, 0.875%, due 09/13/221 | GBP | 85,000 | $ | 108,365 | |||||||
1.500%, due 09/13/191 | $ | 350,000 | 347,636 | ||||||||
| LANXESS AG, 0.250%, due 10/07/211 | EUR | 50,000 | 56,695 | ||||||||
Total Germany corporate bonds | 1,387,944 | ||||||||||
Hong Kong: 0.13% | |||||||||||
| AIA Group Ltd., 1.750%, due 03/13/181 | $ | 200,000 | 199,594 | ||||||||
Ireland: 0.90% | |||||||||||
| Aquarius & Investments plc for Swiss Reinsurance Co. Ltd., 6.375%, due 09/01/241,3 | 200,000 | 212,884 | |||||||||
| Fresenius Finance Ireland plc, 0.875%, due 01/31/221 | EUR | 90,000 | 102,874 | ||||||||
1.500%, due 01/30/241 | 80,000 | 92,320 | |||||||||
| GAS Networks Ireland, 1.375%, due 12/05/261 | 120,000 | 137,927 | |||||||||
| GE Capital International Funding Co. Unlimited Co., 4.418%, due 11/15/35 | $ | 604,000 | 658,081 | ||||||||
| Shire Acquisitions Investments Ireland DAC, 2.400%, due 09/23/21 | 150,000 | 148,236 | |||||||||
3.200%, due 09/23/26 | 90,000 | 88,016 | |||||||||
Total Ireland corporate bonds | 1,440,338 | ||||||||||
Italy: 0.85% | |||||||||||
| Autostrade per l'Italia SpA, 1.125%, due 11/04/211 | EUR | 110,000 | 129,610 | ||||||||
| CDP Reti SpA, 1.875%, due 05/29/221 | 155,000 | 182,445 | |||||||||
| Intesa Sanpaolo SpA, 3.875%, due 01/16/18 | $ | 320,000 | 322,963 | ||||||||
4.375%, due 10/15/191 | EUR | 100,000 | 124,973 | ||||||||
| Italgas SpA, 1.625%, due 01/19/271 | 100,000 | 115,402 | |||||||||
| Snam SpA, 1.375%, due 11/19/231 | 110,000 | 129,029 | |||||||||
| UniCredit SpA, 6.375%, due 05/02/231,3 | $ | 340,000 | 350,050 | ||||||||
Total Italy corporate bonds | 1,354,472 | ||||||||||
Japan: 0.21% | |||||||||||
| Bank of Tokyo-Mitsubishi UFJ Ltd. (The), 2.350%, due 09/08/191 | 200,000 | 200,602 | |||||||||
| Sumitomo Mitsui Financial Group, Inc., 2.934%, due 03/09/21 | 125,000 | 126,975 | |||||||||
Total Japan corporate bonds | 327,577 | ||||||||||
Jersey: 0.46% | |||||||||||
| AA Bond Co. Ltd., 2.875%, due 01/31/221 | GBP | 174,000 | 231,007 | ||||||||
4.720%, due 07/31/181 | 10,000 | 13,474 | |||||||||
12
UBS Dynamic Alpha Fund
Portfolio of investments
June 30, 2017
| Face amount | Value | ||||||||||
Bonds—(Continued) | |||||||||||
Corporate bonds—(Continued) | |||||||||||
Jersey—(Concluded) | |||||||||||
| Gatwick Funding Ltd., 5.250%, due 01/23/241 | GBP | 140,000 | $ | 217,776 | |||||||
| Heathrow Funding Ltd., 4.600%, due 02/15/181 | EUR | 150,000 | 176,180 | ||||||||
| HSBC Bank Capital Funding Sterling 2 LP, 5.862%, due 04/07/203,5 | GBP | 70,000 | 100,110 | ||||||||
Total Jersey corporate bonds | 738,547 | ||||||||||
Luxembourg: 0.43% | |||||||||||
| Allergan Funding SCS, 1.250%, due 06/01/24 | EUR | 205,000 | 232,611 | ||||||||
2.125%, due 06/01/29 | 100,000 | 114,078 | |||||||||
3.450%, due 03/15/22 | $ | 160,000 | 164,913 | ||||||||
4.750%, due 03/15/45 | 52,000 | 56,210 | |||||||||
| Glencore Finance Europe SA, 1.875%, due 09/13/231 | EUR | 100,000 | 115,577 | ||||||||
Total Luxembourg corporate bonds | 683,389 | ||||||||||
Mexico: 0.47% | |||||||||||
| America Movil SAB de CV, Series A, 5.000%, due 03/30/20 | $ | 185,000 | 198,824 | ||||||||
5.125%, due 09/06/731,3 | EUR | 145,000 | 174,141 | ||||||||
| Petroleos Mexicanos, 3.750%, due 02/21/241 | 180,000 | 212,525 | |||||||||
5.500%, due 02/24/251 | 130,000 | 169,638 | |||||||||
Total Mexico corporate bonds | 755,128 | ||||||||||
Netherlands: 3.83% | |||||||||||
| ABN AMRO Bank NV, 4.875%, due 01/16/191 | GBP | 150,000 | 207,256 | ||||||||
| Achmea BV, 2.500%, due 11/19/201 | EUR | 380,000 | 463,584 | ||||||||
4.250%, due 02/04/251,3,5 | 105,000 | 115,734 | |||||||||
| Bharti Airtel International Netherlands BV, 4.000%, due 12/10/181 | 255,000 | 306,706 | |||||||||
| Coca-Cola HBC Finance BV, 2.375%, due 06/18/201 | 245,000 | 295,889 | |||||||||
| Cooperatieve Rabobank UA, 1.700%, due 03/19/18 | $ | 330,000 | 330,432 | ||||||||
2.500%, due 05/26/261,3 | EUR | 265,000 | 317,453 | ||||||||
5.500%, due 06/29/201,3,5 | 250,000 | 302,298 | |||||||||
| Demeter Investments BV for Swiss Life AG, 4.375%, due 06/16/251,3,5 | 215,000 | 267,602 | |||||||||
| Deutsche Telekom International Finance BV, 0.625%, due 04/03/231 | 70,000 | 79,612 | |||||||||
6.500%, due 04/08/22 | GBP | 70,000 | 112,233 | ||||||||
| EDP Finance BV, 2.000%, due 04/22/251 | EUR | 155,000 | 179,917 | ||||||||
| ELM BV for Swiss Reinsurance Co. Ltd., 2.600%, due 09/01/251,3,5 | 130,000 | 150,709 | |||||||||
| Heineken NV, 2.125%, due 08/04/201 | 100,000 | 120,858 | |||||||||
| Face amount | Value | ||||||||||
| ING Bank NV, 4.125%, due 11/21/231,3 | $ | 210,000 | $ | 214,570 | |||||||
| ING Groep NV, 3.150%, due 03/29/22 | 200,000 | 203,787 | |||||||||
| Mylan NV, 3.125%, due 11/22/281 | EUR | 180,000 | 218,294 | ||||||||
| NN Group NV, 0.875%, due 01/13/231 | 170,000 | 193,473 | |||||||||
| Nomura Europe Finance NV, 1.500%, due 05/12/211 | 180,000 | 212,795 | |||||||||
| Redexis Gas Finance BV, 1.875%, due 04/27/271 | 210,000 | 237,717 | |||||||||
2.750%, due 04/08/211 | 175,000 | 216,323 | |||||||||
| Ren Finance BV, 2.500%, due 02/12/251 | 180,000 | 215,020 | |||||||||
| Shell International Finance BV, 1.250%, due 11/10/17 | $ | 245,000 | 245,094 | ||||||||
4.375%, due 05/11/45 | 305,000 | 319,653 | |||||||||
| Teva Pharmaceutical Finance Netherlands II BV, 1.125%, due 10/15/241 | EUR | 220,000 | 240,657 | ||||||||
| Teva Pharmaceutical Finance Netherlands III BV, 2.800%, due 07/21/23 | $ | 215,000 | 209,356 | ||||||||
| Vonovia Finance BV, 4.000%, due 12/17/211,3,5 | EUR | 100,000 | 122,858 | ||||||||
Total Netherlands corporate bonds | 6,099,880 | ||||||||||
New Zealand: 0.12% | |||||||||||
| Westpac Securities NZ Ltd., 0.250%, due 04/06/221 | 170,000 | 193,339 | |||||||||
Norway: 0.20% | |||||||||||
| Statoil ASA, 3.125%, due 08/17/17 | $ | 175,000 | 175,328 | ||||||||
4.800%, due 11/08/43 | 130,000 | 145,632 | |||||||||
Total Norway corporate bonds | 320,960 | ||||||||||
Portugal: 0.14% | |||||||||||
| Caixa Geral de Depositos SA, 3.750%, due 01/18/181 | EUR | 100,000 | 116,584 | ||||||||
| Galp Gas Natural Distribuicao SA, 1.375%, due 09/19/231 | 100,000 | 113,520 | |||||||||
Total Portugal corporate bonds | 230,104 | ||||||||||
Singapore: 0.16% | |||||||||||
| United Overseas Bank Ltd., 3.750%, due 09/19/241,3 | $ | 250,000 | 254,932 | ||||||||
Spain: 0.62% | |||||||||||
| Aigues de Barcelona Finance SAU, 1.944%, due 09/15/211 | EUR | 175,000 | 210,457 | ||||||||
| Canal de Isabel II Gestion SA, 1.680%, due 02/26/251 | 100,000 | 115,560 | |||||||||
| Santander Issuances SAU, 3.250%, due 04/04/261 | 100,000 | 121,758 | |||||||||
13
UBS Dynamic Alpha Fund
Portfolio of investments
June 30, 2017
| Face amount | Value | ||||||||||
Bonds—(Continued) | |||||||||||
Corporate bonds—(Continued) | |||||||||||
Spain—(Concluded) | |||||||||||
| Telefonica Emisiones SAU, 4.710%, due 01/20/201 | EUR | 300,000 | $ | 382,474 | |||||||
5.213%, due 03/08/47 | $ | 150,000 | 162,203 | ||||||||
Total Spain corporate bonds | 992,452 | ||||||||||
Sweden: 0.38% | |||||||||||
| Nordea Bank AB, 1.875%, due 11/10/251,3 | EUR | 140,000 | 165,680 | ||||||||
2.125%, due 05/29/202 | $ | 200,000 | 200,249 | ||||||||
| PGE Sweden AB, 1.625%, due 06/09/191 | EUR | 100,000 | 117,294 | ||||||||
| Svenska Handelsbanken AB, 5.125%, due 03/30/201 | $ | 115,000 | 124,138 | ||||||||
Total Sweden corporate bonds | 607,361 | ||||||||||
Switzerland: 0.16% | |||||||||||
| Credit Suisse Group AG, 4.282%, due 01/09/282 | 250,000 | 258,447 | |||||||||
United Kingdom: 5.71% | |||||||||||
| Anglian Water Services Financing plc, 4.500%, due 02/22/261 | GBP | 100,000 | 149,698 | ||||||||
| Aon plc, 2.875%, due 05/14/26 | EUR | 155,000 | 193,570 | ||||||||
| Arqiva Financing plc, 4.040%, due 06/30/201 | GBP | 100,000 | 138,273 | ||||||||
4.882%, due 12/31/321 | 130,000 | 192,190 | |||||||||
| Aviva plc, 0.100%, due 12/13/181 | EUR | 120,000 | 136,992 | ||||||||
5.125%, due 06/04/501,3 | GBP | 180,000 | 255,853 | ||||||||
| Barclays Bank plc, 6.625%, due 03/30/221 | EUR | 110,000 | 155,620 | ||||||||
| Barclays plc, 1.875%, due 12/08/231 | 120,000 | 142,026 | |||||||||
3.684%, due 01/10/23 | $ | 235,000 | 241,098 | ||||||||
4.375%, due 09/11/24 | 350,000 | 354,232 | |||||||||
| BAT International Finance plc, 0.875%, due 10/13/231 | EUR | 120,000 | 134,812 | ||||||||
2.375%, due 01/19/231 | 100,000 | 122,993 | |||||||||
| BP Capital Markets plc, 1.375%, due 05/10/18 | $ | 115,000 | 114,764 | ||||||||
2.750%, due 05/10/23 | 80,000 | 79,653 | |||||||||
| British Telecommunications plc, 0.625%, due 03/10/211 | EUR | 100,000 | 114,604 | ||||||||
| BUPA Finance plc, 3.375%, due 06/17/211 | GBP | 110,000 | 153,521 | ||||||||
6.125%, due 09/16/203,5 | 85,000 | 123,025 | |||||||||
| Cadent Finance plc, 2.750%, due 09/22/461 | 100,000 | 124,629 | |||||||||
| Coca-Cola European Partners plc, 1.125%, due 05/26/241 | EUR | 140,000 | 161,554 | ||||||||
| Diageo Capital plc, 3.875%, due 04/29/43 | $ | 115,000 | 115,327 | ||||||||
| Face amount | Value | ||||||||||
| EE Finance plc, 4.375%, due 03/28/191 | GBP | 145,000 | $ | 199,086 | |||||||
| HSBC Holdings plc, 5.100%, due 04/05/21 | $ | 305,000 | 331,568 | ||||||||
| Imperial Brands Finance plc, 1.375%, due 01/27/251 | EUR | 100,000 | 113,564 | ||||||||
2.950%, due 07/21/202 | $ | 305,000 | 310,128 | ||||||||
9.000%, due 02/17/221 | GBP | 75,000 | 129,041 | ||||||||
| Lloyds Banking Group plc, 1.000%, due 11/09/231 | EUR | 300,000 | 342,179 | ||||||||
| National Grid Electricity Transmission plc, 4.000%, due 06/08/271 | GBP | 130,000 | 198,156 | ||||||||
| Northern Gas Networks Finance plc, 5.875%, due 07/08/19 | 75,000 | 107,171 | |||||||||
| Northumbrian Water Finance plc, 1.625%, due 10/11/261 | 100,000 | 125,187 | |||||||||
| Prudential plc, 1.375%, due 01/19/181 | 170,000 | 222,045 | |||||||||
5.000%, due 07/20/551,3 | 100,000 | 137,062 | |||||||||
| Reckitt Benckiser Treasury Services plc, 2.375%, due 06/24/222 | $ | 380,000 | 377,475 | ||||||||
| Royal Bank of Scotland Group plc, 3.498%, due 05/15/233 | 200,000 | 201,185 | |||||||||
3.875%, due 09/12/23 | 200,000 | 203,960 | |||||||||
| Royal Bank of Scotland plc (The), 6.934%, due 04/09/18 | EUR | 290,000 | 347,996 | ||||||||
| Santander UK Group Holdings plc, 3.571%, due 01/10/23 | $ | 200,000 | 204,530 | ||||||||
| Santander UK plc, 4.000%, due 03/13/24 | 165,000 | 174,293 | |||||||||
| Scottish Widows Ltd., 5.500%, due 06/16/231 | GBP | 100,000 | 145,832 | ||||||||
| Sky plc, 2.500%, due 09/15/261 | EUR | 150,000 | 183,869 | ||||||||
| Southern Gas Networks plc, 2.500%, due 02/03/251 | GBP | 115,000 | 155,906 | ||||||||
| SSE plc, 3.875%, due 09/10/201,3,5 | 100,000 | 133,570 | |||||||||
| Standard Chartered plc, 4.000%, due 07/12/221,3 | $ | 350,000 | 350,140 | ||||||||
| State Grid Europe Development 2014 plc, Series A, 1.500%, due 01/26/221 | EUR | 125,000 | 145,981 | ||||||||
| Tesco Property Finance 4 plc, 5.801%, due 10/13/401 | GBP | 137,618 | 198,208 | ||||||||
| Thames Water Utilities Finance Ltd., 5.125%, due 09/28/37 | 100,000 | 177,116 | |||||||||
| Vodafone Group plc, 4.375%, due 02/19/43 | $ | 55,000 | 54,386 | ||||||||
| Wales & West Utilities Finance plc, 6.750%, due 12/17/363 | GBP | 50,000 | 69,714 | ||||||||
| Western Power Distribution West Midlands plc, 5.750%, due 04/16/321 | 100,000 | 178,901 | |||||||||
| WPP Finance 2010, 3.750%, due 09/19/24 | $ | 130,000 | 133,188 | ||||||||
14
UBS Dynamic Alpha Fund
Portfolio of investments
June 30, 2017
| Face amount | Value | ||||||||||
Bonds—(Continued) | |||||||||||
Corporate bonds—(Continued) | |||||||||||
United Kingdom—(Concluded) | |||||||||||
| WPP Finance 2013, 0.430%, due 03/23/181 | EUR | 210,000 | $ | 240,323 | |||||||
Total United Kingdom corporate bonds | 9,096,194 | ||||||||||
United States: 21.54% | |||||||||||
| 21st Century Fox America, Inc., 6.200%, due 12/15/34 | $ | 275,000 | 338,924 | ||||||||
| ABB Finance USA, Inc., 2.875%, due 05/08/22 | 160,000 | 163,619 | |||||||||
| Abbott Laboratories, 3.750%, due 11/30/26 | 165,000 | 168,451 | |||||||||
4.900%, due 11/30/46 | 190,000 | 209,990 | |||||||||
| AbbVie, Inc., 1.375%, due 05/17/24 | EUR | 405,000 | 466,611 | ||||||||
2.900%, due 11/06/22 | $ | 145,000 | 146,346 | ||||||||
4.400%, due 11/06/42 | 105,000 | 107,710 | |||||||||
| Aetna, Inc., 3.500%, due 11/15/24 | 175,000 | 180,537 | |||||||||
| Albemarle Corp., 1.875%, due 12/08/211 | EUR | 109,000 | 129,752 | ||||||||
| Alphabet, Inc., 1.998%, due 08/15/26 | $ | 395,000 | 369,615 | ||||||||
| Altria Group, Inc., 4.250%, due 08/09/42 | 410,000 | 424,346 | |||||||||
| American International Group, Inc., 3.375%, due 08/15/20 | 225,000 | 232,810 | |||||||||
| Amgen, Inc., 4.400%, due 05/01/45 | 95,000 | 97,717 | |||||||||
| Anadarko Petroleum Corp., 3.450%, due 07/15/24 | 70,000 | 68,383 | |||||||||
4.850%, due 03/15/21 | 50,000 | 53,363 | |||||||||
| Anheuser-Busch InBev Worldwide, Inc., 3.750%, due 01/15/22 | 390,000 | 411,255 | |||||||||
| Apache Corp., 4.250%, due 01/15/44 | 255,000 | 239,176 | |||||||||
| Apple, Inc., 1.300%, due 02/23/18 | 85,000 | 84,970 | |||||||||
3.850%, due 08/04/46 | 290,000 | 290,245 | |||||||||
| AT&T, Inc., 2.350%, due 09/04/29 | EUR | 240,000 | 271,046 | ||||||||
3.000%, due 02/15/22 | $ | 160,000 | 160,695 | ||||||||
4.750%, due 05/15/46 | 325,000 | 319,133 | |||||||||
5.000%, due 03/01/21 | 340,000 | 367,800 | |||||||||
5.550%, due 08/15/41 | 180,000 | 195,824 | |||||||||
| Baltimore Gas & Electric Co., 3.500%, due 08/15/46 | 115,000 | 109,815 | |||||||||
| Bank of America Corp., 3.875%, due 08/01/25 | 650,000 | 672,494 | |||||||||
5.875%, due 02/07/42 | 135,000 | 169,390 | |||||||||
| Berkshire Hathaway Finance Corp., 1.300%, due 05/15/18 | 110,000 | 109,882 | |||||||||
| Face amount | Value | ||||||||||
| Berkshire Hathaway, Inc., 1.300%, due 03/15/24 | EUR | 100,000 | $ | 116,757 | |||||||
3.125%, due 03/15/26 | $ | 135,000 | 136,532 | ||||||||
| Burlington Northern Santa Fe LLC, 3.000%, due 03/15/23 | 190,000 | 194,817 | |||||||||
5.400%, due 06/01/41 | 130,000 | 158,549 | |||||||||
| Capital One Financial Corp., 2.500%, due 05/12/20 | 90,000 | 90,383 | |||||||||
3.200%, due 02/05/25 | 280,000 | 274,106 | |||||||||
| Celgene Corp., 3.875%, due 08/15/25 | 120,000 | 125,333 | |||||||||
| CF Industries, Inc., 3.400%, due 12/01/212 | 115,000 | 116,257 | |||||||||
5.150%, due 03/15/34 | 165,000 | 152,625 | |||||||||
| Charter Communications Operating LLC, 4.464%, due 07/23/22 | 180,000 | 191,763 | |||||||||
5.375%, due 05/01/472 | 75,000 | 79,451 | |||||||||
| Cimarex Energy Co., 3.900%, due 05/15/27 | 80,000 | 80,446 | |||||||||
| Cisco Systems, Inc., 1.400%, due 02/28/18 | 75,000 | 75,012 | |||||||||
| Citigroup, Inc., 3.875%, due 10/25/23 | 745,000 | 777,364 | |||||||||
4.600%, due 03/09/26 | 105,000 | 110,191 | |||||||||
| Coca-Cola Co. (The), 1.875%, due 09/22/26 | EUR | 105,000 | 127,576 | ||||||||
| Comcast Corp., 4.750%, due 03/01/44 | $ | 65,000 | 72,431 | ||||||||
| ConocoPhillips Co., 2.200%, due 05/15/20 | 235,000 | 235,752 | |||||||||
4.200%, due 03/15/21 | 120,000 | 127,219 | |||||||||
| Consumers Energy Co., 3.250%, due 08/15/46 | 65,000 | 59,682 | |||||||||
| CVS Health Corp., 5.125%, due 07/20/45 | 230,000 | 264,033 | |||||||||
| Daimler Finance North America LLC, 2.450%, due 05/18/202 | 150,000 | 150,881 | |||||||||
| Diamond 1 Finance Corp., 3.480%, due 06/01/192 | 235,000 | 240,503 | |||||||||
8.350%, due 07/15/462 | 265,000 | 342,386 | |||||||||
| Dominion Energy, Inc., Series D, 2.850%, due 08/15/26 | 80,000 | 76,266 | |||||||||
| DTE Energy Co., 6.375%, due 04/15/33 | 165,000 | 207,972 | |||||||||
| Duke Energy Carolinas LLC, 4.000%, due 09/30/42 | 170,000 | 175,638 | |||||||||
| Eaton Corp., 4.150%, due 11/02/42 | 120,000 | 122,912 | |||||||||
| Ecolab, Inc., 5.500%, due 12/08/41 | 200,000 | 245,299 | |||||||||
| EI du Pont de Nemours & Co., 2.200%, due 05/01/20 | 65,000 | 65,348 | |||||||||
| Eli Lilly & Co., 2.350%, due 05/15/22 | 80,000 | 80,209 | |||||||||
3.100%, due 05/15/27 | 85,000 | 85,833 | |||||||||
15
UBS Dynamic Alpha Fund
Portfolio of investments
June 30, 2017
| Face amount | Value | ||||||||||
Bonds—(Continued) | |||||||||||
Corporate bonds—(Continued) | |||||||||||
United States—(Continued) | |||||||||||
| Enable Midstream Partners LP, 3.900%, due 05/15/24 | $ | 140,000 | $ | 138,847 | |||||||
| Energy Transfer LP, 6.050%, due 06/01/41 | 240,000 | 255,585 | |||||||||
| Enterprise Products Operating LLC, 4.850%, due 03/15/44 | 130,000 | 137,990 | |||||||||
| ERAC USA Finance LLC, 5.625%, due 03/15/422 | 105,000 | 119,391 | |||||||||
| ERP Operating LP, 3.375%, due 06/01/25 | 165,000 | 166,038 | |||||||||
| Exelon Corp., 3.400%, due 04/15/26 | 135,000 | 134,558 | |||||||||
| Express Scripts Holding Co., 2.250%, due 06/15/19 | 160,000 | 160,536 | |||||||||
| Exxon Mobil Corp., 3.567%, due 03/06/45 | 65,000 | 62,620 | |||||||||
4.114%, due 03/01/46 | 70,000 | 73,953 | |||||||||
| FedEx Corp., 1.625%, due 01/11/27 | EUR | 150,000 | 170,885 | ||||||||
4.550%, due 04/01/46 | $ | 40,000 | 42,313 | ||||||||
| Fifth Third Bancorp, 2.600%, due 06/15/22 | 290,000 | 288,475 | |||||||||
| Five Corners Funding Trust, 4.419%, due 11/15/232 | 375,000 | 402,651 | |||||||||
| Freeport-McMoRan, Inc., 3.550%, due 03/01/22 | 285,000 | 267,096 | |||||||||
3.875%, due 03/15/234 | 150,000 | 139,500 | |||||||||
| General Electric Co., 2.125%, due 05/17/37 | EUR | 200,000 | 223,586 | ||||||||
4.125%, due 10/09/42 | $ | 95,000 | 100,118 | ||||||||
4.375%, due 09/16/20 | 70,000 | 75,130 | |||||||||
6.750%, due 03/15/32 | 122,000 | 167,244 | |||||||||
| General Motors Financial Co., Inc., 3.200%, due 07/06/21 | 180,000 | 182,006 | |||||||||
| Georgia Power Co., 5.400%, due 06/01/40 | 125,000 | 146,195 | |||||||||
| Gilead Sciences, Inc., 2.050%, due 04/01/19 | 85,000 | 85,272 | |||||||||
4.750%, due 03/01/46 | 75,000 | 82,240 | |||||||||
4.800%, due 04/01/44 | 125,000 | 136,397 | |||||||||
| Glencore Funding LLC, 2.500%, due 01/15/192 | 9,000 | 9,027 | |||||||||
| Goldman Sachs Group, Inc. (The), 2.000%, due 07/27/231 | EUR | 630,000 | 755,806 | ||||||||
5.150%, due 05/22/45 | $ | 155,000 | 172,447 | ||||||||
| Hartford Financial Services Group, Inc. (The), 4.300%, due 04/15/43 | 115,000 | 117,101 | |||||||||
| HCP, Inc., 3.875%, due 08/15/24 | 160,000 | 163,130 | |||||||||
| Home Depot, Inc. (The), 4.875%, due 02/15/44 | 95,000 | 110,347 | |||||||||
| Honeywell International, Inc., 1.850%, due 11/01/21 | 160,000 | 157,421 | |||||||||
| Face amount | Value | ||||||||||
| Illinois Tool Works, Inc., 2.650%, due 11/15/26 | $ | 210,000 | $ | 205,100 | |||||||
| JPMorgan Chase & Co., 3.200%, due 01/25/23 | 1,300,000 | 1,325,271 | |||||||||
3.625%, due 12/01/27 | 295,000 | 292,013 | |||||||||
| Juniper Networks, Inc., 4.500%, due 03/15/24 | 155,000 | 164,652 | |||||||||
| Kinder Morgan Energy Partners LP, 5.000%, due 10/01/21 | 105,000 | 112,761 | |||||||||
5.000%, due 03/01/43 | 260,000 | 251,136 | |||||||||
| Kinder Morgan, Inc., 5.625%, due 11/15/232 | 60,000 | 66,378 | |||||||||
| Kraft Heinz Foods Co., 2.250%, due 05/25/281 | EUR | 250,000 | 285,644 | ||||||||
4.875%, due 02/15/252 | $ | 133,000 | 142,553 | ||||||||
5.000%, due 06/04/42 | 175,000 | 184,981 | |||||||||
| Kroger Co. (The), 3.875%, due 10/15/46 | 50,000 | 44,119 | |||||||||
| Liberty Mutual Group, Inc., 2.750%, due 05/04/261 | EUR | 140,000 | 170,699 | ||||||||
4.250%, due 06/15/232 | $ | 215,000 | 228,705 | ||||||||
| Lowe's Cos., Inc., 4.250%, due 09/15/44 | 155,000 | 162,399 | |||||||||
| Marathon Oil Corp., 3.850%, due 06/01/25 | 145,000 | 141,549 | |||||||||
| McDonald's Corp., 2.750%, due 12/09/20 | 105,000 | 106,895 | |||||||||
| Medtronic, Inc., 3.150%, due 03/15/22 | 160,000 | 165,556 | |||||||||
4.625%, due 03/15/45 | 55,000 | 61,988 | |||||||||
| Merck & Co., Inc., 1.875%, due 10/15/26 | EUR | 125,000 | 152,654 | ||||||||
3.700%, due 02/10/45 | $ | 65,000 | 64,920 | ||||||||
| Metropolitan Life Global Funding I, 1.250%, due 09/17/211 | EUR | 300,000 | 353,891 | ||||||||
| Microsoft Corp., 2.400%, due 08/08/26 | $ | 130,000 | 125,122 | ||||||||
3.500%, due 11/15/42 | 140,000 | 138,026 | |||||||||
3.700%, due 08/08/46 | 195,000 | 193,261 | |||||||||
| Molson Coors Brewing Co., 3.000%, due 07/15/26 | 60,000 | 57,717 | |||||||||
| Monongahela Power Co., 5.400%, due 12/15/432 | 105,000 | 127,689 | |||||||||
| Morgan Stanley, 2.500%, due 04/21/21 | 705,000 | 704,393 | |||||||||
2.625%, due 03/09/27 | GBP | 195,000 | 253,783 | ||||||||
4.350%, due 09/08/26 | $ | 150,000 | 155,961 | ||||||||
6.375%, due 07/24/42 | 85,000 | 113,132 | |||||||||
| MPLX LP, 5.200%, due 03/01/47 | 120,000 | 123,070 | |||||||||
| NBCUniversal Media LLC, 4.375%, due 04/01/21 | 435,000 | 468,839 | |||||||||
| Occidental Petroleum Corp., 4.625%, due 06/15/45 | 60,000 | 63,693 | |||||||||
16
UBS Dynamic Alpha Fund
Portfolio of investments
June 30, 2017
| Face amount | Value | ||||||||||
Bonds—(Continued) | |||||||||||
Corporate bonds—(Concluded) | |||||||||||
United States—(Concluded) | |||||||||||
| Oncor Electric Delivery Co. LLC, 7.000%, due 05/01/32 | $ | 141,000 | $ | 194,198 | |||||||
7.250%, due 01/15/33 | 110,000 | 153,687 | |||||||||
| ONEOK, Inc., 7.500%, due 09/01/23 | 200,000 | 238,500 | |||||||||
| Oracle Corp., 2.400%, due 09/15/23 | 290,000 | 286,196 | |||||||||
| Pacific Gas & Electric Co., 6.050%, due 03/01/34 | 285,000 | 368,127 | |||||||||
| PacifiCorp, 6.000%, due 01/15/39 | 180,000 | 234,004 | |||||||||
| PepsiCo, Inc., 1.350%, due 10/04/19 | 100,000 | 99,122 | |||||||||
| Pfizer, Inc., 0.250%, due 03/06/22 | EUR | 225,000 | 254,757 | ||||||||
5.200%, due 08/12/20 | $ | 100,000 | 109,700 | ||||||||
| Philip Morris International, Inc., 4.250%, due 11/10/44 | 175,000 | 180,402 | |||||||||
| Phillips 66, 4.650%, due 11/15/34 | 105,000 | 110,634 | |||||||||
| Phillips 66 Partners LP, 4.680%, due 02/15/45 | 85,000 | 81,528 | |||||||||
| Plains All American Pipeline LP, 3.650%, due 06/01/22 | 45,000 | 45,902 | |||||||||
| PNC Bank NA, 2.700%, due 11/01/22 | 250,000 | 250,036 | |||||||||
| PPL Capital Funding, Inc., 4.700%, due 06/01/43 | 200,000 | 211,133 | |||||||||
| Procter & Gamble Co. (The), 2.450%, due 11/03/26 | 120,000 | 117,280 | |||||||||
| QUALCOMM, Inc., 1.850%, due 05/20/19 | 285,000 | 285,661 | |||||||||
3.250%, due 05/20/27 | 190,000 | 190,455 | |||||||||
4.300%, due 05/20/47 | 100,000 | 102,088 | |||||||||
| Reynolds American, Inc., 4.450%, due 06/12/25 | 90,000 | 96,618 | |||||||||
5.700%, due 08/15/35 | 55,000 | 65,242 | |||||||||
| Roche Holdings, Inc., 2.625%, due 05/15/261 | 200,000 | 194,681 | |||||||||
| Schlumberger Holdings Corp., 3.000%, due 12/21/202 | 170,000 | 173,078 | |||||||||
| Sempra Energy, 6.000%, due 10/15/39 | 155,000 | 196,425 | |||||||||
| Southern Co. (The), 3.250%, due 07/01/26 | 180,000 | 176,105 | |||||||||
4.400%, due 07/01/46 | 170,000 | 173,337 | |||||||||
| Southwestern Electric Power Co., 6.200%, due 03/15/40 | 215,000 | 276,553 | |||||||||
| SunTrust Banks, Inc., 2.350%, due 11/01/18 | 185,000 | 186,109 | |||||||||
2.700%, due 01/27/22 | 280,000 | 280,555 | |||||||||
| Face amount | Value | ||||||||||
| Swiss Re Treasury US Corp., 4.250%, due 12/06/422 | $ | 100,000 | $ | 102,962 | |||||||
| Teachers Insurance & Annuity Association of America, 4.900%, due 09/15/442 | 105,000 | 117,687 | |||||||||
| Thermo Fisher Scientific, Inc., 2.400%, due 02/01/19 | 130,000 | 130,968 | |||||||||
| Time Warner Cable LLC, 4.500%, due 09/15/42 | 130,000 | 123,854 | |||||||||
5.000%, due 02/01/20 | 405,000 | 432,024 | |||||||||
| Unilever Capital Corp., 1.375%, due 07/28/21 | 100,000 | 96,516 | |||||||||
| Union Pacific Corp., 4.050%, due 11/15/45 | 80,000 | 82,888 | |||||||||
| UnitedHealth Group, Inc., 2.700%, due 07/15/20 | 290,000 | 296,429 | |||||||||
| Valero Energy Corp., 4.900%, due 03/15/45 | 165,000 | 172,128 | |||||||||
| Verizon Communications, Inc., 2.946%, due 03/15/222 | 404,000 | 406,763 | |||||||||
3.000%, due 11/01/21 | 105,000 | 106,380 | |||||||||
4.500%, due 09/15/20 | 135,000 | 144,201 | |||||||||
5.250%, due 03/16/37 | 75,000 | 80,713 | |||||||||
5.500%, due 03/16/47 | 365,000 | 399,540 | |||||||||
| Virginia Electric & Power Co., Series C, 4.000%, due 11/15/46 | 120,000 | 123,918 | |||||||||
| Wachovia Corp., 5.750%, due 02/01/18 | 445,000 | 455,429 | |||||||||
| Walgreens Boots Alliance, Inc., 3.800%, due 11/18/24 | 150,000 | 155,803 | |||||||||
| Walt Disney Co. (The), 1.850%, due 07/30/26 | 40,000 | 36,413 | |||||||||
| Wells Fargo & Co., 2.100%, due 07/26/21 | 255,000 | 251,596 | |||||||||
3.069%, due 01/24/23 | 280,000 | 283,721 | |||||||||
| Williams Partners LP, 4.300%, due 03/04/24 | 195,000 | 202,849 | |||||||||
4.875%, due 05/15/23 | 18,000 | 18,677 | |||||||||
4.900%, due 01/15/45 | 80,000 | 80,211 | |||||||||
| Xcel Energy, Inc., 4.800%, due 09/15/41 | 225,000 | 240,564 | |||||||||
| Zimmer Biomet Holdings, Inc., 3.550%, due 04/01/25 | 80,000 | 80,814 | |||||||||
Total United States corporate bonds | 34,327,041 | ||||||||||
Virgin Islands, British: 0.28% | |||||||||||
| CNPC General Capital Ltd., 3.400%, due 04/16/232,4 | 250,000 | 254,458 | |||||||||
| Sinopec Capital 2013 Ltd., 3.125%, due 04/24/231 | 200,000 | 198,992 | |||||||||
Total Virgin Islands, British corporate bonds | 453,450 | ||||||||||
| Total corporate bonds (cost $72,212,200) | 72,647,612 | ||||||||||
17
UBS Dynamic Alpha Fund
Portfolio of investments
June 30, 2017
| Face amount | Value | ||||||||||
Bonds—(Concluded) | |||||||||||
Asset-backed security: 0.04% | |||||||||||
United States: 0.04% | |||||||||||
| American Airlines Pass-Through Trust, Series 2014-1, Class B, 4.375%, due 10/01/22 (cost $69,769) | $ | 70,120 | $ | 71,610 | |||||||
Collateralized debt obligation: 0.00%6 | |||||||||||
Cayman Islands: 0.00%6 | |||||||||||
| LNR CDO Ltd., Series 2006-1A, Class FFX, 7.592%, due 05/28/437 (cost $8,097,844) | 8,000,000 | 0 | |||||||||
Collateralized mortgage obligation: 0.00%6 | |||||||||||
United States: 0.00%6 | |||||||||||
| Structured Adjustable Rate Mortgage Loan Trust, Series 2005-7, Class B11, 3.494%, due 04/25/353 (cost $25,575) | 208,515 | 6,003 | |||||||||
Non-U.S. government obligation: 0.12% | |||||||||||
Germany: 0.12% | |||||||||||
| FMS Wertmanagement AoeR, 1.000%, due 08/16/19 (cost $199,354) | 200,000 | 197,397 | |||||||||
U.S. treasury obligations: 27.59% | |||||||||||
| U.S. Treasury Notes, 0.750%, due 10/31/17 | 21,000,000 | 20,976,060 | |||||||||
1.000%, due 09/15/17 | 23,000,000 | 22,996,619 | |||||||||
| Total U.S. treasury obligations (cost $43,987,888) | 43,972,679 | ||||||||||
| Total bonds (cost $124,592,630) | 116,895,301 | ||||||||||
Shares | Value | ||||||||||
Exchange traded fund: 4.69% | |||||||||||
| iShares Edge MSCI Minimum Volatility Emerging Markets Fund4 (cost $7,170,054) | 135,000 | $ | 7,479,000 | ||||||||
Short-term investments: 14.25% | |||||||||||
Investment company: 4.84% | |||||||||||
| JPMorgan U.S. Government Money Market Fund, Capital Shares (cost $7,718,224) | 7,718,224 | 7,718,224 | |||||||||
| Face amount | |||||||||||
U.S. treasury obligation: 9.41% | |||||||||||
| U.S. Treasury Bill 0.750%, due 07/20/178 (cost 14,994,062) | $ | 15,000,000 | 14,993,660 | ||||||||
| Total short-term investments (cost $22,712,286) | 22,711,884 | ||||||||||
Shares | |||||||||||
Investment of cash collateral from securities loaned: 5.09% | |||||||||||
| JPMorgan U.S. Government Money Market Fund, Capital Shares (cost $8,106,675) | 8,106,675 | 8,106,675 | |||||||||
| Total investments: 97.36% (cost $162,581,645) | 155,192,860 | ||||||||||
Cash and other assets, less liabilities: 2.64% | 4,205,504 | ||||||||||
Net assets: 100.00% | $ | 159,398,364 | |||||||||
Notes to portfolio of investments
Aggregate cost for federal income tax purposes was $166,989,962; and net unrealized depreciation consisted of:
Gross unrealized appreciation | $ | 1,264,385 | |||||
Gross unrealized depreciation | (13,061,487 | ) | |||||
Net unrealized depreciation of investments | $ | (11,797,102 | ) | ||||
For a listing of defined portfolio acronyms, counterparty abbreviations and currency abbreviations that are used throughout the Portfolio of investments as well as the tables that follow, please refer to page 85. Portfolio footnotes begin on page 22.
18
UBS Dynamic Alpha Fund
Portfolio of investments
June 30, 2017
Forward foreign currency contracts
Counterparty | Contracts to deliver | In exchange for | Maturity date | Unrealized appreciation/ (depreciation) | |||||||||||||||
BB | CAD | 19,180,000 | USD | 14,531,172 | 09/27/17 | $ | (278,976 | ) | |||||||||||
CITI | SGD | 14,465,000 | USD | 10,448,555 | 09/27/17 | (72,180 | ) | ||||||||||||
GSI | CHF | 8,295,000 | USD | 8,594,374 | 09/27/17 | (103,846 | ) | ||||||||||||
GSI | CNY | 11,615,000 | USD | 1,689,332 | 09/27/17 | (14,816 | ) | ||||||||||||
GSI | EUR | 29,970,000 | USD | 33,655,363 | 09/27/17 | (729,877 | ) | ||||||||||||
GSI | TWD | 27,200,000 | USD | 896,211 | 09/27/17 | (754 | ) | ||||||||||||
GSI | USD | 7,633,075 | AUD | 10,100,000 | 09/27/17 | 121,401 | |||||||||||||
GSI | USD | 10,065,094 | MYR | 43,295,000 | 09/27/17 | (15,300 | ) | ||||||||||||
JPMCB | USD | 3,392,242 | COP | 10,365,842,232 | 09/27/17 | (28,598 | ) | ||||||||||||
JPMCB | USD | 12,721,112 | INR | 827,890,000 | 09/27/17 | (53,498 | ) | ||||||||||||
JPMCB | USD | 12,411,086 | JPY | 1,374,500,000 | 09/27/17 | (144,530 | ) | ||||||||||||
MSC | GBP | 5,350,000 | USD | 6,830,772 | 09/27/17 | (155,761 | ) | ||||||||||||
MSC | KRW | 17,665,000,000 | USD | 15,550,450 | 09/27/17 | 91,172 | |||||||||||||
MSC | NZD | 16,075,000 | USD | 11,683,053 | 09/27/17 | (78,188 | ) | ||||||||||||
Net unrealized depreciation on forward foreign currency contracts | $ | (1,463,751 | ) | ||||||||||||||||
Futures contracts
| Expiration date | Cost/ (proceeds) | Value | Unrealized appreciation/ (depreciation) | ||||||||||||||||
US Treasury futures buy contracts: | |||||||||||||||||||
5 Year US Treasury Notes, 29 contracts (USD) | September 2017 | $ | 3,425,666 | $ | 3,417,242 | $ | (8,424 | ) | |||||||||||
US Treasury futures sell contracts: | |||||||||||||||||||
US Ultra Bond, 41 contracts (USD) | September 2017 | (6,671,683 | ) | (6,800,875 | ) | (129,192 | ) | ||||||||||||
10 Year US Treasury Notes, 121 contracts (USD) | September 2017 | (15,386,548 | ) | (15,189,281 | ) | 197,267 | |||||||||||||
Index futures buy contracts: | |||||||||||||||||||
CAC 40 Index, 33 contracts (EUR) | July 2017 | 1,973,543 | 1,928,457 | (45,086 | ) | ||||||||||||||
DAX Index, 7 contracts (EUR) | September 2017 | 2,535,559 | 2,462,476 | (73,083 | ) | ||||||||||||||
EURO STOXX Bank Index, 679 contracts (EUR) | September 2017 | 5,084,680 | 5,060,267 | (24,413 | ) | ||||||||||||||
FTSE 100 Index, 35 contracts (GBP) | September 2017 | 3,395,375 | 3,301,547 | (93,828 | ) | ||||||||||||||
Hong Kong Hang Seng China Enterprise Index, 73 contracts (HKD) | July 2017 | 4,786,671 | 4,766,185 | (20,486 | ) | ||||||||||||||
Mini MSCI Emerging Markets Index, 148 contracts (USD) | September 2017 | 7,416,178 | 7,461,420 | 45,242 | |||||||||||||||
Russell 1000 Value Index, 234 contracts (USD) | September 2017 | 13,353,772 | 13,314,601 | (39,171 | ) | ||||||||||||||
SPI 200 Index, 16 contracts (AUD) | September 2017 | 1,733,248 | 1,736,728 | 3,480 | |||||||||||||||
TOPIX Index, 36 contracts (JPY) | September 2017 | 5,088,997 | 5,157,946 | 68,949 | |||||||||||||||
Index futures sell contracts: | |||||||||||||||||||
E-mini S&P 500 Index, 164 contracts (USD) | September 2017 | (19,912,511 | ) | (19,851,380 | ) | 61,131 | |||||||||||||
EURO STOXX 50 Index, 62 contracts (EUR) | September 2017 | (2,504,723 | ) | (2,429,604 | ) | 75,119 | |||||||||||||
MSCI Taiwan Index, 194 contracts (USD) | July 2017 | (7,453,034 | ) | (7,474,820 | ) | (21,786 | ) | ||||||||||||
S&P/Toronto Stock Exchange 60 Index, 185 contracts (CAD) | September 2017 | (25,739,275 | ) | (25,370,451 | ) | 368,824 | |||||||||||||
Interest rate futures buy contracts: | |||||||||||||||||||
Canadian Government 10 Year Bond, 96 contracts (CAD) | September 2017 | 10,685,872 | 10,404,689 | (281,183 | ) | ||||||||||||||
19
UBS Dynamic Alpha Fund
Portfolio of investments
June 30, 2017
Futures contracts—(Concluded)
| Expiration date | Cost/ (proceeds) | Value | Unrealized appreciation/ (depreciation) | ||||||||||||||||
Interest rate futures sell contracts: | |||||||||||||||||||
Euro-Bund, 125 contracts (EUR) | September 2017 | $ | (23,464,478 | ) | $ | (23,109,977 | ) | $ | 354,501 | ||||||||||
Long Gilt, 43 contracts (GBP) | September 2017 | (7,140,401 | ) | (7,032,592 | ) | 107,809 | |||||||||||||
Net unrealized appreciation on futures contracts | $ | 545,670 | |||||||||||||||||
Credit default swap agreements on corporate issues—buy protection9
Counterparty | Referenced obligation | Notional amount | Termination date | Payments made by the Fund10 | Upfront payments received | Value | Unrealized depreciation | ||||||||||||||||||||||||
BB | METRO AG bond, 3.375%, due 03/01/19 | EUR | 455,000 | 06/20/20 | 1.000 | % | $ | 1,691 | $ | (6,668 | ) | $ | (4,977 | ) | |||||||||||||||||
CITI | HSBC Bank plc bond, 4.000%, due 01/15/21 | EUR | 325,000 | 03/20/20 | 1.000 | 6,254 | (8,706 | ) | (2,452 | ) | |||||||||||||||||||||
$ | 7,945 | $ | (15,374 | ) | $ | (7,429 | ) | ||||||||||||||||||||||||
Credit default swap agreements on corporate issues—sell protection11
Counterparty | Referenced obligation | Notional amount | Termination date | Payments received by the Fund10 | Upfront payments (made)/ received | Value | Unrealized appreciation | Credit spread12 | |||||||||||||||||||||||||||
CITI | Glencore International AG bond, 6.500%, due 02/27/19 | EUR | 355,000 | 06/20/19 | 1.000 | % | $ | 11,228 | $ | 3,222 | $ | 14,450 | 0.616 | % | |||||||||||||||||||||
CITI | Standard Chartered Bank plc bond, 0.000%, due 03/20/20 | EUR | 325,000 | 03/20/20 | 1.000 | (721 | ) | 8,031 | 7,310 | 0.226 | |||||||||||||||||||||||||
GSI | Freeport-McMoRan, Inc. bond, 3.550%, due 03/01/22 | USD | 290,000 | 12/20/19 | 1.000 | 7,105 | (3,173 | ) | 3,932 | 1.468 | |||||||||||||||||||||||||
JPMCB | Lanxess AG bond, 4.125%, due 05/23/18 | EUR | 595,000 | 06/20/19 | 1.000 | 4,308 | 11,356 | 15,664 | 0.180 | ||||||||||||||||||||||||||
JPMCB | Teck Resources Ltd. bond, 3.150%, due 12/20/19 | USD | 420,000 | 12/20/19 | 1.000 | 20,439 | 2,375 | 22,814 | 0.780 | ||||||||||||||||||||||||||
JPMCB | Teck Resources Ltd. bond, 3.150%, due 03/20/20 | USD | 90,000 | 03/20/20 | 1.000 | 3,943 | 321 | 4,264 | 0.877 | ||||||||||||||||||||||||||
$ | 46,302 | $ | 22,132 | $ | 68,434 | ||||||||||||||||||||||||||||||
Centrally cleared credit default swap agreements on credit indices—buy protection9
| Referenced obligation | Notional amount | Termination date | Payments made by the Fund10 | Value | Unrealized depreciation | ||||||||||||||||||
iTraxx Europe Series 25 Index | EUR | 4,070,000 | 06/20/21 | 1.000 | % | $ | (109,475 | ) | $ | (66,939 | ) | ||||||||||||
iTraxx Europe Series 27 Index | EUR | 20,800,000 | 06/20/22 | 1.000 | (518,530 | ) | (241,858 | ) | |||||||||||||||
CDX.NA.IG. Series 28 Index | USD | 43,900,000 | 06/20/22 | 1.000 | (828,364 | ) | (168,173 | ) | |||||||||||||||
$ | (1,456,369 | ) | $ | (476,970 | ) | ||||||||||||||||||
20
UBS Dynamic Alpha Fund
Portfolio of investments
June 30, 2017
Options written activity for the year ended June 30, 2017 was as follows:
| Number of contracts | Premiums received | ||||||||||
Call and/or put options outstanding at June 30, 2016 | — | $ | — | ||||||||
Call and/or put options written | 150 | 218,625 | |||||||||
Call and/or put options terminated in closing purchase transactions | (150 | ) | (218,625 | ) | |||||||
Call and/or put options expired prior to exercise | — | — | |||||||||
Call and/or put options outstanding at June 30, 2017 | — | $ | — | ||||||||
Fair valuation summary
The following is a summary of the fair valuations according to the inputs used as of June 30, 2017 in valuing the Fund's investments. In the event a Fund holds investments for which fair value is measured using the NAV per share practical expedient (or its equivalent), a separate column will be added to the fair value hierarchy table; this is intended to permit reconciliation to the amounts presented in the Portfolio of investments.
Description | Unadjusted quoted prices in active markets for identical investments (Level 1) | Other significant observable inputs (Level 2) | Unobservable inputs (Level 3) | Total | |||||||||||||||
Assets | |||||||||||||||||||
Corporate bonds | $ | — | $ | 72,647,612 | $ | — | $ | 72,647,612 | |||||||||||
Asset-backed security | — | 71,610 | — | 71,610 | |||||||||||||||
Collateralized debt obligation | — | — | 0 | 0 | |||||||||||||||
Collateralized mortgage obligation | — | 6,003 | — | 6,003 | |||||||||||||||
Non-U.S. government obligation | — | 197,397 | — | 197,397 | |||||||||||||||
U.S. treasury obligations | — | 43,972,679 | — | 43,972,679 | |||||||||||||||
Exchange traded fund | 7,479,000 | — | — | 7,479,000 | |||||||||||||||
Short-term investments | 7,718,224 | 14,993,660 | — | 22,711,884 | |||||||||||||||
Investment of cash collateral from securities loaned | 8,106,675 | — | — | 8,106,675 | |||||||||||||||
Forward foreign currency contracts | — | 212,573 | — | 212,573 | |||||||||||||||
Futures contracts | 1,282,322 | — | — | 1,282,322 | |||||||||||||||
Swap agreements, at value | — | 25,305 | — | 25,305 | |||||||||||||||
Total | $ | 24,586,221 | $ | 132,126,839 | $ | 0 | $ | 156,713,060 | |||||||||||
Liabilities | |||||||||||||||||||
Forward foreign currency contracts | $ | — | $ | (1,676,324 | ) | $ | — | $ | (1,676,324 | ) | |||||||||
Futures contracts | (736,652 | ) | — | — | (736,652 | ) | |||||||||||||
Swap agreements, at value | — | (1,474,916 | ) | — | (1,474,916 | ) | |||||||||||||
Total | $ | (736,652 | ) | $ | (3,151,240 | ) | $ | — | $ | (3,887,892 | ) | ||||||||
At June 30, 2017, there were no transfers between Level 1 and Level 2. At June 30, 2016, $26,384,956 and $1,048,138 of short-term investments and investment of cash collateral from securities loaned, respectively, were classified within Level 2 and are now classified within Level 1 in accordance with the investment valuation leveling policy. At June 30, 2016, $1,601,058 and $(1,190,970) of futures contracts were classified within Level 2 of the fair value hierarchy pursuant to the Fund's fair valuation procedures for foreign portfolio holdings.
21
UBS Dynamic Alpha Fund
Portfolio of investments
June 30, 2017
Level 3 rollforward disclosure
The following is a rollforward of the Fund's investments that were valued using unobservable inputs for the year ended June 30, 2017:
| Collateralized debt obligation | |||||||
Assets | |||||||
Beginning balance | $ | 0 | |||||
Purchases | — | ||||||
Issuances | — | ||||||
Sales | — | ||||||
Accrued discounts (premiums) | (3,774 | ) | |||||
Total realized gain (loss) | — | ||||||
Change in net unrealized appreciation (depreciation) | 3,774 | ||||||
Transfers into Level 3 | — | ||||||
Transfers out of Level 3 | — | ||||||
Ending balance | $ | 0 | |||||
The change in net unrealized appreciation (depreciation) relating to the Level 3 investments held at June 30, 2017 was $3,774.
Portfolio footnotes
1 Security was purchased pursuant to Regulation S under the Securities Act of 1933, which exempts from registration securities offered and sold outside of the United States. Such a security cannot be sold in the United States without either an effective registration statement filed pursuant to the Securities Act of 1933, or pursuant to an exemption from registration.
2 Security exempt from registration pursuant to Rule 144A under the Securities Act of 1933. These securities are considered liquid, unless noted otherwise, and may be resold in transactions exempt from registration, normally to qualified institutional buyers.
3 Variable or floating rate security. The interest rate shown is the current rate at the period end and changes periodically.
4 Security, or portion thereof, was on loan at the period end.
5 Perpetual investment. Date shown reflects the next call date.
6 Amount represents less than 0.005%.
7 Illiquid investment at the period end.
8 Rate shown is the discount rate at the date of purchase unless otherwise noted.
9 If the Fund is a buyer of protection and a credit event occurs, as defined under the terms of that particular swap agreement, the Fund will either (i) receive from the seller of protection an amount equal to the notional amount of the swap and deliver the referenced obligation or underlying securities comprising the referenced obligation or (ii) receive a net settlement amount in the form of cash or securities equal to the notional amount of the swap less the recovery value of the referenced obligation or underlying securities comprising the referenced obligation.
10 Payments made or received are based on the notional amount.
11 If the Fund is a seller of protection and a credit event occurs, as defined under the terms of that particular swap agreement, the Fund will either (i) pay to the buyer of protection an amount equal to the notional amount of the swap and take delivery of the referenced obligation or underlying securities comprising the referenced obligation or (ii) pay a net settlement amount in the form of cash or securities equal to the notional amount of the swap less the recovery value of the referenced obligation or underlying securities comprising the referenced obligation.
12 Credit spreads, represented in absolute terms, utilized in determining the market value as of period end serve as an indicator of the current status of the payment/performance risk and represent the likelihood or risk of default or other credit event occurring for the credit derivative. The credit spread of a particular referenced entity reflects the cost of buying/selling protection and may include upfront payments required to be made to enter into the agreement. Wider credit spreads represent a deterioration of the referenced entity's credit soundness and a greater likelihood or risk of default or other credit event occurring as defined under the terms of the agreement. A credit spread identified as "Defaulted" indicates a credit event has occurred for the referenced entity. Credit spreads are unaudited.
See accompanying notes to financial statements.
22
UBS Global Allocation Fund
Portfolio performance
For the 12 months ended June 30, 2017, Class A shares of UBS Global Allocation Fund (the "Fund") increased 12.51% (Class A shares returned 6.31% after the deduction of the maximum sales charge), while Class P shares increased 12.85%. In contrast, the Fund's benchmark, the 60% MSCI All Country World Index (net)/40% Citigroup World Government Bond Index (Hedged in USD), returned 10.05% during the same time period. For comparison purposes, the MSCI All Country World Index (net) returned 18.78% and the Citigroup World Government Bond Index (Hedged in USD) returned -2.00%. (Class P shares have lower expenses than other share classes of the Fund. Returns for all share classes over various time periods are shown on page 25; please note that these returns do not reflect the deduction of taxes that a shareholder would pay on Fund distributions or the redemption of Fund shares, while the Index returns do not reflect the deduction of fees and expenses.)
The Fund produced a positive absolute return during the reporting period and outperformed the benchmark. Positive performance was primarily due to our active market allocation strategy and security selection.
During the reporting period, we used derivatives for risk management purposes and as a tool to help enhance returns across various strategies. With respect to our active currency strategy, utilizing currency forwards had a direct, modestly negative impact on Fund performance.1 We used a variety of equity and fixed income options, futures and swaps to implement our market allocation strategy. Derivatives were just one tool, among others, that we used to implement our market allocation strategy. These derivatives, in aggregate, added to performance during the reporting period.
Portfolio performance summary2
What worked:
• Overall active equity positions added to performance.
– The Fund's long exposure to global equities (US, developed ex-US and emerging markets) contributed to performance over the reporting period. A number of equity markets ended the reporting period at all-time highs amid improving economic data and resurgent investor confidence.
– The Fund benefited from certain relative value trades, such as being long developed ex-US equities versus US equities and long emerging markets equities versus US equities.
• Overall, the portfolio's fixed income positions were positive for performance.
– The Fund's allocations to high yield bonds and emerging markets debt were additive for performance.
– The Fund benefited from certain relative value trades, such as long German bunds versus French government bonds and our preference for global corporate bonds over sovereigns. Global yields rose and credit spreads compressed during the reporting period.
• Certain active currency positions were positive for performance.
– The Fund's allocation to the Mexican peso relative to the US dollar and long euro position relative to the Swiss franc contributed to performance.
1 Active currency strategy refers to those positions explicitly implemented by the portfolio manager in an effort to generate alpha and does not include the currency contracts utilized by the Fund for hedging purposes.
2 For a detailed commentary on the market environment in general during the reporting period, see pages 3-4.
23
UBS Global Allocation Fund
– During the reporting period, the Fund maintained an overweight to the Indian rupee relative to the Taiwanese dollar. This was beneficial for performance as the rupee was more resilient during this volatile time period amid interventions by the Reserve Bank of India and strong macro fundamentals.
• Overall, the portfolio's bottom-up security selection was positive for results.
– Positive security selection came from within US equities, non-US equities and emerging markets equities.
What didn't work:
• Certain equity trades detracted from performance during the reporting period.
– A preference for emerging markets minimum volatility equities over broad emerging markets equities detracted from performance.
– Long-forgotten value stocks performed strongly following the US election outcome, but have since reverted back to underperforming growth stocks and the capitalization-weighted index, as evidenced by the negative performance of our long Russell 1000 Value position versus the S&P 500.
– The Fund's relative value trade of long Spanish versus Italian equities detracted from performance. We expected the Spanish market to outperform on the back of relative political and economic momentum. We decided to close the position after Mariano Rajoy was re-elected Prime Minister of Spain and we saw further pricing of a negative Italian referendum in the market.
• Certain fixed income allocations detracted from results.
– The Fund's long exposure to Australian duration detracted from results as the economy fared better than expected given lower commodity prices. This resulted in fewer rate cuts than expected.
– The Fund's performance was negatively impacted by certain relative value trades, such as long US Treasuries versus Italian government bonds.
• Overall, the portfolio's active currency positions detracted from performance.
– A detractor from performance was the Fund's short Canadian dollar position versus both the Mexican peso and the US dollar.
– The Fund's long exposure to the Japanese yen relative to the euro has not fared well since its introduction in late February of 2017. The euro has appreciated following European elections and potential rate hikes hinted at by the European Central Bank.
This letter is intended to assist shareholders in understanding how the Fund performed during the 12 months ended June 30, 2017. The views and opinions in the letter were current as of August 18, 2017. They are not guarantees of future performance or investment results and should not be taken as investment advice. Investment decisions reflect a variety of factors, and we reserve the right to change our views about individual securities, sectors and markets at any time. As a result, the views expressed should not be relied upon as a forecast of the Fund's future investment intent. We encourage you to consult your financial advisor regarding your personal investment program.
Mutual funds are sold by prospectus only. You should read it carefully and consider a fund's investment objectives, risks, charges, expenses and other important information contained in the prospectus before investing. Prospectuses for most of our funds can be obtained from your financial advisor, by calling UBS Funds at 800-647 1568 or by visiting our website at www.ubs.com/am-us.
24
UBS Global Allocation Fund
Average annual total returns for periods ended 06/30/17 (unaudited)
1 year | 5 years | 10 years | |||||||||||||
Before deducting maximum sales charge | |||||||||||||||
Class A1 | 12.51 | % | 6.52 | % | 2.44 | % | |||||||||
Class C2 | 11.76 | 5.73 | 1.66 | ||||||||||||
Class P3 | 12.85 | 6.84 | 2.74 | ||||||||||||
After deducting maximum sales charge | |||||||||||||||
Class A1 | 6.31 | % | 5.33 | % | 1.87 | % | |||||||||
Class C2 | 10.76 | 5.73 | 1.66 | ||||||||||||
MSCI All Country World Index (net)4 | 18.78 | 10.54 | 3.71 | ||||||||||||
Citigroup World Government Bond Index (Hedged in USD)5 | (2.00 | ) | 3.31 | 4.31 | |||||||||||
| 60% MSCI All Country World Index (net)/40% Citigroup World Government Bond Index (Hedged in USD)6 | 10.05 | 7.73 | 4.36 | ||||||||||||
The annualized gross and net expense ratios, respectively, for each class of shares as in the October 28, 2016 prospectuses were as follows: Class A—1.46% and 1.30%; Class C—2.25% and 2.05%; Class P—1.19% and 1.05%. Net expenses reflect fee waivers and/or expense reimbursements, if any, pursuant to an agreement that is in effect to cap the expenses. Effective October 28, 2016, the Trust, with respect to the Fund, and UBS Asset Management (Americas) Inc., the Fund's investment advisor ("UBS AM (Americas)" or the "Advisor"), have entered into a written agreement pursuant to which the Advisor has agreed to waive a portion of its management fees and/or to reimburse expenses (excluding expenses incurred through investment in other investment companies, interest, taxes, brokerage commissions, and extraordinary expenses to the extent necessary so that the Fund's ordinary operating expenses (excluding expenses incurred through investment in other investment companies, interest, taxes, brokerage commissions, and extraordinary expenses), through the period ending October 27, 2017, do not exceed 1.20% for Class A shares, 1.95% for Class C shares and 0.95% for Class P shares; Prior to October 28, 2016 UBS Global Allocation Fund's expense caps were 1.35%, 2.10% and 1.10% for Class A, C, and P shares, respectively. Pursuant to the written agreement, the Advisor is entitled to be reimbursed for any fees it waives and expenses it reimburses to the extent such reimbursement can be made during the three years following the period during which such fee waivers and expense reimbursements were made, provided that the reimbursement of the Advisor by the Fund will not cause the Fund to exceed any applicable expense limit that is in place for the Fund. The fee waiver/expense reimbursement agreement may be terminated by the Fund's Board of Trustees at any time and also will terminate automatically upon the expiration or termination of the Fund's advisory contract with the Advisor. Upon termination of the fee waiver/expense reimbursement agreement, however, UBS AM (Americas)'s three year recoupment rights will survive.
1 Maximum sales charge for Class A shares is 5.5%. Class A shares bear ongoing 12b-1 service fees.
2 Maximum contingent deferred sales charge for Class C shares is 1% imposed on redemptions and is reduced to 0% after one year. Class C shares bear ongoing 12b-1 distribution and service fees.
3 Class P shares do not bear initial or contingent deferred sales charges or ongoing 12b-1 service and distribution fees, but Class P shares held through advisory programs may be subject to a program fee, which, if included, would have reduced performance.
4 The MSCI All Country World Index (net) is a free float-adjusted market capitalization weighted index that is designed to measure the equity market performance of developed and emerging markets. Net total return indices reinvest dividends after the deduction of withholding taxes, using a tax rate applicable to non-resident institutional investors who do not benefit from double taxation treaties. The index is constructed and managed with a view to being fully investable from the perspective of international institutional investors. Investors should note that indices do not reflect the deduction of fees and expenses.
5 The Citigroup World Government Bond Index (Hedged in USD) is an unmanaged market capitalization-weighted index designed to measure the performance of fixed-rate, local currency, investment-grade sovereign bonds with a one-year minimum maturity and is hedged back to the US dollar. Investors should note that indices do not reflect the deduction of fees and expenses.
6 The 60% MSCI All Country World Index (net)/40% Citigroup World Government Bond Index (Hedged in USD) is a unmanaged blended benchmark compiled by the Advisor. Investors should note that indices do not reflect the deduction of fees and expenses.
Prior to August 3, 2015, a 1% redemption fee was imposed on sales or exchanges of any class of shares of the Fund made during the specified holding period.
Past performance does not predict future performance, and the performance information provided does not reflect the deduction of taxes that a shareholder would pay on Fund distributions or the redemption of Fund shares. The return and principal value of an investment will fluctuate, so that an investor's shares, when redeemed, may be worth more or less than their original cost. Performance results assume reinvestment of all dividends and capital gain distributions at net asset value on the ex-dividend dates. Current performance may be higher or lower than the performance data quoted. For month-end performance figures, please visit www.ubs.com/us-mutualfundperformance.
25
UBS Global Allocation Fund
Illustration of an assumed investment of $10,000 in Class A shares (adjusted for 5.5% maximum sales charge) and $5,000,000 in Class P shares (unaudited)
The following two graphs depict the performance of UBS Global Allocation Fund Class A and Class P shares versus the MSCI All Country World Index (net), Citigroup World Government Bond Index (Hedged in USD), and the 60% MSCI All Country World Index (net)/40% Citigroup World Government Bond Index (Hedged in USD) over the 10 years ended June 30, 2017. The performance of Class C shares will vary based upon the different class specific expenses and sales charges. The performance provided does not reflect the deduction of taxes that a shareholder would pay on Fund distributions or the redemption of Fund shares. Past performance is no guarantee of future results. Share price and returns will vary with market conditions; investors may realize a gain or loss upon redemption.
UBS Global Allocation Fund Class A vs. MSCI All Country World Index (net), Citigroup World Government Bond Index (Hedged in USD) and 60% MSCI All Country World Index (net)/40% Citigroup World Government Bond Index (Hedged in USD)
Wealth value with dividends reinvested. Initial investment for Class A Shares as of June 30, 2007 = $9,450
The Fund's growth of an assumed $10,000 investment is adjusted for the maximum sales charge of 5.5%.

UBS Global Allocation Fund Class P vs. MSCI All Country World Index (net), Citigroup World Government Bond Index (Hedged in USD) and 60% MSCI All Country World Index (net)/40% Citigroup World Government Bond Index (Hedged in USD)
Wealth value with dividends reinvested. Initial investment for Class P shares as of June 30, 2007 = $5,000,000

Past performance does not predict future performance, and the performance information provided does not reflect the deduction of taxes that a shareholder would pay on Fund distributions or the redemption of Fund shares. The return and principal value of an investment will fluctuate, so that an investor's shares, when redeemed, may be worth more or less than their original cost. Performance results assume reinvestment of all dividends and capital gain distributions at net asset value on the ex-dividend dates. Current performance may be higher or lower than the performance data quoted. For month-end performance figures, please visit www.ubs.com/us-mutualfundperformance.
26
UBS Global Allocation Fund
Portfolio statistics—June 30, 2017 (unaudited)1
Top ten equity holdings
| Percentage of net assets | |||||||
Amazon.com, Inc. | 0.9 | % | |||||
British American Tobacco plc | 0.9 | ||||||
Facebook, Inc., Class A | 0.8 | ||||||
Philip Morris International, Inc. | 0.6 | ||||||
Deutsche Telekom AG (Registered) | 0.6 | ||||||
Sony Corp. | 0.6 | ||||||
Unilever NV, CVA | 0.6 | ||||||
Sanofi | 0.6 | ||||||
Marsh & McLennan Cos., Inc. | 0.5 | ||||||
Visa, Inc., Class A | 0.5 | ||||||
Total | 6.6 | % | |||||
Top ten long-term fixed income holdings
| Percentage of net assets | |||||||
| U.S. Treasury Note, 1.000%, 03/15/19 | 1.2 | % | |||||
| U.S. Treasury Note, 0.750%, 02/28/18 | 1.2 | ||||||
| New Zealand Government Bond, 2.000%, 09/20/25 | 0.8 | ||||||
| Commonwealth of Australia, 1.750%, 11/21/20 | 0.8 | ||||||
| Japan Government Twenty Year Bond, 0.400%, 03/20/36 | 0.6 | ||||||
| Government of Canada, 1.500%, 03/01/20 | 0.5 | ||||||
| U.S. Treasury Note, 0.750%, 07/31/18 | 0.5 | ||||||
| France Government Bond OAT, 0.500%, 05/25/26 | 0.5 | ||||||
| U.S. Treasury Note, 2.000%, 11/30/22 | 0.5 | ||||||
| Japan Government Five Year Bond, 0.100%, 12/20/19 | 0.4 | ||||||
Total | 7.0 | % | |||||
Top five issuer breakdown by country or territory of origin2
| Percentage of net assets | |||||||
United States | 26.2 | % | |||||
Japan | 5.7 | ||||||
United Kingdom | 3.7 | ||||||
Germany | 2.4 | ||||||
Italy | 2.4 | ||||||
Total | 40.4 | % | |||||
1 The Fund's portfolio is actively managed and its composition will vary over time.
2 Figures represent the direct investments of UBS Global Allocation Fund. If a breakdown of the underlying investment companies and exchange traded funds was included, the country or territory of origin breakdown would be as follows: United States: 33.2%, Japan: 5.8%, United Kingdom: 5.7%, Germany: 2.7%, and Italy: 2.6%.
27
UBS Global Allocation Fund
Industry diversification—June 30, 2017 (unaudited)1,2
Common stocks | Percentage of net assets | ||||||
Aerospace & defense | 1.23 | % | |||||
Airlines | 0.40 | ||||||
Auto components | 0.76 | ||||||
Automobiles | 0.77 | ||||||
Banks | 3.44 | ||||||
Beverages | 0.31 | ||||||
Biotechnology | 1.70 | ||||||
Building products | 0.25 | ||||||
Capital markets | 0.34 | ||||||
Chemicals | 1.42 | ||||||
Commercial services & supplies | 0.31 | ||||||
Communications equipment | 0.12 | ||||||
Consumer finance | 0.69 | ||||||
Distributors | 0.19 | ||||||
Diversified financial services | 1.04 | ||||||
Diversified telecommunication services | 0.95 | ||||||
Electric utilities | 0.15 | ||||||
Electronic equipment, instruments & components | 0.20 | ||||||
Equity real estate investment trusts (REITs) | 0.29 | ||||||
Food & staples retailing | 1.03 | ||||||
Food products | 0.34 | ||||||
Health care equipment & supplies | 0.42 | ||||||
Health care providers & services | 1.36 | ||||||
Hotels, restaurants & leisure | 0.43 | ||||||
Household durables | 1.21 | ||||||
Industrial conglomerates | 0.56 | ||||||
Insurance | 2.15 | ||||||
Internet & direct marketing retail | 1.22 | ||||||
Internet software & services | 1.47 | ||||||
IT services | 1.35 | ||||||
Life sciences tools & services | 0.64 | ||||||
Machinery | 0.89 | ||||||
Marine | 0.24 | ||||||
Media | 0.98 | ||||||
Metals & mining | 0.92 | ||||||
Oil, gas & consumable fuels | 2.84 | ||||||
Personal products | 0.71 | ||||||
Pharmaceuticals | 2.19 | ||||||
Professional services | 0.15 | ||||||
Real estate management & development | 0.26 | ||||||
Road & rail | 0.19 | ||||||
Semiconductors & semiconductor equipment | 2.12 | ||||||
Software | 2.39 | ||||||
Specialty retail | 1.06 | ||||||
Technology hardware, storage & peripherals | 0.61 | ||||||
Textiles, apparel & luxury goods | 0.18 | ||||||
Tobacco | 1.53 | ||||||
Trading companies & distributors | 0.30 | ||||||
Common stocks—(Continued) | Percentage of net assets | ||||||
Transportation infrastructure | 0.21 | % | |||||
Wireless telecommunication services | 0.57 | ||||||
Total common stocks | 45.08 | % | |||||
Bonds | |||||||
Non-U.S. government obligations | 6.99 | ||||||
U.S. treasury obligations | 5.11 | ||||||
Total bonds | 12.10 | % | |||||
Investment companies | |||||||
UBS Global Corporate Bond Relationship Fund | 15.28 | ||||||
UBS-HALO Emerging Markets Equity Relationship Fund | 7.25 | ||||||
Total investment companies | 22.53 | % | |||||
Exchange traded funds | 9.05 | ||||||
Short-term investment | 7.69 | ||||||
Investment of cash collateral from securities loaned | 5.00 | ||||||
Total investments | 101.45 | % | |||||
Liabilities, in excess of cash and other assets | (1.45 | ) | |||||
Net assets | 100.00 | % | |||||
1 Figures represent the breakdown of direct investments of UBS Global Allocation Fund. Figures would be different if a breakdown of the underlying investment companies and exchange traded funds was included.
2 The Fund's portfolio is actively managed and its composition will vary over time.
28
UBS Global Allocation Fund
Portfolio of investments
June 30, 2017
Shares | Value | ||||||||||
Common stocks: 45.08% | |||||||||||
Australia: 0.55% | |||||||||||
Insurance Australia Group Ltd. | 52,260 | $ | 272,333 | ||||||||
Rio Tinto Ltd. | 12,951 | 629,798 | |||||||||
Wesfarmers Ltd. | 31,466 | 970,293 | |||||||||
Total Australia common stocks | 1,872,424 | ||||||||||
Austria: 0.48% | |||||||||||
Erste Group Bank AG* | 42,453 | 1,625,550 | |||||||||
Belgium: 0.06% | |||||||||||
Galapagos NV* | 2,588 | 197,630 | |||||||||
Bermuda: 0.77% | |||||||||||
Jardine Matheson Holdings Ltd. | 18,700 | 1,200,540 | |||||||||
Marvell Technology Group Ltd. | 47,097 | 778,042 | |||||||||
Norwegian Cruise Line Holdings Ltd.* | 11,482 | 623,358 | |||||||||
Total Bermuda common stocks | 2,601,940 | ||||||||||
Canada: 1.45% | |||||||||||
Canadian Pacific Railway Ltd. | 3,952 | 635,521 | |||||||||
Enerplus Corp. | 37,972 | 308,039 | |||||||||
Husky Energy, Inc.* | 69,878 | 793,187 | |||||||||
Paramount Resources Ltd., Class A* | 12,372 | 182,126 | |||||||||
Suncor Energy, Inc. | 46,648 | 1,362,965 | |||||||||
Toronto-Dominion Bank (The) | 32,143 | 1,619,791 | |||||||||
Total Canada common stocks | 4,901,629 | ||||||||||
Cayman Islands: 0.11% | |||||||||||
Alibaba Group Holding Ltd. ADR* | 2,560 | 360,704 | |||||||||
Denmark: 0.63% | |||||||||||
AP Moller—Maersk A/S, Class B | 410 | 824,364 | |||||||||
Novo Nordisk A/S, Class B | 30,199 | 1,293,246 | |||||||||
Total Denmark common stocks | 2,117,610 | ||||||||||
Finland: 0.18% | |||||||||||
Sampo OYJ, Class A | 11,949 | 612,366 | |||||||||
France: 1.46% | |||||||||||
Credit Agricole SA | 90,325 | 1,453,075 | |||||||||
Peugeot SA | 33,153 | 661,324 | |||||||||
Sanofi | 19,085 | 1,825,795 | |||||||||
Thales SA | 9,205 | 990,791 | |||||||||
Total France common stocks | 4,930,985 | ||||||||||
Germany: 2.43% | |||||||||||
Deutsche Telekom AG (Registered) | 121,779 | 2,186,493 | |||||||||
Fresenius SE & Co. KGaA | 15,381 | 1,318,610 | |||||||||
Infineon Technologies AG | 38,569 | 814,294 | |||||||||
KION Group AG | 16,699 | 1,276,349 | |||||||||
MTU Aero Engines AG | 4,143 | 584,393 | |||||||||
SAP SE | 9,335 | 975,037 | |||||||||
thyssenkrupp AG | 36,871 | 1,047,541 | |||||||||
Total Germany common stocks | 8,202,717 | ||||||||||
Shares | Value | ||||||||||
Hong Kong: 0.65% | |||||||||||
AIA Group Ltd. | 230,717 | $ | 1,685,878 | ||||||||
Power Assets Holdings Ltd. | 59,000 | 521,047 | |||||||||
Total Hong Kong common stocks | 2,206,925 | ||||||||||
Ireland: 1.59% | |||||||||||
Allegion plc | 10,353 | 839,835 | |||||||||
Allergan plc | 5,952 | 1,446,872 | |||||||||
ICON plc* | 12,919 | 1,263,349 | |||||||||
Mallinckrodt plc* | 10,631 | 476,375 | |||||||||
Ryanair Holdings plc ADR* | 12,392 | 1,333,503 | |||||||||
Total Ireland common stocks | 5,359,934 | ||||||||||
Italy: 1.34% | |||||||||||
Atlantia SpA | 25,453 | 716,313 | |||||||||
Autogrill SpA | 69,327 | 840,119 | |||||||||
Banca Mediolanum SpA | 149,142 | 1,237,539 | |||||||||
Intesa Sanpaolo SpA | 226,910 | 719,443 | |||||||||
UniCredit SpA* | 53,610 | 1,001,121 | |||||||||
Total Italy common stocks | 4,514,535 | ||||||||||
Japan: 4.62% | |||||||||||
ABC-Mart, Inc. | 15,200 | 893,283 | |||||||||
Inpex Corp. | 108,900 | 1,046,641 | |||||||||
KDDI Corp. | 49,800 | 1,317,226 | |||||||||
Matsui Securities Co. Ltd. | 95,000 | 773,683 | |||||||||
Mitsui Fudosan Co. Ltd. | 36,500 | 869,867 | |||||||||
ORIX Corp. | 84,300 | 1,304,130 | |||||||||
Santen Pharmaceutical Co. Ltd. | 34,000 | 460,689 | |||||||||
Shin-Etsu Chemical Co. Ltd. | 16,600 | 1,503,187 | |||||||||
Shionogi & Co. Ltd. | 8,100 | 450,748 | |||||||||
Sony Corp. | 54,000 | 2,057,737 | |||||||||
Sumitomo Electric Industries Ltd. | 55,900 | 859,809 | |||||||||
Takeda Pharmaceutical Co., Ltd. | 6,100 | 309,623 | |||||||||
THK Co. Ltd. | 22,300 | 630,487 | |||||||||
Tokyo Electron Ltd. | 6,900 | 930,020 | |||||||||
Toyota Industries Corp. | 19,500 | 1,024,628 | |||||||||
Toyota Motor Corp. | 22,500 | 1,178,862 | |||||||||
Total Japan common stocks | 15,610,620 | ||||||||||
Jersey: 0.80% | |||||||||||
Delphi Automotive plc | 7,700 | 674,905 | |||||||||
Glencore plc* | 187,377 | 700,909 | |||||||||
Shire plc | 23,774 | 1,312,273 | |||||||||
Total Jersey common stocks | 2,688,087 | ||||||||||
Netherlands: 1.80% | |||||||||||
| ASR Nederland NV | 34,710 | 1,170,490 | |||||||||
Koninklijke Ahold Delhaize NV | 40,592 | 776,102 | |||||||||
Koninklijke DSM NV | 16,457 | 1,196,201 | |||||||||
LyondellBasell Industries NV, Class A | 9,011 | 760,438 | |||||||||
Unilever NV, CVA | 34,337 | 1,895,014 | |||||||||
Wright Medical Group NV* | 10,402 | 285,951 | |||||||||
Total Netherlands common stocks | 6,084,196 | ||||||||||
29
UBS Global Allocation Fund
Portfolio of investments
June 30, 2017
Shares | Value | ||||||||||
Common stocks—(Continued) | |||||||||||
Norway: 0.60% | |||||||||||
Statoil ASA | 60,294 | $ | 999,514 | ||||||||
Telenor ASA | 60,974 | 1,011,516 | |||||||||
Total Norway common stocks | 2,011,030 | ||||||||||
Singapore: 0.33% | |||||||||||
Broadcom Ltd. | 3,552 | 827,794 | |||||||||
Flex Ltd.* | 18,700 | 304,997 | |||||||||
Total Singapore common stocks | 1,132,791 | ||||||||||
Spain: 0.51% | |||||||||||
Banco Santander SA | 153,944 | 1,018,391 | |||||||||
Mediaset Espana Comunicacion SA | 57,158 | 711,258 | |||||||||
Total Spain common stocks | 1,729,649 | ||||||||||
United Kingdom: 3.66% | |||||||||||
Anglo American plc* | 55,487 | 740,035 | |||||||||
Ashtead Group plc | 48,276 | 999,117 | |||||||||
Babcock International Group plc | 92,061 | 1,055,762 | |||||||||
| BP plc | 261,806 | 1,509,900 | |||||||||
British American Tobacco plc | 43,691 | 2,978,426 | |||||||||
HSBC Holdings plc | 177,984 | 1,649,829 | |||||||||
Sage Group plc (The) | 152,103 | 1,362,973 | |||||||||
Tesco plc* | 381,010 | 837,664 | |||||||||
Worldpay Group plc1 | 301,476 | 1,236,085 | |||||||||
Total United Kingdom common stocks | 12,369,791 | ||||||||||
United States: 21.06% | |||||||||||
Abbott Laboratories | 10,766 | 523,335 | |||||||||
Activision Blizzard, Inc. | 15,064 | 867,234 | |||||||||
Adobe Systems, Inc.* | 4,410 | 623,750 | |||||||||
Aetna, Inc. | 4,261 | 646,948 | |||||||||
Allstate Corp. (The) | 6,849 | 605,726 | |||||||||
Alnylam Pharmaceuticals, Inc.* | 6,582 | 524,980 | |||||||||
Alphabet, Inc., Class A* | 1,526 | 1,418,692 | |||||||||
Alphabet, Inc., Class C* | 505 | 458,909 | |||||||||
Amazon.com, Inc.* | 3,083 | 2,984,344 | |||||||||
American Express Co. | 14,106 | 1,188,289 | |||||||||
Apple, Inc. | 7,782 | 1,120,764 | |||||||||
Applied Materials, Inc. | 11,800 | 487,458 | |||||||||
Arista Networks, Inc.* | 2,615 | 391,701 | |||||||||
Bio-Rad Laboratories, Inc., Class A* | 3,887 | 879,667 | |||||||||
Bluebird Bio, Inc.* | 962 | 101,058 | |||||||||
CBOE Holdings, Inc. | 3,997 | 365,326 | |||||||||
CBS Corp. (Non-Voting), Class B | 13,169 | 839,919 | |||||||||
Celgene Corp.* | 12,081 | 1,568,959 | |||||||||
Cigna Corp. | 4,030 | 674,582 | |||||||||
Cirrus Logic, Inc.* | 5,579 | 349,915 | |||||||||
Coherus Biosciences, Inc.* | 13,772 | 197,628 | |||||||||
Cooper Cos., Inc. | 2,536 | 607,169 | |||||||||
Delek US Holdings, Inc. | 23,283 | 615,603 | |||||||||
Ecolab, Inc. | 5,185 | 688,309 | |||||||||
Electronic Arts, Inc.* | 3,593 | 379,852 | |||||||||
Eli Lilly & Co. | 10,577 | 870,487 | |||||||||
Emergent BioSolutions, Inc.* | 6,749 | 228,859 | |||||||||
Shares | Value | ||||||||||
EOG Resources, Inc. | 10,968 | $ | 992,823 | ||||||||
Estee Lauder Cos., Inc., Class A | 5,277 | 506,486 | |||||||||
Expedia, Inc. | 7,583 | 1,129,488 | |||||||||
Facebook, Inc., Class A* | 18,076 | 2,729,114 | |||||||||
FleetCor Technologies, Inc.* | 4,850 | 699,418 | |||||||||
Fortive Corp. | 6,799 | 430,717 | |||||||||
General Motors Co. | 21,668 | 756,863 | |||||||||
Gilead Sciences, Inc. | 5,408 | 382,778 | |||||||||
Hess Corp. | 12,817 | 562,282 | |||||||||
Home Depot, Inc. (The) | 6,913 | 1,060,454 | |||||||||
Honeywell International, Inc. | 5,240 | 698,440 | |||||||||
Incyte Corp.* | 4,679 | 589,133 | |||||||||
Ironwood Pharmaceuticals, Inc.* | 14,916 | 281,614 | |||||||||
Jabil, Inc. | 12,211 | 356,439 | |||||||||
JPMorgan Chase & Co. | 14,717 | 1,345,134 | |||||||||
Laboratory Corp. of America Holdings* | 6,562 | 1,011,467 | |||||||||
Lam Research Corp. | 2,967 | 419,623 | |||||||||
Lennar Corp., Class A | 14,373 | 766,368 | |||||||||
Lexicon Pharmaceuticals, Inc.*,2 | 21,758 | 357,919 | |||||||||
LKQ Corp.* | 19,804 | 652,542 | |||||||||
Marsh & McLennan Cos., Inc. | 23,282 | 1,815,065 | |||||||||
Mastercard, Inc., Class A | 7,113 | 863,874 | |||||||||
Medicines Co. (The)*,2 | 6,801 | 258,506 | |||||||||
MetLife, Inc. | 19,858 | 1,090,999 | |||||||||
Micron Technology, Inc.* | 28,262 | 843,903 | |||||||||
Microsemi Corp.* | 7,349 | 343,933 | |||||||||
Microsoft Corp. | 23,147 | 1,595,523 | |||||||||
Mondelez International, Inc., Class A | 26,184 | 1,130,887 | |||||||||
Newell Brands, Inc. | 23,687 | 1,270,097 | |||||||||
NIKE, Inc., Class B | 10,230 | 603,570 | |||||||||
Noble Energy, Inc. | 14,508 | 410,576 | |||||||||
NVIDIA Corp. | 2,599 | 375,711 | |||||||||
Oasis Petroleum, Inc.* | 53,057 | 427,109 | |||||||||
ON Semiconductor Corp.* | 25,172 | 353,415 | |||||||||
O'Reilly Automotive, Inc.* | 2,042 | 446,667 | |||||||||
Parsley Energy, Inc., Class A* | 13,362 | 370,795 | |||||||||
PepsiCo, Inc. | 9,026 | 1,042,413 | |||||||||
Philip Morris International, Inc. | 18,670 | 2,192,791 | |||||||||
PTC, Inc.* | 10,809 | 595,792 | |||||||||
Qorvo, Inc.* | 4,817 | 305,012 | |||||||||
salesforce.com, Inc.* | 5,315 | 460,279 | |||||||||
ServiceNow, Inc.* | 5,428 | 575,368 | |||||||||
Sherwin-Williams Co. (The) | 1,860 | 652,786 | |||||||||
Simon Property Group, Inc. REIT | 5,986 | 968,295 | |||||||||
Skyworks Solutions, Inc. | 3,590 | 344,460 | |||||||||
Spirit AeroSystems Holdings, Inc., Class A | 18,290 | 1,059,723 | |||||||||
Synchrony Financial | 38,685 | 1,153,587 | |||||||||
Take-Two Interactive Software, Inc.* | 4,388 | 321,991 | |||||||||
TJX Cos., Inc. (The) | 16,495 | 1,190,444 | |||||||||
T-Mobile US, Inc.* | 10,216 | 619,294 | |||||||||
TransDigm Group, Inc. | 1,728 | 464,607 | |||||||||
Ultimate Software Group, Inc. (The)* | 1,547 | 324,963 | |||||||||
United Technologies Corp. | 8,652 | 1,056,496 | |||||||||
UnitedHealth Group, Inc. | 5,079 | 941,748 | |||||||||
Verisk Analytics, Inc.* | 6,126 | 516,851 | |||||||||
Visa, Inc., Class A | 18,809 | 1,763,908 | |||||||||
30
UBS Global Allocation Fund
Portfolio of investments
June 30, 2017
Shares | Value | ||||||||||
Common stocks—(Concluded) | |||||||||||
United States—(Concluded) | |||||||||||
Voya Financial, Inc. | 26,445 | $ | 975,556 | ||||||||
Wabtec Corp.2 | 7,326 | 670,329 | |||||||||
Walgreens Boots Alliance, Inc. | 11,393 | 892,186 | |||||||||
Walt Disney Co. (The) | 16,499 | 1,753,019 | |||||||||
Wells Fargo & Co. | 21,246 | 1,177,241 | |||||||||
Western Digital Corp. | 10,586 | 937,920 | |||||||||
Total United States common stocks | 71,096,254 | ||||||||||
| Total common stocks (cost $134,962,439) | 152,227,367 | ||||||||||
| Face amount | |||||||||||
Bonds: 12.10% | |||||||||||
Non-U.S. government obligations: 6.99% | |||||||||||
Australia: 1.01% | |||||||||||
| Commonwealth of Australia, 1.750%, due 11/21/203 | AUD | 3,390,000 | 2,583,282 | ||||||||
4.500%, due 04/15/203 | 625,000 | 513,817 | |||||||||
4.500%, due 04/21/333 | 122,000 | 111,887 | |||||||||
5.500%, due 04/21/233 | 230,000 | 207,554 | |||||||||
3,416,540 | |||||||||||
Austria: 0.06% | |||||||||||
| Republic of Austria, 1.200%, due 10/20/251,3 | EUR | 47,000 | 56,893 | ||||||||
3.150%, due 06/20/441,3 | 86,000 | 134,134 | |||||||||
191,027 | |||||||||||
Belgium: 0.08% | |||||||||||
| Kingdom of Belgium, 3.750%, due 06/22/453 | 161,000 | 267,536 | |||||||||
Canada: 0.60% | |||||||||||
| Government of Canada, 1.500%, due 03/01/20 | CAD | 2,310,000 | 1,796,155 | ||||||||
2.250%, due 06/01/25 | 206,000 | 166,071 | |||||||||
2.750%, due 12/01/64 | 82,000 | 75,517 | |||||||||
2,037,743 | |||||||||||
Finland: 0.03% | |||||||||||
| Republic of Finland, 0.500%, due 04/15/261,3 | EUR | 85,000 | 97,025 | ||||||||
France: 0.93% | |||||||||||
| France Government Bond OAT, 0.500%, due 05/25/263 | 1,462,000 | 1,646,696 | |||||||||
2.500%, due 05/25/303 | 625,000 | 834,353 | |||||||||
3.250%, due 05/25/453 | 436,000 | 661,346 | |||||||||
3,142,395 | |||||||||||
Ireland: 0.07% | |||||||||||
| Republic of Ireland, 2.000%, due 02/18/453 | 208,000 | 241,034 | |||||||||
| Face amount | Value | ||||||||||
Italy: 1.09% | |||||||||||
| Italy Buoni Poliennali Del Tesoro, 0.950%, due 03/15/23 | EUR | 1,020,000 | $ | 1,153,262 | |||||||
1.650%, due 03/01/321,3 | 60,000 | 61,087 | |||||||||
| 2.550%, due 09/15/413,4 | 882,192 | 1,146,767 | |||||||||
4.000%, due 02/01/373 | 309,000 | 410,279 | |||||||||
4.250%, due 02/01/193 | 720,000 | 879,255 | |||||||||
4.750%, due 09/01/441,3 | 25,000 | 36,087 | |||||||||
3,686,737 | |||||||||||
Japan: 1.06% | |||||||||||
| Japan Government Five Year Bond, 0.100%, due 12/20/19 | JPY | 155,000,000 | 1,384,382 | ||||||||
| Japan Government Twenty Year Bond, 0.400%, due 03/20/36 | 231,350,000 | 2,009,346 | |||||||||
2.300%, due 06/20/27 | 16,000,000 | 173,420 | |||||||||
3,567,148 | |||||||||||
Netherlands: 0.07% | |||||||||||
| Kingdom of the Netherlands, 2.750%, due 01/15/471,3 | EUR | 139,000 | 214,725 | ||||||||
New Zealand: 0.94% | |||||||||||
| New Zealand Government Bond, 2.000%, due 09/20/254 | NZD | 3,915,214 | 2,902,169 | ||||||||
2.500%, due 09/20/353,4 | 369,036 | 282,898 | |||||||||
3,185,067 | |||||||||||
Spain: 1.05% | |||||||||||
| Kingdom of Spain, 3.450%, due 07/30/661,3 | EUR | 350,000 | 423,218 | ||||||||
3.750%, due 10/31/18 | 920,000 | 1,108,586 | |||||||||
4.200%, due 01/31/371,3 | 404,000 | 588,321 | |||||||||
4.800%, due 01/31/241,3 | 640,000 | 918,711 | |||||||||
5.150%, due 10/31/441,3 | 310,000 | 514,338 | |||||||||
3,553,174 | |||||||||||
| Total Non-U.S. government obligations (cost $23,547,706) | 23,600,151 | ||||||||||
U.S. treasury obligations: 5.11% | |||||||||||
| U.S. Treasury Bonds, 2.500%, due 02/15/46 | $ | 590,000 | 550,106 | ||||||||
2.750%, due 11/15/42 | 543,000 | 537,273 | |||||||||
2.875%, due 05/15/43 | 1,045,000 | 1,056,348 | |||||||||
2.875%, due 08/15/45 | 50,000 | 50,357 | |||||||||
3.000%, due 11/15/45 | 125,000 | 128,960 | |||||||||
| U.S. Treasury Notes, 0.750%, due 02/28/18 | 3,970,000 | 3,957,594 | |||||||||
0.750%, due 07/31/18 | 1,710,000 | 1,700,248 | |||||||||
0.875%, due 10/15/18 | 510,000 | 507,052 | |||||||||
1.000%, due 03/15/19 | 4,100,000 | 4,074,535 | |||||||||
1.250%, due 03/31/21 | 637,000 | 626,400 | |||||||||
1.375%, due 10/31/20 | 665,000 | 659,545 | |||||||||
1.375%, due 09/30/23 | 400,000 | 383,875 | |||||||||
1.625%, due 12/31/19 | 770,000 | 772,827 | |||||||||
31
UBS Global Allocation Fund
Portfolio of investments
June 30, 2017
| Face amount | Value | ||||||||||
Bonds—(Concluded) | |||||||||||
U.S. treasury obligations—(Concluded) | |||||||||||
1.750%, due 05/15/23 | $ | 680,000 | $ | 669,747 | |||||||
2.000%, due 11/30/22 | 1,575,000 | 1,578,260 | |||||||||
| Total U.S. treasury obligations (cost $17,364,625) | 17,253,127 | ||||||||||
| Total bonds (cost $40,912,331) | 40,853,278 | ||||||||||
Shares | |||||||||||
Exchange traded funds: 9.05% | |||||||||||
| iShares Edge MSCI Minimum Volatility Emerging Markets Fund2 | 275,600 | 15,268,240 | |||||||||
| iShares JP Morgan USD Emerging Markets Bond Fund | 133,700 | 15,289,932 | |||||||||
| Total exchange traded funds (cost $29,102,236) | 30,558,172 | ||||||||||
Investment companies: 22.53% | |||||||||||
| UBS Global Corporate Bond Relationship Fund*,5 | 3,530,059 | 51,581,219 | |||||||||
| UBS-HALO Emerging Markets Equity Relationship Fund*,5 | 542,859 | 24,479,787 | |||||||||
| Total investment companies (cost $68,261,190) | 76,061,006 | ||||||||||
Shares | Value | ||||||||||
Short-term investment: 7.69% | |||||||||||
Investment company: 7.69% | |||||||||||
| JPMorgan U.S. Government Money Market Fund, Capital Shares (cost $25,960,777) | 25,960,777 | $ | 25,960,777 | ||||||||
Investment of cash collateral from securities loaned: 5.00% | |||||||||||
| JPMorgan U.S. Government Money Market Fund, Capital Shares (cost $16,889,087) | 16,889,087 | 16,889,087 | |||||||||
| Total investments: 101.45% (cost $316,088,060) | 342,549,687 | ||||||||||
Liabilities, in excess of cash and other assets: (1.45)% | (4,889,495 | ) | |||||||||
Net assets: 100.00% | $ | 337,660,192 | |||||||||
Notes to portfolio of investments
Aggregate cost for federal income tax purposes was $323,123,727; and net unrealized appreciation consisted of:
Gross unrealized appreciation | $ | 25,349,108 | |||||
Gross unrealized depreciation | (5,923,148 | ) | |||||
Net unrealized appreciation of investments | $ | 19,425,960 | |||||
For a listing of defined portfolio acronyms, counterparty abbreviations and currency abbreviations that are used throughout the Portfolio of investments as well as the tables that follow, please refer to page 85. Portfolio footnotes begin on page 35.
Forward foreign currency contracts
Counterparty | Contracts to deliver | In exchange for | Maturity date | Unrealized appreciation/ (depreciation) | |||||||||||||||
BB | CAD | 11,440,000 | USD | 8,667,185 | 09/27/17 | $ | (166,397 | ) | |||||||||||
BB | CZK | 176,175,360 | EUR | 6,551,218 | 12/18/17 | (249,245 | ) | ||||||||||||
BB | EUR | 6,560,000 | CZK | 176,175,360 | 12/18/17 | 239,122 | |||||||||||||
CSI | USD | 10,182,620 | MXN | 186,450,000 | 09/27/17 | (46,360 | ) | ||||||||||||
GSI | CNY | 35,065,000 | USD | 5,099,993 | 09/27/17 | (44,727 | ) | ||||||||||||
GSI | EUR | 9,750,000 | USD | 10,948,942 | 09/27/17 | (237,447 | ) | ||||||||||||
GSI | TWD | 52,300,000 | USD | 1,723,229 | 09/27/17 | (1,450 | ) | ||||||||||||
GSI | USD | 7,489,483 | AUD | 9,910,000 | 09/27/17 | 119,118 | |||||||||||||
JPMCB | CHF | 5,830,000 | USD | 6,038,053 | 09/27/17 | (75,343 | ) | ||||||||||||
JPMCB | INR | 118,500,000 | USD | 1,820,836 | 09/27/17 | 7,657 | |||||||||||||
32
UBS Global Allocation Fund
Portfolio of investments
June 30, 2017
Forward foreign currency contracts—(Concluded)
Counterparty | Contracts to deliver | In exchange for | Maturity date | Unrealized appreciation/ (depreciation) | |||||||||||||||
JPMCB | NOK | 10,910,000 | USD | 1,290,064 | 09/27/17 | $ | (18,904 | ) | |||||||||||
JPMCB | THB | 84,200,000 | USD | 2,479,388 | 09/27/17 | 606 | |||||||||||||
JPMCB | USD | 7,652,835 | COP | 23,385,150,000 | 09/27/17 | (64,517 | ) | ||||||||||||
JPMCB | USD | 1,843,645 | GBP | 1,445,000 | 09/27/17 | 43,372 | |||||||||||||
JPMCB | USD | 1,524,328 | HKD | 11,860,000 | 09/27/17 | (1,710 | ) | ||||||||||||
JPMCB | USD | 596,403 | ILS | 2,100,000 | 09/27/17 | 7,655 | |||||||||||||
JPMCB | USD | 5,675,585 | JPY | 628,600,000 | 09/27/17 | (65,722 | ) | ||||||||||||
JPMCB | USD | 1,668,682 | SGD | 2,310,000 | 09/27/17 | 11,435 | |||||||||||||
MSC | KRW | 4,236,000,000 | USD | 3,728,939 | 09/27/17 | 21,863 | |||||||||||||
MSC | NZD | 24,370,000 | USD | 17,711,726 | 09/27/17 | (118,534 | ) | ||||||||||||
MSC | RUB | 129,375,388 | USD | 2,161,209 | 09/27/17 | 5,911 | |||||||||||||
Net unrealized depreciation on forward foreign currency contracts | $ | (633,617 | ) | ||||||||||||||||
Futures contracts
| Expiration date | Cost/ (proceeds) | Value | Unrealized appreciation/ (depreciation) | ||||||||||||||||
US Treasury futures buy contracts: | |||||||||||||||||||
US Ultra Bond, 40 contracts (USD) | September 2017 | $ | 6,511,398 | $ | 6,634,999 | $ | 123,601 | ||||||||||||
10 Year US Treasury Notes, 84 contracts (USD) | September 2017 | 10,575,672 | 10,544,625 | (31,047 | ) | ||||||||||||||
US Treasury futures sell contracts: | |||||||||||||||||||
2 Year US Treasury Notes, 197 contracts (USD) | September 2017 | (42,637,801 | ) | (42,573,546 | ) | 64,255 | |||||||||||||
Index futures buy contracts: | |||||||||||||||||||
EURO STOXX 50 Index, 91 contracts (EUR) | September 2017 | 3,676,581 | 3,566,032 | (110,549 | ) | ||||||||||||||
Hong Kong Hang Seng China Enterprise Index, 106 contracts (HKD) | July 2017 | 6,950,508 | 6,920,761 | (29,747 | ) | ||||||||||||||
Russell 1000 Value Index, 694 contracts (USD) | September 2017 | 39,604,288 | 39,488,600 | (115,688 | ) | ||||||||||||||
TOPIX Index, 53 contracts (JPY) | September 2017 | 7,555,040 | 7,593,643 | 38,603 | |||||||||||||||
Index futures sell contracts: | |||||||||||||||||||
E-mini S&P 500 Index, 226 contracts (USD) | September 2017 | (27,440,411 | ) | (27,356,170 | ) | 84,241 | |||||||||||||
FTSE China A50 Index, 687 contracts (USD) | July 2017 | (7,796,172 | ) | (7,806,037 | ) | (9,865 | ) | ||||||||||||
Mini MSCI Emerging Markets Index, 124 contracts (USD) | September 2017 | (6,200,868 | ) | (6,251,460 | ) | (50,592 | ) | ||||||||||||
S&P/Toronto Stock Exchange 60 Index, 81 contracts (CAD) | September 2017 | (11,321,504 | ) | (11,108,144 | ) | 213,360 | |||||||||||||
Interest rate futures buy contracts: | |||||||||||||||||||
Canadian Government 10 Year Bond, 323 contracts (CAD) | September 2017 | 35,951,884 | 35,007,442 | (944,442 | ) | ||||||||||||||
Euro Schatz, 33 contracts (EUR) | September 2017 | 4,226,148 | 4,215,732 | (10,416 | ) | ||||||||||||||
Long Gilt, 46 contracts (GBP) | September 2017 | 7,634,727 | 7,523,238 | (111,489 | ) | ||||||||||||||
Interest rate futures sell contracts: | |||||||||||||||||||
Euro-Bund, 176 contracts (EUR) | September 2017 | (33,037,247 | ) | (32,538,848 | ) | 498,399 | |||||||||||||
10 Year Mini Japanese Government Bond, 21 contracts (JPY) | September 2017 | (2,808,629 | ) | (2,804,916 | ) | 3,713 | |||||||||||||
Net unrealized depreciation on futures contracts | $ | (387,663 | ) | ||||||||||||||||
33
UBS Global Allocation Fund
Portfolio of investments
June 30, 2017
Centrally cleared credit default swap agreements on credit indices—sell protection6
| Referenced obligation | Notional amount | Termination date | Payments made by the Fund7 | Value | Unrealized appreciation | Credit spread8 | |||||||||||||||||||||
CDX.EM. Series 27 Index | USD | 18,000,000 | 06/20/22 | 1.000 | % | $ | (817,998 | ) | $ | 92,450 | 2.013 | % | |||||||||||||||
CDX.NA.HY. Series 28 Index | USD | 23,000,000 | 06/20/22 | 5.000 | 1,622,132 | 208,593 | 3.388 | ||||||||||||||||||||
$ | 804,134 | $ | 301,043 | ||||||||||||||||||||||||
Options written activity for the year ended June 30, 2017 was as follows:
| Number of contracts | Premiums received | ||||||||||
Call and/or put options outstanding at June 30, 2016 | 891 | $ | 171,748 | ||||||||
Call and/or put options written | 158 | 126,005 | |||||||||
Call and/or put options terminated in closing purchase transactions | — | — | |||||||||
Call and/or put options expired prior to exercise | (1,049 | ) | (297,753 | ) | |||||||
Call and/or put options outstanding at June 30, 2017 | — | $ | — | ||||||||
Fair valuation summary
The following is a summary of the fair valuations according to the inputs used as of June 30, 2017 in valuing the Fund's investments. Certain investments that are measured at fair value using the net asset value per share practical expedient (or its equivalent) have not been classified in the fair value hierarchy. The fair value amounts presented in this table are intended to permit reconciliation to the amounts presented in the Portfolio of investments.
Description | Investments measured at fair value using the net asset value per share (or its equivalent) practical expedient | Unadjusted quoted prices in active markets for identical investments (Level 1) | Other significant observable inputs (Level 2) | Unobservable inputs (Level 3) | Total | ||||||||||||||||||
Assets | |||||||||||||||||||||||
Common stocks | $ | — | $ | 152,227,367 | $ | — | $ | — | $ | 152,227,367 | |||||||||||||
Non-U.S. government obligations | — | — | 23,600,151 | — | 23,600,151 | ||||||||||||||||||
U.S. treasury obligations | — | — | 17,253,127 | — | 17,253,127 | ||||||||||||||||||
Exchange traded funds | — | 30,558,172 | — | — | 30,558,172 | ||||||||||||||||||
Investment companies | 76,061,006 | — | — | — | 76,061,006 | ||||||||||||||||||
Short-term investment | — | 25,960,777 | — | — | 25,960,777 | ||||||||||||||||||
Investment of cash collateral from securities loaned | — | 16,889,087 | — | — | 16,889,087 | ||||||||||||||||||
Forward foreign currency contracts | — | — | 456,739 | — | 456,739 | ||||||||||||||||||
Futures contracts | — | 1,026,172 | — | — | 1,026,172 | ||||||||||||||||||
Swap agreements, at value | — | — | 1,622,132 | — | 1,622,132 | ||||||||||||||||||
Total | $ | 76,061,006 | $ | 226,661,575 | $ | 42,932,149 | $ | — | $ | 345,654,730 | |||||||||||||
Liabilities | |||||||||||||||||||||||
Forward foreign currency contracts | $ | — | $ | — | $ | (1,090,356 | ) | $ | — | $ | (1,090,356 | ) | |||||||||||
Futures contracts | — | (1,413,835 | ) | — | — | (1,413,835 | ) | ||||||||||||||||
Swap agreements, at value | — | — | (817,998 | ) | — | (817,998 | ) | ||||||||||||||||
Total | $ | — | $ | (1,413,835 | ) | $ | (1,908,354 | ) | $ | — | $ | (3,322,189 | ) | ||||||||||
34
UBS Global Allocation Fund
Portfolio of investments
June 30, 2017
At June 30, 2017, there were no transfers between Level 1 and Level 2. At June 30, 2016, $52,265,201 and $24,965,617 of short-term investments and investment of cash collateral from securities loaned, respectively, were classified within Level 2 and are now classified within Level 1 in accordance with the investment valuation leveling policy. At June 30, 2016, $81,454,809 of foreign investments, including futures contracts, and $(2,911,305) of futures contracts were classified within Level 2 of the fair value hierarchy pursuant to the Fund's fair valuation procedures for foreign portfolio holdings.
Portfolio footnotes
* Non-income producing security.
1 Security exempt from registration pursuant to Rule 144A under the Securities Act of 1933. These securities are considered liquid, unless noted otherwise, and may be resold in transactions exempt from registration, normally to qualified institutional buyers.
2 Security, or portion thereof, was on loan at the period end.
3 Security was purchased pursuant to Regulation S under the Securities Act of 1933, which exempts from registration securities offered and sold outside of the United States. Such a security cannot be sold in the United States without either an effective registration statement filed pursuant to the Securities Act of 1933, or pursuant to an exemption from registration.
4 Debt security whose principal and/or interest payments are adjusted for inflation, unlike debt securities that make fixed principal and interest payments. The interest rate paid by the securities is fixed, while the principal value rises or falls based on changes in an index. Thus, if inflation occurs, the principal and interest payments on the securities are adjusted accordingly to protect investors from inflationary loss. During a deflationary period, the principal and interest payments decrease, although the securities' principal amounts will not drop below their face amounts at maturity. In exchange for the inflation protection, the securities generally pay lower interest rates than typical government securities from the issuer's country. Only if inflation occurs will securities offer a higher real yield than a conventional security of the same maturity.
5 The table below details the Fund's investments in funds advised by the same Advisor as the Fund. The Advisor does not earn a management fee from the affiliated UBS Relationship Funds.
Security description | Value 06/30/16 | Purchases during the year ended 06/30/17 | Sales during the year ended 06/30/17 | Net realized gain during the year ended 06/30/17 | Change in net unrealized appreciation/ (depreciation) during the year ended 06/30/17 | Value 06/30/17 | Net income earned from affiliate for the year ended 06/30/17 | ||||||||||||||||||||||||
| UBS Global Corporate Bond Relationship Fund | $ | 40,307,836 | $ | 16,000,000 | $ | 6,500,000 | $ | 433,268 | $ | 1,340,115 | $ | 51,581,219 | $ | — | |||||||||||||||||
| UBS-HALO Emerging Markets Equity Relationship Fund | 27,386,277 | — | 10,000,000 | 924,575 | 6,168,935 | 24,479,787 | — | ||||||||||||||||||||||||
$ | 67,694,113 | $ | 16,000,000 | $ | 16,500,000 | $ | 1,357,843 | $ | 7,509,050 | $ | 76,061,006 | $ | — | ||||||||||||||||||
6 If the Fund is a seller of protection and a credit event occurs, as defined under the terms of that particular swap agreement, the Fund will either (i) pay to the buyer of protection an amount equal to the notional amount of the swap and take delivery of the referenced obligation or underlying securities comprising the referenced obligation or (ii) pay a net settlement amount in the form of cash or securities equal to the notional amount of the swap less the recovery value of the referenced obligation or underlying securities comprising the referenced obligation.
7 Payments made or received are based on the notional amount.
8 Credit spreads, represented in absolute terms, utilized in determining the market value as of period end serve as an indicator of the current status of the payment/performance risk and represent the likelihood or risk of default or other credit event occurring for the credit derivative. The credit spread of a particular referenced entity reflects the cost of buying/selling protection and may include upfront payments required to be made to enter into the agreement. Wider credit spreads represent a deterioration of the referenced entity's credit soundness and a greater likelihood or risk of default or other credit event occurring as defined under the terms of the agreement. A credit spread identified as "Defaulted" indicates a credit event has occurred for the referenced entity. Credit spreads are unaudited.
See accompanying notes to financial statements.
35
UBS International Sustainable Equity Fund
Portfolio performance
For the 12 months ended June 30, 2017, Class A shares of UBS International Sustainable Equity Fund (the "Fund") returned 21.43% (Class A shares returned 14.73% after the deduction of the maximum sales charge), while Class P shares returned 21.68%. The Fund's benchmark, the MSCI World ex USA Index (net) (the "Index"), returned 19.49%. (Class P shares have lower expenses than other share classes in the series. Returns for all share classes over various time periods are shown on page 38; please note that these returns do not reflect the deduction of taxes that a shareholder would pay on Fund distributions or the redemption of Fund shares, while the Index returns do not reflect the deduction of fees and expenses.)
The Fund posted a positive absolute return and outperformed its benchmark during the reporting period, due to a balanced combination of stock selection and sector allocation.
Portfolio performance summary1
What worked:
• Stock selection in the industrials, materials and financials sectors contributed the most to performance.
• Norsk Hydro is an aluminium manufacturer and renewable energy producer. The company benefited from higher growth expectations, as well as expectations of increased US infrastructure investments following Donald Trump's election. We closed our position in February 2017.
• Nordea Bank is a universal pan-Nordic bank with a diversified business model allowing for a low volatility in earnings. The management team increased the company's dividend distribution rate and currently offers a 12% return on equity, which is expected to improve due to additional cost cutting. A higher-than-expected capital ratio for the third quarter of 2016 improved investors' confidence in the company's dividend policy.
• Ping An Insurance is a China-based insurer and also a provider of financial services such as wealth management and credit card services. The company is increasing its footprint in Asia, reaching 131 million customers (up 20% in comparison with 2015). The profit per customer increased by 8% as overall revenues grew 11% in 2016.
• From a sector allocation perspective, an average overweight to the information technology and average underweight to the consumer staples sectors contributed to performance.
What didn't work:
• Stock selection in the energy and telecommunication services sectors detracted from performance during the reporting period.
• Santos Limited is a gas producer with operations in Australia, Papua New Guinea, Malaysia, Indonesia and Vietnam. Highly leveraged, the company suffered from the recent low oil price environment, but delivered on cost cutting and divestment in 2016. We continue to find the company attractive as it shows strong efforts to manage its environmental impact and performs well on safety metrics.
• KDDI Corp. provides a full range of telecommunication services in Japan, from fixed line to cellular. The company presented mixed results during the reporting period, as the number of subscribers declined. We continue to hold the company as, despite lower revenue due to pressure for lower tariff plans, we expect lower operating expenditures to lead to higher margins. We also expect a continued increase in its dividend pay-out.
1 For a detailed commentary on the market environment in general during the reporting period, see pages 3-4.
36
UBS International Sustainable Equity Fund
• Capita provides technology and back-office support solutions for businesses and public services. The UK-based company suffered from the "Brexit" vote and expectations of further cuts in public spending. We met with the new Chairman in October 2016 to understand the Board's view on its current challenges and its strategic position, which reaffirmed our positive longer-term outlook for the company.
• Sector allocations to health care (average overweight) and consumer discretionary (average underweight) were modest detractors to performance.
Portfolio highlights
• EasyJet is one of the largest and most successful low cost carriers in Europe. It has been taking market share and growing passenger count by 6% annually over the last four years, while also increasing margins and return on equity ("ROE"). Given the advantaged cost position of EasyJet, the fact that it currently has only a 9% share of the intra-European market, and that low cost carriers have about 30% of the market (up from 10% ten years ago), there is still plenty of share to win from the remainder of the market. EasyJet advantages include lower fleet costs due to superior asset utilization and efficiency, a strong brand that allows agility in fleet deployment and a very strong presence in primary airports. The company reports continued reductions in carbon emissions per passenger kilometer travelled due to efficiency improvements and ranks well in comparison with its peers. The company has also improved its relationship with its employees and customer engagement, as reflected by internal and third-party surveys.
• Koninklijke DSM is a specialty chemicals company involved in health, nutrition and materials. In 2016, it launched a portfolio restructuring which should result in a higher valuation as the company becomes more focused and transparent. As a result, their business mix has improved by moving out of their pharmaceutical and commodity chemicals businesses, which were lower return and slower growth units. Koninklijke DSM's valuation is attractive, given: (a) the company has now exited its low return commodities business and; (b) for the majority of the past several years, returns in the company's largest business, nutrition, were declining, but now look likely to expand, due to a combination of internal restructuring under a new Chief Financial Officer, and rising vitamin prices. Uplift from higher vitamin prices should become apparent appearing first in animal then in human nutrition. Koninklijke DSM products play a role in improving nutrition and also reducing pollution in materials. The group targets 40-45% greenhouse gas efficiency improvements and to source half of its energy from renewable energy sources by 2025.
• During the reporting period, we initiated several new positions, notably in Bank Central Asia, Sino Biopharmaceutical and Credit Agricole. We sold the Fund's positions in Astellas and Merck in the health care sector and NXP Semiconductor and ARM Holdings in the information technology sector.
This letter is intended to assist shareholders in understanding how the Fund performed during the 12 months ended June 30, 2017. The views and opinions in the letter were current as of August 18, 2017. They are not guarantees of future performance or investment results and should not be taken as investment advice. Investment decisions reflect a variety of factors, and we reserve the right to change our views about individual securities, sectors and markets at any time. As a result, the views expressed should not be relied upon as a forecast of the Fund's future investment intent. We encourage you to consult your financial advisor regarding your personal investment program.
Mutual funds are sold by prospectus only. You should read it carefully and consider a fund's investment objectives, risks, charges, expenses and other important information contained in the prospectus before investing. Prospectuses for most of our funds can be obtained from your financial advisor, by calling UBS Funds at 800-647 1568 or by visiting our website at www.ubs.com/am-us.
37
UBS International Sustainable Equity Fund
Average annual total returns for periods ended 06/30/17 (unaudited)
1 year | 5 years | 10 years | |||||||||||||
Before deducting maximum sales charge | |||||||||||||||
Class A1 | 21.43 | % | 9.39 | % | 1.45 | % | |||||||||
Class C2 | 20.56 | 8.58 | 0.70 | ||||||||||||
Class P3 | 21.68 | 9.68 | 1.70 | ||||||||||||
After deducting maximum sales charge | |||||||||||||||
Class A1 | 14.73 | % | 8.17 | % | 0.88 | % | |||||||||
Class C2 | 19.56 | 8.58 | 0.70 | ||||||||||||
MSCI World ex USA Index (net)4 | 19.49 | 8.15 | 1.00 | ||||||||||||
The annualized gross and net expense ratios, respectively, for each class of shares as in the October 28, 2016 prospectuses were as follows: Class A—2.37% and 1.25%; Class C—3.15% and 2.00%; Class P—2.12% and 1.00%. Net expenses reflect fee waivers and/or expense reimbursements, if any, pursuant to an agreement that is in effect to cap the expenses. UBS Asset Management (Americas) Inc., the Fund's investment advisor ("UBS AM (Americas)" or the "Advisor"), has agreed irrevocably to waive its fees and reimburse certain expenses (excluding expenses incurred through investment in other investment companies, interest, taxes, brokerage commissions and extraordinary expenses) so that the Fund's ordinary operating expenses (excluding expenses incurred through investment in other investment companies, interest, taxes, brokerage commissions and extraordinary expenses) do not exceed 1.25% for Class A shares, 2.00% for Class C shares and 1.00% for Class P shares. This fee waiver and expense arrangement may only be amended or terminated by shareholders.
1 Maximum sales charge for Class A shares is 5.5%. Class A shares bear ongoing 12b-1 service fees.
2 Maximum contingent deferred sales charge for Class C shares is 1% imposed on redemptions and is reduced to 0% after one year. Class C shares bear ongoing 12b-1 distribution and service fees.
3 Class P shares do not bear initial or contingent deferred sales charges or ongoing 12b-1 service and distribution fees, but Class P shares held through advisory programs may be subject to a program fee, which, if included, would have reduced performance.
4 The MSCI World ex USA Index (net) is a free float-adjusted market capitalization weighted index that is designed to measure the equity market performance of developed markets excluding the United States. Net total return indices reinvest dividends after the deduction of withholding taxes, using a tax rate applicable to non-resident institutional investors who do not benefit from double taxation treaties. The index is constructed and managed with a view to being fully investable from the perspective of international institutional investors. Investors should note that indices do not reflect the deduction of fees and expenses.
Prior to August 3, 2015, a 1% redemption fee was imposed on sales or exchanges of any class of shares of the Fund made during the specified holding period.
Past performance does not predict future performance, and the performance information provided does not reflect the deduction of taxes that a shareholder would pay on Fund distributions or the redemption of Fund shares. The return and principal value of an investment will fluctuate, so that an investor's shares, when redeemed, may be worth more or less than their original cost. Performance results assume reinvestment of all dividends and capital gain distributions at net asset value on the ex-dividend dates. Current performance may be higher or lower than the performance data quoted. For month-end performance figures, please visit www.ubs.com/us-mutualfundperformance.
38
UBS International Sustainable Equity Fund
Illustration of an assumed investment of $10,000 in Class A shares (adjusted for 5.5% maximum sales charge) and $5,000,000 in Class P shares (unaudited)
The following graph depict the performance of UBS International Sustainable Equity Fund Class A and Class P shares versus the MSCI World ex USA Index (net) over the 10 years ended June 30, 2017. The performance of Class C shares will vary based upon the different class specific expenses and sales charges. The performance provided does not reflect the deduction of taxes that a shareholder would pay on Fund distributions or the redemption of Fund shares. Past performance is no guarantee of future results. Share price and returns will vary with market conditions; investors may realize a gain or loss upon redemption.
UBS International Sustainable Equity Fund Class A vs. MSCI World ex USA Index (net)
Wealth value with dividends reinvested. Initial investment for Class A Shares as of June 30, 2007 = $9,450
The Fund's growth of an assumed $10,000 investment is adjusted for the maximum sales charge of 5.5%.

UBS International Sustainable Equity Fund Class P vs. MSCI World ex USA Index (net)
Wealth value with dividends reinvested. Initial investment for Class P shares as of June 30, 2007 = $5,000,000

Past performance does not predict future performance, and the performance information provided does not reflect the deduction of taxes that a shareholder would pay on Fund distributions or the redemption of Fund shares. The return and principal value of an investment will fluctuate, so that an investor's shares, when redeemed, may be worth more or less than their original cost. Performance results assume reinvestment of all dividends and capital gain distributions at net asset value on the ex-dividend dates. Current performance may be higher or lower than the performance data quoted. For month-end performance figures, please visit www.ubs.com/us-mutualfundperformance.
39
UBS International Sustainable Equity Fund
Portfolio statistics and industry diversification—June 30, 2017 (unaudited)1
Top ten holdings
| Percentage of net assets | |||||||
easyJet plc | 2.8 | % | |||||
Koninklijke DSM NV | 2.8 | ||||||
Zurich Insurance Group AG | 2.8 | ||||||
Ping An Insurance Group Co. of China Ltd., H Shares | 2.7 | ||||||
AP Moller—Maersk A/S, Class B | 2.7 | ||||||
Prudential plc | 2.6 | ||||||
Nordea Bank AB | 2.5 | ||||||
Credit Agricole SA | 2.4 | ||||||
Sumitomo Mitsui Financial Group, Inc. | 2.4 | ||||||
Mirvac Group, REIT | 2.4 | ||||||
Total | 26.1 | % | |||||
Top five issuer breakdown by country or territory of origin
| Percentage of net assets | |||||||
United Kingdom | 17.0 | % | |||||
Japan | 15.6 | ||||||
Netherlands | 9.4 | ||||||
Germany | 8.8 | ||||||
France | 7.9 | ||||||
Total | 58.7 | % | |||||
Common stocks | Percentage of net assets | ||||||
Airlines | 2.82 | % | |||||
Auto components | 1.22 | ||||||
Automobiles | 1.57 | ||||||
Banks | 12.92 | ||||||
Biotechnology | 2.12 | ||||||
Building products | 1.44 | ||||||
Chemicals | 7.42 | ||||||
Construction materials | 0.64 | ||||||
Diversified telecommunication services | 0.97 | ||||||
Electrical equipment | 1.46 | ||||||
Equity real estate investment trusts (REITs) | 2.34 | ||||||
Food & staples retailing | 0.73 | ||||||
Food products | 1.00 | ||||||
Health care equipment & supplies | 1.99 | ||||||
Household durables | 1.44 | ||||||
Household products | 2.28 | ||||||
Insurance | 11.24 | ||||||
IT services | 1.46 | ||||||
Machinery | 6.56 | ||||||
Marine | 2.65 | ||||||
Media | 1.99 | ||||||
Oil, gas & consumable fuels | 3.58 | ||||||
Personal products | 3.70 | ||||||
Pharmaceuticals | 5.64 | ||||||
Professional services | 1.38 | ||||||
Real estate management & development | 1.36 | ||||||
Semiconductors & semiconductor equipment | 4.23 | ||||||
Software | 5.63 | ||||||
Technology hardware, storage & peripherals | 0.99 | ||||||
Trading companies & distributors | 1.78 | ||||||
Water utilities | 1.06 | ||||||
Wireless telecommunication services | 1.90 | ||||||
Total common stocks | 97.51 | % | |||||
Short-term investment | 3.16 | ||||||
Investment of cash collateral from securities loaned | 0.02 | ||||||
Total investments | 100.69 | % | |||||
Liabilities, in excess of cash and other assets | (0.69 | ) | |||||
Net assets | 100.00 | % | |||||
1 The Fund's portfolio is actively managed and its composition will vary over time.
40
UBS International Sustainable Equity Fund
Portfolio of investments
June 30, 2017
Shares | Value | ||||||||||
Common stocks: 97.51% | |||||||||||
Australia: 3.66% | |||||||||||
Mirvac Group, REIT | 539,636 | $ | 883,448 | ||||||||
Santos Ltd.* | 215,274 | 501,342 | |||||||||
Total Australia common stocks | 1,384,790 | ||||||||||
Brazil: 1.06% | |||||||||||
Cia de Saneamento Basico do Estado de Sao Paulo* | 42,100 | 402,332 | |||||||||
Cayman Islands: 0.95% | |||||||||||
Sino Biopharmaceutical Ltd. | 407,000 | 359,695 | |||||||||
China: 2.70% | |||||||||||
Ping An Insurance Group Co. of China Ltd., H Shares | 155,000 | 1,021,428 | |||||||||
Denmark: 3.78% | |||||||||||
AP Moller—Maersk A/S, Class B | 498 | 1,001,301 | |||||||||
Novo Nordisk A/S, Class B | 9,969 | 426,914 | |||||||||
Total Denmark common stocks | 1,428,215 | ||||||||||
France: 7.86% | |||||||||||
AXA SA | 13,130 | 359,164 | |||||||||
Credit Agricole SA | 55,919 | 899,579 | |||||||||
Sanofi | 7,289 | 697,313 | |||||||||
Schneider Electric SE* | 7,200 | 553,194 | |||||||||
Valeo SA | 6,842 | 460,983 | |||||||||
Total France common stocks | 2,970,233 | ||||||||||
Germany: 8.78% | |||||||||||
Bayerische Motoren Werke AG | 6,409 | 594,973 | |||||||||
Carl Zeiss Meditec AG | 14,476 | 751,294 | |||||||||
Infineon Technologies AG | 26,361 | 556,550 | |||||||||
Jungheinrich AG (Preference) | 18,020 | 658,712 | |||||||||
SAP SE | 7,263 | 758,618 | |||||||||
Total Germany common stocks | 3,320,147 | ||||||||||
Hong Kong: 1.36% | |||||||||||
Sun Hung Kai Properties Ltd. | 35,000 | 514,188 | |||||||||
India: 2.92% | |||||||||||
ICICI Bank Ltd. ADR | 61,490 | 551,565 | |||||||||
Infosys Ltd. ADR | 36,700 | 551,234 | |||||||||
Total India common stocks | 1,102,799 | ||||||||||
Indonesia: 2.94% | |||||||||||
Bank Central Asia Tbk. PT | 635,900 | 866,578 | |||||||||
Indocement Tunggal Prakarsa Tbk. PT | 175,900 | 243,061 | |||||||||
Total Indonesia common stocks | 1,109,639 | ||||||||||
Japan: 15.57% | |||||||||||
Canon, Inc. | 11,000 | 373,203 | |||||||||
Kao Corp. | 9,100 | 539,811 | |||||||||
KDDI Corp. | 27,200 | 719,449 | |||||||||
Kubota Corp. | 35,900 | 602,456 | |||||||||
Nintendo Co. Ltd. | 2,400 | 804,019 | |||||||||
Panasonic Corp. | 40,100 | 543,342 | |||||||||
Shin-Etsu Chemical Co. Ltd. | 5,900 | 534,265 | |||||||||
Sumitomo Mitsui Financial Group, Inc. | 22,800 | 887,675 | |||||||||
Shares | Value | ||||||||||
THK Co. Ltd. | 19,000 | $ | 537,186 | ||||||||
Unicharm Corp. | 13,800 | 346,242 | |||||||||
Total Japan common stocks | 5,887,648 | ||||||||||
Jersey: 2.11% | |||||||||||
Shire plc | 14,484 | 799,485 | |||||||||
Netherlands: 9.41% | |||||||||||
| ASML Holding NV | 4,118 | 536,655 | |||||||||
Koninklijke Ahold Delhaize NV | 14,474 | 276,737 | |||||||||
Koninklijke DSM NV | 14,593 | 1,060,713 | |||||||||
LyondellBasell Industries NV, Class A | 9,733 | 821,368 | |||||||||
Unilever NV CVA | 15,589 | 860,336 | |||||||||
Total Netherlands common stocks | 3,555,809 | ||||||||||
Norway: 2.69% | |||||||||||
Statoil ASA1 | 39,236 | 650,428 | |||||||||
Telenor ASA | 22,172 | 367,818 | |||||||||
Total Norway common stocks | 1,018,246 | ||||||||||
South Korea: 1.34% | |||||||||||
SK Hynix, Inc. | 8,570 | 504,845 | |||||||||
Spain: 3.95% | |||||||||||
Banco Bilbao Vizcaya Argentaria SA | 88,990 | 738,414 | |||||||||
Mediaset Espana Comunicacion SA | 60,540 | 753,343 | |||||||||
Total Spain common stocks | 1,491,757 | ||||||||||
Sweden: 3.93% | |||||||||||
Assa Abloy AB, Class B | 24,781 | 544,466 | |||||||||
Nordea Bank AB | 73,895 | 940,276 | |||||||||
Total Sweden common stocks | 1,484,742 | ||||||||||
Switzerland: 4.47% | |||||||||||
Novartis AG | 3,300 | 274,627 | |||||||||
Roche Holding AG | 1,469 | 374,106 | |||||||||
Zurich Insurance Group AG | 3,576 | 1,040,840 | |||||||||
Total Switzerland common stocks | 1,689,573 | ||||||||||
Taiwan: 1.00% | |||||||||||
Uni-President Enterprises Corp. | 189,000 | 378,994 | |||||||||
United Kingdom: 17.03% | |||||||||||
Aon plc | 3,000 | 398,850 | |||||||||
Ashtead Group plc | 32,468 | 671,956 | |||||||||
Aviva plc | 65,224 | 446,842 | |||||||||
Capita plc | 57,850 | 521,023 | |||||||||
Croda International plc | 7,648 | 386,990 | |||||||||
easyJet plc | 60,109 | 1,063,947 | |||||||||
Prudential plc | 42,864 | 983,135 | |||||||||
Reckitt Benckiser Group plc | 5,092 | 516,241 | |||||||||
Sage Group plc (The) | 63,068 | 565,143 | |||||||||
Tullow Oil plc* | 103,415 | 202,982 | |||||||||
Weir Group plc (The) | 30,247 | 681,931 | |||||||||
Total United Kingdom common stocks | 6,439,040 | ||||||||||
| Total common stocks (cost $33,265,047) | 36,863,605 | ||||||||||
41
UBS International Sustainable Equity Fund
Portfolio of investments
June 30, 2017
Shares | Value | ||||||||||
Short-term investment: 3.16% | |||||||||||
Investment company: 3.16% | |||||||||||
| JPMorgan U.S. Government Money Market Fund, Capital Shares (cost $1,193,077) | 1,193,077 | $ | 1,193,077 | ||||||||
Investment of cash collateral from securities loaned: 0.02% | |||||||||||
| JPMorgan U.S. Government Money Market Fund, Capital Shares (cost $6,685) | 6,685 | 6,685 | |||||||||
| Total investments: 100.69% (cost $34,464,809) | 38,063,367 | ||||||||||
Liabilities, in excess of cash and other assets: (0.69)% | (259,868 | ) | |||||||||
Net assets: 100.00% | $ | 37,803,499 | |||||||||
Notes to portfolio of investments
Aggregate cost for federal income tax purposes was $34,889,103; and net unrealized appreciation consisted of:
Gross unrealized appreciation | $ | 4,043,642 | |||||
Gross unrealized depreciation | (869,378 | ) | |||||
Net unrealized appreciation of investments | $ | 3,174,264 | |||||
For a listing of defined portfolio acronyms, counterparty abbreviations and currency abbreviations that are used throughout the Portfolio of investments as well as the tables that follow, please refer to page 85. Portfolio footnotes begin on page 43.
Forward foreign currency contracts
Counterparty | Contracts to deliver | In exchange for | Maturity date | Unrealized depreciation | |||||||||||||||
JPMCB | USD | 45,885 | IDR | 610,758,704 | 07/03/17 | $ | (58 | ) | |||||||||||
42
UBS International Sustainable Equity Fund
Portfolio of investments
June 30, 2017
Fair valuation summary
The following is a summary of the fair valuations according to the inputs used as of June 30, 2017 in valuing the Fund's investments. In the event a Fund holds investments for which fair value is measured using the NAV per share practical expedient (or its equivalent), a separate column will be added to the fair value hierarchy table; this is intended to permit reconciliation to the amounts presented in the Portfolio of investments.
Description | Unadjusted quoted prices in active markets for identical investments (Level 1) | Other significant observable inputs (Level 2) | Unobservable inputs (Level 3) | Total | |||||||||||||||
Assets | |||||||||||||||||||
Common stocks | $ | 36,863,605 | $ | — | $ | — | $ | 36,863,605 | |||||||||||
Short-term investment | 1,193,077 | — | — | 1,193,077 | |||||||||||||||
Investment of cash collateral from securities loaned | 6,685 | — | — | 6,685 | |||||||||||||||
Total | $ | 38,063,367 | $ | — | $ | — | $ | 38,063,367 | |||||||||||
Liabilities | |||||||||||||||||||
Forward foreign currency contracts | $ | — | $ | (58 | ) | $ | — | $ | (58 | ) | |||||||||
At June 30, 2017, there were no transfers between Level 1 and Level 2. At June 30, 2016, $464,904 and $440,742 of short-term investments and investment of cash collateral from securities loaned, respectively, were classified within Level 2 and are now classified within Level 1 in accordance with the investment valuation leveling policy. At June 30, 2016, $21,825,231 of foreign investments were classified within Level 2 of the fair value hierarchy pursuant to the Fund's fair valuation procedures for foreign portfolio holdings.
Portfolio footnotes
* Non-income producing security.
1 Security, or portion thereof, was on loan at the period end.
See accompanying notes to financial statements.
43
UBS U.S. Large Cap Equity Fund
Portfolio performance
For the 12 months ended June 30, 2017, Class A shares of UBS U.S. Large Cap Equity Fund (the "Fund") returned 23.61% (Class A shares returned 16.82% after the deduction of the maximum sales charge), while Class P shares returned 23.87%. The Fund's benchmark, the Russell 1000 Index (the "Index"), returned 18.03% over the same time period. (Class P shares have lower expenses than other share classes of the Fund. Returns for all share classes over various time periods are shown on page 47; please note that the Fund's returns do not reflect the deduction of taxes that a shareholder would pay on Fund distributions or the redemption of Fund shares, while the Index returns do not reflect the deduction of fees and expenses.)
The Fund outperformed the Index primarily due to stock selection.
Portfolio performance summary1
What worked:
• Stock selection within information technology was a top contributor to performance during the 12 months ended June 30, 2017. The Fund benefited from exposure to semiconductors and to communications and electronic equipment.
– Micron Technology's outperformance was driven by its strong quarterly results and forward-looking guidance relative to market expectations. This has resulted from a continuingly balanced supply/demand environment in Flash memory, a type of computer hardware.
– Western Digital also benefited from the supply/demand dynamics in Flash memory, as well as from speculation that the company might participate in, or profit from, the pending sale of Toshiba's Flash memory business.
– Take-Two Interactive Software outperformed based on the overall strength of the videogame industry. We believe that videogame companies can grow faster than other areas of the entertainment industry due to more profitable digital downloads; increased genres, studios and platforms (including virtual reality, mobile and streaming); new engagement models (subscriptions, competitive gaming/"e-sports"); geographic growth (particularly in Asia and South America); multiplayer networked gaming; and the emergence of "e-sports" leagues.
• Certain health care stocks made a positive contribution to relative returns. Within health care, we remain overweight to biotechnology and health care providers, and underweight medical equipment.
– Shares of Bio-Rad traded higher during the 12 months as the market was pricing in the company's potential for increased margins in the attractive diagnostics area of healthcare, as well as future benefits from the rollout of its enterprise resource planning (ERP) system. (For details, see "Portfolio highlights.")
• The Fund benefited from other successful stock selection decisions across sectors.
– Caterpillar was one of the top contributors to Fund performance over the reporting period. The company benefited from increased margins, accelerating growth in resource industries and high business confidence. Growing Chinese infrastructure investments have been an additional tailwind that, combined with higher sales and operating leverage, resulted in increased revenue guidance for the full year. We sold out of the position after the stock price reached our estimate of intrinsic value.
1 For a detailed commentary on the market environment in general during the reporting period, see page 3-4.
44
UBS U.S. Large Cap Equity Fund
What didn't work:
• Stock selection in the consumer staples sector detracted from Fund returns.
– Kroger was one of the Fund's main underperforming positions during the 12-month period. Kroger's performance has been hampered by 18 months of food deflation, which makes it difficult to grow top-line sales and leverage the high fixed cost of running the business. We believe Kroger is a well-managed company at the forefront of using customer analytics to drive loyalty in a highly fragmented and low margin industry. Unfortunately, the planned purchase of Whole Foods by Amazon presents a threat to Kroger's market share. This violated our research thesis for owning the stock, so we sold out of the position.
• Several energy stocks made a negative contribution to performance. Energy continued to underperform based on concerns about excess supply and OPEC's ability to maintain discipline in the current low-price environment.
– We have repositioned the Fund to reduce exposure to the sector. Within energy, however, we are focused on exploration and production (E&P) companies with good acreage and less exposure to changing oil prices. Gulfport Energy underperformed for the 12 months, and we sold out of the stock.
– Oasis Petroleum is one of the company-specific opportunities we are pursuing in the Fund, while cautiously observing macroeconomic events. We continue to believe that global inventory trends will improve.
• Stock selection within the financial sector detracted from relative returns.
– Simon Property Group is a self-administered and self-managed real estate investment trust (REIT). The company owns, develops and manages retail real estate properties. Simon's stock price suffered from recent elevated fears about the future of "brick and mortar" retail. As the owner of some of the country's most productive regional malls, we believe Simon is strongly positioned to generate solid, high single-digit cash flow growth for the foreseeable future.
– Synchrony Financial lost 15.9% from its share price in a single day after missing earnings expectations. We believe that the sharp fall in price was an overreaction by the market, so we used this opportunity to add to our position. We have confidence in the company's ability to grow its loan book more rapidly than other card issuers, while simultaneously returning its industry-leading excess capital position to its shareholders over the next few years. (For details, see "Portfolio highlights.")
Portfolio highlights
• American Express is a global provider of credit card services. We believe the company will maintain its 20% return on equity (ROE) over the medium term, despite the increased competition in its core credit card issuance business. While increased competition could lead to weaker margins on discount revenues, we believe the strong secular global trend toward card usage and electronic transactions, and away from cash and check payment methods, will lead to solid top-line growth in coming years. In turn, we believe this should lead to stronger operating margins than is implied in current consensus estimates.
• Bio-Rad is a manufacturer and distributor of life science research and clinical diagnostics products. The company is under-earning as management invests in the rollout of its enterprise resource planning (ERP) system to streamline key areas of the business. We believe margins should increase significantly, driving earnings per share estimates well ahead of consensus. We also like the hidden value in Bio-Rad's ownership stake in Sartorius, a biotechnology filtration company.
45
UBS U.S. Large Cap Equity Fund
• Newell Brands is a marketer of consumer and commercial products. We believe the company's investments in capabilities across consumer insights, innovation and go-to-market, as well as a substantial step-up in brand spending, will positively impact top-line growth. This should lead to profitable share gains, higher margins and higher return on invested capital (ROIC). We believe the company's leading market share in several categories makes it well-placed to succeed across a highly fragmented competitor base. Additionally, we see opportunity for margin expansion from merger synergies.
• Mondelez International manufactures and markets snack food and beverage products worldwide. The company's cookies and chocolate products are experiencing strong category growth in developing markets. We believe Mondelez is well-positioned to benefit from its geographic exposure and strong operations in the BRICS countries (Brazil, Russia, India, China and South Africa), as well as in next-wave markets, such as Indonesia and the Middle East. In addition, we see potential for restructuring in the company's developed markets business, which represents an attractive opportunity to improve profit margins.
• Synchrony Financial is the largest private label supplier of credit cards in the US. We believe the company's excess capital position offers it a competitive advantage and the opportunity to return cash to shareholders. We also believe Synchrony should be able to generate high single-digit loan growth. The company continues to experience high retention rates among its private label customers. Additionally, we believe that given the company's strong capital position, it is well-equipped to weather any short-term uptick in charge offs driven by a weakening economy.
This letter is intended to assist shareholders in understanding how the Fund performed during the 12 months ended June 30, 2017. The views and opinions in the letter were current as of August 18, 2017. They are not guarantees of future performance or investment results and should not be taken as investment advice. Investment decisions reflect a variety of factors, and we reserve the right to change our views about individual securities, sectors and markets at any time. As a result, the views expressed should not be relied upon as a forecast of the Fund's future investment intent. We encourage you to consult your financial advisor regarding your personal investment program.
Mutual funds are sold by prospectus only. You should read it carefully and consider a fund's investment objectives, risks, charges, expenses and other important information contained in the prospectus before investing. Prospectuses for most of our funds can be obtained from your financial advisor, by calling UBS Funds at 800-647 1568 or by visiting our website at www.ubs.com/am-us.
46
UBS U.S. Large Cap Equity Fund
Average annual total returns for periods ended 06/30/17 (unaudited)
1 year | 5 years | 10 years | |||||||||||||
Before deducting maximum sales charge | |||||||||||||||
Class A1 | 23.61 | % | 15.30 | % | 5.71 | % | |||||||||
Class C2 | 22.63 | 14.44 | 4.92 | ||||||||||||
Class P3 | 23.87 | 15.58 | 5.98 | ||||||||||||
After deducting maximum sales charge | |||||||||||||||
Class A1 | 16.82 | % | 14.00 | % | 5.11 | % | |||||||||
Class C2 | 21.63 | 14.44 | 4.92 | ||||||||||||
Russell 1000 Index4 | 18.03 | 14.67 | 7.29 | ||||||||||||
The annualized gross and net expense ratios, respectively, for each class of shares as in the October 28, 2016 prospectuses, supplemented from time to time, were as follows: Class A—1.93% and 0.95%; Class C—2.68% and 1.70%; Class P—1.64% and 0.70%. Net expenses reflect fee waivers and/or expense reimbursements, if any, pursuant to an agreement that is in effect to cap the expenses. Effective March 23, 2016, the Trust, with respect to the Fund, and UBS Asset Management (Americas) Inc., the Fund's investment advisor ("UBS AM (Americas)" or the "Advisor"), have entered into a written agreement pursuant to which the Advisor has agreed to waive a portion of its management fees and/or to reimburse expenses (excluding expenses incurred through investment in other investment companies, interest, taxes, brokerage commissions and extraordinary expenses) to the extent necessary so that the Fund's ordinary operating expenses (excluding expenses incurred through investment in other investment companies, interest, taxes, brokerage commissions and extraordinary expenses), through the period ending October 27, 2017, do not exceed 0.95% for Class A shares, 1.70% for Class C shares and 0.70% for Class P shares. Pursuant to the written agreement, the Advisor is entitled to be reimbursed for any fees it waives and expenses it reimburses to the extent such reimbursement can be made during the three years following the period during which such fee waivers and expense reimbursements were made, provided that the reimbursement of the Advisor by the Fund will not cause the Fund to exceed any applicable expense limit that is in place for the Fund. The fee waiver/expense reimbursement agreement may be terminated by the Fund's Board of Trustees at any time and also will terminate automatically upon the expiration or termination of the Fund's advisory contract with the Advisor. Upon termination of the fee waiver/expense reimbursement agreement, however, UBS AM (Americas)'s three year recoupment rights will survive.
1 Maximum sales charge for Class A shares is 5.5%. Class A shares bear ongoing 12b-1 service fees.
2 Maximum contingent deferred sales charge for Class C shares is 1% imposed on redemptions and is reduced to 0% after one year. Class C shares bear ongoing 12b-1 distribution and service fees.
3 Class P shares do not bear initial or contingent deferred sales charges or ongoing 12b-1 service and distribution fees, but Class P shares held through advisory programs may be subject to a program fee, which, if included, would have reduced performance.
4 The Russell 1000 Index is designed to measure the performance of the large-cap segment of the US equity universe. It is a subset of the Russell 3000 Index and includes approximately 1,000 of the largest securities based on a combination of their market cap and current index membership. The Russell 1000 Index is constructed to provide a comprehensive and unbiased barometer for the large-cap segment and is completely reconstituted annually to ensure new and growing equities are reflected. Investors should note that indices do not reflect the deduction of fees and expenses.
Prior to August 3, 2015, a 1% redemption fee was imposed on sales or exchanges of any class of shares of the Fund made during the specified holding period.
Past performance does not predict future performance, and the performance information provided does not reflect the deduction of taxes that a shareholder would pay on Fund distributions or the redemption of Fund shares. The return and principal value of an investment will fluctuate, so that an investor's shares, when redeemed, may be worth more or less than their original cost. Performance results assume reinvestment of all dividends and capital gain distributions at net asset value on the ex-dividend dates. Current performance may be higher or lower than the performance data quoted. For month-end performance figures, please visit www.ubs.com/us-mutualfundperformance.
47
UBS U.S. Large Cap Equity Fund
Illustration of an assumed investment of $10,000 in Class A shares (adjusted for 5.5% maximum sales charge) and $5,000,000 in Class P shares (unaudited)
The following two graphs depict the performance of UBS U.S. Large Cap Equity Fund Class A and Class P shares versus the Russell 1000 Index over the 10 years ended June 30, 2017. The performance of Class C shares will vary based upon the different class specific expenses and sales charges. The performance provided does not reflect the deduction of taxes that a shareholder would pay on Fund distributions or the redemption of Fund shares. Past performance is no guarantee of future results. Share price and returns will vary with market conditions; investors may realize a gain or loss upon redemption.
UBS U.S. Large Cap Equity Fund Class A vs. Russell 1000 Index
Wealth value with dividends reinvested. Initial investment for Class A Shares as of June 30, 2007 = $9,450
The Fund's growth of an assumed $10,000 investment is adjusted for the maximum sales charge of 5.5%.

UBS U.S. Large Cap Equity Fund Class P vs. Russell 1000 Index
Wealth value with dividends reinvested. Initial investment for Class P shares as of June 30, 2007 = $5,000,000
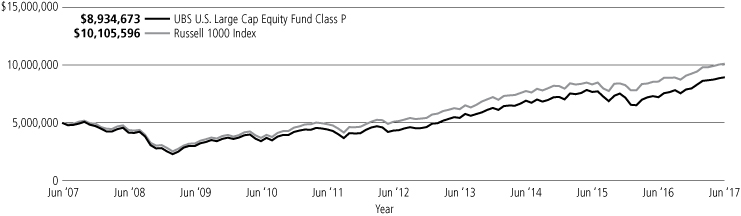
Past performance does not predict future performance, and the performance information provided does not reflect the deduction of taxes that a shareholder would pay on Fund distributions or the redemption of Fund shares. The return and principal value of an investment will fluctuate, so that an investor's shares, when redeemed, may be worth more or less than their original cost. Performance results assume reinvestment of all dividends and capital gain distributions at net asset value on the ex-dividend dates. Current performance may be higher or lower than the performance data quoted. For month-end performance figures, please visit www.ubs.com/us-mutualfundperformance.
48
UBS U.S. Large Cap Equity Fund
Portfolio statistics and industry diversification—June 30, 2017 (unaudited)1
Top ten holdings
| Percentage of net assets | |||||||
Philip Morris International, Inc. | 4.1 | % | |||||
Amazon.com, Inc. | 3.0 | ||||||
Marsh & McLennan Cos., Inc. | 2.9 | ||||||
Facebook, Inc., Class A | 2.8 | ||||||
JPMorgan Chase & Co. | 2.6 | ||||||
Newell Brands, Inc. | 2.4 | ||||||
Wells Fargo & Co. | 2.2 | ||||||
American Express Co. | 2.2 | ||||||
Synchrony Financial | 2.2 | ||||||
Visa, Inc., Class A | 2.2 | ||||||
Total | 26.6 | % | |||||
Top five issuer breakdown by country or territory of origin
| Percentage of net assets | |||||||
United States | 89.8 | % | |||||
Ireland | 4.1 | ||||||
Bermuda | 2.7 | ||||||
Netherlands | 2.0 | ||||||
Jersey | 1.3 | ||||||
Total | 99.9 | % | |||||
Common stocks | Percentage of net assets | ||||||
Aerospace & defense | 4.01 | % | |||||
Auto components | 1.30 | ||||||
Automobiles | 1.45 | ||||||
Banks | 4.83 | ||||||
Beverages | 1.96 | ||||||
Biotechnology | 5.73 | ||||||
Building products | 1.62 | ||||||
Chemicals | 1.45 | ||||||
Communications equipment | 0.76 | ||||||
Consumer finance | 4.40 | ||||||
Distributors | 1.21 | ||||||
Diversified financial services | 1.87 | ||||||
Electronic equipment, instruments & components | 1.28 | ||||||
Equity real estate investment trusts (REITs) | 1.82 | ||||||
Food & staples retailing | 1.70 | ||||||
Food products | 2.13 | ||||||
Health care equipment & supplies | 0.55 | ||||||
Health care providers & services | 4.98 | ||||||
Hotels, restaurants & leisure | 1.20 | ||||||
Household durables | 3.86 | ||||||
Insurance | 6.09 | ||||||
Internet & direct marketing retail | 4.34 | ||||||
Internet software & services | 2.78 | ||||||
IT services | 2.16 | ||||||
Life sciences tools & services | 1.65 | ||||||
Machinery | 1.28 | ||||||
Media | 3.34 | ||||||
Oil, gas & consumable fuels | 5.76 | ||||||
Pharmaceuticals | 4.64 | ||||||
Semiconductors & semiconductor equipment | 8.14 | ||||||
Software | 3.91 | ||||||
Specialty retail | 1.16 | ||||||
Technology hardware, storage & peripherals | 1.79 | ||||||
Tobacco | 4.15 | ||||||
Wireless telecommunication services | 1.20 | ||||||
Total common stocks | 100.50 | % | |||||
Short-term investment | 1.16 | ||||||
Investment of cash collateral from securities loaned | 2.47 | ||||||
Total investments | 104.13 | % | |||||
Liabilities, in excess of cash and other assets | (4.13 | ) | |||||
Net assets | 100.00 | % | |||||
1 The Fund's portfolio is actively managed and its composition will vary over time.
49
UBS U.S. Large Cap Equity Fund
Portfolio of investments
June 30, 2017
Shares | Value | ||||||||||
Common stocks: 100.50% | |||||||||||
Aerospace & defense: 4.01% | |||||||||||
Spirit AeroSystems Holdings, Inc., Class A | 10,719 | $ | 621,059 | ||||||||
United Technologies Corp. | 4,975 | 607,497 | |||||||||
1,228,556 | |||||||||||
Auto components: 1.30% | |||||||||||
Delphi Automotive plc | 4,540 | 397,931 | |||||||||
Automobiles: 1.45% | |||||||||||
General Motors Co. | 12,718 | 444,240 | |||||||||
Banks: 4.83% | |||||||||||
JPMorgan Chase & Co. | 8,665 | 791,981 | |||||||||
Wells Fargo & Co. | 12,378 | 685,865 | |||||||||
1,477,846 | |||||||||||
Beverages: 1.96% | |||||||||||
PepsiCo, Inc. | 5,191 | 599,509 | |||||||||
Biotechnology: 5.73% | |||||||||||
Alnylam Pharmaceuticals, Inc.* | 3,863 | 308,113 | |||||||||
Celgene Corp.* | 3,747 | 486,623 | |||||||||
Coherus Biosciences, Inc.* | 8,024 | 115,144 | |||||||||
Emergent BioSolutions, Inc.* | 3,798 | 128,790 | |||||||||
Incyte Corp.* | 2,726 | 343,231 | |||||||||
Ironwood Pharmaceuticals, Inc.* | 8,691 | 164,086 | |||||||||
Lexicon Pharmaceuticals, Inc.*,1 | 12,692 | 208,783 | |||||||||
1,754,770 | |||||||||||
Building products: 1.62% | |||||||||||
Allegion plc | 6,100 | 494,832 | |||||||||
Chemicals: 1.45% | |||||||||||
LyondellBasell Industries NV, Class A | 5,260 | 443,891 | |||||||||
Communications equipment: 0.76% | |||||||||||
Arista Networks, Inc.* | 1,559 | 233,523 | |||||||||
Consumer finance: 4.40% | |||||||||||
American Express Co. | 8,122 | 684,197 | |||||||||
Synchrony Financial | 22,269 | 664,062 | |||||||||
1,348,259 | |||||||||||
Distributors: 1.21% | |||||||||||
LKQ Corp.* | 11,292 | 372,071 | |||||||||
Diversified financial services: 1.87% | |||||||||||
Voya Financial, Inc. | 15,544 | 573,418 | |||||||||
Electronic equipment, instruments & components: 1.28% | |||||||||||
Flex Ltd.* | 11,100 | 181,041 | |||||||||
Jabil, Inc. | 7,280 | 212,503 | |||||||||
393,544 | |||||||||||
Equity real estate investment trusts (REITs): 1.82% | |||||||||||
Simon Property Group, Inc. | 3,438 | 556,131 | |||||||||
Shares | Value | ||||||||||
Food & staples retailing: 1.70% | |||||||||||
Walgreens Boots Alliance, Inc. | 6,638 | $ | 519,822 | ||||||||
Food products: 2.13% | |||||||||||
Mondelez International, Inc., Class A | 15,079 | 651,262 | |||||||||
Health care equipment & supplies: 0.55% | |||||||||||
Wright Medical Group NV* | 6,158 | 169,283 | |||||||||
Health care providers & services: 4.98% | |||||||||||
Cigna Corp. | 2,301 | 385,164 | |||||||||
Laboratory Corp. of America Holdings* | 3,823 | 589,277 | |||||||||
UnitedHealth Group, Inc. | 2,966 | 549,956 | |||||||||
1,524,397 | |||||||||||
Hotels, restaurants & leisure: 1.20% | |||||||||||
Norwegian Cruise Line Holdings Ltd.* | 6,771 | 367,598 | |||||||||
Household durables: 3.86% | |||||||||||
Lennar Corp., Class A | 8,438 | 449,914 | |||||||||
Newell Brands, Inc. | 13,652 | 732,020 | |||||||||
1,181,934 | |||||||||||
Insurance: 6.09% | |||||||||||
Allstate Corp. (The) | 4,022 | 355,705 | |||||||||
Marsh & McLennan Cos., Inc. | 11,303 | 881,182 | |||||||||
MetLife, Inc. | 11,421 | 627,470 | |||||||||
1,864,357 | |||||||||||
Internet & direct marketing retail: 4.34% | |||||||||||
Amazon.com, Inc.* | 951 | 920,568 | |||||||||
Expedia, Inc. | 2,742 | 408,421 | |||||||||
1,328,989 | |||||||||||
Internet software & services: 2.78% | |||||||||||
Facebook, Inc., Class A* | 5,636 | 850,923 | |||||||||
IT services: 2.16% | |||||||||||
Visa, Inc., Class A | 7,056 | 661,712 | |||||||||
Life sciences tools & services: 1.65% | |||||||||||
Bio-Rad Laboratories, Inc., Class A* | 2,229 | 504,445 | |||||||||
Machinery: 1.28% | |||||||||||
Wabtec Corp.1 | 4,301 | 393,542 | |||||||||
Media: 3.34% | |||||||||||
CBS Corp. (Non-Voting), Class B | 7,673 | 489,384 | |||||||||
Walt Disney Co. (The) | 5,012 | 532,525 | |||||||||
1,021,909 | |||||||||||
Oil, gas & consumable fuels: 5.76% | |||||||||||
Delek US Holdings, Inc. | 13,748 | 363,497 | |||||||||
EOG Resources, Inc. | 6,417 | 580,867 | |||||||||
Hess Corp. | 7,468 | 327,621 | |||||||||
Noble Energy, Inc. | 8,511 | 240,861 | |||||||||
Oasis Petroleum, Inc.* | 31,190 | 251,080 | |||||||||
1,763,926 | |||||||||||
50
UBS U.S. Large Cap Equity Fund
Portfolio of investments
June 30, 2017
Shares | Value | ||||||||||
Common stocks—(Concluded) | |||||||||||
Pharmaceuticals: 4.64% | |||||||||||
Allergan plc | 1,984 | $ | 482,291 | ||||||||
Eli Lilly & Co. | 6,178 | 508,449 | |||||||||
Mallinckrodt plc* | 6,194 | 277,553 | |||||||||
Medicines Co. (The)*,1 | 4,026 | 153,028 | |||||||||
1,421,321 | |||||||||||
Semiconductors & semiconductor equipment: 8.14% | |||||||||||
Applied Materials, Inc. | 6,952 | 287,187 | |||||||||
Cirrus Logic, Inc.* | 3,327 | 208,670 | |||||||||
Lam Research Corp. | 1,755 | 248,210 | |||||||||
Marvell Technology Group Ltd. | 27,669 | 457,092 | |||||||||
Micron Technology, Inc.* | 16,498 | 492,630 | |||||||||
Microsemi Corp.* | 4,324 | 202,363 | |||||||||
ON Semiconductor Corp.* | 14,805 | 207,862 | |||||||||
Qorvo, Inc.* | 2,872 | 181,855 | |||||||||
Skyworks Solutions, Inc. | 2,141 | 205,429 | |||||||||
2,491,298 | |||||||||||
Software: 3.91% | |||||||||||
Activision Blizzard, Inc. | 4,094 | 235,692 | |||||||||
Electronic Arts, Inc.* | 2,142 | 226,452 | |||||||||
PTC, Inc.* | 6,394 | 352,437 | |||||||||
Take-Two Interactive Software, Inc.* | 2,616 | 191,962 | |||||||||
Ultimate Software Group, Inc. (The)* | 916 | 192,415 | |||||||||
1,198,958 | |||||||||||
Shares | Value | ||||||||||
Specialty retail: 1.16% | |||||||||||
TJX Cos., Inc. (The) | 4,938 | $ | 356,375 | ||||||||
Technology hardware, storage & peripherals: 1.79% | |||||||||||
Western Digital Corp. | 6,181 | 547,637 | |||||||||
Tobacco: 4.15% | |||||||||||
Philip Morris International, Inc. | 10,813 | 1,269,987 | |||||||||
Wireless telecommunication services: 1.20% | |||||||||||
T-Mobile US, Inc.* | 6,043 | 366,327 | |||||||||
| Total common stocks (cost $26,418,638) | 30,774,523 | ||||||||||
Short-term investment: 1.16% | |||||||||||
Investment company: 1.16% | |||||||||||
| JPMorgan U.S. Government Money Market Fund, Capital Shares (cost $353,772) | 353,772 | 353,772 | |||||||||
Investment of cash collateral from securities loaned: 2.47% | |||||||||||
| JPMorgan U.S. Government Money Market Fund, Capital Shares (cost $756,972) | 756,972 | 756,972 | |||||||||
| Total investments: 104.13% (cost $27,529,382) | 31,885,267 | ||||||||||
Liabilities, in excess of cash and other assets: (4.13)% | (1,265,460 | ) | |||||||||
Net assets: 100.00% | $ | 30,619,807 | |||||||||
Notes to portfolio of investments
Aggregate cost for federal income tax purposes was $27,718,614; and net unrealized appreciation consisted of:
Gross unrealized appreciation | $ | 4,673,658 | |||||
Gross unrealized depreciation | (507,005 | ) | |||||
Net unrealized appreciation of investments | $ | 4,166,653 | |||||
For a listing of defined portfolio acronyms, counterparty abbreviations and currency abbreviations that are used throughout the Portfolio of investments as well as the tables that follow, please refer to page 85. Portfolio footnotes begin on page 52.
51
UBS U.S. Large Cap Equity Fund
Portfolio of investments
June 30, 2017
Fair valuation summary
The following is a summary of the fair valuations according to the inputs used as of June 30, 2017 in valuing the Fund's investments. In the event a Fund holds investments for which fair value is measured using the NAV per share practical expedient (or its equivalent), a separate column will be added to the fair value hierarchy table; this is intended to permit reconciliation to the amounts presented in the Portfolio of investments.
Description | Unadjusted quoted prices in active markets for identical investments (Level 1) | Other significant observable inputs (Level 2) | Unobservable inputs (Level 3) | Total | |||||||||||||||
Assets | |||||||||||||||||||
Common stocks | $ | 30,774,523 | $ | — | $ | — | $ | 30,774,523 | |||||||||||
Short-term investment | 353,772 | — | — | 353,772 | |||||||||||||||
Investment of cash collateral from securities loaned | 756,972 | — | — | 756,972 | |||||||||||||||
Total | $ | 31,885,267 | $ | — | $ | — | $ | 31,885,267 | |||||||||||
At June 30, 2017, there were no transfers between Level 1 and Level 2. At June 30, 2016, $1,545,341 of investment of cash collateral from securities loaned were classified within Level 2 and are now classified within Level 1 in accordance with the investment valuation leveling policy.
Portfolio footnotes
* Non-income producing security.
1 Security, or portion thereof, was on loan at the period end.
See accompanying notes to financial statements.
52
UBS U.S. Small Cap Growth Fund
Portfolio performance
For the 12 months ended June 30, 2017, Class A shares of UBS U.S. Small Cap Growth Fund (the "Fund") returned 23.75% (Class A shares returned 16.97% after the deduction of the maximum sales charge), while Class P shares returned 24.09%. The Fund's benchmark, the Russell 2000 Growth Index (the "Index"), returned 24.40% over the same time period. (Class P shares have lower expenses than other share classes of the Fund. Returns for all share classes over various time periods are shown on page 55; please note that the Fund's returns do not reflect the deduction of taxes that a shareholder would pay on Fund distributions or the redemption of Fund shares, while the Index returns do not reflect the deduction of fees and expenses.)
The Fund underperformed the Index primarily due to sector and industry allocation decisions.
Portfolio performance summary1
What worked:
• Stock selection within the healthcare sector, as well as the Fund's overweight allocation to banks, contributed positively to performance during the 12 months ended June 30, 2017.
– Exact Sciences, a company focused on commercializing a non-invasive molecular screening test for the early detection and prevention of colorectal cancer, outperformed for the 12-month period. The company reported first quarter 2017 test volumes and revenues that exceeded consensus estimates and provided a significant increase in annual guidance for both metrics. The stock also rose in response to UnitedHealthcare's decision to cover Exact Sciences' Cologuard fecal DNA test on an interval of once every three years for individuals aged 50-75 years. (For details, see "Portfolio highlights.")
– Shares of Loxo Oncology, a cancer drug development and research company, traded higher, particularly after the company reported positive trial results in TRK-fusion cancer patients at the annual meeting of the American Society of Clinical Oncology in early June 2017.
– ZELTIQ Aesthetics offers non-invasive, FDA-cleared procedures for eliminating body fat. ZELTIQ was acquired by Allergan during the reporting period, and the Fund subsequently sold its shares.
• Several information technology names were positive for performance during the period.
– Wix.com, a web-platform operator and developer, posted strong gains based on accelerating fundamentals. The stock price increased more than 50% during the first half of 2017. (For details, see "Portfolio highlights.")
– Universal Display Corporation is a manufacturer of emitters and materials supporting organic light-emitting diodes display technology. The stock outperformed after reporting first quarter 2017 results that beat consensus expectations. In addition, Universal Display's management raised its guidance for 2017 driven by increasing AMOLED display capacity plans and continued momentum ahead of the iPhone 8 launch. (For details, see "Portfolio highlights.")
What didn't work:
• The Fund's allocation to the energy sector, as well as certain information technology stocks, contributed negatively to performance.
– Synchronoss Technologies is a provider of e-commerce transaction management solutions to the communications services market. Shares fell after the company preannounced disappointing first quarter 2017 results, as well as the departure of the recently appointed Chief Executive Officer and Chief Financial Officer. We closed our position in the company prior to the end of the reporting period.
1 For a detailed commentary on the market environment in general during the reporting period, see pages 3-4.
53
UBS U.S. Small Cap Growth Fund
– 8x8 Inc. provides internet protocol voice, video and data communications technologies to small and midsized businesses. Shares underperformed on concerns about increased competition. We continue to believe 8x8 is well-positioned, and remain overweight. (For details, see "Portfolio highlights.")
• A handful of other stock selection decisions detracted from the Fund's performance during the 12 months ended June 30, 2017.
– The Finish Line, a retailer of athletic apparel and footwear, saw its shares decline during the first half of 2017 after the company reported disappointing sales and earnings.
– The stock price of IMAX, an end-to-end cinematic solution containing proprietary software, theater architecture and equipment, declined in response to weak box office sales.
– Envision Healthcare provides health care services, including physician-led and ambulatory surgery center management and transportation. Shares fell on softer-than-expected fourth quarter 2016 results and initial 2017 guidance.
Portfolio highlights
• Exact Sciences is a molecular diagnostics company focusing on the early detection and prevention of colorectal cancer. The company has exclusive intellectual property protecting its non-invasive, molecular screening technology for the detection of colorectal cancer, Cologuard. We believe Exact Sciences is in the midst of a positive inflection with Cologuard uptake increasing.
• Wix.com is a web platform that offers solutions for developing customized websites and applications. The company is experiencing rapid growth, driven by the continued move online by small and medium-sized businesses (SMBs). Websites are crucial for all businesses today, and Wix.com provides SMBs with an easy-to-use web design solution that also incorporates e-commerce capabilities.
• Universal Display Corporation is a leader in the research, development and commercialization of organic light-emitting diode technologies and materials. We remain positive regarding the company's expected industry shipments and the overall increase in OLED manufacturing in 2017.
• Ollie's Bargain Outlet operates a chain of retail stores, primarily in the eastern U.S., that offer brand name products at discounted and closeout prices. Ollie's seeks to deliver sustainable earnings growth in the high teens by growing its square footage by 15% or more annually and driving flat to slightly positive same store sales growth. As the company continues to grow its scale, it is able to procure a greater selection and volume of closeouts from a variety of manufacturers and retail stores.
• 8x8 Inc. is one of the leading providers of unified communications as a service. The company's cloud-based solutions enable communications and collaboration on a platform that includes voice, video, contact center and desktop. 8x8's solutions allow enterprises to easily deploy and scale their communications platforms without large upfront expenses.
This letter is intended to assist shareholders in understanding how the Fund performed during the 12 months ended June 30, 2017. The views and opinions in the letter were current as of August 18, 2017. They are not guarantees of future performance or investment results and should not be taken as investment advice. Investment decisions reflect a variety of factors, and we reserve the right to change our views about individual securities, sectors and markets at any time. As a result, the views expressed should not be relied upon as a forecast of the Fund's future investment intent. We encourage you to consult your financial advisor regarding your personal investment program.
Mutual funds are sold by prospectus only. You should read it carefully and consider a fund's investment objectives, risks, charges, expenses and other important information contained in the prospectus before investing. Prospectuses for most of our funds can be obtained from your financial advisor, by calling UBS Funds at 800-647 1568 or by visiting our website at www.ubs.com/am-us.
54
UBS U.S. Small Cap Growth Fund
Average annual total returns for periods ended 06/30/17 (unaudited)
1 year | 5 years | 10 years | |||||||||||||
Before deducting maximum sales charge | |||||||||||||||
Class A1 | 23.75 | % | 13.03 | % | 7.25 | % | |||||||||
Class C2 | 22.77 | 12.18 | 6.45 | ||||||||||||
Class P3 | 24.09 | 13.35 | 7.54 | ||||||||||||
After deducting maximum sales charge | |||||||||||||||
Class A1 | 16.97 | % | 11.76 | % | 6.65 | % | |||||||||
Class C2 | 21.77 | 12.18 | 6.45 | ||||||||||||
Russell 2000 Growth Index4 | 24.40 | 13.98 | 7.82 | ||||||||||||
The annualized gross and net expense ratios, respectively, for each class of shares as in the October 28, 2016 prospectuses were as follows: Class A—1.54% and 1.25%; Class C—2.29% and 2.00%; Class P—1.18% and 1.00%. Net expenses reflect fee waivers and/or expense reimbursements, if any, pursuant to an agreement that is in effect to cap the expenses. The Trust, with respect to the Fund, and UBS Asset Management (Americas) Inc. the Fund's investment advisor ("UBS AM (Americas)" or the "Advisor"), have entered into a written agreement pursuant to which the Advisor has agreed to waive a portion of its management fees and/or to reimburse expenses (excluding expenses incurred through investment in other investment companies, interest, taxes, brokerage commissions, extraordinary expenses, and dividend expense and security loan fees for securities sold short) to the extent necessary so that the Fund's ordinary operating expenses (excluding expenses incurred through investment in other investment companies, interest, taxes, brokerage commissions, extraordinary expenses, and dividend expense and security loan fees for securities sold short), through the period ending October 27, 2017, do not exceed 1.24% for Class A shares, 1.99% for Class C shares and 0.99% for Class P shares. Pursuant to the written agreement, the Advisor is entitled to be reimbursed for any fees it waives and expenses it reimburses to the extent such reimbursement can be made during the three years following the period during which such fee waivers and expense reimbursements were made, provided that the reimbursement of the Advisor by the Fund will not cause the Fund to exceed any applicable expense limit that is in place for the Fund. The fee waiver/expense reimbursement agreement may be terminated by the Fund's Board of Trustees at any time and also will terminate automatically upon the expiration or termination of the Fund's advisory contract with the Advisor. Upon termination of the fee waiver/expense reimbursement agreement, however, UBS AM (Americas)'s three year recoupment rights will survive.
1 Maximum sales charge for Class A shares is 5.5%. Class A shares bear ongoing 12b-1 service fees.
2 Maximum contingent deferred sales charge for Class C shares is 1% imposed on redemptions and is reduced to 0% after one year. Class C shares bear ongoing 12b-1 distribution and service fees.
3 Class P shares do not bear initial or contingent deferred sales charges or ongoing 12b-1 service and distribution fees, but Class P shares held through advisory programs may be subject to a program fee, which, if included, would have reduced performance.
4 The Russell 2000 Growth Index measures the performance of the small-cap growth segment of the US equity universe. It includes those Russell 2000 Index companies with higher price-to-book ratios and higher forecasted growth values. The Russell 2000 Growth Index is constructed to provide a comprehensive and unbiased barometer for the small-cap growth segment. The Index is completely reconstituted annually to ensure larger stocks do not distort the performance and characteristics of the true small-cap opportunity set and that the represented companies continue to reflect growth characteristics. Investors should note that indices do not reflect the deduction of fees and expenses.
Prior to August 3, 2015, a 1% redemption fee was imposed on sales or exchanges of any class of shares of the Fund made during the specified holding period.
The Fund invests in IPOs which may have a magnified impact on performance.
Past performance does not predict future performance, and the performance information provided does not reflect the deduction of taxes that a shareholder would pay on Fund distributions or the redemption of Fund shares. The return and principal value of an investment will fluctuate, so that an investor's shares, when redeemed, may be worth more or less than their original cost. Performance results assume reinvestment of all dividends and capital gain distributions at net asset value on the ex-dividend dates. Current performance may be higher or lower than the performance data quoted. For month-end performance figures, please visit www.ubs.com/us-mutualfundperformance.
55
UBS U.S. Small Cap Growth Fund
Illustration of an assumed investment of $10,000 in Class A shares (adjusted for 5.5% maximum sales charge) and $5,000,000 in Class P shares (unaudited)
The following two graphs depict the performance of UBS U.S. Small Cap Growth Fund Class A and Class P versus the Russell 2000 Growth Index over the 10 years ended June 30, 2017. The performance of Class C shares will vary based upon the different class specific expenses and sales charges. The performance provided does not reflect the deduction of taxes that a shareholder would pay on Fund distributions or the redemption of Fund shares. Past performance is no guarantee of future results. Share price and returns will vary with market conditions; investors may realize a gain or loss upon redemption.
UBS U.S. Small Cap Growth Fund Class A vs. Russell 2000 Growth Index
Wealth value with dividends reinvested. Initial investment for Class A Shares as of June 30, 2007 = $9,450
The Fund's growth of an assumed $10,000 investment is adjusted for the maximum sales charge of 5.5%.

UBS U.S. Small Cap Growth Fund Class P vs. Russell 2000 Growth Index
Wealth value with dividends reinvested. Initial investment for Class P shares as of June 30, 2007 = $5,000,000
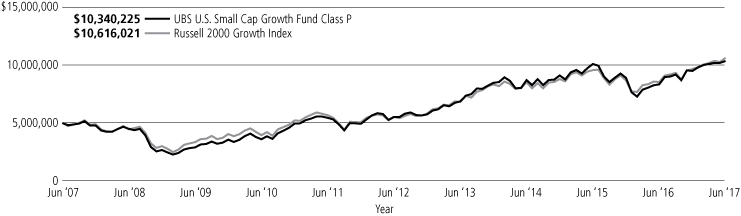
Past performance does not predict future performance, and the performance information provided does not reflect the deduction of taxes that a shareholder would pay on Fund distributions or the redemption of Fund shares. The return and principal value of an investment will fluctuate, so that an investor's shares, when redeemed, may be worth more or less than their original cost. Performance results assume reinvestment of all dividends and capital gain distributions at net asset value on the ex-dividend dates. Current performance may be higher or lower than the performance data quoted. For month-end performance figures, please visit www.ubs.com/us-mutualfundperformance.
56
UBS U.S. Small Cap Growth Fund
Portfolio statistics—June 30, 2017 (unaudited)1
Top ten holdings
| Percentage of net assets | |||||||
Universal Display Corp. | 3.4 | % | |||||
Exact Sciences Corp. | 2.8 | ||||||
Wix.com Ltd. | 2.4 | ||||||
Proofpoint, Inc. | 2.0 | ||||||
Grand Canyon Education, Inc. | 1.8 | ||||||
Callidus Software, Inc. | 1.8 | ||||||
Summit Materials, Inc., Class A | 1.8 | ||||||
8x8, Inc. | 1.7 | ||||||
Semtech Corp. | 1.6 | ||||||
National Bank Holdings Corp., Class A | 1.6 | ||||||
Total | 20.9 | % | |||||
Issuer breakdown by country or territory
of origin
| Percentage of net assets | |||||||
United States | 93.4 | % | |||||
Israel | 3.1 | ||||||
Bermuda | 1.2 | ||||||
Canada | 1.1 | ||||||
Total | 98.8 | % | |||||
1 The Fund's portfolio is actively managed and its composition will vary over time.
57
UBS U.S. Small Cap Growth Fund
Industry diversification—June 30, 2017 (unaudited)1,2
Common stocks | Percentage of net assets | ||||||
Airlines | 1.40 | % | |||||
Auto components | 1.19 | ||||||
Banks | 7.52 | ||||||
Biotechnology | 8.89 | ||||||
Building products | 1.15 | ||||||
Communications equipment | 1.30 | ||||||
Construction & engineering | 1.47 | ||||||
Construction materials | 1.75 | ||||||
Diversified consumer services | 1.82 | ||||||
Electrical equipment | 2.81 | ||||||
Electronic equipment, instruments & components | 3.40 | ||||||
Energy equipment & services | 2.63 | ||||||
Equity real estate investment trusts (REITs) | 0.97 | ||||||
Food & staples retailing | 0.88 | ||||||
Food products | 2.68 | ||||||
Health care equipment & supplies | 3.14 | ||||||
Health care providers & services | 5.57 | ||||||
Health care technology | 3.73 | ||||||
Hotels, restaurants & leisure | 5.63 | ||||||
Internet software & services | 4.62 | ||||||
Life sciences tools & services | 0.58 | ||||||
Machinery | 1.81 | ||||||
Media | 2.00 | ||||||
Multiline retail | 1.04 | ||||||
Oil, gas & consumable fuels | 1.77 | ||||||
Paper & forest products | 1.44 | ||||||
Personal products | 0.27 | ||||||
Pharmaceuticals | 2.05 | ||||||
Professional services | 1.94 | ||||||
Road & rail | 0.95 | ||||||
Semiconductors & semiconductor equipment | 6.37 | ||||||
Software | 11.23 | ||||||
Specialty retail | 3.55 | ||||||
Thrifts & mortgage finance | 1.20 | ||||||
Total common stocks | 98.75 | % | |||||
Exchange traded fund | 0.63 | ||||||
Short-term investment | 1.66 | ||||||
Investment of cash collateral from securities loaned | 4.68 | ||||||
Total investments | 105.72 | % | |||||
Liabilities, in excess of cash and other assets | (5.72 | ) | |||||
Net assets | 100.00 | % | |||||
1 Figures represent the breakdown of direct investments of UBS U.S. Small Cap Growth Fund. Figures would be different if a breakdown of the underlying investment companies and exchange traded funds was included.
2 The Fund's portfolio is actively managed and its composition will vary over time.
58
UBS U.S. Small Cap Growth Fund
Portfolio of investments
June 30, 2017
Shares | Value | ||||||||||
Common stocks: 98.75% | |||||||||||
Airlines: 1.40% | |||||||||||
Spirit Airlines, Inc.* | 29,151 | $ | 1,505,649 | ||||||||
Auto components: 1.19% | |||||||||||
Tenneco, Inc. | 22,137 | 1,280,183 | |||||||||
Banks: 7.52% | |||||||||||
BankUnited, Inc. | 32,844 | 1,107,171 | |||||||||
Columbia Banking System, Inc. | 35,541 | 1,416,309 | |||||||||
FB Financial Corp.* | 12,144 | 439,491 | |||||||||
Guaranty Bancshares, Inc. | 8,651 | 276,399 | |||||||||
National Bank Holdings Corp., Class A | 51,507 | 1,705,397 | |||||||||
South State Corp. | 16,835 | 1,442,760 | |||||||||
Webster Financial Corp. | 32,274 | 1,685,348 | |||||||||
8,072,875 | |||||||||||
Biotechnology: 8.89% | |||||||||||
Array BioPharma, Inc.* | 80,393 | 672,889 | |||||||||
Avexis, Inc.* | 9,879 | 811,659 | |||||||||
Bluebird Bio, Inc.* | 8,467 | 889,458 | |||||||||
Exact Sciences Corp.* | 85,403 | 3,020,704 | |||||||||
Five Prime Therapeutics, Inc.* | 11,887 | 357,918 | |||||||||
Jounce Therapeutics, Inc.* | 13,251 | 185,911 | |||||||||
Kite Pharma, Inc.*,1 | 8,640 | 895,709 | |||||||||
Ligand Pharmaceuticals, Inc.* | 11,843 | 1,437,740 | |||||||||
Loxo Oncology, Inc.* | 15,846 | 1,270,691 | |||||||||
9,542,679 | |||||||||||
Building products: 1.15% | |||||||||||
NCI Building Systems, Inc.* | 74,056 | 1,236,735 | |||||||||
Communications equipment: 1.30% | |||||||||||
Ciena Corp.* | 55,932 | 1,399,419 | |||||||||
Construction & engineering: 1.47% | |||||||||||
EMCOR Group, Inc. | 24,188 | 1,581,411 | |||||||||
Construction materials: 1.75% | |||||||||||
Summit Materials, Inc., Class A* | 64,979 | 1,875,944 | |||||||||
Diversified consumer services: 1.82% | |||||||||||
Grand Canyon Education, Inc.* | 24,969 | 1,957,819 | |||||||||
Electrical equipment: 2.81% | |||||||||||
EnerSys | 21,003 | 1,521,667 | |||||||||
Generac Holdings, Inc.* | 41,328 | 1,493,181 | |||||||||
3,014,848 | |||||||||||
Electronic equipment, instruments & components: 3.40% | |||||||||||
Universal Display Corp. | 33,366 | 3,645,235 | |||||||||
Energy equipment & services: 2.63% | |||||||||||
Patterson-UTI Energy, Inc. | 28,245 | 570,267 | |||||||||
ProPetro Holding Corp.* | 110,162 | 1,537,862 | |||||||||
US Silica Holdings, Inc. | 20,056 | 711,787 | |||||||||
2,819,916 | |||||||||||
Shares | Value | ||||||||||
Equity real estate investment trusts (REITs): 0.97% | |||||||||||
Education Realty Trust, Inc. | 26,900 | $ | 1,042,375 | ||||||||
Food & staples retailing: 0.88% | |||||||||||
Casey's General Stores, Inc. | 8,778 | 940,212 | |||||||||
Food products: 2.68% | |||||||||||
B&G Foods, Inc.1 | 29,304 | 1,043,222 | |||||||||
Blue Buffalo Pet Products, Inc.* | 32,981 | 752,297 | |||||||||
Dean Foods Co. | 63,812 | 1,084,804 | |||||||||
2,880,323 | |||||||||||
Health care equipment & supplies: 3.14% | |||||||||||
ABIOMED, Inc.* | 9,176 | 1,314,921 | |||||||||
DexCom, Inc.* | 6,988 | 511,172 | |||||||||
K2M Group Holdings, Inc.* | 63,545 | 1,547,956 | |||||||||
3,374,049 | |||||||||||
Health care providers & services: 5.57% | |||||||||||
Acadia Healthcare Co., Inc.*,1 | 30,453 | 1,503,769 | |||||||||
Envision Healthcare Corp.* | 14,700 | 921,249 | |||||||||
LifePoint Health, Inc.* | 22,640 | 1,520,276 | |||||||||
MEDNAX, Inc.* | 10,119 | 610,884 | |||||||||
Tenet Healthcare Corp.* | 73,651 | 1,424,411 | |||||||||
5,980,589 | |||||||||||
Health care technology: 3.73% | |||||||||||
Evolent Health, Inc., Class A* | 65,641 | 1,664,000 | |||||||||
HMS Holdings Corp.* | 69,366 | 1,283,271 | |||||||||
Vocera Communications, Inc.* | 39,934 | 1,055,056 | |||||||||
4,002,327 | |||||||||||
Hotels, restaurants & leisure: 5.63% | |||||||||||
ClubCorp Holdings, Inc. | 83,585 | 1,094,963 | |||||||||
Dave & Buster's Entertainment, Inc.* | 15,912 | 1,058,307 | |||||||||
Del Frisco's Restaurant Group, Inc.* | 40,618 | 653,950 | |||||||||
Del Taco Restaurants, Inc.* | 68,080 | 936,100 | |||||||||
Shake Shack, Inc., Class A*,1 | 28,761 | 1,003,184 | |||||||||
Sonic Corp. | 49,106 | 1,300,818 | |||||||||
6,047,322 | |||||||||||
Internet software & services: 4.62% | |||||||||||
Alteryx, Inc., Class A*,1 | 27,752 | 541,719 | |||||||||
Cloudera, Inc.*,1 | 14,850 | 237,897 | |||||||||
LogMeIn, Inc. | 13,336 | 1,393,612 | |||||||||
MuleSoft, Inc., Class A*,1 | 9,148 | 228,151 | |||||||||
Wix.com Ltd.* | 36,782 | 2,560,027 | |||||||||
4,961,406 | |||||||||||
Life sciences tools & services: 0.58% | |||||||||||
Charles River Laboratories International, Inc.* | 6,108 | 617,824 | |||||||||
Machinery: 1.81% | |||||||||||
Colfax Corp.* | 20,192 | 794,959 | |||||||||
Woodward, Inc. | 17,007 | 1,149,333 | |||||||||
1,944,292 | |||||||||||
59
UBS U.S. Small Cap Growth Fund
Portfolio of investments
June 30, 2017
Shares | Value | ||||||||||
Common stocks—(Concluded) | |||||||||||
Media: 2.00% | |||||||||||
AMC Entertainment Holdings, Inc., Class A1 | 44,885 | $ | 1,021,134 | ||||||||
IMAX Corp.* | 51,310 | 1,128,820 | |||||||||
2,149,954 | |||||||||||
Multiline retail: 1.04% | |||||||||||
Ollie's Bargain Outlet Holdings, Inc.* | 26,195 | 1,115,907 | |||||||||
Oil, gas & consumable fuels: 1.77% | |||||||||||
Callon Petroleum Co.* | 59,008 | 626,075 | |||||||||
Extraction Oil & Gas, Inc.*,1 | 43,303 | 582,425 | |||||||||
Matador Resources Co.* | 32,571 | 696,042 | |||||||||
1,904,542 | |||||||||||
Paper & forest products: 1.44% | |||||||||||
Boise Cascade Co.* | 50,727 | 1,542,101 | |||||||||
Personal products: 0.27% | |||||||||||
elf Beauty, Inc.*,1 | 10,499 | 285,678 | |||||||||
Pharmaceuticals: 2.05% | |||||||||||
Aclaris Therapeutics, Inc.* | 11,973 | 324,708 | |||||||||
Amphastar Pharmaceuticals, Inc.* | 27,386 | 489,114 | |||||||||
Nektar Therapeutics* | 25,347 | 495,534 | |||||||||
Supernus Pharmaceuticals, Inc.* | 20,600 | 887,860 | |||||||||
2,197,216 | |||||||||||
Professional services: 1.94% | |||||||||||
Kforce, Inc. | 31,043 | 608,443 | |||||||||
WageWorks, Inc.* | 21,893 | 1,471,209 | |||||||||
2,079,652 | |||||||||||
Road & rail: 0.95% | |||||||||||
Saia, Inc.* | 19,852 | 1,018,408 | |||||||||
Semiconductors & semiconductor equipment: 6.37% | |||||||||||
Cavium, Inc.* | 22,151 | 1,376,242 | |||||||||
Integrated Device Technology, Inc.* | 65,183 | 1,681,070 | |||||||||
MACOM Technology Solutions Holdings, Inc., H Shares* | 16,872 | 940,951 | |||||||||
Monolithic Power Systems, Inc. | 11,262 | 1,085,657 | |||||||||
Semtech Corp.* | 49,179 | 1,758,149 | |||||||||
6,842,069 | |||||||||||
Shares | Value | ||||||||||
Software: 11.23% | |||||||||||
8x8, Inc.* | 126,787 | $ | 1,844,751 | ||||||||
Callidus Software, Inc.* | 80,275 | 1,942,655 | |||||||||
CyberArk Software Ltd.* | 16,422 | 820,279 | |||||||||
Ellie Mae, Inc.* | 12,979 | 1,426,522 | |||||||||
Paycom Software, Inc.* | 4,605 | 315,028 | |||||||||
Proofpoint, Inc.* | 24,515 | 2,128,638 | |||||||||
Ultimate Software Group, Inc. (The)* | 5,990 | 1,258,259 | |||||||||
Upland Software, Inc.* | 29,564 | 650,112 | |||||||||
Varonis Systems, Inc.* | 44,692 | 1,662,542 | |||||||||
12,048,786 | |||||||||||
Specialty retail: 3.55% | |||||||||||
Burlington Stores, Inc.* | 12,011 | 1,104,892 | |||||||||
Children's Place, Inc. (The) | 10,657 | 1,088,080 | |||||||||
Finish Line, Inc. (The), Class A | 38,520 | 545,828 | |||||||||
Five Below, Inc.* | 21,651 | 1,068,910 | |||||||||
3,807,710 | |||||||||||
Thrifts & mortgage finance: 1.20% | |||||||||||
Essent Group Ltd.* | 34,545 | 1,283,001 | |||||||||
| Total common stocks (cost $86,489,011) | 105,998,456 | ||||||||||
Exchange traded fund: 0.63% | |||||||||||
| iShares Russell 2000 Growth Fund1 (cost $660,053) | 4,050 | 683,519 | |||||||||
Short-term investment: 1.66% | |||||||||||
Investment company: 1.66% | |||||||||||
| JPMorgan U.S. Government Money Market Fund, Capital Shares (cost $1,783,978) | 1,783,978 | 1,783,978 | |||||||||
Investment of cash collateral from securities loaned: 4.68% | |||||||||||
| JPMorgan U.S. Government Money Market Fund, Capital Shares (cost $5,019,751) | 5,019,751 | 5,019,751 | |||||||||
| Total investments: 105.72% (cost $93,952,793) | 113,485,704 | ||||||||||
Liabilities, in excess of cash and other assets: (5.72)% | (6,142,624 | ) | |||||||||
Net assets: 100.00% | $ | 107,343,080 | |||||||||
Notes to portfolio of investments
Aggregate cost for federal income tax purposes was $94,704,568; and net unrealized appreciation consisted of:
Gross unrealized appreciation | $ | 22,423,511 | |||||
Gross unrealized depreciation | (3,642,375 | ) | |||||
Net unrealized appreciation of investments | $ | 18,781,136 | |||||
For a listing of defined portfolio acronyms, counterparty abbreviations and currency abbreviations that are used throughout the Portfolio of investments as well as the tables that follow, please refer to page 85. Portfolio footnotes begin on page 61.
60
UBS U.S. Small Cap Growth Fund
Portfolio of investments
June 30, 2017
Fair valuation summary
The following is a summary of the fair valuations according to the inputs used as of June 30, 2017 in valuing the Fund's investments. In the event a Fund holds investments for which fair value is measured using the NAV per share practical expedient (or its equivalent), a separate column will be added to the fair value hierarchy table; this is intended to permit reconciliation to the amounts presented in the Portfolio of investments.
Description | Unadjusted quoted prices in active markets for identical investments (Level 1) | Other significant observable inputs (Level 2) | Unobservable inputs (Level 3) | Total | |||||||||||||||
Assets | |||||||||||||||||||
Common stocks | $ | 105,998,456 | $ | — | $ | — | $ | 105,998,456 | |||||||||||
Exchange traded fund | 683,519 | — | — | 683,519 | |||||||||||||||
Short-term investment | 1,783,978 | — | — | 1,783,978 | |||||||||||||||
Investment of cash collateral from securities loaned | 5,019,751 | — | — | 5,019,751 | |||||||||||||||
Total | $ | 113,485,704 | $ | — | $ | — | $ | 113,485,704 | |||||||||||
At June 30, 2017, there were no transfers between Level 1 and Level 2. At June 30, 2016, $4,280,339 and $13,614,860 of short-term investments and investment of cash collateral from securities loaned, respectively, were classified within Level 2 and are now classified within Level 1 in accordance with the investment valuation leveling policy.
Portfolio footnotes
* Non-income producing security.
1 Security, or portion thereof, was on loan at the period end.
See accompanying notes to financial statements.
61
UBS Total Return Bond Fund
Portfolio performance
For the 12 months ended June 30, 2017, Class P shares of the UBS Total Return Bond Fund (the "Fund") returned 1.32%. (Class P shares have lower expenses than other share classes of the Fund. Returns for all share classes over various time periods are shown on page 64.) For comparison purposes, the Bloomberg Barclays US Aggregate Bond Index (the "Index") returned -0.31%. (Please note that the Fund's returns do not reflect the deduction of taxes that a shareholder would pay on the redemption of Fund shares, while index returns do not reflect the deduction of fees and expenses.)
The fund posted a positive return during the reporting period and outperformed its benchmark. This was primarily due to security selection and sector exposure.
Market commentary1
The 12 months ended June 30, 2017, were marked by a number of global political events, most notably the surprise election of Donald Trump as the 45th President of the United States. While President Trump's planned fiscal stimulus policies (e.g., infrastructure spending, health care reform, deregulation and tax reform) are largely expected to spur growth, his administration continues to have great difficulty bringing them to bear, primarily due to political gridlock.
For the reporting period, 2-year, 10-year, and 30-year U.S. Treasury yields rose 71 basis points (bps), 84 bps, and 66 bps, respectively, to close the reporting period at 1.38%, 2.30%, and 2.84%, respectively. The Federal Reserve Board (the "Fed") raised its policy rate 25 bps three times during the reporting period, citing improvement in the labor market, a continued decrease in the unemployment rate and an uptick in inflation. In addition to the rate hikes, the Fed announced at its June 2017 meeting a plan to begin gradually winding down its balance sheet.
Improved fundamentals and strong investor demand globally for higher yields caused nearly all fixed income sectors to outperform Treasuries over the reporting period, with the more rate-sensitive sectors underperforming the more credit-sensitive sectors. For example, the Bloomberg Barclays US Mortgage-Backed Securities Index returned -0.06% over the reporting period, compared to the Bloomberg Barclays US Corporate High Yield Index's gain of 2.28%.
Despite continued Fed rate hikes, the US dollar strengthened a mere 0.12% over the reporting period, as inflation data came in weaker than anticipated. Lastly, oil prices ended the reporting period 11% higher to close June at nearly $46 per barrel, as OPEC and other major oil exporters agreed to cut production (supply) in 2017.
Portfolio performance summary
What worked:
• Security selection was additive for results. Security selection was the most meaningful contributor to performance over the reporting period, specifically within financials, industrials and commercial mortgage-backed securities ("CMBS"). Financials outperformed due to rising rates (i.e., higher profitability) and the hope for future deregulation. Industrials outperformed in step with the rally in equities, whereas CMBS outperformed due to solid fundamentals and strong investor demand.
• Sector exposure was beneficial overall. The Fund was overweight various credit sectors over the reporting period, most notably corporates (both investment-grade and high yield) and CMBS. This positioning was based on our belief that fundamentals were solid and higher-yielding bonds would attract investors' demand for yield. This benefited performance, as credit-sensitive sectors meaningfully outperformed rate-sensitive sectors (e.g., Treasuries) over the reporting period.
1 For a detailed commentary on the market environment in general during the reporting period, see pages 3-4.
62
UBS Total Return Bond Fund
What didn't work:
• Agency residential mortgage-backed security ("RMBS") exposure detracted from performance. The Fund's tactical positioning to agency RMBS throughout the reporting period detracted from performance, particularly in the fourth quarter of 2016, when rates rose significantly and agency RMBS underperformed.
• Emerging markets currency exposure was a headwind for performance. The Fund's tactical long exposure to the Mexican peso detracted from performance, particularly in the fourth quarter of 2016, when the peso depreciated due to the surprise election of Donald Trump as President.
Market outlook
2017 thus far has been characterized by a flatter yield curve and continued demand for yield. The market waits in anticipation for the Trump administration's pro-growth/inflationary fiscal policies to get under way, while US fixed income markets offer some of the highest developed market yields in the world. The right-wing populist movement sparked by Brexit and Trump seems to have lost momentum of late, as Republican control of the White House and both houses of Congress in the US thus far has fallen short of expectations, the Dutch Presidential election in March resulted in a loss for Geert Wilders (a far-right candidate) and the French Presidential election in May resulted in a loss for Marine Le Pen (also a far-right candidate). Focus now shifts to the UK, where British Prime Minister Theresa May fights to retain her seat following her party's disappointing showing in the June snap elections, and the German federal elections in September, where the incumbent, Angela Merkel, maintains a modest lead in the latest opinion polls. On the geopolitical front, tensions between Russia and the US over Syria seem to have percolated once again, while tensions between North Korea and the US continue to rise. Yet despite all of these uncertainties and pockets of volatility, investor confidence and demand for yield remain strong, putting downward pressure on yields and grinding spreads even tighter, while monetary policy for the time being remains quite accommodative. Given this backdrop, it is our view that interest rates are likely to trend higher over the medium-term due to gradually improving fundamentals and moderately increasing inflation. Meanwhile, carry remains attractive due to the continued demand for yield.2
2 Carry refers to an investment strategy that involves borrowing at a low interest rate and using the proceeds to invest in an asset that produces a higher rate of return than the initial borrowing cost.
This letter is intended to assist shareholders in understanding how the Fund performed during the 12 months ended June 30, 2017. The views and opinions in the letter were current as of August 18, 2017. They are not guarantees of future performance or investment results and should not be taken as investment advice. Investment decisions reflect a variety of factors, and we reserve the right to change our views about individual securities, sectors and markets at any time. As a result, the views expressed should not be relied upon as a forecast of the Fund's future investment intent. We encourage you to consult your financial advisor regarding your personal investment program.
Mutual funds are sold by prospectus only. You should read it carefully and consider a fund's investment objectives, risks, charges, expenses and other important information contained in the prospectus before investing. Prospectuses for most of our funds can be obtained from your financial advisor, by calling UBS Funds at (800) 647-1568 or by visiting our website at www.ubs.com/am-us.
63
UBS Total Return Bond Fund
Average annual total returns for periods ended 06/30/17 (unaudited)
1 year | 5 years | 10 years or Inception1 | |||||||||||||
Before deducting maximum sales charge | |||||||||||||||
Class A1 | N/A | N/A | (0.31 | )% | |||||||||||
Class C3 | N/A | N/A | (0.66 | ) | |||||||||||
Class P4 | 1.32 | % | 2.16 | % | 5.79 | ||||||||||
After deducting maximum sales charge | |||||||||||||||
Class A2 | N/A | N/A | (4.03 | )% | |||||||||||
Class C3 | N/A | N/A | (1.40 | ) | |||||||||||
Bloomberg Barclays US Aggregate Index5 | (0.31 | )% | 2.21 | % | (1.00 | ) | |||||||||
The annualized gross and net expense ratios as in the October 28, 2016 prospectuses were as follows: Class A—1.21% and 0.75%; Class C—1.71% and 1.25%; Class P—1.21% and 0.50%. Net expenses reflect fee waivers and/or expense reimbursements, if any, pursuant to an agreement that is in effect to cap the expenses. The Trust, with respect to the Fund, and UBS Asset Management (Americas) Inc., the Fund's investment advisor ("UBS AM (Americas)" or the "Advisor"), have entered into a written agreement pursuant to which the Advisor has agreed to waive a portion of its management fees and/or to reimburse expenses (excluding expenses incurred through investment in other investment companies, interest, taxes, brokerage commissions and extraordinary expenses) to the extent necessary so that the Fund's ordinary operating expenses (excluding expenses incurred through investment in other investment companies, interest, taxes, brokerage commissions and extraordinary expenses), through the period ending October 27, 2017, do not exceed 0.75% for Class A shares, 1.25% for Class C shares and 0.50% for Class P shares. Pursuant to the written agreement, the Advisor is entitled to be reimbursed for any fees it waives and expenses it reimburses to the extent such reimbursement can be made during the three years following the period during which such fee waivers and expense reimbursements were made, provided that the reimbursement of the Advisor by the Fund will not cause the Fund to exceed any applicable expense limit that is in place for the Fund. The fee waiver/expense reimbursement agreement may be terminated by the Fund's Board of Trustees at any time and also will terminate automatically upon the expiration or termination of the Fund's advisory contract with the Advisor. Upon termination of the fee waiver/expense reimbursement agreement, however, UBS AM (Americas)'s three year recoupment rights will survive.
1 Inception date of A and C shares of UBS Total Return Bond Fund and the index is September 29, 2016. 10 years fund performance is shown for Class P Shares, and the 10 years index performance of the Bloomberg Barclays US Aggregate Index is 4.48%. The Fund's Class P shares acquired the assets and liabilities of Fort Dearborn Income Securities, Inc., a closed-end fund (the "Predecessor Fund"), prior to the opening of business on May 23, 2016 (the "Reorganization"). The Predecessor Fund was also managed by the Advisor, and the day-to-day management of, and investment decisions for, the Fund and the Predecessor Fund are made by the same portfolio management team. The Funds have generally similar investment objectives and strategies. Therefore, the information shown above reflects the historical performance of the Predecessor Fund for periods prior to the Reorganization. The performance information shown for periods prior to the Reorganization is for the Predecessor Fund and may not be representative of performance of the Fund.
2 Maximum sales charge for Class A shares is 3.75%. Class A shares bear ongoing 12b-1 service fees.
3 Maximum contingent deferred sales charge for Class C shares is 0.75% imposed on redemptions and is reduced to 0% after one year. Class C shares bear ongoing 12b-1 distribution and service fees.
4 Class P shares do not bear initial or contingent deferred sales charges or ongoing 12b-1 service and distribution fees, but Class P shares held through advisory programs may be subject to a program fee, which, if included, would have reduced performance.
5 The Bloomberg Barclays US Aggregate Index is an unmanaged broad based index designed to measure the US dollar-denominated, investment-grade, taxable bond market. The index includes bonds from the Treasury, government-related, corporate, mortgage-backed, assetbacked and commercial mortgage-backed sectors. Investors should note that indices do not reflect the deduction of fees and expenses.
A temporary redemption fee of 2% was imposed on sales of Class P shares of the Fund between May 23, and August 22, 2016.
Past performance does not predict future performance, and the performance information provided does not reflect the deduction of taxes that a shareholder would pay on Fund distributions or the redemption of Fund shares. The return and principal value of an investment will fluctuate, so that an investor's shares, when redeemed, may be worth more or less than their original cost. Performance results assume reinvestment of all dividends and capital gain distributions at net asset value on the ex-dividend dates. Current performance may be higher or lower than the performance data quoted. For month-end performance figures, please visit www.ubs.com/us-mutualfundperformance.
64
UBS Total Return Bond Fund
Illustration of an assumed investment of $10,000 in Class A shares (adjusted for 3.75% maximum sales charge) and $5,000,000 in Class P shares (unaudited)
The following two graphs depict the performance of UBS Total Return Bond Fund Class A and Class P shares versus the Bloomberg Barclays US Aggregate Index from September 29, 2016 for Class A and over 10 years for Class P, both ending June 30, 2017. The performance of Class C shares will vary based upon the different class specific expenses and sales charges. The performance provided does not reflect the deduction of taxes that a shareholder would pay on Fund distributions or the redemption of Fund shares. Past performance is no guarantee of future results. Share price and returns will vary with market conditions; investors may realize a gain or loss upon redemption.
UBS Total Return Bond Fund Class A vs. Bloomberg Barclays US Aggregate Index
Wealth value with dividends reinvested. Initial investment for Class A Shares as of September 29, 2016 = $9,625.
The Fund's growth of an assumed $10,000 investment is adjusted for the maximum sales charge of 3.75%.
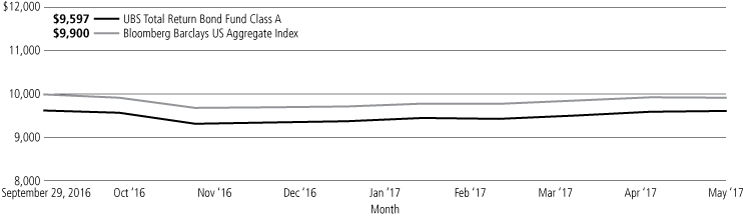
UBS Total Return Bond Fund Class P vs. Bloomberg Barclays US Aggregate Index
Wealth value with dividends reinvested. Initial investment for Class P shares as of June 30, 2007 = $5,000,000

Past performance does not predict future performance, and the performance information provided does not reflect the deduction of taxes that a shareholder would pay on Fund distributions or the redemption of Fund shares. The return and principal value of an investment will fluctuate, so that an investor's shares, when redeemed, may be worth more or less than their original cost. Performance results assume reinvestment of all dividends and capital gain distributions at net asset value on the ex-dividend dates. Current performance may be higher or lower than the performance data quoted. For month-end performance figures, please visit www.ubs.com/us-mutualfundperformance.
65
UBS Total Return Bond Fund
Portfolio statistics—June 30, 2017 (unaudited)1
Top ten holdings
| Percentage of net assets | |||||||
| FHLMC, 3.000%, 07/01/47 | 3.7 | % | |||||
| FNMA, 3.500%, 07/01/47 | 3.3 | ||||||
| FHLMC, 4.000%, 07/01/47 | 3.2 | ||||||
| U.S. Treasury Notes, 2.375%, 05/15/27 | 2.2 | ||||||
| FHLMC, 3.500%, TBA | 2.1 | ||||||
| Capital Auto Receivables Asset Trust, Series 2016-1, Class D, 4.030%, 08/21/23 | 2.0 | ||||||
| Drive Auto Receivables Trust, Series 2015-DA, Class C, 3.380%, 11/15/21 | 2.0 | ||||||
| GNMA, 3.500%, 06/20/47 | 1.5 | ||||||
| GNMA, 3.500%, TBA | 1.5 | ||||||
| GNMA, 3.000%, TBA | 1.4 | ||||||
Total | 22.9 | % | |||||
Top five issuer breakdown by country
or territory of origin
| Percentage of net assets | |||||||
United States | 81.9 | % | |||||
Brazil | 2.1 | ||||||
Netherlands | 2.0 | ||||||
United Kingdom | 2.0 | ||||||
New Zealand | 1.3 | ||||||
Total | 89.3 | % | |||||
1 The Fund's portfolio is actively managed and its composition will vary over time.
66
UBS Total Return Bond Fund
Industry diversification—June 30, 2017 (unaudited)1
| Bonds Corporate bonds | Percentage of net assets | ||||||
Automobiles | 0.56 | % | |||||
Banks | 6.72 | ||||||
Beverages | 0.67 | ||||||
Biotechnology | 0.87 | ||||||
Capital markets | 1.74 | ||||||
Chemicals | 1.59 | ||||||
Commercial services & supplies | 0.46 | ||||||
Communications equipment | 0.34 | ||||||
Consumer finance | 1.67 | ||||||
Diversified financial services | 0.92 | ||||||
Diversified telecommunication services | 2.98 | ||||||
Electric utilities | 1.67 | ||||||
Electrical equipment | 0.38 | ||||||
Electronic equipment, instruments & components | 0.33 | ||||||
Equity real estate investment trusts (REITs) | 0.40 | ||||||
Food & staples retailing | 0.38 | ||||||
Food products | 0.16 | ||||||
Health care equipment & supplies | 0.16 | ||||||
Health care providers & services | 0.54 | ||||||
Household durables | 0.95 | ||||||
Household products | 0.11 | ||||||
Industrial conglomerates | 0.74 | ||||||
Insurance | 1.68 | ||||||
Internet & direct marketing retail | 0.52 | ||||||
Life sciences tools & services | 0.43 | ||||||
Machinery | 0.16 | ||||||
Media | 2.62 | ||||||
Metals & mining | 0.40 | ||||||
Oil, gas & consumable fuels | 4.51 | ||||||
Pharmaceuticals | 1.60 | ||||||
Real estate management & development | 0.31 | ||||||
Road & rail | 0.50 | ||||||
Semiconductors & semiconductor equipment | 0.43 | ||||||
Software | 0.64 | ||||||
Specialty retail | 0.19 | ||||||
Technology hardware, storage & peripherals | 0.92 | ||||||
Thrifts & mortgage finance | 0.54 | ||||||
Tobacco | 0.48 | ||||||
Trading companies & distributors | 1.12 | ||||||
Wireless telecommunication services | 0.37 | ||||||
Total corporate bonds | 41.76 | % | |||||
Bonds—(Continued) | Percentage of net assets | ||||||
Asset-backed securities | 13.25 | % | |||||
Commercial mortgage-backed securities | 8.45 | ||||||
Mortgage-backed securities | 23.47 | ||||||
Municipal bond | 0.73 | ||||||
Non-U.S. government obligations | 5.94 | ||||||
U.S. government agency obligation | 0.40 | ||||||
U.S. treasury obligations | 4.53 | ||||||
Total bonds | 98.53 | % | |||||
Preferred stock | 0.21 | ||||||
Short-term investment | 9.21 | ||||||
Total investments | 107.95 | % | |||||
Liabilities, in excess of cash and other assets | (7.95 | ) | |||||
Net assets | 100.00 | % | |||||
1 The Fund's portfolio is actively managed and its composition will vary over time.
67
UBS Total Return Bond Fund
Portfolio of investments
June 30, 2017
| Face amount | Value | ||||||||||
Bonds: 98.53% | |||||||||||
Corporate bonds: 41.76% | |||||||||||
Brazil: 1.11% | |||||||||||
| Caixa Economica Federal, 2.375%, due 11/06/171 | $ | 555,000 | $ | 554,334 | |||||||
Canada: 1.14% | |||||||||||
| Cenovus Energy, Inc., 5.400%, due 06/15/471 | 80,000 | 74,765 | |||||||||
| NOVA Chemicals Corp., 5.250%, due 08/01/231 | 210,000 | 215,775 | |||||||||
| Rogers Communications, Inc., 5.000%, due 03/15/44 | 160,000 | 182,968 | |||||||||
| Teck Resources Ltd., 3.750%, due 02/01/23 | 100,000 | 97,375 | |||||||||
Total Canada corporate bonds | 570,883 | ||||||||||
Cayman Islands: 0.77% | |||||||||||
| Seagate HDD Cayman, 5.750%, due 12/01/34 | 150,000 | 150,360 | |||||||||
| XLIT Ltd., 6.375%, due 11/15/24 | 200,000 | 234,860 | |||||||||
Total Cayman Islands corporate bonds | 385,220 | ||||||||||
Colombia: 0.15% | |||||||||||
| Ecopetrol SA, 5.375%, due 06/26/26 | 70,000 | 72,975 | |||||||||
Curacao: 0.12% | |||||||||||
| Teva Pharmaceutical Finance IV BV, 3.650%, due 11/10/21 | 57,000 | 58,852 | |||||||||
France: 0.41% | |||||||||||
| Societe Generale SA, 4.000%, due 01/12/271 | 200,000 | 206,714 | |||||||||
Germany: 0.64% | |||||||||||
| Unitymedia GmbH, 6.125%, due 01/15/251 | 300,000 | 321,750 | |||||||||
Ireland: 0.39% | |||||||||||
| Shire Acquisitions Investments Ireland DAC, 2.400%, due 09/23/21 | 100,000 | 98,824 | |||||||||
3.200%, due 09/23/26 | 100,000 | 97,796 | |||||||||
Total Ireland corporate bonds | 196,620 | ||||||||||
Luxembourg: 0.83% | |||||||||||
| Allergan Funding SCS, 3.800%, due 03/15/25 | 200,000 | 206,888 | |||||||||
| INEOS Group Holdings SA, 5.625%, due 08/01/241 | 200,000 | 206,250 | |||||||||
Total Luxembourg corporate bonds | 413,138 | ||||||||||
Mexico: 0.67% | |||||||||||
| Petroleos Mexicanos, 3.500%, due 01/30/23 | 350,000 | 335,475 | |||||||||
| Face amount | Value | ||||||||||
Netherlands: 2.03% | |||||||||||
| Deutsche Telekom International Finance BV, 8.750%, due 06/15/30 | $ | 60,000 | $ | 88,995 | |||||||
| EDP Finance BV, 4.900%, due 10/01/191 | 439,000 | 460,972 | |||||||||
| LYB International Finance BV, 4.875%, due 03/15/44 | 120,000 | 127,241 | |||||||||
| Mylan NV, 3.950%, due 06/15/26 | 130,000 | 131,734 | |||||||||
| Teva Pharmaceutical Finance Netherlands III BV, 3.150%, due 10/01/26 | 220,000 | 208,725 | |||||||||
Total Netherlands corporate bonds | 1,017,667 | ||||||||||
Singapore: 0.33% | |||||||||||
| Flex Ltd., 5.000%, due 02/15/23 | 150,000 | 163,650 | |||||||||
Spain: 0.32% | |||||||||||
| Telefonica Emisiones SAU, 5.213%, due 03/08/47 | 150,000 | 162,203 | |||||||||
United Kingdom: 1.95% | |||||||||||
| Aon plc, 3.875%, due 12/15/25 | 120,000 | 125,408 | |||||||||
| Barclays plc, 4.337%, due 01/10/28 | 115,000 | 118,393 | |||||||||
| HSBC Holdings plc, 3.400%, due 03/08/21 | 260,000 | 267,204 | |||||||||
| Lloyds Banking Group plc, 4.582%, due 12/10/25 | 200,000 | 207,375 | |||||||||
| Royal Bank of Scotland Group plc, 3.875%, due 09/12/23 | 250,000 | 254,950 | |||||||||
Total United Kingdom corporate bonds | 973,330 | ||||||||||
United States: 30.90% | |||||||||||
| 21st Century Fox America, Inc., 7.750%, due 12/01/45 | 50,000 | 72,546 | |||||||||
| Abbott Laboratories, 3.750%, due 11/30/26 | 80,000 | 81,673 | |||||||||
| AbbVie, Inc., 2.500%, due 05/14/20 | 200,000 | 202,304 | |||||||||
| ADT Corp. (The), 3.500%, due 07/15/22 | 240,000 | 232,128 | |||||||||
| AEP Texas, Inc., Series E, 6.650%, due 02/15/33 | 80,000 | 101,464 | |||||||||
| Alabama Power Co., 6.000%, due 03/01/39 | 100,000 | 127,380 | |||||||||
| Ally Financial, Inc., 6.250%, due 12/01/17 | 250,000 | 254,325 | |||||||||
| Anadarko Petroleum Corp., 5.550%, due 03/15/26 | 150,000 | 167,641 | |||||||||
| Anheuser-Busch InBev Finance, Inc., 4.900%, due 02/01/46 | 295,000 | 333,418 | |||||||||
| AT&T, Inc., 3.600%, due 02/17/23 | 400,000 | 409,333 | |||||||||
4.350%, due 06/15/45 | 130,000 | 120,821 | |||||||||
68
UBS Total Return Bond Fund
Portfolio of investments
June 30, 2017
| Face amount | Value | ||||||||||
Bonds—(Continued) | |||||||||||
Corporate bonds—(Continued) | |||||||||||
United States—(Continued) | |||||||||||
| Bank of America Corp., 4.200%, due 08/26/24 | $ | 300,000 | $ | 311,235 | |||||||
6.110%, due 01/29/37 | 125,000 | 153,159 | |||||||||
| Biogen, Inc., 4.050%, due 09/15/25 | 150,000 | 158,383 | |||||||||
| Boston Properties LP, 2.750%, due 10/01/26 | 210,000 | 198,297 | |||||||||
| Brighthouse Financial, Inc., 4.700%, due 06/22/471 | 70,000 | 68,820 | |||||||||
| Burlington Northern Santa Fe LLC, 5.150%, due 09/01/43 | 150,000 | 179,800 | |||||||||
| Capital One Financial Corp., 3.750%, due 07/28/26 | 100,000 | 97,592 | |||||||||
4.200%, due 10/29/25 | 140,000 | 141,181 | |||||||||
| CF Industries, Inc., 3.450%, due 06/01/23 | 150,000 | 141,750 | |||||||||
| Charter Communications Operating LLC, 3.579%, due 07/23/20 | 150,000 | 154,994 | |||||||||
| Cisco Systems, Inc., 5.900%, due 02/15/39 | 130,000 | 169,238 | |||||||||
| CIT Group, Inc., 5.500%, due 02/15/191 | 100,000 | 105,000 | |||||||||
| Citigroup, Inc., 5.500%, due 09/13/25 | 500,000 | 556,061 | |||||||||
| Comcast Corp., 6.950%, due 08/15/37 | 130,000 | 183,597 | |||||||||
| Devon Energy Corp., 5.000%, due 06/15/45 | 110,000 | 112,198 | |||||||||
| Diamond 1 Finance Corp., 4.420%, due 06/15/211 | 100,000 | 105,412 | |||||||||
| DISH DBS Corp., 7.875%, due 09/01/19 | 150,000 | 165,375 | |||||||||
| DR Horton, Inc., 4.000%, due 02/15/20 | 227,000 | 235,712 | |||||||||
| Eaton Corp., 2.750%, due 11/02/22 | 190,000 | 191,012 | |||||||||
| Enterprise Products Operating LLC, 2.850%, due 04/15/21 | 105,000 | 106,179 | |||||||||
| Exelon Corp., 3.400%, due 04/15/26 | 300,000 | 299,018 | |||||||||
| Ford Motor Co., 7.450%, due 07/16/31 | 55,000 | 69,547 | |||||||||
| Frontier Communications Corp., 8.500%, due 04/15/20 | 250,000 | 262,812 | |||||||||
| General Electric Co., Series D, 5.000%, due 01/21/212,3 | 349,000 | 370,429 | |||||||||
| General Motors Co., 6.600%, due 04/01/36 | 180,000 | 208,757 | |||||||||
| General Motors Financial Co., Inc., 3.000%, due 09/25/17 | 250,000 | 250,698 | |||||||||
| Gilead Sciences, Inc., 3.650%, due 03/01/26 | 75,000 | 77,249 | |||||||||
| Face amount | Value | ||||||||||
| Goldman Sachs Group, Inc. (The), 5.750%, due 01/24/22 | $ | 305,000 | $ | 343,357 | |||||||
| Great Plains Energy, Inc., 4.850%, due 04/01/47 | 60,000 | 61,825 | |||||||||
| HCA, Inc., 5.000%, due 03/15/24 | 150,000 | 158,812 | |||||||||
| Home Depot, Inc. (The), 2.125%, due 09/15/26 | 100,000 | 93,496 | |||||||||
| Illinois Tool Works, Inc., 2.650%, due 11/15/26 | 80,000 | 78,133 | |||||||||
| International Lease Finance Corp., 5.875%, due 08/15/22 | 120,000 | 135,460 | |||||||||
7.125%, due 09/01/181 | 400,000 | 423,348 | |||||||||
| JPMorgan Chase & Co., Series 1, 7.900%, due 04/30/182,3 | 200,000 | 207,900 | |||||||||
| Kimberly-Clark Corp., 3.200%, due 07/30/46 | 60,000 | 54,599 | |||||||||
| Kinder Morgan, Inc., 5.550%, due 06/01/45 | 40,000 | 42,443 | |||||||||
6.500%, due 09/15/20 | 100,000 | 111,050 | |||||||||
7.250%, due 06/01/18 | 300,000 | 314,038 | |||||||||
| Kroger Co. (The), 6.900%, due 04/15/38 | 150,000 | 189,535 | |||||||||
| Lennar Corp., 4.750%, due 05/30/25 | 130,000 | 135,850 | |||||||||
| Liberty Mutual Group, Inc., 4.250%, due 06/15/231 | 200,000 | 212,749 | |||||||||
| Life Technologies Corp., 6.000%, due 03/01/20 | 135,000 | 147,119 | |||||||||
| Marathon Petroleum Corp., 4.750%, due 09/15/44 | 120,000 | 114,156 | |||||||||
| MetLife, Inc., 6.400%, due 12/15/36 | 35,000 | 40,425 | |||||||||
| Microsoft Corp., 2.375%, due 02/12/22 | 250,000 | 251,808 | |||||||||
4.450%, due 11/03/45 | 60,000 | 66,858 | |||||||||
| Morgan Stanley, 4.350%, due 09/08/26 | 140,000 | 145,564 | |||||||||
4.875%, due 11/01/22 | 350,000 | 379,966 | |||||||||
| Mosaic Co. (The), 5.625%, due 11/15/43 | 100,000 | 102,219 | |||||||||
| MPLX LP, 4.875%, due 06/01/25 | 70,000 | 74,234 | |||||||||
| NCR Corp., 5.000%, due 07/15/22 | 200,000 | 204,000 | |||||||||
| Netflix, Inc., 5.500%, due 02/15/22 | 240,000 | 260,623 | |||||||||
| Oncor Electric Delivery Co. LLC, 3.750%, due 04/01/45 | 50,000 | 48,952 | |||||||||
| Pacific Gas & Electric Co., 2.950%, due 03/01/26 | 200,000 | 198,633 | |||||||||
| Prudential Financial, Inc., 6.625%, due 06/21/40 | 70,000 | 94,835 | |||||||||
| Quicken Loans, Inc., 5.750%, due 05/01/251 | 260,000 | 268,450 | |||||||||
69
UBS Total Return Bond Fund
Portfolio of investments
June 30, 2017
| Face amount | Value | ||||||||||
Bonds—(Continued) | |||||||||||
Corporate bonds—(Concluded) | |||||||||||
United States—(Concluded) | |||||||||||
| Realogy Group LLC, 5.250%, due 12/01/211 | $ | 150,000 | $ | 157,200 | |||||||
| Regency Energy Partners LP, 5.500%, due 04/15/23 | 500,000 | 517,500 | |||||||||
| Reynolds American, Inc., 7.250%, due 06/15/37 | 175,000 | 239,515 | |||||||||
| Sabine Pass Liquefaction LLC, 5.000%, due 03/15/27 | 200,000 | 212,915 | |||||||||
| Smithfield Foods, Inc., 3.350%, due 02/01/221 | 80,000 | 80,408 | |||||||||
| Southern Copper Corp., 6.750%, due 04/16/40 | 90,000 | 103,613 | |||||||||
| Sprint Capital Corp., 6.875%, due 11/15/28 | 200,000 | 222,314 | |||||||||
| SunTrust Bank, 7.250%, due 03/15/18 | 220,000 | 228,253 | |||||||||
| SunTrust Banks, Inc., 2.700%, due 01/27/22 | 110,000 | 110,218 | |||||||||
| Synchrony Financial, 4.500%, due 07/23/25 | 90,000 | 92,560 | |||||||||
| Teachers Insurance & Annuity Association of America, 4.270%, due 05/15/471 | 60,000 | 61,514 | |||||||||
| Texas Instruments, Inc., 1.850%, due 05/15/22 | 220,000 | 215,637 | |||||||||
| Thermo Fisher Scientific, Inc., 5.300%, due 02/01/44 | 60,000 | 70,106 | |||||||||
| Time Warner Cable LLC, 8.750%, due 02/14/19 | 210,000 | 230,988 | |||||||||
| Time Warner, Inc., 2.950%, due 07/15/26 | 190,000 | 179,266 | |||||||||
| Toll Brothers Finance Corp., 4.875%, due 11/15/25 | 100,000 | 103,750 | |||||||||
| Union Pacific Corp., 4.050%, due 11/15/45 | 70,000 | 72,527 | |||||||||
| UnitedHealth Group, Inc., 4.625%, due 07/15/35 | 100,000 | 112,517 | |||||||||
| Wells Fargo & Co., 5.375%, due 11/02/43 | 70,000 | 81,087 | |||||||||
| Windstream Services LLC, 7.750%, due 10/15/20 | 220,000 | 221,650 | |||||||||
Total United States corporate bonds | 15,450,513 | ||||||||||
| Total corporate bonds (cost $20,534,121) | 20,883,324 | ||||||||||
Asset-backed securities: 13.25% | |||||||||||
United States: 13.25% | |||||||||||
| AmeriCredit Automobile Receivables Trust, Series 2016-3, Class D, 2.710%, due 09/08/22 | 600,000 | 593,596 | |||||||||
| Series 2013-4, Class C, 2.720%, due 09/09/19 | 72,649 | 72,817 | |||||||||
| Series 2016-4, Class D, 2.740%, due 12/08/22 | 525,000 | 521,348 | |||||||||
| Face amount | Value | ||||||||||
| Series 2017-1, Class D, 3.130%, due 01/18/23 | $ | 350,000 | $ | 351,352 | |||||||
| Capital Auto Receivables Asset Trust, Series 2016-2, Class D, 3.160%, due 11/20/23 | 475,000 | 478,347 | |||||||||
| Series 2015-4, Class D, 3.620%, due 05/20/21 | 125,000 | 127,870 | |||||||||
| Series 2016-1, Class D, 4.030%, due 08/21/23 | 975,000 | 994,501 | |||||||||
| Dell Equipment Finance Trust, Series 2016-1, Class D, 3.240%, due 07/22/221 | 268,000 | 270,013 | |||||||||
| Drive Auto Receivables Trust, Series 2016-CA, Class A2, 1.410%, due 01/15/191 | 123,111 | 123,076 | |||||||||
| Series 2016-AA, Class B, 3.170%, due 05/15/201 | 418,037 | 419,350 | |||||||||
| Series 2015-DA, Class C, 3.380%, due 11/15/211 | 975,000 | 984,367 | |||||||||
| Series 2017-1, Class D, 3.840%, due 03/15/23 | 75,000 | 74,826 | |||||||||
| Series 2017-AA, Class D, 4.160%, due 05/15/241 | 200,000 | 203,343 | |||||||||
| Series 2016-CA, Class D, 4.180%, due 03/15/241 | 175,000 | 178,695 | |||||||||
| Santander Drive Auto Receivables Trust, Series 2013-5, Class C, 2.250%, due 06/17/19 | 33,672 | 33,726 | |||||||||
| Series 2017-1, Class D, 3.170%, due 04/17/23 | 375,000 | 374,338 | |||||||||
| Series 2017-2, Class D, 3.730%, due 07/17/23 | 100,000 | 100,021 | |||||||||
| Verizon Owner Trust, Series 2017-2A, Class C, 2.380%, due 12/20/211 | 175,000 | 175,100 | |||||||||
| World Financial Network Credit Card Master Trust, Series 2016-A, Class A, 2.030%, due 04/15/25 | 275,000 | 271,739 | |||||||||
| Series 2015-B, Class A, 2.550%, due 06/17/24 | 275,000 | 278,193 | |||||||||
| Total asset-backed securities (cost $6,633,046) | 6,626,618 | ||||||||||
Commercial mortgage-backed securities: 8.45% | |||||||||||
United States: 8.45% | |||||||||||
| COMM Mortgage Trust, Series 2015-DC1, Class A5, 3.350%, due 02/10/48 | 300,000 | 304,498 | |||||||||
| Commercial Mortgage Pass-Through Certificates, Series 2014-CR14, Class A4, 4.236%, due 02/10/472 | 150,000 | 161,152 | |||||||||
| FREMF Mortgage Trust, Series 2017-K724, Class B, 3.601%, due 11/25/231,2 | 265,000 | 259,983 | |||||||||
| Series 2015-K48, Class B, 3.761%, due 08/25/481,2 | 500,000 | 499,417 | |||||||||
70
UBS Total Return Bond Fund
Portfolio of investments
June 30, 2017
| Face amount | Value | ||||||||||
Bonds—(Continued) | |||||||||||
Commercial mortgage-backed securities—(Concluded) | |||||||||||
United States—(Concluded) | |||||||||||
| Series 2015-K50, Class B, 3.908%, due 10/25/481,2 | $ | 350,000 | $ | 353,636 | |||||||
| Series 2017-K64, Class B, 4.116%, due 03/25/271,2 | 50,000 | 50,325 | |||||||||
| Series 2016-K55, Class B, 4.294%, due 04/25/491,2 | 525,000 | 541,399 | |||||||||
| GS Mortgage Securities Trust, Series 2013-GC14, Class A5, 4.243%, due 08/10/46 | 150,000 | 161,938 | |||||||||
| Series 2014-GSFL, Class D, 5.059%, due 07/15/311,2 | 225,000 | 226,475 | |||||||||
| Hilton USA Trust, Series 2016-SFP, Class E, 5.519%, due 11/05/351 | 125,000 | 126,027 | |||||||||
| JPMBB Commercial Mortgage Securities Trust, Series 2014-C26, Class AS, 3.800%, due 01/15/48 | 200,000 | 205,534 | |||||||||
| Series 2015-C30, Class A5, 3.822%, due 07/15/48 | 250,000 | 262,334 | |||||||||
| Rosslyn Portfolio Trust, Series 2017-ROSS, Class E, 4.159%, due 06/15/331,2,4 | 275,000 | 275,000 | |||||||||
| Starwood Retail Property Trust, Series 2014-STAR, Class C, 3.627%, due 11/15/271,2 | 125,000 | 123,720 | |||||||||
| VNDO Mortgage Trust, Series 2013-PENN, Class D, 4.079%, due 12/13/291,2 | 500,000 | 512,861 | |||||||||
| WFCG Commercial Mortgage Trust, Series 2015-BXRP, Class D, 3.698%, due 11/15/291,2 | 160,685 | 161,089 | |||||||||
| Total commercial mortgage-backed securities (cost $4,176,785) | 4,225,388 | ||||||||||
Mortgage-backed securities: 23.47% | |||||||||||
United States: 23.47% | |||||||||||
| FHLMC, 3.000%, TBA | 200,000 | 199,531 | |||||||||
| #G08769 3.000%, due 07/01/47 | 1,850,000 | 1,846,909 | |||||||||
| 3.500%, TBA | 1,025,000 | 1,052,707 | |||||||||
| #G08771 4.000%, due 07/01/47 | 1,500,000 | 1,578,509 | |||||||||
| 4.500%, TBA | 375,000 | 401,566 | |||||||||
| FNMA, 3.500%, TBA | 425,000 | 436,376 | |||||||||
| #MA2864 3.500%, due 01/01/47 | 415,189 | 426,564 | |||||||||
| #MA3057 3.500%, due 07/01/47 | 1,600,000 | 1,643,836 | |||||||||
| 4.000%, TBA | 400,000 | 420,406 | |||||||||
| #AE1568 4.000%, due 09/01/40 | 199,069 | 210,143 | |||||||||
| Face amount | Value | ||||||||||
| #BE3702 4.000%, due 06/01/47 | $ | 450,000 | $ | 473,185 | |||||||
| #688066 5.500%, due 03/01/33 | 44,917 | 50,608 | |||||||||
| #793666 5.500%, due 09/01/34 | 149,976 | 166,487 | |||||||||
| #802481 5.500%, due 11/01/34 | 36,752 | 41,143 | |||||||||
| #596124 6.000%, due 11/01/28 | 49,044 | 55,578 | |||||||||
| GNMA, 3.000%, TBA | 700,000 | 707,000 | |||||||||
| #MA4509 3.000%, due 06/20/47 | 500,000 | 505,529 | |||||||||
| 3.500%, TBA | 725,000 | 750,771 | |||||||||
| #MA4510 3.500%, due 06/20/47 | 725,000 | 751,563 | |||||||||
| #781029 6.500%, due 05/15/29 | 13,153 | 15,202 | |||||||||
| Total mortgage-backed securities (cost $11,748,241) | 11,733,613 | ||||||||||
Municipal bond: 0.73% | |||||||||||
| State of California, GO Bonds, 7.300%, due 10/01/39 (cost $373,569) | 250,000 | 365,578 | |||||||||
Non-U.S. government obligations: 5.94% | |||||||||||
Argentina: 0.75% | |||||||||||
| Republic of Argentina, 7.500%, due 04/22/26 | 350,000 | 377,125 | |||||||||
Brazil: 0.94% | |||||||||||
| Federative Republic of Brazil, 5.000%, due 01/27/45 | 200,000 | 175,000 | |||||||||
6.000%, due 04/07/26 | 275,000 | 296,725 | |||||||||
471,725 | |||||||||||
Chile: 0.42% | |||||||||||
| Republic of Chile, 3.250%, due 09/14/21 | 200,000 | 207,500 | |||||||||
Colombia: 0.59% | |||||||||||
| Republic of Colombia, 8.125%, due 05/21/24 | 230,000 | 293,020 | |||||||||
Indonesia: 0.49% | |||||||||||
| Republic of Indonesia, 6.625%, due 02/17/371 | 200,000 | 247,500 | |||||||||
Ivory Coast: 0.38% | |||||||||||
| Ivory Coast Government Bond, 6.125%, due 06/15/331 | 200,000 | 192,000 | |||||||||
Mexico: 0.24% | |||||||||||
| United Mexican States, 4.000%, due 10/02/23 | 100,000 | 104,750 | |||||||||
6.750%, due 09/27/34 | 10,000 | 12,760 | |||||||||
117,510 | |||||||||||
71
UBS Total Return Bond Fund
Portfolio of investments
June 30, 2017
| Face amount | Value | ||||||||||
Bonds—(Concluded) | |||||||||||
Non-U.S. government obligations—(Concluded) | |||||||||||
New Zealand: 1.31% | |||||||||||
| New Zealand Government Bond, 3.000%, due 09/20/305,6 | NZD | 801,801 | $ | 657,039 | |||||||
Peru: 0.59% | |||||||||||
| Republic of Peru, 7.350%, due 07/21/25 | $ | 225,000 | 294,750 | ||||||||
Turkey: 0.23% | |||||||||||
| Republic of Turkey, 6.875%, due 03/17/36 | 100,000 | 112,500 | |||||||||
| Total Non-U.S. government obligations (cost $2,975,978) | 2,970,669 | ||||||||||
U.S. government agency obligation: 0.40% | |||||||||||
| FNMA, 1.875%, due 09/24/26 (cost $195,476) | 210,000 | 199,148 | |||||||||
U.S. treasury obligations: 4.53% | |||||||||||
| U.S. Treasury Bond, 3.000%, due 05/15/47 | 640,000 | 661,650 | |||||||||
| U.S. Treasury Notes, 1.750%, due 06/30/22 | 525,000 | 521,555 | |||||||||
2.375%, due 05/15/27 | 1,075,000 | 1,081,928 | |||||||||
| Total U.S. treasury obligations (cost $2,277,846) | 2,265,133 | ||||||||||
| Total bonds (cost $48,915,062) | 49,269,471 | ||||||||||
Shares | Value | ||||||||||
Preferred stock: 0.21% | |||||||||||
United States: 0.21% | |||||||||||
| JPMorgan Chase & Co., 5.450%, due 03/01/183 (cost $102,000) | 4,000 | $ | 103,560 | ||||||||
Short-term investment: 9.21% | |||||||||||
Investment company: 9.21% | |||||||||||
| JPMorgan U.S. Government Money Market Fund, Capital Shares (cost $4,607,470) | 4,607,470 | 4,607,470 | |||||||||
| Total investments: 107.95% (cost $53,624,532) | 53,980,501 | ||||||||||
Liabilities, in excess of cash and other assets: (7.95%) | (3,974,216 | ) | |||||||||
Net assets: 100.00% | $ | 50,006,285 | |||||||||
Notes to portfolio of investments
Aggregate cost for federal income tax purposes was $53,631,233; and net unrealized appreciation consisted of:
Gross unrealized appreciation | $ | 720,143 | |||||
Gross unrealized depreciation | (370,875 | ) | |||||
Net unrealized appreciation of investments | $ | 349,268 | |||||
For a listing of defined portfolio acronyms, counterparty abbreviations and currency abbreviations that are used throughout the Portfolio of investments as well as the tables that follow, please refer to page 85. Portfolio footnotes begin on page 75.
Forward foreign currency contracts
Counterparty | Contracts to deliver | In exchange for | Maturity date | Unrealized appreciation/ (depreciation) | |||||||||||||||
BB | USD | 186,563 | ARS | 3,110,000 | 09/13/17 | $ | (6,318 | ) | |||||||||||
BB | USD | 388,734 | BRL | 1,300,000 | 09/13/17 | (2,043 | ) | ||||||||||||
BB | USD | 190,000 | SEK | 1,602,251 | 07/31/17 | 485 | |||||||||||||
BB | USD | 197,312 | TRY | 715,000 | 09/13/17 | 1,773 | |||||||||||||
JPMCB | EUR | 220,000 | JPY | 28,207,711 | 07/31/17 | (549 | ) | ||||||||||||
JPMCB | JPY | 111,000,000 | USD | 992,833 | 07/31/17 | 4,771 | |||||||||||||
72
UBS Total Return Bond Fund
Portfolio of investments
June 30, 2017
Forward foreign currency contracts—(Concluded)
Counterparty | Contracts to deliver | In exchange for | Maturity date | Unrealized appreciation/ (depreciation) | |||||||||||||||
JPMCB | NZD | 930,000 | USD | 675,862 | 07/31/17 | $ | (5,306 | ) | |||||||||||
JPMCB | USD | 689,619 | EUR | 605,000 | 07/31/17 | 2,387 | |||||||||||||
JPMCB | USD | 1,056,045 | SEK | 9,060,000 | 07/31/17 | 21,063 | |||||||||||||
Net unrealized appreciation on forward foreign currency contracts | $ | 16,263 | |||||||||||||||||
Futures contracts
| Expiration date | Cost/ (proceeds) | Value | Unrealized appreciation/ (depreciation) | ||||||||||||||||
US Treasury futures buy contracts: | |||||||||||||||||||
Ultra 10 Year US Treasury Note, 13 contracts (USD) | September 2017 | $ | 1,766,902 | $ | 1,752,562 | $ | (14,340 | ) | |||||||||||
US Ultra Bond, 13 contracts (USD) | September 2017 | 2,124,010 | 2,156,375 | 32,365 | |||||||||||||||
2 Year US Treasury Notes, 15 contracts (USD) | September 2017 | 3,242,460 | 3,241,641 | (819 | ) | ||||||||||||||
5 Year US Treasury Notes, 14 contracts (USD) | September 2017 | 1,652,878 | 1,649,703 | (3,175 | ) | ||||||||||||||
US Treasury futures sell contracts: | |||||||||||||||||||
US Long Bond, 7 contracts (USD) | September 2017 | (1,075,695 | ) | (1,075,812 | ) | (117 | ) | ||||||||||||
10 Year US Treasury Notes, 13 contracts (USD) | September 2017 | (1,643,700 | ) | (1,631,906 | ) | 11,794 | |||||||||||||
Interest rate futures buy contracts: | |||||||||||||||||||
Canadian 3-Month Bank Acceptance, 82 contracts (CAD) | September 2018 | 15,586,992 | 15,561,537 | (25,455 | ) | ||||||||||||||
Euro-BTP, 4 contracts (EUR) | September 2017 | 624,748 | 617,400 | (7,348 | ) | ||||||||||||||
Interest rate futures sell contracts: | |||||||||||||||||||
Euro Schatz, 60 contracts (EUR) | September 2017 | (7,682,038 | ) | (7,664,969 | ) | 17,069 | |||||||||||||
Euro-Bund, 9 contracts (EUR) | September 2017 | (1,694,193 | ) | (1,663,919 | ) | 30,274 | |||||||||||||
Long Gilt, 14 contracts (GBP) | September 2017 | (2,327,337 | ) | (2,289,681 | ) | 37,656 | |||||||||||||
Net unrealized appreciation on futures contracts | $ | 77,904 | |||||||||||||||||
Total return swap agreements7
Counterparty | Notional amount | Termination date | Payments made by the Fund8 | Payments received by the Fund8 | Upfront payments received | Value | Unrealized appreciation | ||||||||||||||||||||||||
CITI | USD | 1,100,000 | 09/20/17 | 3 month USD LIBOR | —9 | $ | 2,991 | $ | 4,251 | $ | 7,242 | ||||||||||||||||||||
73
UBS Total Return Bond Fund
Portfolio of investments
June 30, 2017
Options written activity for the year ended June 30, 2017 was as follows:
| Number of contracts | Premiums received | ||||||||||
Call and/or put options outstanding at June 30, 2016 | 130 | $ | 38,545 | ||||||||
Call and/or put options written | — | — | |||||||||
Call and/or put options terminated in closing purchase transactions | (130 | ) | (38,545 | ) | |||||||
Call and/or put options expired prior to exercise | — | — | |||||||||
Call and/or put options outstanding at June 30, 2017 | — | $ | — | ||||||||
| Premiums received | |||||||
Swaptions & foreign exchange options outstanding at June 30, 2016 | $ | 105,847 | |||||
Swaptions & foreign exchange options written | 540,429 | ||||||
Swaptions & foreign exchange options terminated in closing purchase transactions | (646,276 | ) | |||||
Swaptions & foreign exchange options expired prior to exercise | — | ||||||
Swaptions & foreign exchange options outstanding at June 30, 2017 | $ | — | |||||
Fair valuation summary
The following is a summary of the fair valuations according to the inputs used as of June 30, 2017 in valuing the Fund's investments. In the event a Fund holds investments for which fair value is measured using the NAV per share practical expedient (or its equivalent), a separate column will be added to the fair value hierarchy table; this is intended to permit reconciliation to the amounts presented in the Portfolio of investments.
Description | Unadjusted quoted prices in active markets for identical investments (Level 1) | Other significant observable inputs (Level 2) | Unobservable inputs (Level 3) | Total | |||||||||||||||
Assets | |||||||||||||||||||
Corporate bonds | $ | — | $ | 20,883,324 | $ | — | $ | 20,883,324 | |||||||||||
Asset-backed securities | — | 6,626,618 | — | 6,626,618 | |||||||||||||||
Commercial mortgage-backed securities | — | 4,225,388 | — | 4,225,388 | |||||||||||||||
Mortgage-backed securities | — | 11,733,613 | — | 11,733,613 | |||||||||||||||
Municipal bond | — | 365,578 | — | 365,578 | |||||||||||||||
Non-U.S. government obligations | — | 2,970,669 | — | 2,970,669 | |||||||||||||||
U.S. government agency obligation | — | 199,148 | — | 199,148 | |||||||||||||||
U.S. treasury obligations | — | 2,265,133 | — | 2,265,133 | |||||||||||||||
Preferred stock | 103,560 | — | — | 103,560 | |||||||||||||||
Short-term investment | 4,607,470 | — | — | 4,607,470 | |||||||||||||||
Forward foreign currency contracts | — | 30,479 | — | 30,479 | |||||||||||||||
Futures contracts | 129,158 | — | — | 129,158 | |||||||||||||||
Swap agreements, at value | — | 4,251 | — | 4,251 | |||||||||||||||
Total | $ | 4,840,188 | $ | 49,304,201 | $ | — | $ | 54,144,389 | |||||||||||
Liabilities | |||||||||||||||||||
Forward foreign currency contracts | $ | — | $ | (14,216 | ) | $ | — | $ | (14,216 | ) | |||||||||
Futures contracts | (51,254 | ) | — | — | (51,254 | ) | |||||||||||||
Total | $ | (51,254 | ) | $ | (14,216 | ) | $ | — | $ | (65,470 | ) | ||||||||
74
UBS Total Return Bond Fund
Portfolio of investments
June 30, 2017
At June 30, 2017, there were no transfers between Level 1 and Level 2. At June 30, 2016, $17,940,956 of short-term investments were classified within Level 2 and are now classified within Level 1 in accordance with the investment valuation leveling policy.
Portfolio footnotes
1 Security exempt from registration pursuant to Rule 144A under the Securities Act of 1933. These securities are considered liquid, unless noted otherwise, and may be resold in transactions exempt from registration, normally to qualified institutional buyers.
2 Variable or floating rate security. The interest rate shown is the current rate at the period end and changes periodically.
3 Perpetual investment. Date shown reflects the next call date.
4 Security is being fair valued by a valuation committee under the direction of the board of trustees.
5 Security was purchased pursuant to Regulation S under the Securities Act of 1933, which exempts from registration securities offered and sold outside of the United States. Such a security cannot be sold in the United States without either an effective registration statement filed pursuant to the Securities Act of 1933, or pursuant to an exemption from registration.
6 Debt security whose principal and/or interest payments are adjusted for inflation, unlike debt securities that make fixed principal and interest payments. The interest rate paid by the securities is fixed, while the principal value rises or falls based on changes in an index. Thus, if inflation occurs, the principal and interest payments on the securities are adjusted accordingly to protect investors from inflationary loss. During a deflationary period, the principal and interest payments decrease, although the securities' principal amounts will not drop below their face amounts at maturity. In exchange for the inflation protection, the securities generally pay lower interest rates than typical government securities from the issuer's country. Only if inflation occurs will securities offer a higher real yield than a conventional security of the same maturity.
7 Illiquid investment at the period end.
8 Payments made or received are based on the notional amount.
9 Payment is based on the performance of the underlying Markit iBoxx USD Liquid High Yield Index.
See accompanying notes to financial statements.
75
UBS Municipal Bond Fund
Portfolio performance
For the 12 months ended June 30, 2017, Class A shares of UBS Municipal Bond Fund (the "Fund") declined 1.11% (Class A shares returned -3.32% after the deduction of the maximum sales charge), while Class P shares declined 0.97%. For comparison purposes, the Fund's benchmark, the Bloomberg Barclays Municipal Bond Index (the "Index"), declined 0.49%, and the Bloomberg Barclays Municipal Managed Money Intermediate (1–17) Index returned -0.64% over the same time period. (Class P shares have lower expenses than other share classes of the Fund. Returns for all share classes over various time periods are shown on page 78; please note that the Fund's returns do not reflect the deduction of taxes that a shareholder could pay on Fund distributions or the redemption of Fund shares, while the Index returns do not reflect the deduction of fees and expenses.)
The Fund posted a negative return during the reporting period and underperformed its benchmark. This was primarily due to an underweight to the one- to seven-year portion of the municipal yield curve and an overweight to AAA-rated municipal securities.
Portfolio performance summary1
What worked
• Duration positioning was a positive for performance. Having a shorter duration than that of the benchmark was rewarded as the overall municipal market generated negative results during the reporting period.
What didn't work:
• Yield curve positioning detracted from results. In particular, an underweight to the short end of the municipal yield curve (1–7 year maturities) was a headwind for results as this portion of the curve outperformed the Index. (The yield curve plots the interest rates, at a set point in time, of bonds having equal credit quality, but differing maturity dates.)
• An overweight to AAA-rated municipal bonds was not beneficial, as lower rated securities outperformed their higher quality counterparts during the reporting period.
• Security selection of A-rated municipal securities detracted from results.
• Positioning in certain sectors detracted from performance. In particular, underweights to the housing and industrial development revenue/pollution control revenue sectors were headwinds for results as they outperformed the Index.
Outlook
The municipal fixed income market has been in a strong technical position since the end of tax season. Year-to-date, aggregate net inflows into tax-exempt mutual funds have totaled about $5.3 billion, according to J.P. Morgan. Compared to the fourth quarter of 2016, which saw a mass exodus from tax-exempts, 2017 has seen a strong demand rebound amid a higher rate environment. We anticipate that this trend will continue through the summer, as July and August are heavy maturity and coupon-paying months.
Robust demand for securities inside of five years, coupled with lower supply, has pushed prices to more expensive levels than we have seen in a while. While rising rates tend to lead to underperformance in municipals, we believe this is unlikely. The supply/demand imbalances that we are seeing—the strong demand for shorter-term securities and the not-quite-as-strong demand for longer-term securities due to fears of a rate rise—should continue to support the municipal market.
1 For a detailed commentary on the market environment in general during the reporting period, see pages 3-4.
76
UBS Municipal Bond Fund
From a credit perspective, generally, we continue to favor AA- and AAA-rated bonds at tighter spreads rather than reach for yield in the A and BBB categories, though A and BBB may become more attractive if spreads widen further. While we maintain no exposure to Puerto Rico, we are closely following events on the island to determine if there exists any lesson to be learned for potential future investments in the market. Credit contagion and ensuing credit spread widening are a real possibility. The need to be relative-value driven, selective and carry out an in-depth credit analysis when purchasing A and BBB credits remains.
This letter is intended to assist shareholders in understanding how the Fund performed during the 12 months ended June 30, 2017. The views and opinions in the letter were current as of August 18, 2017. They are not guarantees of future performance or investment results and should not be taken as investment advice. Investment decisions reflect a variety of factors, and we reserve the right to change our views about individual securities, sectors and markets at any time. As a result, the views expressed should not be relied upon as a forecast of the Fund's future investment intent. We encourage you to consult your financial advisor regarding your personal investment program.
Mutual funds are sold by prospectus only. You should read it carefully and consider a fund's investment objectives, risks, charges, expenses and other important information contained in the prospectus before investing. Prospectuses for most of our funds can be obtained from your financial advisor, by calling UBS Funds at 800-647 1568 or by visiting our Web site at www.ubs.com/am-us.
77
UBS Municipal Bond Fund
Average annual total returns for periods ended 06/30/17 (unaudited)
1 year | Inception1 | ||||||||||
Before deducting maximum sales charge | |||||||||||
Class A2 | (1.11 | )% | 2.55 | % | |||||||
Class C3 | (1.71 | )% | 2.02 | % | |||||||
Class P4 | (0.97 | )% | 2.76 | % | |||||||
After deducting maximum sales charge | |||||||||||
Class A2 | (3.32 | )% | 1.66 | % | |||||||
Class C3 | (2.44 | )% | 2.02 | % | |||||||
Bloomberg Barclays Municipal Bond Index5 | (0.49 | )% | 3.06 | % | |||||||
Bloomberg Barclays Municipal Managed Money Intermediate (1-17) Index6 | (0.64 | )% | 2.87 | % | |||||||
The annualized gross and net expense ratios, respectively, for each class of shares as in the October 28, 2016 prospectuses were as follows: Class A—1.15% and 0.65%; Class C—1.65% and 1.15%; Class P—0.89% and 0.40%. Net expenses reflect fee waivers and/or expense reimbursements, if any, pursuant to an agreement that is in effect to cap the expenses. The Trust, with respect to the Fund, and UBS Asset Management (Americas) Inc., the Fund's investment advisor ("UBS AM (Americas)" or the "Advisor"), have entered into a written agreement pursuant to which the Advisor has agreed to waive a portion of its management fees and/or to reimburse expenses (excluding expenses incurred through investment in other investment companies, interest, taxes, brokerage commissions and extraordinary expenses) to the extent necessary so that the Fund's ordinary operating expenses (excluding expenses incurred through investment in other investment companies, interest, taxes, brokerage commissions and extraordinary expenses), through the period ending October 27, 2017, do not exceed 0.65% for Class A shares, 1.15% for Class C shares and 0.40% for Class P shares. Pursuant to the written agreement, the Advisor is entitled to be reimbursed for any fees it waives and expenses it reimburses to the extent such reimbursement can be made during the three years following the period during which such fee waivers and expense reimbursements were made, provided that the reimbursement of the Advisor by the Fund will not cause the Fund to exceed any applicable expense limit that is in place for the Fund. The fee waiver/expense reimbursement agreement may be terminated by the Fund's Board of Trustees at any time and also will terminate automatically upon the expiration or termination of the Fund's advisory contract with the Advisor. Upon termination of the fee waiver/expense reimbursement agreement, however, UBS AM (Americas)'s three year recoupment rights will survive.
1 Inception date of all shares of UBS Municipal Bond Fund and the indices is November 10, 2014.
2 Maximum sales charge for Class A shares is 2.25%. Class A shares bear ongoing 12b-1 service fees.
3 Maximum contingent deferred sales charge for Class C shares is 0.75% imposed on redemptions and is reduced to 0% after one year. Class C shares bear ongoing 12b-1 distribution and service fees.
4 Class P shares do not bear initial or contingent deferred sales charges or ongoing 12b-1 service and distribution fees, but Class P shares held through advisory programs may be subject to a program fee, which, if included, would have reduced performance.
5 The Bloomberg Barclays Municipal Bond Index is an unmanaged index designed to measure the total return of the US dollar denominated tax exempt bond market. Investors should note that indices do not reflect the deduction of fees and expenses.
6 The Bloomberg Barclays Municipal Managed Money Intermediate (1-17) Index is an unmanaged sub-index of the Barclays Municipal Managed Money Index, which is a rules-based, market-value-weighted index designed to track the performance of municipal securities issued by state and local municipalities whose interest is exempt from federal income tax and the federal alternative minimum tax. Investors should note that indices do not reflect the deduction of fees and expenses.
Prior to August 3, 2015, a 1% redemption fee was imposed on sales or exchanges of any class of shares of the Fund made during the specified holding period.
Past performance does not predict future performance, and the performance information provided does not reflect the deduction of taxes that a shareholder could pay on Fund distributions or the redemption of Fund shares. The return and principal value of an investment will fluctuate, so that an investor's shares, when redeemed, may be worth more or less than their original cost. Performance results assume reinvestment of all dividends and capital gain distributions at net asset value on the ex-dividend dates. Current performance may be higher or lower than the performance data quoted. For month-end performance figures, please visit www.ubs.com/us-mutualfundperformance.
78
UBS Municipal Bond Fund
Illustration of an assumed investment of $10,000 in Class A shares (adjusted for 2.25% maximum sales charge) and $5,000,000 in Class P shares (unaudited)
The following two graphs depict the performance of UBS Municipal Bond Fund Class A and Class P shares versus the Bloomberg Barclays Municipal Bond Index and Bloomberg Barclays Municipal Managed Money Intermediate (1-17) Index from November 10, 2014, which is the inception date of the two classes, through June 30, 2017. The performance of Class C shares will vary based upon the different class specific expenses and sales charges. The performance provided does not reflect the deduction of taxes that a shareholder could pay on Fund distributions or the redemption of Fund shares. Past performance is no guarantee of future results. Share price and returns will vary with market conditions; investors may realize a gain or loss upon redemption.
UBS Municipal Bond Fund Class A vs. Bloomberg Barclays Municipal Bond Index and Bloomberg Barclays Municipal Managed Money Intermediate (1-17) Index
Wealth value with dividends reinvested. Initial investment for Class A Shares as of November 10, 2014 = $9,775
The Fund's growth of an assumed $10,000 investment is adjusted for the maximum sales charge of 2.25%.

UBS Municipal Bond Fund Class P vs. Bloomberg Barclays Municipal Bond Index and Bloomberg Barclays Municipal Managed Money Intermediate (1-17) Index
Wealth value with dividends reinvested. Initial investment for Class P shares as of November 10, 2014 = $5,000,000

Past performance does not predict future performance, and the performance information provided does not reflect the deduction of taxes that a shareholder could pay on Fund distributions or the redemption of Fund shares. The return and principal value of an investment will fluctuate, so that an investor's shares, when redeemed, may be worth more or less than their original cost. Performance results assume reinvestment of all dividends and capital gain distributions at net asset value on the ex-dividend dates. Current performance may be higher or lower than the performance data quoted. For month-end performance figures, please visit www.ubs.com/us-mutualfundperformance.
79
UBS Municipal Bond Fund
Portfolio statistics—June 30, 2017 (unaudited)1
Summary of municipal securities by state
| Percentage of net assets | |||||||
Long-term municipal bonds | |||||||
Arizona | 1.22 | % | |||||
California | 4.79 | ||||||
Colorado | 1.42 | ||||||
Connecticut | 3.85 | ||||||
District of Columbia | 0.96 | ||||||
Florida | 12.31 | ||||||
Georgia | 1.35 | ||||||
Hawaii | 1.37 | ||||||
Illinois | 11.84 | ||||||
Kentucky | 2.19 | ||||||
Maryland | 2.05 | ||||||
Massachusetts | 3.40 | ||||||
Michigan | 1.85 | ||||||
Mississippi | 1.01 | ||||||
Missouri | 0.78 | ||||||
Nebraska | 2.99 | ||||||
Nevada | 1.71 | ||||||
New Jersey | 4.81 | ||||||
New York | 6.68 | ||||||
Pennsylvania | 8.21 | ||||||
Rhode Island | 4.96 | ||||||
Tennessee | 0.94 | ||||||
Texas | 15.48 | ||||||
Washington | 0.95 | ||||||
Wisconsin | 1.76 | ||||||
Total long-term municipal bonds | 98.88 | % | |||||
Short-term investment | 0.05 | ||||||
Total investments | 98.93 | % | |||||
Cash and other assets, less liabilities | 1.07 | ||||||
Net assets | 100.00 | % | |||||
1 The Fund's portfolio is actively managed and its composition will vary over time.
80
UBS Municipal Bond Fund
Portfolio of investments
June 30, 2017
| Face amount | Value | ||||||||||
Long-term municipal bonds: 98.88% | |||||||||||
Arizona: 1.22% | |||||||||||
| Salt River Project Agricultural Improvement and Power District, Electric System Revenue Bonds, Series A, 5.000%, due 01/01/23 | $ | 1,325,000 | $ | 1,567,528 | |||||||
California: 4.79% | |||||||||||
| California State Public Works Board Revenue Bonds, Series F, 5.000%, due 05/01/26 | 1,500,000 | 1,807,590 | |||||||||
| Golden State Tobacco Securitization Corp., Enhanced Tobacco Settlement, Asset-Backed Revenue Bonds, Series A, 5.000%, due 06/01/32 | 1,000,000 | 1,157,580 | |||||||||
5.000%, due 06/01/33 | 650,000 | 748,930 | |||||||||
| State of California, Various Purpose, GO Bonds, 5.000%, due 08/01/24 | 2,000,000 | 2,434,980 | |||||||||
6,149,080 | |||||||||||
Colorado: 1.42% | |||||||||||
| City and County of Denver, Airport System Revenue Bonds, Series A, 5.000%, due 11/15/23 | 1,545,000 | 1,828,461 | |||||||||
Connecticut: 3.85% | |||||||||||
| Connecticut Health & Educational Facilities Authority, Fairfield University Revenue Bonds, Series M, 5.000%, due 07/01/181 | 1,100,000 | 1,144,693 | |||||||||
| State of Connecticut, GO Bonds, Series A, 5.000%, due 04/15/25 | 1,250,000 | 1,461,275 | |||||||||
| Series B, 5.000%, due 04/15/25 | 2,000,000 | 2,338,040 | |||||||||
4,944,008 | |||||||||||
District of Columbia: 0.96% | |||||||||||
| District of Columbia, GO Bonds, Series E, 5.000%, due 06/01/25 | 1,000,000 | 1,228,580 | |||||||||
Florida: 12.31% | |||||||||||
| Central Florida Expressway Authority Revenue Bonds, Series B, 5.000%, due 07/01/34 | 1,000,000 | 1,155,910 | |||||||||
| Miami-Dade County Revenue Bonds, 5.000%, due 10/01/26 | 1,000,000 | 1,209,010 | |||||||||
| Pinellas County Health Facilities Authority, Baycare Health Systems Revenue Bonds, Series A-1, 0.930%, due 11/01/382 | 3,000,000 | 3,000,000 | |||||||||
| School Board of Volusia County, Certificates Refunding, Master Lease Program, COP, Series B, 5.000%, due 08/01/31 | 1,000,000 | 1,144,640 | |||||||||
| Face amount | Value | ||||||||||
| School District of St. Lucie County, Sales Tax Revenue Bonds, AGM, 5.000%, due 10/01/26 | $ | 1,020,000 | $ | 1,213,239 | |||||||
| South Florida Water Management District, COP, Series 2015, 5.000%, due 10/01/34 | 1,000,000 | 1,157,080 | |||||||||
| The School Board of Broward County, COP, Series B, 5.000%, due 07/01/30 | 2,000,000 | 2,323,640 | |||||||||
| The School Board of Miami-Dade County, COP, Series A, 5.000%, due 05/01/31 | 1,000,000 | 1,143,200 | |||||||||
| Series D, 5.000%, due 02/01/23 | 1,000,000 | 1,166,520 | |||||||||
5.000%, due 11/01/31 | 1,000,000 | 1,139,260 | |||||||||
| The School Board of Palm Beach County, COP, Series B, 5.000%, due 08/01/31 | 1,000,000 | 1,161,320 | |||||||||
15,813,819 | |||||||||||
Georgia: 1.35% | |||||||||||
| State of Georgia, GO Bonds, Series F, 5.000%, due 07/01/26 | 1,385,000 | 1,740,737 | |||||||||
Hawaii: 1.37% | |||||||||||
| City & County of Honolulu, Wastewater System Revenue Bonds, Series B, 5.000%, due 07/01/35 | 1,500,000 | 1,754,490 | |||||||||
Illinois: 11.84% | |||||||||||
| City of Chicago O'Hare International Airport, Senior Lien Revenue Bonds, Series B, 5.000%, due 01/01/30 | 1,000,000 | 1,156,000 | |||||||||
5.000%, due 01/01/31 | 1,050,000 | 1,209,180 | |||||||||
5.250%, due 01/01/29 | 500,000 | 578,350 | |||||||||
| Series C, 5.000%, due 01/01/23 | 2,900,000 | 3,394,044 | |||||||||
| County of Cook, GO Bonds, Series A, 5.000%, due 11/15/20 | 1,830,000 | 1,999,037 | |||||||||
5.000%, due 11/15/26 | 1,500,000 | 1,731,780 | |||||||||
| Illinois Finance Authority, Sherman Health Systems Revenue Bonds, Series A, 5.500%, due 08/01/171 | 1,000,000 | 1,003,980 | |||||||||
| Illinois State Toll Highway Authority Revenue Bonds, Series B, 5.000%, due 01/01/27 | 1,000,000 | 1,191,540 | |||||||||
5.000%, due 01/01/40 | 1,000,000 | 1,124,360 | |||||||||
| State of Illinois, Sales Tax Revenue Bonds, 5.000%, due 06/15/22 | 1,105,000 | 1,245,202 | |||||||||
81
UBS Municipal Bond Fund
Portfolio of investments
June 30, 2017
| Face amount | Value | ||||||||||
Long-term municipal bonds—(Continued) | |||||||||||
Illinois—(Concluded) | |||||||||||
| NATL-RE, 5.750%, due 06/15/20 | $ | 510,000 | $ | 566,743 | |||||||
15,200,216 | |||||||||||
Kentucky: 2.19% | |||||||||||
| Kentucky Property & Buildings Community Project No. 87 Revenue Bonds, AGC, 5.250%, due 02/01/191 | 2,635,000 | 2,807,724 | |||||||||
Maryland: 2.05% | |||||||||||
| State of Maryland, GO Bonds, 5.000%, due 06/01/26 | 2,180,000 | 2,629,451 | |||||||||
Massachusetts: 3.40% | |||||||||||
| Massachusetts Health and Educational Facilities Authority, Childrens Hospital Revenue Bonds, Series N-4, 0.890%, due 10/01/492 | 300,000 | 300,000 | |||||||||
| The Commonwealth of Massachusetts, Consolidated Loan of 2016, GO Bonds, Series A, 5.000%, due 03/01/34 | 1,125,000 | 1,298,993 | |||||||||
| The Commonwealth of Massachusetts, GO Bonds, Series B, 5.000%, due 07/01/22 | 780,000 | 912,553 | |||||||||
| Series D, 5.000%, due 07/01/26 | 1,500,000 | 1,860,735 | |||||||||
4,372,281 | |||||||||||
Michigan: 1.85% | |||||||||||
| Michigan Municipal Bond Authority, Clean Water Revolving Fund Revenue Bonds, 5.000%, due 10/01/17 | 1,160,000 | 1,172,365 | |||||||||
| State Building Authority of Michigan, Facilities Program Revenue Bonds, Series I, 5.000%, due 04/15/21 | 1,060,000 | 1,201,309 | |||||||||
2,373,674 | |||||||||||
Mississippi: 1.01% | |||||||||||
| Mississippi Business Finance Corp., Gulf Opportunity Zone, Industrial Development, Chevron USA, Inc., Project Revenue Bonds, Series B, 0.980%, due 12/01/302 | 500,000 | 500,000 | |||||||||
| Series C, 0.830%, due 12/01/302 | 100,000 | 100,000 | |||||||||
| Series F, 0.880%, due 12/01/302 | 200,000 | 200,000 | |||||||||
| Mississippi Development Bank, Industrial Water System Project, GO Bonds, 0.830%, due 12/01/392 | 500,000 | 500,000 | |||||||||
1,300,000 | |||||||||||
| Face amount | Value | ||||||||||
Missouri: 0.78% | |||||||||||
| Missouri Health and Educational Facilities Authority, Washington University Revenue Bonds, Series D, 0.830%, due 09/01/302 | $ | 1,000,000 | $ | 1,000,000 | |||||||
Nebraska: 2.99% | |||||||||||
| Douglas County Hospital Authority No. 2 Revenue Bonds, 5.000%, due 05/15/25 | 1,250,000 | 1,507,900 | |||||||||
| Public Power Generation Agency, Whelan Energy Center Unit-2 Revenue Bonds, Series A, 5.000%, due 01/01/24 | 2,000,000 | 2,334,940 | |||||||||
3,842,840 | |||||||||||
Nevada: 1.71% | |||||||||||
| Clark County, Las Vegas-Mccarran International Airport Revenue Bonds, Series C, 5.000%, due 07/01/27 | 1,815,000 | 2,202,775 | |||||||||
New Jersey: 4.81% | |||||||||||
| New Jersey Turnpike Authority Revenue Bonds, Series A, 5.000%, due 01/01/27 | 1,000,000 | 1,177,960 | |||||||||
| Series E, 5.000%, due 01/01/34 | 860,000 | 974,793 | |||||||||
| State of New Jersey, GO Bonds, 5.000%, due 06/01/18 | 500,000 | 517,075 | |||||||||
5.000%, due 06/01/20 | 1,000,000 | 1,086,180 | |||||||||
| Series Q, 5.000%, due 08/15/19 | 1,500,000 | 1,606,290 | |||||||||
| Series T, 5.000%, due 06/01/20 | 750,000 | 814,635 | |||||||||
6,176,933 | |||||||||||
New York: 6.68% | |||||||||||
| City of New York, GO Bonds, Series E, 5.000%, due 08/01/26 | 1,000,000 | 1,240,220 | |||||||||
| City of New York, Tax Exempt, GO Bonds, Series I, 5.000%, due 08/01/17 | 1,040,000 | 1,043,857 | |||||||||
| New York City Municipal Water Finance Authority, Water and Sewer System, Second General Resolution Fiscal 2017 Revenue Bonds, Series EE, 5.000%, due 06/15/33 | 1,000,000 | 1,198,680 | |||||||||
| New York City Transitional Finance Authority Revenue Bonds, Subseries A-4, 0.800%, due 08/01/432 | 200,000 | 200,000 | |||||||||
| Subseries B-1, 5.000%, due 08/01/33 | 1,000,000 | 1,162,820 | |||||||||
| Subseries E-1, 5.000%, due 02/01/32 | 1,000,000 | 1,176,870 | |||||||||
82
UBS Municipal Bond Fund
Portfolio of investments
June 30, 2017
| Face amount | Value | ||||||||||
Long-term municipal bonds—(Concluded) | |||||||||||
New York—(Concluded) | |||||||||||
| New York State Dormitory Authority, Sales Tax Revenue Bonds, Series A, 5.000%, due 03/15/25 | $ | 2,000,000 | $ | 2,463,820 | |||||||
| Triborough Bridge and Tunnel Authority, MTA Bridges and Tunnels Revenue Bonds, Subseries B-2, 0.830%, due 01/01/322 | 100,000 | 100,000 | |||||||||
8,586,267 | |||||||||||
Pennsylvania: 8.21% | |||||||||||
| City of Philadelphia, GO Bonds, 5.000%, due 08/01/20 | 1,590,000 | 1,751,783 | |||||||||
| Series A, 5.000%, due 08/01/22 | 1,000,000 | 1,150,740 | |||||||||
| Commonwealth of Pennsylvania, GO Bonds, 5.000%, due 08/15/21 | 1,700,000 | 1,936,028 | |||||||||
5.000%, due 09/15/25 | 1,500,000 | 1,804,455 | |||||||||
| Pennsylvania Turnpike Commission Revenue Bonds, Series A-1, 5.000%, due 12/01/24 | 1,500,000 | 1,798,515 | |||||||||
| Pennsylvania Turnpike Commission, Oil Franchise Tax Revenue Bonds, Series A, 5.000%, due 12/01/22 | 1,000,000 | 1,173,020 | |||||||||
| Philadelphia Municipal Authority, City Agreement Revenue Bonds, Series A, 5.000%, due 11/15/17 | 910,000 | 924,123 | |||||||||
10,538,664 | |||||||||||
Rhode Island: 4.96% | |||||||||||
| Rhode Island Health & Educational Building Corp., Tockwotton Home Issue Revenue Bonds, 8.380%, due 01/01/211 | 2,000,000 | 2,464,400 | |||||||||
| Rhode Island Industrial Facilities Corp., Exxon Mobil Project, Marine Terminal Refunding Revenue Bonds, 0.830%, due 02/01/252 | 2,800,000 | 2,800,000 | |||||||||
| Tobacco Settlement Fing Corp., Asset-Backed Revenue Bonds, Series A, 5.000%, due 06/01/21 | 1,000,000 | 1,100,560 | |||||||||
6,364,960 | |||||||||||
Tennessee: 0.94% | |||||||||||
| State of Tennessee, GO Bonds, Series B, 5.000%, due 08/01/23 | 1,000,000 | 1,202,310 | |||||||||
Texas: 15.48% | |||||||||||
| Austin Community College District Public Facility Corp., Round Rock Campus Revenue Bonds, 5.000%, due 08/01/24 | 1,000,000 | 1,184,930 | |||||||||
| Face amount | Value | ||||||||||
| Dallas Area Rapid Transit, Sales Tax Revenue Bonds, Series B, 5.000%, due 12/01/22 | $ | 1,600,000 | $ | 1,888,656 | |||||||
| Garland Independent School District, GO Bonds, PSF-GTD, 5.000%, due 02/15/25 | 1,200,000 | 1,467,180 | |||||||||
| Harris County, Health Facilities Development Corp., Methodist Hospital System Revenue Bonds, Series A-2, 0.900%, due 12/01/412 | 700,000 | 700,000 | |||||||||
| Houston Independent School District, GO Bonds, PSF-GTD, 5.000%, due 02/15/26 | 2,000,000 | 2,476,260 | |||||||||
| Lower Neches Valley Authority Industrial Development Corp., Exxon Mobil Project Revenue Bonds, 0.750%, due 05/01/462 | 100,000 | 100,000 | |||||||||
0.750%, due 11/01/512 | 200,000 | 200,000 | |||||||||
| North Texas Tollway Authority Revenue Bonds, Series A, 5.000%, due 01/01/27 | 3,030,000 | 3,553,463 | |||||||||
| Plano Independent School District, GO Bonds, PSF-GTD, 5.000%, due 02/15/25 | 2,000,000 | 2,450,080 | |||||||||
| State of Texas Transportation Commission Highway Fund First Tier Revenue Bonds, Series A, 5.000%, due 10/01/25 | 1,000,000 | 1,236,590 | |||||||||
| Texas A&M University, Financing System Revenue Bonds, Series C, 5.000%, due 05/15/26 | 2,275,000 | 2,823,161 | |||||||||
| Texas Transportation Commission, GO Bonds, Series A, 5.000%, due 10/01/29 | 1,500,000 | 1,801,245 | |||||||||
19,881,565 | |||||||||||
Washington: 0.95% | |||||||||||
| Central Puget Sound Regional Transit Authority, Sales Tax and Motor Vehicle Excise Tax Revenue Bonds, Series S-1, 5.000%, due 11/01/24 | 1,000,000 | 1,225,490 | |||||||||
Wisconsin: 1.76% | |||||||||||
| Shawano School District, GO Bonds, AGC, 4.250%, due 03/01/181 | 500,000 | 510,945 | |||||||||
| State of Wisconsin, GO Bonds, Series A, 5.000%, due 05/01/34 | 1,500,000 | 1,746,750 | |||||||||
2,257,695 | |||||||||||
| Total long-term municipal bonds (cost $126,262,696) | 126,989,548 | ||||||||||
83
UBS Municipal Bond Fund
Portfolio of investments
June 30, 2017
Shares | Value | ||||||||||
Short-term investment: 0.05% | |||||||||||
Investment company: 0.05% | |||||||||||
| JPMorgan U.S. Government Money Market Fund, Capital Shares (cost $61,339) | 61,339 | $ | 61,339 | ||||||||
| Total investments: 98.93% (cost $126,324,035) | 127,050,887 | ||||||||||
Cash and other assets, less liabilities: 1.07% | 1,372,003 | ||||||||||
Net assets: 100.00% | $ | 128,422,890 | |||||||||
Notes to portfolio of investments
Aggregate cost for federal income tax purposes was $126,324,035; and net unrealized appreciation consisted of:
Gross unrealized appreciation | $ | 1,507,907 | |||||
Gross unrealized depreciation | (781,055 | ) | |||||
Net unrealized appreciation of investments | $ | 726,852 | |||||
For a listing of defined portfolio acronyms, counterparty abbreviations and currency abbreviations that are used throughout the Portfolio of investments as well as the tables that follow, please refer to page 85. Portfolio footnotes begin below.
Fair valuation summary
The following is a summary of the fair valuations according to the inputs used as of June 30, 2017 in valuing the Fund's investments. In the event a Fund holds investments for which fair value is measured using the NAV per share practical expedient (or its equivalent), a separate column will be added to the fair value hierarchy table; this is intended to permit reconciliation to the amounts presented in the Portfolio of investments.
Description | Unadjusted quoted prices in active markets for identical investments (Level 1) | Other significant observable inputs (Level 2) | Unobservable inputs (Level 3) | Total | |||||||||||||||
Assets | |||||||||||||||||||
Long-term municipal bonds | $ | — | $ | 126,989,548 | $ | — | $ | 126,989,548 | |||||||||||
Short-term investment | 61,339 | — | — | 61,339 | |||||||||||||||
Total | $ | 61,339 | $ | 126,989,548 | $ | — | $ | 127,050,887 | |||||||||||
At June 30, 2017, there were no transfers between Level 1 and Level 2. At June 30, 2016, $37,563 of short-term investments were classified within Level 2 and are now classified within Level 1 in accordance with the investment valuation leveling policy.
Portfolio footnotes
1 Security is prerefunded or escrowed to maturity. The maturity date shown is the earlier of the reset date or the date of the prerefunded call.
2 Variable or floating rate security. The interest rate shown is the current rate at the period end and changes periodically.
84
The UBS Funds
June 30, 2017
Portfolio acronyms
ADR American Depositary Receipt
AGC Assured Guaranty Corp.
AGM Assured Guaranty Municipal
CDO Collateralized Debt Obligation
COP Certificate of Participation
CVA Dutch Certification—Depository Certificate
FHLMC Federal Home Loan Mortgage Corporation
FNMA Federal National Mortgage Association
GNMA Government National Mortgage Association
GO General Obligation
LIBOR London Interbank Offered Rate
NATL-RE Reinsured by National Public Finance Guarantee Corp.
PSF-GTD Permanent School Fund Guaranteed
REIT Real Estate Investment Trust
TBA To Be Announced. TBA security is purchased on a forward commitment basis with an approximate principal amount (generally +/-1.0%) and no definite maturity date. The actual principal amount and maturity date will be determined upon settlement, when the specific mortgage pools are assigned.
Counterparty abbreviations
BB Barclays Bank plc
CITI Citibank NA
CSI Credit Suisse International
GSI Goldman Sachs International
JPMCB JPMorgan Chase Bank
MSC Morgan Stanley & Co.
Currency abbreviations
ARS Argentine Peso
AUD Australian Dollar
BRL Brazilian Real
CAD Canadian Dollar
CHF Swiss Franc
CNY Chinese Yuan
COP Colombian Peso
CZK Czech Koruna
EUR Euro
GBP Great Britain Pound
HKD Hong Kong Dollar
IDR Indonesian Rupiah
ILS Israel New Shekel
INR Indian Rupee
JPY Japanese Yen
KRW Korean Won
MXN Mexican Peso
MYR Malaysian Ringgit
NOK Norwegian Krone
NZD New Zealand Dollar
RUB Russian Ruble
SEK Swedish Krona
SGD Singapore Dollar
THB Thai Baht
TRY Turkish Lira
TWD Taiwan Dollar
USD United States Dollar
See accompanying notes to financial statements.
85
The UBS Funds
June 30, 2017 (unaudited)
Explanation of expense disclosure
As a shareholder of the Funds, you incur two types of costs: (1) transactional costs (as applicable); including sales charges (loads); and (2) ongoing costs, including management fees; service and/or distribution (12b-1) fees (if applicable); and other Fund expenses. This example is intended to help you understand your ongoing costs (in dollars) of investing in each Fund and to compare these costs with the ongoing costs of investing in other mutual funds.
The example below is based on an investment of $1,000 invested at the beginning of the period and held for the entire period, January 1, 2017 to June 30, 2017.
Actual expenses
The first line for each class of shares in the table below provides information about actual account values and actual expenses. You may use the information in this line, together with the amount you invested, to estimate the expenses that you paid over a period. Simply divide your account value by $1,000 (for example, an $8,600 account value divided by $1,000 = 8.6), then multiply the result by the number in the first line under the heading entitled "Expenses paid during period" to estimate the expenses you paid on your account during this period.
Hypothetical example for comparison purposes
The second line for each class of shares in the table below provides information about hypothetical account values and hypothetical expenses based on that Fund's actual expense ratios for each class of shares and an assumed rate of return of 5% per year before expenses, which is not that Fund's actual return for each class of shares. The hypothetical account values and expenses may not be used to estimate the actual ending account balance or expenses you paid for the period. You may use this information to compare the ongoing costs of investing in a Fund and other funds. To do so, compare this 5% hypothetical example with the 5% hypothetical examples that appear in the shareholder reports of other funds.
Please note that the expenses shown in the table are meant to highlight your ongoing costs only and do not reflect any transactional costs (as applicable), such as sales charges (loads). Therefore, the second line in the table for each class of shares is useful in comparing ongoing costs only, and will not help you determine the relative total costs of owning different funds. In addition, if these transactional costs were included, your costs would have been higher.
This projection assumes that annualized expense ratios were in effect during the period January 1, 2017 to June 30, 2017.
86
The UBS Funds
June 30, 2017 (unaudited)
| Beginning account value January 1, 2017 | Ending account value June 30, 2017 | Expenses paid during period* 01/01/17 – 06/30/17 | Expense ratio during period | ||||||||||||||||||||
UBS Dynamic Alpha Fund | |||||||||||||||||||||||
Class A | Actual | $ | 1,000.00 | $ | 1,038.20 | $ | 6.82 | 1.35 | % | ||||||||||||||
Hypothetical (5% annual return before expenses) | 1,000.00 | 1,018.10 | 6.76 | 1.35 | |||||||||||||||||||
Class C | Actual | 1,000.00 | 1,032.40 | 10.58 | 2.10 | ||||||||||||||||||
Hypothetical (5% annual return before expenses) | 1,000.00 | 1,014.38 | 10.49 | 2.10 | |||||||||||||||||||
Class P | Actual | 1,000.00 | 1,039.00 | 5.56 | 1.10 | ||||||||||||||||||
Hypothetical (5% annual return before expenses) | 1,000.00 | 1,019.34 | 5.51 | 1.10 | |||||||||||||||||||
UBS Global Allocation Fund | |||||||||||||||||||||||
Class A | Actual | 1,000.00 | 1,088.80 | 6.21 | 1.20 | ||||||||||||||||||
Hypothetical (5% annual return before expenses) | 1,000.00 | 1,018.84 | 6.01 | 1.20 | |||||||||||||||||||
Class C | Actual | 1,000.00 | 1,086.20 | 10.09 | 1.95 | ||||||||||||||||||
Hypothetical (5% annual return before expenses) | 1,000.00 | 1,015.12 | 9.74 | 1.95 | |||||||||||||||||||
Class P | Actual | 1,000.00 | 1,091.70 | 4.93 | 0.95 | ||||||||||||||||||
Hypothetical (5% annual return before expenses) | 1,000.00 | 1,020.08 | 4.76 | 0.95 | |||||||||||||||||||
UBS International Sustainable Equity Fund | |||||||||||||||||||||||
Class A | Actual | 1,000.00 | 1,157.00 | 6.69 | 1.25 | ||||||||||||||||||
Hypothetical (5% annual return before expenses) | 1,000.00 | 1,018.60 | 6.26 | 1.25 | |||||||||||||||||||
Class C | Actual | 1,000.00 | 1,152.90 | 10.68 | 2.00 | ||||||||||||||||||
Hypothetical (5% annual return before expenses) | 1,000.00 | 1,014.88 | 9.99 | 2.00 | |||||||||||||||||||
Class P | Actual | 1,000.00 | 1,157.80 | 5.35 | 1.00 | ||||||||||||||||||
Hypothetical (5% annual return before expenses) | 1,000.00 | 1,019.84 | 5.01 | 1.00 | |||||||||||||||||||
UBS U.S. Large Cap Equity Fund | |||||||||||||||||||||||
Class A | Actual | 1,000.00 | 1,119.00 | 4.99 | 0.95 | ||||||||||||||||||
Hypothetical (5% annual return before expenses) | 1,000.00 | 1,020.08 | 4.76 | 0.95 | |||||||||||||||||||
Class C | Actual | 1,000.00 | 1,114.60 | 8.91 | 1.70 | ||||||||||||||||||
Hypothetical (5% annual return before expenses) | 1,000.00 | 1,016.36 | 8.50 | 1.70 | |||||||||||||||||||
Class P | Actual | 1,000.00 | 1,120.50 | 3.68 | 0.70 | ||||||||||||||||||
Hypothetical (5% annual return before expenses) | 1,000.00 | 1,021.32 | 3.51 | 0.70 | |||||||||||||||||||
* Expenses are equal to each Fund's annualized net expense ratios, multiplied by the average account value over the period, multiplied by 181 divided by 365 (to reflect the one-half year period).
87
The UBS Funds
June 30, 2017 (unaudited)
| Beginning account value January 1, 2017 | Ending account value June 30, 2017 | Expenses paid during period* 01/01/17 – 06/30/17 | Expense ratio during period | ||||||||||||||||||||
UBS U.S. Small Cap Growth Fund | |||||||||||||||||||||||
Class A | Actual | $ | 1,000.00 | $ | 1,088.60 | $ | 6.42 | 1.24 | % | ||||||||||||||
Hypothetical (5% annual return before expenses) | 1,000.00 | 1,018.65 | 6.21 | 1.24 | |||||||||||||||||||
Class C | Actual | 1,000.00 | 1,084.10 | 10.28 | 1.99 | ||||||||||||||||||
Hypothetical (5% annual return before expenses) | 1,000.00 | 1,014.93 | 9.94 | 1.99 | |||||||||||||||||||
Class P | Actual | 1,000.00 | 1,089.90 | 5.13 | 0.99 | ||||||||||||||||||
Hypothetical (5% annual return before expenses) | 1,000.00 | 1,019.89 | 4.96 | 0.99 | |||||||||||||||||||
UBS Total Return Bond Fund | |||||||||||||||||||||||
Class A | Actual | 1,000.00 | 1,028.60 | 3.77 | 0.75 | ||||||||||||||||||
Hypothetical (5% annual return before expenses) | 1,000.00 | 1,021.08 | 3.76 | 0.75 | |||||||||||||||||||
Class C | Actual | 1,000.00 | 1,026.00 | 6.28 | 1.25 | ||||||||||||||||||
Hypothetical (5% annual return before expenses) | 1,000.00 | 1,018.60 | 6.26 | 1.25 | |||||||||||||||||||
Class P | Actual | 1,000.00 | 1,029.10 | 2.52 | 0.50 | ||||||||||||||||||
Hypothetical (5% annual return before expenses) | 1,000.00 | 1,022.32 | 2.51 | 0.50 | |||||||||||||||||||
UBS Municipal Bond Fund | |||||||||||||||||||||||
Class A | Actual | 1,000.00 | 1,030.00 | 3.27 | 0.65 | ||||||||||||||||||
Hypothetical (5% annual return before expenses) | 1,000.00 | 1,021.57 | 3.26 | 0.65 | |||||||||||||||||||
Class C | Actual | 1,000.00 | 1,026.50 | 5.78 | 1.15 | ||||||||||||||||||
Hypothetical (5% annual return before expenses) | 1,000.00 | 1,019.09 | 5.76 | 1.15 | |||||||||||||||||||
Class P | Actual | 1,000.00 | 1,030.30 | 2.01 | 0.40 | ||||||||||||||||||
Hypothetical (5% annual return before expenses) | 1,000.00 | 1,022.81 | 2.01 | 0.40 | |||||||||||||||||||
* Expenses are equal to each Fund's annualized net expense ratios, multiplied by the average account value over the period, multiplied by 181 divided by 365 (to reflect the one-half year period).
88
This page intentionally left blank.
89
The UBS Funds
Financial Statements
Statement of assets and liabilities—June 30, 2017
| UBS Dynamic Alpha Fund | UBS Global Allocation Fund | UBS International Sustainable Equity Fund | |||||||||||||
Assets | |||||||||||||||
Investments, at cost | |||||||||||||||
Unaffiliated issuers | $ | 154,474,970 | $ | 230,937,783 | $ | 34,458,124 | |||||||||
Affiliated issuers | — | 68,261,190 | — | ||||||||||||
Investment of cash collateral received from securities loaned1 | 8,106,675 | 16,889,087 | 6,685 | ||||||||||||
Foreign currency | 1,462,234 | 3,278,340 | 44,488 | ||||||||||||
$ | 164,043,879 | $ | 319,366,400 | $ | 34,509,297 | ||||||||||
Investments, at value | |||||||||||||||
Unaffiliated issuers | $ | 147,086,185 | $ | 249,599,594 | $ | 38,056,682 | |||||||||
Affiliated issuers | — | 76,061,006 | — | ||||||||||||
Investment of cash collateral received from securities loaned1 | 8,106,675 | 16,889,087 | 6,685 | ||||||||||||
Foreign currency | 1,469,648 | 3,281,588 | 44,563 | ||||||||||||
Cash | — | — | — | ||||||||||||
Receivables | |||||||||||||||
Investment securities sold | 544,215 | 8,635,766 | — | ||||||||||||
Interest | 872,957 | 170,977 | 49 | ||||||||||||
Fund shares sold | 8,954 | 5,134 | 40,635 | ||||||||||||
Foreign tax reclaims | 323 | 88,411 | 36,049 | ||||||||||||
Due from Advisor | — | — | 828 | ||||||||||||
Dividends | 3,472 | 111,318 | 61,490 | ||||||||||||
Variation margin on futures contracts | 546,833 | — | — | ||||||||||||
Variation margin on centrally cleared swap agreements | 52,876 | 1,765,688 | — | ||||||||||||
Due from broker | 4,709,165 | 198,527 | — | ||||||||||||
Cash collateral for futures contracts | 5,273,691 | 5,799,275 | — | ||||||||||||
Cash collateral for swap agreements | 1,190,202 | 3,905,317 | — | ||||||||||||
Outstanding swap agreements, at value2 | 25,305 | — | — | ||||||||||||
Unrealized appreciation on forward foreign currency contracts | 212,573 | 456,739 | — | ||||||||||||
Other assets | 28,071 | 34,059 | 26,399 | ||||||||||||
Total assets | 170,131,145 | 367,002,486 | 38,273,380 | ||||||||||||
Liabilities | |||||||||||||||
Payables | |||||||||||||||
Cash collateral from securities loaned | 8,106,675 | 16,889,087 | 6,685 | ||||||||||||
Investment securities purchased | 129,536 | 8,896,778 | 45,827 | ||||||||||||
Investment advisory and administration fee | 94,626 | 151,349 | — | ||||||||||||
Custody and fund accounting fees | 33,027 | 48,753 | 18,696 | ||||||||||||
Fund shares redeemed | 434,537 | 1,420,586 | 272,839 | ||||||||||||
Distribution and service fees | 23,508 | 114,565 | 4,885 | ||||||||||||
Trustees' fees | 17,235 | 27,162 | 8,446 | ||||||||||||
Due to custodian | 667 | 260 | — | ||||||||||||
Variation margin on futures contracts | — | 387,262 | — | ||||||||||||
Accrued expenses | 198,099 | 316,136 | 112,445 | ||||||||||||
Outstanding swap agreements, at value2 | 18,547 | — | — | ||||||||||||
Unrealized depreciation on forward foreign currency contracts | 1,676,324 | 1,090,356 | 58 | ||||||||||||
Total liabilities | 10,732,781 | 29,342,294 | 469,881 | ||||||||||||
Net assets | $ | 159,398,364 | $ | 337,660,192 | $ | 37,803,499 | |||||||||
1 The market value of securities loaned by UBS Dynamic Alpha Fund, UBS Global Allocation Fund, UBS International Sustainable Equity Fund, UBS U.S. Large Cap Equity Fund and UBS U.S. Small Cap Growth Fund as of June 30, 2017 was $7,921,141, $16,501,729, $6,365, $740,827 and $4,905,836, respectively.
2 Net upfront payments received by UBS Dynamic Alpha Fund were $54,247.
90
The UBS Funds
| UBS U.S. Large Cap Equity Fund | UBS U.S. Small Cap Growth Fund | ||||||||||
Assets | |||||||||||
Investments, at cost | |||||||||||
Unaffiliated issuers | $ | 26,772,410 | $ | 88,933,042 | |||||||
Affiliated issuers | — | — | |||||||||
Investment of cash collateral received from securities loaned1 | 756,972 | 5,019,751 | |||||||||
Foreign currency | — | — | |||||||||
$ | 27,529,382 | $ | 93,952,793 | ||||||||
Investments, at value | |||||||||||
Unaffiliated issuers | $ | 31,128,295 | $ | 108,465,953 | |||||||
Affiliated issuers | — | — | |||||||||
Investment of cash collateral received from securities loaned1 | 756,972 | 5,019,751 | |||||||||
Foreign currency | — | — | |||||||||
Cash | — | 1,194 | |||||||||
Receivables | |||||||||||
Investment securities sold | 557,927 | 2,231,124 | |||||||||
Interest | 85 | 1,079 | |||||||||
Fund shares sold | 50,000 | 89,303 | |||||||||
Foreign tax reclaims | — | — | |||||||||
Due from Advisor | 25,039 | — | |||||||||
Dividends | 22,771 | 25,135 | |||||||||
Variation margin on futures contracts | — | — | |||||||||
Variation margin on centrally cleared swap agreements | — | — | |||||||||
Due from broker | — | — | |||||||||
Cash collateral for futures contracts | — | — | |||||||||
Cash collateral for swap agreements | — | — | |||||||||
Outstanding swap agreements, at value2 | — | — | |||||||||
Unrealized appreciation on forward foreign currency contracts | — | — | |||||||||
Other assets | 19,010 | 21,832 | |||||||||
Total assets | 32,560,099 | 115,855,371 | |||||||||
Liabilities | |||||||||||
Payables | |||||||||||
Cash collateral from securities loaned | 756,972 | 5,019,751 | |||||||||
Investment securities purchased | 643,118 | 2,668,522 | |||||||||
Investment advisory and administration fee | — | 40,506 | |||||||||
Custody and fund accounting fees | 13,829 | 18,599 | |||||||||
Fund shares redeemed | 422,236 | 616,112 | |||||||||
Distribution and service fees | 4,048 | 9,030 | |||||||||
Trustees' fees | 8,758 | 17,204 | |||||||||
Due to custodian | 404 | — | |||||||||
Variation margin on futures contracts | — | — | |||||||||
Accrued expenses | 90,927 | 122,567 | |||||||||
Outstanding swap agreements, at value2 | — | — | |||||||||
Unrealized depreciation on forward foreign currency contracts | — | — | |||||||||
Total liabilities | 1,940,292 | 8,512,291 | |||||||||
Net assets | $ | 30,619,807 | $ | 107,343,080 | |||||||
See accompanying notes to financial statements.
91
The UBS Funds
Financial Statements
Statement of assets and liabilities—June 30, 2017 (continued)
| UBS Total Return Bond Fund | |||||||
Assets | |||||||
Investments, at cost | |||||||
Unaffiliated issuers | $ | 53,624,532 | |||||
Foreign currency | 371,267 | ||||||
$ | 53,995,799 | ||||||
Investments, at value | |||||||
Unaffiliated issuers | $ | 53,980,501 | |||||
Foreign currency | 372,937 | ||||||
Receivables | |||||||
Investment securities sold | 2,108,620 | ||||||
Interest | 333,664 | ||||||
Fund shares sold | — | ||||||
Due from Advisor | 27,788 | ||||||
Dividends | 4,998 | ||||||
Variation margin on futures contracts | 78,458 | ||||||
Due from broker | 13,715 | ||||||
Cash collateral for futures contracts | 193,254 | ||||||
Outstanding swap agreements, at value1 | 4,251 | ||||||
Unrealized appreciation on forward foreign currency contracts | 30,479 | ||||||
Other assets | — | ||||||
Total assets | 57,148,665 | ||||||
Liabilities | |||||||
Payables | |||||||
Investment securities purchased | 6,895,522 | ||||||
Investment advisory and administration fee | — | ||||||
Custody and fund accounting fees | 14,196 | ||||||
Fund shares redeemed | 31,079 | ||||||
Distribution and service fees | 39 | ||||||
Trustees' fees | 10,071 | ||||||
Due to custodian | 1,270 | ||||||
Accrued expenses | 175,987 | ||||||
Unrealized depreciation on forward foreign currency contracts | 14,216 | ||||||
Total liabilities | 7,142,380 | ||||||
Net assets | $ | 50,006,285 | |||||
1 Net upfront payments received by UBS Total Return Bond Fund were $2,991.
92
The UBS Funds
| UBS Municipal Bond Fund | |||||||
Assets | |||||||
Investments, at cost | |||||||
Unaffiliated issuers | $ | 126,324,035 | |||||
Foreign currency | — | ||||||
$ | 126,324,035 | ||||||
Investments, at value | |||||||
Unaffiliated issuers | $ | 127,050,887 | |||||
Foreign currency | — | ||||||
Receivables | |||||||
Investment securities sold | — | ||||||
Interest | 1,572,011 | ||||||
Fund shares sold | 140,269 | ||||||
Due from Advisor | — | ||||||
Dividends | 274 | ||||||
Variation margin on futures contracts | — | ||||||
Due from broker | — | ||||||
Cash collateral for futures contracts | — | ||||||
Outstanding swap agreements, at value1 | — | ||||||
Unrealized appreciation on forward foreign currency contracts | — | ||||||
Other assets | 19,526 | ||||||
Total assets | 128,782,967 | ||||||
Liabilities | |||||||
Payables | |||||||
Investment securities purchased | — | ||||||
Investment advisory and administration fee | 4,945 | ||||||
Custody and fund accounting fees | 18,026 | ||||||
Fund shares redeemed | 214,726 | ||||||
Distribution and service fees | 5,308 | ||||||
Trustees' fees | 14,279 | ||||||
Due to custodian | — | ||||||
Accrued expenses | 102,793 | ||||||
Unrealized depreciation on forward foreign currency contracts | — | ||||||
Total liabilities | 360,077 | ||||||
Net assets | $ | 128,422,890 | |||||
See accompanying notes to financial statements.
93
The UBS Funds
Financial Statements
Statement of assets and liabilities—June 30, 2017 (continued)
| UBS Dynamic Alpha Fund | UBS Global Allocation Fund | UBS International Sustainable Equity Fund | |||||||||||||
Net assets consist of: | |||||||||||||||
Beneficial interest | $ | 451,073,990 | $ | 1,173,846,867 | $ | 42,763,164 | |||||||||
Accumulated undistributed (distributions in excess of) net investment income (loss) | (1,137,644 | ) | 3,584,343 | 408,459 | |||||||||||
Accumulated net realized gain (loss) | (282,348,481 | ) | (865,398,425 | ) | (8,967,789 | ) | |||||||||
Net unrealized appreciation (depreciation) | (8,189,501 | ) | 25,627,407 | 3,599,665 | |||||||||||
Net assets | $ | 159,398,364 | $ | 337,660,192 | $ | 37,803,499 | |||||||||
Class A: | |||||||||||||||
Net assets | $ | 43,930,271 | $ | 174,147,680 | $ | 15,811,644 | |||||||||
Shares outstanding | 6,741,147 | 15,110,929 | 1,650,030 | ||||||||||||
Net asset value and redemption proceeds per share | $ | 6.52 | $ | 11.52 | $ | 9.58 | |||||||||
Offering price per share (NAV per share plus maximum sales charge) | $ | 6.90 | $ | 12.19 | $ | 10.14 | |||||||||
Class C: | |||||||||||||||
Net assets | $ | 17,450,382 | $ | 96,356,478 | $ | 2,039,673 | |||||||||
Shares outstanding | 2,878,622 | 8,598,353 | 218,134 | ||||||||||||
Net asset value and offering price per share | $ | 6.06 | $ | 11.21 | $ | 9.35 | |||||||||
Redemption proceeds per share (NAV per share less maximum contingent deferred sales charge) | $ | 6.00 | $ | 11.10 | $ | 9.26 | |||||||||
Class P: | |||||||||||||||
Net assets | $ | 98,017,711 | $ | 67,156,034 | $ | 19,952,182 | |||||||||
Shares outstanding | 14,726,195 | 5,702,879 | 2,075,160 | ||||||||||||
Net asset value per share, offering price per share, and redemption proceeds per share | $ | 6.66 | $ | 11.78 | $ | 9.61 | |||||||||
94
The UBS Funds
| UBS U.S. Large Cap Equity Fund | UBS U.S. Small Cap Growth Fund | ||||||||||
Net assets consist of: | |||||||||||
Beneficial interest | $ | 106,237,116 | $ | 69,879,087 | |||||||
Accumulated undistributed (distributions in excess of) net investment income (loss) | 161,956 | — | |||||||||
Accumulated net realized gain (loss) | (80,135,150 | ) | 17,931,082 | ||||||||
Net unrealized appreciation (depreciation) | 4,355,885 | 19,532,911 | |||||||||
Net assets | $ | 30,619,807 | $ | 107,343,080 | |||||||
Class A: | |||||||||||
Net assets | $ | 11,856,543 | $ | 27,464,570 | |||||||
Shares outstanding | 379,900 | 1,292,008 | |||||||||
Net asset value and redemption proceeds per share | $ | 31.21 | $ | 21.26 | |||||||
Offering price per share (NAV per share plus maximum sales charge) | $ | 33.03 | $ | 22.50 | |||||||
Class C: | |||||||||||
Net assets | $ | 2,009,316 | $ | 4,108,834 | |||||||
Shares outstanding | 67,285 | 229,351 | |||||||||
Net asset value and offering price per share | $ | 29.86 | $ | 17.92 | |||||||
Redemption proceeds per share (NAV per share less maximum contingent deferred sales charge) | $ | 29.56 | $ | 17.74 | |||||||
Class P: | |||||||||||
Net assets | $ | 16,753,948 | $ | 75,769,676 | |||||||
Shares outstanding | 534,583 | 3,306,243 | |||||||||
Net asset value per share, offering price per share, and redemption proceeds per share | $ | 31.34 | $ | 22.92 | |||||||
See accompanying notes to financial statements.
95
The UBS Funds
Financial Statements
Statement of assets and liabilities—June 30, 2017 (continued)
| UBS Total Return Bond Fund | |||||||
Net assets consist of: | |||||||
Beneficial interest | $ | 52,912,410 | |||||
Distributions in excess of net investment income | (207,039 | ) | |||||
Accumulated net realized loss | (3,161,043 | ) | |||||
Net unrealized appreciation | 461,957 | ||||||
Net assets | $ | 50,006,285 | |||||
Class A: | |||||||
Net assets | $ | 43,726 | |||||
Shares outstanding | 2,927 | ||||||
Net asset value and redemption proceeds per share | $ | 14.94 | |||||
Offering price per share (NAV per share plus maximum sales charge) | $ | 15.52 | |||||
Class C: | |||||||
Net assets | $ | 43,348 | |||||
Shares outstanding | 2,902 | ||||||
Net asset value and offering price per share | $ | 14.94 | |||||
Redemption proceeds per share (NAV per share less maximum contingent deferred sales charge) | $ | 14.83 | |||||
Class P: | |||||||
Net assets | $ | 49,919,211 | |||||
Shares outstanding | 3,340,745 | ||||||
Net asset value per share, offering price per share, and redemption proceeds per share | $ | 14.94 | |||||
96
The UBS Funds
| UBS Municipal Bond Fund | |||||||
Net assets consist of: | |||||||
Beneficial interest | $ | 128,620,875 | |||||
Distributions in excess of net investment income | (40,569 | ) | |||||
Accumulated net realized loss | (884,268 | ) | |||||
Net unrealized appreciation | 726,852 | ||||||
Net assets | $ | 128,422,890 | |||||
Class A: | |||||||
Net assets | $ | 21,006,972 | |||||
Shares outstanding | 2,054,175 | ||||||
Net asset value and redemption proceeds per share | $ | 10.23 | |||||
Offering price per share (NAV per share plus maximum sales charge) | $ | 10.47 | |||||
Class C: | |||||||
Net assets | $ | 5,815,391 | |||||
Shares outstanding | 568,935 | ||||||
Net asset value and offering price per share | $ | 10.22 | |||||
Redemption proceeds per share (NAV per share less maximum contingent deferred sales charge) | $ | 10.14 | |||||
Class P: | |||||||
Net assets | $ | 101,600,527 | |||||
Shares outstanding | 9,939,161 | ||||||
Net asset value per share, offering price per share, and redemption proceeds per share | $ | 10.22 | |||||
See accompanying notes to financial statements.
97
The UBS Funds
Financial Statements
Statement of operations—For the year ended June 30, 2017
| UBS Dynamic Alpha Fund | UBS Global Allocation Fund | UBS International Sustainable Equity Fund | |||||||||||||
Investment income | |||||||||||||||
Dividends | $ | 265,245 | $ | 4,773,229 | $ | 888,705 | |||||||||
Interest | 3,172,188 | 581,197 | — | ||||||||||||
Securities lending | 13,068 | 55,127 | 6,721 | ||||||||||||
Foreign tax withheld | — | (224,672 | ) | (87,196 | ) | ||||||||||
Total income | 3,450,501 | 5,184,881 | 808,230 | ||||||||||||
Expenses | |||||||||||||||
Advisory and administration | 1,793,577 | 3,220,091 | 245,911 | ||||||||||||
Distribution and service: | |||||||||||||||
Class A | 136,992 | 449,568 | 21,395 | ||||||||||||
Class C | 216,389 | 1,035,771 | 22,269 | ||||||||||||
Transfer agency and related service fees: | |||||||||||||||
Class A | 30,004 | 114,532 | 4,418 | ||||||||||||
Class C | 20,243 | 94,174 | 2,046 | ||||||||||||
Class P | 90,750 | 38,222 | 9,446 | ||||||||||||
Custodian and fund accounting | 112,607 | 154,440 | 54,818 | ||||||||||||
Federal and state registration | 44,896 | 44,298 | 42,531 | ||||||||||||
Professional services | 157,704 | 190,976 | 141,444 | ||||||||||||
Shareholder reports | 63,164 | 138,711 | 12,814 | ||||||||||||
Trustees | 67,186 | 103,689 | 32,106 | ||||||||||||
Other | 73,446 | 105,002 | 30,534 | ||||||||||||
Total expenses | 2,806,958 | 5,689,474 | 619,732 | ||||||||||||
Fee waivers and/or expense reimbursements by Advisor | (315,834 | ) | (508,271 | ) | (294,288 | ) | |||||||||
Net expenses | 2,491,124 | 5,181,203 | 325,444 | ||||||||||||
Net investment income (loss) | 959,377 | 3,678 | 482,786 | ||||||||||||
Net realized gain (loss) on: | |||||||||||||||
Investments in unaffiliated issuers | (1,283,316 | ) | 14,245,559 | 187,027 | |||||||||||
Investments in affiliated issuers | — | 1,357,843 | — | ||||||||||||
Futures contracts | 6,377,287 | (3,305,311 | ) | — | |||||||||||
Options written | 50,250 | 297,753 | — | ||||||||||||
Swap agreements | 814,067 | 3,275,607 | — | ||||||||||||
Forward foreign currency contracts | 3,724,517 | 1,044,355 | 15,541 | ||||||||||||
Foreign currency transactions | (580,302 | ) | 742,796 | (31,107 | ) | ||||||||||
Net realized gain | 9,102,503 | 17,658,602 | 171,461 | ||||||||||||
Change in net unrealized appreciation (depreciation) on: | |||||||||||||||
Investments in unaffiliated issuers | 2,453,517 | 19,514,985 | 5,178,448 | ||||||||||||
Investments in affiliated issuers | — | 7,509,050 | — | ||||||||||||
Futures contracts | 1,583,061 | (42,542 | ) | — | |||||||||||
Options written | — | (147,028 | ) | — | |||||||||||
Swap agreements | (313,350 | ) | (604,398 | ) | — | ||||||||||
Forward foreign currency contracts | (3,395,426 | ) | (631,910 | ) | (58 | ) | |||||||||
Translation of other assets and liabilities denominated in foreign currency | 404,973 | (262,431 | ) | 1,920 | |||||||||||
Change in net unrealized appreciation (depreciation) | 732,775 | 25,335,726 | 5,180,310 | ||||||||||||
Net realized and unrealized gain | 9,835,278 | 42,994,328 | 5,351,771 | ||||||||||||
Net increase in net assets resulting from operations | $ | 10,794,655 | $ | 42,998,006 | $ | 5,834,557 | |||||||||
98
The UBS Funds
| UBS U.S. Large Cap Equity Fund | UBS U.S. Small Cap Growth Fund | ||||||||||
Investment income | |||||||||||
Dividends | $ | 409,962 | $ | 701,280 | |||||||
Interest | — | — | |||||||||
Securities lending | 2,700 | 68,239 | |||||||||
Foreign tax withheld | — | — | |||||||||
Total income | 412,662 | 769,519 | |||||||||
Expenses | |||||||||||
Advisory and administration | 221,545 | 1,470,249 | |||||||||
Distribution and service: | |||||||||||
Class A | 25,765 | 72,115 | |||||||||
Class C | 21,155 | 42,721 | |||||||||
Transfer agency and related service fees: | |||||||||||
Class A | 5,335 | 44,213 | |||||||||
Class C | 1,723 | 5,526 | |||||||||
Class P | 3,924 | 92,264 | |||||||||
Custodian and fund accounting | 41,982 | 64,345 | |||||||||
Federal and state registration | 41,560 | 45,316 | |||||||||
Professional services | 127,411 | 124,385 | |||||||||
Shareholder reports | 11,213 | 25,616 | |||||||||
Trustees | 32,987 | 64,455 | |||||||||
Other | 20,171 | 35,613 | |||||||||
Total expenses | 554,771 | 2,086,818 | |||||||||
Fee waivers and/or expense reimbursements by Advisor | (307,281 | ) | (395,062 | ) | |||||||
Net expenses | 247,490 | 1,691,756 | |||||||||
Net investment income (loss) | 165,172 | (922,237 | ) | ||||||||
Net realized gain (loss) on: | |||||||||||
Investments in unaffiliated issuers | 1,946,218 | 27,041,263 | |||||||||
Investments in affiliated issuers | — | — | |||||||||
Futures contracts | — | — | |||||||||
Options written | — | — | |||||||||
Swap agreements | — | — | |||||||||
Forward foreign currency contracts | — | — | |||||||||
Foreign currency transactions | — | — | |||||||||
Net realized gain | 1,946,218 | 27,041,263 | |||||||||
Change in net unrealized appreciation (depreciation) on: | |||||||||||
Investments in unaffiliated issuers | 3,907,417 | 9,556,957 | |||||||||
Investments in affiliated issuers | — | — | |||||||||
Futures contracts | — | — | |||||||||
Options written | — | — | |||||||||
Swap agreements | — | — | |||||||||
Forward foreign currency contracts | — | — | |||||||||
Translation of other assets and liabilities denominated in foreign currency | — | — | |||||||||
Change in net unrealized appreciation (depreciation) | 3,907,417 | 9,556,957 | |||||||||
Net realized and unrealized gain | 5,853,635 | 36,598,220 | |||||||||
Net increase in net assets resulting from operations | $ | 6,018,807 | $ | 35,675,983 | |||||||
See accompanying notes to financial statements.
99
The UBS Funds
Financial Statements
Statement of operations—For the year ended June 30, 2017 (continued)
| UBS Total Return Bond Fund | |||||||
Investment income | |||||||
Dividends | $ | 66,855 | |||||
Interest | 1,961,808 | ||||||
Total income | 2,028,663 | ||||||
Expenses | |||||||
Advisory and administration | 394,078 | ||||||
Distribution and service: | |||||||
Class A | 50 | ||||||
Class C | 364 | ||||||
Transfer agency and related service fees: | |||||||
Class A | 32 | ||||||
Class C | 44 | ||||||
Class P | 56,628 | ||||||
Custodian and fund accounting | 42,234 | ||||||
Federal and state registration | 12,096 | ||||||
Professional services | 153,090 | ||||||
Shareholder reports | 54,411 | ||||||
Trustees | 39,560 | ||||||
Amortization of offering costs | 107,002 | ||||||
Other | 28,660 | ||||||
Total expenses | 888,249 | ||||||
Fee waivers and/or expense reimbursements by Advisor | (544,583 | ) | |||||
Net expenses | 343,666 | ||||||
Net investment income | 1,684,997 | ||||||
Net realized gain (loss) on: | |||||||
Investments in unaffiliated issuers | 1,300,264 | ||||||
Futures contracts | (334,447 | ) | |||||
Options written | 185,282 | ||||||
Swap agreements | 38,305 | ||||||
Forward foreign currency contracts | 47,034 | ||||||
Foreign currency transactions | (27,651 | ) | |||||
Net realized gain (loss) | 1,208,787 | ||||||
Change in net unrealized appreciation (depreciation) on: | |||||||
Investments in unaffiliated issuers | (1,830,944 | ) | |||||
Futures contracts | 177,608 | ||||||
Options written | 2,999 | ||||||
Swap agreements | 12,434 | ||||||
Forward foreign currency contracts | (10,884 | ) | |||||
Translation of other assets and liabilities denominated in foreign currency | 8,614 | ||||||
Change in net unrealized appreciation (depreciation) | (1,640,173 | ) | |||||
Net realized and unrealized loss | (431,386 | ) | |||||
Net increase (decrease) in net assets resulting from operations | $ | 1,253,611 | |||||
100
The UBS Funds
| UBS Municipal Bond Fund | |||||||
Investment income | |||||||
Dividends | $ | 1,066 | |||||
Interest | 2,609,565 | ||||||
Total income | 2,610,631 | ||||||
Expenses | |||||||
Advisory and administration | 596,546 | ||||||
Distribution and service: | |||||||
Class A | 55,546 | ||||||
Class C | 46,746 | ||||||
Transfer agency and related service fees: | |||||||
Class A | 2,098 | ||||||
Class C | 1,647 | ||||||
Class P | 19,365 | ||||||
Custodian and fund accounting | 53,523 | ||||||
Federal and state registration | 54,897 | ||||||
Professional services | 135,501 | ||||||
Shareholder reports | 19,101 | ||||||
Trustees | 55,040 | ||||||
Amortization of offering costs | — | ||||||
Other | 23,668 | ||||||
Total expenses | 1,063,678 | ||||||
Fee waivers and/or expense reimbursements by Advisor | (458,253 | ) | |||||
Net expenses | 605,425 | ||||||
Net investment income | 2,005,206 | ||||||
Net realized gain (loss) on: | |||||||
Investments in unaffiliated issuers | (635,940 | ) | |||||
Futures contracts | (93,705 | ) | |||||
Options written | — | ||||||
Swap agreements | — | ||||||
Forward foreign currency contracts | — | ||||||
Foreign currency transactions | — | ||||||
Net realized gain (loss) | (729,645 | ) | |||||
Change in net unrealized appreciation (depreciation) on: | |||||||
Investments in unaffiliated issuers | (2,761,625 | ) | |||||
Futures contracts | — | ||||||
Options written | — | ||||||
Swap agreements | — | ||||||
Forward foreign currency contracts | — | ||||||
Translation of other assets and liabilities denominated in foreign currency | — | ||||||
Change in net unrealized appreciation (depreciation) | (2,761,625 | ) | |||||
Net realized and unrealized loss | (3,491,270 | ) | |||||
Net increase (decrease) in net assets resulting from operations | $ | (1,486,064 | ) | ||||
See accompanying notes to financial statements.
101
The UBS Funds
Financial Statements
Statement of changes in net assets
UBS Dynamic Alpha Fund | UBS Global Allocation Fund | ||||||||||||||||||
| Year ended June 30, 2017 | Year ended June 30, 2016 | Year ended June 30, 2017 | Year ended June 30, 2016 | ||||||||||||||||
Operations: | |||||||||||||||||||
Net investment income (loss) | $ | 959,377 | $ | 2,396,025 | $ | 3,678 | $ | (282,902 | ) | ||||||||||
Net realized gain (loss) | 9,102,503 | (44,796,086 | ) | 17,658,602 | (15,818,275 | ) | |||||||||||||
Change in net unrealized appreciation (depreciation) | 732,775 | 10,008,305 | 25,335,726 | (8,564,917 | ) | ||||||||||||||
Contributions from Advisor | — | 214,280 | — | 316,557 | |||||||||||||||
Net increase (decrease) in net assets from operations | 10,794,655 | (32,177,476 | ) | 42,998,006 | (24,349,537 | ) | |||||||||||||
Dividends and distributions to shareholders by class: | |||||||||||||||||||
Class A: | |||||||||||||||||||
Net investment income | — | (2,647,814 | ) | (3,709,639 | ) | (5,354,437 | ) | ||||||||||||
Return of capital | — | (30,207 | ) | — | — | ||||||||||||||
Total Class A dividends and distributions | — | (2,678,021 | ) | (3,709,639 | ) | (5,354,437 | ) | ||||||||||||
Class C: | |||||||||||||||||||
Net investment income | — | (936,550 | ) | (1,163,177 | ) | (2,183,113 | ) | ||||||||||||
Return of capital | — | (10,683 | ) | — | — | ||||||||||||||
Total Class C dividends and distributions | — | (947,233 | ) | (1,163,177 | ) | (2,183,113 | ) | ||||||||||||
Class P: | |||||||||||||||||||
Net investment income | — | (5,913,042 | ) | (1,947,479 | ) | (3,013,026 | ) | ||||||||||||
Return of capital | — | (67,458 | ) | — | — | ||||||||||||||
Total Class P dividends and distributions | — | (5,980,500 | ) | (1,947,479 | ) | (3,013,026 | ) | ||||||||||||
Decrease in net assets from dividends and distributions | — | (9,605,754 | ) | (6,820,295 | ) | (10,550,576 | ) | ||||||||||||
Beneficial interest transactions: | |||||||||||||||||||
Proceeds from shares sold | 6,143,479 | 29,677,803 | 12,635,795 | 9,553,990 | |||||||||||||||
Shares issued on reinvestment of dividends and distributions | — | 9,059,509 | 6,231,895 | 9,531,202 | |||||||||||||||
Cost of shares redeemed | (83,276,893 | ) | (99,285,584 | ) | (115,259,301 | ) | (90,668,225 | ) | |||||||||||
Redemption fees | — | — | — | 378 | |||||||||||||||
Net increase (decrease) in net assets resulting from beneficial interest transactions | (77,133,414 | ) | (60,548,272 | ) | (96,391,611 | ) | (71,582,655 | ) | |||||||||||
Increase (decrease) in net asset | (66,338,759 | ) | (102,331,502 | ) | (60,213,900 | ) | (106,482,768 | ) | |||||||||||
Net assets, beginning of year | 225,737,123 | 328,068,625 | 397,874,092 | 504,356,860 | |||||||||||||||
Net assets, end of year | $ | 159,398,364 | $ | 225,737,123 | $ | 337,660,192 | $ | 397,874,092 | |||||||||||
Accumulated undistributed (distributions in excess) net investment income (loss) | $ | (1,137,644 | ) | $ | (8,555,716 | ) | $ | 3,584,343 | $ | 4,640,197 | |||||||||
102
The UBS Funds
| UBS International Sustainable Equity Fund | UBS U.S. Large Cap Equity Fund | ||||||||||||||||||
| Year ended June 30, 2017 | Year ended June 30, 2016 | Year ended June 30, 2017 | Year ended June 30, 2016 | ||||||||||||||||
Operations: | |||||||||||||||||||
Net investment income (loss) | $ | 482,786 | $ | 439,021 | $ | 165,172 | $ | 307,584 | |||||||||||
Net realized gain (loss) | 171,461 | (520,410 | ) | 1,946,218 | (473,205 | ) | |||||||||||||
Change in net unrealized appreciation (depreciation) | 5,180,310 | (3,713,231 | ) | 3,907,417 | (3,137,879 | ) | |||||||||||||
Contributions from Advisor | — | 39,797 | — | — | |||||||||||||||
Net increase (decrease) in net assets from operations | 5,834,557 | (3,754,823 | ) | 6,018,807 | (3,303,500 | ) | |||||||||||||
Dividends and distributions to shareholders by class: | |||||||||||||||||||
Class A: | |||||||||||||||||||
Net investment income | (107,890 | ) | (69,810 | ) | (96,685 | ) | (132,023 | ) | |||||||||||
Return of capital | — | — | — | — | |||||||||||||||
Total Class A dividends and distributions | (107,890 | ) | (69,810 | ) | (96,685 | ) | (132,023 | ) | |||||||||||
Class C: | |||||||||||||||||||
Net investment income | (26,845 | ) | (15,558 | ) | (5,319 | ) | (12,163 | ) | |||||||||||
Return of capital | — | — | — | — | |||||||||||||||
Total Class C dividends and distributions | (26,845 | ) | (15,558 | ) | (5,319 | ) | (12,163 | ) | |||||||||||
Class P: | |||||||||||||||||||
Net investment income | (369,867 | ) | (218,890 | ) | (197,574 | ) | (454,262 | ) | |||||||||||
Return of capital | — | — | — | — | |||||||||||||||
Total Class P dividends and distributions | (369,867 | ) | (218,890 | ) | (197,574 | ) | (454,262 | ) | |||||||||||
Decrease in net assets from dividends and distributions | (504,602 | ) | (304,258 | ) | (299,578 | ) | (598,448 | ) | |||||||||||
Beneficial interest transactions: | |||||||||||||||||||
Proceeds from shares sold | 13,512,832 | 7,565,514 | 3,903,550 | 6,381,043 | |||||||||||||||
Shares issued on reinvestment of dividends and distributions | 468,472 | 274,911 | 286,088 | 577,488 | |||||||||||||||
Cost of shares redeemed | (5,340,120 | ) | (6,095,200 | ) | (6,340,155 | ) | (16,777,291 | ) | |||||||||||
Redemption fees | — | — | — | 188 | |||||||||||||||
Net increase (decrease) in net assets resulting from beneficial interest transactions | 8,641,184 | 1,745,225 | (2,150,517 | ) | (9,818,572 | ) | |||||||||||||
Increase (decrease) in net asset | 13,971,139 | (2,313,856 | ) | 3,568,712 | (13,720,520 | ) | |||||||||||||
Net assets, beginning of year | 23,832,360 | 26,146,216 | 27,051,095 | 40,771,615 | |||||||||||||||
Net assets, end of year | $ | 37,803,499 | $ | 23,832,360 | $ | 30,619,807 | $ | 27,051,095 | |||||||||||
Accumulated undistributed (distributions in excess) net investment income (loss) | $ | 408,459 | $ | 427,895 | $ | 161,956 | $ | 302,171 | |||||||||||
See accompanying notes to financial statements.
103
The UBS Funds
Financial Statements
Statement of changes in net assets (continued)
UBS U.S. Small Cap Growth Fund | UBS Total Return Bond Fund | ||||||||||||||||||||||
| Year ended June 30, 2017 | Year ended June 30, 2016 | Year ended June 30, 2017 | Nine months ended June 30, 2016 | Year ended September 30, 2015 | |||||||||||||||||||
Operations: | |||||||||||||||||||||||
Net investment income (loss) | $ | (922,237 | ) | $ | (919,714 | ) | $ | 1,684,997 | $ | 3,128,455 | $ | 5,587,745 | |||||||||||
Net realized gain (loss) | 27,041,263 | (975,802 | ) | 1,208,787 | (4,059,029 | ) | (265,409 | ) | |||||||||||||||
Change in net unrealized appreciation (depreciation) | 9,556,957 | (41,105,966 | ) | (1,640,173 | ) | 5,043,486 | (8,068,933 | ) | |||||||||||||||
Net increase (decrease) in net assets from operations | 35,675,983 | (43,001,482 | ) | 1,253,611 | 4,112,912 | (2,746,597 | ) | ||||||||||||||||
Dividends and distributions to shareholders by class: | |||||||||||||||||||||||
Class A: | |||||||||||||||||||||||
Net investment income | — | — | (452 | ) | — | — | |||||||||||||||||
Net realized gain | (1,010,739 | ) | (3,580,313 | ) | — | — | — | ||||||||||||||||
Return of capital | — | — | (5 | ) | — | — | |||||||||||||||||
Total Class A dividends and distributions | (1,010,739 | ) | (3,580,313 | ) | (457 | ) | — | — | |||||||||||||||
Class C: | |||||||||||||||||||||||
Net investment income | — | — | (864 | ) | — | — | |||||||||||||||||
Net realized gain | (164,852 | ) | (515,022 | ) | — | — | — | ||||||||||||||||
Return of capital | — | — | (10 | ) | — | — | |||||||||||||||||
Total Class C dividends and distributions | (164,852 | ) | (515,022 | ) | (874 | ) | — | — | |||||||||||||||
Class P: | |||||||||||||||||||||||
Net investment income | — | — | (1,759,722 | ) | (2,868,246 | ) | (5,638,365 | ) | |||||||||||||||
Net realized gain | (4,314,480 | ) | (10,977,397 | ) | — | — | (480,029 | ) | |||||||||||||||
Return of capital | — | — | (19,932 | ) | — | — | |||||||||||||||||
Total Class P dividends and distributions | (4,314,480 | ) | (10,977,397 | ) | (1,779,654 | ) | (2,868,246 | ) | (6,118,394 | ) | |||||||||||||
Decrease in net assets from dividends and distributions | (5,490,071 | ) | (15,072,732 | ) | (1,780,985 | ) | (2,868,246 | ) | (6,118,394 | ) | |||||||||||||
Beneficial interest transactions: | |||||||||||||||||||||||
Proceeds from shares sold | 28,894,607 | 96,909,755 | 345,280 | 303,562 | — | ||||||||||||||||||
Shares issued on reinvestment of dividends and distributions | 5,212,883 | 13,779,443 | 1,364,650 | 249,928 | — | ||||||||||||||||||
Cost of shares redeemed | (119,609,922 | ) | (120,663,054 | ) | (78,136,932 | ) | (6,441,226 | ) | — | ||||||||||||||
Redemption fees | — | 1,617 | 38,529 | 92,483 | — | ||||||||||||||||||
Net increase (decrease) in net assets resulting from beneficial interest transactions | (85,502,432 | ) | (9,972,239 | ) | (76,388,473 | ) | (5,795,253 | ) | — | ||||||||||||||
Increase (decrease) in net asset | (55,316,520 | ) | (68,046,453 | ) | (76,915,847 | ) | (4,550,587 | ) | (8,864,991 | ) | |||||||||||||
Net assets, beginning of year | 162,659,600 | 230,706,053 | 126,922,132 | 131,472,719 | 140,337,710 | ||||||||||||||||||
Net assets, end of year | $ | 107,343,080 | $ | 162,659,600 | $ | 50,006,285 | $ | 126,922,132 | $ | 131,472,719 | |||||||||||||
Accumulated undistributed (distributions in excess) net investment income (loss) | $ | — | $ | (388,273 | ) | $ | (207,039 | ) | $ | 75,097 | $ | 144,266 | |||||||||||
104
The UBS Funds
UBS Municipal Bond Fund | |||||||||||
| Year ended June 30, 2017 | Year ended June 30, 2016 | ||||||||||
Operations: | |||||||||||
Net investment income (loss) | $ | 2,005,206 | $ | 1,312,103 | |||||||
Net realized gain (loss) | (729,645 | ) | 273,244 | ||||||||
Change in net unrealized appreciation (depreciation) | (2,761,625 | ) | 4,066,059 | ||||||||
Net increase (decrease) in net assets from operations | (1,486,064 | ) | 5,651,406 | ||||||||
Dividends and distributions to shareholders by class: | |||||||||||
Class A: | |||||||||||
Net investment income | (317,347 | ) | (232,100 | ) | |||||||
Net realized gain | (54,279 | ) | — | ||||||||
Return of capital | — | — | |||||||||
Total Class A dividends and distributions | (371,626 | ) | (232,100 | ) | |||||||
Class C: | |||||||||||
Net investment income | (57,086 | ) | (57,551 | ) | |||||||
Net realized gain | (15,735 | ) | — | ||||||||
Return of capital | — | — | |||||||||
Total Class C dividends and distributions | (72,821 | ) | (57,551 | ) | |||||||
Class P: | |||||||||||
Net investment income | (1,630,048 | ) | (1,118,533 | ) | |||||||
Net realized gain | (223,923 | ) | — | ||||||||
Return of capital | — | — | |||||||||
Total Class P dividends and distributions | (1,853,971 | ) | (1,118,533 | ) | |||||||
Decrease in net assets from dividends and distributions | (2,298,418 | ) | (1,408,184 | ) | |||||||
Beneficial interest transactions: | |||||||||||
Proceeds from shares sold | 72,756,643 | 85,280,837 | |||||||||
Shares issued on reinvestment of dividends and distributions | 1,835,254 | 1,172,802 | |||||||||
Cost of shares redeemed | (56,365,873 | ) | (37,585,911 | ) | |||||||
Redemption fees | — | — | |||||||||
Net increase (decrease) in net assets resulting from beneficial interest transactions | 18,226,024 | 48,867,728 | |||||||||
Increase (decrease) in net asset | 14,441,542 | 53,110,950 | |||||||||
Net assets, beginning of year | 113,981,348 | 60,870,398 | |||||||||
Net assets, end of year | $ | 128,422,890 | $ | 113,981,348 | |||||||
Accumulated undistributed (distributions in excess) net investment income (loss) | $ | (40,569 | ) | $ | (43,851 | ) | |||||
See accompanying notes to financial statements.
105
UBS Dynamic Alpha Fund
Financial highlights
The table below sets forth financial data for one share of beneficial interest outstanding throughout each year presented.
Class A
Year ended June 30, | |||||||||||||||||||||||
2017 | 2016 | 2015 | 2014 | 2013 | |||||||||||||||||||
Net asset value, beginning of year | $ | 6.17 | $ | 7.13 | $ | 7.24 | $ | 6.82 | $ | 6.36 | |||||||||||||
Income (loss) from investment operations: | |||||||||||||||||||||||
Net investment income1 | 0.03 | 0.05 | 0.04 | 0.05 | 0.07 | ||||||||||||||||||
Net realized and unrealized gain (loss) | 0.32 | (0.79 | ) | 0.11 | 0.38 | 0.50 | |||||||||||||||||
Net increase from payment by Advisor | — | 0.01 | 0.003 | — | — | ||||||||||||||||||
Total income (loss) from investment operations | 0.35 | (0.73 | ) | 0.15 | 0.43 | 0.57 | |||||||||||||||||
Less dividends/distributions: | |||||||||||||||||||||||
From net investment income | — | (0.23 | ) | (0.26 | ) | (0.01 | ) | (0.11 | ) | ||||||||||||||
Return of capital | — | (0.00 | )3 | — | — | — | |||||||||||||||||
Total dividends/distributions | — | (0.23 | ) | (0.26 | ) | (0.01 | ) | (0.11 | ) | ||||||||||||||
Net asset value, end of year | $ | 6.52 | $ | 6.17 | $ | 7.13 | $ | 7.24 | $ | 6.82 | |||||||||||||
Total investment return2 | 5.84 | % | (10.48 | )%4 | 2.03 | %5 | 6.31 | % | 9.05 | % | |||||||||||||
Ratios to average net assets: | |||||||||||||||||||||||
Expenses before fee waivers and/or expense reimbursement | 1.49 | % | 1.45 | % | 1.43 | % | 1.42 | % | 1.43 | % | |||||||||||||
Expenses after fee waivers and/or expense reimbursement | 1.35 | % | 1.35 | % | 1.35 | % | 1.35 | % | 1.35 | % | |||||||||||||
Net investment income | 0.42 | % | 0.82 | % | 0.58 | % | 0.66 | % | 0.98 | % | |||||||||||||
Supplemental data: | |||||||||||||||||||||||
Net assets, end of year (000's) | $ | 43,930 | $ | 65,741 | $ | 89,421 | $ | 194,185 | $ | 208,369 | |||||||||||||
Portfolio turnover rate | 48 | % | 50 | % | 54 | % | 45 | % | 74 | % | |||||||||||||
Class P
Year ended June 30, | |||||||||||||||||||||||
2017 | 2016 | 2015 | 2014 | 2013 | |||||||||||||||||||
Net asset value, beginning of year | $ | 6.28 | $ | 7.27 | $ | 7.38 | $ | 6.96 | $ | 6.48 | |||||||||||||
Income (loss) from investment operations: | |||||||||||||||||||||||
Net investment income1 | 0.04 | 0.07 | 0.06 | 0.06 | 0.09 | ||||||||||||||||||
Net realized and unrealized gain (loss) | 0.34 | (0.82 | ) | 0.12 | 0.39 | 0.52 | |||||||||||||||||
Net increase from payment by Advisor | — | 0.01 | 0.003 | — | — | ||||||||||||||||||
Total income (loss) from investment operations | 0.38 | (0.74 | ) | 0.18 | 0.45 | 0.61 | |||||||||||||||||
Less dividends/distributions: | |||||||||||||||||||||||
From net investment income | — | (0.25 | ) | (0.29 | ) | (0.03 | ) | (0.13 | ) | ||||||||||||||
Return of capital | — | (0.00 | )3 | — | — | — | |||||||||||||||||
Total dividends/distributions | — | (0.25 | ) | (0.29 | ) | (0.03 | ) | (0.13 | ) | ||||||||||||||
Net asset value, end of year | $ | 6.66 | $ | 6.28 | $ | 7.27 | $ | 7.38 | $ | 6.96 | |||||||||||||
Total investment return2 | 6.05 | % | (10.17 | )%4 | 2.29 | %5 | 6.45 | % | 9.29 | % | |||||||||||||
Ratios to average net assets: | |||||||||||||||||||||||
Expenses before fee waivers and/or expense reimbursement | 1.27 | % | 1.22 | % | 1.20 | % | 1.15 | % | 1.12 | % | |||||||||||||
Expenses after fee waivers and/or expense reimbursement | 1.10 | % | 1.10 | % | 1.10 | % | 1.10 | % | 1.10 | % | |||||||||||||
Net investment income | 0.68 | % | 1.07 | % | 0.84 | % | 0.87 | % | 1.25 | % | |||||||||||||
Supplemental data: | |||||||||||||||||||||||
Net assets, end of year (000's) | $ | 98,018 | $ | 132,725 | $ | 192,777 | $ | 81,168 | $ | 48,113 | |||||||||||||
Portfolio turnover rate | 48 | % | 50 | % | 54 | % | 45 | % | 74 | % | |||||||||||||
1 Calculated using the average shares method.
2 Total investment return is calculated assuming a $10,000 investment on the first day of each year reported, reinvestment of all dividends and distributions, if any, at net asset value on the ex-dividend dates, and a sale at net asset value on the last day of each year reported. The figures do not include any applicable sales charges; results would be lower if they were included. Returns do not reflect the deduction of taxes that a shareholder would pay on Fund dividends/distributions or the redemption of Fund shares.
3 Amount represents less than $0.005 per share.
106
UBS Dynamic Alpha Fund
Financial highlights
Class C
Year ended June 30, | |||||||||||||||||||||||
2017 | 2016 | 2015 | 2014 | 2013 | |||||||||||||||||||
Net asset value, beginning of year | $ | 5.78 | $ | 6.68 | $ | 6.81 | $ | 6.46 | $ | 6.02 | |||||||||||||
Income (loss) from investment operations: | |||||||||||||||||||||||
Net investment income (loss)1 | (0.02 | ) | 0.003 | (0.01 | ) | (0.01 | ) | 0.02 | |||||||||||||||
Net realized and unrealized gain (loss) | 0.30 | (0.73 | ) | 0.09 | 0.36 | 0.48 | |||||||||||||||||
Net increase from payment by Advisor | — | 0.003 | 0.003 | — | — | ||||||||||||||||||
Total income (loss) from investment operations | 0.28 | (0.73 | ) | 0.08 | 0.35 | 0.50 | |||||||||||||||||
Less dividends/distributions: | |||||||||||||||||||||||
From net investment income | — | (0.17 | ) | (0.21 | ) | — | (0.06 | ) | |||||||||||||||
Return of capital | — | (0.00 | )3 | — | — | — | |||||||||||||||||
Total dividends/distributions | — | (0.17 | ) | (0.21 | ) | — | (0.06 | ) | |||||||||||||||
Net asset value, end of year | $ | 6.06 | $ | 5.78 | $ | 6.68 | $ | 6.81 | $ | 6.46 | |||||||||||||
Total investment return2 | 4.84 | % | (11.00 | )%4 | 1.21 | %5 | 5.42 | % | 8.22 | % | |||||||||||||
Ratios to average net assets: | |||||||||||||||||||||||
Expenses before fee waivers and/or expense reimbursement | 2.28 | % | 2.23 | % | 2.19 | % | 2.18 | % | 2.19 | % | |||||||||||||
Expenses after fee waivers and/or expense reimbursement | 2.10 | % | 2.10 | % | 2.10 | % | 2.10 | % | 2.10 | % | |||||||||||||
Net investment income (loss) | (0.33 | )% | 0.07 | % | (0.17 | )% | (0.09 | )% | 0.24 | % | |||||||||||||
Supplemental data: | |||||||||||||||||||||||
Net assets, end of year (000's) | $ | 17,450 | $ | 27,271 | $ | 45,871 | $ | 51,119 | $ | 53,405 | |||||||||||||
Portfolio turnover rate | 48 | % | 50 | % | 54 | % | 45 | % | 74 | % | |||||||||||||
4 During the year ended June 30,2016, the Advisor reimbursed the Fund $128,212, which was determined to be the value of the ineligible services paid for from the Fund's dealing commissions, and $86,068 for a trading error, both reimbursements had no impact on the Fund's total return.
5 During the year ended June 30, 2015, the Advisor reimbursed the Fund for a trading error in the amount of $2,068, which had no impact on the Fund's total return.
See accompanying notes to financial statements.
107
UBS Global Allocation Fund
Financial highlights
The table below sets forth financial data for one share of beneficial interest outstanding throughout each year presented.
Class A
Year ended June 30, | |||||||||||||||||||||||
2017 | 2016 | 2015 | 2014 | 2013 | |||||||||||||||||||
Net asset value, beginning of year | $ | 10.46 | $ | 11.27 | $ | 11.04 | $ | 9.79 | $ | 9.12 | |||||||||||||
Income (loss) from investment operations: | |||||||||||||||||||||||
Net investment income (loss)1 | 0.02 | 0.01 | (0.00 | )3 | 0.02 | 0.01 | |||||||||||||||||
Net realized and unrealized gain (loss) | 1.27 | (0.56 | ) | 0.23 | 1.36 | 0.88 | |||||||||||||||||
Net increase from payment by Advisor | — | 0.01 | — | — | — | ||||||||||||||||||
Total income (loss) from investment operations | 1.29 | (0.54 | ) | 0.23 | 1.38 | 0.89 | |||||||||||||||||
Less dividends/distributions: | |||||||||||||||||||||||
From net investment income | (0.23 | ) | (0.27 | ) | — | (0.13 | ) | (0.22 | ) | ||||||||||||||
Net asset value, end of year | $ | 11.52 | $ | 10.46 | $ | 11.27 | $ | 11.04 | $ | 9.79 | |||||||||||||
Total investment return2 | 12.51 | % | (4.81 | )%4 | 2.08 | % | 14.20 | % | 9.86 | % | |||||||||||||
Ratios to average net assets: | |||||||||||||||||||||||
Expenses before fee waivers and/or expense reimbursement | 1.39 | % | 1.36 | % | 1.32 | % | 1.30 | % | 1.28 | % | |||||||||||||
Expenses after fee waivers and/or expense reimbursement | 1.25 | % | 1.35 | % | 1.32 | % | 1.30 | % | 1.28 | % | |||||||||||||
Net investment income (loss) | 0.16 | % | 0.09 | % | (0.01 | )% | 0.17 | % | 0.12 | % | |||||||||||||
Supplemental data: | |||||||||||||||||||||||
Net assets, end of year (000's) | $ | 174,148 | $ | 190,813 | $ | 234,665 | $ | 309,296 | $ | 377,781 | |||||||||||||
Portfolio turnover rate | 56 | % | 60 | % | 62 | % | 49 | % | 54 | % | |||||||||||||
Class P
Year ended June 30, | |||||||||||||||||||||||
2017 | 2016 | 2015 | 2014 | 2013 | |||||||||||||||||||
Net asset value, beginning of year | $ | 10.69 | $ | 11.51 | $ | 11.25 | $ | 9.98 | $ | 9.30 | |||||||||||||
Income (loss) from investment operations: | |||||||||||||||||||||||
Net investment income1 | 0.05 | 0.04 | 0.03 | 0.05 | 0.04 | ||||||||||||||||||
Net realized and unrealized gain (loss) | 1.30 | (0.56 | ) | 0.23 | 1.39 | 0.90 | |||||||||||||||||
Net increase from payment by Advisor | — | 0.01 | — | — | — | ||||||||||||||||||
Total income (loss) from investment operations | 1.35 | (0.51 | ) | 0.26 | 1.44 | 0.94 | |||||||||||||||||
Less dividends/distributions: | |||||||||||||||||||||||
From net investment income | (0.26 | ) | (0.31 | ) | �� | — | (0.17 | ) | (0.26 | ) | |||||||||||||
Net asset value, end of year | $ | 11.78 | $ | 10.69 | $ | 11.51 | $ | 11.25 | $ | 9.98 | |||||||||||||
Total investment return2 | 12.85 | % | (4.50 | )%4 | 2.31 | % | 14.56 | % | 10.22 | % | |||||||||||||
Ratios to average net assets: | |||||||||||||||||||||||
Expenses before fee waivers and/or expense reimbursement | 1.12 | % | 1.09 | % | 1.04 | % | 1.00 | % | 0.98 | % | |||||||||||||
Expenses after fee waivers and/or expense reimbursement | 1.00 | % | 1.09 | % | 1.04 | % | 1.00 | % | 0.98 | % | |||||||||||||
Net investment income | 0.41 | % | 0.34 | % | 0.26 | % | 0.51 | % | 0.44 | % | |||||||||||||
Supplemental data: | |||||||||||||||||||||||
Net assets, end of year (000's) | $ | 67,156 | $ | 91,004 | $ | 124,415 | $ | 129,417 | $ | 127,751 | |||||||||||||
Portfolio turnover rate | 56 | % | 60 | % | 62 | % | 49 | % | 54 | % | |||||||||||||
1 Calculated using the average shares method.
2 Total investment return is calculated assuming a $10,000 investment on the first day of each year reported, reinvestment of all dividends and distributions, if any, at net asset value on the ex-dividend dates, and a sale at net asset value on the last day of each year reported. The figures do not include any applicable sales charges; results would be lower if they were included. Returns do not reflect the deduction of taxes that a shareholder would pay on Fund dividends/distributions or the redemption of Fund shares.
3 Amount represents less than $0.005 per share.
108
UBS Global Allocation Fund
Financial highlights
Class C
Year ended June 30, | |||||||||||||||||||||||
2017 | 2016 | 2015 | 2014 | 2013 | |||||||||||||||||||
Net asset value, beginning of year | $ | 10.15 | $ | 10.92 | $ | 10.79 | $ | 9.55 | $ | 8.89 | |||||||||||||
Income (loss) from investment operations: | |||||||||||||||||||||||
Net investment (loss)1 | (0.06 | ) | (0.07 | ) | (0.09 | ) | (0.06 | ) | (0.06 | ) | |||||||||||||
Net realized and unrealized gain (loss) | 1.24 | (0.54 | ) | 0.22 | 1.34 | 0.86 | |||||||||||||||||
Net increase from payment by Advisor | — | 0.01 | — | — | — | ||||||||||||||||||
Total income (loss) from investment operations | 1.18 | (0.60 | ) | 0.13 | 1.28 | 0.80 | |||||||||||||||||
Less dividends/distributions: | |||||||||||||||||||||||
From net investment income | (0.12 | ) | (0.17 | ) | — | (0.04 | ) | (0.14 | ) | ||||||||||||||
Net asset value, end of year | $ | 11.21 | $ | 10.15 | $ | 10.92 | $ | 10.79 | $ | 9.55 | |||||||||||||
Total investment return2 | 11.76 | % | (5.49 | )%4 | 1.20 | % | 13.31 | % | 9.11 | % | |||||||||||||
Ratios to average net assets: | |||||||||||||||||||||||
Expenses before fee waivers and/or expense reimbursement | 2.16 | % | 2.15 | % | 2.10 | % | 2.08 | % | 2.06 | % | |||||||||||||
Expenses after fee waivers and/or expense reimbursement | 2.01 | % | 2.10 | % | 2.10 | % | 2.08 | % | 2.06 | % | |||||||||||||
Net investment loss | (0.60 | )% | (0.66 | )% | (0.79 | )% | (0.59 | )% | (0.65 | )% | |||||||||||||
Supplemental data: | |||||||||||||||||||||||
Net assets, end of year (000's) | $ | 96,356 | $ | 116,057 | $ | 145,277 | $ | 174,078 | $ | 195,427 | |||||||||||||
Portfolio turnover rate | 56 | % | 60 | % | 62 | % | 49 | % | 54 | % | |||||||||||||
4 During the year ended June 30, 2016, the Advisor reimbursed the Fund $316,557 which was determined to be the value of the ineligible services paid for from the Fund's dealing commissions. If payment from Advisor was not made, the estimated total return would have been -4.90% for A shares, -5.59% for C shares, and -4.59% for P shares.
See accompanying notes to financial statements.
109
UBS International Sustainable Equity Fund
Financial highlights
The table below sets forth financial data for one share of beneficial interest outstanding throughout each year presented.
Class A
Year ended June 30, | |||||||||||||||||||||||
2017 | 2016 | 2015 | 2014 | 2013 | |||||||||||||||||||
Net asset value, beginning of year | $ | 8.05 | $ | 9.47 | $ | 8.95 | $ | 7.55 | $ | 6.75 | |||||||||||||
Income (loss) from investment operations: | |||||||||||||||||||||||
Net investment income1 | 0.19 | 0.13 | 0.10 | 0.08 | 0.11 | ||||||||||||||||||
Net realized and unrealized gain (loss) | 1.51 | (1.47 | ) | 0.53 | 1.51 | 0.93 | |||||||||||||||||
Net increase from payment by Advisor | — | 0.01 | — | — | — | ||||||||||||||||||
Total income (loss) from investment operations | 1.70 | (1.33 | ) | 0.63 | 1.59 | 1.04 | |||||||||||||||||
Less dividends/distributions: | |||||||||||||||||||||||
From net investment income | (0.17 | ) | (0.09 | ) | (0.11 | ) | (0.19 | ) | (0.24 | ) | |||||||||||||
Net asset value, end of year | $ | 9.58 | $ | 8.05 | $ | 9.47 | $ | 8.95 | $ | 7.55 | |||||||||||||
Total investment return2 | 21.43 | % | (14.07 | )%3 | 7.14 | % | 21.32 | % | 15.49 | % | |||||||||||||
Ratios to average net assets: | |||||||||||||||||||||||
Expenses before fee waivers and/or expense reimbursement | 2.25 | % | 2.37 | % | 2.47 | % | 2.74 | % | 2.65 | % | |||||||||||||
Expenses after fee waivers and/or expense reimbursement | 1.25 | % | 1.25 | % | 1.25 | % | 1.25 | % | 1.25 | % | |||||||||||||
Net investment income | 2.16 | % | 1.59 | % | 1.09 | % | 0.91 | % | 1.49 | % | |||||||||||||
Supplemental data: | |||||||||||||||||||||||
Net assets, end of year (000's) | $ | 15,811 | $ | 5,204 | $ | 6,371 | $ | 7,541 | $ | 5,433 | |||||||||||||
Portfolio turnover rate | 33 | % | 114 | % | 42 | % | 137 | % | 41 | % | |||||||||||||
Class P
Year ended June 30, | |||||||||||||||||||||||
2017 | 2016 | 2015 | 2014 | 2013 | |||||||||||||||||||
Net asset value, beginning of year | $ | 8.08 | $ | 9.50 | $ | 8.99 | $ | 7.58 | $ | 6.77 | |||||||||||||
Income (loss) from investment operations: | |||||||||||||||||||||||
Net investment income1 | 0.14 | 0.16 | 0.13 | 0.09 | 0.13 | ||||||||||||||||||
Net realized and unrealized gain (loss) | 1.58 | (1.48 | ) | 0.51 | 1.53 | 0.94 | |||||||||||||||||
Net increase from payment by Advisor | — | 0.01 | — | — | — | ||||||||||||||||||
Total income (loss) from investment operations | 1.72 | (1.31 | ) | 0.64 | 1.62 | 1.07 | |||||||||||||||||
Less dividends/distributions: | |||||||||||||||||||||||
From net investment income | (0.19 | ) | (0.11 | ) | (0.13 | ) | (0.21 | ) | (0.26 | ) | |||||||||||||
Net asset value, end of year | $ | 9.61 | $ | 8.08 | $ | 9.50 | $ | 8.99 | $ | 7.58 | |||||||||||||
Total investment return2 | 21.68 | % | (13.83 | )%3 | 7.32 | % | 21.65 | % | 15.95 | % | |||||||||||||
Ratios to average net assets: | |||||||||||||||||||||||
Expenses before fee waivers and/or expense reimbursement | 2.06 | % | 2.12 | % | 2.21 | % | 2.45 | % | 2.40 | % | |||||||||||||
Expenses after fee waivers and/or expense reimbursement | 1.00 | % | 1.00 | % | 1.00 | % | 1.00 | % | 1.00 | % | |||||||||||||
Net investment income | 1.65 | % | 1.92 | % | 1.40 | % | 1.10 | % | 1.69 | % | |||||||||||||
Supplemental data: | |||||||||||||||||||||||
Net assets, end of year (000's) | $ | 19,952 | $ | 16,277 | $ | 17,103 | $ | 12,462 | $ | 11,740 | |||||||||||||
Portfolio turnover rate | 33 | % | 114 | % | 42 | % | 137 | % | 41 | % | |||||||||||||
1 Calculated using the average shares method.
2 Total investment return is calculated assuming a $10,000 investment on the first day of each year reported, reinvestment of all dividends and distributions, if any, at net asset value on the ex-dividend dates, and a sale at net asset value on the last day of each year reported. The figures do not include any applicable sales charges; results would be lower if they were included. Returns do not reflect the deduction of taxes that a shareholder would pay on Fund dividends/distributions or the redemption of Fund shares.
110
UBS International Sustainable Equity Fund
Financial highlights
Class C
Year ended June 30, | |||||||||||||||||||||||
2017 | 2016 | 2015 | 2014 | 2013 | |||||||||||||||||||
Net asset value, beginning of year | $ | 7.85 | $ | 9.26 | $ | 8.80 | $ | 7.43 | $ | 6.63 | |||||||||||||
Income (loss) from investment operations: | |||||||||||||||||||||||
Net investment income1 | 0.04 | 0.07 | 0.04 | 0.03 | 0.05 | ||||||||||||||||||
Net realized and unrealized gain (loss) | 1.56 | (1.44 | ) | 0.51 | 1.47 | 0.92 | |||||||||||||||||
Net increase from payment by Advisor | — | 0.01 | — | — | — | ||||||||||||||||||
Total income (loss) from investment operations | 1.60 | (1.36 | ) | 0.55 | 1.50 | 0.97 | |||||||||||||||||
Less dividends/distributions: | |||||||||||||||||||||||
From net investment income | (0.10 | ) | (0.05 | ) | (0.09 | ) | (0.13 | ) | (0.17 | ) | |||||||||||||
Net asset value, end of year | $ | 9.35 | $ | 7.85 | $ | 9.26 | $ | 8.80 | $ | 7.43 | |||||||||||||
Total investment return2 | 20.56 | % | (14.72 | )%3 | 6.36 | % | 20.32 | % | 14.72 | % | |||||||||||||
Ratios to average net assets: | |||||||||||||||||||||||
Expenses before fee waivers and/or expense reimbursement | 3.11 | % | 3.15 | % | 3.23 | % | 3.54 | % | 3.40 | % | |||||||||||||
Expenses after fee waivers and/or expense reimbursement | 2.00 | % | 2.00 | % | 2.00 | % | 2.00 | % | 2.00 | % | |||||||||||||
Net investment income | 0.48 | % | 0.86 | % | 0.46 | % | 0.37 | % | 0.65 | % | |||||||||||||
Supplemental data: | |||||||||||||||||||||||
Net assets, end of year (000's) | $ | 2,040 | $ | 2,351 | $ | 2,672 | $ | 1,579 | $ | 605 | |||||||||||||
Portfolio turnover rate | 33 | % | 114 | % | 42 | % | 137 | % | 41 | % | |||||||||||||
3 During the year ended June 30, 2016, the Advisor reimbursed the Fund $34,326, which was determined to be the value of the ineligible services paid for from the Fund's dealing commissions, and $5,471 for a trading error. lf payment from Advisor was not made, the estimated total return would have been -14.18% for A shares, -14.83% for C shares, and -13.94% for P shares.
See accompanying notes to financial statements.
111
UBS U.S. Large Cap Equity Fund
Financial highlights
The table below sets forth financial data for one share of beneficial interest outstanding throughout each year presented.
Class A
Year ended June 30, | |||||||||||||||||||||||
2017 | 2016 | 2015 | 2014 | 2013 | |||||||||||||||||||
Net asset value, beginning of year | $ | 25.51 | $ | 27.55 | $ | 25.03 | $ | 19.85 | $ | 15.96 | |||||||||||||
Income (loss) from investment operations: | |||||||||||||||||||||||
Net investment income1 | 0.14 | 0.21 | 0.14 | 0.11 | 0.11 | ||||||||||||||||||
Net realized and unrealized gain (loss) | 5.84 | (1.88 | ) | 2.50 | 5.23 | 3.86 | |||||||||||||||||
Total income (loss) from investment operations | 5.98 | (1.67 | ) | 2.64 | 5.34 | 3.97 | |||||||||||||||||
Less dividends/distributions: | |||||||||||||||||||||||
From net investment income | (0.28 | ) | (0.37 | ) | (0.12 | ) | (0.16 | ) | (0.08 | ) | |||||||||||||
Net asset value, end of year | $ | 31.21 | $ | 25.51 | $ | 27.55 | $ | 25.03 | $ | 19.85 | |||||||||||||
Total investment return2 | 23.61 | % | (6.13 | )% | 10.61 | % | 27.05 | % | 24.99 | % | |||||||||||||
Ratios to average net assets: | |||||||||||||||||||||||
Expenses before fee waivers and/or expense reimbursement | 2.04 | % | 1.93 | % | 1.56 | % | 1.29 | % | 1.28 | % | |||||||||||||
Expenses after fee waivers and/or expense reimbursement | 0.95 | % | 1.13 | % | 1.20 | % | 1.20 | % | 1.20 | % | |||||||||||||
Net investment income | 0.49 | % | 0.81 | % | 0.53 | % | 0.47 | % | 0.63 | % | |||||||||||||
Supplemental data: | |||||||||||||||||||||||
Net assets, end of year (000's) | $ | 11,857 | $ | 9,774 | $ | 9,784 | $ | 9,478 | $ | 8,534 | |||||||||||||
Portfolio turnover rate | 78 | % | 57 | % | 59 | % | 55 | % | 58 | % | |||||||||||||
Class P
Year ended June 30, | |||||||||||||||||||||||
2017 | 2016 | 2015 | 2014 | 2013 | |||||||||||||||||||
Net asset value, beginning of year | $ | 25.61 | $ | 27.67 | $ | 25.14 | $ | 19.94 | $ | 16.07 | |||||||||||||
Income (loss) from investment operations: | |||||||||||||||||||||||
Net investment income1 | 0.21 | 0.26 | 0.20 | 0.16 | 0.15 | ||||||||||||||||||
Net realized and unrealized gain (loss) | 5.87 | (1.89 | ) | 2.52 | 5.27 | 3.88 | |||||||||||||||||
Total income (loss) from investment operations | 6.08 | (1.63 | ) | 2.72 | 5.43 | 4.03 | |||||||||||||||||
Less dividends/distributions: | |||||||||||||||||||||||
From net investment income | (0.35 | ) | (0.43 | ) | (0.19 | ) | (0.23 | ) | (0.16 | ) | |||||||||||||
Net asset value, end of year | $ | 31.34 | $ | 25.61 | $ | 27.67 | $ | 25.14 | $ | 19.94 | |||||||||||||
Total investment return2 | 23.87 | % | (5.91 | )% | 10.90 | % | 27.38 | % | 25.28 | % | |||||||||||||
Ratios to average net assets: | |||||||||||||||||||||||
Expenses before fee waivers and/or expense reimbursement | 1.76 | % | 1.64 | % | 1.07 | % | 0.99 | % | 0.98 | % | |||||||||||||
Expenses after fee waivers and/or expense reimbursement | 0.70 | % | 0.90 | % | 0.95 | % | 0.95 | % | 0.95 | % | |||||||||||||
Net investment income | 0.74 | % | 1.00 | % | 0.77 | % | 0.71 | % | 0.87 | % | |||||||||||||
Supplemental data: | |||||||||||||||||||||||
Net assets, end of year (000's) | $ | 16,754 | $ | 15,147 | $ | 28,345 | $ | 126,735 | $ | 146,145 | |||||||||||||
Portfolio turnover rate | 78 | % | 57 | % | 59 | % | 55 | % | 58 | % | |||||||||||||
1 Calculated using the average shares method.
2 Total investment return is calculated assuming a $10,000 investment on the first day of each year reported, reinvestment of all dividends and distributions, if any, at net asset value on the ex-dividend dates, and a sale at net asset value on the last day of each year reported. The figures do not include any applicable sales charges; results would be lower if they were included. Returns do not reflect the deduction of taxes that a shareholder would pay on Fund dividends/distributions or the redemption of Fund shares.
112
UBS U.S. Large Cap Equity Fund
Financial highlights
Class C
Year ended June 30, | |||||||||||||||||||||||
2017 | 2016 | 2015 | 2014 | 2013 | |||||||||||||||||||
Net asset value, beginning of year | $ | 24.41 | $ | 26.34 | $ | 23.99 | $ | 19.06 | $ | 15.36 | |||||||||||||
Income (loss) from investment operations: | |||||||||||||||||||||||
Net investment income (loss)1 | (0.07 | ) | 0.01 | (0.05 | ) | (0.06 | ) | (0.02 | ) | ||||||||||||||
Net realized and unrealized gain (loss) | 5.59 | (1.80 | ) | 2.40 | 5.03 | 3.72 | |||||||||||||||||
Total income (loss) from investment operations | 5.52 | (1.79 | ) | 2.35 | 4.97 | 3.70 | |||||||||||||||||
Less dividends/distributions: | |||||||||||||||||||||||
From net investment income | (0.07 | ) | (0.14 | ) | — | (0.04 | ) | — | |||||||||||||||
Net asset value, end of year | $ | 29.86 | $ | 24.41 | $ | 26.34 | $ | 23.99 | $ | 19.06 | |||||||||||||
Total investment return2 | 22.63 | % | (6.82 | )% | 9.80 | % | 26.09 | % | 24.09 | % | |||||||||||||
Ratios to average net assets: | |||||||||||||||||||||||
Expenses before fee waivers and/or expense reimbursement | 2.81 | % | 2.68 | % | 2.31 | % | 2.08 | % | 2.04 | % | |||||||||||||
Expenses after fee waivers and/or expense reimbursement | 1.70 | % | 1.88 | % | 1.95 | % | 1.95 | % | 1.95 | % | |||||||||||||
Net investment income (loss) | (0.26 | )% | 0.03 | % | (0.22 | )% | (0.27 | )% | (0.11 | )% | |||||||||||||
Supplemental data: | |||||||||||||||||||||||
Net assets, end of year (000's) | $ | 2,009 | $ | 2,130 | $ | 2,643 | $ | 3,299 | $ | 2,617 | |||||||||||||
Portfolio turnover rate | 78 | % | 57 | % | 59 | % | 55 | % | 58 | % | |||||||||||||
See accompanying notes to financial statements.
113
UBS U.S. Small Cap Growth Fund
Financial highlights
The table below sets forth financial data for one share of beneficial interest outstanding throughout each year presented.
Class A
Year ended June 30, | |||||||||||||||||||||||
2017 | 2016 | 2015 | 2014 | 2013 | |||||||||||||||||||
Net asset value, beginning of year | $ | 17.75 | $ | 23.60 | $ | 24.76 | $ | 20.10 | $ | 16.19 | |||||||||||||
Income (loss) from investment operations: | |||||||||||||||||||||||
Net investment (loss)1 | (0.15 | ) | (0.13 | ) | (0.16 | ) | (0.21 | ) | (0.11 | ) | |||||||||||||
Net realized and unrealized gain (loss) | 4.34 | (3.89 | ) | 3.38 | 5.40 | 4.02 | |||||||||||||||||
Total income (loss) from investment operations | 4.19 | (4.02 | ) | 3.22 | 5.19 | 3.91 | |||||||||||||||||
Less dividends/distributions: | |||||||||||||||||||||||
From net realized gains | (0.68 | ) | (1.83 | ) | (4.38 | ) | (0.53 | ) | — | ||||||||||||||
Net asset value, end of year | $ | 21.26 | $ | 17.75 | $ | 23.60 | $ | 24.76 | $ | 20.10 | |||||||||||||
Total investment return2 | 23.75 | % | (17.58 | )% | 15.61 | % | 26.42 | % | 23.78 | % | |||||||||||||
Ratios to average net assets: | |||||||||||||||||||||||
Expenses before fee waivers and/or expense reimbursement | 1.56 | % | 1.53 | % | 1.51 | % | 1.45 | % | 1.55 | % | |||||||||||||
Expenses after fee waivers and/or expense reimbursement | 1.24 | % | 1.24 | % | 1.35 | % | 1.40 | % | 1.40 | % | |||||||||||||
Net investment loss | (0.77 | )% | (0.65 | )% | (0.69 | )% | (0.92 | )% | (0.64 | )% | |||||||||||||
Supplemental data: | |||||||||||||||||||||||
Net assets, end of year (000's) | $ | 27,464 | $ | 28,048 | $ | 46,813 | $ | 42,552 | $ | 32,848 | |||||||||||||
Portfolio turnover rate | 50 | % | 109 | % | 64 | % | 57 | % | 42 | % | |||||||||||||
Class P
Year ended June 30, | |||||||||||||||||||||||
2017 | 2016 | 2015 | 2014 | 2013 | |||||||||||||||||||
Net asset value, beginning of year | $ | 19.05 | $ | 25.11 | $ | 26.00 | $ | 21.01 | $ | 16.88 | |||||||||||||
Income (loss) from investment operations: | |||||||||||||||||||||||
Net investment (loss)1 | (0.11 | ) | (0.08 | ) | (0.11 | ) | (0.15 | ) | (0.08 | ) | |||||||||||||
Net realized and unrealized gain (loss) | 4.66 | (4.15 | ) | 3.60 | 5.67 | 4.21 | |||||||||||||||||
Total income (loss) from investment operations | 4.55 | (4.23 | ) | 3.49 | 5.52 | 4.13 | |||||||||||||||||
Less dividends/distributions: | |||||||||||||||||||||||
From net realized gains | (0.68 | ) | (1.83 | ) | (4.38 | ) | (0.53 | ) | — | ||||||||||||||
Net asset value, end of year | $ | 22.92 | $ | 19.05 | $ | 25.11 | $ | 26.00 | $ | 21.01 | |||||||||||||
Total investment return2 | 24.09 | % | (17.39 | )% | 15.93 | % | 26.79 | % | 24.17 | % | |||||||||||||
Ratios to average net assets: | |||||||||||||||||||||||
Expenses before fee waivers and/or expense reimbursement/recoupment | 1.22 | % | 1.17 | % | 1.10 | % | 1.09 | % | 1.13 | % | |||||||||||||
Expenses after fee waivers and/or expense reimbursement/recoupment | 0.99 | % | 0.99 | % | 1.07 | % | 1.09 | % | 1.15 | %3 | |||||||||||||
Net investment loss | (0.50 | )% | (0.40 | )% | (0.43 | )% | (0.61 | )% | (0.41 | )% | |||||||||||||
Supplemental data: | |||||||||||||||||||||||
Net assets, end of year (000's) | $ | 75,770 | $ | 130,227 | $ | 178,495 | $ | 226,376 | $ | 172,436 | |||||||||||||
Portfolio turnover rate | 50 | % | 109 | % | 64 | % | 57 | % | 42 | % | |||||||||||||
1 Calculated using the average shares method.
2 Total investment return is calculated assuming a $10,000 investment on the first day of each year reported, reinvestment of all dividends and distributions, if any, at net asset value on the ex-dividend dates, and a sale at net asset value on the last day of each year reported. The figures do not include any applicable sales charges; results would be lower if they were included. Returns do not reflect the deduction of taxes that a shareholder would pay on Fund dividends/distributions or the redemption of Fund shares.
3 The investment manager recouped expenses previously reimbursed by the investment manager on behalf of the Fund, not to exceed the expense cap.
See accompanying notes to financial statements.
114
UBS U.S. Small Cap Growth Fund
Financial highlights
Class C
Year ended June 30, | |||||||||||||||||||||||
2017 | 2016 | 2015 | 2014 | 2013 | |||||||||||||||||||
Net asset value, beginning of year | $ | 15.16 | $ | 20.60 | $ | 22.32 | $ | 18.29 | $ | 14.85 | |||||||||||||
Income (loss) from investment operations: | |||||||||||||||||||||||
Net investment (loss)1 | (0.26 | ) | (0.23 | ) | (0.29 | ) | (0.35 | ) | (0.22 | ) | |||||||||||||
Net realized and unrealized gain (loss) | 3.70 | (3.38 | ) | 2.95 | 4.91 | 3.66 | |||||||||||||||||
Total income (loss) from investment operations | 3.44 | (3.61 | ) | 2.66 | 4.56 | 3.44 | |||||||||||||||||
Less dividends/distributions: | |||||||||||||||||||||||
From net realized gains | (0.68 | ) | (1.83 | ) | (4.38 | ) | (0.53 | ) | — | ||||||||||||||
Net asset value, end of year | $ | 17.92 | $ | 15.16 | $ | 20.60 | $ | 22.32 | $ | 18.29 | |||||||||||||
Total investment return2 | 22.77 | % | (18.18 | )% | 14.71 | % | 25.51 | % | 22.83 | % | |||||||||||||
Ratios to average net assets: | |||||||||||||||||||||||
Expenses before fee waivers and/or expense reimbursement | 2.29 | % | 2.28 | % | 2.24 | % | 2.24 | % | 2.32 | % | |||||||||||||
Expenses after fee waivers and/or expense reimbursement | 1.99 | % | 1.99 | % | 2.10 | % | 2.15 | % | 2.15 | % | |||||||||||||
Net investment loss | (1.52 | )% | (1.39 | )% | (1.44 | )% | (1.67 | )% | (1.39 | )% | |||||||||||||
Supplemental data: | |||||||||||||||||||||||
Net assets, end of year (000's) | $ | 4,109 | $ | 4,385 | $ | 5,398 | $ | 3,687 | $ | 2,937 | |||||||||||||
Portfolio turnover rate | 50 | % | 109 | % | 64 | % | 57 | % | 42 | % | |||||||||||||
115
UBS Total Return Bond Fund
Financial highlights
The table below sets forth financial data for one share of beneficial interest outstanding throughout each period presented.
Class A | Class C | ||||||||||
| Period ended June 30, 20173 | Period ended June 30, 20173 | ||||||||||
Net asset value, beginning of period | $ | 15.24 | $ | 15.24 | |||||||
Income (loss) from investment operations: | |||||||||||
Net investment income1 | 0.25 | 0.19 | |||||||||
Net realized and unrealized loss | (0.30 | ) | (0.30 | ) | |||||||
Total loss from investment operations | (0.05 | ) | (0.11 | ) | |||||||
Less dividends/distributions: | |||||||||||
From net investment income | (0.25 | ) | (0.19 | ) | |||||||
Return of capital | (0.00 | )4 | (0.00 | )4 | |||||||
Total dividends/distributions | (0.25 | ) | (0.19 | ) | |||||||
Net asset value, end of period | $ | 14.94 | $ | 14.94 | |||||||
Total investment return2 | (0.31 | )% | (0.66 | )% | |||||||
Ratios to average net assets: | |||||||||||
Expenses before fee waivers and/or expense reimbursement | 1.74 | %5 | 2.14 | %5 | |||||||
Expenses after fee waivers and/or expense reimbursement | 0.75 | %5 | 1.25 | %5 | |||||||
Net investment income | 2.28 | %5 | 1.71 | %5 | |||||||
Supplemental data: | |||||||||||
Net assets, end of period (000's) | $ | 44 | $ | 43 | |||||||
Portfolio turnover rate | 700 | % | 700 | % | |||||||
Class P
| Year ended June 30, | Nine months ended June 30, | Year ended September 30, | |||||||||||||||||||||||||
2017 | 2016 | 2015 | 2014 | 2013 | 2012 | ||||||||||||||||||||||
Net asset value, beginning of period | $ | 15.14 | $ | 14.98 | $ | 15.99 | $ | 15.89 | $ | 17.87 | $ | 17.29 | |||||||||||||||
Income (loss) from investment operations: | |||||||||||||||||||||||||||
Net investment income1 | 0.37 | 0.36 | 0.64 | 0.60 | 0.60 | 0.67 | |||||||||||||||||||||
Net realized and unrealized gain (loss) | (0.18 | ) | 0.13 | (0.96 | ) | 0.44 | (1.06 | ) | 1.34 | ||||||||||||||||||
Total income (loss) from investment operations | 0.19 | 0.49 | (0.32 | ) | 1.04 | (0.46 | ) | 2.01 | |||||||||||||||||||
Less dividends/distributions: | |||||||||||||||||||||||||||
From net investment income | (0.39 | ) | (0.33 | ) | (0.64 | ) | (0.62 | ) | (0.70 | ) | (0.71 | ) | |||||||||||||||
From net realized gains | — | — | (0.05 | ) | (0.32 | ) | (0.82 | ) | (0.72 | ) | |||||||||||||||||
Return of capital | (0.00 | )4 | — | — | — | — | — | ||||||||||||||||||||
Total dividends/distributions | (0.39 | ) | (0.33 | ) | (0.69 | ) | (0.94 | ) | (1.52 | ) | (1.43 | ) | |||||||||||||||
Net asset value, end of period | $ | 14.94 | $ | 15.14 | $ | 14.98 | $ | 15.99 | $ | 15.89 | $ | 17.87 | |||||||||||||||
Total investment return2 | 1.32 | % | 3.33 | % | (2.05 | )% | 6.77 | % | (2.82 | )% | 12.23 | % | |||||||||||||||
Ratios to average net assets: | |||||||||||||||||||||||||||
Expenses before fee waivers and/or expense reimbursement | 1.29 | % | 1.21 | %5 | 0.75 | % | 0.83 | % | 0.71 | % | 0.67 | % | |||||||||||||||
Expenses after fee waivers and/or expense reimbursement | 0.50 | % | 1.16 | %5 | 0.75 | % | 0.83 | % | 0.71 | % | 0.67 | % | |||||||||||||||
Net investment income | 2.45 | % | 3.22 | %5 | 4.04 | % | 3.76 | % | 3.56 | % | 3.89 | % | |||||||||||||||
Supplemental data: | |||||||||||||||||||||||||||
Net assets, end of period (000's) | $ | 49,919 | $ | 126,922 | $ | 131,473 | $ | 140,338 | $ | 139,416 | $ | 156,791 | |||||||||||||||
Portfolio turnover rate | 700 | % | 251 | % | 26 | % | 44 | % | 133 | % | 175 | % | |||||||||||||||
1 Calculated using the average shares method.
2 Total investment return is calculated assuming a $10,000 investment on the first day of each period reported, reinvestment of all dividends and distributions, if any, at net asset value on the ex-dividend dates, and a sale at net asset value on the last day of each period reported. The figures do not include any applicable sales charges; results would be lower if they were included. Total investment return for periods of less than one year has not been annualized. Returns do not reflect the deduction of taxes that a shareholder would pay on Fund dividends/distributions or the redemption of Fund shares.
3 For the period September 29, 2016 (commencement of operations) through June 30, 2017.
4 Amount represents less than 0.005%.
5 Annualized.
See accompanying notes to financial statements.
116
This page intentionally left blank.
117
UBS Municipal Bond Fund
Financial highlights
The table below sets forth financial data for one share of beneficial interest outstanding throughout each period presented.
Class A
| Year ended June 30, | Period ended | ||||||||||||||
2017 | 2016 | June 30, 20154 | |||||||||||||
Net asset value, beginning of period | $ | 10.52 | $ | 9.94 | $ | 10.00 | |||||||||
Income (loss) from investment operations: | |||||||||||||||
Net investment income1 | 0.15 | 0.17 | 0.09 | ||||||||||||
Net realized and unrealized gain (loss) | (0.27 | ) | 0.59 | (0.06 | ) | ||||||||||
Total income (loss) from investment operations | (0.12 | ) | 0.76 | 0.03 | |||||||||||
Less dividends/distributions: | |||||||||||||||
From net investment income | (0.15 | ) | (0.18 | ) | (0.09 | ) | |||||||||
From net realized gains | (0.02 | ) | — | — | |||||||||||
Total dividends/distributions | (0.17 | ) | (0.18 | ) | (0.09 | ) | |||||||||
Net asset value, end of period | $ | 10.23 | $ | 10.52 | $ | 9.94 | |||||||||
Total investment return2 | (1.11 | )% | 7.74 | % | 0.30 | % | |||||||||
Ratios to average net assets: | |||||||||||||||
Expenses before fee waivers and/or expense reimbursement | 1.00 | % | 1.15 | % | 1.46 | %6 | |||||||||
Expenses after fee waivers and/or expense reimbursement | 0.65 | % | 0.65 | % | 0.65 | %6 | |||||||||
Net investment income | 1.42 | % | 1.66 | % | 1.43 | %6 | |||||||||
Supplemental data: | |||||||||||||||
Net assets, end of period (000's) | $ | 21,007 | $ | 17,671 | $ | 10,929 | |||||||||
Portfolio turnover rate | 60 | %3 | 100 | % | 72 | % | |||||||||
Class P
| Year ended June 30, | Period ended | ||||||||||||||
2017 | 2016 | June 30, 20154 | |||||||||||||
Net asset value, beginning of period | $ | 10.52 | $ | 9.94 | $ | 10.00 | |||||||||
Income (loss) from investment operations: | |||||||||||||||
Net investment income1 | 0.17 | 0.19 | 0.10 | ||||||||||||
Net realized and unrealized gain (loss) | (0.28 | ) | 0.60 | (0.05 | ) | ||||||||||
Total income (loss) from investment operations | (0.11 | ) | 0.79 | 0.05 | |||||||||||
Less dividends/distributions: | |||||||||||||||
From net investment income | (0.17 | ) | (0.21 | ) | (0.11 | ) | |||||||||
From net realized gains | (0.02 | ) | — | — | |||||||||||
Total dividends/distributions | (0.19 | ) | (0.21 | ) | (0.11 | ) | |||||||||
Net asset value, end of period | $ | 10.22 | $ | 10.52 | $ | 9.94 | |||||||||
Total investment return2 | (0.97 | )% | 8.01 | % | 0.45 | % | |||||||||
Ratios to average net assets: | |||||||||||||||
Expenses before fee waivers and/or expense reimbursement | 0.77 | % | 0.89 | % | 1.23 | %6 | |||||||||
Expenses after fee waivers and/or expense reimbursement | 0.40 | % | 0.40 | % | 0.40 | %6 | |||||||||
Net investment income | 1.68 | % | 1.89 | % | 1.63 | %6 | |||||||||
Supplemental data: | |||||||||||||||
Net assets, end of period (000's) | $ | 101,601 | $ | 90,146 | $ | 46,993 | |||||||||
Portfolio turnover rate | 60 | %3 | 100 | % | 72 | % | |||||||||
1 Calculated using the average shares method.
2 Total investment return is calculated assuming a $10,000 investment on the first day of each period reported, reinvestment of all dividends and distributions, if any, at net asset value on the ex-dividend dates, and a sale at net asset value on the last day of each period reported. The figures do not include any applicable sales charges; results would be lower if they were included. Total investment return for periods of less than one year has not been annualized. Returns do not reflect the deduction of taxes that a shareholder could pay on Fund dividends/distributions or the redemption of Fund shares.
118
UBS Municipal Bond Fund
Financial highlights
Class C
| Year ended June 30, | Period ended | ||||||||||||||
2017 | 2016 | June 30, 20154 | |||||||||||||
Net asset value, beginning of period | $ | 10.52 | $ | 9.94 | $ | 10.00 | |||||||||
Income (loss) from investment operations: | |||||||||||||||
Net investment income1 | 0.09 | 0.12 | 0.06 | ||||||||||||
Net realized and unrealized gain (loss) | (0.28 | ) | 0.59 | (0.06 | ) | ||||||||||
Total income (loss) from investment operations | (0.19 | ) | 0.71 | 0.005 | |||||||||||
Less dividends/distributions: | |||||||||||||||
From net investment income | (0.09 | ) | (0.13 | ) | (0.06 | ) | |||||||||
From net realized gains | (0.02 | ) | — | — | |||||||||||
Total dividends/distributions | (0.11 | ) | (0.13 | ) | (0.06 | ) | |||||||||
Net asset value, end of period | $ | 10.22 | $ | 10.52 | $ | 9.94 | |||||||||
Total investment return2 | (1.71 | )% | 7.21 | % | 0.03 | % | |||||||||
Ratios to average net assets: | |||||||||||||||
Expenses before fee waivers and/or expense reimbursement | 1.52 | % | 1.65 | % | 1.98 | %6 | |||||||||
Expenses after fee waivers and/or expense reimbursement | 1.15 | % | 1.15 | % | 1.14 | %6 | |||||||||
Net investment income | 0.92 | % | 1.15 | % | 0.94 | %6 | |||||||||
Supplemental data: | |||||||||||||||
Net assets, end of period (000's) | $ | 5,815 | $ | 6,164 | $ | 2,948 | |||||||||
Portfolio turnover rate | 60 | %3 | 100 | % | 72 | % | |||||||||
3 Effective with the fiscal year ended June 30, 2017, calculation of the portfolio turnover rate excludes transactions involving variable-rate demand notes, which are considered short-term instruments due to the ability to demand immediate repayment.
4 For the period November 10, 2014 (commencement of operations) through June 30, 2015.
5 Amount represents less than $0.005 per share.
6 Annualized.
See accompanying notes to financial statements.
119
The UBS Funds
Notes to financial statements
Organization and significant accounting policies
The UBS Funds (the "Trust") is an open-end management investment company registered with the US Securities and Exchange Commission ("SEC") under the Investment Company Act of 1940 (the "1940 Act"), as amended, currently offering multiple series representing separate investment portfolios. The Trust is a Delaware statutory trust organized on August 13, 1993. The trustees of the Trust have authority to issue an unlimited number of shares of beneficial interest at par value of $0.001 per share.
The Trust has seven Funds available for investment, each having its own investment objectives and policies: UBS Dynamic Alpha Fund, UBS Global Allocation Fund, UBS International Sustainable Equity Fund, UBS U.S. Large Cap Equity Fund, UBS U.S. Small Cap Growth Fund, UBS Total Return Bond Fund and UBS Municipal Bond Fund, (each a "Fund", and collectively, the "Funds"). Each of the Funds is classified as a diversified investment company with the exception of UBS Dynamic Alpha Fund and UBS Municipal Bond Fund, which are classified as non-diversified for purposes of the 1940 Act.
UBS Asset Management (Americas) Inc. ("UBS AM" or the "Advisor") serves as the investment advisor and administrator for the Funds. UBS Asset Management (US) Inc. ("UBS AM (US)") serves as principal underwriter for the Funds. UBS AM and UBS AM (US) are indirect wholly owned subsidiaries of UBS Group AG. UBS Group AG is an internationally diversified organization with headquarters in Zurich, Switzerland. UBS Group AG operates in many areas of the financial services industry.
The Funds currently offer Class A, Class C and Class P shares. Each class represents interests in the same assets of the applicable Fund and the classes are identical except for differences in their sales charge structures, ongoing service and distribution charges and certain transfer agency and related services expenses. All classes of shares have equal voting privileges except that each class has exclusive voting rights with respect to its service and/or distribution plan, if any. Class P shares have no service or distribution plan.
The Class P shares of the UBS Total Return Bond Fund acquired the assets and liabilities of Fort Dearborn Income Securities, Inc., a closed-end management investment company organized as a Illinois corporation (the "Predecessor Fund"), prior to the opening of business on May 23, 2016 (the "Reorganization"). The UBS Total Return Bond Fund's investment advisor, UBS AM, was the advisor for the Predecessor Fund, and the day-to-day management of, and investment decisions for, the UBS Total Return Bond Fund and the Predecessor Fund are made by the same portfolio managers. The Funds have generally similar investment objectives and strategies. As such, the Predecessor Fund was designed as accounting survivor of the Reorganization. The UBS Total Return Bond Fund's Class P shares have adopted the historical performance of the Predecessor Fund. In connection with the Reorganization, the fiscal year end for UBS Total Return Bond Fund has changed from September 30th to June 30th. As such, the fiscal period ended June 30, 2016 for UBS Total Return Bond Fund reflects the nine month period from October 1, 2015 through June 30, 2016.
The Trust accounts separately for the assets, liabilities and operations of each Fund. Expenses directly attributable to each Fund are charged to that Fund's operations; expenses which are applicable to all Funds are allocated among them on a pro rata basis.
In the normal course of business, the Funds may enter into contracts that contain a variety of representations that provide indemnification for certain liabilities. The Funds' maximum exposure under these arrangements is unknown, as this would involve future claims that may be made against the Funds that have not yet occurred. However, the Funds have not had any prior claims or losses pursuant to these contracts and expect the risk of loss to be remote.
Under certain circumstances, shareholders of the Funds may receive payment for redemptions in securities rather than in cash.
120
The UBS Funds
Notes to financial statements
The Financial Accounting Standards Board ("FASB") Accounting Standards Codification ("ASC") is the exclusive reference of authoritative US generally accepted accounting principles ("US GAAP") recognized by the FASB to be applied by nongovernmental entities. Rules and interpretive releases of the SEC under authority of federal laws are also sources of authoritative US GAAP for SEC registrants. The Funds' financial statements are prepared in accordance with US GAAP, which may require the use of management estimates and assumptions. Actual results could differ from those estimates.
In August 2014, the FASB issued Accounting Standard Update No. 2014-15, Presentation of Financial Statements—Going Concern (Subtopic 205-40): "Disclosure of Uncertainties about an Entity's Ability to Continue as a Going Concern" ("ASU 2014-15"). The update provides guidance about management's responsibility to evaluate whether there is substantial doubt about the entity's ability to continue as a going concern and to provide related footnote disclosure. Management has evaluated relevant conditions and events, which are known and reasonably knowable, and has determined that there are no conditions and events that raise substantial doubt about the Funds' ability to continue as a going concern.
In October 2016, the SEC adopted new rules and forms, and amendments to certain current rules and forms, to modernize reporting and disclosure of information by registered investment companies. The amendments to Regulation S-X will require standardized, enhanced disclosure about derivatives in investment company financial statements, and will also change the rules governing the form and content of such financial statements. The amendments to Regulation S-X take effect on August 1, 2017. At this time, management is assessing the anticipated impact of these regulatory developments.
The following is a summary of significant accounting policies:
Investment transactions, investment income and expenses: Investment transactions are recorded on the trade date. Realized gains and losses from investment transactions and foreign exchange transactions are calculated using the identified cost method. Dividend income and expense are recorded on the ex-dividend date ("ex-date") except in the case of certain dividends from foreign securities which are recorded as soon after the ex-date as the respective Fund, using reasonable diligence, becomes aware of such dividends. Interest income is recorded on an accrual basis. Discounts are accreted and premiums are amortized as adjustments to interest income and the identified cost of investments.
Income, expenses (excluding class-specific expenses) and realized/unrealized gains/losses are allocated proportionately to each class of shares based upon the relative net asset value of outstanding shares (or the value of dividend eligible shares, as appropriate) of each class at the beginning of the day after adjusting for current capital share activity of the respective classes. Class specific expenses are charged directly to the applicable class of shares.
Dividends and distributions: Dividends and distributions to shareholders are recorded on the ex-dividend date. The amount of dividends from net investment income and distributions from net realized capital gains and/or return of capital are determined in accordance with US federal income tax regulations, which may differ from US GAAP. These "book/tax" differences are either considered temporary or permanent in nature. To the extent these differences are permanent in nature, such amounts are reclassified within the capital accounts based on their federal tax-basis treatment; temporary differences do not require reclassification.
Foreign currency translation: The books and records of the Funds are maintained in US dollars. Foreign currency amounts are translated into US dollars as follows: (1) the foreign currency market value of investment securities and other assets and liabilities stated in foreign currencies are translated into US dollars based on the current exchange rates each business day; and (2) purchases and sales of investment securities and income and expenses are translated at the rate of exchange prevailing on the respective dates of such transactions. The resulting exchange gains and losses are included in the Statement of operations.
121
The UBS Funds
Notes to financial statements
The Funds do not generally isolate the effect of fluctuations in foreign exchange rates from the effect of the changes in market prices of securities. However, the Funds do isolate the effect of fluctuations in foreign exchange rates when determining the realized gain or loss upon the sale or maturity of foreign currency-denominated securities pursuant to US federal income tax regulations. Net realized foreign currency transaction gain (loss) is treated as ordinary income (loss) for income tax reporting purposes.
Concentration of risk: Investing in securities of foreign issuers and currency transactions may involve certain considerations and risks not typically associated with investments in the United States. These risks include revaluation of currencies, adverse fluctuations in foreign currency values and possible adverse political, social and economic developments, including those particular to a specific industry, country or region, which could cause the securities and their markets to be less liquid and prices more volatile than those of comparable US companies and US government securities. These risks are greater with respect to securities of issuers located in emerging market countries in which some Funds in the Trust invest.
Small capitalization ("small cap") companies may be more vulnerable than larger capitalization ("large cap") companies to adverse business or economic developments. Small cap companies may also have limited product lines, markets or financial resources, and may be dependent on a relatively small management group. Securities of such companies may be less liquid and more volatile than securities of large cap companies or the market averages in general and therefore may involve greater risk than investing in large cap companies. In addition, small cap companies may not be well-known to the investing public, may not have institutional ownership and may have only cyclical, static or moderate growth prospects.
The ability of the issuers of debt securities held by the Funds to meet their obligations may be affected by economic and political developments particular to a specific industry, country, state or region.
Investments in bonds with ratings of BB (Standard & Poor's Financial Services LLC or Fitch Ratings, Inc.) or Ba (Moody's Investors Service, Inc.) or below (commonly referred to as "high yield" bonds), or deemed of equivalent quality, have an increased risk of defaulting or otherwise being unable to honor a financial obligation. These securities are considered to be predominately speculative with respect to an issuer's capacity to pay interest and repay principal in accordance with the terms of the obligations. Lower-quality bonds are more likely to be subject to an issuer's default or downgrade than investment grade (higher-quality) bonds.
Valuation of investments
Each Fund generally calculates its net asset value on days that the New York Stock Exchange ("NYSE") is open. A Fund calculates net asset value separately for each class as of the close of regular trading on the NYSE (generally, 4:00 p.m., Eastern time). The NYSE normally is not open, and the Funds do not price their shares, on most national holidays and Good Friday. To the extent that a Fund's assets are traded in other markets on days when the NYSE is not open, the value of a Fund's assets may be affected on those days. If trading on the NYSE is halted for the day before 4:00 p.m., Eastern time, a Fund's net asset value per share generally will still be calculated as of the close of regular trading on the NYSE. The time at which a Fund calculates its net asset value and until which purchase, sale or exchange orders are accepted may be changed as permitted by the SEC.
Each Fund calculates its net asset value based on the current market value, where available, for its portfolio investments. The Funds normally obtain market values for their investments from independent pricing sources and broker-dealers. Independent pricing sources may use reported last sale prices, official market closing prices, current market quotations or valuations from computerized "evaluation" systems that derive values based on comparable investments. An evaluation system incorporates parameters such as security quality, maturity and coupon, and/or research and evaluations by its staff, including review of broker-dealer market price quotations, if available, in determining the valuation of the portfolio investments. Investments also may be valued based on appraisals derived from information concerning the investment or similar investments received from recognized dealers in those holdings.
122
The UBS Funds
Notes to financial statements
Investments traded in the over-the-counter ("OTC") market and listed on The NASDAQ Stock Market, Inc. ("NASDAQ") normally are valued at the NASDAQ Official Closing Price. Other OTC securities are valued at the last bid price on the valuation date available prior to valuation. Investments which are listed on US and foreign stock exchanges normally are valued at the market closing price, the last sale price on the day the securities are valued or, lacking any sales on such day, at the last available bid price. Investments listed on foreign stock exchanges may be fair valued based on significant events that have occurred subsequent to the close of the foreign markets. In cases where investments are traded on more than one exchange, the investments are valued on the exchange designated as the primary market by UBS AM. If a market value is not readily available from an independent pricing source for a particular investment, that investment is valued at fair value as determined in good faith by or under the direction of the Trust's Board of Trustees (the "Board"). Foreign currency exchange rates are generally determined as of the close of the NYSE.
Certain investments in which the Funds invest are traded in markets that close before 4:00 p.m., Eastern time. Normally, developments that occur between the close of the foreign markets and 4:00 p.m., Eastern time, will not be reflected in a Fund's net asset value. However, if any of the Funds determine that such developments are so significant that they will materially affect the value of the Fund's investments, the Fund may adjust the previous closing prices to reflect what is believed to be the fair value of these investments as of 4:00 p.m., Eastern time.
Certain Funds may use a systematic fair valuation model provided by an independent third party to value investments principally traded in foreign markets in order to adjust for possible stale pricing that may occur between the close of the foreign exchanges and the time for valuation. The systematic fair valuation model may use calculations based on indices of domestic securities and other appropriate indicators, such as prices of relevant ADRs and futures contracts. If an investment is valued at a "fair value," that value is likely to be different from the last quoted market price for the investment. The use of the fair valuation model may result in securities being transferred between Level 1 and Level 2 of the fair valuation hierarchy at the end of the reporting period. Transfers between Level 1 and Level 2, if any, are disclosed near the end of each Fund's Portfolio of investments.
The amortized cost method of valuation, which approximates market value, generally is used to value short-term debt instruments with 60 days or less remaining to maturity, unless the Board determines that this does not represent fair value.
Investments in open-end investment companies are valued at the daily closing net asset value of the respective investment company. Pursuant to the Funds' use of the practical expedient within ASC Topic 820, Fair Value Measurement, investments in investment companies without publicly published prices are also valued at the daily net asset value.
All investments quoted in foreign currencies are valued daily in US dollars on the basis of the foreign currency exchange rates prevailing at the time such valuation is determined by the Funds' custodian.
Futures contracts are generally valued at the settlement price established each day on the exchange on which they are traded. Forward foreign currency contracts are valued daily using forward exchange rates quoted by independent pricing services.
Swaps are marked-to-market daily based upon values from third party vendors or quotations from market makers to the extent available. In the event that market quotations are not readily available or deemed unreliable, the swap is valued at fair value as determined in good faith by or under the direction of the Board.
The Board has delegated to the Equities, Fixed Income, and Multi-Asset Valuation Committee ("VC") (formerly UBS AM Global Valuation Committee or GVC) the responsibility for making fair value determinations with respect to the Funds' portfolio holdings. The VC is comprised of representatives of management. The VC provides reports to the Board at each quarterly meeting regarding any investments that have been fair valued, valued pursuant to standing
123
The UBS Funds
Notes to financial statements
instructions approved by the VC, or where non-vendor pricing sources had been used to make fair value determinations when sufficient information exists during the prior quarter. Fair valuation determinations are subject to review at least monthly by the VC during scheduled meetings. Pricing decisions, processes, and controls over fair value determinations are subject to internal and external reviews, including annual internal compliance reviews and periodic internal audit reviews.
The types of investments for which such fair value pricing may be necessary include, but are not limited to: foreign investments under some circumstances; securities of an issuer that has entered into a restructuring; investments whose trading has been halted or suspended; fixed income securities that are in default and for which there is no current market value quotation; and investments that are restricted as to transfer or resale. The need to fair value a Fund's portfolio investments may also result from low trading volume in foreign markets or thinly traded domestic investments, and when a security that is subject to a trading limit or collar on the exchange or market on which it is primarily traded reaches the "limit up" or "limit down" price and no trading has taken place at that price. Various factors may be reviewed in order to make a good faith determination of an investment's fair value. These factors include, but are not limited to, fundamental analytical data relating to the investment; the nature and duration of restrictions on disposition of the investment; and the evaluation of forces which influence the market in which the investment is purchased and sold. Valuing investments at fair value involves greater reliance on judgment than valuing investments that have readily available market quotations. Fair value determinations can also involve reliance on quantitative models employed by a fair value pricing service.
US GAAP requires disclosure regarding the various inputs that are used in determining the value of each Fund's investments. These inputs are summarized into the three broad levels listed below:
Level 1—Unadjusted quoted prices in active markets for identical investments.
Level 2—Other significant observable inputs, including but not limited to, quoted prices for similar investments, interest rates, prepayment speeds and credit risk.
Level 3—Unobservable inputs inclusive of the Funds' own assumptions in determining the fair value of investments.
A fair value hierarchy table has been included near the end of each Fund's Portfolio of investments.
Investments
Securities traded on to-be-announced basis: Certain Funds may from time to time purchase, or short sell, securities on a to-be-announced ("TBA") basis. In a TBA transaction, the Fund commits to purchasing or selling securities for which all specific information is not yet known at the time of the trade, particularly the face amount and maturity date of the underlying securities. Securities purchased on a TBA basis are not settled until they are delivered to the Fund, normally 15 to 45 days later. Beginning on the date the Fund enters into a TBA transaction, cash, US government securities or other liquid securities are segregated in an amount equal in value to the purchase price of the TBA security. These transactions are subject to market fluctuations, and their current value is determined in the same manner as for other securities.
Mortgage-backed securities: Certain Funds may invest in mortgage-backed securities ("MBS"), representing direct or indirect interests in pools of underlying mortgage loans that are secured by real property. These securities provide investors with payments consisting of both principal and interest as the mortgages in the underlying mortgage pools are paid.
The timely payment of principal and interest (but not the market value) on MBS issued or guaranteed by Ginnie Mae (formally known as the Government National Mortgage Association or GNMA) is backed by Ginnie Mae and the full faith and credit of the US government. Obligations issued by Fannie Mae (formally known as the Federal National
124
The UBS Funds
Notes to financial statements
Mortgage Association or FNMA) and Freddie Mac (formally known as the Federal Home Loan Mortgage Corporation or FHLMC) are historically supported only by the credit of the issuer, but currently are guaranteed by the US government in connection with such agencies being placed temporarily into conservatorship by the US government.
Some MBS are sponsored or issued by private entities. Payments of principal and interest (but not the market value) of such private MBS may be supported by pools of mortgage loans or other MBS that are guaranteed, directly or indirectly, by the US government or one of its agencies or instrumentalities, or they may be issued without any government guarantee of the underlying mortgage assets but with some form of non-government credit enhancement.
Collateralized mortgage obligations ("CMO") are a type of MBS. A CMO is a debt security that may be collateralized by whole mortgage loans or mortgage pass-through securities. The mortgage loans or mortgage pass-through securities are divided into classes or tranches with each class having its own characteristics. Investors typically receive payments out of the interest and principal on the underlying mortgages. The portions of these payments that investors receive, as well as the priority of their rights to receive payments, are determined by the specific terms of the CMO class.
The yield characteristics of MBS differ from those of traditional debt securities. Among the major differences are that interest and principal payments are made more frequently, usually monthly, and that principal may be prepaid at any time because the underlying mortgage loans or other obligations generally may be prepaid at any time. Prepayments on a pool of mortgage loans are influenced by a variety of economic, geographic, social and other factors. Generally, prepayments on fixed-rate mortgage loans will increase during a period of falling interest rates and decrease during a period of rising interest rates. Certain classes of CMOs and other MBS are structured in a manner that makes them extremely sensitive to changes in prepayment rates. Such classes include interest-only ("IO") and principal-only ("PO") classes. IOs are entitled to receive all or a portion of the interest, but none (or only a nominal amount) of the principal payments, from the underlying mortgage assets. If the mortgage assets underlying an IO experience greater than anticipated principal prepayments, then the total amount of interest payments allocable to the IO class, and therefore the yield to investors, generally will be reduced. Conversely, PO classes are entitled to receive all or a portion of the principal payments, but none of the interest, from the underlying mortgage assets. PO classes are purchased at substantial discounts from par, and the yield to investors will be reduced if principal payments are slower than expected.
Asset-backed securities: Certain Funds may invest in asset-backed securities ("ABS"), representing interests in pools of certain types of underlying installment loans, home equity loans, leases of various types of real and personal property and receivables from revolving lines of credit (credit cards). Such assets are securitized through the use of trusts or special purpose corporations. The yield characteristics of ABS differ from those of traditional debt securities. One such major difference is that principal may be prepaid at any time because the underlying obligations generally may be prepaid at any time. ABS may decrease in value as a result of increases in interest rates and may benefit less than other fixed-income securities from declining interest rates because of the risk of prepayment.
Short sales: UBS Dynamic Alpha Fund, UBS U.S. Small Cap Growth Fund and UBS Total Return Bond Fund may engage in short sale transactions in which the Fund sells a security it does not own (or does not have the right to acquire at no added cost), in anticipation of a decline in the security's price.
The Fund must borrow the security to make delivery to the buyer. The initial amount of a short sale is recorded as a liability which is marked to market daily. Fluctuations in the value of this liability are recorded as unrealized appreciation or depreciation on the Statement of operations. The Fund will realize a loss as a result of the short sale if the price of the security increases between the date of the short sale and the date on which the Fund replaces the borrowed security, and the Fund will realize a gain if the security declines in price between those same dates. Each Fund segregates collateral, consisting of cash or liquid assets, sufficient to collateralize the market value of the investments sold short. Each Fund incurs transaction costs, including dividend expense, borrowing costs and interest
125
The UBS Funds
Notes to financial statements
expenses in connection with opening, maintaining and closing short sales. These dividends and interest are booked as an expense or liability to the Fund.
Because a Fund's loss on a short sale arises from increases in the value of the investment sold short, such loss, like the potential increase in price of the security sold short, is theoretically unlimited. The Fund's investments held long could also decline in value at the same time the value of the investment sold short increases, thereby increasing the Fund's potential for loss. There is also the risk that the counterparty to a short sale transaction may fail to honor its contract terms, causing a loss to the Fund.
For the period ended June 30, 2017, UBS Dynamic Alpha Fund, UBS U.S. Small Cap Growth Fund and UBS Total Return Bond Fund did not engage in short sale transactions.
Restricted securities: The Funds may invest in securities that are subject to legal or contractual restrictions on resale. These securities generally may be resold in transactions exempt from registration or to the public if the securities are registered. Disposal of these securities may involve time-consuming negotiations and expenses, and prompt sale at an acceptable price may be difficult. Information regarding restricted securities, if any, is included in each Fund's portfolio footnotes.
Derivative instruments
Purchased options: Certain Funds may purchase put and call options, including, but not limited to, options on foreign or US securities, indices, foreign currencies and options on swap agreements (commonly referred to as swaptions), in order to gain exposure to or protect against changes in the markets or in an attempt to enhance income or gains. Purchasing call options tends to increase exposure to the underlying instrument. Purchasing put options tends to decrease exposure to the underlying instrument.
The Fund pays a premium which is included in the Statement of assets and liabilities as an investment and subsequently marked-to-market to reflect the current value of the option. Premiums paid for purchasing options which expire are treated as realized losses. Purchased options are shown as portfolio holdings within the Portfolio of investments and are included in the Statement of assets and liabilities in investments of unaffiliated issuers, at value.
The risk associated with purchasing put and call options is limited to the premium paid. Premiums paid for purchasing options which are exercised or closed are added to the amounts paid or offset against the proceeds on the underlying future, security or currency transaction to determine the realized gain or loss.
Option writing: Certain Funds may write (sell) put and call options, including, but not limited to, options on foreign or US securities, indices, foreign currencies and options on swap agreements (commonly referred to as swaptions), in order to gain exposure to or protect against changes in the markets or in an attempt to enhance income or gains.
When a Fund writes a call or a put option, an amount equal to the premium received by the Fund is included in the Fund's Statement of assets and liabilities as a liability. The amount of the liability is subsequently marked-to-market to reflect the current market value of the option written. If an option which a Fund has written either expires on its stipulated expiration date or the Fund enters into a closing purchase transaction, the Fund realizes a gain (or a loss if the cost of a closing purchase transaction exceeds the premium received when the option was written) without regard to any unrealized gain or loss on the underlying security or derivative instrument, and the liability related to such option is extinguished. If a call option, which a Fund has written, is exercised, the Fund recognizes a realized gain or loss (long-term or short-term, depending on the holding period of the underlying security) from the sale of the underlying security or derivative instrument and the proceeds from the sale are increased by the premium originally received. If a put option, which a Fund has written, is exercised, the amount of the premium originally received reduces the cost of the security or derivative instrument which the Fund purchases upon exercise of the option.
126
The UBS Funds
Notes to financial statements
In writing an option, a Fund bears the market risk of an unfavorable change in the price of the derivative instrument, security, or currency underlying the written option. Exercise of an option written by a Fund could result in the Fund selling or buying a derivative instrument, security or currency at a price different from current market value.
In the normal course of trading activities, the Funds trade and hold certain fair valued derivative contracts that constitute guarantees. Such contracts include written put options, where the Funds would be obligated to purchase securities at specified prices (i.e. the options are exercised by the counterparties). The maximum payout for these contracts is limited to the number of put option contracts written and the related strike prices, respectively. Maximum payout amounts could be offset by the subsequent sale, if any, of assets obtained via the execution of a payout event. At June 30, 2017, none of the Funds held written put options.
Futures contracts: Certain Funds may purchase or sell futures contracts to increase or reduce their exposure to an asset class without purchasing or selling the underlying securities, either as a hedge or to enhance income or realized gains. Generally, a futures contract is a standard binding agreement to buy or sell a specified quantity of an underlying reference asset, such as a specific security or currency, at a specified price at a specified later date.
Upon entering into a futures contract, a Fund is required to deliver to a broker an amount of cash and/or US government securities equal to a certain percentage of the contract amount. This amount is known as the "initial margin". Subsequent payments, known as "variation margin", generally are made or received by a Fund, depending on the daily fluctuations in the value of the underlying futures contracts. Such variation margin is recorded for financial statement purposes on a daily basis as an unrealized appreciation or depreciation on futures until the futures contract is closed or expires, at which time the net gain or loss is reclassified to realized gain or loss on futures.
Using futures contracts involves various market risks, including interest rate and equity risk. Risks of entering into futures contracts include the possibility that there may be an illiquid market or that a change in the value of the contract may not correlate with changes in the value of the underlying securities. To the extent that market prices move in an unexpected direction, there is a risk that a Fund will not achieve the anticipated benefits of the futures contract or may realize a loss.
Forward foreign currency contracts: Certain Funds may enter into forward foreign currency contracts in order to expedite settlement of portfolio transactions, manage currency risk or to gain exposure to a currency without purchasing securities denominated in that currency. Generally, a forward foreign currency contract is a commitment to purchase or sell a foreign currency at a future date at a negotiated forward rate. Non-deliverable forward foreign currency contracts are settled with the counterparty in US dollars, or another fully convertible currency, without the physical delivery of foreign currency.
Fluctuations in the value of open forward foreign currency contracts are recorded daily for book purposes as unrealized appreciation or depreciation on forward foreign currency contracts by the Funds. Realized gains and losses on forward foreign currency contracts include net gains or losses recognized by the Funds on contracts which have been sold or matured.
Risks may arise upon entering into forward foreign currency contracts from the potential inability of counterparties to meet the terms of their contracts and from unanticipated movements in the value of foreign currencies relative to the US dollar or each other.
Swap agreements: Certain Funds may engage in swap agreements, including, but not limited to, interest rate, credit default and total return swap agreements. A Fund expects to enter into these transactions to preserve a return or spread on a particular investment or to hedge a portion of the portfolio's duration, to protect against any increase in the price of securities the Fund anticipates purchasing at a later date, to gain exposure to certain markets in the most economical way possible or in an attempt to enhance income or gains.
127
The UBS Funds
Notes to financial statements
The Funds accrue for interim payments on swap agreements on a daily basis, with the net amount recorded within unrealized appreciation or depreciation of swap agreements. Once interim payments are settled in cash, the net amount is recorded as realized gain/loss on swap agreements, in addition to realized gain/loss recorded upon the termination of swap agreements on the Statement of operations. Fluctuations in the value of swap agreements are recorded for financial statement purposes as unrealized appreciation or depreciation on swap agreements.
Certain Funds may enter into interest rate swap agreements with another party to receive or pay interest (e.g., an exchange of fixed rate payments for floating rate payments) to protect themselves from interest rate fluctuations. This type of swap is an agreement that obligates two parties to exchange a series of cash flows at specified intervals based upon or calculated by reference to a specified interest rate(s) for a specified amount. The payment flows are usually netted against each other, with the difference being paid by one party to the other. Interest rate swap agreements are subject to general market risk, liquidity risk, counterparty risk and interest rate risk.
Credit default swap agreements involve commitments to make or receive payments in the event of a default of a security or other credit event of the referenced obligation. As a buyer, the Fund would make periodic payments to the counterparty, and the Fund would receive payments only upon the occurrence of a default or credit event. If no default or credit event occurs, the Fund will lose its periodic stream of payments over the term of the contract. However, if a default or a credit event does occur, the Fund typically would receive full notional value for the referenced obligation that may have little or no value. As a seller, the Fund would receive periodic payments from the counterparty, and the Fund would make payments only upon the occurrence of a default or a credit event. If no default or credit event occurs, the Fund will gain the periodic stream of payments it received over the term of the contract and the counterparty will lose its periodic stream of payments over the term of the contract. However, if a default or credit event occurs, the Fund typically would pay full notional value for the referenced obligation that may have little or no value. Credit default swap agreements may involve greater risks than if the Fund had invested in the referenced obligation directly and are subject to general market risk, liquidity risk and credit risk.
Credit default swap agreements on credit indices involve one party making a stream of payments to another party in exchange for the right to receive a specified return in the event of a write-down, principal shortfall, interest shortfall or default of all or part of the referenced entities comprising the credit index. A credit index is a list of a basket of credit instruments or exposures designed to be representative of some part of the credit market as a whole. These indices are made up of referenced credits that are judged by a poll of dealers to be the most liquid entities in the credit default swap market based on the sector of the index. Components of the indices may include, but are not limited to, investment grade securities, high yield securities, asset backed securities, emerging markets, and/or various credit ratings within each sector. Credit indices are traded using credit default swaps with standardized terms including a fixed spread and standard maturity dates. An index credit default swap references all the names in the index, and if there is a default, the credit event is settled based on that name's weight in the index. The composition of the indices changes periodically, usually every six months, and for most indices, each name has an equal weight in the index. A Fund may use credit default swap agreements on credit indices to hedge a portfolio of credit default swaps or bonds with a credit default swap on indices which is less expensive than it would be to buy many credit default swaps to achieve a similar effect. Credit default swap agreements on credit indices are benchmarks for protecting investors owning bonds against default, and traders use them to speculate on changes in credit quality.
Credit default swap agreements on corporate issues or sovereign issues of an emerging market country involve one party making a stream of payments to another party in exchange for the right to receive a specified return in the event of a default or other credit event. If a credit event occurs and cash settlement is not elected, a variety of other obligations may be delivered in lieu of the specific referenced obligation. The ability to deliver other obligations may result in a cheapest-to-deliver option (the buyer of protection's right to choose the deliverable obligation with the lowest value following a credit event). A Fund may use credit default swap agreements on corporate issues or sovereign issues of an emerging market country to provide a measure of protection against defaults of the issuers (i.e., to
128
The UBS Funds
Notes to financial statements
reduce risk where the Fund owns or has exposure to the referenced obligation) or to take an active long or short position with respect to the likelihood of a particular issuer's default.
The maximum potential amount of future payments (undiscounted) that a Fund as a seller of protection could be required to make under a credit default swap agreement would be an amount equal to the notional amount of the agreement, which may exceed the amount of the value reflected on the Statement of assets and liabilities. Notional amounts of all credit default swap agreements outstanding as of the period end for which a Fund is the seller of protection are disclosed under the section "Credit default swap agreements on corporate issues—sell protection" in the Portfolio of investments. These potential amounts would be partially offset by any recovery values of the respective referenced obligations, upfront payments received upon entering into the agreement, or net amounts received from the settlement of buy protection credit default swap agreements entered into, if any, by a Fund for the same referenced entity or entities.
Total return swap agreements involve commitments to pay or receive interest in exchange for a market-linked return based on a notional amount. To the extent the total return of the security or index underlying the transaction exceeds or falls short of the offsetting interest rate obligation, the Fund will receive a payment from or make a payment to the counterparty, respectively. Total return swap agreements are marked-to-market daily, and the change, if any, is recorded as unrealized appreciation or depreciation. Total return swap agreements are subject to general market risk, liquidity risk, counterparty risk, interest rate risk, credit risk and the risk that there may be unfavorable changes in the underlying investments or instruments.
The use of swap agreements involves investment techniques and risks different from those associated with ordinary portfolio security transactions. If UBS AM is incorrect in its forecast of market values, interest rates and other applicable factors, the investment performance of the Fund will be less favorable than it would have been if this investment technique was never used. OTC swap agreements do not involve the delivery of securities and are subject to counterparty risk. If the other party to a swap agreement defaults and fails to consummate the transaction, a Fund's risk of loss will consist of the net amount of interest or other payments that the Fund is contractually entitled to receive. Therefore, the Fund would consider the creditworthiness of the counterparty to a swap agreement in evaluating potential credit risk.
Certain clearinghouses offer clearing for limited types of derivatives transactions, such as interest rate and credit default swap agreements. Centrally cleared swap agreements must be transacted through a futures commission merchant ("FCM") and cleared through a clearinghouse that serves as a central counterparty. The performance of a centrally cleared swap transaction is effectively guaranteed by a central clearinghouse, thereby reducing the Fund's exposure to the credit risk of its original counterparty. The Fund will be required to post specified levels of margin with the clearinghouse or at the instruction of the clearinghouse; the margin required by a clearinghouse may be greater than the margin the Fund would be required to post in an uncleared transaction. Centrally cleared swap agreements, if any, are reported on the Statement of assets and liabilities based on variation margin receivable or payable, if any.
Derivatives by underlying risk: Investment companies value their derivatives at fair value and recognize changes in fair value through the Statement of operations. Under US GAAP, investment companies do not qualify for hedge accounting. Accordingly, even though a Fund's investments in derivatives may represent economic hedges, they are considered to be non-hedge transactions for purposes of disclosure under US GAAP.
The volume of derivatives as disclosed in each Fund's Portfolio of investments is representative of the volume of derivatives outstanding during the period ended June 30, 2017.
Swap agreements, forward foreign currency contracts, swaptions and options written entered into by the Funds may contain credit-risk related contingent features that could be triggered subject to certain circumstances. Such circumstances include agreed upon net asset value thresholds. If triggered, the derivative counterparty could request
129
The UBS Funds
Notes to financial statements
additional cash margin and/or terminate the derivative contract. The aggregate fair value of the derivative contracts that are in a net liability position that contain these triggers can be found in the Portfolio of investments. The aggregate fair value of assets that are already posted as collateral as of June 30, 2017 is reflected in the Statement of assets and liabilities.
At June 30, 2017, the Fund had the following derivatives categorized by underlying risk:
Asset derivatives1
| Interest rate risk | Foreign exchange risk | Credit risk | Equity risk | Total | |||||||||||||||||||
UBS Dynamic Alpha Fund | |||||||||||||||||||||||
Forward foreign currency contracts | $ | — | $ | 212,573 | $ | — | $ | — | $ | 212,573 | |||||||||||||
Futures contracts | 659,577 | — | — | 622,745 | 1,282,322 | ||||||||||||||||||
Swap agreements | — | — | 25,305 | — | 25,305 | ||||||||||||||||||
Total value | $ | 659,577 | $ | 212,573 | $ | 25,305 | $ | 622,745 | $ | 1,520,200 | |||||||||||||
Liability derivatives2
| Interest rate risk | Foreign exchange risk | Credit risk | Equity risk | Total | |||||||||||||||||||
UBS Dynamic Alpha Fund | |||||||||||||||||||||||
Forward foreign currency contracts | $ | — | $ | (1,676,324 | ) | $ | — | $ | — | $ | (1,676,324 | ) | |||||||||||
Futures contracts | (418,799 | ) | — | — | (317,853 | ) | (736,652 | ) | |||||||||||||||
Swap agreements | — | — | (1,474,916 | ) | — | (1,474,916 | ) | ||||||||||||||||
Total value | $ | (418,799 | ) | $ | (1,676,324 | ) | $ | (1,474,916 | ) | $ | (317,853 | ) | $ | (3,887,892 | ) | ||||||||
During the year ended June 30, 2017, net realized gains (losses) and change in net unrealized appreciation (depreciation) from derivatives were as follows:
| Interest rate risk | Foreign exchange risk | Credit risk | Equity risk | Total | |||||||||||||||||||
UBS Dynamic Alpha Fund | |||||||||||||||||||||||
Net realized gain (loss)3 | |||||||||||||||||||||||
Forward foreign currency contracts | $ | — | $ | 3,724,517 | $ | — | $ | — | $ | 3,724,517 | |||||||||||||
Futures contracts | (206,052 | ) | — | — | 6,583,339 | 6,377,287 | |||||||||||||||||
Options purchased | — | — | (14,400 | ) | (1,626,905 | ) | (1,641,305 | ) | |||||||||||||||
Options written | — | — | — | 50,250 | 50,250 | ||||||||||||||||||
Swap agreements | (176,755 | ) | — | 990,822 | — | 814,067 | |||||||||||||||||
Total net realized gain (loss) | $ | (382,807 | ) | $ | 3,724,517 | $ | 976,422 | $ | 5,006,684 | $ | 9,324,816 | ||||||||||||
Change in net unrealized appreciation (depreciation)4 | |||||||||||||||||||||||
Forward foreign currency contracts | $ | — | $ | (3,395,426 | ) | $ | — | $ | — | $ | (3,395,426 | ) | |||||||||||
Futures contracts | 1,688,257 | — | — | (105,196 | ) | 1,583,061 | |||||||||||||||||
Options purchased | — | — | — | 895,044 | 895,044 | ||||||||||||||||||
Swap agreements | 67,080 | — | (380,430 | ) | — | (313,350 | ) | ||||||||||||||||
Total change in net unrealized appreciation (depreciation) | $ | 1,755,337 | $ | (3,395,426 | ) | $ | (380,430 | ) | $ | 789,848 | $ | (1,230,671 | ) | ||||||||||
Table footnotes begin on page 132.
130
The UBS Funds
Notes to financial statements
At June 30, 2017, the Fund had the following derivatives categorized by underlying risk:
Asset derivatives1
| Interest rate risk | Foreign exchange risk | Credit risk | Equity risk | Total | |||||||||||||||||||
UBS Global Allocation Fund | |||||||||||||||||||||||
Forward foreign currency contracts | $ | — | $ | 456,739 | $ | — | $ | — | $ | 456,739 | |||||||||||||
Futures contracts | 689,968 | — | — | 336,204 | 1,026,172 | ||||||||||||||||||
Swap agreements | — | — | 1,622,132 | — | 1,622,132 | ||||||||||||||||||
Total value | $ | 689,968 | $ | 456,739 | $ | 1,622,132 | $ | 336,204 | $ | 3,105,043 | |||||||||||||
Liability derivatives2
| Interest rate risk | Foreign exchange risk | Credit risk | Equity risk | Total | |||||||||||||||||||
UBS Global Allocation Fund | |||||||||||||||||||||||
Forward foreign currency contracts | $ | — | $ | (1,090,356 | ) | $ | — | $ | — | $ | (1,090,356 | ) | |||||||||||
Futures contracts | (1,097,394 | ) | — | — | (316,441 | ) | (1,413,835 | ) | |||||||||||||||
Swap agreements | — | — | (817,998 | ) | — | (817,998 | ) | ||||||||||||||||
Total value | $ | (1,097,394 | ) | $ | (1,090,356 | ) | $ | (817,998 | ) | $ | (316,441 | ) | $ | (3,322,189 | ) | ||||||||
During the year ended June 30, 2017, net realized gains (losses) and change in net unrealized appreciation (depreciation) from derivatives were as follows:
| Interest rate risk | Foreign exchange risk | Credit risk | Equity risk | Total | |||||||||||||||||||
UBS Global Allocation Fund | |||||||||||||||||||||||
Net realized gain (loss)3 | |||||||||||||||||||||||
Forward foreign currency contracts | $ | — | $ | 1,044,355 | $ | — | $ | — | $ | 1,044,355 | |||||||||||||
Futures contracts | (366,802 | ) | — | — | (2,938,509 | ) | (3,305,311 | ) | |||||||||||||||
Options purchased | — | — | — | (1,666,949 | ) | (1,666,949 | ) | ||||||||||||||||
Options written | — | — | — | 297,753 | 297,753 | ||||||||||||||||||
Swap agreements | — | — | 3,276,558 | (951 | ) | 3,275,607 | |||||||||||||||||
Total net realized gain (loss) | $ | (366,802 | ) | $ | 1,044,355 | $ | 3,276,558 | $ | (4,308,656 | ) | $ | (354,545 | ) | ||||||||||
Change in net unrealized appreciation (depreciation)4 | |||||||||||||||||||||||
Forward foreign currency contracts | $ | — | $ | (631,910 | ) | $ | — | $ | — | $ | (631,910 | ) | |||||||||||
Futures contracts | (1,484,672 | ) | — | — | 1,442,130 | (42,542 | ) | ||||||||||||||||
Options purchased | — | — | — | 553,331 | 553,331 | ||||||||||||||||||
Options written | — | — | — | (147,028 | ) | (147,028 | ) | ||||||||||||||||
Swap agreements | — | — | (604,398 | ) | — | (604,398 | ) | ||||||||||||||||
Total change in net unrealized appreciation (depreciation) | $ | (1,484,672 | ) | $ | (631,910 | ) | $ | (604,398 | ) | $ | 1,848,433 | $ | (872,547 | ) | |||||||||
Table footnotes begin on page 132.
131
The UBS Funds
Notes to financial statements
At June 30, 2017, the Fund had the following derivatives categorized by underlying risk:
Asset derivatives1
| Interest rate risk | Foreign exchange risk | Total | |||||||||||||
UBS Total Return Bond Fund | |||||||||||||||
Forward foreign currency contracts | $ | — | $ | 30,479 | $ | 30,479 | |||||||||
Futures contracts | 129,158 | — | 129,158 | ||||||||||||
Swap agreements | 4,251 | — | 4,251 | ||||||||||||
Total value | $ | 133,409 | $ | 30,479 | $ | 163,888 | |||||||||
Liability derivatives2
| Interest rate risk | Foreign exchange risk | Total | |||||||||||||
UBS Total Return Bond Fund | |||||||||||||||
Forward foreign currency contracts | $ | — | $ | (14,216 | ) | $ | (14,216 | ) | |||||||
Futures contracts | (51,254 | ) | — | (51,254 | ) | ||||||||||
Total value | $ | (51,254 | ) | $ | (14,216 | ) | $ | (65,470 | ) | ||||||
During the year ended June 30, 2017, net realized gains (losses) and change in net unrealized appreciation (depreciation) from derivatives were as follows:
| Interest rate risk | Foreign exchange risk | Credit risk | Total | ||||||||||||||||
UBS Total Return Bond Fund | |||||||||||||||||||
Net realized gain (loss)3 | |||||||||||||||||||
Forward foreign currency contracts | $ | — | $ | 47,034 | $ | — | $ | 47,034 | |||||||||||
Futures contracts | (334,447 | ) | — | — | (334,447 | ) | |||||||||||||
Options purchased | (51,269 | ) | (33,104 | ) | (164,974 | ) | (249,347 | ) | |||||||||||
Options written | 3,965 | 106,935 | 74,382 | 185,282 | |||||||||||||||
Swap agreements | 38,305 | — | — | 38,305 | |||||||||||||||
Total net realized gain (loss) | $ | (343,446 | ) | $ | 120,865 | $ | (90,592 | ) | $ | (313,173 | ) | ||||||||
Change in net unrealized appreciation (depreciation)4 | |||||||||||||||||||
Forward foreign currency contracts | $ | — | $ | (10,884 | ) | $ | — | $ | (10,884 | ) | |||||||||
Futures contracts | 177,608 | — | — | 177,608 | |||||||||||||||
Options purchased | (30,261 | ) | 5,357 | 1,227 | (23,677 | ) | |||||||||||||
Options written | 26,455 | (17,445 | ) | (6,011 | ) | 2,999 | |||||||||||||
Swap agreements | 12,434 | — | — | 12,434 | |||||||||||||||
Total change in net unrealized appreciation (depreciation) | $ | 186,236 | $ | (22,972 | ) | $ | (4,784 | ) | $ | 158,480 | |||||||||
1 In the Statement of assets and liabilities, options purchased are shown within investments of unaffiliated issuers, at value, swap agreements (except centrally cleared swap agreements) are shown within outstanding swap agreements, at value, while forward foreign currency contracts are shown within unrealized appreciation on forward foreign currency contracts. Futures contracts are reported in the table above using cumulative appreciation of futures contracts and centrally cleared swap agreements are reported at value, as reported in the futures contracts and centrally cleared swap agreements tables at the end of the Portfolio of investments, respectively, but only the variation margin to be received, if any, is reported within the Statement of assets and liabilities.
132
The UBS Funds
Notes to financial statements
2 In the Statement of assets and liabilities, options written are shown within options written, at value, swap agreements (except centrally cleared swap agreements) are shown within outstanding swap agreements, at value, while forward foreign currency contracts are shown within unrealized depreciation on forward foreign currency contracts. Futures contracts are reported in the table above using cumulative depreciation of futures contracts and centrally cleared swap agreements are reported at value, as reported in the futures contracts and centrally cleared swap agreements tables at the end of the Portfolio of investments, respectively, but only the variation margin to be paid, if any, is reported within the Statement of assets and liabilities.
3 The net realized gain (loss) is shown in the Statement of operations in net realized gain (loss) on futures contracts, options written, swap agreements and forward foreign currency contracts, unless otherwise noted. The net realized gain (loss) of options purchased is shown in the Statement of operations in net realized gain (loss) on investments in unaffiliated issuers.
4 The change in net unrealized appreciation (depreciation) is shown in the Statement of operations in change in net unrealized appreciation (depreciation) on futures contracts, options written, swap agreements and forward foreign currency contracts, unless otherwise noted. The change in net unrealized appreciation (depreciation) of options purchased is shown in the Statement of operations in change in net unrealized appreciation (depreciation) on investments.
UBS International Sustainable Equity Fund had net realized gains of $15,541 on forward foreign currency contracts related to foreign exchange risk and net change in unrealized depreciation of $58 on forward foreign currency contracts related to foreign exchange risk.
UBS Municipal Bond Fund had net realized losses of $93,705 on futures contracts related to interest rate risk.
Offsetting of certain derivatives: The Funds typically enter into International Swaps and Derivatives Association, Inc. Master Agreements ("ISDA Master Agreements") or similar master agreements with its OTC derivative contract counterparties in order to, among other things, reduce its credit risk to counterparties. ISDA Master Agreements include provisions for general obligations, representations, collateral and events of default or termination. Under an ISDA Master Agreement, the Funds typically may offset with the counterparty certain derivative financial instrument's payables and/or receivables with collateral held and/or posted and create one single net payment (close-out netting) in the event of default or termination. The Statement of assets and liabilities is presented gross of any netting.
At June 30, 2017, derivative assets and liabilities (by type) on a gross basis and derivatives subject to an enforceable master netting arrangement ("MNA") or similar agreement were follows:
UBS Dynamic Alpha Fund
Derivative Financial Instruments: | Assets | Liabilities | |||||||||
Forward foreign currency contracts | $ | 212,573 | $ | (1,676,324 | ) | ||||||
Futures contracts1 | 1,282,322 | (736,652 | ) | ||||||||
Swap agreements1 | 25,305 | (1,474,916 | ) | ||||||||
Total gross amount of derivative assets and liabilities in the Statement of assets and liabilities | $ | 1,520,200 | $ | (3,887,892 | ) | ||||||
Derivatives not subject to MNA or similar agreements | (1,282,322 | ) | 2,193,021 | ||||||||
Total gross amount of assets and liabilities subject to MNA or similar agreements | $ | 237,878 | $ | (1,694,871 | ) | ||||||
Table footnotes begin on page 136.
133
The UBS Funds
Notes to financial statements
The following tables present the Fund's derivative assets and liabilities by counterparty net of amounts available for offset under a MNA and net of the related collateral received/pledged by the Fund as of the period end.
Counterparty | Gross amount of assets | Financial instruments and derivatives available for offset | Collateral received2 | Net amount of assets | |||||||||||||||
CITI | $ | 11,253 | $ | (11,253 | ) | $ | — | $ | — | ||||||||||
GSI | 121,401 | (121,401 | ) | — | — | ||||||||||||||
JPMCB | 14,052 | (14,052 | ) | — | — | ||||||||||||||
MSC | 91,172 | (91,172 | ) | — | — | ||||||||||||||
Total | $ | 237,878 | $ | (237,878 | ) | $ | — | $ | — | ||||||||||
Counterparty | Gross amount of liabilities | Financial instruments and derivatives available for offset | Collateral pledged2 | Net amount of liabilities | |||||||||||||||
BB | $ | (285,644 | ) | $ | — | $ | — | $ | (285,644 | ) | |||||||||
CITI | (80,886 | ) | 11,253 | — | (69,633 | ) | |||||||||||||
GSI | (867,766 | ) | 121,401 | — | (746,365 | ) | |||||||||||||
JPMCB | (226,626 | ) | 14,052 | 212,574 | — | ||||||||||||||
MSC | (233,949 | ) | 91,172 | — | (142,777 | ) | |||||||||||||
Total | $ | (1,694,871 | ) | $ | 237,878 | $ | 212,574 | $ | (1,244,419 | ) | |||||||||
At June 30, 2017, derivative assets and liabilities (by type) on a gross basis and derivatives subject to an enforceable MNA or similar agreement were follows:
UBS Global Allocation Fund
Derivative Financial Instruments: | Assets | Liabilities | |||||||||
Forward foreign currency contracts | $ | 456,739 | $ | (1,090,356 | ) | ||||||
Futures contracts1 | 1,026,172 | (1,413,835 | ) | ||||||||
Swap agreements1 | 1,622,132 | (817,998 | ) | ||||||||
Total gross amount of derivative assets and liabilities in the Statement of assets and liabilities | $ | 3,105,043 | $ | (3,322,189 | ) | ||||||
Derivatives not subject to MNA or similar agreements | (2,648,304 | ) | 2,231,833 | ||||||||
Total gross amount of assets and liabilities subject to MNA or similar agreements | $ | 456,739 | $ | (1,090,356 | ) | ||||||
Table footnotes begin on page 136.
134
The UBS Funds
Notes to financial statements
The following tables present the Fund's derivative assets and liabilities by counterparty net of amounts available for offset under a MNA and net of the related collateral received/pledged by the Fund as of the period end.
Counterparty | Gross amount of assets | Financial instruments and derivatives available for offset | Collateral received | Net amount of assets | |||||||||||||||
BB | $ | 239,122 | $ | (239,122 | ) | $ | — | $ | — | ||||||||||
GSI | 119,118 | (119,118 | ) | — | — | ||||||||||||||
JPMCB | 70,725 | (70,725 | ) | — | — | ||||||||||||||
MSC | 27,774 | (27,774 | ) | — | — | ||||||||||||||
Total | $ | 456,739 | $ | (456,739 | ) | $ | — | $ | — | ||||||||||
Counterparty | Gross amount of liabilities | Financial instruments and derivatives available for offset | Collateral pledged | Net amount of liabilities | |||||||||||||||
BB | $ | (415,642 | ) | $ | 239,122 | $ | — | $ | (176,520 | ) | |||||||||
CSI | (46,360 | ) | — | — | (46,360 | ) | |||||||||||||
GSI | (283,624 | ) | 119,118 | — | (164,506 | ) | |||||||||||||
JPMCB | (226,196 | ) | 70,725 | — | (155,471 | ) | |||||||||||||
MSC | (118,534 | ) | 27,774 | — | (90,760 | ) | |||||||||||||
Total | $ | (1,090,356 | ) | $ | 456,739 | $ | — | $ | (633,617 | ) | |||||||||
At June 30, 2017, derivative assets and liabilities (by type) on a gross basis and derivatives subject to an enforceable MNA or similar agreement were follows:
UBS International Sustainable Equity Fund
Derivative Financial Instruments: | Assets | Liabilities | |||||||||
Forward foreign currency contracts | $ | — | $ | (58 | ) | ||||||
Total gross amount of assets and liabilities subject to MNA or similar agreements | $ | — | $ | (58 | ) | ||||||
The following tables present the Fund's derivative assets and liabilities by counterparty net of amounts available for offset under a MNA and net of the related collateral received/pledged by the Fund as of the period end.
Counterparty | Gross amount of liabilities | Financial instruments and derivatives available for offset | Collateral pledged | Net amount of liabilities | |||||||||||||||
JPMCB | $ | (58 | ) | $ | — | $ | — | $ | (58 | ) | |||||||||
135
The UBS Funds
Notes to financial statements
At June 30, 2017, derivative assets and liabilities (by type) on a gross basis and derivatives subject to an enforceable MNA or similar agreement were as follows:
UBS Total Return Bond Fund
Derivative Financial Instruments: | Assets | Liabilities | |||||||||
Forward foreign currency contracts | $ | 30,479 | $ | (14,216 | ) | ||||||
Futures contracts1 | 129,158 | (51,254 | ) | ||||||||
Swap agreements | 4,251 | — | |||||||||
Total gross amount of derivative assets and liabilities in the Statement of assets and liabilities | $ | 163,888 | $ | (65,470 | ) | ||||||
Derivatives not subject to MNA or similar agreements | (129,158 | ) | 51,254 | ||||||||
Total gross amount of assets and liabilities subject to MNA or similar agreements | $ | 34,730 | $ | (14,216 | ) | ||||||
The following tables present the Fund's derivative assets and liabilities by counterparty net of amounts available for offset under a MNA and net of the related collateral received/pledged by the Fund as of the period end.
Counterparty | Gross amount of assets | Financial instruments and derivatives available for offset | Collateral received | Net amount of assets | |||||||||||||||
BB | $ | 2,258 | $ | (2,258 | ) | $ | — | $ | — | ||||||||||
CITI | 4,251 | — | — | 4,251 | |||||||||||||||
JPMCB | 28,221 | (5,855 | ) | — | 22,366 | ||||||||||||||
Total | $ | 34,730 | $ | (8,113 | ) | $ | — | $ | 26,617 | ||||||||||
Counterparty | Gross amount of liabilities | Financial instruments and derivatives available for offset | Collateral pledged | Net amount of liabilities | |||||||||||||||
BB | $ | (8,361 | ) | $ | 2,258 | $ | — | $ | (6,103 | ) | |||||||||
JPMCB | (5,855 | ) | 5,855 | — | — | ||||||||||||||
Total | $ | (14,216 | ) | $ | 8,113 | $ | — | $ | (6,103 | ) | |||||||||
1 Includes cumulative appreciation (depreciation) of futures contracts and centrally cleared swaps, at value as reported in the futures contracts and centrally cleared swap tables in the Portfolio of investments, but only the unpaid variation margin is reported within the Statement of assets and liabilities within variation margin on futures contracts and centrally cleared swap agreements, respectively.
2 In some instances, the actual collateral received and/or pledged may be more than the amount shown and may be comprised of cash collateral, non-cash collateral or a combination of both.
Investment advisory fees and other transactions with affiliates
The Advisor, a registered investment advisor, provides the Funds with investment management services. As compensation for these services, each Fund pays the Advisor a monthly fee, accrued daily and paid monthly, based on each Fund's respective average daily net assets in accordance with the following per annum schedule:
Fund | $0 to $500 mm | $500 mm to $1.0 billion | $1.0 billion to $1.5 billion | $1.5 billion to $2.0 billion | $2.0 billion to $4.0 billion | $4.0 billion and over | |||||||||||||||||||||
UBS Dynamic Alpha Fund | 0.850 | % | 0.800 | % | 0.750 | % | 0.725 | % | 0.700 | % | 0.680 | % | |||||||||||||||
136
The UBS Funds
Notes to financial statements
Fund | $0 to $500 mm | $500 mm to $1.0 billion | $1.0 billion to $1.5 billion | $1.5 billion to $2.0 billion | $2.0 billion to $3.0 billion | $3.0 billion to $6.0 billion | $6.0 billion and over | ||||||||||||||||||||||||
UBS Global Allocation Fund | 0.800 | % | 0.750 | % | 0.700 | % | 0.675 | % | 0.650 | % | 0.630 | % | 0.610 | % | |||||||||||||||||
Fund | $0 to $500 mm | $500 mm to $1.0 billion | $1.0 billion to $1.5 billion | $1.5 billion to $2.0 billion | $2.0 billion and over | ||||||||||||||||||
UBS International Sustainable Equity Fund | 0.800 | % | 0.750 | % | 0.700 | % | 0.675 | % | 0.650 | % | |||||||||||||
UBS U.S. Large Cap Equity Fund | 0.700 | 0.650 | 0.600 | 0.575 | 0.550 | ||||||||||||||||||
UBS U.S. Small Cap Growth Fund | 0.850 | 0.850 | 0.825 | 0.825 | 0.825 | ||||||||||||||||||
Fund | All assets | ||||||
UBS Total Return Bond Fund | 0.500 | % | |||||
UBS Municipal Bond Fund | 0.400 | ||||||
For UBS Global Allocation Fund, UBS International Sustainable Equity Fund, UBS U.S. Large Cap Equity Fund, UBS Total Return Bond Fund and UBS Municipal Bond Fund, the Advisor has agreed to waive its fees and/or reimburse expenses (excluding expenses incurred through investment in other investment companies, interest, taxes, brokerage commissions and extraordinary expenses) to the extent necessary so that the Funds' operating expenses (excluding expenses incurred through investment in other investment companies, interest, taxes, brokerage commissions and extraordinary expenses) do not exceed the expense limit of each class of shares as indicated in the following table. For UBS Dynamic Alpha Fund and UBS U.S. Small Cap Growth Fund the Advisor has agreed to waive its fees and/or reimburse expenses (excluding expenses incurred through investment in other investment companies, interest, taxes, brokerage commissions, extraordinary expenses and dividend expense and security loan fees for securities sold short) to the extent necessary so that the Fund's operating expenses (excluding expenses incurred through investment in other investment companies, interest, taxes, brokerage commissions, extraordinary expenses and dividend expense and security loan fees for securities sold short) do not exceed the expense limit of each class of shares as indicated in the following table. The contractual fee waiver and/or expense reimbursement agreement for each Fund, except UBS International Sustainable Equity Fund, will remain in place through the period ending October 27, 2017. The fee waiver and/or expense reimbursement for UBS International Sustainable Equity Fund is irrevocable. Investment advisory fees, including the dollar amount waived or reimbursed, for the period ended June 30, 2017 were as follows:
Fund | Class A expense cap | Class C expense cap | Class P expense cap | Amount due to or (due from) Advisor | Advisory fees incurred | Fees waived/ expenses reimbursed | Recoupments | ||||||||||||||||||||||||
UBS Dynamic Alpha Fund | 1.35 | % | 2.10 | % | 1.10 | % | $ | 84,865 | $ | 1,648,151 | $ | 315,834 | $ | — | |||||||||||||||||
UBS Global Allocation Fund1 | 1.20 | 1.95 | 0.95 | 129,766 | 2,944,081 | 508,271 | — | ||||||||||||||||||||||||
UBS International Sustainable Equity Fund | 1.25 | 2.00 | 1.00 | (3,130 | ) | 224,833 | 294,288 | — | |||||||||||||||||||||||
UBS U.S. Large Cap Equity Fund | 0.95 | 1.70 | 0.70 | (26,927 | ) | 200,105 | 307,281 | — | |||||||||||||||||||||||
UBS U.S. Small Cap Growth Fund | 1.24 | 1.99 | 0.99 | 33,830 | 1,351,039 | 395,062 | — | ||||||||||||||||||||||||
UBS Total Return Bond Fund | 0.75 | 1.25 | 0.50 | (30,807 | ) | 342,676 | 544,583 | — | |||||||||||||||||||||||
UBS Municipal Bond Fund | 0.65 | 1.15 | 0.40 | (2,906 | ) | 502,354 | 458,253 | — | |||||||||||||||||||||||
1 Effective October 28, 2016, UBS Global Allocation Fund's expense caps were reduced from 1.35%, 2.10% and 1.10% for Class A, C & P, respectively.
Each Fund, except for UBS International Sustainable Equity Fund, will reimburse the Advisor for expenses it waives or reimburses for a period of three years following such expense waivers or reimbursements, provided that the reimbursement by a Fund of the Advisor will not cause the total operating expense ratio to exceed the contractual
137
The UBS Funds
Notes to financial statements
limit as then may be in effect for the Fund. The expenses waived or reimbursed for the period ended June 30, 2017 are subject to repayment through June 30, 2020.
At June 30, 2017, the following Funds had remaining fee waivers and expense reimbursements subject to repayment to the Advisor and respective dates of expiration as follows:
Fund | Fee waivers/ expense reimbursements subject to repayment | Expires June 30, 2018 | Expires June 30, 2019 | Expires June 30, 2020 | |||||||||||||||
UBS Dynamic Alpha Fund—Class A | $ | 231,074 | $ | 78,494 | $ | 73,863 | $ | 78,717 | |||||||||||
UBS Dynamic Alpha Fund—Class C | 127,677 | 43,534 | 44,827 | 39,316 | |||||||||||||||
UBS Dynamic Alpha Fund—Class P | 557,444 | 165,473 | 194,170 | 197,801 | |||||||||||||||
UBS Global Allocation Fund—Class A | 270,166 | — | 26,083 | 244,083 | |||||||||||||||
UBS Global Allocation Fund—Class C | 224,147 | — | 60,816 | 163,331 | |||||||||||||||
UBS Global Allocation Fund—Class P | 100,857 | — | — | 100,857 | |||||||||||||||
UBS U.S. Large Cap Equity Fund—Class A | 220,211 | 33,158 | 75,018 | 112,035 | |||||||||||||||
UBS U.S. Large Cap Equity Fund—Class C | 50,761 | 9,467 | 17,727 | 23,567 | |||||||||||||||
UBS U.S. Large Cap Equity Fund—Class P | 438,554 | 94,815 | 172,060 | 171,679 | |||||||||||||||
UBS U.S. Small Cap Growth Fund—Class A | 261,467 | 59,130 | 109,706 | 92,631 | |||||||||||||||
UBS U.S. Small Cap Growth Fund—Class C | 31,750 | 5,493 | 13,652 | 12,605 | |||||||||||||||
UBS U.S. Small Cap Growth Fund—Class P | 623,730 | 59,114 | 274,790 | 289,826 | |||||||||||||||
UBS Total Return Bond Fund—Class A1 | 193 | — | — | 193 | |||||||||||||||
UBS Total Return Bond Fund—Class C1 | 431 | — | — | 431 | |||||||||||||||
UBS Total Return Bond Fund—Class P | 586,554 | — | 42,595 | 543,959 | |||||||||||||||
UBS Municipal Bond Fund—Class A | 179,356 | 35,220 | 65,430 | 78,706 | |||||||||||||||
UBS Municipal Bond Fund—Class C | 56,055 | 10,331 | 22,631 | 23,093 | |||||||||||||||
UBS Municipal Bond Fund—Class P | 848,652 | 220,354 | 271,844 | 356,454 | |||||||||||||||
1 For the period from September 29, 2016 (commencement of operations) through June 30, 2017.
Each Fund pays UBS AM a monthly administration fee that is accrued daily and paid monthly at an annual rate of 0.075% of the average daily net assets of such Fund. For the period ended June 30, 2017, the Funds owed and incurred administrative fees as follows:
Fund | Administrative fees owed | Administrative fees incurred | |||||||||
UBS Dynamic Alpha Fund | $ | 9,761 | $ | 145,426 | |||||||
UBS Global Allocation Fund | 21,583 | 276,010 | |||||||||
UBS International Sustainable Equity Fund | 2,302 | 21,078 | |||||||||
UBS U.S. Large Cap Equity Fund | 1,888 | 21,440 | |||||||||
UBS U.S. Small Cap Growth Fund | 6,676 | 119,210 | |||||||||
UBS Total Return Bond Fund | 3,019 | 51,402 | |||||||||
UBS Municipal Bond Fund | 7,851 | 94,192 | |||||||||
The Funds may invest in shares of certain affiliated investment companies also advised or managed by the Advisor. Investments in affiliated investment companies for the period ended June 30, 2017 have been included near the end of each Fund's Portfolio of investments.
During the period ended June 30, 2017, the Funds listed below paid broker commissions to affiliates of the investment advisor as detailed in the below table. These broker commissions are reflected in the Statement of assets and
138
The UBS Funds
Notes to financial statements
liabilities within investments at cost of unaffiliated issuers, and the Statement of operations within net realized gain (loss) on, and/or change in net unrealized appreciation (depreciation) on investments and/or futures contracts.
Fund | UBS Group AG | ||||||
UBS Global Allocation Fund | $ | 3,799 | |||||
UBS International Sustainable Equity Fund | 190 | ||||||
UBS U.S. Large Cap Equity Fund | 2,156 | ||||||
Service and distribution plans
UBS AM (US) is the principal underwriter of each Fund's shares. The Trust has adopted distribution and/or service plans (the "Plans") pursuant to Rule 12b-1 under the 1940 Act for Class A and Class C shares. The Plans govern payments made for the expenses incurred in the service and/or distribution of Class A and Class C shares. Annual fees under the Plans as a percentage of the average daily net assets of each representative class of each of the Funds are as follows:
Fund | Class A | Class C | |||||||||
UBS Dynamic Alpha Fund | 0.25 | % | 1.00 | % | |||||||
UBS Global Allocation Fund | 0.25 | 1.00 | |||||||||
UBS International Sustainable Equity Fund | 0.25 | 1.00 | |||||||||
UBS U.S. Large Cap Equity Fund | 0.25 | 1.00 | |||||||||
UBS U.S. Small Cap Growth Fund | 0.25 | 1.00 | |||||||||
UBS Total Return Bond Fund | 0.25 | 0.75 | |||||||||
UBS Municipal Bond Fund | 0.25 | 0.75 | |||||||||
UBS AM (US) also receives the proceeds of the initial sales charges paid upon purchases of Class A shares and the contingent deferred sales charges paid by shareholders upon certain redemptions of Class A and Class C shares. At June 30, 2017, certain Funds owed UBS AM (US) service and distribution fees, and for the period ended June 30, 2017, certain Funds were informed by UBS AM (US) that it had earned sales charges as follows:
Fund | Service and distribution fees owed | Sales charges earned by distributor | |||||||||
UBS Dynamic Alpha Fund—Class A | $ | 8,961 | 429 | ||||||||
UBS Dynamic Alpha Fund—Class C | 14,547 | — | |||||||||
UBS Global Allocation Fund—Class A | 35,639 | 11,358 | |||||||||
UBS Global Allocation Fund—Class C | 78,926 | 371 | |||||||||
UBS International Sustainable Equity Fund—Class A | 3,241 | 10,044 | |||||||||
UBS International Sustainable Equity Fund—Class C | 1,644 | 10 | |||||||||
UBS U.S. Large Cap Equity Fund—Class A | 2,409 | 7,718 | |||||||||
UBS U.S. Large Cap Equity Fund—Class C | 1,639 | — | |||||||||
UBS U.S. Small Cap Growth Fund—Class A | 5,687 | 3,206 | |||||||||
UBS U.S. Small Cap Growth Fund—Class C | 3,343 | 62 | |||||||||
UBS Total Return Bond Fund—Class A1 | — | 857 | |||||||||
UBS Total Return Bond Fund—Class C1 | 39 | — | |||||||||
UBS Municipal Bond Fund—Class A | 4,283 | 29,009 | |||||||||
UBS Municipal Bond Fund—Class C | 1,025 | 7,633 | |||||||||
1 For the period from September 29, 2016 (commencement of operations) through June 30, 2017.
139
The UBS Funds
Notes to financial statements
Transfer agency and related services fees
UBS Financial Services Inc. provides certain services to the Funds pursuant to a delegation of authority from BNY Mellon Investment Servicing (US) Inc. ("BNY Mellon"), the Funds' transfer agent, and is compensated for these services by BNY Mellon, not the Funds.
For the period ended June 30, 2017, UBS Financial Services Inc. received from BNY Mellon, not the Funds, total delegated service fees as follows:
Fund | Delegated services fees earned | ||||||
UBS Dynamic Alpha Fund | $ | 45,622 | |||||
UBS Global Allocation Fund | 106,975 | ||||||
UBS International Sustainable Equity Fund | 3,794 | ||||||
UBS U.S. Large Cap Equity Fund | 2,511 | ||||||
UBS U.S. Small Cap Growth Fund | 6,922 | ||||||
UBS Total Return Bond Fund | 1,549 | ||||||
UBS Municipal Bond Fund | 14,303 | ||||||
Securities lending
Each Fund may lend securities up to 331/3% of its total assets to qualified broker-dealers or institutional investors. When loaning portfolio securities, each Fund will initially require the borrower to provide the Fund with collateral in an amount at least equal to 102% of the market value of the loaned securities with respect to domestic securities or 105% of the market value of the loaned securities with respect to foreign securities, provided that loans of "Government Securities" as defined in the 1940 Act may be collateralized at 100%. Thereafter, collateral will generally be maintained in an amount at least equal to 102% of the value of the securities loaned with respect to domestic securities, 105% of the value of the securities loaned with respect to foreign securities, or 100% of the value of the securities loaned with respect to "Government Securities." Occasionally, for certain securities, the market value of the collateral may fall below the collateral amount stated above by a de minimis amount for a period of time. However, at no time will the market value of the collateral fall below the market value of the loaned securities with respect to domestic securities or 102% of the value of the loaned securities with respect to foreign securities.
Each Fund will regain ownership of loaned securities to exercise certain beneficial rights; however, the Fund may bear the risk of delay in recovery of, or even loss of rights in, the securities loaned should the borrower fail financially. Each Fund receives compensation for lending its securities from interest or dividends earned on the cash, US government or government agency securities or, under certain conditions, bank letters of credit held as collateral, net of fee rebates paid to the borrower plus reasonable administrative and custody fees. Cash collateral received is invested in JPMorgan U.S. Government Money Market Fund, which is included in each Fund's Portfolio of investments. JPMorgan Chase Bank serves as the Funds' lending agent.
At June 30, 2017, the following Funds had securities on loan at value, cash collateral and non-cash collateral as follows:
Fund | Market value of securities loaned | Total market value of collateral received for securities loaned | Market value of cash collateral received | Market value of non-cash collateral received | Security type held as non-cash collateral | ||||||||||||||||||
UBS Dynamic Alpha Fund | $ | 7,921,141 | $ | 8,106,675 | $ | 8,106,675 | $ | — | $ | — | |||||||||||||
UBS Global Allocation Fund | 16,501,729 | 16,889,087 | 16,889,087 | — | — | ||||||||||||||||||
UBS International Sustainable Equity Fund | 6,365 | 6,685 | 6,685 | — | — | ||||||||||||||||||
UBS U.S. Large Cap Equity Fund | 740,827 | 756,972 | 756,972 | — | — | ||||||||||||||||||
UBS U.S. Small Cap Growth Fund | 4,905,836 | 5,019,751 | 5,019,751 | — | — | ||||||||||||||||||
140
The UBS Funds
Notes to financial statements
The table below represents the disaggregation at June 30, 2017 of the gross amount of recognized liabilities for securities lending transactions. As the securities loaned are subject to termination by the Funds or the borrower at any time, the remaining contractual maturities of the transactions presented below are considered to be overnight and continuous.
Type of securities loaned | Total gross amount of recognized | ||||||||||||||||||
Fund | Equity securities | Investment companies | Corporate notes | liabilities for securities lending transactions | |||||||||||||||
UBS Dynamic Alpha Fund | $ | — | $ | 7,627,500 | $ | 479,175 | $ | 8,106,675 | |||||||||||
UBS Global Allocation Fund | 1,317,687 | 15,571,400 | — | 16,889,087 | |||||||||||||||
UBS International Sustainable Equity Fund | 6,685 | — | — | 6,685 | |||||||||||||||
UBS U.S. Large Cap Equity Fund | 756,972 | — | — | 756,972 | |||||||||||||||
UBS U.S. Small Cap Growth Fund | 4,322,139 | 697,612 | — | 5,019,751 | |||||||||||||||
Bank line of credit
The Funds participate with other funds managed by UBS AM in a $50 million committed credit facility (the "Committed Credit Facility") with JPMorgan Chase Bank. The Committed Credit Facility is to be utilized for temporary financing until the settlement of sales or purchases of portfolio securities, the repurchase or redemption of shares of a participating Fund at the request of shareholders and other temporary or emergency purposes.
Interest on amounts borrowed is calculated based on the prevailing rates in effect at the time of borrowing. Each Fund covered by the Committed Credit Facility has agreed to pay commitment fees on the average daily balance of the Committed Credit Facility not utilized. Commitment fees have been allocated among the Funds in the Committed Credit Facility as follows: 50% of the allocation is based on the relative asset size of Funds and the other 50% of the allocation is based on utilization. For the period ended June 30, 2017, the Funds had no borrowings under the Committed Credit Facility.
Commission recapture program
Certain Funds participate in a brokerage commission recapture program. These Funds have established commission recapture arrangements with certain participating brokers or dealers. If a Fund's investment manager chooses to execute a transaction through a participating broker subject to best price and execution, the broker will rebate a portion of the commission back to the Fund. Any collateral benefit received through participation in the commission recapture program is directed exclusively to the Fund. For the period ended June 30, 2017, the following Funds recorded recaptured commissions which are reflected in the Statement of operations within the net realized gains (losses) on investments in unaffiliated issuers:
Fund | Amount | ||||||
UBS Global Allocation Fund | $ | 1,896 | |||||
UBS U.S. Large Cap Equity Fund | 462 | ||||||
UBS U.S. Small Cap Growth Fund | 22,338 | ||||||
141
The UBS Funds
Notes to financial statements
Purchases and sales of securities
For the period ended June 30, 2017, aggregate purchases and sales of portfolio securities, excluding short-term securities, were as follows:
Fund | Purchases | Sales proceeds | |||||||||
UBS Dynamic Alpha Fund | $ | 53,916,164 | $ | 99,162,057 | |||||||
UBS Global Allocation Fund | 179,629,246 | 249,054,364 | |||||||||
UBS International Sustainable Equity Fund | 17,238,250 | 9,104,939 | |||||||||
UBS U.S. Large Cap Equity Fund | 22,218,497 | 24,192,522 | |||||||||
UBS U.S. Small Cap Growth Fund | 75,771,387 | 165,187,218 | |||||||||
UBS Total Return Bond Fund | 479,839,832 | 557,561,198 | |||||||||
UBS Municipal Bond Fund | 83,791,027 | * | 67,897,168 | * | |||||||
* Effective with the fiscal year ended June 30, 2017, calculation of the purchases and sales proceeds excludes transactions involving variable-rate demand notes, which are considered short-term instruments due to the ability to demand immediate repayment.
Shares of beneficial interest
There is an unlimited number of $0.001 par value shares of beneficial interest authorized. Transactions in shares of beneficial interest for each of the Funds for the period ended June 30, 2017 were as follows:
UBS Dynamic Alpha Fund
Class A | Class C | Class P | |||||||||||||||||||||||||
Shares | Amount | Shares | Amount | Shares | Amount | ||||||||||||||||||||||
Shares sold | 324,115 | $ | 2,048,589 | 22,260 | $ | 131,381 | 616,014 | $ | 3,963,509 | ||||||||||||||||||
Shares repurchased | (4,246,201 | ) | (26,813,692 | ) | (1,863,321 | ) | (10,990,127 | ) | (7,018,203 | ) | (45,473,074 | ) | |||||||||||||||
Dividends reinvested | — | — | — | — | — | — | |||||||||||||||||||||
Net decrease | (3,922,086 | ) | $ | (24,765,103 | ) | (1,841,061 | ) | $ | (10,858,746 | ) | (6,402,189 | ) | $ | (41,509,565 | ) | ||||||||||||
UBS Global Allocation Fund
Class A | Class C | Class P | |||||||||||||||||||||||||
Shares | Amount | Shares | Amount | Shares | Amount | ||||||||||||||||||||||
Shares sold | 809,815 | $ | 8,846,203 | 26,726 | $ | 284,483 | 308,851 | $ | 3,505,109 | ||||||||||||||||||
Shares repurchased | (4,258,751 | ) | (46,378,135 | ) | (2,964,452 | ) | (31,354,216 | ) | (3,285,596 | ) | (37,526,950 | ) | |||||||||||||||
Dividends reinvested | 318,584 | 3,373,805 | 103,791 | 1,073,201 | 165,115 | 1,784,889 | |||||||||||||||||||||
Net decrease | (3,130,352 | ) | $ | (34,158,127 | ) | (2,833,935 | ) | $ | (29,996,532 | ) | (2,811,630 | ) | $ | (32,236,952 | ) | ||||||||||||
UBS International Sustainable Equity Fund
Class A | Class C | Class P | |||||||||||||||||||||||||
Shares | Amount | Shares | Amount | Shares | Amount | ||||||||||||||||||||||
Shares sold | 1,084,582 | $ | 9,431,602 | 12,501 | $ | 107,705 | 446,870 | $ | 3,973,525 | ||||||||||||||||||
Shares repurchased | (92,917 | ) | (825,993 | ) | (96,847 | ) | (811,317 | ) | (427,874 | ) | (3,702,810 | ) | |||||||||||||||
Dividends reinvested | 12,031 | 99,137 | 3,112 | 25,111 | 41,673 | 344,224 | |||||||||||||||||||||
Net increase (decrease) | 1,003,696 | $ | 8,704,746 | (81,234 | ) | $ | (678,501 | ) | 60,669 | $ | 614,939 | ||||||||||||||||
142
The UBS Funds
Notes to financial statements
UBS U.S. Large Cap Equity Fund
Class A | Class C | Class P | |||||||||||||||||||||||||
Shares | Amount | Shares | Amount | Shares | Amount | ||||||||||||||||||||||
Shares sold | 115,398 | $ | 3,309,668 | 3,738 | $ | 99,051 | 16,513 | $ | 494,831 | ||||||||||||||||||
Shares repurchased | (121,919 | ) | (3,371,576 | ) | (23,886 | ) | (655,577 | ) | (80,006 | ) | (2,313,002 | ) | |||||||||||||||
Dividends reinvested | 3,244 | 92,024 | 167 | 4,560 | 6,661 | 189,504 | |||||||||||||||||||||
Net increase (decrease) | (3,277 | ) | $ | 30,116 | (19,981 | ) | $ | (551,966 | ) | (56,832 | ) | $ | (1,628,667 | ) | |||||||||||||
UBS U.S. Small Cap Growth Fund
Class A | Class C | Class P | |||||||||||||||||||||||||
Shares | Amount | Shares | Amount | Shares | Amount | ||||||||||||||||||||||
Shares sold | 332,360 | $ | 6,657,203 | 12,103 | $ | 206,614 | 1,017,424 | $ | 22,030,790 | ||||||||||||||||||
Shares repurchased | (662,420 | ) | (13,149,173 | ) | (79,327 | ) | (1,330,303 | ) | (4,744,999 | ) | (105,130,446 | ) | |||||||||||||||
Dividends reinvested | 42,131 | 843,036 | 7,412 | 125,480 | 196,954 | 4,244,367 | |||||||||||||||||||||
Net decrease | (287,929 | ) | $ | (5,648,934 | ) | (59,812 | ) | $ | (998,209 | ) | (3,530,621 | ) | $ | (78,855,289 | ) | ||||||||||||
UBS Total Return Bond Fund
Class A1 | Class C1 | Class P | |||||||||||||||||||||||||
Shares | Amount | Shares | Amount | Shares | Amount | ||||||||||||||||||||||
Shares sold | 3,089 | $ | 45,442 | 7,648 | $ | 114,229 | 12,187 | $ | 185,609 | ||||||||||||||||||
Shares repurchased | (186 | ) | (2,759 | ) | (4,805 | ) | (70,673 | ) | (5,145,916 | ) | (78,063,500 | ) | |||||||||||||||
Dividends reinvested | 24 | 362 | 59 | 863 | 90,987 | 1,363,425 | |||||||||||||||||||||
Redemption fees | — | — | — | — | — | 38,529 | |||||||||||||||||||||
Net increase (decrease) | 2,927 | $ | 43,045 | 2,902 | $ | 44,419 | (5,042,742 | ) | $ | (76,475,937 | ) | ||||||||||||||||
1 For the period from September 29, 2016 (commencement of operations) through June 30, 2017.
UBS Municipal Bond Fund
Class A | Class C | Class P | |||||||||||||||||||||||||
Shares | Amount | Shares | Amount | Shares | Amount | ||||||||||||||||||||||
Shares sold | 949,490 | $ | 9,859,344 | 141,161 | $ | 1,453,294 | 6,020,944 | $ | 61,444,005 | ||||||||||||||||||
Shares repurchased | (599,513 | ) | (6,045,175 | ) | (164,230 | ) | (1,663,573 | ) | (4,801,298 | ) | (48,657,125 | ) | |||||||||||||||
Dividends reinvested | 24,923 | 253,441 | 5,985 | 60,709 | 149,567 | 1,521,104 | |||||||||||||||||||||
Net increase (decrease) | 374,900 | $ | 4,067,610 | (17,084 | ) | $ | (149,570 | ) | 1,369,213 | $ | 14,307,984 | ||||||||||||||||
143
The UBS Funds
Notes to financial statements
Transactions in shares of beneficial interest for each of the Funds for the period ended June 30, 2016 were as follows:
UBS Dynamic Alpha Fund
Class A | Class C | Class P | |||||||||||||||||||||||||
Shares | Amount | Shares | Amount | Shares | Amount | ||||||||||||||||||||||
Shares sold | 218,328 | $ | 1,421,937 | 103,426 | $ | 617,783 | 4,014,934 | $ | 27,638,083 | ||||||||||||||||||
Shares repurchased | (2,467,134 | ) | (16,053,447 | ) | (2,385,743 | ) | (14,684,601 | ) | (10,309,029 | ) | (68,547,536 | ) | |||||||||||||||
Dividends reinvested | 373,973 | 2,404,649 | 139,684 | 845,085 | 888,345 | 5,809,775 | |||||||||||||||||||||
Net decrease | (1,874,833 | ) | $ | (12,226,861 | ) | (2,142,633 | ) | $ | (13,221,733 | ) | (5,405,750 | ) | $ | (35,099,678 | ) | ||||||||||||
UBS Global Allocation Fund
Class A | Class C | Class P | |||||||||||||||||||||||||
Shares | Amount | Shares | Amount | Shares | Amount | ||||||||||||||||||||||
Shares sold | 254,146 | $ | 2,707,293 | 81,385 | $ | 830,853 | 549,495 | $ | 6,015,844 | ||||||||||||||||||
Shares repurchased | (3,292,895 | ) | (35,058,994 | ) | (2,142,869 | ) | (22,145,568 | ) | (3,083,713 | ) | (33,463,663 | ) | |||||||||||||||
Dividends reinvested | 453,882 | 4,861,081 | 193,128 | 2,016,252 | 242,806 | 2,653,869 | |||||||||||||||||||||
Redemption fees | — | 172 | — | 107 | — | 99 | |||||||||||||||||||||
Net decrease | (2,584,867 | ) | $ | (27,490,448 | ) | (1,868,356 | ) | $ | (19,298,356 | ) | (2,291,412 | ) | $ | (24,793,851 | ) | ||||||||||||
UBS International Sustainable Equity Fund
Class A | Class C | Class P | |||||||||||||||||||||||||
Shares | Amount | Shares | Amount | Shares | Amount | ||||||||||||||||||||||
Shares sold | 178,748 | $ | 1,556,047 | 66,720 | $ | 566,384 | 662,247 | $ | 5,443,083 | ||||||||||||||||||
Shares repurchased | (212,720 | ) | (1,713,569 | ) | (57,757 | ) | (450,574 | ) | (471,757 | ) | (3,931,057 | ) | |||||||||||||||
Dividends reinvested | 7,241 | 61,695 | 1,731 | 14,435 | 23,276 | 198,781 | |||||||||||||||||||||
Net increase (decrease) | (26,731 | ) | $ | (95,827 | ) | 10,694 | $ | 130,245 | 213,766 | $ | 1,710,807 | ||||||||||||||||
UBS U.S. Large Cap Equity Fund
Class A | Class C | Class P | |||||||||||||||||||||||||
Shares | Amount | Shares | Amount | Shares | Amount | ||||||||||||||||||||||
Shares sold | 73,334 | $ | 1,777,229 | 6,633 | $ | 162,598 | 171,857 | $ | 4,441,216 | ||||||||||||||||||
Shares repurchased | (49,958 | ) | (1,264,299 | ) | (20,150 | ) | (497,984 | ) | (621,766 | ) | (15,015,008 | ) | |||||||||||||||
Dividends reinvested | 4,705 | 122,708 | 430 | 10,793 | 16,972 | 443,987 | |||||||||||||||||||||
Redemption fees | — | 60 | — | 14 | — | 114 | |||||||||||||||||||||
Net increase (decrease) | 28,081 | $ | 635,698 | (13,087 | ) | $ | (324,579 | ) | (432,937 | ) | $ | (10,129,691 | ) | ||||||||||||||
UBS U.S. Small Cap Growth Fund
Class A | Class C | Class P | |||||||||||||||||||||||||
Shares | Amount | Shares | Amount | Shares | Amount | ||||||||||||||||||||||
Shares sold | 722,812 | $ | 14,513,102 | 91,782 | $ | 1,545,730 | 3,815,467 | $ | 80,850,923 | ||||||||||||||||||
Shares repurchased | (1,286,169 | ) | (24,263,478 | ) | (89,821 | ) | (1,435,475 | ) | (4,588,148 | ) | (94,964,101 | ) | |||||||||||||||
Dividends reinvested | 159,734 | 3,063,699 | 25,184 | 414,279 | 501,288 | 10,301,465 | |||||||||||||||||||||
Redemption fees | — | 16 | — | 1,555 | — | 46 | |||||||||||||||||||||
Net increase (decrease) | (403,623 | ) | $ | (6,686,661 | ) | 27,145 | $ | 526,089 | (271,393 | ) | $ | (3,811,667 | ) | ||||||||||||||
144
The UBS Funds
Notes to financial statements
UBS Total Return Bond Fund
Class P | |||||||||||
Shares | Amount | ||||||||||
Shares sold | 19,939 | $ | 303,562 | ||||||||
Shares repurchased | (428,779 | ) | (6,441,226 | ) | |||||||
Dividends reinvested | 16,662 | 249,928 | |||||||||
Redemption fees | — | 92,483 | |||||||||
Net decrease | (392,178 | ) | $ | (5,795,253 | ) | ||||||
UBS Municipal Bond Fund
Class A | Class C | Class P | |||||||||||||||||||||||||
Shares | Amount | Shares | Amount | Shares | Amount | ||||||||||||||||||||||
Shares sold | 1,127,581 | $ | 11,536,432 | 362,028 | $ | 3,709,114 | 6,811,943 | $ | 70,035,291 | ||||||||||||||||||
Shares repurchased | (563,957 | ) | (5,741,505 | ) | (77,714 | ) | (804,441 | ) | (3,063,665 | ) | (31,039,965 | ) | |||||||||||||||
Dividends reinvested | 16,474 | 168,229 | 5,066 | 51,751 | 93,107 | 952,822 | |||||||||||||||||||||
Net increase | 580,098 | $ | 5,963,156 | 289,380 | $ | 2,956,424 | 3,841,385 | $ | 39,948,148 | ||||||||||||||||||
Redemption fees
Effective August 3, 2015, the redemption fee of 1.00% imposed by each class of each series of The UBS Funds, with the exception of UBS Total Return Bond Fund, was eliminated. Prior to August 3, 2015 for purchases of shares on or after February 17, 2015, the redemption fee was calculated as a percentage of the amount redeemed within 30 days of purchase, if applicable.
The Board of Trustees approved a temporary redemption fee of 2.00% following the reorganization of Fort Dearborn Income Securities, Inc. with UBS Total Return Bond Fund. The temporary redemption fee was paid to the UBS Total Return Bond Fund and was in effect until August 22, 2016.
The redemption fees retained by the Funds are disclosed in the Statement of changes in net assets. For the period ended June 30, 2017, redemption fee represented less than $0.005 per share.
Federal tax status
It is each Fund's policy to comply with all requirements of the Internal Revenue Code applicable to regulated investment companies and to distribute substantially all of their taxable income to their shareholders. In addition, by distributing during each calendar year substantially all of its net investment income, net realized capital gains and certain other amounts, if any, each Fund intends not to be subject to a federal excise tax. Accordingly, no federal income tax provision was required.
The tax character of distributions paid during the fiscal years ended June 30, 2017 and June 30, 2016 were as follows:
2017 | |||||||||||||||||||||||
| Fund | Distributions paid from tax-exempt income | Distributions paid from ordinary income | Distributions paid from net long-term gains | Return of capital | Total distributions paid | ||||||||||||||||||
UBS Dynamic Alpha Fund | $ | — | $ | — | $ | — | $ | — | $ | — | |||||||||||||
UBS Global Allocation Fund | — | 6,820,295 | — | — | 6,820,295 | ||||||||||||||||||
UBS International Sustainable Equity Fund | — | 504,602 | — | — | 504,602 | ||||||||||||||||||
UBS U.S. Large Cap Equity Fund | — | 299,578 | — | — | 299,578 | ||||||||||||||||||
UBS U.S. Small Cap Growth Fund | — | 212,094 | 5,277,977 | — | 5,490,071 | ||||||||||||||||||
UBS Total Return Bond Fund | — | 1,761,038 | — | 19,947 | 1,780,985 | ||||||||||||||||||
UBS Municipal Bond Fund | 2,000,918 | 83,331 | 214,169 | — | 2,298,418 | ||||||||||||||||||
145
The UBS Funds
Notes to financial statements
2016 | |||||||||||||||||||||||
| Fund | Distributions paid from tax-exempt income | Distributions paid from ordinary income | Distributions paid from net long-term gains | Return of capital | Total distributions paid | ||||||||||||||||||
UBS Dynamic Alpha Fund | $ | — | $ | 9,497,406 | $ | — | $ | 108,348 | $ | 9,605,754 | |||||||||||||
UBS Global Allocation Fund | — | 10,550,576 | — | — | 10,550,576 | ||||||||||||||||||
UBS International Sustainable Equity Fund | — | 304,258 | — | — | 304,258 | ||||||||||||||||||
UBS U.S. Large Cap Equity Fund | — | 598,448 | — | — | 598,448 | ||||||||||||||||||
UBS U.S. Small Cap Growth Fund | — | 5,972,567 | 9,100,165 | — | 15,072,732 | ||||||||||||||||||
UBS Total Return Bond Fund1 | — | 2,868,246 | — | — | 2,868,246 | ||||||||||||||||||
UBS Municipal Bond Fund | 1,363,303 | 15,711 | 29,170 | — | 1,408,184 | ||||||||||||||||||
1 For the period from October 1, 2015 through June 30, 2016.
At June 30, 2017, the components of accumulated earnings (deficit) on a tax basis were as follows:
| Fund | Undistributed ordinary income | Undistributed long-term capital gains | Accumulated capital and other losses | Unrealized appreciation/ (depreciation) | Total | ||||||||||||||||||
UBS Dynamic Alpha Fund | $ | — | $ | — | $ | (280,396,331 | ) | $ | (11,279,295 | ) | $ | (291,675,626 | ) | ||||||||||
UBS Global Allocation Fund | 4,089,278 | — | (863,854,796 | ) | 18,592,480 | $ | (841,173,038 | ) | |||||||||||||||
UBS International Sustainable Equity Fund | 515,496 | — | (8,650,532 | ) | 3,175,371 | $ | (4,959,665 | ) | |||||||||||||||
UBS U.S. Large Cap Equity Fund | 152,997 | — | (79,936,959 | ) | 4,166,653 | $ | (75,617,309 | ) | |||||||||||||||
UBS U.S. Small Cap Growth Fund | 2,899,227 | 15,783,630 | — | 18,781,136 | $ | 37,463,993 | |||||||||||||||||
UBS Total Return Bond Fund | — | — | (3,228,196 | ) | 322,071 | $ | (2,906,125 | ) | |||||||||||||||
UBS Municipal Bond Fund | — | — | (884,268 | ) | 726,852 | $ | (157,416 | ) | |||||||||||||||
The difference between book and tax basis net unrealized appreciation (depreciation) of investments is primarily attributable to mark to market of passive foreign investment companies, non-taxable special dividends, return of capital from investments in real estate investment trusts, tax treatment of certain debt instruments and tax deferral of losses on wash sales.
Under the Regulated Investment Company Modernization Act of 2010 (the "Act"), net capital losses recognized by the Funds after December 22, 2010, may be carried forward indefinitely, and retain their character as short-term and/or long-term losses. These carryforwards are available as a reduction, to the extent provided in regulations, of future realized capital gains. To the extent that such losses are used to offset future net realized capital gains, it is probable these gains will not be distributed. The Act requires that post-enactment net capital losses be used before pre-enactment net capital losses.
At June 30, 2017, the following Funds had post-enactment net capital losses that will be carried forward indefinitely, as follows:
Fund | Short-term losses | Long-term losses | Net capital losses | ||||||||||||
UBS Dynamic Alpha Fund | $ | 15,697,248 | $ | 13,788,961 | $ | 29,486,209 | |||||||||
UBS Global Allocation Fund | 805,783 | — | 805,783 | ||||||||||||
UBS International Sustainable Equity Fund | 186,284 | 279,925 | 466,209 | ||||||||||||
UBS Total Return Bond Fund | 2,029,820 | 989,861 | 3,019,681 | ||||||||||||
146
The UBS Funds
Notes to financial statements
At June 30, 2017, the following Funds had pre-enactment capital loss carryforwards for federal income tax purposes available to offset future capital gains through the indicated expiration dates:
Expiration Dates | |||||||||||
Fund | June 30, 2018 | June 30, 2019 | |||||||||
UBS Dynamic Alpha Fund | $ | 202,927,795 | $ | 46,428,719 | |||||||
UBS Global Allocation Fund | 862,762,158 | — | |||||||||
UBS International Sustainable Equity Fund | 8,184,323 | — | |||||||||
UBS U.S. Large Cap Equity Fund | 79,936,959 | — | |||||||||
During the fiscal year ended June 30, 2017, the following Funds utilized capital loss carryforwards to offset current capital gains:
Fund | Amount | ||||||
UBS Dynamic Alpha Fund | $6,956,125 | ||||||
UBS U.S. Large Cap Equity Fund | 867,344 | ||||||
UBS Total Return Bond Fund | 1,406,187 | ||||||
During the fiscal year, the following Funds had capital loss carryforwards expired un-utilized:
Fund | Amount | ||||||
UBS Dynamic Alpha Fund | $ | 103,495,364 | |||||
UBS Global Allocation Fund | 89,719,530 | ||||||
Qualified late year losses are deemed to arise on the first business day of a Fund's next taxable year. For the year ended June 30, 2017, the following Funds incurred and elected to defer qualified late year losses of the following:
Post October Capital Loss | |||||||||||||||
| Fund | Late year ordinary loss | Short-term losses | Long-term losses | ||||||||||||
UBS Dynamic Alpha Fund | $ | 1,553,608 | $ | — | $ | — | |||||||||
UBS Total Return Bond Fund | 201,661 | — | — | ||||||||||||
UBS Municipal Bond Fund | — | 763,384 | 120,884 | ||||||||||||
At June 30, 2017, the effect of permanent "book/tax" reclassifications resulted in increases and decreases to components of the Funds' net assets as follows:
| Fund | Accumulated undistributed/ (distributions in excess of) net investment income | Accumulated net realized gain/(loss) | Beneficial interest | ||||||||||||
UBS Dynamic Alpha Fund | $ | 6,458,695 | $ | 106,336,092 | $ | (112,794,787 | ) | ||||||||
UBS Global Allocation Fund | 5,760,763 | 85,008,617 | (90,769,380 | ) | |||||||||||
UBS International Sustainable Equity Fund | 2,380 | (2,380 | ) | — | |||||||||||
UBS U.S. Large Cap Equity Fund | (5,809 | ) | 5,809 | — | |||||||||||
UBS U.S. Small Cap Growth Fund | 1,310,510 | (1,310,510 | ) | — | |||||||||||
UBS Total Return Bond Fund | (206,095 | ) | 206,095 | — | |||||||||||
UBS Municipal Bond Fund | 2,557 | 1,556 | (4,113 | ) | |||||||||||
147
The UBS Funds
Notes to financial statements
These differences are primarily due to the tax treatment of foreign currency transactions, paydown gains and losses, tax character distributions, the tax treatment of certain derivatives, non-taxable special dividends, passive foreign investment company gains and losses, net operating losses, expiration of capital loss carryforwards, tax treatments of certain debt instruments and partnership adjustments.
ASC 740-10 "Income Taxes—Overall" sets forth a minimum threshold for financial statement recognition of the benefit of a tax position taken or expected to be taken. The Funds have conducted an analysis and concluded, as of June 30, 2017, that there are no significant uncertain tax positions taken or expected to be taken that would require recognition in the financial statements. It is each Fund's policy to record any significant foreign tax exposures in the financial statements. The Funds recognize interest and penalties, if any, related to uncertain tax positions as income tax expense in the Statement of operations. During the year ended June 30, 2017, the Funds did not incur any interest or penalties.
Under the applicable foreign tax laws, gains on certain securities held in certain foreign countries may be subject to taxes that will be paid by the Funds.
Each of the tax years in the four year fiscal period ended June 30, 2017 or since inception in the case of UBS Municipal Bond Fund, remains subject to examination by the Internal Revenue Service and state taxing authorities.
Subsequent events
In June 2017, the Board of Trustees of The UBS Funds approved a name change and investment policy modifications for the UBS U.S. Large Cap Equity Fund (the "Fund") that will go into effect on or about October 27, 2017. The Fund's name will change to the UBS U.S. Sustainable Equity Fund. The Fund will modify part of its investment strategy, such that under normal circumstances the Fund will invest at least 80% of its net assets (plus borrowings for investment purposes, if any) in equity securities of US companies (previously, equity securities of US large capitalization companies). Additionally, the Fund's benchmark will change from the Russell 1000 Index to the S&P 500 Index.
148
The UBS Funds
Report of independent registered public accounting firm
The Board of Trustees and Shareholders of The UBS Funds
We have audited the accompanying statements of assets and liabilities, including the portfolios of investments, of UBS Dynamic Alpha Fund, UBS Global Allocation Fund, UBS International Sustainable Equity Fund, UBS U.S. Large Cap Equity Fund, UBS U.S. Small Cap Growth Fund, UBS Total Return Bond Fund and UBS Municipal Bond Fund (seven of the series comprising The UBS Funds) (collectively the "Funds") as of June 30, 2017, and the related statements of operations for the year then ended, the statements of changes in net assets and the financial highlights for each of the periods indicated therein. These financial statements and financial highlights are the responsibility of the Funds' management. Our responsibility is to express an opinion on these financial statements and financial highlights based on our audits.
We conducted our audits in accordance with the standards of the Public Company Accounting Oversight Board (United States). Those standards require that we plan and perform the audit to obtain reasonable assurance about whether the financial statements and financial highlights are free of material misstatement. We were not engaged to perform an audit of the Funds' internal control over financial reporting. Our audits included consideration of internal control over financial reporting as a basis for designing audit procedures that are appropriate in the circumstances, but not for the purpose of expressing an opinion on the effectiveness of the Funds' internal control over financial reporting. Accordingly, we express no such opinion. An audit also includes examining, on a test basis, evidence supporting the amounts and disclosures in the financial statements and financial highlights, assessing the accounting principles used and significant estimates made by management, and evaluating the overall financial statement presentation. Our procedures included confirmation of securities owned as of June 30, 2017, by correspondence with the custodian and others or by other appropriate auditing procedures where replies from others were not received. We believe that our audits provide a reasonable basis for our opinion.
In our opinion, the financial statements and financial highlights referred to above present fairly, in all material respects, the financial position of UBS Dynamic Alpha Fund, UBS Global Allocation Fund, UBS International Sustainable Equity Fund, UBS U.S. Large Cap Equity Fund, UBS U.S. Small Cap Growth Fund, UBS Total Return Bond Fund and UBS Municipal Bond Fund at June 30, 2017, the results of their operations for the year then ended, the changes in their net assets and the financial highlights for each of the periods indicated therein, in conformity with U.S. generally accepted accounting principles.

New York, New York
August 29, 2017
149
The UBS Funds
Federal tax information (unaudited)
We are required by Subchapter M of the Internal Revenue Code of 1986, as amended, to advise you in writing as to the federal tax status of distributions received by shareholders during the fiscal year. Accordingly, the percentage of ordinary dividends paid that qualify for the dividends received deduction for corporate shareholders and the amount of foreign tax credit to be passed through to shareholders are as follows:
| Fund | Dividends received deduction | Foreign tax credit | |||||||||
UBS Global Allocation Fund | 14.52 | % | $ | — | |||||||
UBS International Sustainable Equity Fund | — | 71,574 | |||||||||
UBS U.S. Small Cap Growth Fund | 100.00 | — | |||||||||
UBS U.S. Large Cap Equity Fund | 100.00 | — | |||||||||
UBS Total Return Bond Fund | 0.31 | — | |||||||||
UBS Municipal Bond Fund | — | — | |||||||||
Also, for the fiscal year ended June 30, 2017, the foreign source income for information reporting purposes for UBS International Sustainable Equity Fund was $781,782.
For the taxable year ended June 30, 2017, the Funds designate the amounts below as the maximum amount that may be considered qualified dividend income for individual shareholders.
| Fund | Maximum amount considered qualified dividend income | ||||||
UBS Global Allocation Fund | $ | 3,108,539 | |||||
UBS International Sustainable Equity Fund | 576,176 | ||||||
UBS U.S. Large Cap Equity Fund | 299,578 | ||||||
UBS U.S. Small Cap Growth Fund | 212,094 | ||||||
UBS Total Return Bond Fund | 5,450 | ||||||
Shareholders should not use the above information to prepare their tax returns. Since the Funds' fiscal year end is not the calendar year end, another notification will be sent with respect to calendar year 2017. Such notification, which will reflect the amount to be used by calendar year taxpayers on their federal income tax returns, will be made in conjunction with Form 1099 DIV and will be mailed in February 2018. Shareholders are advised to consult their own tax advisers with respect to the tax consequences of their investment in each of the Funds.
150
The UBS Funds
General information (unaudited)
Quarterly Form N-Q portfolio schedule
Each Fund will file its complete schedule of portfolio holdings with the Securities and Exchange Commission ("SEC") for the first and third quarters of each fiscal year on Form N-Q. The Funds' Forms N-Q are available on the SEC's Web site at http://www.sec.gov. The Funds' Forms N-Q may be reviewed and copied at the SEC's Public Reference Room in Washington, D.C. Information on the operation of the SEC's Public Reference Room may be obtained by calling 1-202-551 8090. Additionally, you may obtain copies of Forms N-Q from the Funds upon request by calling 1-800-647 1568.
Proxy voting policies, procedures and record
You may obtain a description of the Funds' proxy voting policies and procedures without charge, upon request by contacting the Funds directly at 1-800-647 1568, or on the EDGAR Database on the SEC's Web site (http://www.sec.gov). You may obtain information regarding how the Funds voted any proxies related to portfolio securities during the most recent 12-month period ended June 30, for which an SEC filing has been made, without charge, upon request by contacting the Funds directly at 1-800-647 1568 or on the EDGAR Database on the SEC's Web site (http://www.sec.gov).
151
The UBS Funds
Board approval of investment advisory agreements (unaudited)
At the meeting of the Board of Trustees (the "Board") of The UBS Funds (the "Trust"), held on June 15 and 16, 2017 (the "Meeting"), the Board, including those Trustees who are not "interested persons" (as defined in the 1940 Act) of the Trust or UBS Asset Management (Americas) Inc. (the "Advisor") and its affiliates (together, the "Independent Trustees"), considered the continuation of the investment advisory agreements (the "Advisory Agreements") between the Trust and the Advisor for the UBS Dynamic Alpha Fund, UBS Global Allocation Fund, UBS International Sustainable Equity Fund, UBS U.S. Large Cap Equity Fund, UBS U.S. Small Cap Growth Fund, UBS Total Return Bond Fund and UBS Municipal Bond Fund (each a "Fund," and together, the "Funds"). Prior to the Meeting, the Independent Trustees' counsel had sent to the Advisor a request detailing the information that the Independent Trustees wished to receive in connection with their consideration of the continuation of the Advisory Agreements. The Independent Trustees met with their independent counsel, as well as an independent consultant engaged by the Board to assist in the annual Advisory Agreement review process, on June 9, 2017, June 15, 2017 and June 16, 2017, to discuss the materials provided to them in response to the information request, including materials prepared by the Advisor, as well as reports prepared by Broadridge Financial Solutions, Inc. ("Broadridge Reports"), an independent statistical compilation company, providing comparative expense information on an actual and contractual basis and comparative performance information for the Funds. The Board also made reference to information and material that had been provided to the Independent Trustees throughout the year at quarterly Board meetings.
At the Meeting, the Board considered a number of factors in connection with its deliberations concerning the continuation of the Advisory Agreement for each Fund, including: (i) the nature, extent, and quality of the services provided by the Advisor to the Fund; (ii) the performance of the Fund and the Advisor; (iii) the Fund's expenses, costs of the services to be provided and profits to be realized by the Advisor and its affiliates from the relationship with the Fund; and (iv) whether economies of scale are realized by the Advisor with respect to the Fund, as it grows larger, and the extent to which the economies of scale are reflected in the level of the management fees charged.
Nature, Extent, and Quality of Services.
In considering the nature, extent, and quality of the services provided by the Advisor to a Fund, the Board reviewed the material presented by the Advisor describing the various services provided to each Fund. The Board noted that in addition to investment management services, the Advisor provides each Fund with operational, legal, and compliance support. The Board also considered the scope and depth of the Advisor's organization and the experience and expertise of the professionals currently providing investment management and other services to the Funds. The Board considered that the Advisor was a well-established investment management organization employing investment personnel with significant experience in the investment management industry. The Board also considered the Advisor's in-house research capabilities, as well as other research services available to it, including research services available to the Advisor as a result of securities transactions effected for the Funds and the Advisor's other investment management clients, and noted that the Advisor had extensive global research capabilities. The Board also evaluated the Advisor's portfolio management process for each Fund, including the use of risk management techniques and the proprietary technologies utilized to structure the Fund's portfolio. The Board noted that various presentations had been made by investment personnel at Board meetings throughout the year concerning the Funds' investment performance and investment strategies, including the derivative strategies utilized by certain Funds.
The Board also noted and discussed the services that the Advisor and its affiliates provide to the Funds under other agreements with the Trust, including administration services provided by the Advisor, underwriting services provided by UBS Asset Management (US) Inc. ("UBS AM (US)"), and sub-transfer agency services provided by UBS Financial Services Inc. ("UBS Financial Services"). In connection with the non-investment management services, the Board also considered the quarterly reports that the Advisor provides to the Board throughout the year pertaining to brokerage commissions, soft dollars, portfolio valuations, and Rule 12b-1 fees, among others. In addition, the Board considered the presentations provided with respect to distribution strategies for the Funds. After analyzing the serv-
152
The UBS Funds
Board approval of investment advisory agreements (unaudited) (continued)
ices provided by the Advisor to each Fund, both quantitatively and qualitatively, including the impact of these services on investment performance, the Board concluded that the nature, extent, and quality of services provided to each Fund were consistent with the operational requirements of each Fund, and met the needs of the Fund's shareholders.
Performance.
In evaluating the performance of each Fund, the Board analyzed the Broadridge Reports, which compared the performance of each Fund with other funds in its respective peer universe over various time periods. The Board also reviewed the memoranda provided by the Advisor providing an analysis of the markets and the Funds' performance during the past year. In reviewing the Broadridge Reports, the Board noted that the UBS U.S. Large Cap Equity Fund and UBS U.S. Small Cap Growth Fund each had appeared in the top performance quintile for the one-year performance period. The Board also noted that the UBS Municipal Bond Fund and UBS Total Return Bond Fund each had appeared in the second performance quintile of its respective performance universe for the one-year performance period, while the UBS International Sustainable Equity Fund appeared in the third performance quintile of its performance universe for the one-year period. At the Board's request, the Advisor further addressed the performance data for the UBS Dynamic Alpha Fund and UBS Global Allocation Fund, each of which had appeared in fourth performance quintile for the one-year period.
In discussing the performance of the UBS Dynamic Alpha Fund for the one-year performance period, the Advisor explained that some of the Fund's duration positons in U.S. and Australian government bonds and several emerging market currency positions detracted from the Fund's performance. The Advisor also stated that several of the Fund's relative value trades were out of favor in the beginning part of the year but moved closer to expectations more recently. The Advisor noted that for the most recent three-months ended May 31, 2017, the UBS Dynamic Alpha Fund was outperforming the average of its performance peer universe. The Advisor then discussed planned enhancements to the investment process for the UBS Dynamic Alpha Fund that should help to address the performance issues of the Fund.
In explaining the performance of the UBS Global Allocation Fund, the Advisor discussed the factors that had affected the performance of the Fund over the past year. The Advisor noted that both market allocation and security selection detracted from the Fund's performance over the past year. The Advisor explained that the Fund's equity positions had the most negative effect on the Fund's returns. The Advisor then noted that the Fund's most recent performance had rebounded, noting that for the one-year period ending May 31, 2017, the UBS Global Allocation Fund was outperforming the average of its performance peer universe.
The Board concluded that the Advisor's explanations provided a sound basis for understanding the performance of each Fund that underperformed in comparison to its peer universe. The Board determined, after analyzing the performance data, that the performance of each Fund was acceptable as compared with relevant performance standards, given the investment strategies and risk profile of each Fund, the expectations of the shareholder base and the current market environment.
Fund Fees and Expenses.
When considering the fees and expenses borne by each Fund, and the reasonableness of the management fees paid to the Advisor in light of the services provided to each Fund, the Board compared the fees charged by the Advisor to each Fund to fees charged to the funds in its peer group for comparable services, as provided in the Broadridge Reports, on both an actual (taking into account expense limitation arrangements) and a contractual basis (assuming all funds in the peer expense group were similar in size to the respective Fund).
153
The UBS Funds
Board approval of investment advisory agreements (unaudited) (continued)
In examining the Broadridge Reports, and in reviewing comparative costs, it was noted that each Fund had a contractual fee rate higher than the Broadridge median in its respective Broadridge expense group. The Advisor noted, however, that while each Fund's contractual fee rate was higher than its respective peer expense group median, the UBS U.S. Large Cap Equity Fund, UBS Total Return Bond Fund and UBS Municipal Bond Fund, each had a contractual fee rate within three basis points of its Broadridge median. The Advisor also noted that the results of such expense comparisons showed that the actual management fee rate for each Fund, except the UBS Global Allocation Fund and UBS Dynamic Alpha Fund, was lower than the Broadridge median in its respective Broadridge expense group, and each appeared in the top quintile of its expense group. In addition, the Board reviewed the actual total expenses of each Fund and noted that each Fund had total expenses that were comparable to, or lower than, the Broadridge median in its respective Broadridge expense group, except for the UBS Dynamic Alpha Fund and UBS Global Allocation Fund. After reviewing the fee and expense information, the Board asked the Advisor to further discuss the fees and expenses of the UBS Dynamic Alpha Fund and UBS Global Allocation Fund, which both had contractual fee rates, actual fee rates and total expenses that were higher than each of their respective Broadridge expense group medians.
The Advisor and the Board first discussed the management fee and expenses of the UBS Dynamic Alpha Fund. It was noted that in recent years while the contractual management fee and actual management fee were each higher than the medians in its Broadridge expense group, the UBS Dynamic Alpha Fund's total expenses were in-line with its peers, resulting in the total costs to investors being very competitive. It was noted that in this year's comparison, the Fund's total expenses were higher than the expense group median. At the request of the Board, the Advisor explained the reasons for the less favorable comparative total expenses, noting the small size of the Fund and changes in the composition of the expense group. The Advisor discussed with the Board those funds within the expense group that it considered to be the UBS Dynamic Alpha Fund's key competitors. The Advisor noted that among these key competitors, UBS Dynamic Fund's total expenses were very competitive. The Advisor and the Board agreed to continue to monitor the Fund's peers and expenses.
The Advisor and the Board next discussed the management fee and expenses of the UBS Global Allocation Fund. It was noted that the Board approved a new fee waiver and expense cap arrangement for the Fund that was effective October 28, 2016. The Advisor explained that the Broadridge report did not entirely reflect the effect of the new expense cap, and if the expense cap had been fully reflected in the expense comparison, the total expenses of the UBS Global Allocation Fund would have been below its Broadridge expense group median.
The Board also received and considered information about the fee rates charged to other funds and accounts that are managed by the Advisor. After discussing the information about the other funds and accounts with the Advisor, the Board determined that the fees charged by the Advisor to the Funds were within a reasonable range, giving effect to differences in services performed for such other funds and accounts as compared to such fee rates. The Board, after reviewing all pertinent material, concluded that the management fee payable under each Fund's Advisory Agreement was fair and reasonable, both on an absolute basis and in comparison with the fees of other funds identified in its peer group.
Costs and Profitability.
The Board considered the costs of providing services to the Funds and the profitability of the Funds to the Advisor and its affiliates by reviewing the profitability analysis provided by the Advisor, including information about its fee revenues and expenses. The Board reviewed the profitability of each Fund to the Advisor and its affiliates, and the compensation that was received for providing services to each Fund. The profitability analysis, which provided information for the last three calendar years, included schedules relating to the revenue and expenses attributable to: (i) the investment advisory and administration services provided by the Advisor; (ii) the distribution and shareholder services provided by UBS AM (US) and UBS Financial Services; (iii) the transfer agency-related services provided by
154
The UBS Funds
Board approval of investment advisory agreements (unaudited) (concluded)
UBS Financial Services; and (iv) all services provided by the Advisor, UBS AM (US), and UBS Financial Services shown on a consolidated basis. In discussing the profitability analysis with the Board, the Advisor, as requested by the Board, provided the Board with a presentation on the methodology utilized in the profitability analysis. The Board noted that the methodology used for the profitability analysis provided to the Board for purposes of its annual review of the Advisory Agreements was reasonable. The Advisor also explained to the Board the reasons for an increase or decrease in profitability of each Fund from last calendar year to this calendar year.
The Board also considered "fallout" or ancillary benefits to the Advisor or its affiliates as the result of their relationship with the Funds; for example, the ability to attract other clients due to the Advisor's role as investment advisor to the Funds and the research services available to the Advisor through soft dollar brokerage commissions. The Independent Trustees also considered the ancillary benefits received by the Advisor's affiliates, UBS Securities LLC and UBS Group AG, in the form of commissions for executing securities transactions for the Funds. Upon closely examining the information provided concerning the Advisor's profitability, the Board concluded that the level of profits realized by the Advisor and its affiliates with respect to each Fund, if any, was reasonable in relation to the nature and quality of the services that were provided.
Economies of Scale.
The Board also discussed whether economies of scale are realized by the Advisor with respect to each Fund as it grows larger, and the extent to which this is reflected in the level of management fees charged. The Board noted that with respect most Funds, any actual or potential economies of scale are, or will be, shared with the Fund and its shareholders through existing management fee breakpoints so that as the Fund grows in size, its effective management fee declines. The Board noted that each Fund, except the UBS Total Return Bond Fund and UBS Municipal Bond Fund, had a breakpoint schedule that provided for continuing breakpoints past the current asset level for the Fund. Based on each Fund's fees and expenses and the Advisor's profitability analysis, the Board concluded that any actual or potential economies of scale would be reasonably shared with a Fund and its shareholders.
After full consideration of the factors discussed above, with no single factor identified as being of paramount importance, the Board, including a majority of the Independent Trustees, with the assistance of independent counsel, concluded that the continuation of the Advisory Agreement for each Fund was in the best interests of the Fund and its shareholders.
155
The UBS Funds
Trustee and officer information (unaudited)
The Trust is a Delaware statutory trust. Under Delaware law, the Board has overall responsibility for managing the business and affairs of the Trust, including general supervision and review of its investment activities. The Trustees elect the Officers of the Trust, who are responsible for administering the day-to-day operations of the Trust and the Funds.
The table shows, for each Trustee and Officer, his or her name, address and age, the position held with the Trust, the length of time served as a Trustee or Officer of the Trust, the Trustee's or Officer's principal occupations during the last five years, the number of funds in the UBS Family of Funds overseen by the Trustee or Officer and other directorships held by such Trustee.
The Trust's Statement of Additional Information contains additional information about the Trustees and is available, without charge, upon request, by calling 1-800-647 1568.
Non-interested Trustees
| Name, address and age | Position(s) held with Trust | Term of office1 and length of time served | Principal occupation(s) during past 5 years | Number of portfolios in fund complex overseen by Trustee | Other directorships held by Trustee | ||||||||||||||||||
| Adela Cepeda; 59 PFM Financial Advisors LLC 222 N. LaSalle Street Suite 910 Chicago, IL 60601 | Trustee | Since 2004 | Ms. Cepeda is managing director at PFM Financial Advisors LLC since 2016. From 1995 to 2016, Ms. Cepeda was founder and president of A.C. Advisory, Inc. | Ms. Cepeda is a trustee of three investment companies (consisting of 22 portfolios) for which UBS AM serves as investment advisor or manager. | Ms. Cepeda is a director (since 2012) of BMO Financial Corp. (U.S. holding company for BMO Harris Bank N.A.), director of the Mercer Funds (9 portfolios) (since 2005), trustee of the Morgan Stanley Smith Barney Consulting Group Capital Markets Funds (11 portfolios) (since 2008). Ms. Cepeda was a director of Amalgamated Bank of Chicago (from 2003 to 2012) and a director of the Municipal Securities Rulemaking Board (from 2010 to 2012). | ||||||||||||||||||
| John J. Murphy; 73 268 Main Street P.O. Box 718 Gladstone, NJ 07934 | Trustee | Since 2009 | Mr. Murphy is the president of Murphy Capital Management (investment advisor) (since 1983) | Mr. Murphy is a trustee of three investment companies (consisting of 22 portfolios) for which UBS AM serves as investment advisor or manager. | Mr. Murphy is a director (since 2007) of the Legg Mason Equity Funds (54 portfolios) and a trustee of Morgan Stanley Smith Barney Consulting Group Capital Markets Funds (11 portfolios). | ||||||||||||||||||
156
The UBS Funds
Trustee and officer information (unaudited)
Non-interested Trustees (continued)
| Name, address and age | Position(s) held with Trust | Term of office1 and length of time served | Principal occupation(s) during past 5 years | Number of portfolios in fund complex overseen by Trustee | Other directorships held by Trustee | ||||||||||||||||||
| Abbie J. Smith; 64 University of Chicago Booth School of Business 5807 S. Woodlawn Avenue Chicago, IL 60637 | Trustee | Since 2009 | Ms. Smith is the Boris and Irene Stern Distinguished Service Professor of Accounting in the University of Chicago Booth School of Business (since 1980). Formerly, Ms. Smith was a co-founding partner and Director of Research of Fundamental Investment Advisors, a hedge fund (co-founded in 2004, commenced operations in 2008) (from 2008 to 2010). | Ms. Smith is a trustee of three investment companies (consisting of 22 portfolios) for which UBS AM serves as investment advisor or manager. | Ms. Smith is a director (since 2000) of HNI Corporation (formerly known as HON Industries Inc.) (office furniture) and a director and member (since 2003) and chair (until October 2015) of the audit committee of Ryder System Inc. (transportation, logistics and supply-chain management). In addition, Ms. Smith is a trustee/director (since 2000) and a member of the audit committee of the Dimensional Funds complex (123 portfolios). | ||||||||||||||||||
| Frank K. Reilly; 81 Mendoza College of Business University of Notre Dame Notre Dame, IN 46556-5646 | Chairman and Trustee | Since 1992 | Mr. Reilly is the Bernard J. Hank Professor Emeritus of Finance in the Mendoza College of Business at the University of Notre Dame (since 1982), and is a Chartered Financial Analyst (CFA). | Mr. Reilly is a trustee of three investment companies (consisting of 22 portfolios) for which UBS AM serves as investment advisor or manager. | Mr. Reilly is a director (since 1994) of Discover Bank and Bank of New Castle, both banks are subsidaries of Discover Financial Services, and Mr. Reilly is Chairman of the Audit Committee for both banks. | ||||||||||||||||||
157
The UBS Funds
Trustee and officer information (unaudited)
Non-interested Trustees (continued)
| Name, address and age | Position(s) held with Trust | Term of office1 and length of time served | Principal occupation(s) during past 5 years | Number of portfolios in fund complex overseen by Trustee | Other directorships held by Trustee | ||||||||||||||||||
| J. Mikesell Thomas; 66 c/o UBS AM One North Wacker Drive Chicago, IL 60606 | Trustee | Since 2004 | Mr. Thomas is a principal with the investment firm Castle Creek Capital (since 2008) and President and sole shareholder of Mikesell Advisory Corp. (since 2009). He is the former President and CEO of Federal Home Loan Bank of Chicago (from 2004 to 2008) and of First Chicago Bancorp (from 2008 to 2011). | Mr. Thomas is a trustee of three investment companies (consisting of 22 portfolios) for which UBS AM serves as investment advisor or manager. | Mr. Thomas is a director (since 1992) and chairman of the Audit Committee for NorthShore University HealthSystem, a not-for-profit healthcare organization, and a director and member, (since January 2016) of the Audit Committee of four indirect subsidiaries of Tokio Marine Holdings, Inc., a publicly traded insurance company headquartered in Tokyo, Japan: HCC Life Insurance Co., U.S. Specialty Insurance Co., Houston Casualty Co., and Producers Agriculture Insurance Co. Mr. Thomas was previously a director (2012-October 2015), a member of the Audit Committee (2012-October 2015) and Chairman of the Investment and Finance Committees (2014-October 2015) of HCC Insurance Holdings Inc.; and a director of First Chicago Bancorp (from 2008 to 2010) and First Chicago Bank & Trust (from 2008 to 2010). | ||||||||||||||||||
158
The UBS Funds
Trustee and officer information (unaudited)
Officers
| Name, address and age | Position(s) held with Trust | Term of office1 and length of time served | Principal occupation(s) during past 5 years; number of portfolios in fund complex for which person serves as officer | ||||||||||||
| Joseph J. Allessie*; 52 | Chief Compliance Officer | Since 2014 | Mr. Allessie is a managing director (since 2015) (prior to which he was an executive director (from 2007 to 2015)) at UBS AM and UBS Asset Management (US) Inc. (collectively, "UBS AM—Americas region"). Mr. Allessie is head of compliance and operational risk control for the UBS Asset Management Division in the Americas with oversight for traditional and alternative investment businesses in Canada, the US and Cayman Islands. Prior to that he served as deputy general counsel of UBS AM—Americas region (from 2005 to 2014). Mr. Allessie is the chief compliance officer (prior to which he was interim chief compliance officer (from January to July 2014)) and had served as a vice president and assistant secretary (from 2005 to 2016) of 13 investment companies (consisting of 72 portfolios) for which UBS AM serves as investment advisor or manager. | ||||||||||||
| Rose Ann Bubloski*; 49 | Vice President and Assistant Treasurer | Since 2011 | Ms. Bubloski is a director (since 2012) (prior to which she was an associate director (from 2008 to 2012)) and senior manager of registered fund product control of UBS AM—Americas region. She is vice president and assistant treasurer of 13 investment companies (consisting of 72 portfolios) for which UBS AM serves as investment advisor or manager. | ||||||||||||
| Mark E. Carver*; 53 | President | Since 2010 | Mr. Carver is a managing director and head of product development and management for UBS AM—Americas region (since 2008). In this role, he oversees product development and management for both wholesale and institutional businesses. He is a member of the Americas Management Committee (since 2008) and the Regional Operating Committee (since 2008). Mr. Carver is president of 13 investment companies (consisting of 72 portfolios) for which UBS AM serves as investment advisor or manager. | ||||||||||||
| Thomas Disbrow*; 51 | Vice President, Treasurer and Principal Accounting Officer | Since 2004 and 2006, respectively | Mr. Disbrow is a managing director (since 2011), (prior to which he was an executive director (from 2007 to 2011)) and since January 2016 is global head of registered fund product control (prior to which he was head of the North American fund treasury administration department of UBS AM—Americas region (from 2011-2015)). Mr. Disbrow is a vice president and treasurer and/or principal accounting officer of 13 investment companies (consisting of 72 portfolios) for which UBS AM serves as investment advisor or manager. | ||||||||||||
| Mark F. Kemper**; 59 | Vice President and Secretary | Since 1999 | Mr. Kemper is a managing director and general counsel of UBS AM—Americas region (since 2006 and 2004 respectively). He has been secretary of UBS AM—Americas region (since 2004) and assistant secretary of UBS Asset Management Trust Company (since 1993). Mr. Kemper is vice president and secretary of 13 investment companies (consisting of 72 portfolios) for which UBS AM serves as investment advisor or manager. Mr. Kemper is employed by UBS Business Solutions US LLC (since January 2017). | ||||||||||||
| Joanne M. Kilkeary*; 49 | Vice President and Assistant Treasurer | Since 2006 | Ms. Kilkeary is an executive director (since 2013) (prior to which she was a director (from 2008 to 2013)) and a senior manager (since 2004) of registered fund product control of UBS AM—Americas region. Ms. Kilkeary is a vice president and assistant treasurer of 13 investment companies (consisting of 72 portfolios) for which UBS AM serves as investment advisor or manager. | ||||||||||||
159
The UBS Funds
Trustee and officer information (unaudited)
Officers (concluded)
| Name, address and age | Position(s) held with Trust | Term of office1 and length of time served | Principal occupation(s) during past 5 years; number of portfolios in fund complex for which person serves as officer | ||||||||||||
| Tammie Lee*; 46 | Vice President and Assistant Secretary | Since 2005 | Ms. Lee is an executive director with UBS Solutions US LLC (since January 2017) and also with UBS AM—Americas region (since 2010) (prior to which she was a director (from 2005 to 2010)) and associate general counsel of UBS AM—Americas region (since 2005). Ms. Lee is a vice president and assistant secretary of 13 investment companies (consisting of 72 portfolios) for which UBS AM serves as investment advisor or manager. | ||||||||||||
William T. MacGregor*; 42 | Vice President and Assistant Secretary | Since 2015 | Mr. MacGregor is an executive director and deputy general counsel with UBS Solutions US LLC (since January 2017) and also with UBS AM—Americas region (since 2015). From June 2012 through July 2015, Mr. MacGregor was Senior Vice President, Secretary and Associate General Counsel of AXA Equitable Funds Management Group, LLC and from May 2008 through July 2015, Mr. MacGregor was Lead Director and Associate General Counsel of AXA Equitable Life Insurance Company. Mr. MacGregor is a vice president and assistant secretary of 13 investment companies (consisting of 72 portfolios) for which UBS AM serves as investment advisor or manager. | ||||||||||||
| Nancy D. Osborn*; 51 | Vice President and Assistant Treasurer | Since 2007 | Mrs. Osborn is a director (since 2010) (prior to which she was an associate director) and a senior manager of registered fund product control department of UBS AM—Americas region (since 2006). Mrs. Osborn is a vice president and assistant treasurer of 13 investment companies (consisting of 72 portfolios) for which UBS AM serves as investment advisor or manager. | ||||||||||||
| Eric Sanders*; 51 | Vice President and Assistant Secretary | Since 2005 | Mr. Sanders is a director and associate general counsel with UBS Solutions US LLC (since January 2017) and also with UBS AM—Americas region (since 2005). Mr. Sanders is a vice president and assistant secretary of 13 investment companies (consisting of 72 portfolios) for which UBS AM serves as investment advisor or manager. | ||||||||||||
| Keith A. Weller*; 56 | Vice President and Assistant Secretary | Since 2004 | Mr. Weller is an executive director and senior associate general counsel with UBS Solutions US LLC (since January 2017) and also with UBS AM—Americas region (since 2005) and has been an attorney with affiliated entities since 1995. Mr. Weller is a vice president and assistant secretary of 13 investment companies (consisting of 72 portfolios) for which UBS AM serves as investment advisor or manager. | ||||||||||||
| Mandy Yu*; 33 | Vice President | Since 2013 | Ms. Yu is an associate director (since 2015) (prior to which she was an authorized officer (from 2012 to 2015)) and tax compliance manager (since 2013) of registered fund product control of UBS AM—Americas region. She was a fund treasury manager (from 2012 to 2013) and a mutual fund administrator (from 2007 to 2012) for UBS AM—Americas region. Ms. Yu is a vice president of 13 investment companies (consisting of 72 portfolios) for which UBS AM serves as investment advisor or manager. | ||||||||||||
* This person's business address is 1285 Avenue of the Americas, New York, NY 10019-6028
** This person's business address is One North Wacker Drive, Chicago, IL 60606.
1 Each Trustee holds office for an indefinite term. Officers of the Trust are appointed by the Trustees and serve at the pleasure of the Board.
160
The UBS Funds
Funds' privacy notice
This notice describes the privacy policy of the UBS Family of Funds, the PACE Funds and all closed-end funds man-aged by UBS AM (collectively, the "Funds"). The Funds are committed to protecting the personal information that they collect about individuals who are prospective, current or former investors.
The Funds collect personal information in order to process requests and transactions and to provide customer serv-ice. Personal information, which is obtained from applications and other forms or correspondence submitted to the Funds, may include name(s), address, e-mail address, telephone number, date of birth, social security number or other tax identification number, bank account information, information about your transactions and experiences with the Funds, and any affiliation a client has with UBS Financial Services Inc. or its affiliates ("Personal Information").
The Funds limit access to Personal Information to those individuals who need to know that information in order to process transactions and service accounts. These individuals are required to maintain and protect the confidentiality of Personal Information and to follow established procedures. The Funds maintain physical, electronic and proce-dural safeguards to protect Personal Information and to comply with applicable laws and regulations. The Funds may share Personal Information with their affiliates to facilitate the servicing of accounts and for other business purposes, or as otherwise required or permitted by applicable law. The Funds may also share Personal Information with non-affiliated third parties that perform services for the Funds, such as vendors that provide data or transaction processing, computer software maintenance and development, and other administrative services. When the Funds share Personal Information with a non-affiliated third party, they will do so pursuant to a contract that includes provisions designed to ensure that the third party will uphold and maintain privacy standards when handling Personal Information. In addition to sharing information with non-affiliated third parties to facilitate the servicing of accounts and for other business purposes, the Funds may disclose Personal Information to non-affiliated third parties as otherwise required or permitted by applicable law. For example, the Funds may disclose Personal Information to credit bureaus or regulatory authorities to facilitate or comply with investigations; to protect against or prevent actual or potential fraud, unauthorized transactions, claims or other liabilities; or to respond to judicial or legal process, such as subpoena requests.
Except as described in this privacy notice, the Funds will not use Personal Information for any other purpose unless the Funds describe how such Personal Information will be used and clients are given an opportunity to decline ap-proval of such use of Personal Information relating to them (or affirmatively approve the use of Personal Information, if required by applicable law). The Funds endeavor to keep their customer files complete and accurate. The Funds should be notified if any Personal Information needs to be corrected or updated. Please call 1-800-647 1568 with any questions or concerns regarding your Personal Information or this privacy notice.
Privacy Notice
This privacy notice is not a part of the shareholder report.
This page intentionally left blank.
PRESORTED
STANDARD
U.S. POSTAGE
PAID
COMPUTERSHARE

UBS Asset Management (Americas) Inc.
1285 Avenue of the Americas
New York, NY 10019
S1197
Item 2. Code of Ethics.
The registrant has adopted a code of ethics that applies to its principal executive officer, principal financial officer, principal accounting officer or controller, or persons performing similar functions pursuant to Section 406 of the Sarbanes-Oxley Act of 2002. (The registrant has designated the code of ethics adopted pursuant to Sarbanes-Oxley as a “Code of Conduct” to lessen the risk of confusion with its separate code of ethics adopted pursuant to Rule 17j-1 under the Investment Company Act of 1940, as amended.)
Item 3. Audit Committee Financial Expert.
The registrant’s Board has determined that the following person serving on the registrant’s Audit Committee is an “audit committee financial expert” as defined in item 3 of Form N-CSR: J. Mikesell Thomas. Mr. Thomas is independent as defined in item 3 of Form N-CSR.
Item 4. Principal Accountant Fees and Services.
(a) Audit Fees:
For the fiscal years ended June 30, 2017 and June 30, 2016, the aggregate Ernst & Young LLP (E&Y) audit fees for professional services rendered to the registrant were approximately $396,536 and $451,884, respectively.
Fees included in the audit fees category are those associated with the annual audits of financial statements and services that are normally provided in connection with statutory and regulatory filings.
(b) Audit-Related Fees:
In each of the fiscal years ended June 30, 2017 and June 30, 2016, the aggregate audit-related fees billed by E&Y for services rendered to the registrant that are reasonably related to the performance of the audits of the financial statements, but not reported as audit fees, were approximately $35,696 and $54,750, respectively.
Fees included in the audit-related category are those associated with (1) the reading and providing of comments on the 2016 and 2015 semiannual financial statements and (2) agreed upon procedures performed in connection with the review of Form N-1A.
There were no audit-related fees required to be approved pursuant to paragraph (c)(7)(ii) of Rule 2-01 of Regulation S-X during the fiscal years indicated above.
(c) Tax Fees:
In each of the fiscal years ended June 30, 2017 and June 30, 2016, the aggregate tax fees billed by E&Y for professional services rendered to the registrant were approximately $84,451 and $79,415, respectively.
Fees included in the tax fees category comprise all services performed by professional staff in the independent accountant’s tax division except those services related to the audits. This category comprises fees for review of tax returns.
There were no tax fees required to be approved pursuant to paragraph (c)(7)(ii) of Rule 2-01 of Regulation S-X during the fiscal years indicated above.
(d) All Other Fees:
In each of the fiscal years ended June 30, 2017 and June 30, 2016, there were no fees billed by E&Y for products and services, other than the services reported in Item 4(a)-(c) above, rendered to the registrant.
Fees included in the all other fees category would consist of services related to internal control reviews, strategy and other consulting, financial information systems design and implementation, consulting on other information systems, and other tax services unrelated to the registrant.
There were no “all other fees” required to be approved pursuant to paragraph (c)(7)(ii) of Rule 2-01 of Regulation S-X during the fiscal years indicated above.
(e) (1) Audit Committee Pre-Approval Policies and Procedures:
The Audit Committee Charter contains the Audit Committee’s pre-approval policies and procedures. Reproduced below is an excerpt from the Audit Committee Charter regarding pre-approval policies and procedures:
To carry out its purposes, the Audit Committee shall have the following duties and powers:
(a) To pre-approve the engagement of, and to recommend to the Board the engagement, retention or termination of, the independent auditors to provide audit, review or attest services to the UBS Funds, and, in connection therewith, to review and evaluate the capabilities and independence of the auditors, and receive the auditors’ specific representations as to their independence. In evaluating the auditor’s qualifications performance and independence, the Committee must, among other things, obtain and review a report by the auditors, at least annually, describing the following items: (i) all relationships between the, independent auditors and the UBS Funds, as well as with the UBS Funds, investment advisor or any control affiliate of the investment advisor that provides ongoing services to the UBS Funds; (ii) any material issues raised by the most recent internal quality control review, or peer review, of the audit firm, or by any inquiry or investigation by governmental or professional authorities, within the preceding five years, with respect to one or more independent audits carried out by the firm, and any steps taken to deal with any such issues; and (iii) the audit firm’s internal quality control procedures.
(b) To pre-approve all non-audit services to be provided to the UBS Funds by the independent auditors when, without such pre-approval, the auditors would not be independent of the UBS Funds under applicable federal securities laws, rules or auditing standards.
(c) To pre-approve all non-audit services to be provided by the UBS Funds’ independent auditors to the UBS Funds’ investment advisor or to any entity, that controls, is controlled by or is under common control with the UBS Funds investment advisor (“advisor affiliate”) and that provides ongoing services to the UBS Funds when, without such pre-approval by the Committee, the auditors would not be independent of the UBS Funds under applicable federal securities laws, rules or auditing standards.
(d) To establish, if deemed necessary or appropriate as an alternative to Committee pre-approval of services to be provided by the independent auditors as required by paragraphs (b)
and (c) above, policies and procedures to permit such services to be pre-approved by other means, such as by action of a designated member or members of the Committee, subject to subsequent Committee review or oversight.
(e) To consider whether the non-audit services provided by the UBS Funds’ independent auditor to the UBS Funds investment advisor or any advisor affiliate that provides on-going services to the UBS Funds, which services were not pre-approved by the Committee, are compatible with maintaining the auditors’ independence.
Pursuant to Section (d), the Committee has delegated its responsibility to pre-approve the audit and permissible non-audit services required by paragraphs (a), (b) and (c) of Section 4, not exceeding $100,000 (excluding reasonable out-of-pocket expenses) on an annual basis to the Chairperson. All such pre-approvals will be subject to subsequent Committee review or oversight, including being reported to the full Committee on a quarterly basis at the Committee’s next regularly scheduled meeting after pre-approval. The Committee may not delegate to management its responsibility to pre-approve services to be performed by the independent auditor. Requests or applications to provide services that require specific pre-approval by the Committee or the Chairperson will be submitted by both the Fund’s independent auditors and the Fund’s Treasurer or other designated Fund officer and must include a joint statement as to whether, in their view, the request or application is consistent with U.S. Securities and Exchange Commission rules on auditor independence.
(e) (2) Services approved pursuant to paragraph (c)(7)(i)(C) of Rule 2-01 of Regulation S-X:
Audit-Related Fees:
There were no amounts that were approved by the audit committee pursuant to the de minimis exception for the fiscal years ended June 30, 2017 and June 30, 2016 on behalf of the registrant.
There were no amounts that were required to be approved by the audit committee pursuant to the de minimis exception for the fiscal years ended June 30, 2017 and June 30, 2016 on behalf of the registrant’s service providers that relate directly to the operations and financial reporting of the registrant.
Tax Fees:
There were no amounts that were approved by the audit committee pursuant to the de minimis exception for the fiscal years ended June 30, 2017 and June 30, 2016 on behalf of the registrant.
There were no amounts that were required to be approved by the audit committee pursuant to the de minimis exception for the fiscal years ended June 30, 2017 and June 30, 2016 on behalf of the registrant’s service providers that relate directly to the operations and financial reporting of the registrant.
All Other Fees:
There were no amounts that were approved by the audit committee pursuant to the de minimis exception for the fiscal years ended June 30, 2017 and June 30, 2016 on behalf of the registrant.
There were no amounts that were required to be approved by the audit committee pursuant to the de minimis exception for the fiscal years ended June 30, 2017 and June 30, 2016 on behalf of the registrant’s service providers that relate directly to the operations and financial reporting of the registrant.
(f) For the fiscal year ended June 30, 2017, if greater than 50%, specify the percentage of hours spent on the audit of the registrant’s financial statements for the most recent fiscal year that were attributed to work performed by persons who are not full-time, permanent employees of E&Y. According to E&Y, such amount was below 50%; therefore disclosure item not applicable to this filing.
(g) For the fiscal years ended June 30, 2017 and June 30, 2016, the aggregate fees billed by E&Y of $180,147 and $501,212, respectively, for non-audit services rendered on behalf of the registrant (“covered”), its investment adviser (not including any sub-adviser whose role is primarily portfolio management and is subcontracted with or overseen by another investment adviser) and any entity controlling, controlled by, or under common control with the adviser (“non-covered”) that provides ongoing services to the registrant for each of the last two fiscal years of the registrant is shown in the table below:
|
| 2017 |
| 2016 |
| ||
Covered Services |
| $ | 120,147 |
| $ | 134,165 |
|
Non-Covered Services |
| $ | 60,000 |
| $ | 367,047 |
|
(h) The registrant’s audit committee has considered whether the provision of non-audit services that were rendered to the registrant’s investment adviser (not including any sub-adviser whose role is primarily portfolio management and is subcontracted with or overseen by another investment adviser), and any entity controlling, controlled by, or under common control with the investment adviser that provides ongoing services to the registrant that were not pre-approved pursuant to paragraph (c)(7)(ii) of Rule 2-01 of Regulation S-X is compatible with maintaining the principal accountant’s independence.
Item 5. Audit Committee of Listed Registrants.
Not applicable to the registrant.
Item 6. Schedule of Investments.
(a) Included as part of the report to shareholders filed under Item 1 of this form.
(b) Not applicable.
Item 7. Disclosure of Proxy Voting Policies and Procedures for Closed-End Management Investment Companies.
Not applicable to the registrant.
Item 8. Portfolio Managers of Closed-End Management Investment Companies.
Not applicable to the registrant.
Item 9. Purchases of Equity Securities by Closed-End Management Investment Company and Affiliated Purchasers.
Not applicable to the registrant.
Item 10. Submission of Matters to a Vote of Security Holders.
The Nominating Committee will consider nominees recommended by Qualifying Fund Shareholders if an Independent Trustee vacancy on the Board occurs. A Qualifying Fund Shareholder is a shareholder that: (i) owns of record, or beneficially through a financial intermediary, 1/2 of 1% or more of the Trust’s outstanding shares and (ii) has been a shareholder of at least 1/2 of 1% of the Trust’s total outstanding shares for 12 months or more prior to submitting the recommendation to the Nominating Committee. In order to recommend a nominee, a Qualifying Fund Shareholder should send a letter to the chairperson of the Nominating Committee, Ms. Adela Cepeda, care of Mark Kemper, the Secretary of the UBS Funds at UBS Asset Management, One North Wacker Drive, Chicago, Illinois 60606, and indicate on the envelope “Nominating Committee.” The Qualifying Fund Shareholder’s letter should include: (i) the name and address of the Qualifying Fund Shareholder making the recommendation; (ii) the number of shares of each class and series of shares of the Trust which are owned of record and beneficially by such Qualifying Fund Shareholder and the length of time that such shares have been so owned by the Qualifying Fund Shareholder; (iii) a description of all arrangements and understandings between such Qualifying Fund Shareholder and any other person or persons (naming such person or persons) pursuant to which the recommendation is being made; (iv) the name and address of the nominee; and (v) the nominee’s resume or curriculum vitae. The Qualifying Fund Shareholder’s letter must be accompanied by a written consent of the individual to stand for election if nominated for the Board and to serve if elected by shareholders.
Item 11. Controls and Procedures.
(a) The registrant’s principal executive officer and principal financial officer have concluded that the registrant’s disclosure controls and procedures (as defined in Rule 30a-3(c) under the Investment Company Act of 1940, as amended) are effective based on their evaluation of these controls and procedures as of a date within 90 days of the filing date of this document.
(b) The registrant’s principal executive officer and principal financial officer are aware of no changes in the registrant’s internal control over financial reporting that occurred during the registrant’s most recent fiscal half-year that has materially affected, or is reasonably likely to materially affect, the registrant’s internal control over financial reporting.
Item 12. Exhibits.
(a) (1) Code of Ethics as required pursuant to Section 406 of the Sarbanes-Oxley Act of 2002 (and designated by registrant as a “Code of Conduct”) is filed herewith.
(a) (2) Certifications of principal executive officer and principal financial officer pursuant to Section 302 of the Sarbanes-Oxley Act of 2002 is attached hereto as Exhibit EX-99.CERT.
(a) (3) Written solicitation to purchase securities under Rule 23c-1 under the Investment Company Act of 1940 sent or given during the period covered by the report by or on behalf of the registrant to 10 or more persons — not applicable to the registrant.
(b) Certifications of principal executive officer and principal financial officer pursuant to Section 906 of the Sarbanes-Oxley Act of 2002 is attached hereto as Exhibit EX-99.906.CERT.
(c) Iran related activities disclosure pursuant to Section 13(r) of the Securities Exchange Act of 1934 is filed herewith.
SIGNATURES
Pursuant to the requirements of the Securities Exchange Act of 1934 and the Investment Company Act of 1940, the registrant has duly caused this report to be signed on its behalf by the undersigned, thereunto duly authorized.
The UBS Funds |
| |
|
|
|
By: | /s/ Mark E. Carver |
|
| Mark E. Carver |
|
| President |
|
|
|
|
Date: | September 8, 2017 |
|
Pursuant to the requirements of the Securities Exchange Act of 1934 and the Investment Company Act of 1940, this report has been signed below by the following persons on behalf of the registrant and in the capacities and on the dates indicated.
|
|
|
By: | /s/ Mark E. Carver |
|
| Mark E. Carver |
|
| President |
|
|
|
|
Date: | September 8, 2017 |
|
|
|
|
By: | /s/ Thomas Disbrow |
|
| Thomas Disbrow |
|
| Vice President, Treasurer and Principal Accounting Officer |
|
|
|
|
Date: | September 8, 2017 |
|