
Second Quarter 2012 Business Review
Jonathan W. Painter, President & CEO
Thomas M. O’Brien, Executive Vice President & CFO

*
KAI 2Q12 Business Review-July 31, 2012
© 2012 Kadant Inc. All rights reserved.
Forward-Looking Statements
The following constitutes a “Safe Harbor” statement under the Private Securities Litigation Reform Act of
1995: This presentation contains forward-looking statements that involve a number of risks and
uncertainties, including forward-looking statements about our expected future financial and operating
performance, demand for our products, and economic and industry outlook. Our actual results may differ
materially from these forward-looking statements as a result of various important factors, including those
set forth under the heading “Risk Factors” in Kadant’s quarterly report on Form 10-Q for the quarter ended
March 31, 2012. These include risks and uncertainties relating to our dependence on the pulp and paper
industry; significance of sales and operation of manufacturing facilities in China; our ability to adjust
operating costs and manufacturing sufficiently in China to meet demand; commodity and component price
increases or shortages; international sales and operations; competition; soundness of suppliers and
customers; our effective tax rate; future restructurings; soundness of financial institutions; our debt
obligations; restrictions in our credit agreement; litigation costs related to our discontinued operation; our
acquisition strategy; protection of patents and proprietary rights; failure of our information systems or
breaches of data security; fluctuations in our share price; and anti-takeover provisions. We undertake no
obligation to publicly update any forward-looking statement, whether as a result of new information,
future events, or otherwise.
2

*
KAI 2Q12 Business Review-July 31, 2012
© 2012 Kadant Inc. All rights reserved.
Use of Non-GAAP Financial Measures
In addition to the financial measures prepared in accordance with generally accepted
accounting principles (GAAP), we use certain non-GAAP financial measures, including increases
or decreases in revenues excluding the effect of foreign currency translation, earnings before
interest, taxes, depreciation, and amortization (EBITDA), and adjusted EBITDA.
accounting principles (GAAP), we use certain non-GAAP financial measures, including increases
or decreases in revenues excluding the effect of foreign currency translation, earnings before
interest, taxes, depreciation, and amortization (EBITDA), and adjusted EBITDA.
A reconciliation of those numbers to the most directly comparable U.S. GAAP financial measures
is shown in our 2012 second quarter earnings press release issued July 30, 2012, which is
available in the Investors section of our website at www.kadant.com under the heading Investor
News.
is shown in our 2012 second quarter earnings press release issued July 30, 2012, which is
available in the Investors section of our website at www.kadant.com under the heading Investor
News.
3

*
KAI 2Q12 Business Review-July 31, 2012
© 2012 Kadant Inc. All rights reserved.
BUSINESS REVIEW
Jonathan W. Painter
President & CEO
4
*
KAI 2Q12 Business Review-July 31, 2012
© 2012 Kadant Inc. All rights reserved.
Q2 2012 Financial Highlights
Q2 2012 | Q2 2011 | |
Revenue | $83.0 million | $82.5 million |
Gross Margin | 43.7% | 45.7% |
Operating Income1 | $9.4 million | $10.5 million |
Net Income1 | $6.5 million | $7.3 million |
Diluted EPS1 | $0.56 | $0.59 |
EBITDA2 | $11.4 million | $12.5 million |
EBITDA2/Sales | 13.8% | 15.1% |
Cash Flow1 | $8.6 million | $6.8 million |
Net Cash (cash less debt) | $30.1 million | $28.6 million |
1 Operating Income, Net Income, Cash Flow, and Diluted EPS are from continuing operations.
2 EBITDA (earnings before interest, taxes, depreciation, and amortization) is a non-GAAP financial measure as detailed in our Q2 2012 earnings
press release issued July 30, 2012.
press release issued July 30, 2012.
5
*
KAI 2Q12 Business Review-July 31, 2012
© 2012 Kadant Inc. All rights reserved.
Revenue By Product Line: Q2 2012
$83.0 million, up 0.6% compared to Q2 2011
$83.0 million, up 0.6% compared to Q2 2011
($ Millions) | Q2 2012 | Q2 2011 | % CHANGE | EXCL. FX |
Stock-Preparation | $28.7 | $32.3 | -11.3% | -8.7% |
Fluid-Handling | 23.7 | 24.5 | -3.0% | 2.4% |
Doctoring | 14.0 | 13.7 | 2.1% | 6.6% |
Water-Management | 13.1 | 8.5 | 53.2% | 60.8% |
Fiber-based Products | 3.0 | 2.9 | 6.5% | 6.5% |
Other | 0.5 | 0.6 | -17.1% | -4.3% |
TOTAL | $83.0 | $82.5 | 0.6% | 4.9% |
Percent change calculated using actual numbers reported in our Q2 2012 earnings release dated July 30, 2012.
6

*
KAI 2Q12 Business Review-July 31, 2012
© 2012 Kadant Inc. All rights reserved.
Bookings By Product Line: Q2 2012
$77.4 million, down 11.4% compared to Q2 2011
$77.4 million, down 11.4% compared to Q2 2011
($ Millions) | Q2 2012 | Q2 2011 | % CHANGE | EXCL. FX |
Stock-Preparation | $28.0 | $30.8 | -9.1% | -5.3% |
Fluid-Handling | 24.2 | 28.4 | -15.1% | -10.2% |
Doctoring | 14.8 | 14.5 | 2.3% | 6.8% |
Water-Management | 7.3 | 11.1 | -34.0% | -31.8% |
Fiber-based Products | 2.6 | 1.8 | 47.3% | 47.3% |
Other | 0.5 | 0.7 | -29.2% | -18.5% |
TOTAL | $77.4 | $87.3 | -11.4% | -7.3% |
Percent change calculated using actual numbers reported in our Q2 2012 earnings release dated July 30, 2012.
7
*
KAI 2Q12 Business Review-July 31, 2012
© 2012 Kadant Inc. All rights reserved.
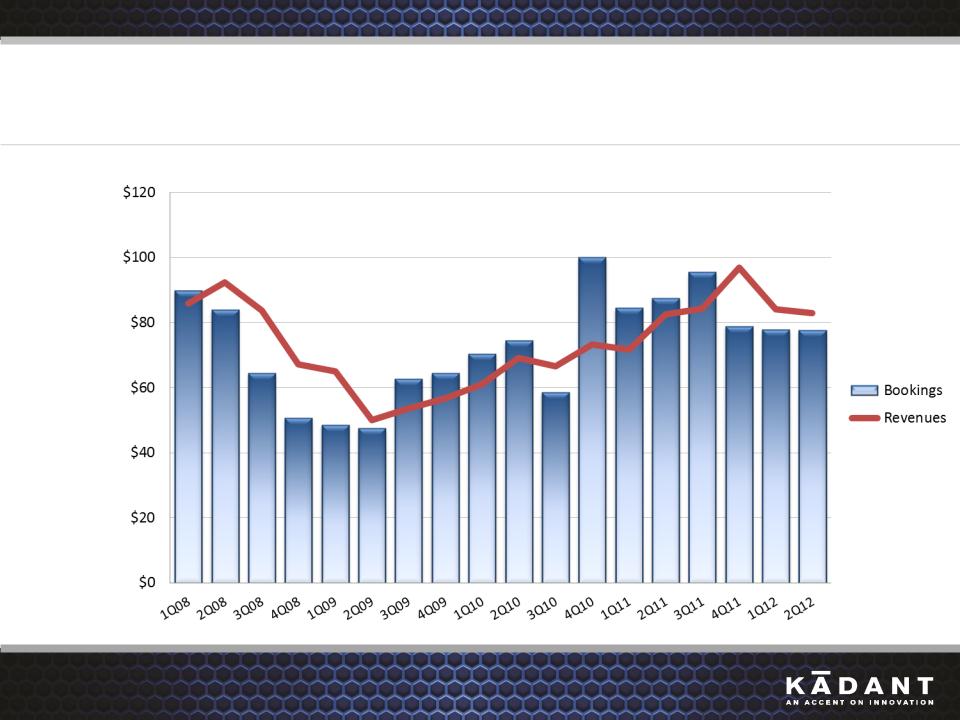
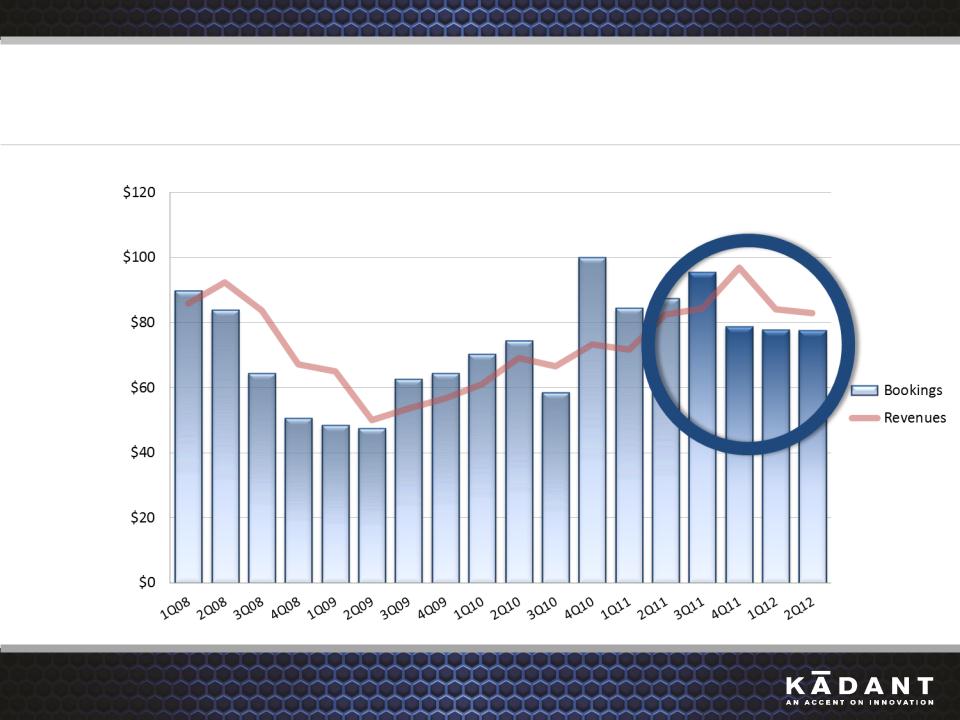
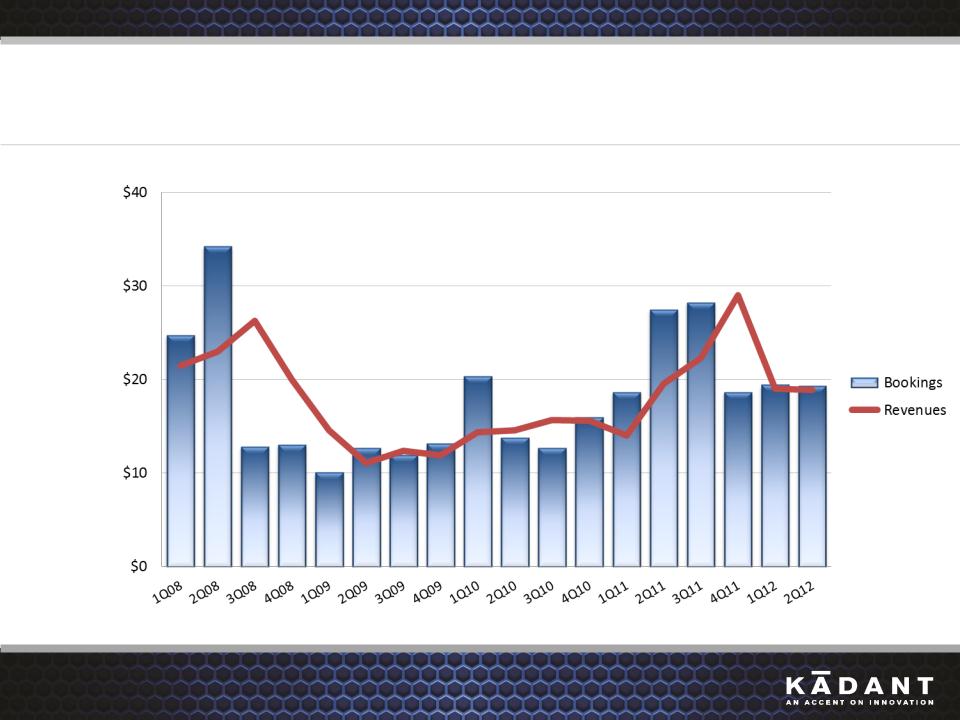
Bookings and Revenues
US$ (millions)
8
*
KAI 2Q12 Business Review-July 31, 2012
© 2012 Kadant Inc. All rights reserved.
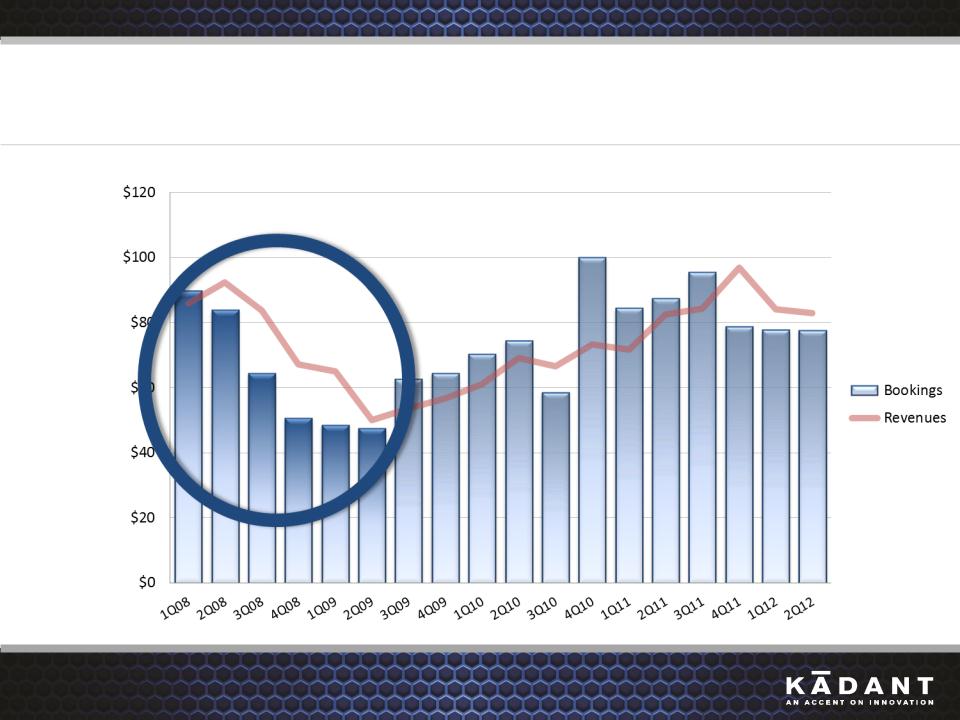
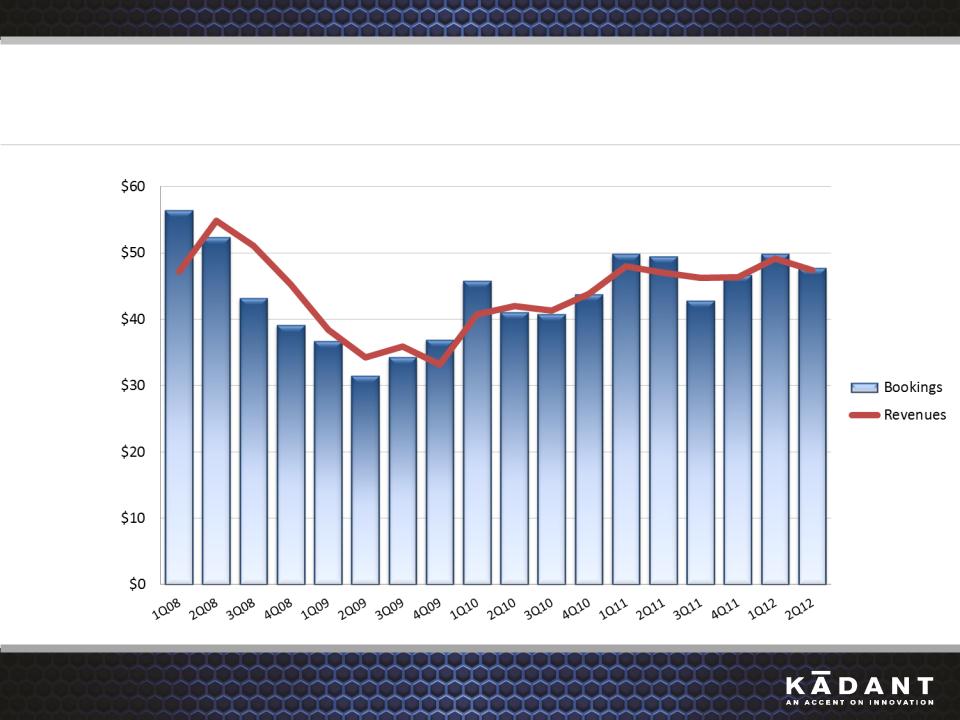
Bookings and Revenues
US$ (millions)
9
*
KAI 2Q12 Business Review-July 31, 2012
© 2012 Kadant Inc. All rights reserved.
Bookings and Revenues
US$ (millions)
10
*
KAI 2Q12 Business Review-July 31, 2012
© 2012 Kadant Inc. All rights reserved.
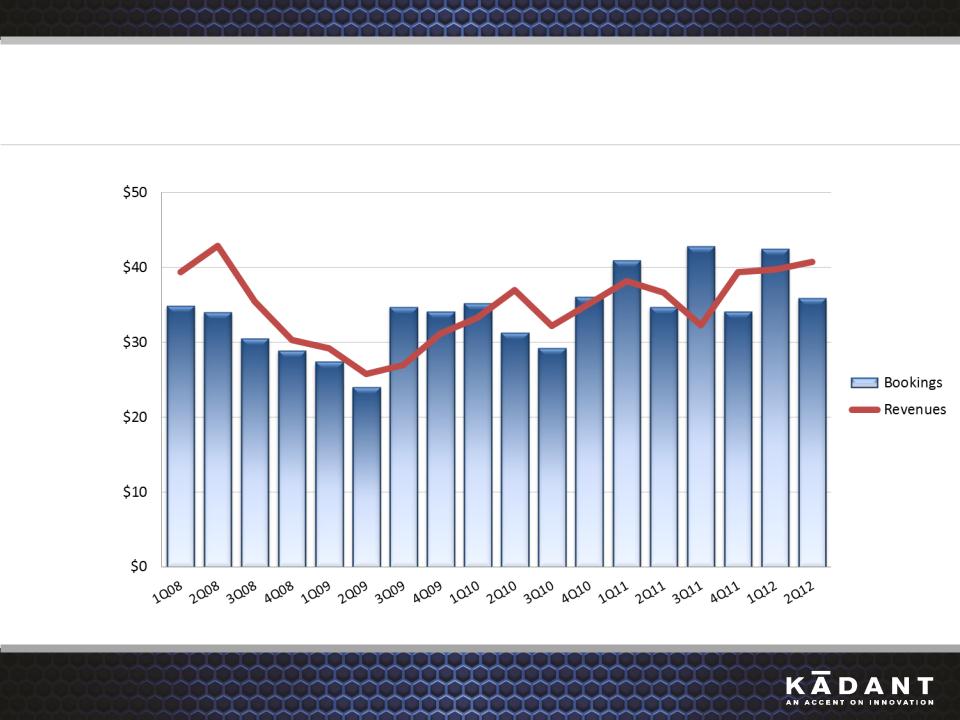
Parts and Consumables Bookings and Revenues
US$ (millions)
11
*
KAI 2Q12 Business Review-July 31, 2012
© 2012 Kadant Inc. All rights reserved.
REGIONAL PERFORMANCE
12
*
KAI 2Q12 Business Review-July 31, 2012
© 2012 Kadant Inc. All rights reserved.
North America Bookings and Revenues
US$ (millions)
13
*
KAI 2Q12 Business Review-July 31, 2012
© 2012 Kadant Inc. All rights reserved.
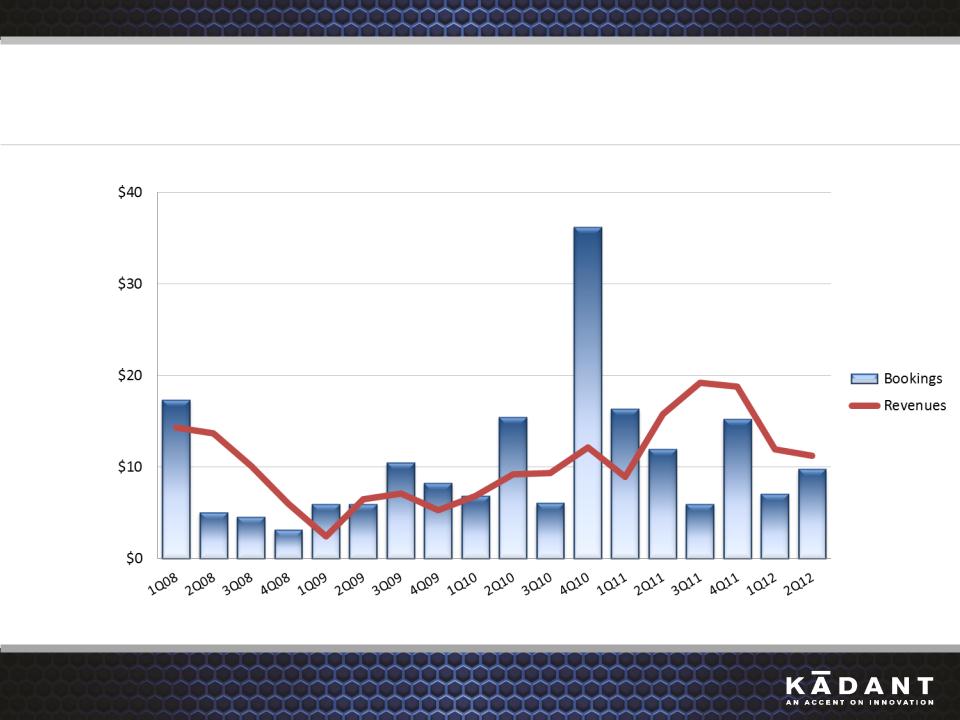
Europe Bookings and Revenues
US$ (millions)
14
*
KAI 2Q12 Business Review-July 31, 2012
© 2012 Kadant Inc. All rights reserved.
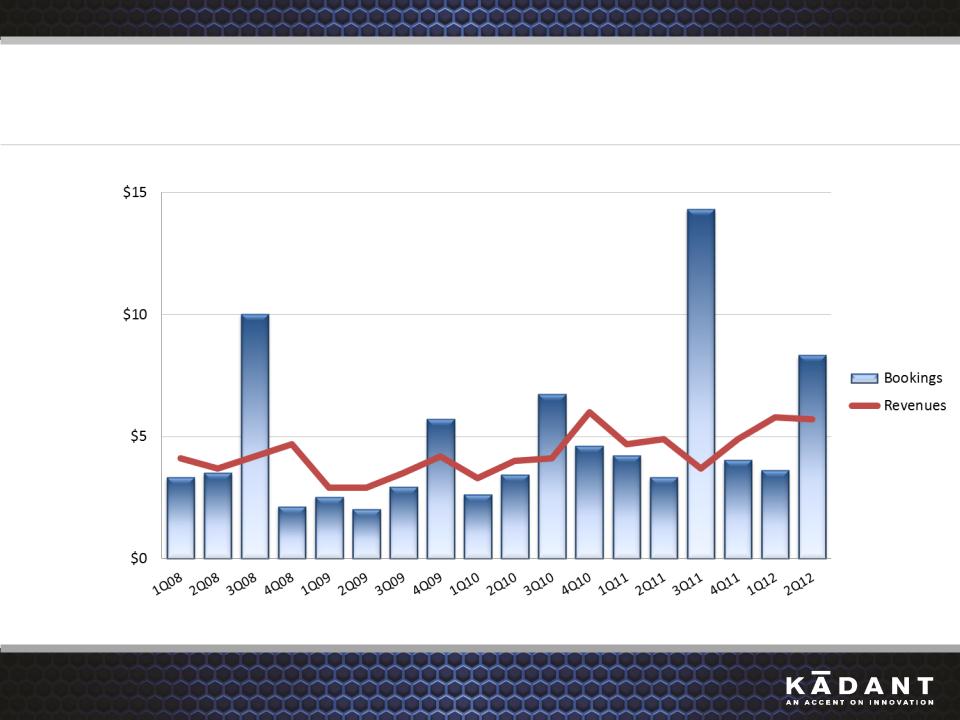
China Bookings and Revenues
US$ (millions)
15
*
KAI 2Q12 Business Review-July 31, 2012
© 2012 Kadant Inc. All rights reserved.
South America Bookings and Revenues
US$ (millions)
16
*
KAI 2Q12 Business Review-July 31, 2012
© 2012 Kadant Inc. All rights reserved.
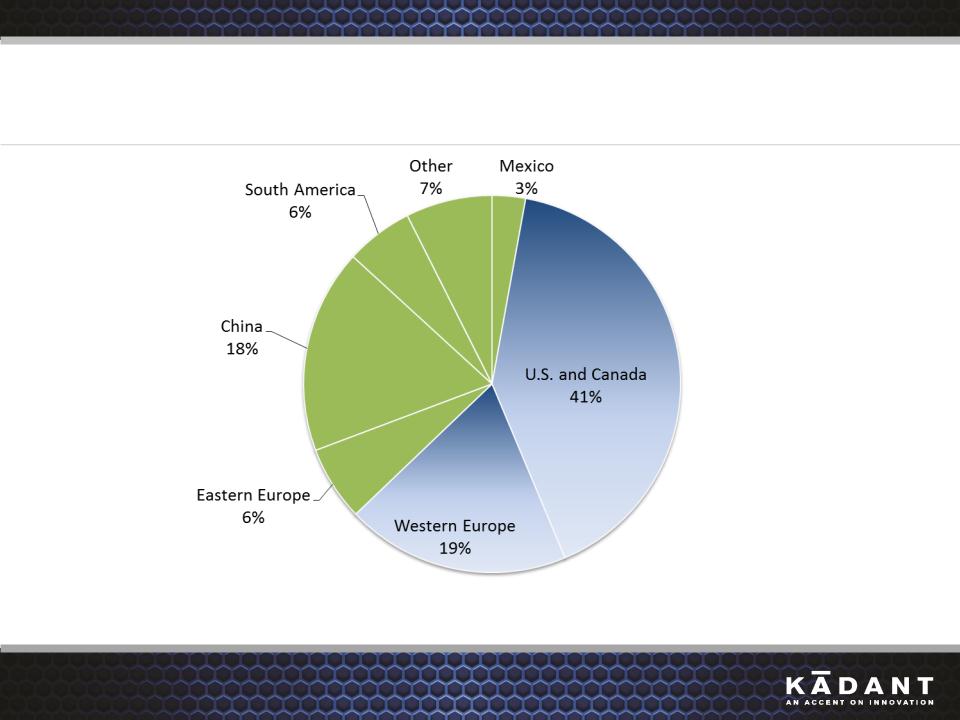
Revenues from Emerging and Developed Economies
Geographic data is attributed to countries based on customer location. Revenues are for the trailing 12 months ending June 30, 2012.
● Emerging Regions (40%) ● Developed Regions (60%)
17

*
KAI 2Q12 Business Review-July 31, 2012
© 2012 Kadant Inc. All rights reserved.
Guidance for Continuing Operations
• FY 2012 GAAP diluted EPS of $2.05 to $2.10
• FY 2012 revenues of $325 to $330 million
• Q3 2012 GAAP diluted EPS of $0.49 to $0.51
• Q3 2012 revenues of $80 to $82 million
18

*
KAI 2Q12 Business Review-July 31, 2012
© 2012 Kadant Inc. All rights reserved.
FINANCIAL REVIEW
Thomas M. O’Brien
Executive Vice President & Chief Financial Officer
19
*
KAI 2Q12 Business Review-July 31, 2012
© 2012 Kadant Inc. All rights reserved.
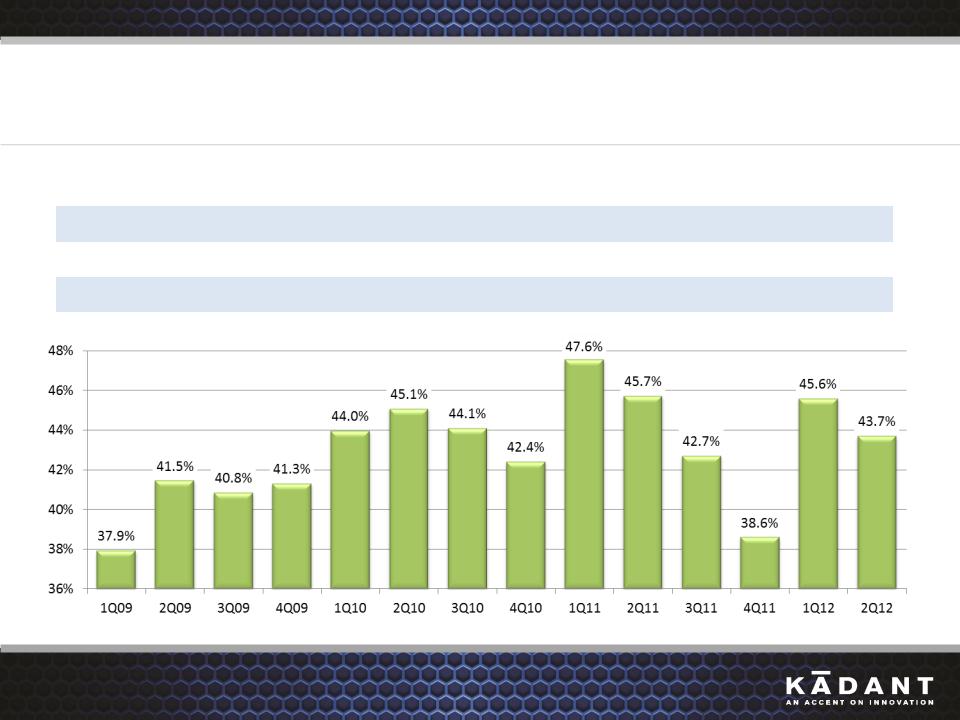
Gross Margins
2Q12 | 1Q12 | 2Q11 | Sequential ∆ | Y-O-Y ∆ | |
Papermaking Systems Segment | 43.4% | 45.1% | 45.3% | -1.7% | -1.9% |
Fiber-based Products | 52.8% | 56.3% | 56.6% | -3.5% | -3.8% |
TOTAL | 43.7% | 45.6% | 45.7% | -1.9% | -2.0% |
20
*
KAI 2Q12 Business Review-July 31, 2012
© 2012 Kadant Inc. All rights reserved.
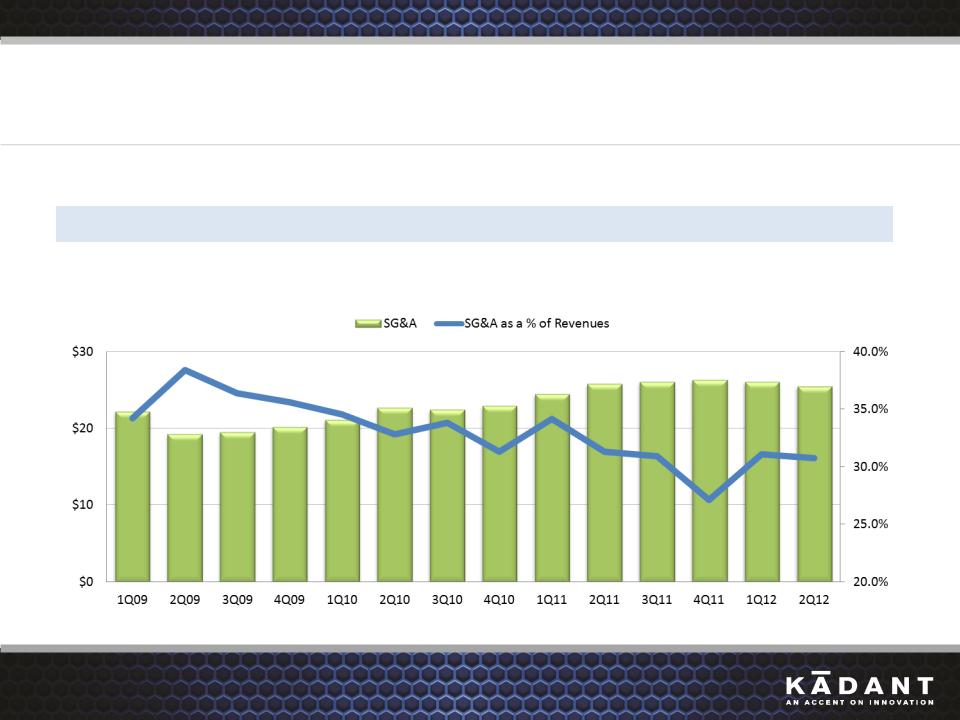
SG&A
($ Millions) | 2Q12 | 1Q12 | 2Q11 | Sequential ∆ | Y-O-Y ∆ |
SG&A | $25.5 | $26.1 | $25.8 | $(0.6) | $(0.3) |
% Revenues | 30.7% | 31.1% | 31.3% | -0.4% | -0.6% |
21
*
KAI 2Q12 Business Review-July 31, 2012
© 2012 Kadant Inc. All rights reserved.
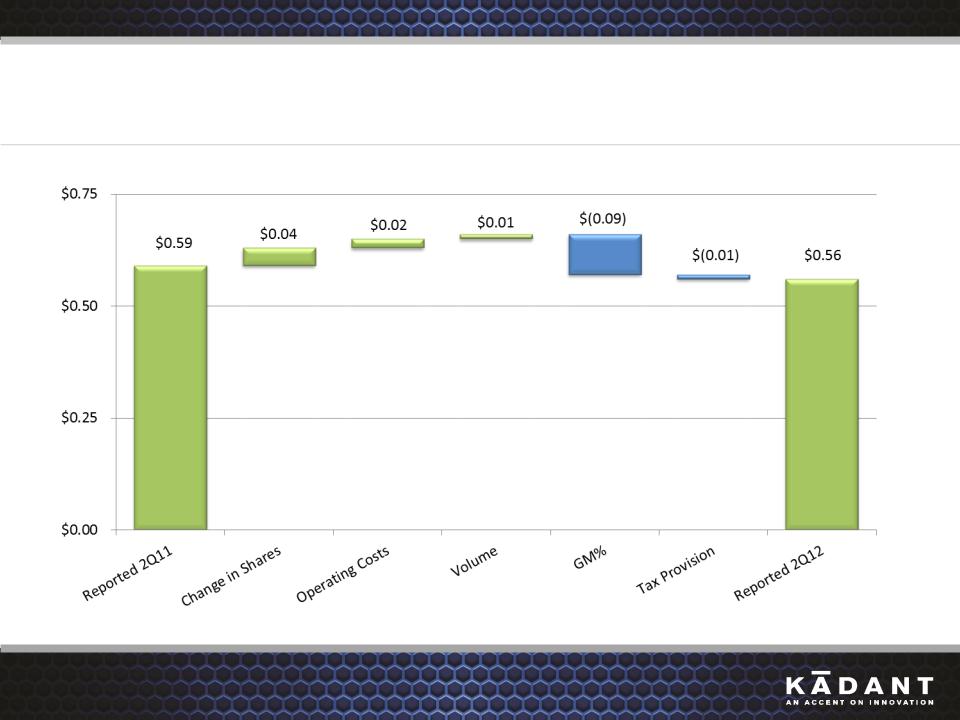
2Q11 to 2Q12 Diluted EPS from Continuing Operations
22
*
KAI 2Q12 Business Review-July 31, 2012
© 2012 Kadant Inc. All rights reserved.
Cash Flow
($ Millions) | 2Q12 | 2Q11 | 2Q12 YTD | 2Q11 YTD |
Income from Continuing Operations | $6.6 | $7.4 | $13.7 | $13.3 |
Depreciation and Amortization | 2.0 | 2.0 | 4.3 | 3.8 |
Stock-Based Compensation | 1.2 | 1.1 | 2.3 | 1.9 |
Other Items | 0.3 | - | (0.1) | 0.5 |
Change in Current Assets & Liabilities (excl. acquisitions) | (1.5) | (3.7) | (15.7) | (12.3) |
Cash Provided by Continuing Operations | $8.6 | $6.8 | $4.5 | $7.2 |
23
*
KAI 2Q12 Business Review-July 31, 2012
© 2012 Kadant Inc. All rights reserved.
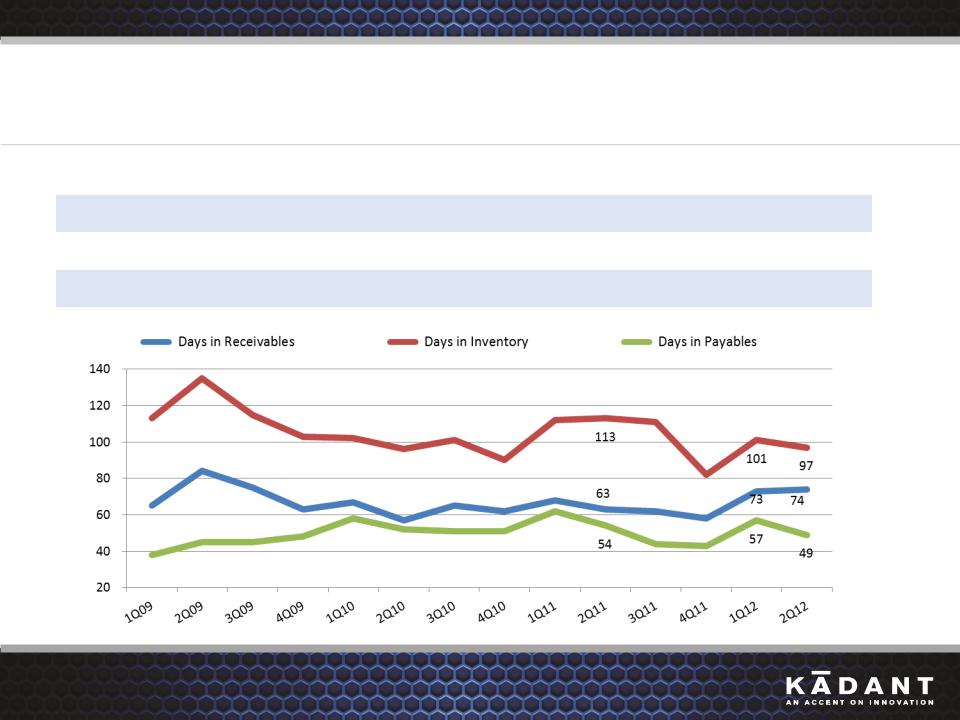
Key Working Capital Metrics
2Q12 | 1Q12 | 2Q11 | |
Days in Receivables | 74 | 73 | 63 |
Days in Payables | 49 | 57 | 54 |
Days in Inventory | 97 | 101 | 113 |
24
*
KAI 2Q12 Business Review-July 31, 2012
© 2012 Kadant Inc. All rights reserved.
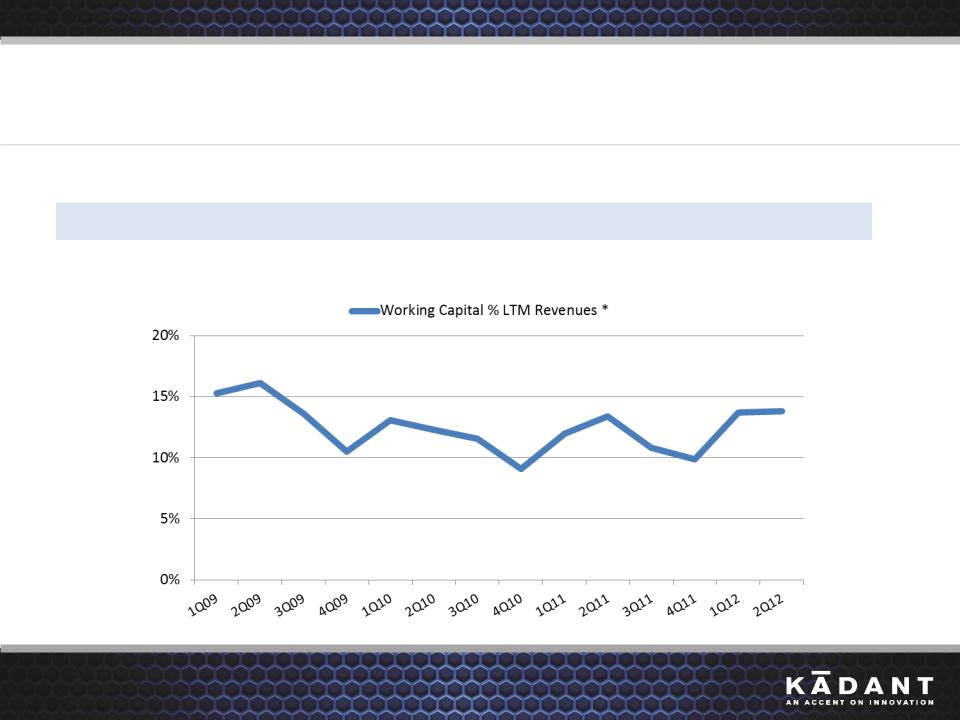
Working Capital
2Q12 | 1Q12 | 2Q11 | |
Working Capital % LTM Revenues* | 13.8% | 13.7% | 13.4% |
*Working Capital is defined as current assets less current liabilities, excluding cash, debt, and the discontinued operation.
25
*
KAI 2Q12 Business Review-July 31, 2012
© 2012 Kadant Inc. All rights reserved.
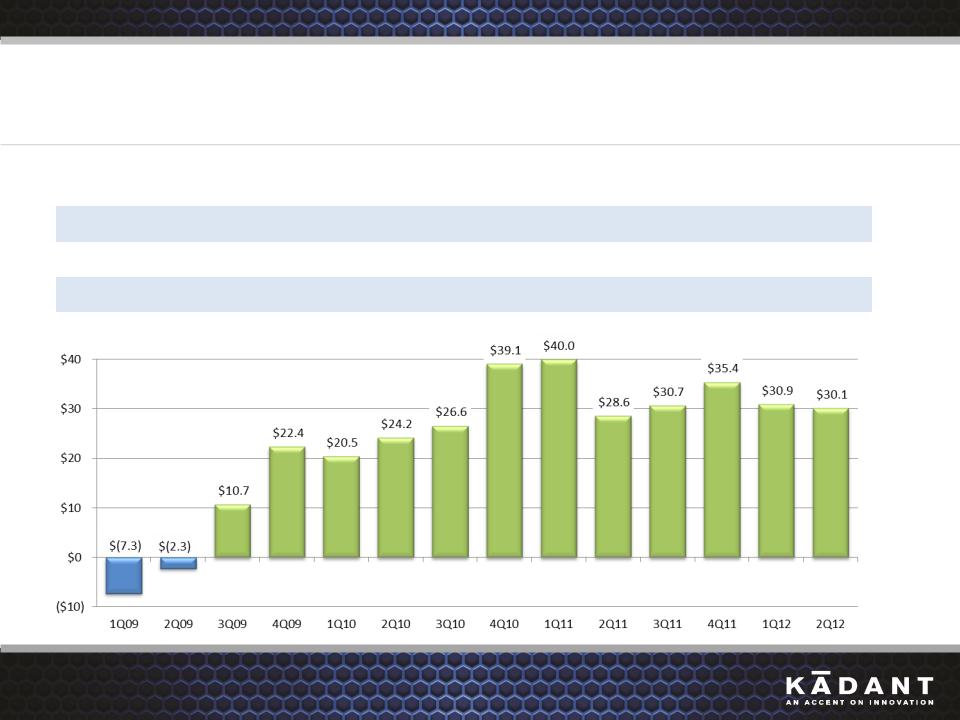
Cash and Debt
($ Millions) | 2Q12 | 1Q12 | 2Q11 |
Cash, cash equivalents, restricted cash | $42.1 | $43.0 | $46.1 |
Debt | (12.0) | (12.1) | (17.5) |
NET CASH | $30.1 | $30.9 | $28.6 |
26
*
KAI 2Q12 Business Review-July 31, 2012
© 2012 Kadant Inc. All rights reserved.
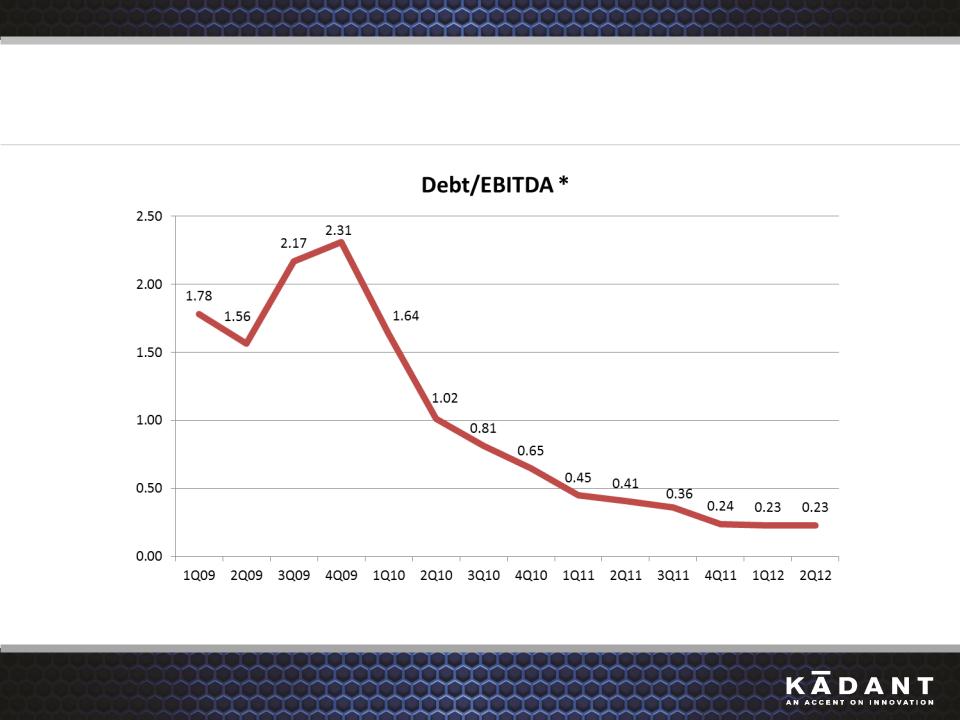
Leverage Ratio
* Calculated by adding or subtracting certain items, as required by our Credit Facility, from Adjusted EBITDA.
27

*
KAI 2Q12 Business Review-July 31, 2012
© 2012 Kadant Inc. All rights reserved.
Questions & Answers
To ask a question, please call 866-804-6926 within the U.S. or
+1-857-350-1672 outside the U.S. and reference 83375884.
+1-857-350-1672 outside the U.S. and reference 83375884.
Please mute the audio on your computer.
28

Second Quarter 2012 Business Review
Jonathan W. Painter, President & CEO
Thomas M. O’Brien, Executive Vice President & CFO