Fourth Quarter and Full-Year 2012 Business Review Jonathan W. Painter, President & CEO Thomas M. O’Brien, Executive Vice President & CFO
* KAI 4Q12 Business Review–February 27, 2013 © 2013 Kadant Inc. All rights reserved. Forward-Looking Statements The following constitutes a “Safe Harbor” statement under the Private Securities Litigation Reform Act of 1995: This presentation contains forward-looking statements that involve a number of risks and uncertainties, including forward-looking statements about our expected future financial and operating performance, demand for our products, and economic and industry outlook. Our actual results may differ materially from these forward-looking statements as a result of various important factors, including those set forth under the heading "Risk Factors" in Kadant’s quarterly report on Form 10-Q for the period ended September 29, 2012. These include risks and uncertainties relating to our dependence on the pulp and paper industry; significance of sales and operation of manufacturing facilities in China; commodity and component price increases or shortages; international sales and operations; competition; soundness of suppliers and customers; our effective tax rate; future restructurings; soundness of financial institutions; our debt obligations; restrictions in our credit agreement; our acquisition strategy; protection of patents and proprietary rights; failure of our information systems or breaches of data security; fluctuations in our share price; and anti-takeover provisions. We undertake no obligation to publicly update any forward-looking statement, whether as a result of new information, future events, or otherwise.
2
* KAI 4Q12 Business Review–February 27, 2013 © 2013 Kadant Inc. All rights reserved. Use of Non-GAAP Financial Measures In addition to the financial measures prepared in accordance with generally accepted accounting principles (GAAP), we use certain non-GAAP financial measures, including increases or decreases in revenues excluding the effect of foreign currency translation, adjusted operating income, adjusted net income, adjusted diluted earnings per share, earnings before interest, taxes, depreciation, and amortization (EBITDA), and adjusted EBITDA. A reconciliation of those numbers to the most directly comparable U.S. GAAP financial measures is shown in our 2012 fourth quarter earnings press release issued February 26, 2013, which is available in the Investors section of our website at www.kadant.com under the heading Investor News.
3
* KAI 4Q12 Business Review–February 27, 2013 © 2013 Kadant Inc. All rights reserved. Financial Classifications Starting in the first quarter of 2012, all geographic revenues and bookings data are attributed to regions based on customer locations. In addition, we segregated our Chemical pulping product line between parts and capital products. Starting in the third quarter of 2012, we combined our doctoring, water-management, and other product lines into the doctoring, cleaning, and filtration product line. Prior period amounts have been recast to conform to the current presentation.
4
* KAI 4Q12 Business Review–February 27, 2013 © 2013 Kadant Inc. All rights reserved. BUSINESS REVIEW Jonathan W. Painter President & CEO
5
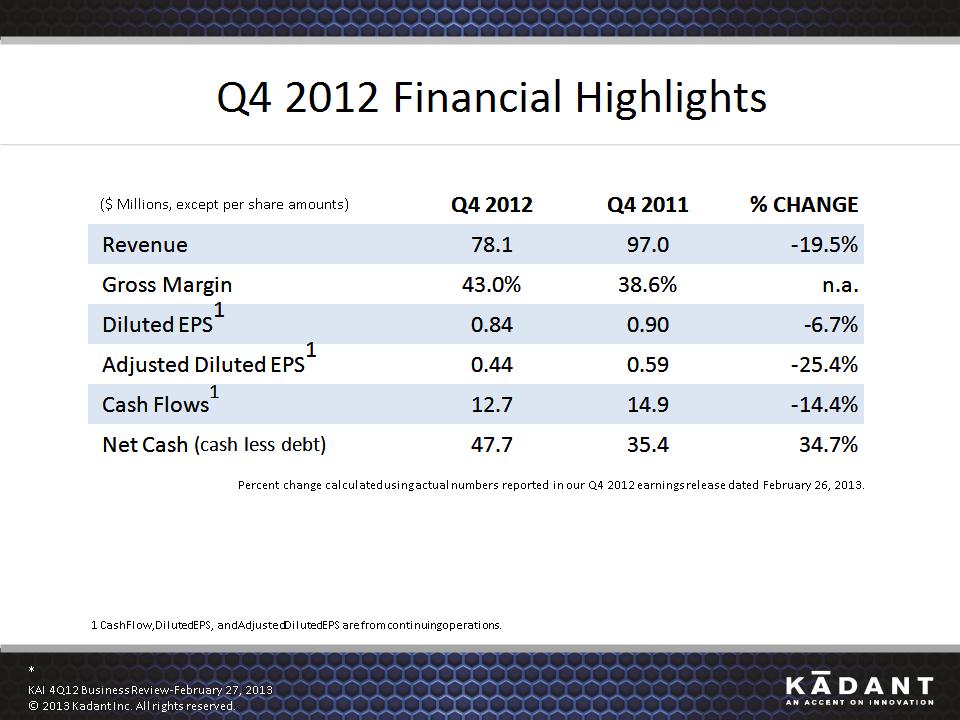
* KAI 4Q12 Business Review–February 27, 2013 © 2013 Kadant Inc. All rights reserved. Q4 2012 Financial Highlights ($ Millions, except per share amounts) Q4 2012 Q4 2011 % CHANGE Revenue 78.1 97.0 -19.5% Gross Margin 43.0% 38.6% n.a. Diluted EPS1 0.84 0.90 -6.7% Adjusted Diluted EPS1 0.44 0.59 -25.4% Cash Flows1 12.7 14.9 -14.4% Net Cash (cash less debt) 47.7 35.4 34.7% 1 Cash Flow, Diluted EPS, and Adjusted Diluted EPS are from continuing operations. Percent change calculated using actual numbers reported in our Q4 2012 earnings release dated February 26, 2013.
6
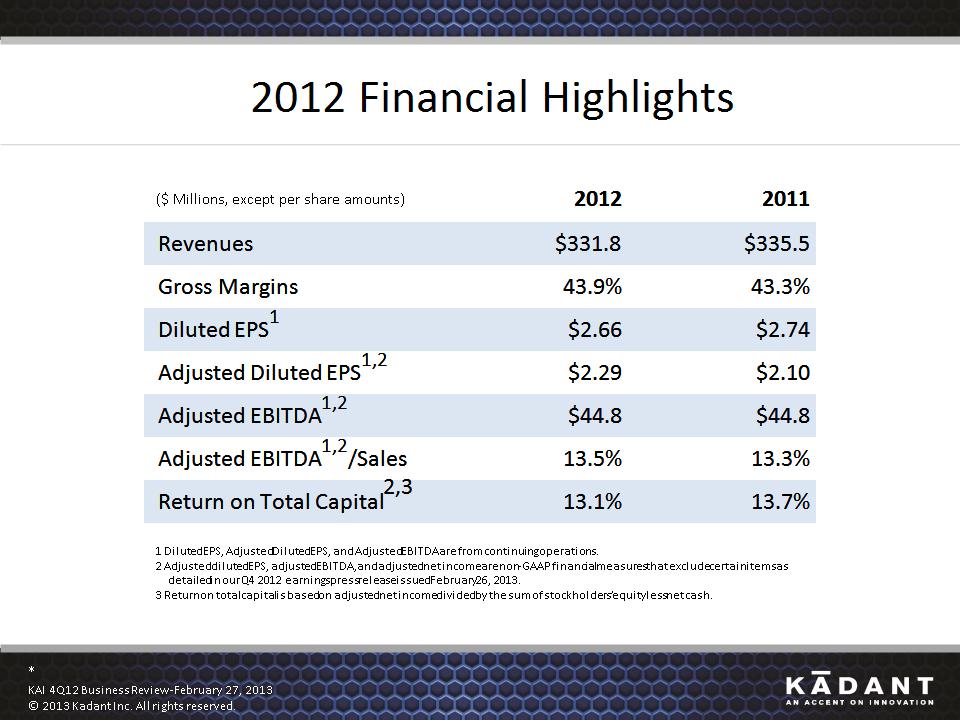
* KAI 4Q12 Business Review–February 27, 2013 © 2013 Kadant Inc. All rights reserved. 2012 Financial Highlights ($ Millions, except per share amounts) 2012 2011 Revenues $331.8 $335.5 Gross Margins 43.9% 43.3% Diluted EPS1 $2.66 $2.74 Adjusted Diluted EPS1,2 $2.29 $2.10 Adjusted EBITDA1,2 $44.8 $44.8 Adjusted EBITDA1,2/Sales 13.5% 13.3% Return on Total Capital2,3 13.1% 13.7% 1 Diluted EPS, Adjusted Diluted EPS, and Adjusted EBITDA are from continuing operations. 2 Adjusted diluted EPS, adjusted EBITDA, and adjusted net income are non-GAAP financial measures that exclude certain items as detailed in our Q4 2012 earnings press release issued February 26, 2013. 3 Return on total capital is based on adjusted net income divided by the sum of stockholders’ equity less net cash.
7
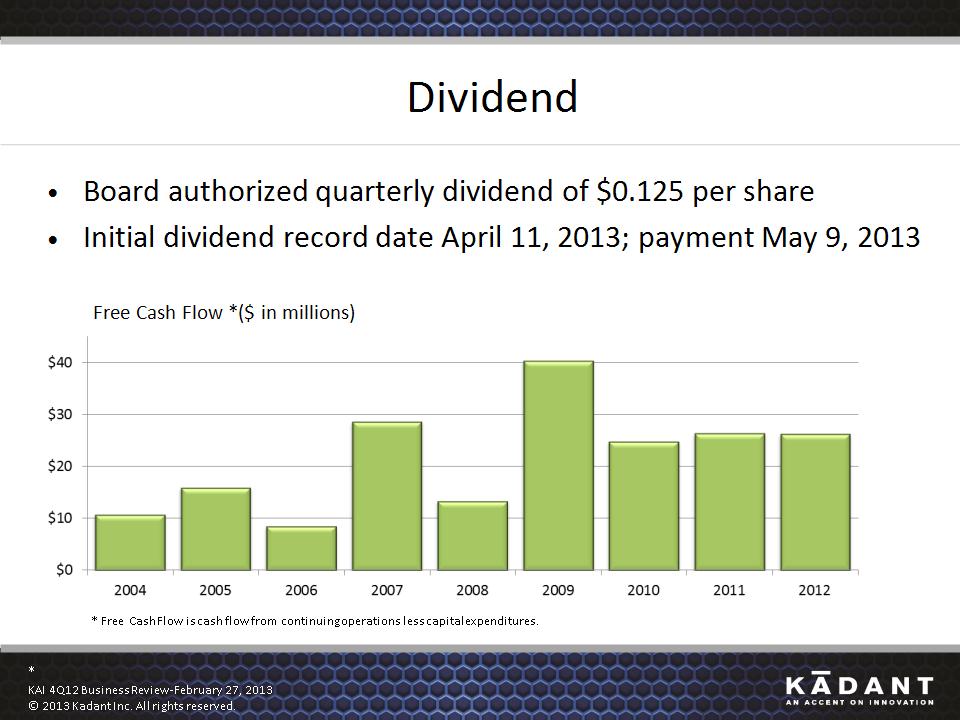
* KAI 4Q12 Business Review–February 27, 2013 © 2013 Kadant Inc. All rights reserved. Dividend Board authorized quarterly dividend of $0.125 per share Initial dividend record date April 11, 2013; payment May 9, 2013 Free Cash Flow *($ in millions) * Free Cash Flow is cash flow from continuing operations less capital expenditures.
8
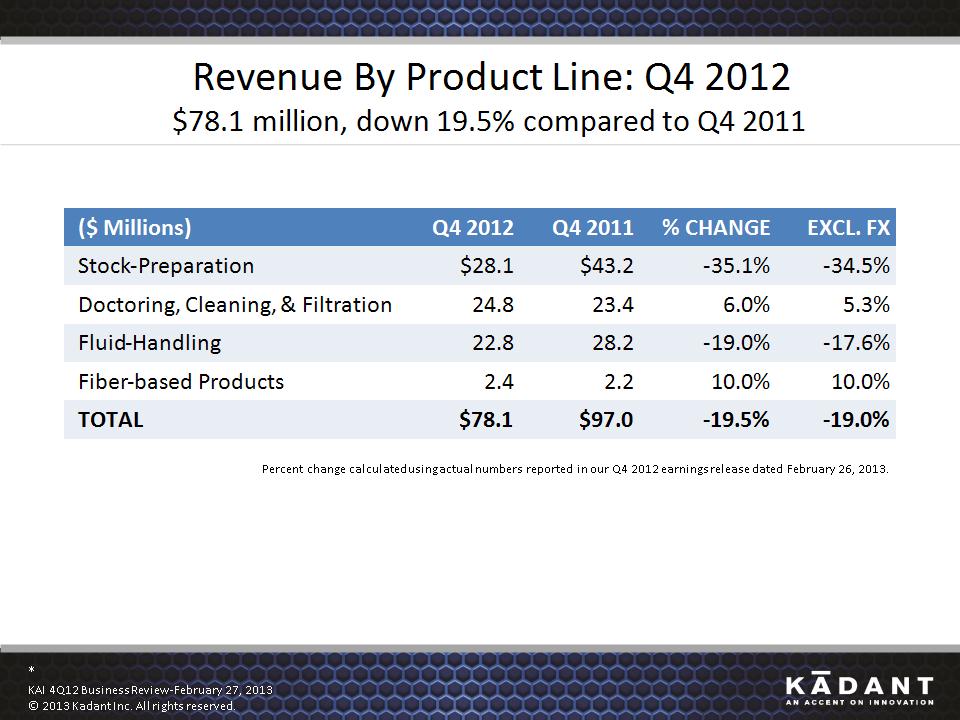
* KAI 4Q12 Business Review–February 27, 2013 © 2013 Kadant Inc. All rights reserved. Revenue By Product Line: Q4 2012 $78.1 million, down 19.5% compared to Q4 2011 ($ Millions) Q4 2012 Q4 2011 % CHANGE EXCL. FX Stock-Preparation $28.1 $43.2 -35.1% -34.5% Doctoring, Cleaning, & Filtration 24.8 23.4 6.0% 5.3% Fluid-Handling 22.8 28.2 -19.0% -17.6% Fiber-based Products 2.4 2.2 10.0% 10.0% TOTAL $78.1 $97.0 -19.5% -19.0% Percent change calculated using actual numbers reported in our Q4 2012 earnings release dated February 26, 2013.
9
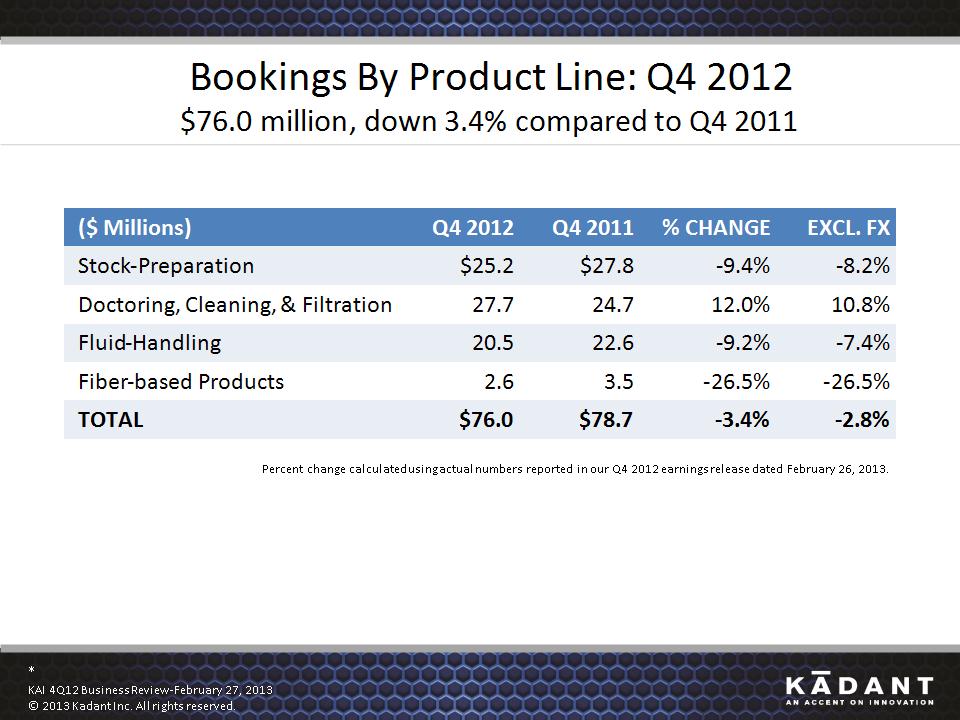
* KAI 4Q12 Business Review–February 27, 2013 © 2013 Kadant Inc. All rights reserved. Bookings By Product Line: Q4 2012 $76.0 million, down 3.4% compared to Q4 2011 Percent change calculated using actual numbers reported in our Q4 2012 earnings release dated February 26, 2013. ($ Millions) Q4 2012 Q4 2011 % CHANGE EXCL. FX Stock-Preparation $25.2 $27.8 -9.4% -8.2% Doctoring, Cleaning, & Filtration 27.7 24.7 12.0% 10.8% Fluid-Handling 20.5 22.6 -9.2% -7.4% Fiber-based Products 2.6 3.5 -26.5% -26.5% TOTAL $76.0 $78.7 -3.4% -2.8%
10
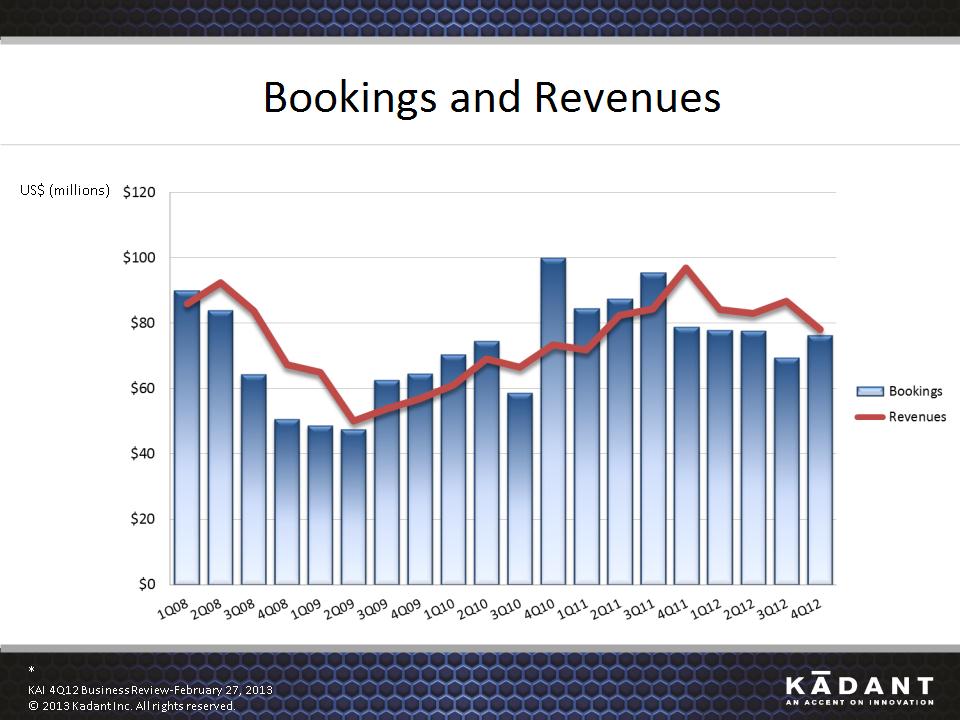
* KAI 4Q12 Business Review–February 27, 2013 © 2013 Kadant Inc. All rights reserved. Bookings and Revenues US$ (millions)
11
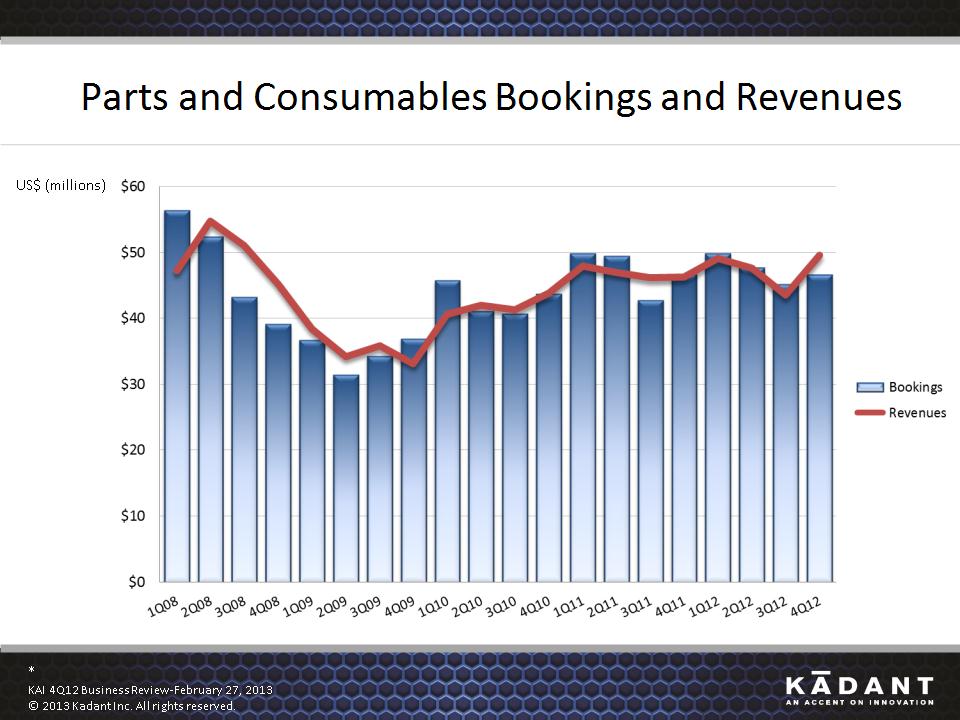
* KAI 4Q12 Business Review–February 27, 2013 © 2013 Kadant Inc. All rights reserved. Parts and Consumables Bookings and Revenues US$ (millions)
12
* KAI 4Q12 Business Review–February 27, 2013 © 2013 Kadant Inc. All rights reserved. REGIONAL PERFORMANCE
13
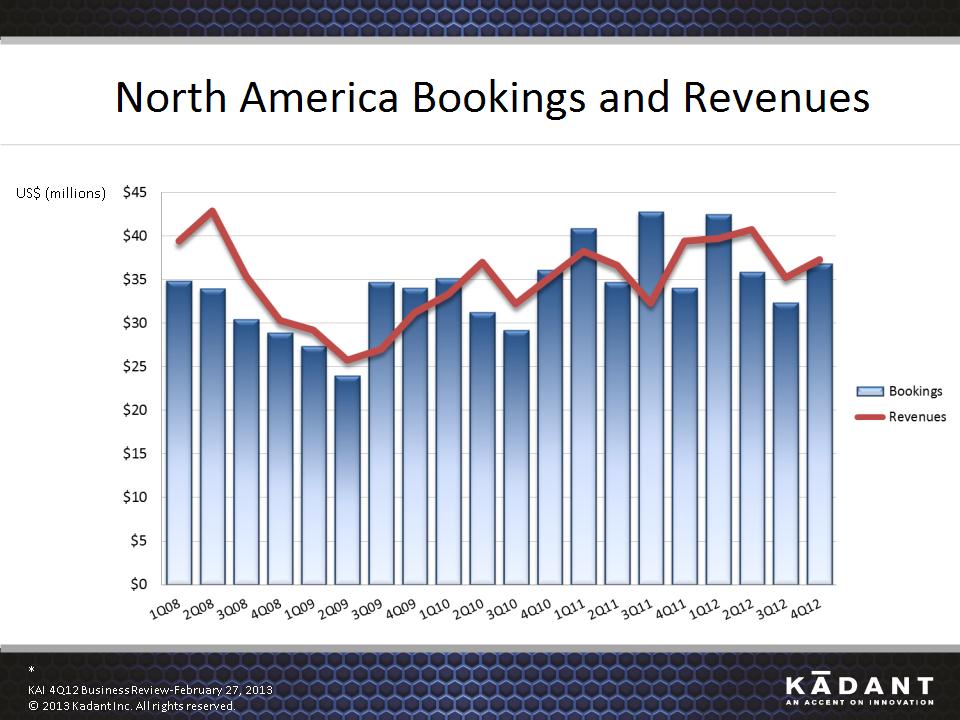
* KAI 4Q12 Business Review–February 27, 2013 © 2013 Kadant Inc. All rights reserved. North America Bookings and Revenues US$ (millions)
14
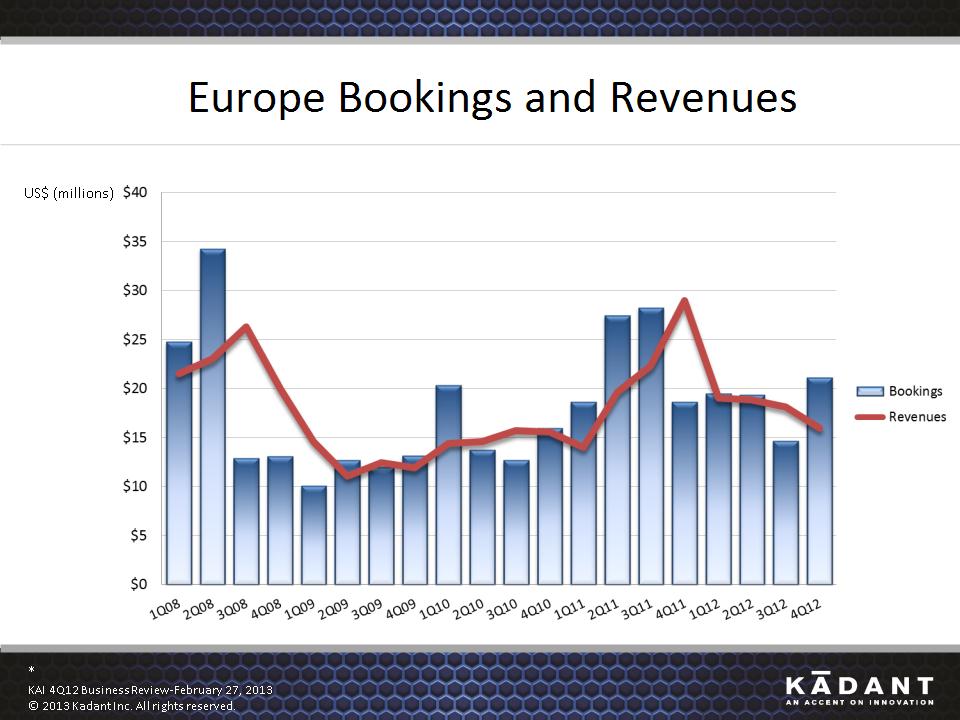
* KAI 4Q12 Business Review–February 27, 2013 © 2013 Kadant Inc. All rights reserved. Europe Bookings and Revenues US$ (millions)
15

* KAI 4Q12 Business Review–February 27, 2013 © 2013 Kadant Inc. All rights reserved. China Bookings and Revenues US$ (millions)
16
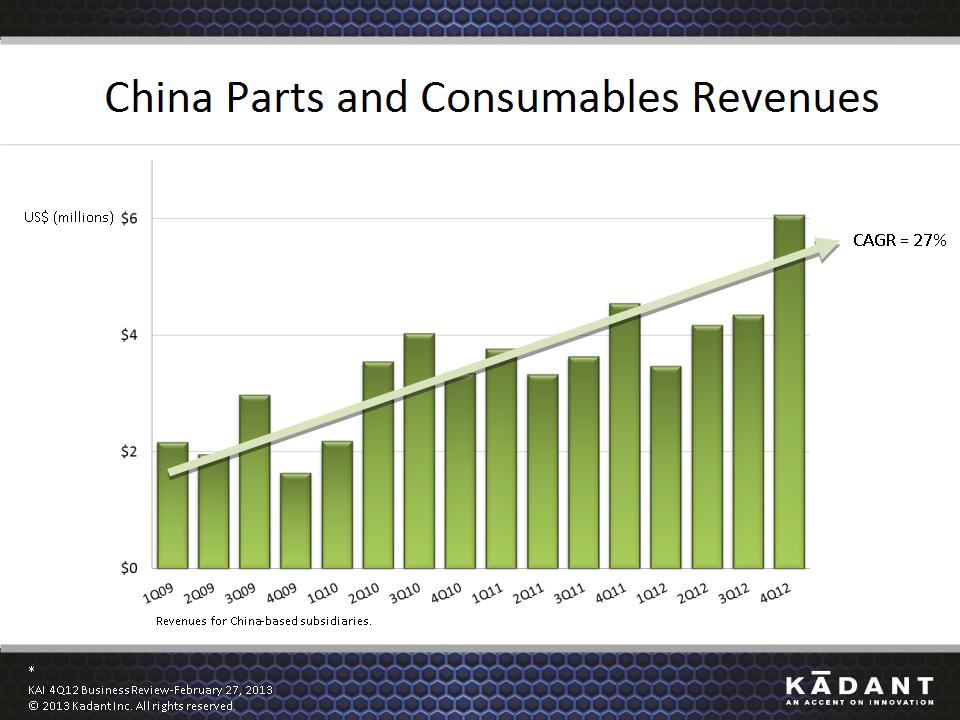
* KAI 4Q12 Business Review–February 27, 2013 © 2013 Kadant Inc. All rights reserved. China Parts and Consumables Revenues US$ (millions) CAGR = 27% Revenues for China-based subsidiaries.
17
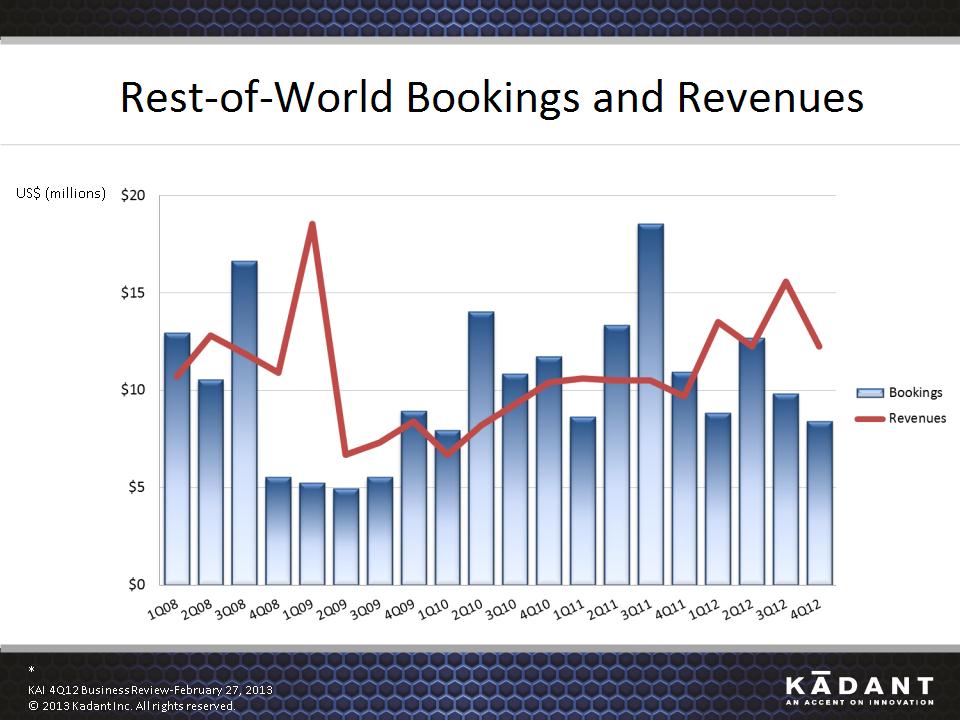
* KAI 4Q12 Business Review–February 27, 2013 © 2013 Kadant Inc. All rights reserved. Rest-of-World Bookings and Revenues US$ (millions)
18
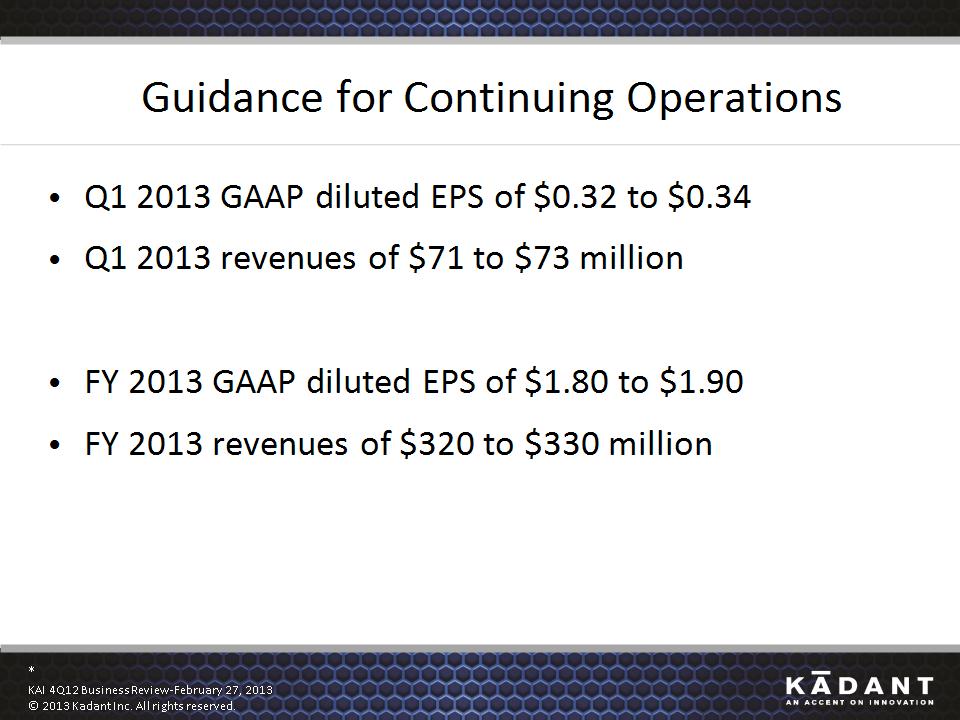
* KAI 4Q12 Business Review–February 27, 2013 © 2013 Kadant Inc. All rights reserved. Guidance for Continuing Operations Q1 2013 GAAP diluted EPS of $0.32 to $0.34 Q1 2013 revenues of $71 to $73 million FY 2013 GAAP diluted EPS of $1.80 to $1.90 FY 2013 revenues of $320 to $330 million
19
* KAI 4Q12 Business Review–February 27, 2013 © 2013 Kadant Inc. All rights reserved. FINANCIAL REVIEW Thomas M. O’Brien Executive Vice President & Chief Financial Officer
20
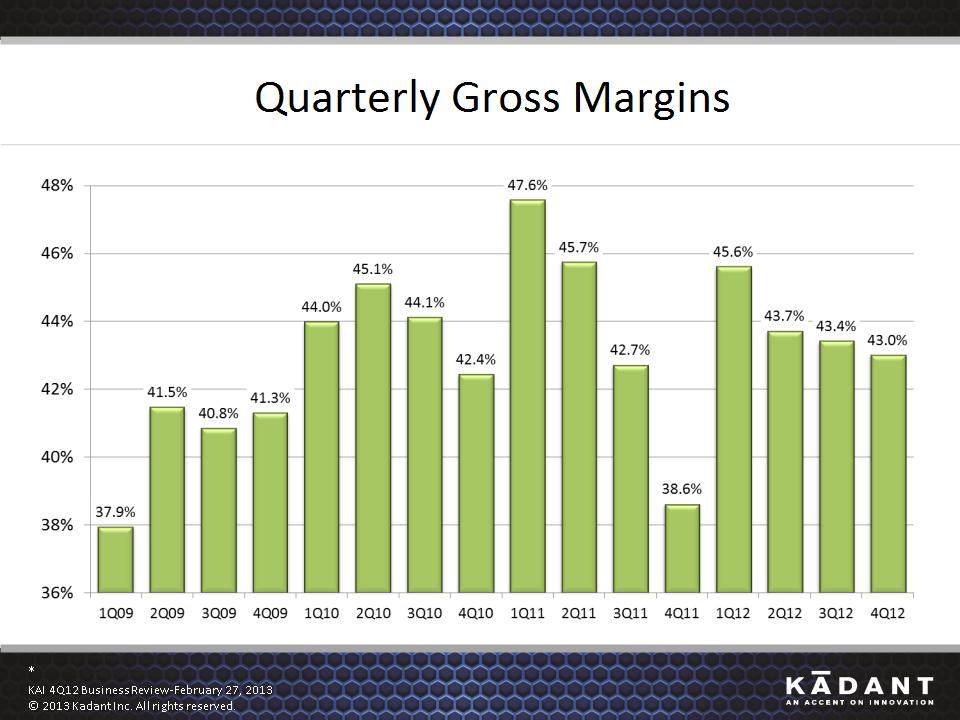
* KAI 4Q12 Business Review–February 27, 2013 © 2013 Kadant Inc. All rights reserved. Quarterly Gross Margins
21
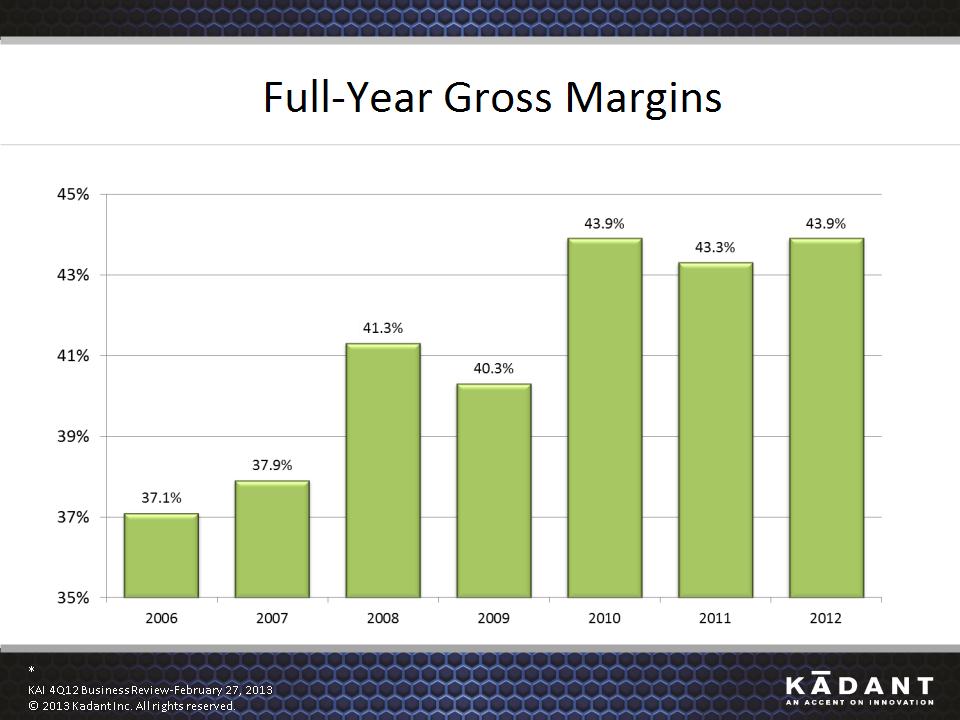
* KAI 4Q12 Business Review–February 27, 2013 © 2013 Kadant Inc. All rights reserved. Full-Year Gross Margins
22
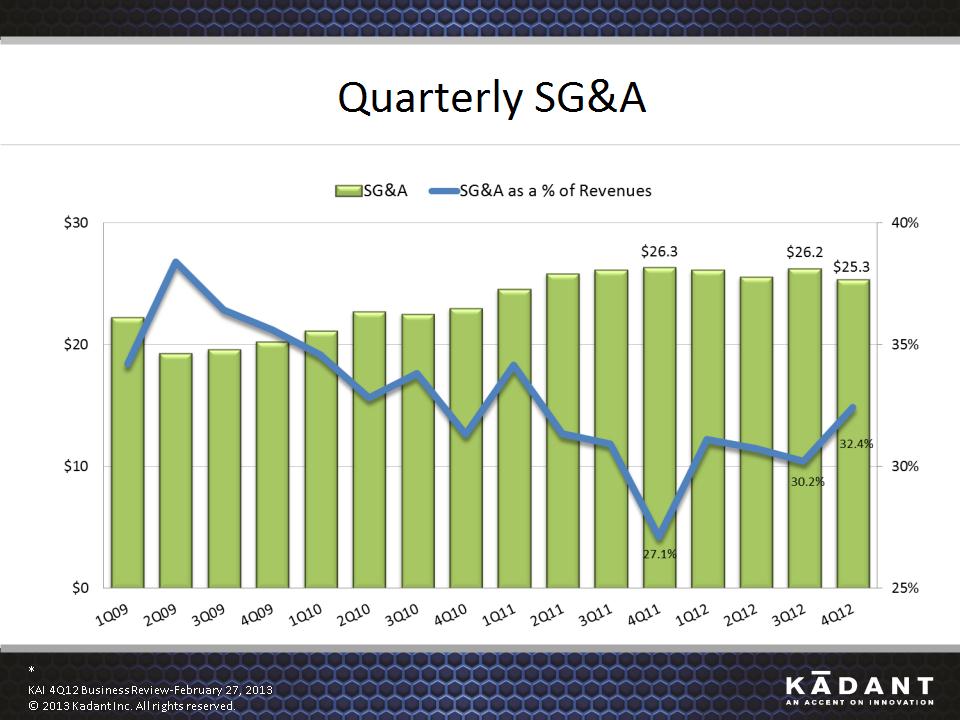
* KAI 4Q12 Business Review–February 27, 2013 © 2013 Kadant Inc. All rights reserved. Quarterly SG&A
23

* KAI 4Q12 Business Review–February 27, 2013 © 2013 Kadant Inc. All rights reserved. Full-Year SG&A
24
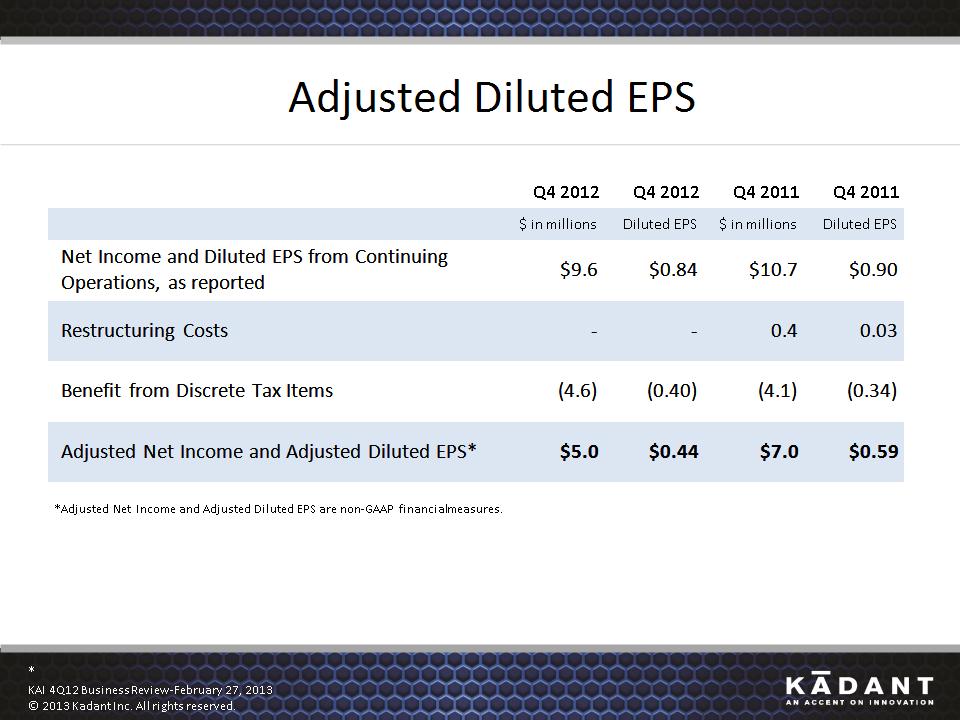
* KAI 4Q12 Business Review–February 27, 2013 © 2013 Kadant Inc. All rights reserved. Adjusted Diluted EPS Q4 2012 Q4 2012 Q4 2011 Q4 2011 $ in millions Diluted EPS $ in millions Diluted EPS Net Income and Diluted EPS from Continuing Operations, as reported $9.6 $0.84 $10.7 $0.90 Restructuring Costs - - 0.4 0.03 Benefit from Discrete Tax Items (4.6) (0.40) (4.1) (0.34) Adjusted Net Income and Adjusted Diluted EPS* $5.0 $0.44 $7.0 $0.59 *Adjusted Net Income and Adjusted Diluted EPS are non-GAAP financial measures.
25
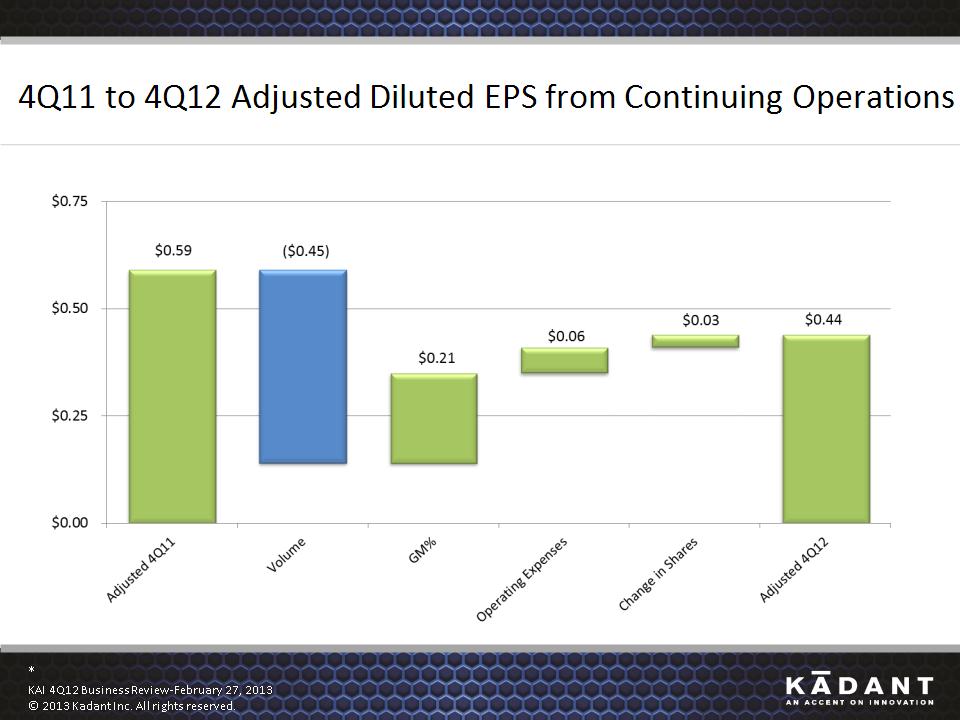
* KAI 4Q12 Business Review–February 27, 2013 © 2013 Kadant Inc. All rights reserved. 4Q11 to 4Q12 Adjusted Diluted EPS from Continuing Operations
26
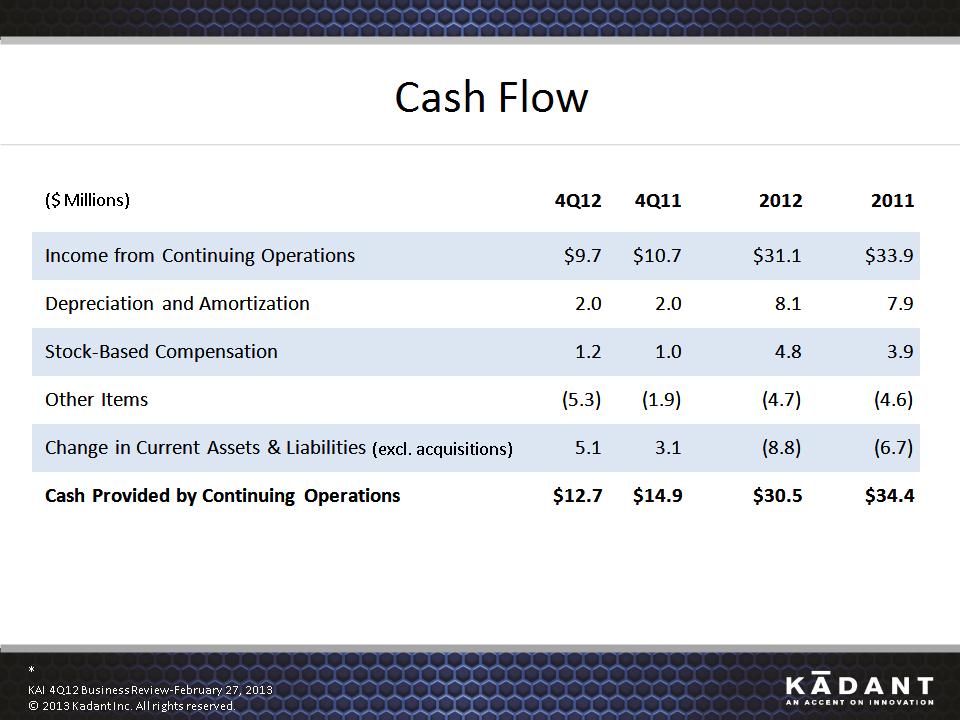
* KAI 4Q12 Business Review–February 27, 2013 © 2013 Kadant Inc. All rights reserved. Cash Flow ($ Millions) 4Q12 4Q11 2012 2011 Income from Continuing Operations $9.7 $10.7 $31.1 $33.9 Depreciation and Amortization 2.0 2.0 8.1 7.9 Stock-Based Compensation 1.2 1.0 4.8 3.9 Other Items (5.3) (1.9) (4.7) (4.6) Change in Current Assets & Liabilities (excl. acquisitions) 5.1 3.1 (8.8) (6.7) Cash Provided by Continuing Operations $12.7 $14.9 $30.5 $34.4
27
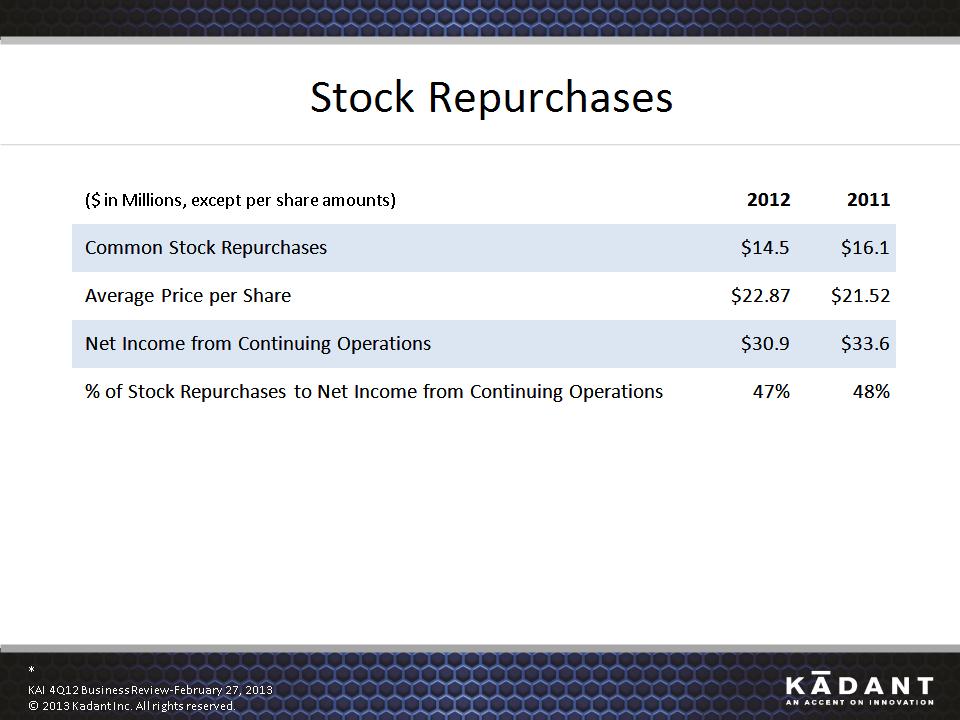
* KAI 4Q12 Business Review–February 27, 2013 © 2013 Kadant Inc. All rights reserved. Stock Repurchases ($ in Millions, except per share amounts) 2012 2011 Common Stock Repurchases $14.5 $16.1 Average Price per Share $22.87 $21.52 Net Income from Continuing Operations $30.9 $33.6 % of Stock Repurchases to Net Income from Continuing Operations 47% 48%
28
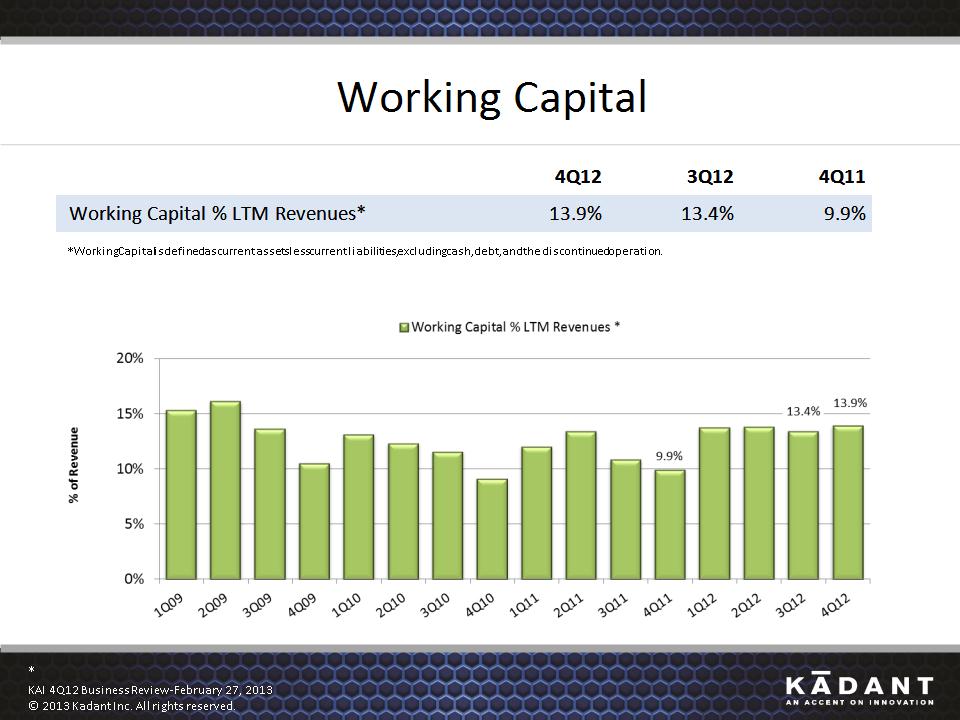
* KAI 4Q12 Business Review–February 27, 2013 © 2013 Kadant Inc. All rights reserved. Working Capital 4Q12 3Q12 4Q11 Working Capital % LTM Revenues* 13.9% 13.4% 9.9% *Working Capital is defined as current assets less current liabilities, excluding cash, debt, and the discontinued operation.
29
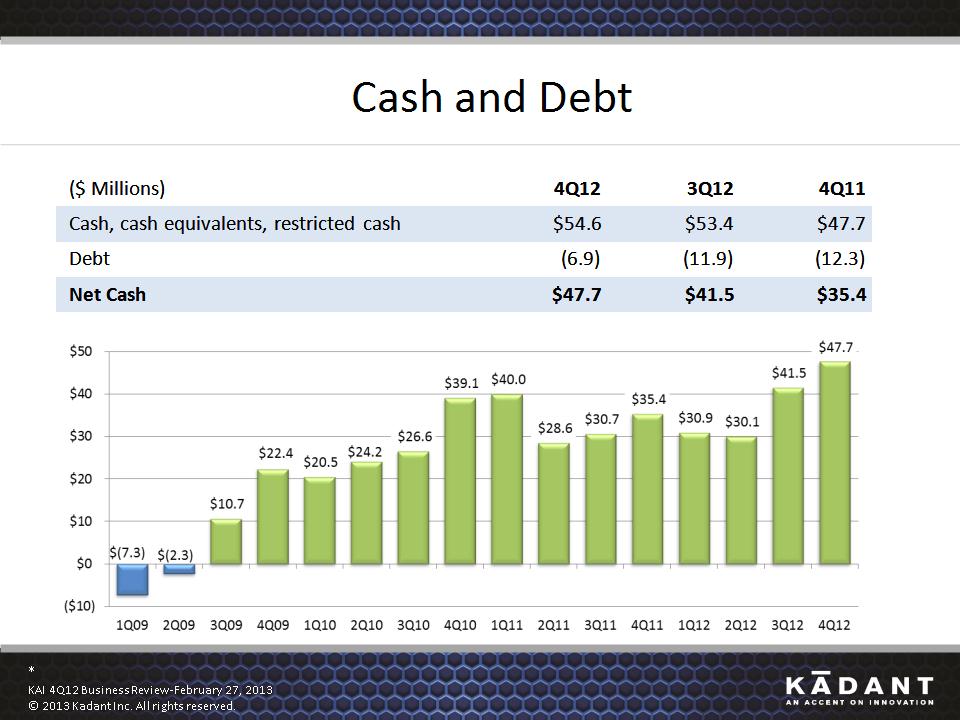
* KAI 4Q12 Business Review–February 27, 2013 © 2013 Kadant Inc. All rights reserved. Cash and Debt ($ Millions) 4Q12 3Q12 4Q11 Cash, cash equivalents, restricted cash $54.6 $53.4 $47.7 Debt (6.9) (11.9) (12.3) Net Cash $47.7 $41.5 $35.4
30
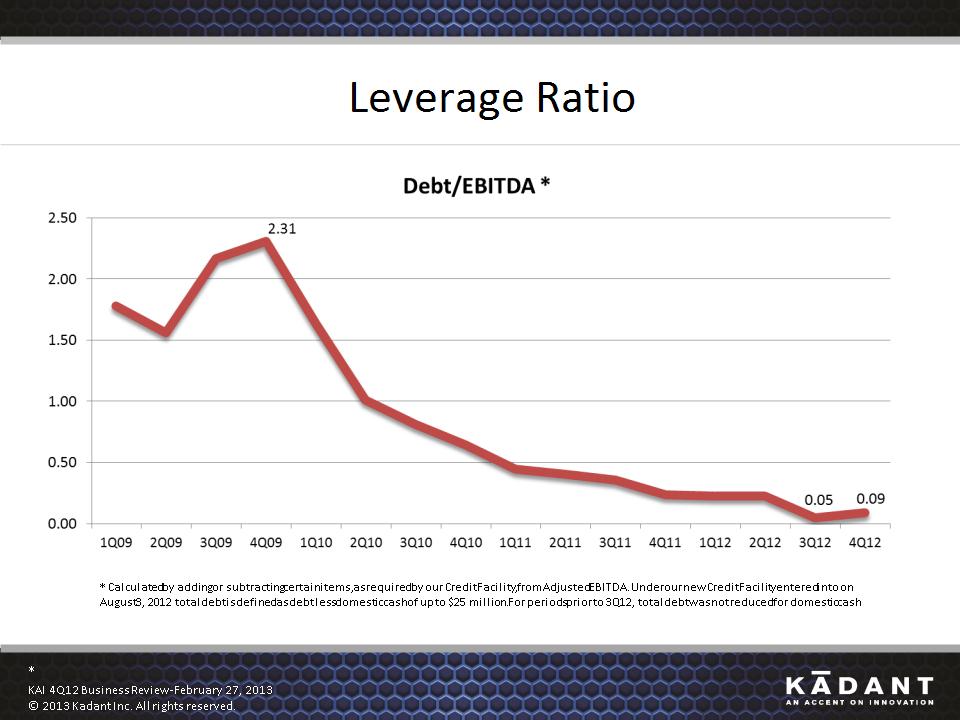
* KAI 4Q12 Business Review–February 27, 2013 © 2013 Kadant Inc. All rights reserved. Leverage Ratio * Calculated by adding or subtracting certain items, as required by our Credit Facility, from Adjusted EBITDA. Under our new Credit Facility entered into on August 3, 2012 total debt is defined as debt less domestic cash of up to $25 million. For periods prior to 3Q12, total debt was not reduced for domestic cash.
31
* KAI 4Q12 Business Review–February 27, 2013 © 2013 Kadant Inc. All rights reserved. Questions & Answers To ask a question, please call 866-804-6926 within the U.S. or +1-857-350-1672 outside the U.S. and reference 83375884. Please mute the audio on your computer.
32

Fourth Quarter and Full-Year 2012 Business Review Jonathan W. Painter, President & CEO Thomas M. O’Brien, Executive Vice President & CFO
33
* KAI 4Q12 Business Review–February 27, 2013 © 2013 Kadant Inc. All rights reserved. APPENDIX Investor Contact: Thomas M. O’Brien, 978-776-2000
34
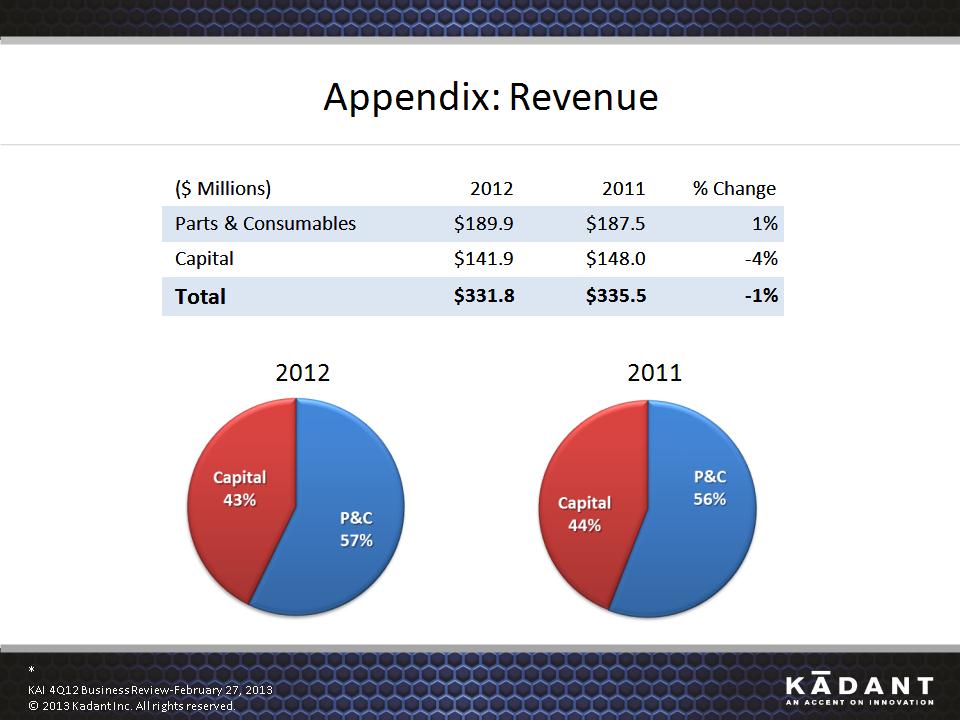
* KAI 4Q12 Business Review–February 27, 2013 © 2013 Kadant Inc. All rights reserved. Appendix: Revenue 2012 2011 ($ Millions) 2012 2011 % Change Parts & Consumables $189.9 $187.5 1% Capital $141.9 $148.0 -4% Total $331.8 $335.5 -1%
35
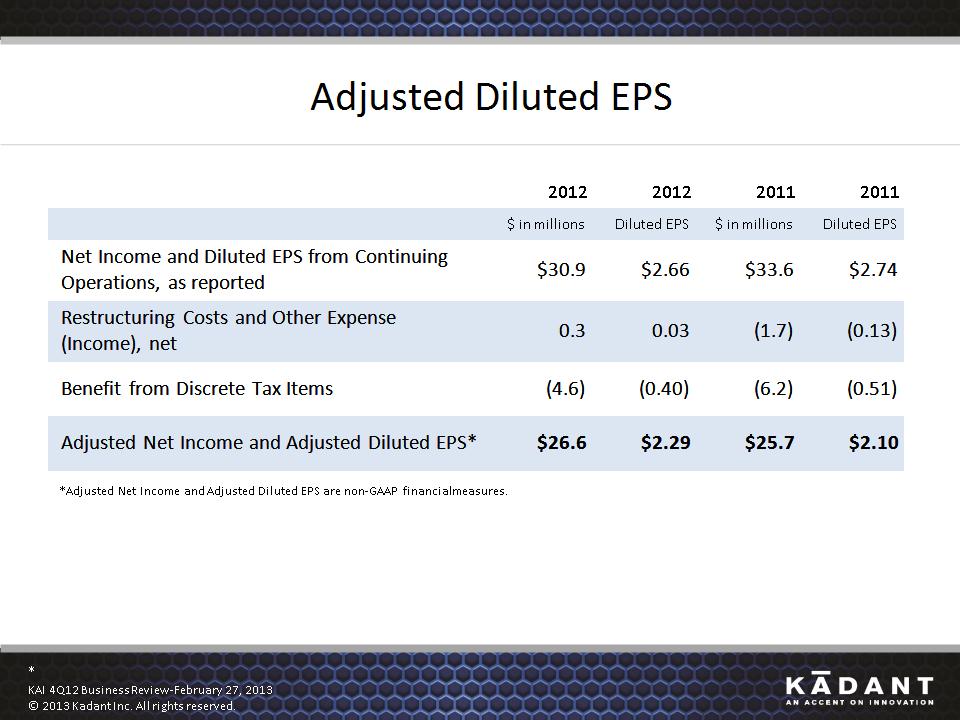
* KAI 4Q12 Business Review–February 27, 2013 © 2013 Kadant Inc. All rights reserved. Adjusted Diluted EPS 2012 2012 2011 2011 $ in millions Diluted EPS $ in millions Diluted EPS Net Income and Diluted EPS from Continuing Operations, as reported $30.9 $2.66 $33.6 $2.74 Restructuring Costs and Other Expense (Income), net 0.3 0.03 (1.7) (0.13) Benefit from Discrete Tax Items (4.6) (0.40) (6.2) (0.51) Adjusted Net Income and Adjusted Diluted EPS* $26.6 $2.29 $25.7 $2.10 *Adjusted Net Income and Adjusted Diluted EPS are non-GAAP financial measures.
36
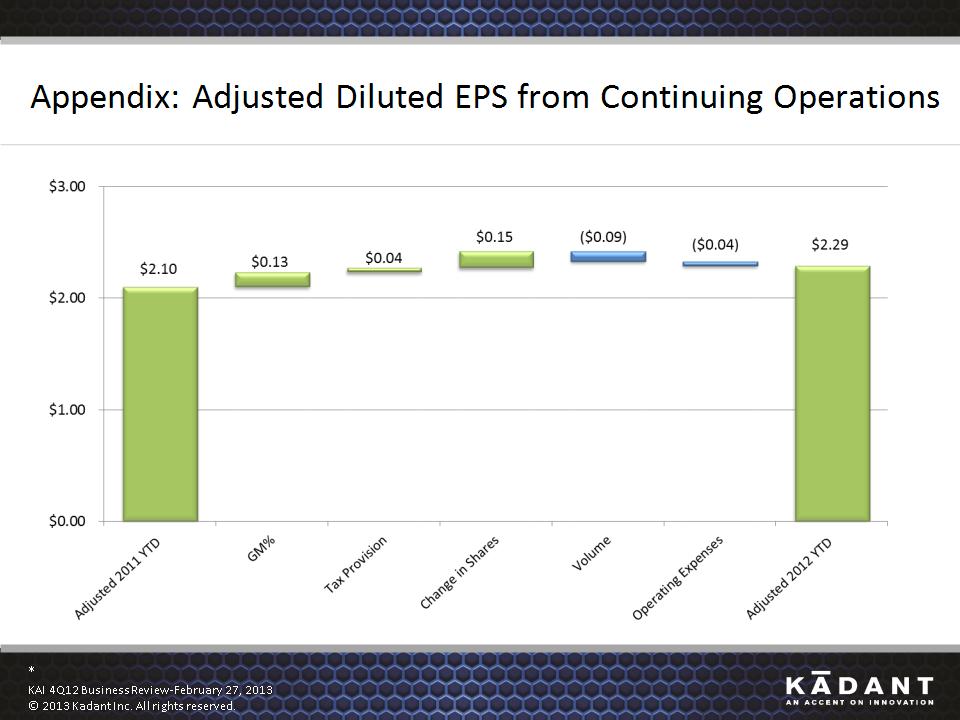
* KAI 4Q12 Business Review–February 27, 2013 © 2013 Kadant Inc. All rights reserved. Appendix: Adjusted Diluted EPS from Continuing Operations