
Annual Meeting of Stockholders May 22, 2013 Westford, Massachusetts © 2013 Kadant Inc. All rights reserved.
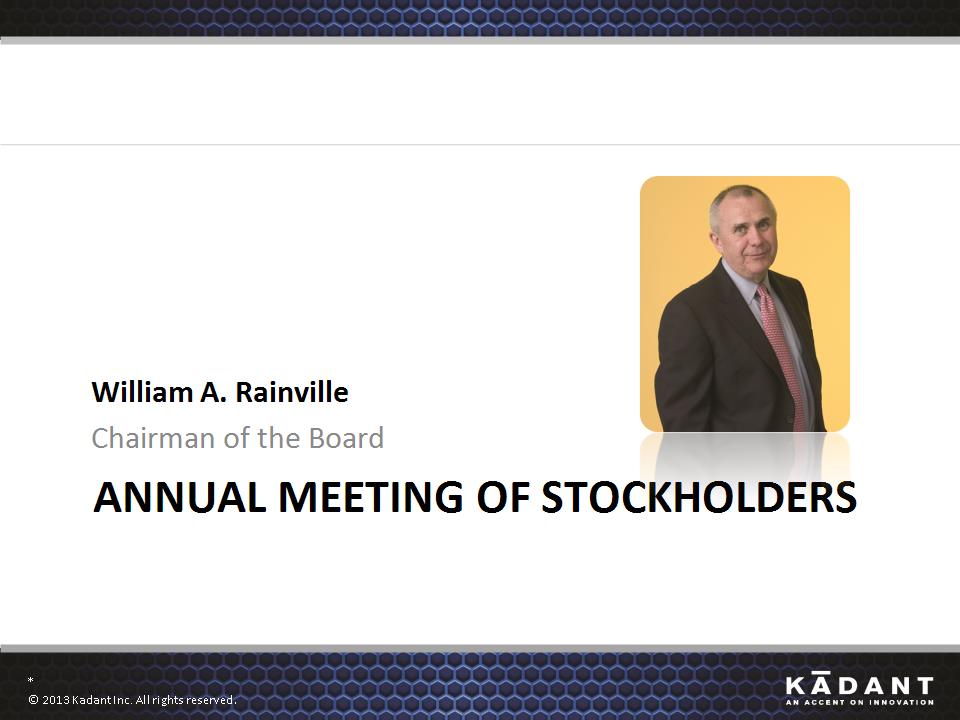
ANNUAL MEETING OF STOCKHOLDERS William A. Rainville Chairman of the Board * © 2013 Kadant Inc. All rights reserved.
2
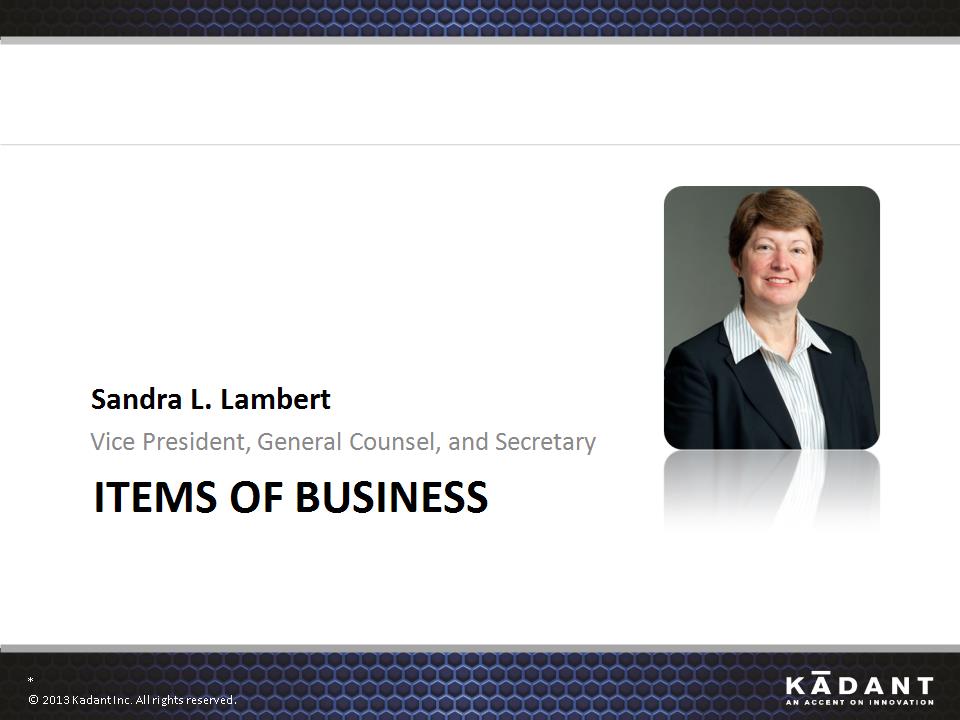
ITEMS OF BUSINESS Sandra L. Lambert Vice President, General Counsel, and Secretary * © 2013 Kadant Inc. All rights reserved.
3
Safe Harbor and Disclaimers The following constitutes a “Safe Harbor” statement under the Private Securities Litigation Reform Act of 1995: Our presentation today and these slides contain forward-looking statements that involve a number of risks and uncertainties, including forward-looking statements about our expected future financial and operating performance, our market opportunities and demand for our products, our views of the trends in the industries we serve, and our capabilities and technological position in the market. Important factors that could cause actual results to differ materially from those indicated by such statements are set forth under the heading “Risk Factors” in Kadant’s quarterly report on Form 10-Q for the period ended March 30, 2013. These include risks and uncertainties relating to our dependence on the pulp and paper industry; significance of sales and operation of manufacturing facilities in China; commodity and component price increases or shortages; international sales and operations; fluctuations in currency exchange rates; competition; soundness of suppliers and customers; our effective tax rate; future restructurings; soundness of financial institutions; our debt obligations; restrictions in our credit agreement; our acquisition strategy; protection of patents and proprietary rights; failure of our information systems or breaches of data security; fluctuations in our share price; and anti-takeover provisions. We undertake no obligation to publicly update any forward‐looking statement, whether as a result of new information, future events, or otherwise. The following slides and related commentary address certain current goals and targets for Kadant over the next five years. There can be no assurance that these goals and targets will be achieved and, in addition to the general risks and uncertainties of our business, they are based on a number of assumptions that may or may not prove accurate or achievable. These assumptions include our ability to identify and complete acquisitions that have the acquisition characteristics we desire and achieve the intended financial metrics, our ability and willingness to continue to pay dividends consistent with our recent practice, our ability to effect open market stock repurchases and our ability to implement our internal growth initiatives successfully and achieve the goals of such initiatives. Additionally, these goals and targets may change at any time and we undertake no obligations to update them. * © 2013 Kadant Inc. All rights reserved.
4
Items of Business PROPOSAL 1 Elect two directors constituting the entire class of directors to be elected for a three-year term expiring in May 2016 Mr. Jonathan W. Painter Mr. William A. Rainville * © 2013 Kadant Inc. All rights reserved.
5
Items of Business (cont.) PROPOSAL 2 Non-binding advisory vote on executive compensation Resolved, that the compensation paid to our company’s named executive officers, as disclosed pursuant to the compensation disclosure rules of the Securities and Exchange Commission, including the compensation discussion and analysis, the compensation tables, and any related material disclosed in our proxy statement, is hereby approved. * © 2013 Kadant Inc. All rights reserved.
6
Items of Business (cont.) PROPOSAL 3 Ratify the selection of KPMG LLP as our independent registered public accounting firm for FY 2013 * © 2013 Kadant Inc. All rights reserved.
7
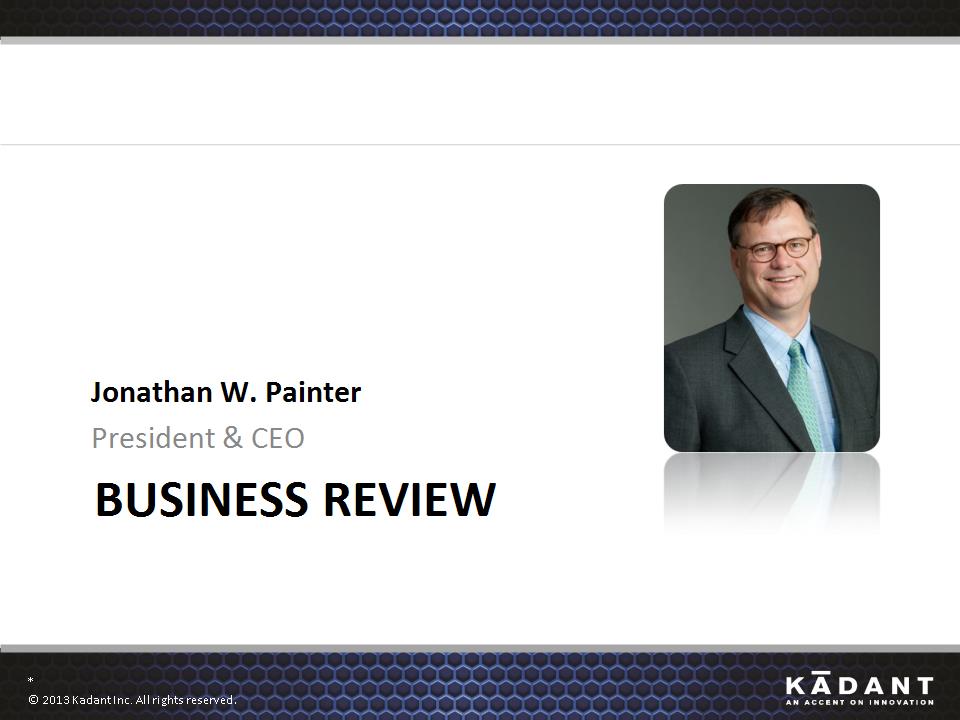
BUSINESS REVIEW Jonathan W. Painter President & CEO * © 2013 Kadant Inc. All rights reserved.
8
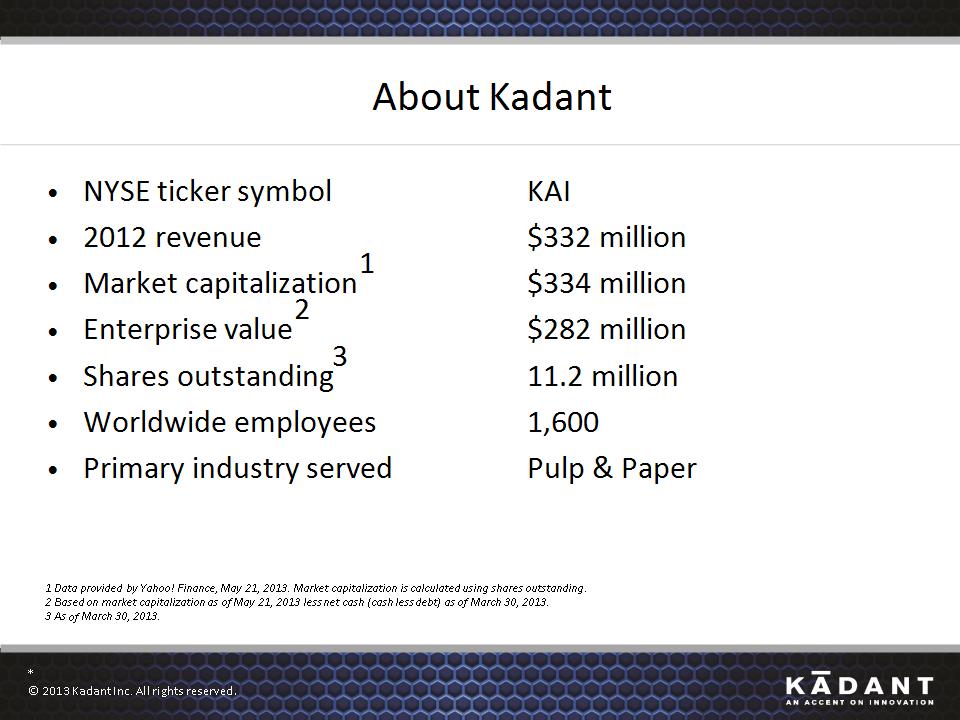
About Kadant NYSE ticker symbol KAI 2012 revenue $332 million Market capitalization1 $334 million Enterprise value2 $282 million Shares outstanding3 11.2 million Worldwide employees 1,600 Primary industry served Pulp & Paper 1 Data provided by Yahoo! Finance, May 21, 2013. Market capitalization is calculated using shares outstanding. 2 Based on market capitalization as of May 21, 2013 less net cash (cash less debt) as of March 30, 2013. 3 As of March 30, 2013. * © 2013 Kadant Inc. All rights reserved.
9
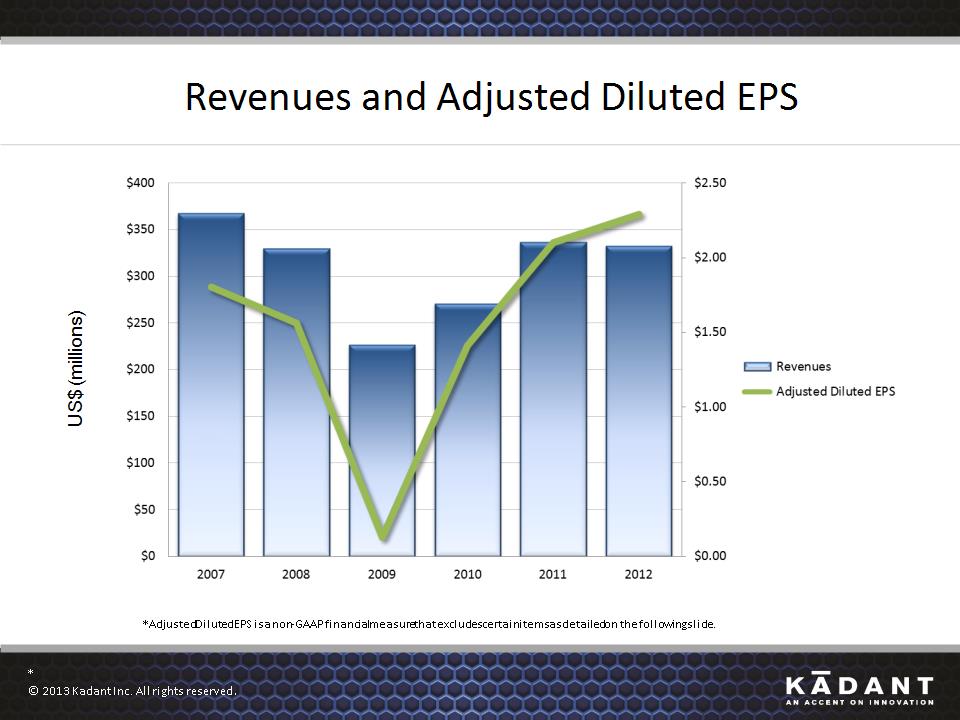
Revenues and Adjusted Diluted EPS US$ (millions) *Adjusted Diluted EPS is a non-GAAP financial measure that excludes certain items as detailed on the following slide. * © 2013 Kadant Inc. All rights reserved.
10
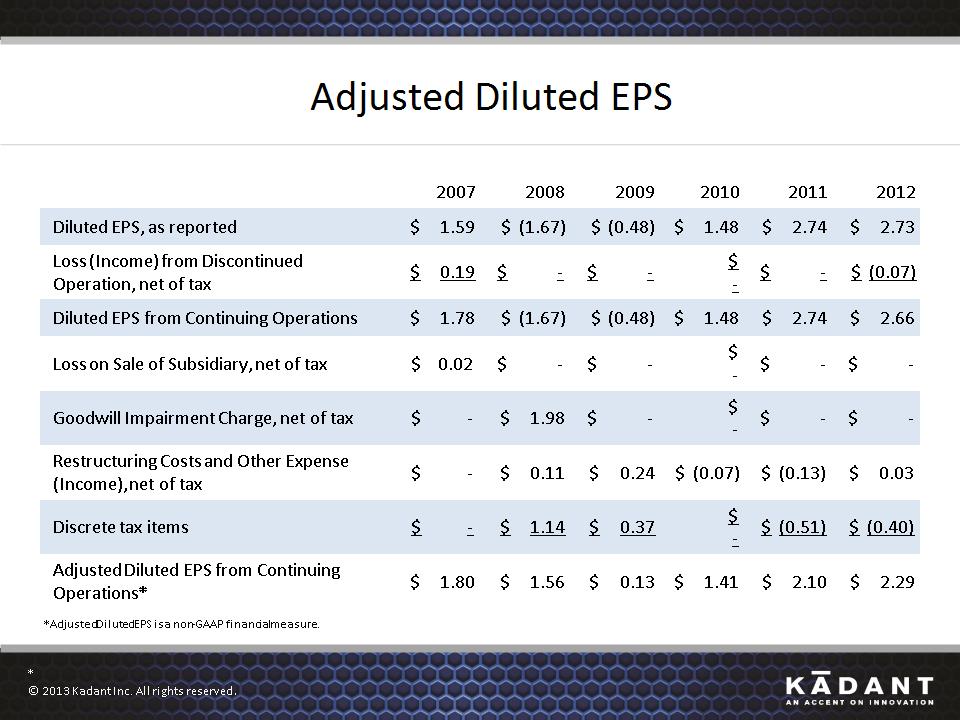
Adjusted Diluted EPS 2007 2008 2009 2010 2011 2012 Diluted EPS, as reported $ 1.59 $ (1.67) $ (0.48) $ 1.48 $ 2.74 $ 2.73 Loss (Income) from Discontinued Operation, net of tax $ 0.19 $ - $ - $ - $ - $ (0.07) Diluted EPS from Continuing Operations $ 1.78 $ (1.67) $ (0.48) $ 1.48 $ 2.74 $ 2.66 Loss on Sale of Subsidiary, net of tax $ 0.02 $ - $ - $ - $ - $ - Goodwill Impairment Charge, net of tax $ - $ 1.98 $ - $ - $ - $ - Restructuring Costs and Other Expense (Income), net of tax $ - $ 0.11 $ 0.24 $ (0.07) $ (0.13) $ 0.03 Discrete tax items $ - $ 1.14 $ 0.37 $ - $ (0.51) $ (0.40) Adjusted Diluted EPS from Continuing Operations* $ 1.80 $ 1.56 $ 0.13 $ 1.41 $ 2.10 $ 2.29 *Adjusted Diluted EPS is a non-GAAP financial measure. * © 2013 Kadant Inc. All rights reserved.
11
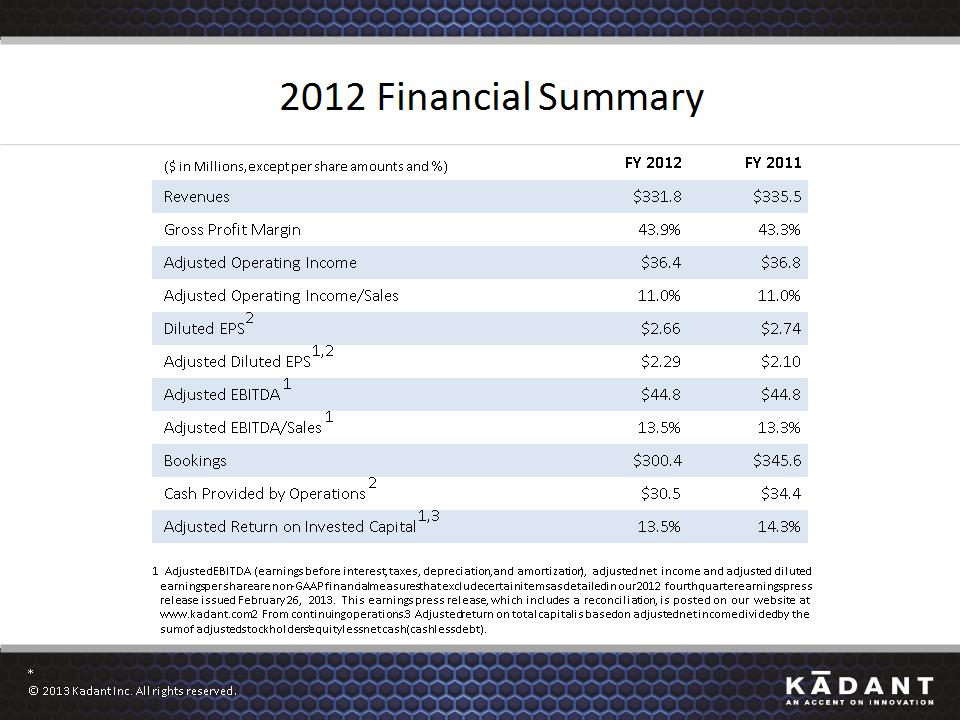
2012 Financial Summary ($ in Millions, except per share amounts and %) FY 2012 FY 2011 Revenues $331.8 $335.5 Gross Profit Margin 43.9% 43.3% Adjusted Operating Income $36.4 $36.8 Adjusted Operating Income/Sales 11.0% 11.0% Diluted EPS2 $2.66 $2.74 Adjusted Diluted EPS1,2 $2.29 $2.10 Adjusted EBITDA1 $44.8 $44.8 Adjusted EBITDA/Sales1 13.5% 13.3% Bookings $300.4 $345.6 Cash Provided by Operations2 $30.5 $34.4 Adjusted Return on Invested Capital1,3 13.5% 14.3% 1 Adjusted EBITDA (earnings before interest, taxes, depreciation, and amortization), adjusted net income and adjusted diluted earnings per share are non-GAAP financial measures that exclude certain items as detailed in our 2012 fourth quarter earnings press release issued February 26, 2013. This earnings press release, which includes a reconciliation, is posted on our website at www.kadant.com. 2 From continuing operations. 3 Adjusted return on total capital is based on adjusted net income divided by the sum of adjusted stockholders’ equity less net cash (cash less debt). * © 2013 Kadant Inc. All rights reserved.
12
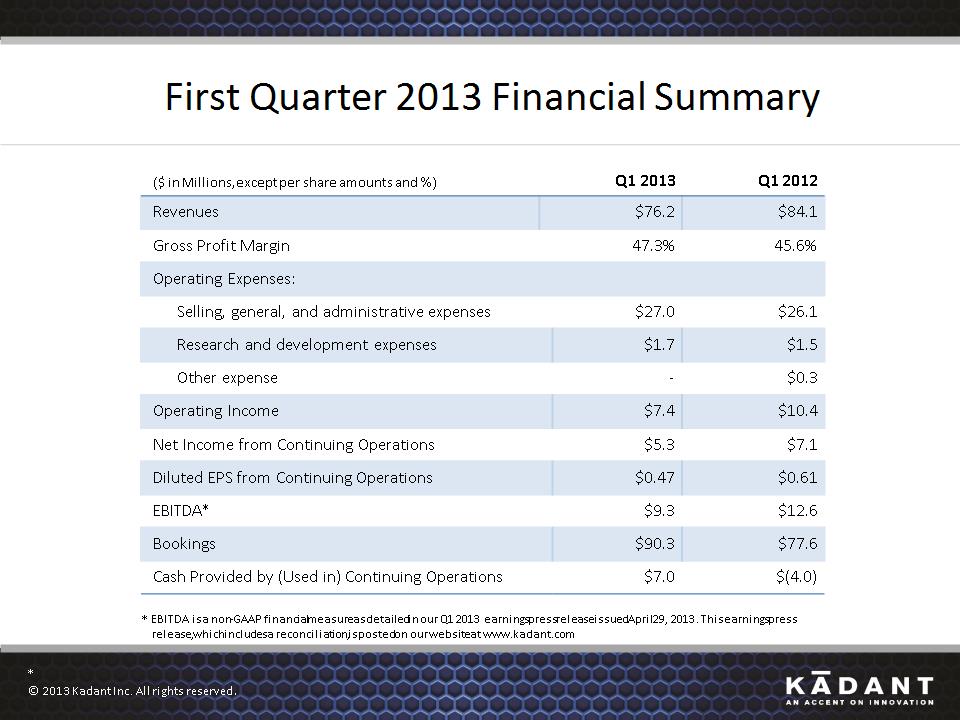
First Quarter 2013 Financial Summary ($ in Millions, except per share amounts and %) Q1 2013 Q1 2013 Q1 2012 Revenues $76.2 $76.2 $84.1 Gross Profit Margin 47.3% 47.3% 45.6% Operating Expenses: Operating Expenses: Operating Expenses: Operating Expenses: Selling, general, and administrative expenses Selling, general, and administrative expenses $27.0 $26.1 Research and development expenses Research and development expenses $1.7 $1.5 Other expense Other expense - $0.3 Operating Income Operating Income $7.4 $10.4 Net Income from Continuing Operations Net Income from Continuing Operations $5.3 $7.1 Diluted EPS from Continuing Operations Diluted EPS from Continuing Operations $0.47 $0.61 EBITDA* EBITDA* $9.3 $12.6 Bookings Bookings $90.3 $77.6 Cash Provided by (Used in) Continuing Operations Cash Provided by (Used in) Continuing Operations $7.0 $(4.0) * EBITDA is a non-GAAP financial measure as detailed in our Q1 2013 earnings press release issued April 29, 2013. This earnings press release, which includes a reconciliation, is posted on our website at www.kadant.com * © 2013 Kadant Inc. All rights reserved.
13
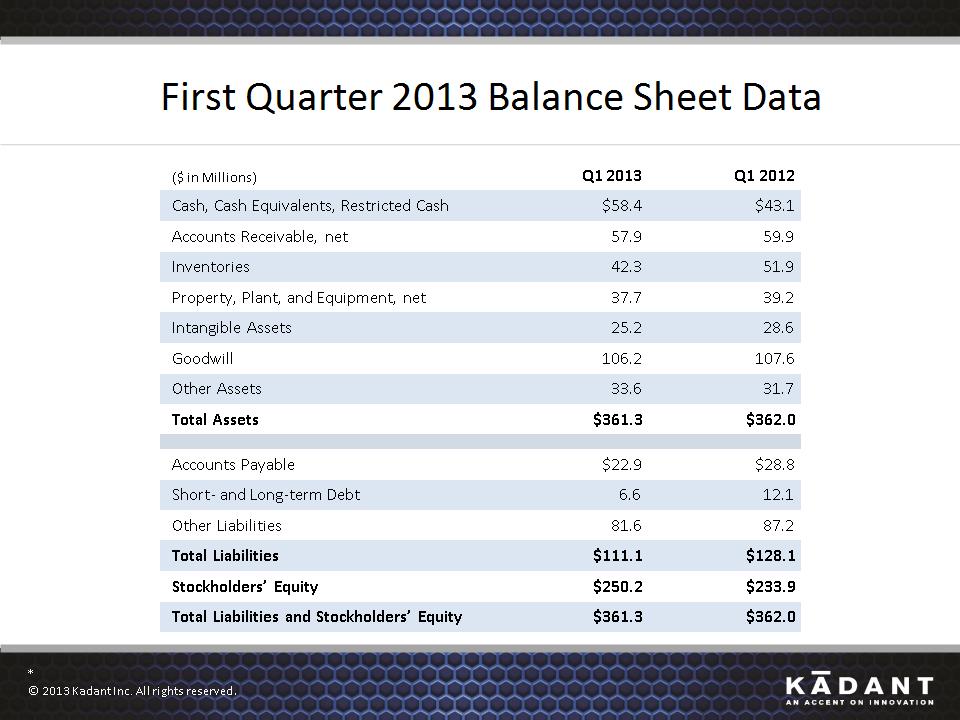
First Quarter 2013 Balance Sheet Data ($ in Millions) Q1 2013 Q1 2012 Cash, Cash Equivalents, Restricted Cash $58.4 $43.1 Accounts Receivable, net 57.9 59.9 Inventories 42.3 51.9 Property, Plant, and Equipment, net 37.7 39.2 Intangible Assets 25.2 28.6 Goodwill 106.2 107.6 Other Assets 33.6 31.7 Total Assets $361.3 $362.0 Accounts Payable $22.9 $28.8 Short- and Long-term Debt 6.6 12.1 Other Liabilities 81.6 87.2 Total Liabilities $111.1 $128.1 Stockholders’ Equity $250.2 $233.9 Total Liabilities and Stockholders’ Equity $361.3 $362.0 * © 2013 Kadant Inc. All rights reserved.
14
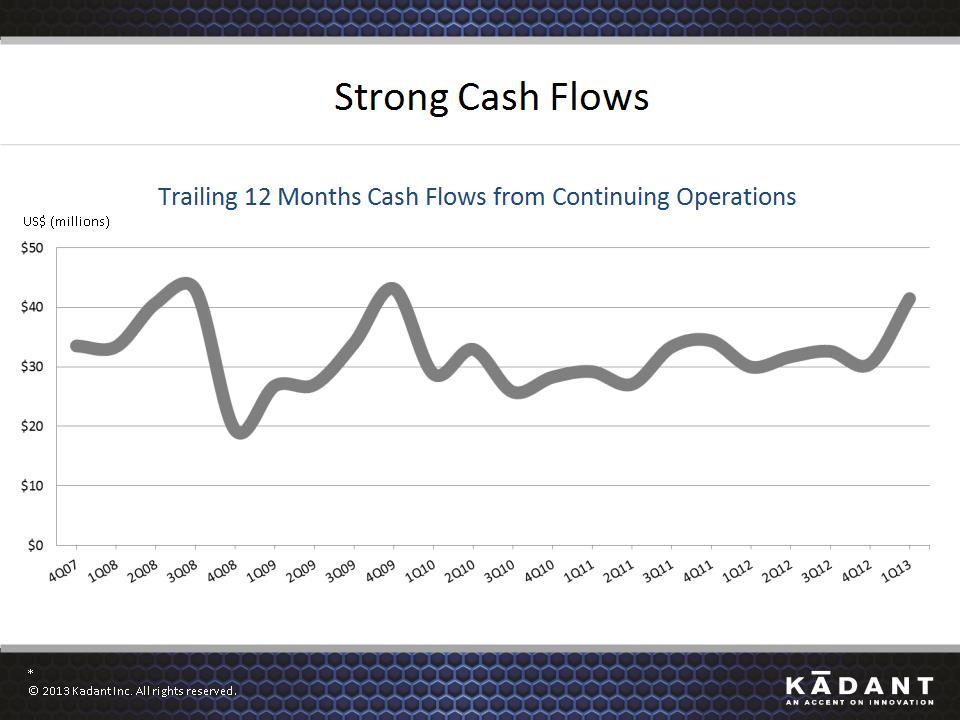
Strong Cash Flows US$ (millions) Trailing 12 Months Cash Flows from Continuing Operations * © 2013 Kadant Inc. All rights reserved.
15
FIVE YEAR FINANCIAL GOALS * © 2013 Kadant Inc. All rights reserved.
16
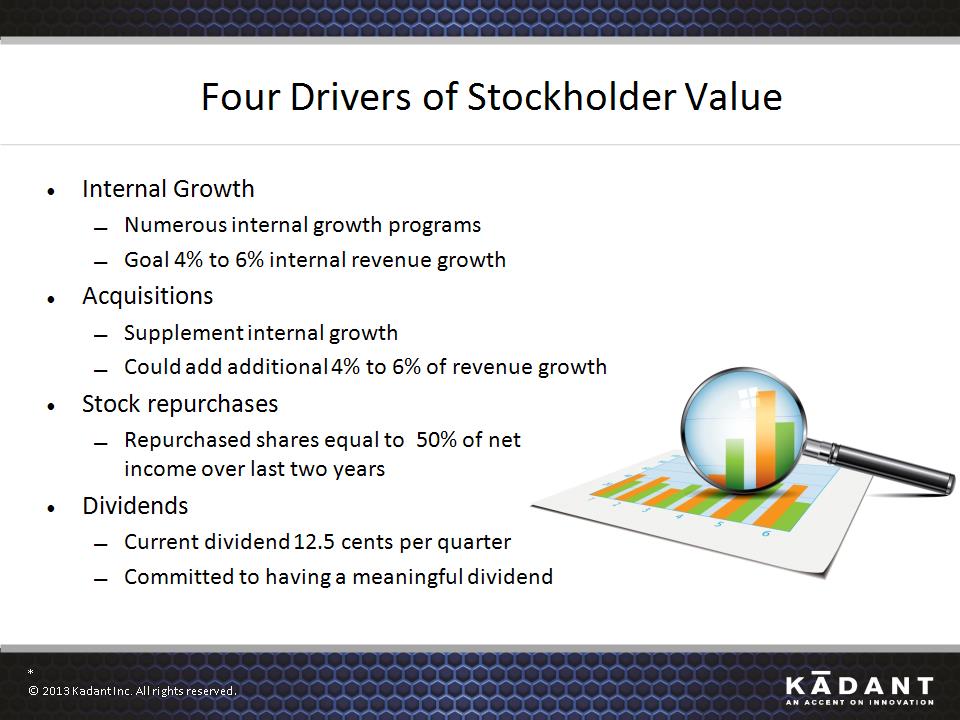
Four Drivers of Stockholder Value Internal Growth Numerous internal growth programs Goal 4% to 6% internal revenue growth Acquisitions Supplement internal growth Could add additional 4% to 6% of revenue growth Stock repurchases Repurchased shares equal to 50% of net income over last two years Dividends Current dividend 12.5 cents per quarter Committed to having a meaningful dividend * © 2013 Kadant Inc. All rights reserved.
17
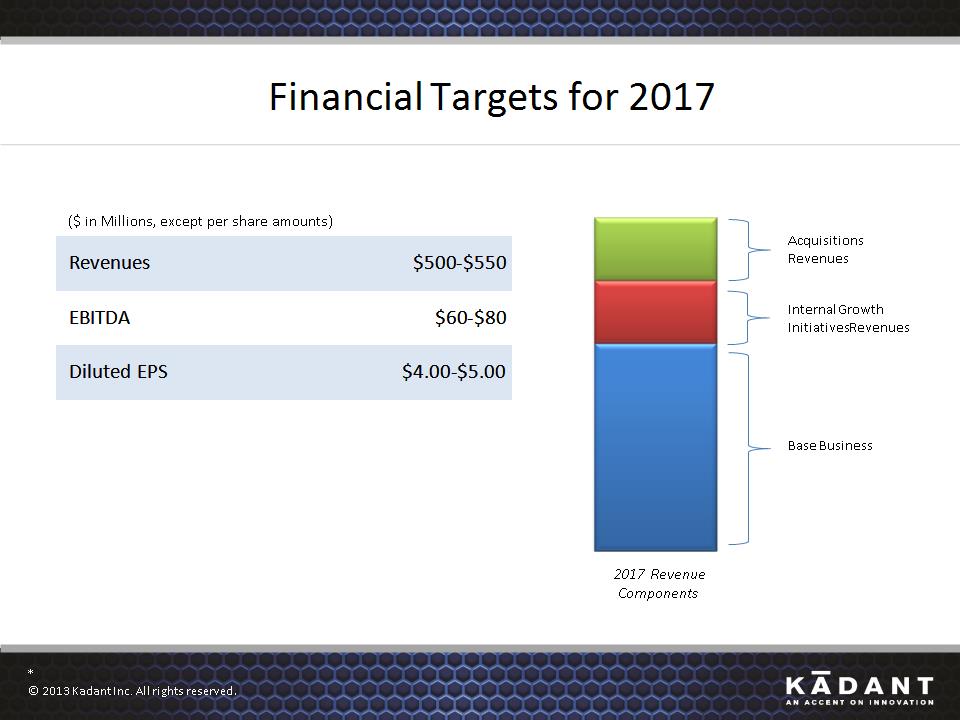
Financial Targets for 2017 Acquisitions Revenues Internal Growth Initiatives Revenues Base Business ($ in Millions, except per share amounts) Revenues $500-$550 EBITDA $60-$80 Diluted EPS $4.00-$5.00 * © 2013 Kadant Inc. All rights reserved. 2017 Revenue Components
18
INTERNAL GROWTH * © 2013 Kadant Inc. All rights reserved.
19
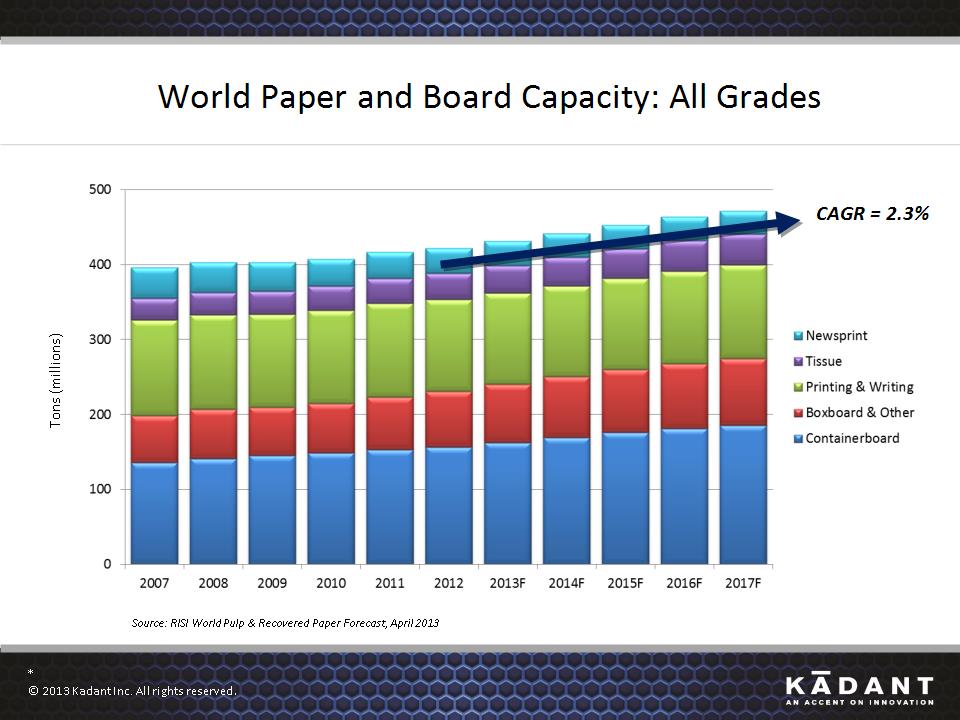
World Paper and Board Capacity: All Grades Tons (millions) Source: RISI World Pulp & Recovered Paper Forecast, April 2013 CAGR = 2.3% * © 2013 Kadant Inc. All rights reserved.
20
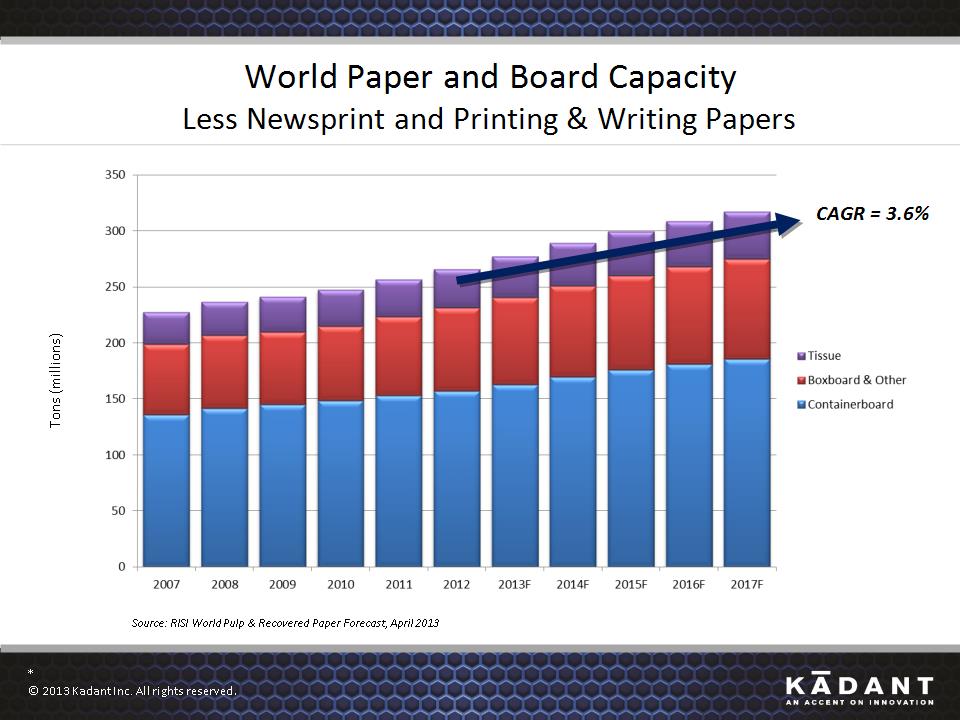
World Paper and Board Capacity Less Newsprint and Printing & Writing Papers Tons (millions) Source: RISI World Pulp & Recovered Paper Forecast, April 2013 CAGR = 3.6% * © 2013 Kadant Inc. All rights reserved.
21
Internal Growth Initiatives Increase presence in emerging markets Grow parts and consumables revenues Focus on higher growth containerboard and tissue grades Introduce technology to new markets Increase market share in low share regions Expand virgin pulp offerings globally * © 2013 Kadant Inc. All rights reserved.
22
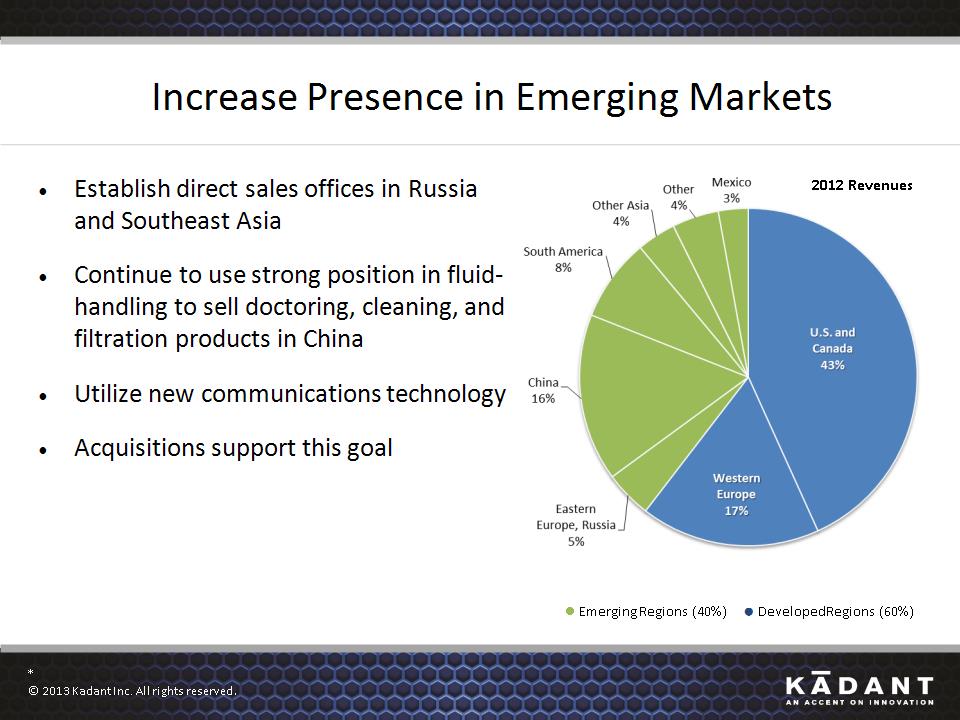
Increase Presence in Emerging Markets Establish direct sales offices in Russia and Southeast Asia Continue to use strong position in fluid-handling to sell doctoring, cleaning, and filtration products in China Utilize new communications technology Acquisitions support this goal ● Emerging Regions (40%) ● Developed Regions (60%) 2012 Revenues * © 2013 Kadant Inc. All rights reserved.
23
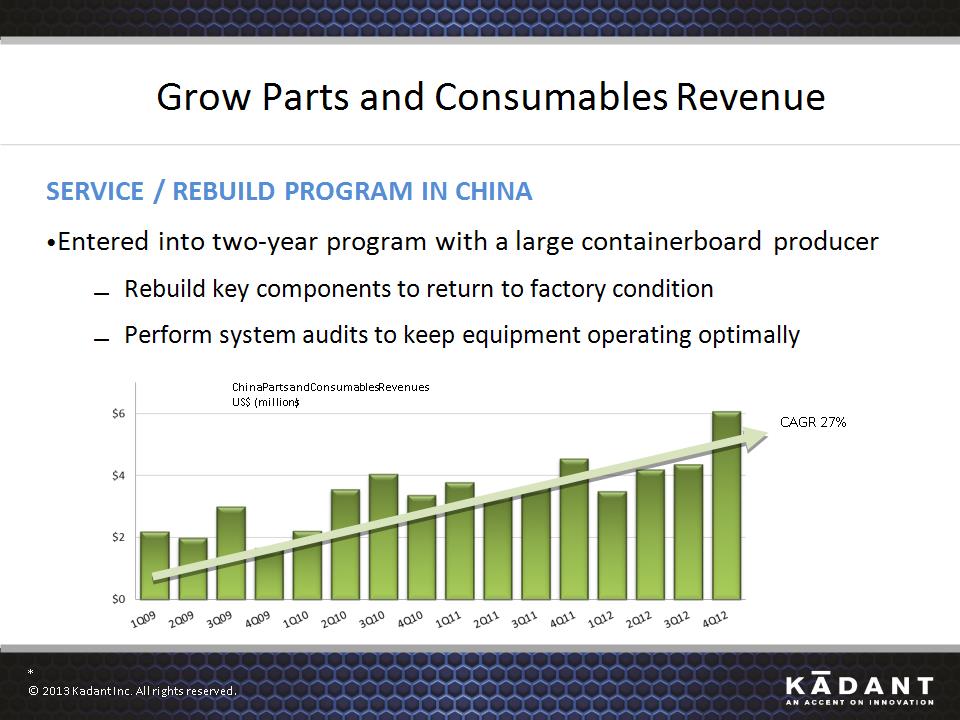
Grow Parts and Consumables Revenue SERVICE / REBUILD PROGRAM IN CHINA Entered into two-year program with a large containerboard producer Rebuild key components to return to factory condition Perform system audits to keep equipment operating optimally China Parts and Consumables Revenues US$ (millions) CAGR 27% * © 2013 Kadant Inc. All rights reserved.
24
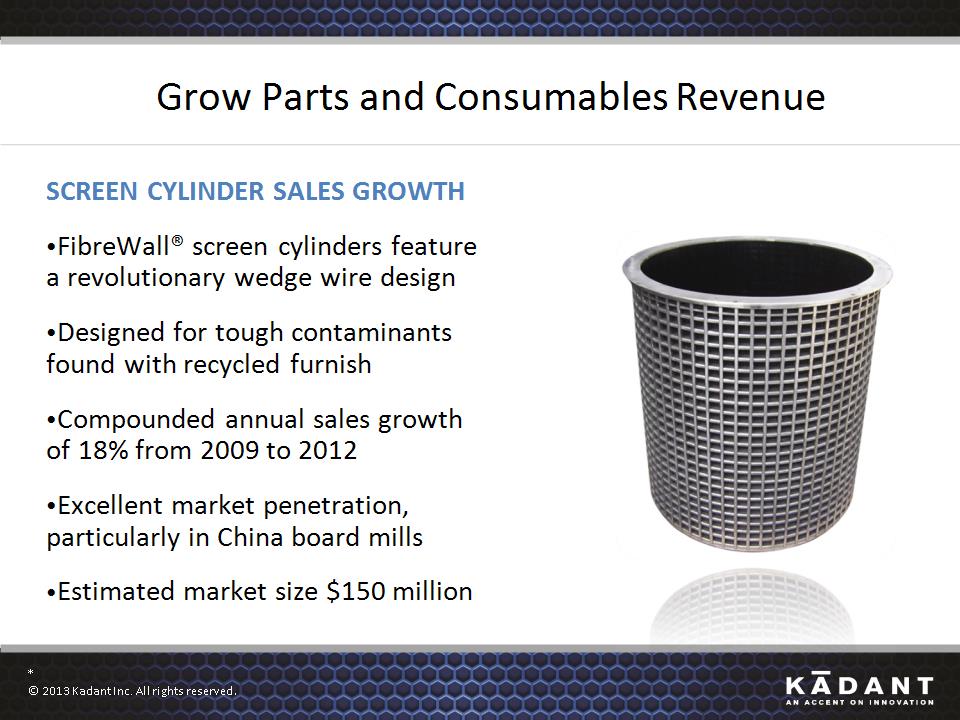
Grow Parts and Consumables Revenue SCREEN CYLINDER SALES GROWTH FibreWall® screen cylinders feature a revolutionary wedge wire design Designed for tough contaminants found with recycled furnish Compounded annual sales growth of 18% from 2009 to 2012 Excellent market penetration, particularly in China board mills Estimated market size $150 million * © 2013 Kadant Inc. All rights reserved.
25

Focus On Higher Growth Paper Grades NANOTECHNOLOGY ENHANCED DOCTOR BLADES Increase parts business and exposure to higher growth grades Patented technology Solves problems of different wear rates of resin and fabric Reduces delamination caused by stickies commonly found with recycled furnish in containerboard grades * © 2013 Kadant Inc. All rights reserved.
26
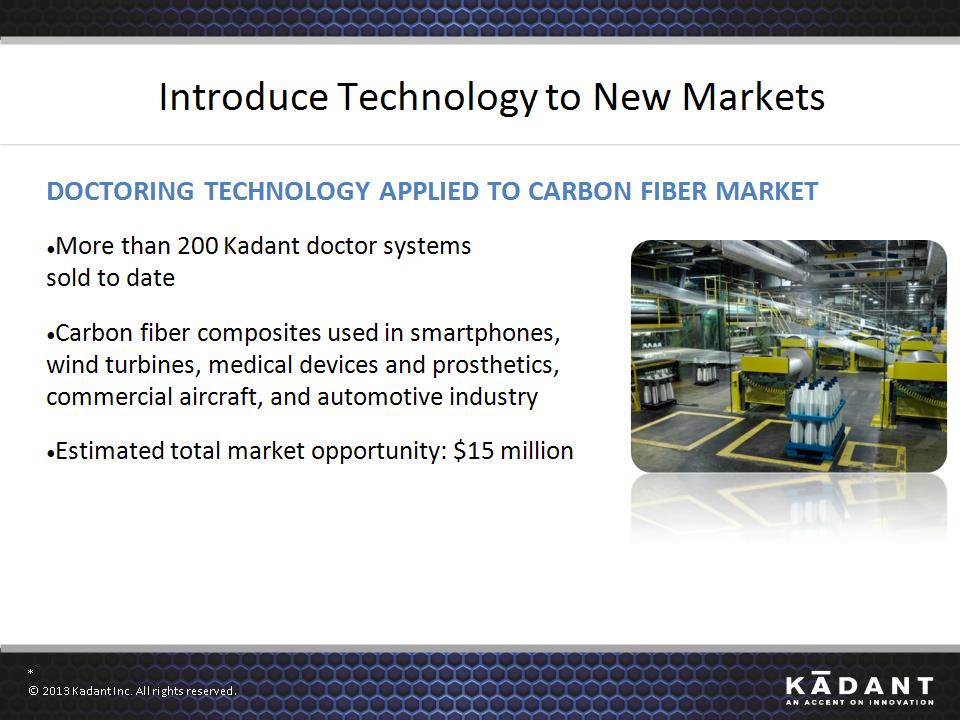
Introduce Technology to New Markets DOCTORING TECHNOLOGY APPLIED TO CARBON FIBER MARKET More than 200 Kadant doctor systems sold to date Carbon fiber composites used in smartphones, wind turbines, medical devices and prosthetics, commercial aircraft, and automotive industry Estimated total market opportunity: $15 million * © 2013 Kadant Inc. All rights reserved.
27
ACQUISITIONS * © 2013 Kadant Inc. All rights reserved.
28
Acquisition Characteristics Focus on premium products with some technology differentiator High aftermarket potential Well-positioned company Adjacent or similar markets Opportunities for synergies Entry into new regions Target investment hurdle: 20% ROTI after three to five years * © 2013 Kadant Inc. All rights reserved.
29
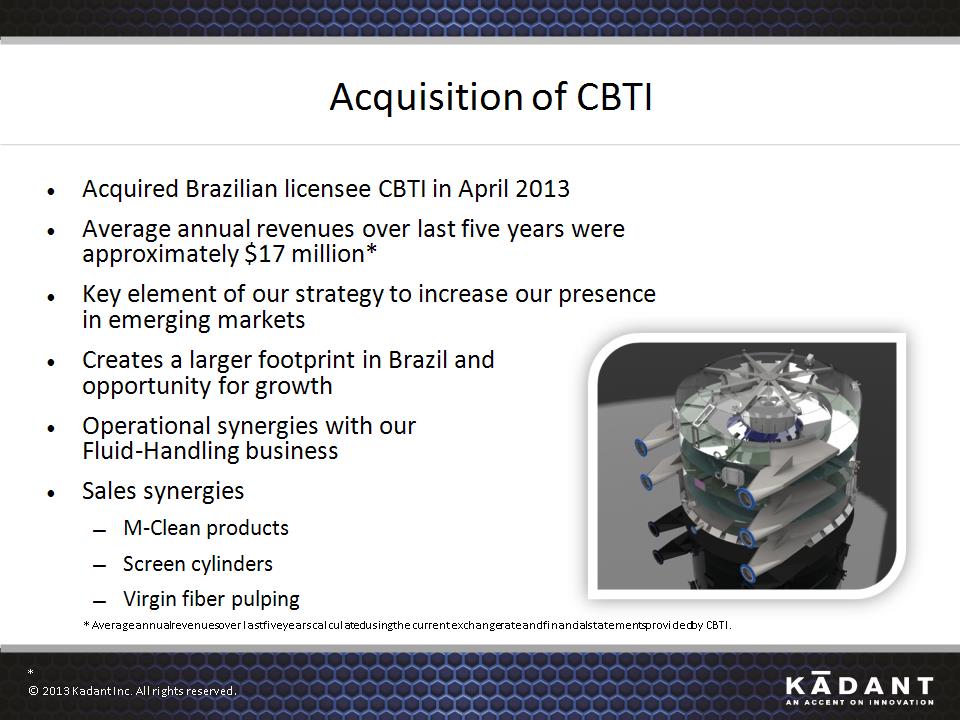
Acquisition of CBTI Acquired Brazilian licensee CBTI in April 2013 Average annual revenues over last five years were approximately $17 million* Key element of our strategy to increase our presence in emerging markets Creates a larger footprint in Brazil and opportunity for growth Operational synergies with our Fluid-Handling business Sales synergies M-Clean products Screen cylinders Virgin fiber pulping * © 2013 Kadant Inc. All rights reserved. * Average annual revenues over last five years calculated using the current exchange rate and financial statements provided by CBTI.
30
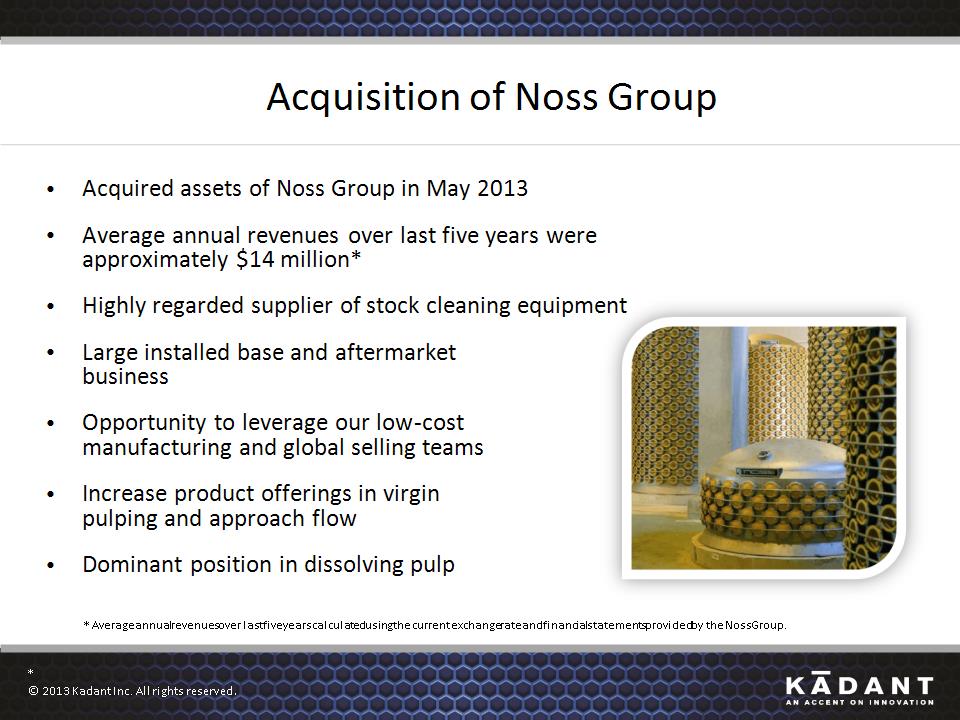
Acquisition of Noss Group Acquired assets of Noss Group in May 2013 Average annual revenues over last five years were approximately $14 million* Highly regarded supplier of stock cleaning equipment Large installed base and aftermarket business Opportunity to leverage our low-cost manufacturing and global selling teams Increase product offerings in virgin pulping and approach flow Dominant position in dissolving pulp * © 2013 Kadant Inc. All rights reserved. * Average annual revenues over last five years calculated using the current exchange rate and financial statements provided by the Noss Group.
31
STOCK REPURCHASES * © 2013 Kadant Inc. All rights reserved.
32
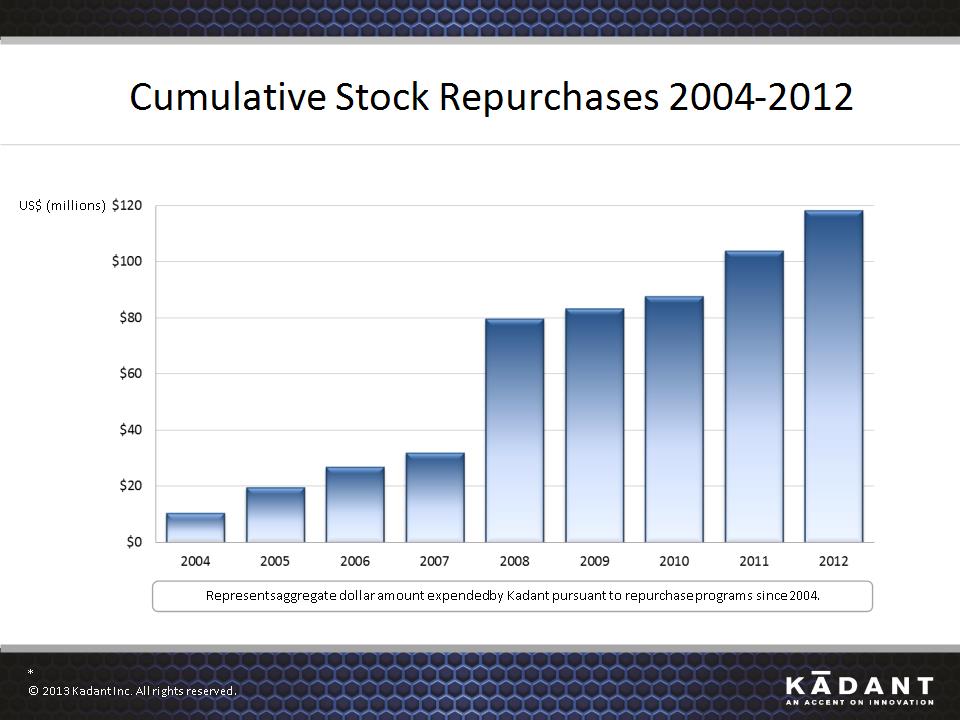
Cumulative Stock Repurchases 2004-2012 US$ (millions) * © 2013 Kadant Inc. All rights reserved. Represents aggregate dollar amount expended by Kadant pursuant to repurchase programs since 2004.
33
Dividends Quarterly dividend of 12.5 cents per share paid in May 2013 Important component of value to stockholders Goal is to have a meaningful dividend * © 2013 Kadant Inc. All rights reserved.
34
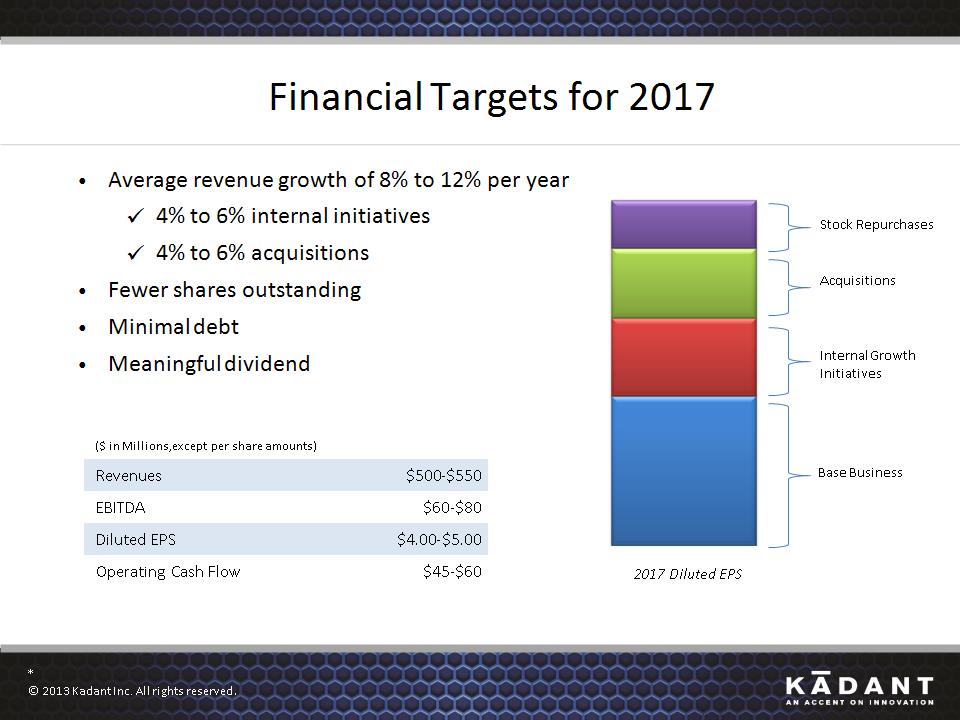
Financial Targets for 2017 ($ in Millions, except per share amounts) ($ in Millions, except per share amounts) Revenues $500-$550 EBITDA $60-$80 Diluted EPS $4.00-$5.00 Operating Cash Flow $45-$60 Acquisitions Internal Growth Initiatives Base Business Stock Repurchases 2017 Diluted EPS Average revenue growth of 8% to 12% per year 4% to 6% internal initiatives 4% to 6% acquisitions Fewer shares outstanding Minimal debt Meaningful dividend * © 2013 Kadant Inc. All rights reserved.
35
Questions & Answers To ask a question, please call 866-515-2913 within the U.S. or +1-617-399-5127 outside the U.S. and reference 83375884. Please mute the audio on your computer. * © 2013 Kadant Inc. All rights reserved.
36
Annual Meeting of Stockholders May 22, 2013 Westford, Massachusetts
37