Annual Meeting of Stockholders May 20, 2014 Westford, Massachusetts © 2014 Kadant Inc. All rights reserved.
ANNUAL MEETING OF STOCKHOLDERS William A. RainvilleChairman of the Board *© 2014 Kadant Inc. All rights reserved.
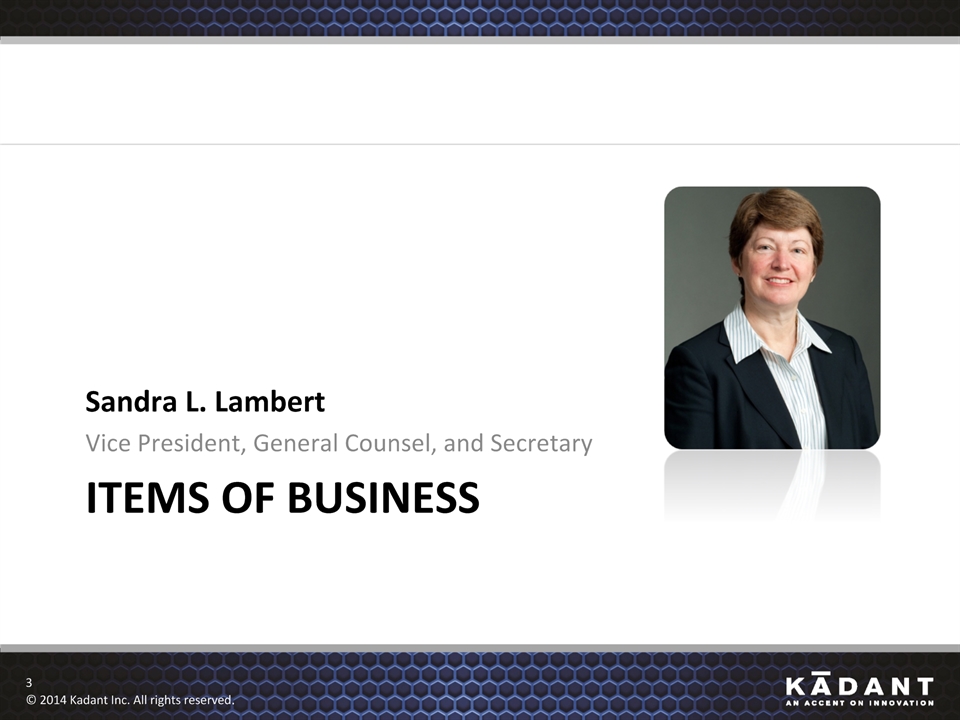
ITEMS OF BUSINESS Sandra L. LambertVice President, General Counsel, and Secretary *© 2014 Kadant Inc. All rights reserved.
Safe Harbor and Disclaimers The following constitutes a “Safe Harbor” statement under the Private Securities Litigation Reform Act of 1995: Our presentation today and these slides contain forward-looking statements that involve a number of risks and uncertainties, including forward-looking statements about our expected future financial and operating performance, our market opportunities and demand for our products, our views of the trends in the industries we serve, and our capabilities and technological position in the market. Important factors that could cause actual results to differ materially from those indicated by such statements are set forth under the heading “Risk Factors” in Kadant’s quarterly report on Form 10-Q for the period ended March 29, 2014. These include risks and uncertainties relating to our dependence on process industries; significance of sales and operation of manufacturing facilities in China; oriented strand board market and levels of residential construction activity; commodity and component price increases or shortages; dependence on certain suppliers; international sales and operations; our acquisition strategy; our internal growth strategy; fluctuations in currency exchange rates; competition; soundness of suppliers and customers; our effective tax rate; future restructurings; soundness of financial institutions; our debt obligations; restrictions in our credit agreement; reliance on third-party research; protection of patents and proprietary rights; failure of our information systems or breaches of data security; fluctuations in our share price; and anti-takeover provisions. We undertake no obligation to publicly update any forward-looking statement, whether as a result of new information, future events, or otherwise.The following slides and related commentary address certain current goals and targets for Kadant. There can be no assurance that these goals and targets will be achieved and, in addition to the general risks and uncertainties of our business, they are based on a number of assumptions that may or may not prove accurate or achievable. These assumptions include our ability to identify and complete acquisitions that have the acquisition characteristics we desire and achieve the intended financial metrics, our ability and willingness to continue to pay dividends consistent with our recent practice, our ability to effect open market stock repurchases and our ability to implement our internal growth initiatives successfully and achieve the goals of such initiatives. Additionally, these goals and targets may change at any time and we undertake no obligations to update them. *© 2014 Kadant Inc. All rights reserved.
Use of Non-GAAP Financial Measures *© 2014 Kadant Inc. All rights reserved. Adjusted net income, adjusted diluted earnings per share (EPS), adjusted operating income, and adjusted EBITDA are non-GAAP financial measures. These non-GAAP financial measures exclude items that are not indicative of our normal operating results and are not comparable to other periods, which may have differing levels of acquired profit in inventory and backlog, restructuring costs, other expense (income), or discrete tax items or none at all. We provide these non-GAAP measures to give investors additional insight into our annual operating performance, especially when compared to periods in which such items had greater or lesser effect or no effect. Non-GAAP financial measures are not meant to be considered superior to or a substitute for the results of operations prepared in accordance with generally accepted accounting principles (GAAP). In addition, the non-GAAP financial measures have limitations associated with their use as compared to the most directly comparable GAAP measures, in that they may be different from, and therefore not comparable to, similar measures used by other companies. We believe that the inclusion of such measures helps investors to gain an understanding of our underlying operating performance and future prospects, consistent with how management measures and forecasts our performance, especially when comparing such results to previous periods or forecasts and to the performance of our competitors. Such measures are also used by us in our financial and operating decision-making and for compensation purposes. We also believe this information is responsive to investors’ requests and gives them an additional measure of our performance.
Items of Business PROPOSAL 1Elect two directors constituting the entire class of directors to be elected for a three-year term expiring in May 2017Dr. John M. AlbertineMr. Thomas C. Leonard *© 2014 Kadant Inc. All rights reserved.
Items of Business (cont.) PROPOSAL 2Non-binding advisory vote on executive compensationResolved, that the compensation paid to our company’s named executive officers, as disclosed pursuant to the compensation disclosure rules of the Securities and Exchange Commission, including the compensation discussion and analysis, the compensation tables, and any related material disclosed in our proxy statement, is hereby approved. *© 2014 Kadant Inc. All rights reserved.
Items of Business (cont.) PROPOSAL 3Amendments to our 2006 equity incentive plan to increase the shares available for issuance and to extend the plan’s term 10 years *© 2014 Kadant Inc. All rights reserved.
Items of Business (cont.) PROPOSAL 4Ratify the selection of KPMG LLP as our independent registered public accounting firm for FY 2014 *© 2014 Kadant Inc. All rights reserved.
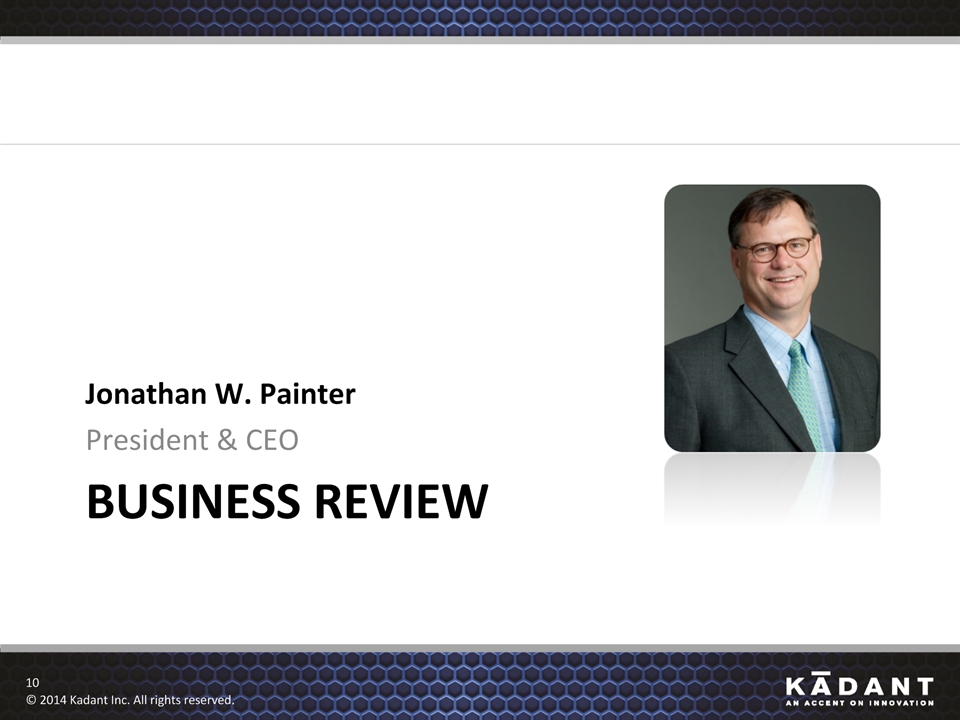
BUSINESS REVIEW Jonathan W. PainterPresident & CEO *© 2014 Kadant Inc. All rights reserved.
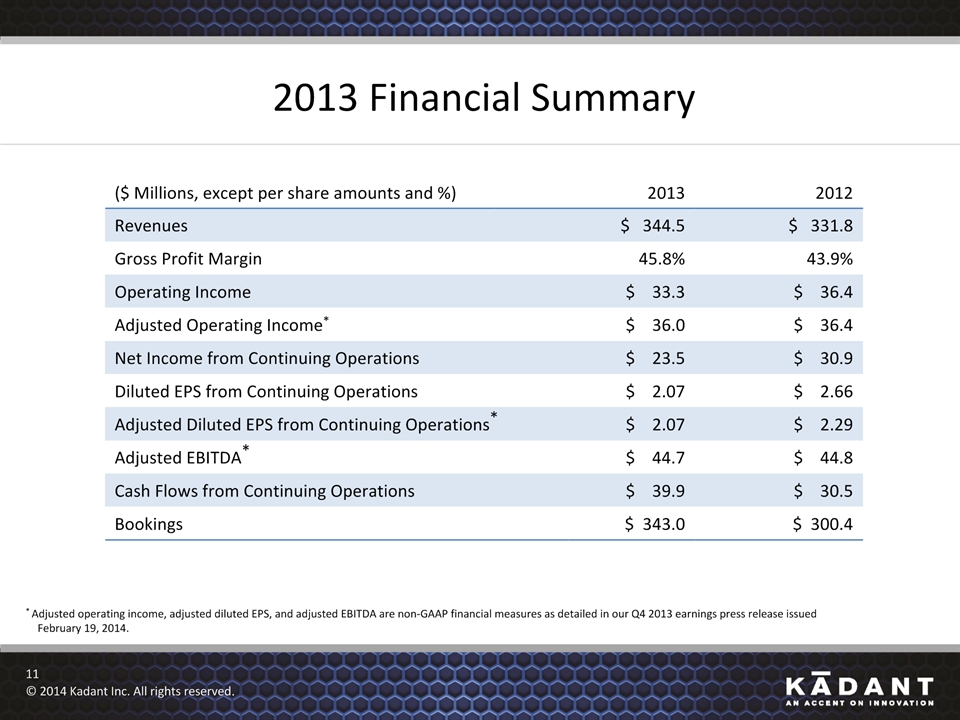
2013 Financial Summary * Adjusted operating income, adjusted diluted EPS, and adjusted EBITDA are non-GAAP financial measures as detailed in our Q4 2013 earnings press release issued February 19, 2014. ($ Millions, except per share amounts and %) 2013 2013 2012 Revenues $ 344.5 $ 344.5 $ 331.8 Gross Profit Margin 45.8% 45.8% 43.9% Operating Income Operating Income $ 33.3 $ 36.4 Adjusted Operating Income* Adjusted Operating Income* $ 36.0 $ 36.4 Net Income from Continuing Operations Net Income from Continuing Operations $ 23.5 $ 30.9 Diluted EPS from Continuing Operations Diluted EPS from Continuing Operations $ 2.07 $ 2.66 Adjusted Diluted EPS from Continuing Operations* Adjusted Diluted EPS from Continuing Operations* $ 2.07 $ 2.29 Adjusted EBITDA* Adjusted EBITDA* $ 44.7 $ 44.8 Cash Flows from Continuing Operations Cash Flows from Continuing Operations $ 39.9 $ 30.5 Bookings Bookings $ 343.0 $ 300.4 *© 2014 Kadant Inc. All rights reserved.
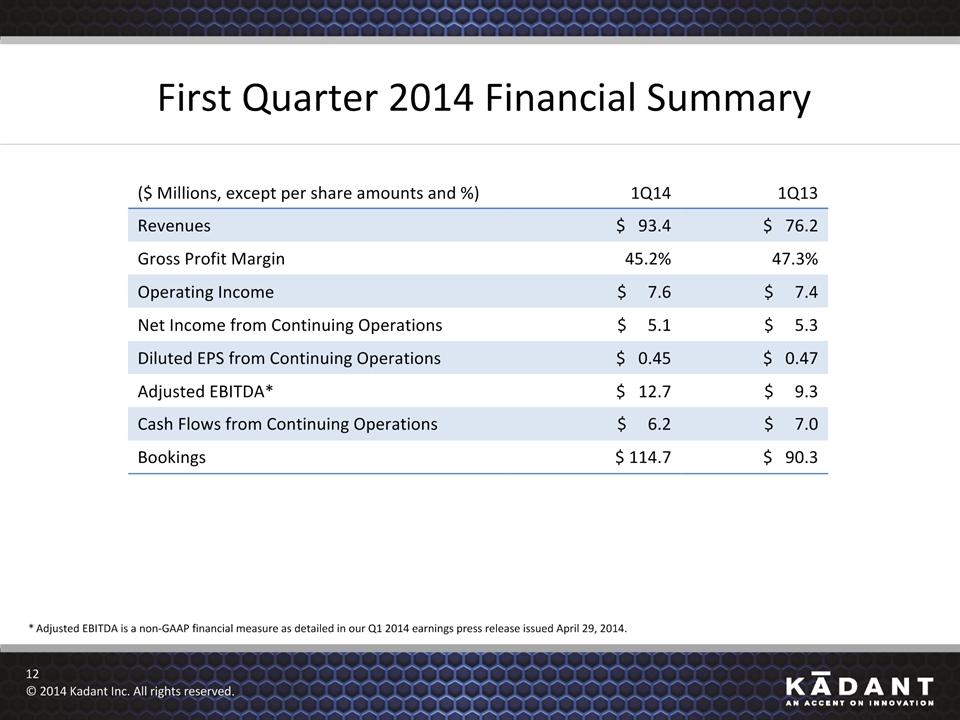
First Quarter 2014 Financial Summary ($ Millions, except per share amounts and %) 1Q14 1Q13 Revenues $ 93.4 $ 76.2 Gross Profit Margin 45.2% 47.3% Operating Income $ 7.6 $ 7.4 Net Income from Continuing Operations $ 5.1 $ 5.3 Diluted EPS from Continuing Operations $ 0.45 $ 0.47 Adjusted EBITDA* $ 12.7 $ 9.3 Cash Flows from Continuing Operations $ 6.2 $ 7.0 Bookings $ 114.7 $ 90.3 * Adjusted EBITDA is a non-GAAP financial measure as detailed in our Q1 2014 earnings press release issued April 29, 2014. *© 2014 Kadant Inc. All rights reserved.
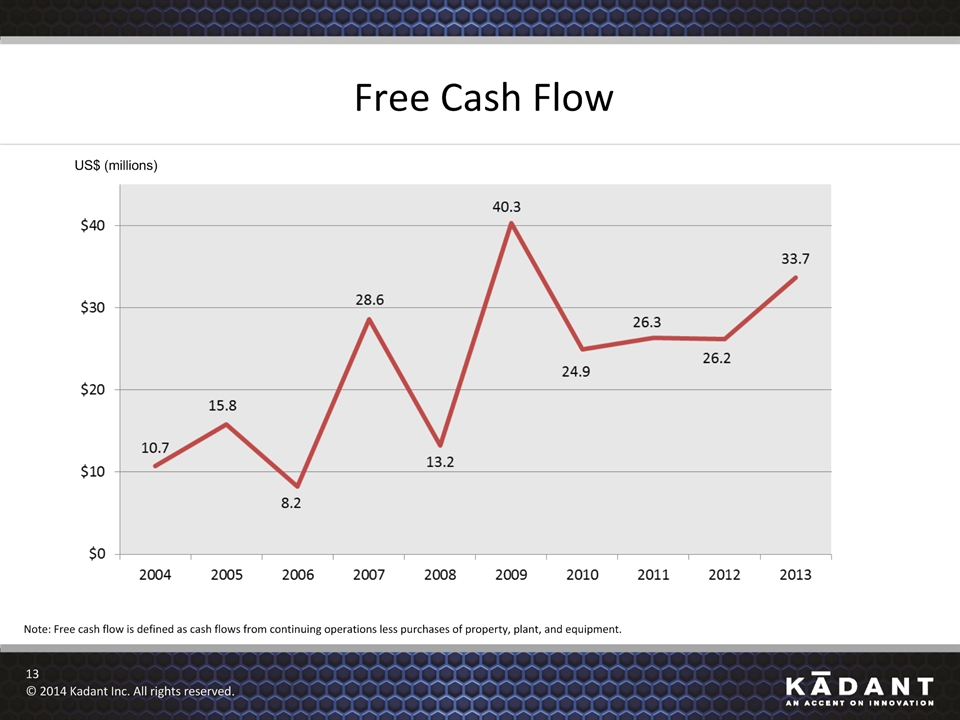
Free Cash Flow Note: Free cash flow is defined as cash flows from continuing operations less purchases of property, plant, and equipment. US$ (millions) *© 2014 Kadant Inc. All rights reserved.
2014 GROWTH INITIATIVES Maximizing Value Through Innovation *© 2014 Kadant Inc. All rights reserved.
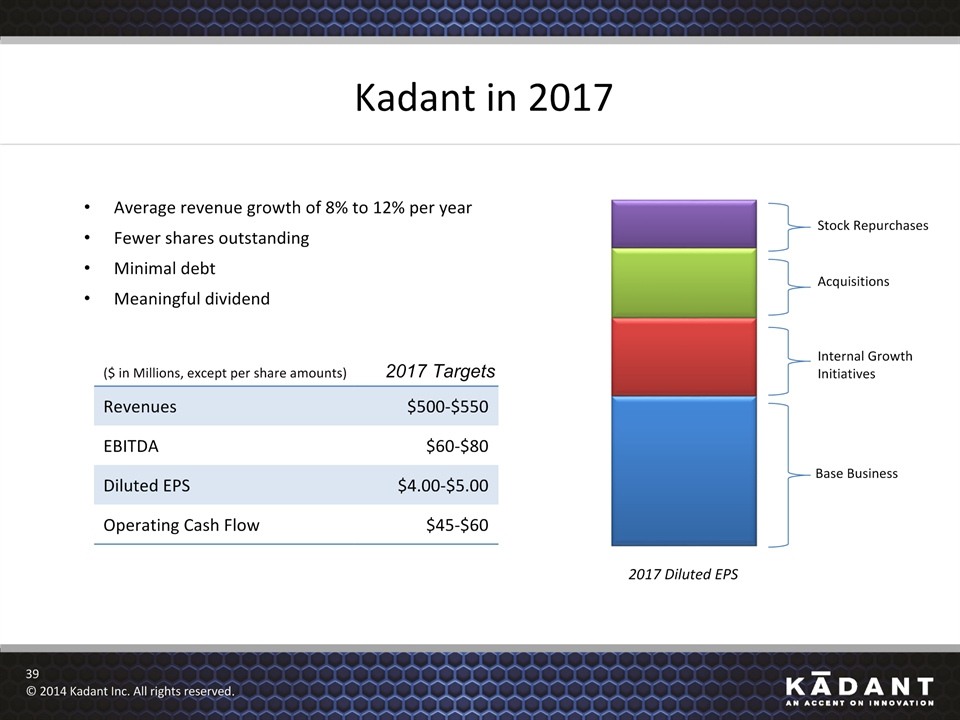
A Look Back at Our Financial Targets Set in 2013(Targets for 2017) ($ in Millions, except per share amounts) ($ in Millions, except per share amounts) Revenues $500-$550 EBITDA $60-$80 Diluted EPS $4.00-$5.00 Operating Cash Flow $45-$60 Acquisitions Internal Growth Initiatives Base Business Stock Repurchases 2017 Diluted EPS Average revenue growth of 8% to 12% per year4% to 6% internal initiatives4% to 6% acquisitionsFewer shares outstandingMinimal debtMeaningful dividend *© 2014 Kadant Inc. All rights reserved. 2017 Targets
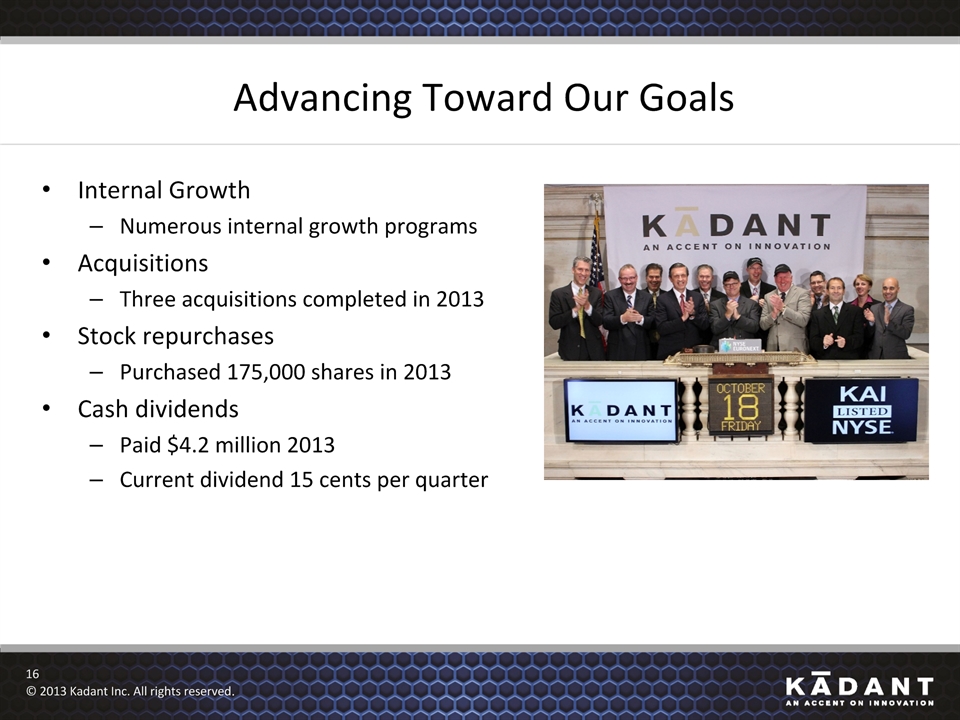
Advancing Toward Our Goals Internal GrowthNumerous internal growth programsAcquisitionsThree acquisitions completed in 2013Stock repurchasesPurchased 175,000 shares in 2013Cash dividends Paid $4.2 million 2013Current dividend 15 cents per quarter *© 2013 Kadant Inc. All rights reserved.
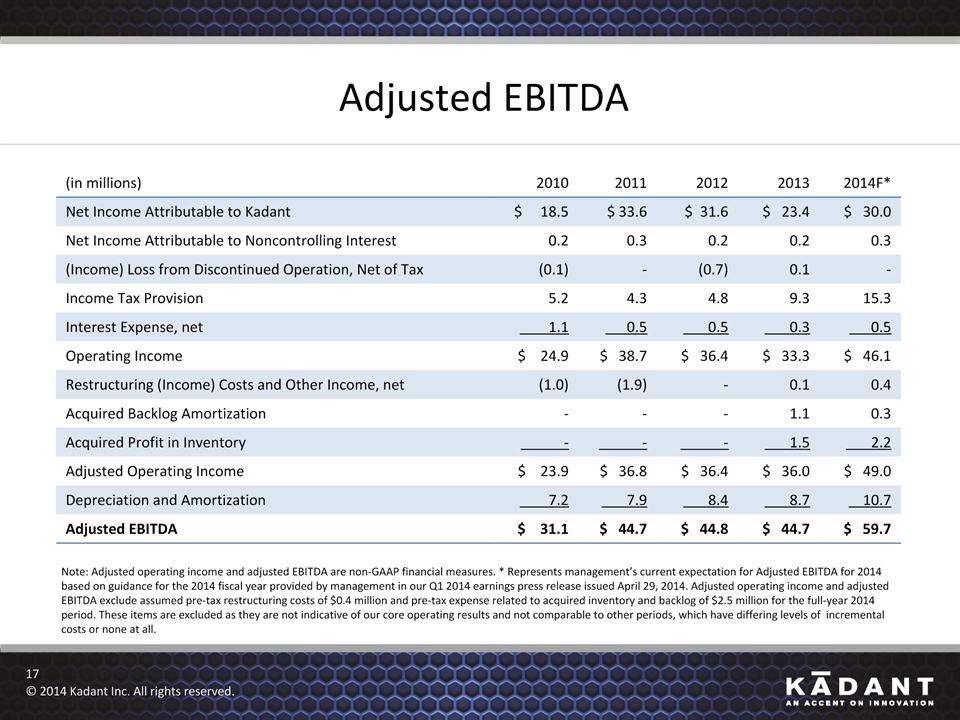
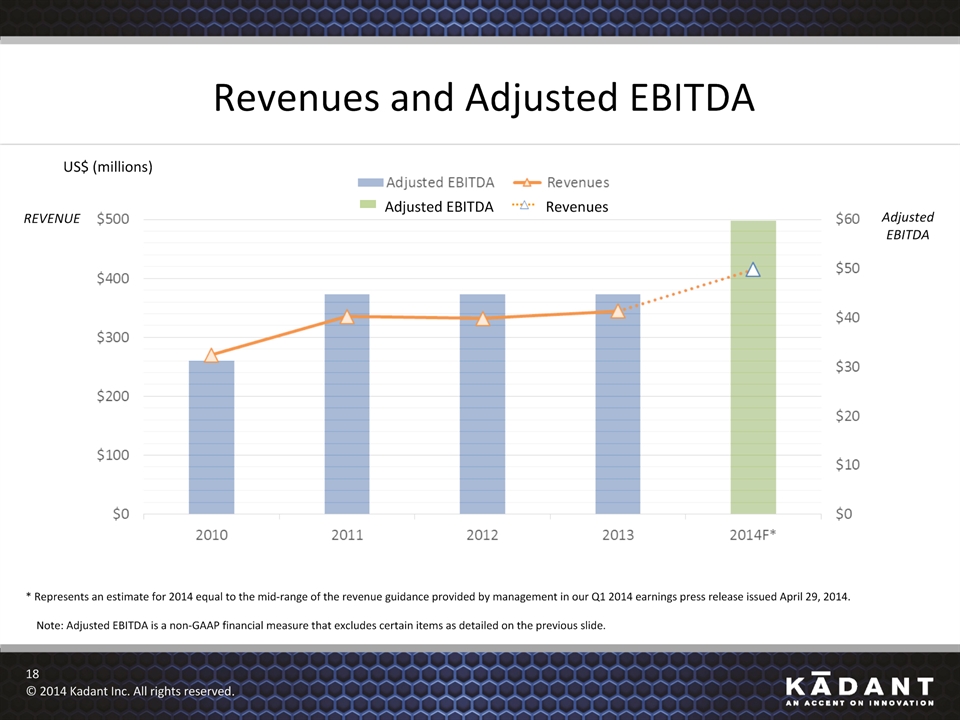
Adjusted EBITDA (in millions) 2010 2011 2012 2013 2014F* Net Income Attributable to Kadant $ 18.5 $ 33.6 $ 31.6 $ 23.4 $ 30.0 Net Income Attributable to Noncontrolling Interest 0.2 0.3 0.2 0.2 0.3 (Income) Loss from Discontinued Operation, Net of Tax (0.1) - (0.7) 0.1 - Income Tax Provision 5.2 4.3 4.8 9.3 15.3 Interest Expense, net 1.1 0.5 0.5 0.3 0.5 Operating Income $ 24.9 $ 38.7 $ 36.4 $ 33.3 $ 46.1 Restructuring (Income) Costs and Other Income, net (1.0) (1.9) - 0.1 0.4 Acquired Backlog Amortization - - - 1.1 0.3 Acquired Profit in Inventory - - - 1.5 2.2 Adjusted Operating Income $ 23.9 $ 36.8 $ 36.4 $ 36.0 $ 49.0 Depreciation and Amortization 7.2 �� 7.9 8.4 8.7 10.7 Adjusted EBITDA $ 31.1 $ 44.7 $ 44.8 $ 44.7 $ 59.7 Note: Adjusted operating income and adjusted EBITDA are non-GAAP financial measures. * Represents management’s current expectation for Adjusted EBITDA for 2014 based on guidance for the 2014 fiscal year provided by management in our Q1 2014 earnings press release issued April 29, 2014. Adjusted operating income and adjusted EBITDA exclude assumed pre-tax restructuring costs of $0.4 million and pre-tax expense related to acquired inventory and backlog of $2.5 million for the full-year 2014 period. These items are excluded as they are not indicative of our core operating results and not comparable to other periods, which have differing levels of incremental costs or none at all. *© 2014 Kadant Inc. All rights reserved.
Revenues and Adjusted EBITDA US$ (millions) * Represents an estimate for 2014 equal to the mid-range of the revenue guidance provided by management in our Q1 2014 earnings press release issued April 29, 2014. Note: Adjusted EBITDA is a non-GAAP financial measure that excludes certain items as detailed on the previous slide. *© 2014 Kadant Inc. All rights reserved. REVENUE Adjusted EBITDA Adjusted EBITDA Revenues
Major Growth Initiatives Grow our parts and consumables businessDevelop innovative products and technologiesPursue new applications for our products in other industriesAcquire complementary businesses *© 2014 Kadant Inc. All rights reserved.
Growing Our Parts and Consumables Business US$ (millions) Parts and Consumables Bookings and Revenues *© 2014 Kadant Inc. All rights reserved.
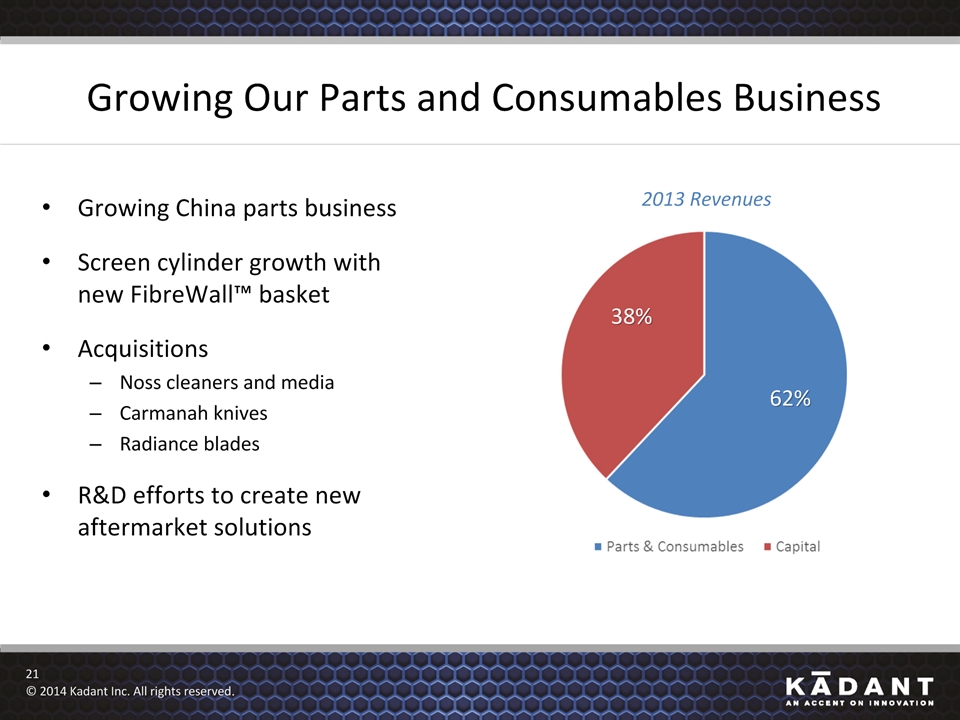
Growing Our Parts and Consumables Business Growing China parts businessScreen cylinder growth with new FibreWall™ basketAcquisitionsNoss cleaners and mediaCarmanah knivesRadiance bladesR&D efforts to create new aftermarket solutions *© 2014 Kadant Inc. All rights reserved. 2013 Revenues 62% 38%
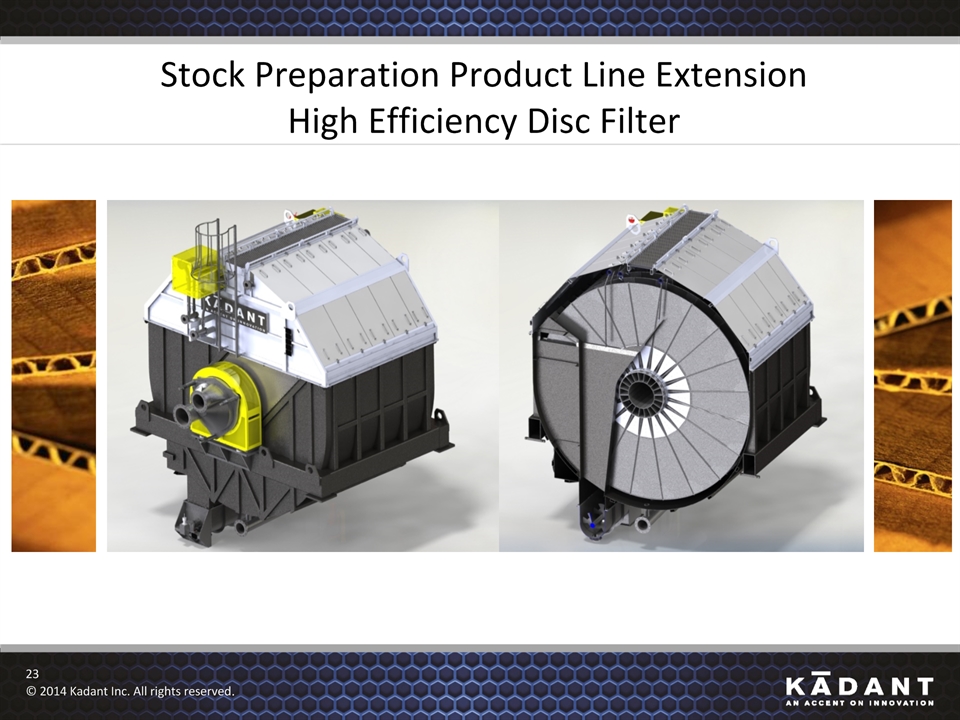
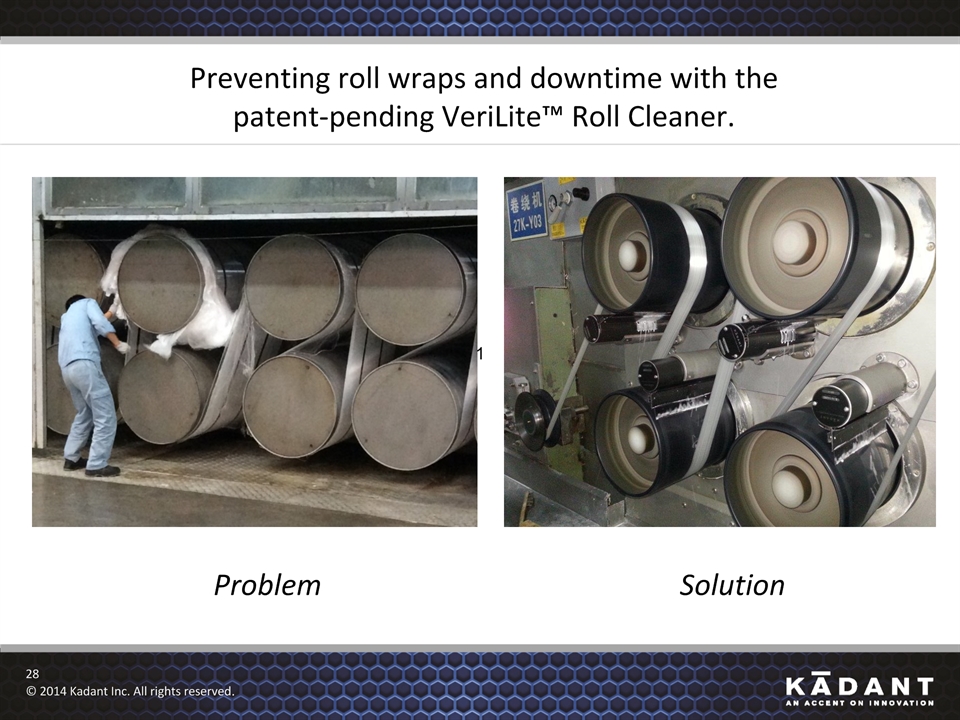
Product Development Filling out our core product lines High-efficiency disc filterHigh-capacity, low-energy drum pulperExtended life blades for tissue and packagingInnovating for new marketsThermoMax™ steam system for high-speed box plantsVeriLite™ and VeriKleen™ roll cleaning assemblies *© 2014 Kadant Inc. All rights reserved.
Stock Preparation Product Line ExtensionHigh Efficiency Disc Filter *© 2014 Kadant Inc. All rights reserved.
Stock Preparation Product Line ExtensionHigh Capacity, Low Energy Drum Pulper *© 2014 Kadant Inc. All rights reserved.
Extended Life Blades for Tissue and Packaging *© 2014 Kadant Inc. All rights reserved.
ThermoMax™ steam system for high-speed corrugated machines. *© 2014 Kadant Inc. All rights reserved.
New Market Development Carbon and synthetic fibersOil & GasSemiconductorFood & BeverageBio-energy / Municipal waste *© 2014 Kadant Inc. All rights reserved.
Preventing roll wraps and downtime with the patent-pending VeriLite™ Roll Cleaner. *© 2014 Kadant Inc. All rights reserved. Problem Solution 1
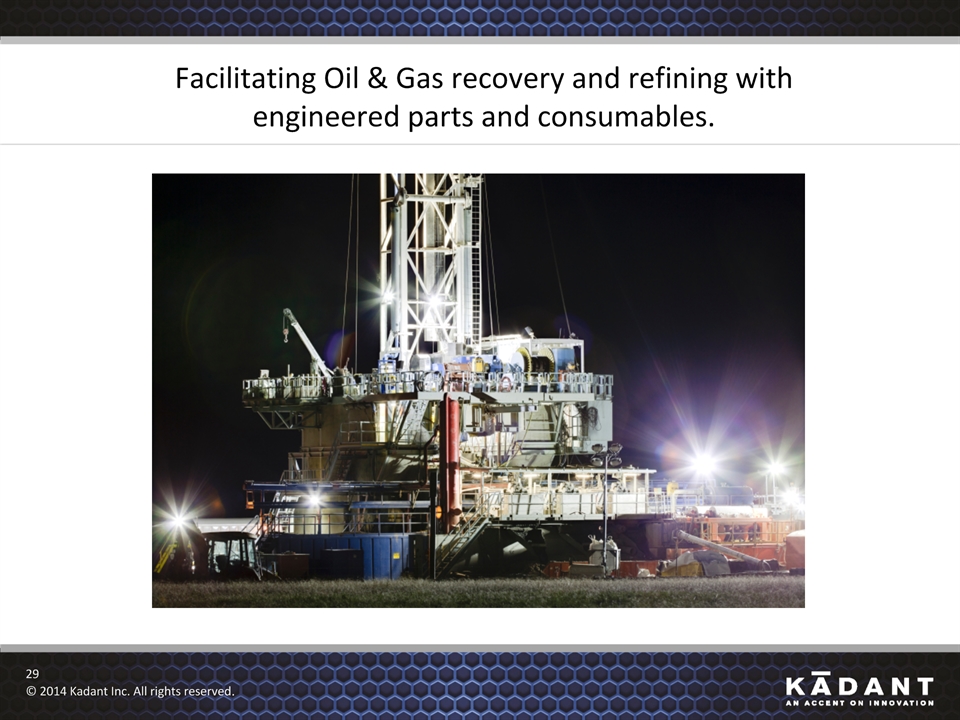
Facilitating Oil & Gas recovery and refining with engineered parts and consumables. *© 2014 Kadant Inc. All rights reserved.
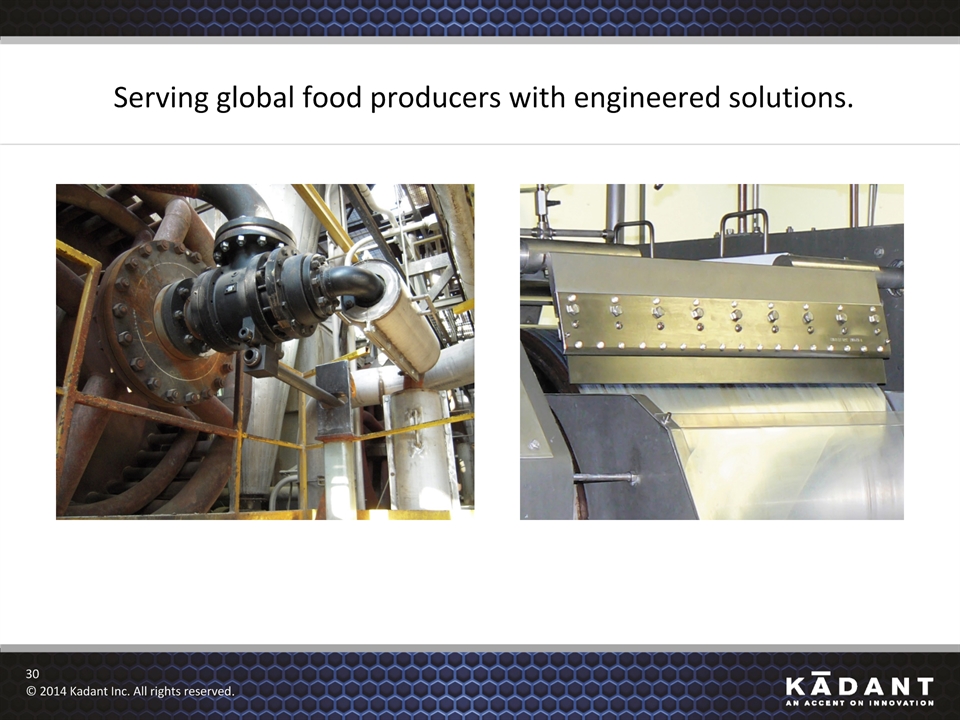
Serving global food producers with engineered solutions. *© 2014 Kadant Inc. All rights reserved.
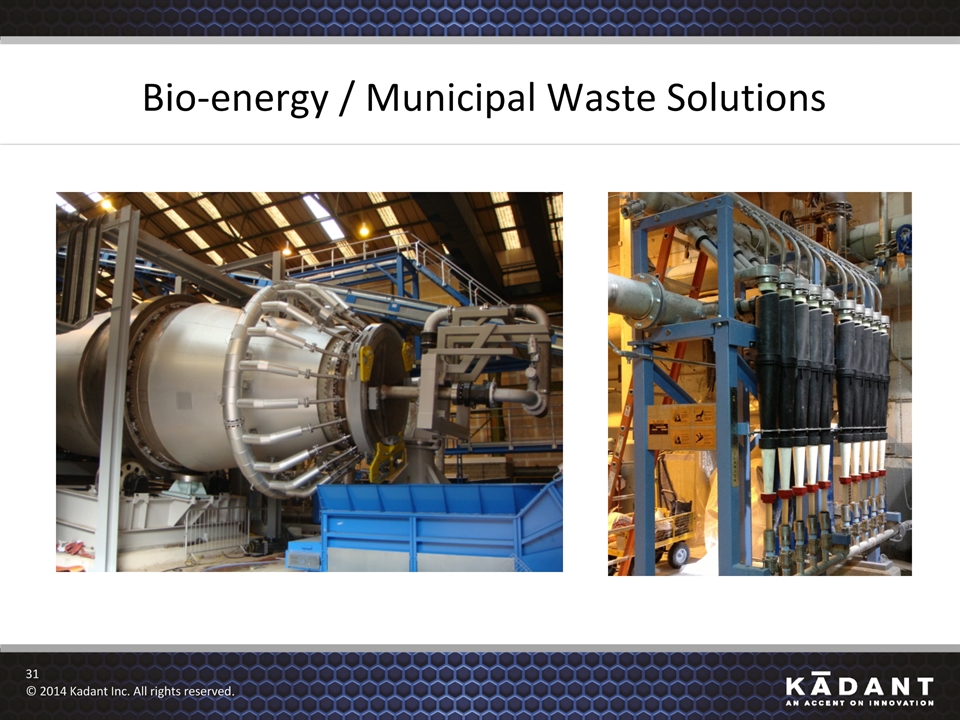
Bio-energy / Municipal Waste Solutions *© 2014 Kadant Inc. All rights reserved.
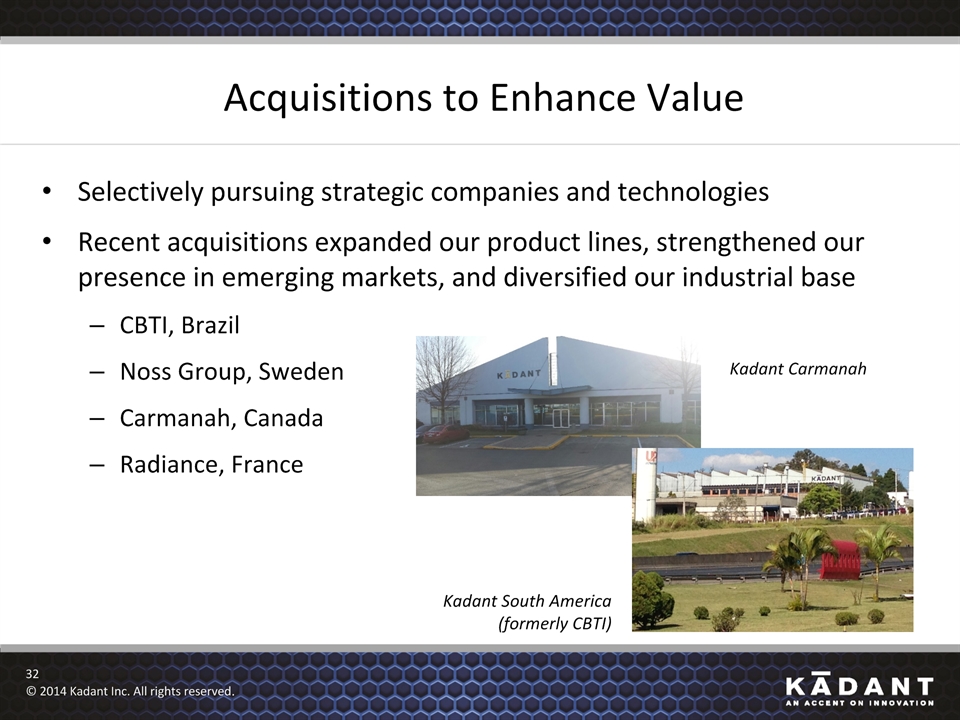
Acquisitions to Enhance Value Selectively pursuing strategic companies and technologiesRecent acquisitions expanded our product lines, strengthened our presence in emerging markets, and diversified our industrial baseCBTI, BrazilNoss Group, SwedenCarmanah, CanadaRadiance, France *© 2014 Kadant Inc. All rights reserved. Kadant Carmanah Kadant South America(formerly CBTI)
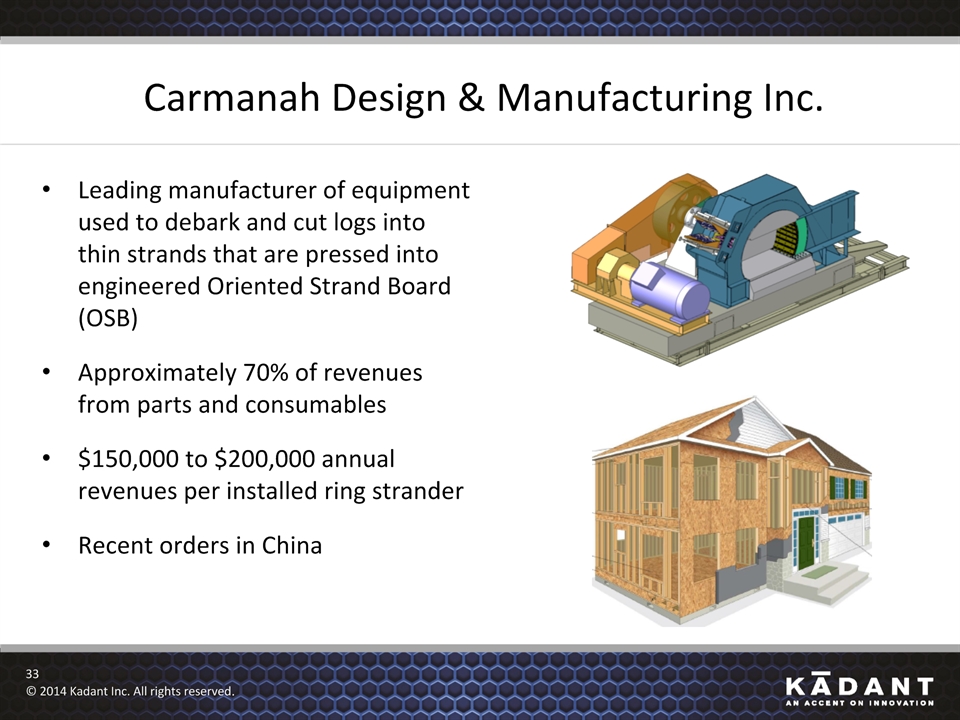
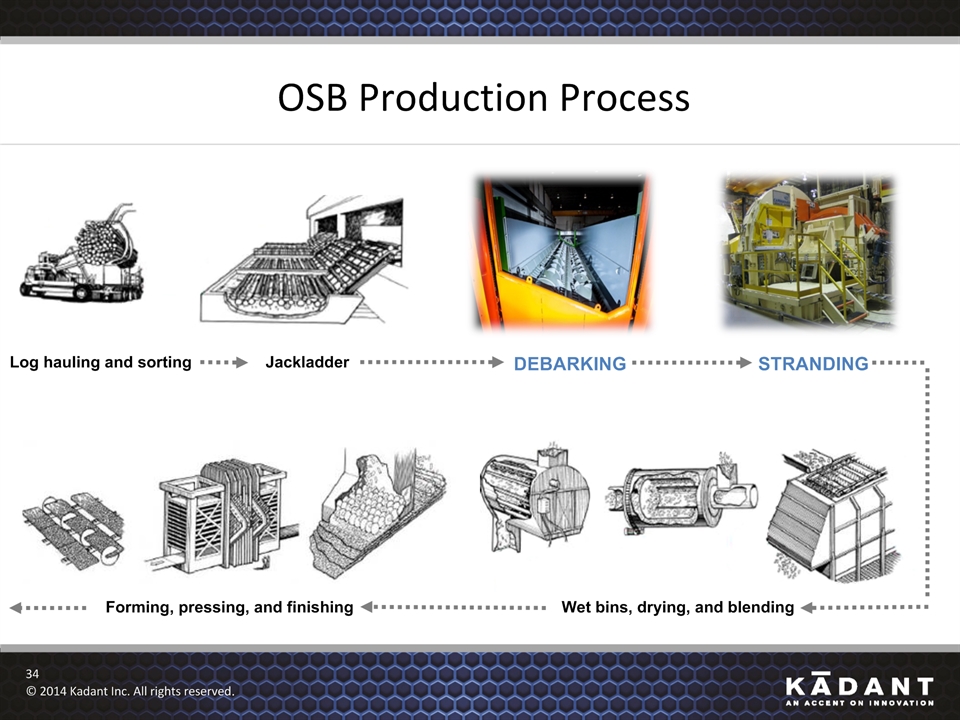
Carmanah Design & Manufacturing Inc. Leading manufacturer of equipment used to debark and cut logs into thin strands that are pressed into engineered Oriented Strand Board (OSB) Approximately 70% of revenues from parts and consumables $150,000 to $200,000 annualrevenues per installed ring stranderRecent orders in China *© 2014 Kadant Inc. All rights reserved.
OSB Production Process Log hauling and sorting Jackladder DEBARKING STRANDING Wet bins, drying, and blending Forming, pressing, and finishing *© 2014 Kadant Inc. All rights reserved.
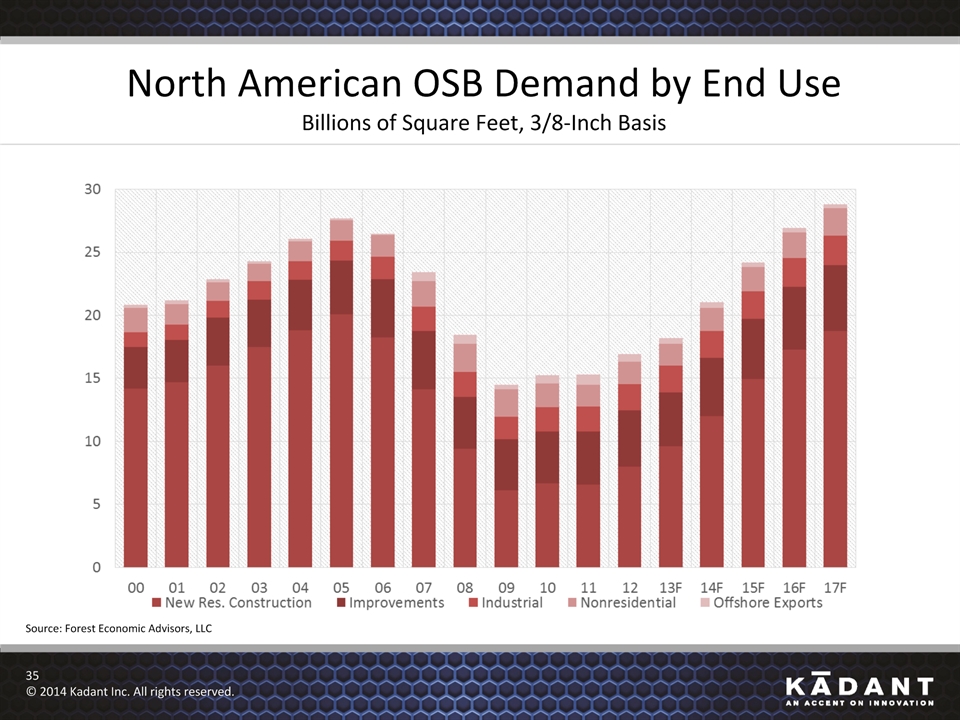
North American OSB Demand by End UseBillions of Square Feet, 3/8-Inch Basis *© 2014 Kadant Inc. All rights reserved. Source: Forest Economic Advisors, LLC
Radiance Technology Acquisition Premium blades for creping and coatingExtends current product mix to new applications and marketsDoubling production capacityIntegration into existing operations moving forwardEstimated $60 million market* *© 2014 Kadant Inc. All rights reserved. * Company estimate based on competitive analysis.
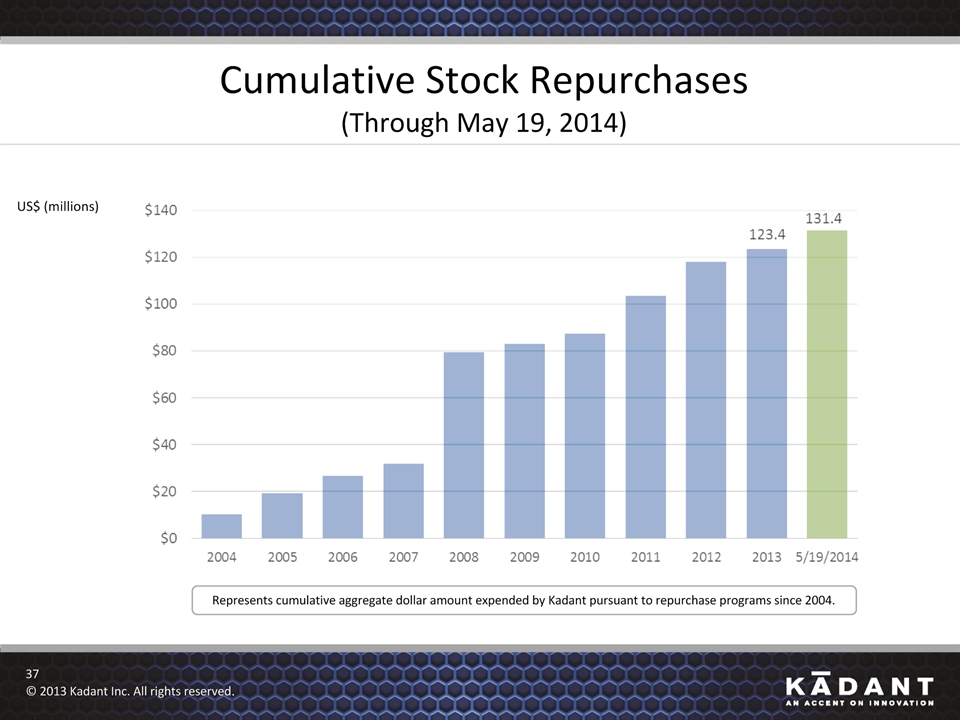
Cumulative Stock Repurchases(Through May 19, 2014) US$ (millions) *© 2013 Kadant Inc. All rights reserved. Represents cumulative aggregate dollar amount expended by Kadant pursuant to repurchase programs since 2004.
Stock Repurchases and Dividends ($ in Millions, except per share amounts) 2013 2012 2011 Common Stock Repurchases $5.4 $14.5 $16.1 Average Price per Share $30.67 $22.87 $21.52 Cash Dividends $4.2 - - Total Stock Repurchases and Dividends $9.6 $14.5 $16.1 Net Income from Continuing Operations $23.5 $30.9 $33.6 % of Net Income from Continuing Operations 41% 47% 48% *© 2014 Kadant Inc. All rights reserved.
Kadant in 2017 ($ in Millions, except per share amounts) ($ in Millions, except per share amounts) Revenues $500-$550 EBITDA $60-$80 Diluted EPS $4.00-$5.00 Operating Cash Flow $45-$60 Acquisitions Internal Growth Initiatives Base Business Stock Repurchases 2017 Diluted EPS Average revenue growth of 8% to 12% per yearFewer shares outstandingMinimal debtMeaningful dividend *© 2014 Kadant Inc. All rights reserved. 2017 Targets
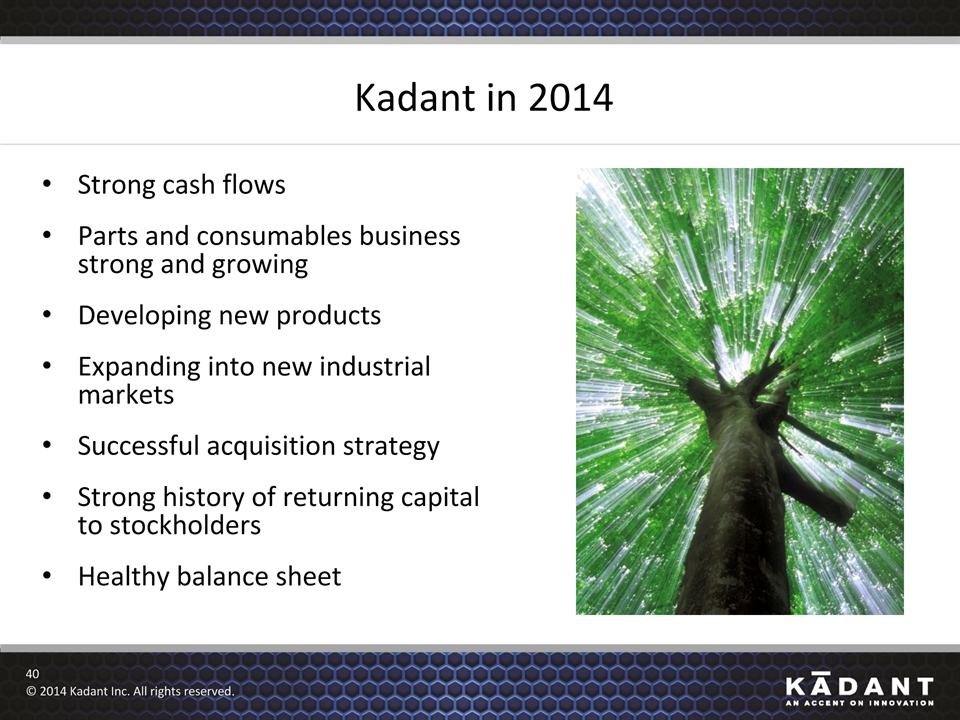
Kadant in 2014 Strong cash flowsParts and consumables business strong and growingDeveloping new productsExpanding into new industrial markets Successful acquisition strategyStrong history of returning capital to stockholdersHealthy balance sheet *© 2014 Kadant Inc. All rights reserved.
Questions & Answers To ask a question, please call 877-703-6107 within the U.S. or +1-857-244-7306 outside the U.S. and reference 83375884. Please mute the audio on your computer when calling. *© 2014 Kadant Inc. All rights reserved.
Annual Meeting of Stockholders May 20, 2014 Westford, Massachusetts