Table of Contents
UNITED STATES
SECURITIES AND EXCHANGE COMMISSION
Washington, D.C. 20549
SCHEDULE 14A INFORMATION
Proxy Statement Pursuant to Section 14(a) of the
Securities Exchange Act of 1934
(Amendment No. )
Filed by the Registrant ☒ Filed by a Party other than the Registrant ☐
Check the appropriate box:
| ☐ | Preliminary Proxy Statement | |||
| ☐ | Confidential, for Use of the Commission Only (as permitted by Rule 14a-6(e)(2)) | |||
| ☒ | Definitive Proxy Statement | |||
| ☐ | Definitive Additional Materials | |||
| ☐ | Soliciting Material under §240.14a-12 | |||
| Superior Energy Services, Inc. | ||||
| (Name of registrant as specified in its charter) | ||||
| (Name of person(s) filing proxy statement, if other than the registrant) | ||||
| Payment of Filing Fee (Check the appropriate box): | ||||
| ☒ | No fee required. | |||
| ☐ | Fee computed on table below per Exchange Act Rules 14a-6(i)(4) and 0-11. | |||
| (1) | Title of each class of securities to which transaction applies: | |||
| ||||
| (2) | Aggregate number of securities to which transaction applies: | |||
| ||||
| (3) | Per unit price or other underlying value of transaction computed pursuant to Exchange Act Rule 0-11 (set forth the amount on which the filing fee is calculated and state how it was determined): | |||
| ||||
| (4) | Proposed maximum aggregate value of transaction: | |||
| ||||
| (5) | Total fee paid: | |||
| ||||
| ☐ | Fee paid previously with preliminary materials. | |||
| ☐ | Check box if any part of the fee is offset as provided by Exchange Act Rule 0-11(a)(2) and identify the filing for which the offsetting fee was paid previously. Identify the previous filing by registration statement number, or the Form or Schedule and the date of its filing. | |||
| (1) | Amount Previously Paid: | |||
| ||||
| (2) | Form, Schedule or Registration Statement No.: | |||
| ||||
| (3) | Filing Party: | |||
| ||||
| (4) | Date Filed: | |||
| ||||
Table of Contents
Superior
ENERGY SERVICES
Proxy Statement 2017
Forged for recovery.
SPN
Table of Contents
|
NOTICE OF ANNUAL MEETING OF STOCKHOLDERS
|
|
SUPERIOR ENERGY SERVICES, INC.
NOTICE OF ANNUAL MEETING
OF STOCKHOLDERS
Tuesday, May 23, 2017
9:00 a.m., Central Daylight Time
1001 Louisiana Street
Houston, Texas 77002 USA
The annual meeting of stockholders of Superior Energy Services, Inc. will be held at 9:00 a.m., Central Daylight Time, on Tuesday, May 23, 2017, at our headquarters located at 1001 Louisiana Street, Houston, Texas, 77002. At the annual meeting, our stockholders will be asked to vote on the following proposals:
1.the election of the eight director nominees named in this proxy statement (Proposal 1);
2.an advisory vote to approve our named executive officers’ 2016 compensation (Proposal 2);
3.an advisory vote on the frequency of future advisory votes on our named executive officers’ compensation (Proposal 3); and
4. the ratification of the appointment of KPMG LLP as our independent registered public accounting firm for 2017 (Proposal 4).
The Board of Directors recommends that you vote “FOR” Proposals 1, 2 and 4, and “Every 1 Year” for Proposal 3. Only holders of record of shares of our common stock as of the close of business on April 3, 2017 are entitled to receive notice of, attend and vote at the meeting.
Your vote is important. Whether or not you plan to attend the meeting, please complete, sign and date the enclosed proxy or voting instruction card and return it promptly in the enclosed envelope, or submit your proxy and/or voting instructions by one of the other methods specified in this proxy statement. If you attend the annual meeting, you may vote your shares of our common stock in person, even if you have sent in your proxy.
By Order of the Board of Directors,

William B. Masters
Executive Vice President, General Counsel and Secretary
Houston, Texas
April 12, 2017
IMPORTANT NOTICE REGARDING THE AVAILABILITY OF PROXY MATERIALS FOR THE STOCKHOLDER MEETING TO BE HELD ON MAY 23, 2017.
This Notice of Meeting, Proxy Statement and the 2016 Annual Report on Form10-K are available without cost at https://materials.proxyvote.com/868157
2017 SPN Proxy Statement |
Table of Contents

Table of Contents
|
| i | |||
| viii | |||
| x | |||
Election of Directors (Proposal 1)
| 1 | |||
| 1 | ||||
| 5 | |||
| 5 | ||||
| 5 | ||||
| 6 | ||||
| 6 | ||||
| 7 | ||||
| 7 | ||||
| 8 | ||||
| 9 | ||||
| 9 | ||||
| 9 | ||||
| 9 | ||||
| 9 | ||||
| 10 | |||
| 12 | |||
| 12 | ||||
| 13 | ||||
| 14 | ||||
Advisory Vote to Approve Our Named Executive Officers’ 2016 Compensation (Proposal 2)
| 15 | |||
| 16 | |||
Ratification of the Appointment of Our Independent Registered Public Accounting Firm (Proposal 4)
| 17 | |||
| 18 | ||||
| 18 | ||||
| 19 | |||
| 21 | |||
| 23 | |||
| 23 | ||||
| 44 | ||||
| 45 | ||||
| 49 | ||||
| 52 | ||||
Questions and Answers about the 2017 Annual Meeting
| 59 | |||
| 63 | ||||
2017 SPN Proxy Statement |
Table of Contents
|
This summary highlights selected information contained in this proxy statement. This summary provides only a brief outline of the contents of this proxy statement and does not provide a full and complete discussion of the information you should consider. Before voting on the proposals to be presented at the annual meeting of stockholders, please review the entire proxy statement carefully. For more complete information regarding our 2016 performance, please review our 2016 Annual Report on Form10-K.
The 2016 Annual Report to stockholders, including financial statements, is being mailed to stockholders together with the proxy statement and form of proxy on or about April 12, 2017.
2017 ANNUAL MEETING OF STOCKHOLDERS
| ||
Time and Date:
| Tuesday, May 23, 2017, 9:00 a.m. (Central Daylight Time)
| |
Place:
| 1001 Louisiana Street, Houston, Texas 77002
| |
Record Date:
| April 3, 2017
| |
Voting: | Stockholders as of the record date are entitled to vote. Each share of common stock is entitled to one vote for each director position and one vote for each of the other proposals to be voted on.
| |
2016 PERFORMANCE HIGHLIGHTS
Managing the Downturn
Superior Energy Services, Inc. (“Superior”) is a globally diversified oilfield services provider, with product and service lines deployed across the U.S. land, Gulf of Mexico and over 20 international markets. Responding to depressed commodity prices, our exploration and production customers have continued to cut spending and reduce capital expenditures since the fourth quarter of 2014, resulting in significant activity reductions, lower rig counts and pricing pressure on service providers. The two years that followed presented the most challenging market environment faced by our industry and our Company in several decades, both domestically and internationally.
On the domestic front, these challenges were particularly acute in the U.S. land market, where the average rig count in 2016 decreased 48% as compared to 2015. U.S. land revenues declined as supply overcapacity remained high throughout 2016, resulting in pricing pressure across all of our product and service lines. We are not unique in this respect. The entire competitive landscape has been similarly impacted by the downturn, but the revenue and cash flows generated in the Gulf of Mexico and international markets throughout the downturn demonstrate how important the execution of our core strategy of geographic diversity is throughout the cycles to which our industry is prone.
Reducing Costs
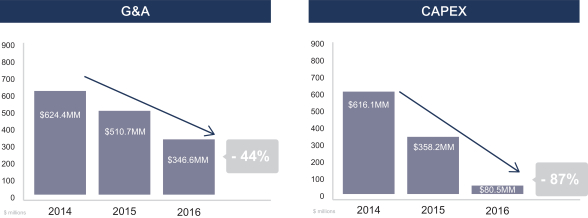
Responding to the depth and duration of the downturn, we took steps in 2016 to continue implementing company-wide cost reduction initiatives. We further reduced our cost structure by integrating product and service lines, reorganizing businesses, limiting capital expenditures to approximately $81 million and reducing our workforce by over 20% as compared to 2015 levels. We reduced our general and administrative (G&A) expenses by approximately 32% from $510.7 million in 2015 to $346.6 million during 2016. We believe our reduced cost structure and streamlined operations provide us a sustainable competitive advantage going forward.
Reduced Capital Expenditures by approximately $278 million (
| Reduced General & Administrative Expenses by approximately $164 million (
| $40 - $50 million in Annual Cost Savings from Restructuring our Businesses
|
 78%)
78%)
|
| |||||
| 2017 SPN Proxy Statement |
i
| |||||
|
|
Table of Contents
|
PROXY SUMMARY
|
|
 |
Disciplined Cash Management
In addition to cost discipline, we have taken positive action regarding liquidity preservation to solidify our balance sheet. During this down-cycle, we have been able to sustain our worldwide days sales outstanding (DSO) at 74 days, marking only a modest increase from DSO of 71 days in both 2014 and 2015. Additionally, we extended the term of our revolving credit facility for an additional two years, so we have no current debt maturities until 2019. We also made payments totaling $325.0 million in 2016 on this credit facility, which extinguished the outstanding debt balance. Following these debt payments, we were able to preserve $188 million in cash on hand atyear-end 2016, providing us with liquidity on our balance sheet to execute our operational objectives.
Worldwide DSO at 74 days
|
Cash on Hand of $188 million
|
$300 million Revolving Credit Facility with $100 million Accordion
|
Positioned for the Upcycle
During the second half of 2016, West Texas Intermediate crude oil prices began to recover and find price stability, reversing some of the steep declines that began in 2014. Many of our customers, primarily in the U.S. land market, gradually increased their activity levels in the third and fourth quarters and began to project a bias towards spending growth in 2017. After two years of industry decline, we were able to generate an increase in revenue in the fourth quarter of 2016.
By taking steps to conserve cash, retire debt and reduce our cost structure throughout the downturn, we positioned ourselves to be an early responder to the market recovery and seize market share. Seeing indications of 2017 spending increases by our customers, we felt confident enough in the forward outlook to make the tactical decision to transition to a mode of cash deployment in the second half of 2016 and begin activating idle equipment and supply chain in our well fracturing and well services businesses, ahead of expected demand increases. During the second half of 2016, we spent $23.1 million reactivating pressure pumping capacity to prepare for a return to service and to increase our active hydraulic horsepower (HHP) by 28% to approximately 450,000 HHP.
While we are optimistic the industry is entering a sustainable recovery, recovery is never linear in nature. By taking the measured steps described above, we feel confident we have responded to the changing dynamics of the current market environment and remain well positioned for future growth, both domestically and internationally. Going forward, we continue to look for opportunities to expand our market share and diversify our sources of revenue in pursuit of long-term stakeholder value creation.
ii
| 2017 SPN Proxy Statement | |
Table of Contents
|
PROXY SUMMARY
|
|
MEETING AGENDA AND VOTING RECOMMENDATIONS
Proposal
|
Board Vote | Page
| ||||
1 |
Election of eight director nominees named in this proxy statement |
FOR each nominee |
1 | |||
2 |
Advisory vote to approve our named executive officers’ 2016 compensation |
FOR |
15 | |||
3 |
Advisory vote on the frequency of future advisory votes on our named executive officers’ compensation |
FOR every 1 year |
16 | |||
4 |
Ratification of the appointment of KPMG LLP as our independent registered public accounting firm for 2017 |
FOR |
17 |
|
| |||||
| 2017 SPN Proxy Statement |
iii
| |||||
|
|
Table of Contents
|
PROXY SUMMARY
|
|
PROPOSAL 1 HIGHLIGHTS
Director Nominees
Our Board is comprised of a strong team of current and former senior professionals with significant industry experience. In 2016, we“right-sized” our Board in this instance by decreasing from nine to eight members, so as to coincide with the efficiencies we have sought throughout the Company. Of our current eight directors, six are independent, including our Lead Director, with the other two being our current and former CEO. We believe this gives us the right blend ofin-depth legacy and strategic knowledge of our Company, as well as broader skills and perspectives on the wider industry and market.
Name
| Age
|
Director | Principal Occupation | Independent
| Board Committees
| |||||
Harold J. Bouillion |
73 |
2006 |
Managing Director Bouillion & Associates, LLC. |
✓ |
• Compensation • Audit (Chair) | |||||
David D. Dunlap |
55 |
2010 |
CEO & President SPN | |||||||
James F. Funk |
67 |
2005 |
President J.M. Funk & Associates |
✓ Lead Director |
• Compensation • Nominating and Corporate | |||||
Terence E. Hall |
71 |
1995 |
Founder & Chairman of the Board SPN | |||||||
Peter D. Kinnear |
70 |
2011 |
Retired Chairman, CEO & President FMC Technologies, Inc. |
✓ |
• Audit • Nominating and Corporate Governance | |||||
Janiece M. Longoria |
63 |
2015 |
Chairman Port of Houston Authority |
✓ |
• Audit • Nominating and Corporate | |||||
Michael M. McShane |
62 |
2012 |
Advisor Advent International |
✓ |
• Compensation • Audit | |||||
W. Matt Ralls |
67 |
2012 |
Retired Chairman, CEO & President Rowan Companies, plc |
✓ |
• Compensation • Nominating & Corporate | |||||
iv
| 2017 SPN Proxy Statement | |
Table of Contents
|
PROXY SUMMARY
|
|
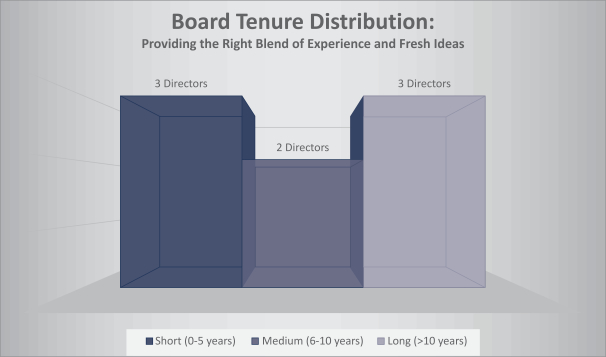
As a result of healthy refreshment over the past three years, our Board has an effective mix of experience and fresh ideas, as reflected by our balanced distribution of tenure. The Company appreciates the strong level of support of our Board in recent years.
Board Refreshment 1 New Director 2 Retirements In the Last Three Years
Each Board Member received 98.5% Support or Higher at our 2016 Annual Meeting of Stockholders
|
|
| |||||
| 2017 SPN Proxy Statement |
v
| |||||
|
|
Table of Contents
|
PROXY SUMMARY
|
|
Corporate Governance
Our Approach: Our leadership structure and corporate policies are designed to strengthen board leadership, foster cohesive decision-making at the board level, solidify director collegiality, improve problem solving and enhance strategy formation and implementation. In establishing corporate policies, our Board examines the Company’s organizational needs, managing its growth, competitive challenges, the potential of senior leadership, future development and possible emergency situations to help provide strategic plans.
Our Actions:
Governance Best Practices
|
SPN
| |
CEO and Chairman Positions are Separate
| ✓
| |
Non-Management Lead Director
| ✓
| |
Annual Election of Directors
| ✓
| |
AnnualSay-on-Pay Votes
| ✓
| |
Robust Stock Ownership Guidelines for all Directors and Executive Officers
| ✓
| |
Annual Performance Evaluations for Board and Standing Committees
| ✓
| |
ISS Governance QualityScore of “1”*
| ✓
|
PROPOSAL 2 HIGHLIGHTS
Executive Compensation
Our Approach: Our Compensation Committee has implemented and oversees a compensation program that strives to: (i) provide a balanced mix of performance-based compensation; (ii) motivate our executives to improve both our financial and stock-price performance; and (iii) maintain alignment of both short- and long-term objectives.
Our Actions:
| • | Reduced by 15% the base salaries of Named Executive Officers effective April 1, 2016. |
| • | Granted 50% of the awards under our LTI program in 2016 as Options (instead of 25% restricted stock units and 25% options) in order to better align the interests of our executives with those of our stockholders. |
| • | Maintained the 37.5% reduced potential payout opportunities under our Annual Incentive Program. |
| • | No Restricted Stock Units or Strategic Performance Stock Units granted in 2016. |
| • | Continued our Shareholder Outreach program to sustain dialogue with and responsiveness to our stockholders. |
| * | A decile score of 1 indicates lowest governance risk. Score current as of April 1, 2017 |
vi
| 2017 SPN Proxy Statement | |
Table of Contents
|
PROXY SUMMARY
|
|
PROPOSAL 3 HIGHLIGHTS
We understand the concerns of some investors that annualsay-on-pay votes lead to excessive focus on near-term, cyclical stock price movements and are redundant to annual votes on compensation committee members. However, at this time we continue to believe that annualsay-on-pay votes remain the market norm and allow our stockholders to express their views timely on our executive compensation program. As a result, we recommend that we continue to future holdsay-on-pay votes annually.
PROPOSAL 4 HIGHLIGHTS
Taking a number of factors into consideration, including past performance, expertise, industry knowledge, and the strong support of 99.5% of our stockholders at our 2016 annual meeting, the Audit Committee has selected KPMG as our independent auditor for the fiscal year ending December 31, 2017, which we submit to our stockholders for ratification. KPMG has audited the Company’s financial statements since 1995.
|
| |||||
| 2017 SPN Proxy Statement |
vii
| |||||
|
|
Table of Contents
|
Our Shared Core Values
Since our founding, Superior has remained committed to conducting our business in a socially responsible and values-based manner, creating sustainable value for our stockholders, employees, customers and communities. In 2015 our President and CEO, Dave Dunlap, personally outlined Our Shared Core Values at Work, which we codified as our new code of conduct and mandate for how we do business:
| • | We conduct ourselves and our business affairs with honesty and integrity, and do not tolerate illegal or fraudulent activities. |
| • | We treat our employees with fairness, dignity and respect and do not tolerate any forms of discrimination. |
| • | We protect the safety and health of ourselves, our fellow employees and everyone that we work with and stop unsafe actions. |
| • | We deal fairly with customers, suppliers and other business relationships and always act in the best interests of the Company. |
| • | We conduct ourselves as good citizens in the communities where we operate, and we respect the environment. |
These core values capture what is unique about Superior and what sets us apart as a fair employer, a trusted business partner and a good corporate citizen, helping us to maintain our well-earned reputation for honesty and integrity. The complete code is available on our website:www.superiorenergy.com/about/corporate-governance/shared-core-values/. All of our other policies flow from Our Shared Core Values.
Health, Safety, Environment and Quality (HSEQ)
Superior’s focus on HSEQ, an approach we call “Target Zero”, is more than a priority; it is deeply rooted as one of the core values of Superior. Emphasizing our commitment to Target Zero, in 2016 we reviewed and updated our HSEQ Policy Statement to better align our message with Our Shared Core Values. Our HSEQ Policy Statement is a concise message stating our commitment to HSEQ and outlining our cornerstone principles essential for our future growth and success. Our new policy has been endorsed by our President and CEO and communicated throughout the Company. Our executive management is graded on an ongoing basis on Target Zero performance metrics, with our full Board receiving HSEQ updates and discussing progress at each Board meeting.
 | Our unwavering commitment toWorking Safely, Living SafelyandProtecting the Environment is what makes our Company strong. |
viii
| 2017 SPN Proxy Statement | |
Table of Contents
|
CORPORATE RESPONSIBILITY
|
|
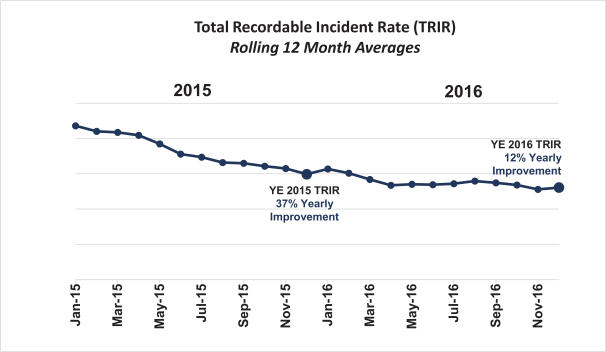
Focusing on results, we strive to maintain a healthy reporting culture and promote proactive behavior in preventing incidents. In 2016 we improved our Total Recordable Incident Rate (TRIR) by 12%, and the total number of lost time injuries decreased by 40%. Four of our business units completed the year without any recordable injuries and six business units achieved improvements in their TRIR of more than 50%. Part of this operational success is due to the fact that all Superior personnel are empowered with “Stop Work Authority” and are trained to use this authority whenever they see something that could harm people or the environment. Our executives and operational leaders continued to demonstrate visible leadership throughout 2016 by participating in Target Zero training, as well as internal HSEQ audits/inspections, described as Target Zero Evaluations. In 2016 we completed week long Target Zero Evaluations at forty locations involvingtwenty-one different business units across our global operations. These evaluations were completed by a team of corporate level auditors who were tasked with ensuring compliance not only with health and safety standards, but also with environmental compliance. Superior is committed to minimizing any environmental impact through strict pollution prevention, waste management, water and energy efficiency, and effective use of raw materials. Additional information on our HSEQ efforts and a copy of our HSEQ Policy Statement is available on our website:www.superiorenergy.com/about/hseq/.
|
| |||||
| 2017 SPN Proxy Statement |
ix
| |||||
|
|
Table of Contents
|
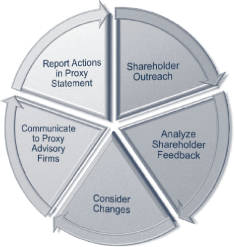
We have institutionalized a governance and compensation focused outreach program to sustain and improve dialogue with our stockholders. With the support of our Board, our outreach team consists of members of executive management, our investor relations, human resources and corporate secretarial teams, as well as the Chair of our Compensation Committee, who has participated in meetings with some of our long-term stockholders. Our annual engagement cycle consists of a primary stockholder outreach effort in the fourth quarter of each year, followed by internal analysis of the feedback, consideration of any necessary changes, communication of our efforts to the proxy advisory firms, and finally the reporting of any actions taken in our annual Proxy Statement. Our outreach is done primarily by holding conference calls with stockholders, but we also provide questionnaires, allowing our stockholders to provide written responses regarding any concerns. Our annual engagement cycle is summarized in the graph below.
Consistent with this approach, in our 2016 engagement campaign we invited ourtop-50 stockholders, representing approximately 82% of our outstanding shares, to discuss our compensation philosophy, executive compensation and any governance concerns. Topics discussed included our recent board refreshment efforts, as well as our improved ISS QualityScore, reflecting our best practices in corporate governance. The significant majority of stockholders who engaged with us indicated that, they did not have any concerns regarding the structure or philosophy of our executive compensation program, particularly after having seen how our program and our Board responded to the market conditions and stockholder feedback by reducing compensation to better align with total shareholder return (TSR) in 2015 and 2016. Overall, our stockholders continued to express confidence in our governance practices and our engagement program. Stockholders’ input received as a result of the outreach program was reported to the Compensation Committee and to our Board.
The feedback we receive from our stockholders is important to us. Through our outreach effort, we are able to hear any concerns from our stockholders, respond effectively and communicate this back to our stockholders. We expect to continue a strong level of engagement to ensure that we understand and remain able to address stockholder concerns and the issues on which they are focused.
x
| 2017 SPN Proxy Statement | |
Table of Contents
ELECTION OF DIRECTORS (PROPOSAL 1)
|
All of our directors are elected annually. On March 30, 2017, the Nominating and Corporate Governance Committee (the Corporate Governance Committee) recommended, and our Board of Directors (the Board) nominated, each of our then-current directors to serve anotherone-year term of office.
Proxies cannot be used to vote a share more than one time for each of the eight nominees. Unless you specify otherwise in your proxy card, your shares will be voted by the proxy holder FOR the election of each of the eight director nominees named below to serve until the next annual meeting and until their successors are duly elected and qualified. If any director nominee should decline or be unable to serve for any reason, and you have returned a proxy card, the proxy holder will vote your shares for a substitute candidate nominated by our Board. Each of the director nominees has advised us that they will serve on our Board if elected.
Information about Director Nominees
The biographies below provide certain information as of the record date, April 3, 2017, for each director nominee. The information includes the person’s tenure as a director, business experience, director positions with other public companies held currently or at any time during the last five years, and the experiences, qualifications, attributes or skills that caused the Corporate Governance Committee and our Board to determine that the person should be nominated to serve as a director of the Company. Unless otherwise indicated, each person has been engaged in the principal occupation shown for the past five years.

Harold J. Bouillion, 73
Director since 2006
Mr. Bouillion is currently the Managing Director of Bouillion & Associates, LLC, which provides tax and financial planning services, a position he has held since 2002. From 1966 until 2002, Mr. Bouillion was with KPMG LLP (KPMG) where he served as Managing Partner of the New Orleans office from 1991 through 2002. Mr. Bouillion is a certified public accountant.
Mr. Bouillion’s tax and financial planning services experience and his36-year career in tax with a leading international accounting firm, where he served in various leadership positions, make him a valuable member of our Board and distinctively qualified to chair the Audit Committee and to serve on our Compensation Committee. His prior management experiences, as well as service with other private andnon-profit organizations, adds valuable perspectives to the challenges faced at the board level.

David D. Dunlap, 55
Director since 2010
Mr. Dunlap has served as CEO since 2010 and President since 2011. Prior to joining the Company, from 2007 to 2010 Mr. Dunlap served as Executive Vice President — Chief Operating Officer of BJ Services Company (BJ Services), a well services provider. He joined BJ Services in 1984 as a District Engineer. Prior to being promoted to Executive Vice President — Chief Operating Officer, Mr. Dunlap held the position of Vice President — International Division from 1995 to 2007. Prior to 1995, he served as Vice President — Sales for the Coastal Division of North America and U.S. Sales and Marketing Manager for BJ Services. Mr. Dunlap previously served as a director of Linn Energy, LLC from 2012 to 2017, and he currently serves as director and trustee on the boards of numerousnon-profit organizations.
Mr. Dunlap has worked and held leadership positions in the oil and gas industry for more than 30 years. Under his direction, BJ Services significantly expanded internationally and successfully transformed into a global leader in multiple well service product
 | 1 | |||
Table of Contents
|
ELECTION OF DIRECTORS (PROPOSAL 1)
|
|
lines, demonstrating his exceptional leadership abilities in developing and executing a global business strategy. His extensive knowledge, experience and expertise and his insight on global expansion in the oil and gas industry make him a valuable member of our Board and uniquely position him to assist our Board in the successful implementation of our business strategy.

James M. Funk, 67
Director since 2005
Dr. Funk is currently the President of J.M. Funk & Associates, an oil and gas business consulting firm, and has more 39 years of experience in the energy industry. Dr. Funk served as Senior Vice President of Equitable Resources (now EQT Corporation) and President of Equitable Production Co. from June 2000 to 2003. Previously, Dr. Funk worked for 23 years with Shell Oil Company and its affiliates. Dr. Funk previously served on the boards of Westport Resources (2000 to 2004), Matador Resources Company (2003 to 2008) and Sonde Resources Corp. (2009 to 2014). Dr. Funk currently serves as a director of Range Resources Corporation. Dr. Funk is a Certified Petroleum Geologist.
Dr. Funk’s extensive experience in the energy industry in similar areas as our operations, along with his strong technical experience, gives him a unique understanding of our business and the challenges and strategic opportunities facing us. His senior executive leadership in the energy industry qualifies him to serve as our Lead Director and provides each of the Compensation and Corporate Governance Committees with substantial personnel management experience. In addition, his current and past service on the board of directors of a number of public companies adds valuable perspective in connection with the role of the Board and positions him well to handle challenges faced at the Board level.

Terence E. Hall, 71
Director since 1995
Mr. Hall has served as the Chairman of the Board since 1995. Mr. Hall is the founder of the Company and served as CEO of the Company and its predecessors from 1980 until 2010. Mr. Hall also currently serves as a director of the Hancock Holding Company (Hancock).
As founder of the Company, Mr. Hall led the Company through tremendous growth through all industry cycles. His detailed knowledge of every aspect of our business and perspective regarding strategic and operational opportunities and challenges facing the Company and the oil and gas industry enable him to guide our business strategy and focus our Board on the most significant business issues.

Peter D. Kinnear, 70
Director since 2011
Mr. Kinnear held numerous management, operations, and marketing roles with FMC Technologies, Inc. (FTI) and FMC Corporation from 1971 until his retirement in 2011. Mr. Kinnear served as Chief Executive Officer from 2007 to 2011 of FTI, chairman of the board from 2008 to 2011, as President from 2006 to 2010 and as Chief Operating Officer from 2006 to 2007.
In addition to serving as trustee or director of variousnon-public entities, Mr. Kinnear previously served on the board of directors of Tronox Incorporated (from November 2005 to December 2010), FTI (from October 2008 through October 2011) and Stone Energy Corporation (from March 2009 to March 2017).
Mr. Kinnear’s experience in numerous roles of management, operations and marketing in the global energy industry brings extensive knowledge and leadership skills to our Board. His management and board experience gives him a thorough understanding of industry regulations and public policy applicable to the industry, experience and understanding of the different cultural, political and regulatory requirements from international operations and extensive oil service industry experience. This experience makes Mr. Kinnear highly qualified to serve on the Audit Committee and to chair the Corporate Governance Committee.
| 2 | | |||
Table of Contents
|
ELECTION OF DIRECTORS (PROPOSAL 1)
|
|

Janiece M. Longoria, 63
Director since 2015
Ms. Longoria serves as the Chairman of the Port of Houston Authority. She has served on the board of directors of CenterPoint Energy, Inc. since 2005. She also currently serves as a Regent for the University of Texas System, and on the board of directors of the Texas Medical Center. Formerly, Ms. Longoria practiced law as a securities and commercial litigator for over 35 years. She was a named partner at the law firm of Ogden, Gibson, Broocks, Longoria & Hall, L.L.P. and previously at Andrews Kurth LLP.
Ms. Longoria’s legal experience, particularly with securities and regulatory matters, allows her to provide extensive guidance to our Board. She has received numerous honors and recognitions for her community and board service during her career, including the Sandra Day O’Connor Award for Board Excellence, as well as the Female Executive of the Year Award from the Houston Hispanic Chamber of Commerce. She brings a fresh and unique perspective to our Board based on her diverse business and legal experience, which makes Ms. Longoria highly qualified to serve on our Audit Committee and Corporate Governance Committee.

Michael M. McShane, 62
Director since 2012
Mr. McShane serves as an Advisor to Advent International, a global private equity fund. Mr. McShane served as a director and President and Chief Executive Officer of Grant Prideco, Inc. from 2002 until the completion of its merger with National Oilwell Varco, Inc. in 2008, having also served as the chairman of its board from 2003 to 2008. Prior to joining Grant Prideco, Mr. McShane was Senior Vice President — Finance and Chief Financial Officer and a director of BJ Services from 1990 to 2002, and Vice President — Finance from 1987 to 1990 when BJ Services was a division of Baker Hughes Incorporated. Mr. McShane also serves as a director of Enbridge, Inc., Oasis Petroleum Inc. and Forum Energy Technologies, Inc.
Mr. McShane’s knowledge of the global oil and gas industry provides insight to our Board. His experience and knowledge in the energy industry, including serving in a variety of executive management and financial leadership positions, provide our Board excellent perspective and experience. Mr. McShane’s experience and finance and accounting background make him highly qualified to serve on the Audit Committee and the Compensation Committee.
| | 3 | |||
Table of Contents
|
ELECTION OF DIRECTORS (PROPOSAL 1)
|
|

W. Matt Ralls, 67
Director since 2012
Mr. Ralls previously served as Executive Chairman of Rowan Companies, plc (Rowan) from 2014 to 2016, as the Chief Executive Officer from 2009 until 2014, and as President from 2009 to 2013.
Mr. Ralls served as Executive Vice President and Chief Operating Officer of GlobalSantaFe Corporation from 2005 until the completion of the merger of GlobalSantaFe with Transocean, Inc. in 2007, prior to which he had served as Senior Vice President and Chief Financial Officer from 2001 to 2005.
Mr. Ralls currently serves as a director of Cabot Oil and Gas Corporation and previously served as a director of El Paso Pipeline Partners L.P., Enterprise Partners G.P., the International Association of Drilling Contractors and the American Petroleum Institute.
Mr. Ralls’ extensive financial and senior executive management experience at companies focusing on the various phases of the drilling and production industry, provides insight to our Board. Our Board also benefits from his extensive leadership and financial knowledge in the global oil and gas drilling and production industry, making him highly qualified to chair the Compensation Committee and to serve on the Corporate Governance Committee.
Vote Required
The election of directors will be decided by plurality vote in compliance with our majority voting policy, which means that the eight director nominees receiving the highest number of affirmative votes cast will be elected to our Board provided no director nominee receives a greater number of “withhold” than “for” votes in an uncontested election. In the event a director nominee receives a greater number of “withhold” than “for” votes, the director will provide his or her resignation for consideration. See “Corporate Governance — Election of Directors.”
Our Board unanimously recommends that stockholders voteFOR each of the eight director nominees named in this proxy statement.
| ||||
| 4 | | |||
Table of Contents
|
Our Board is responsible for our management and direction and for establishing broad corporate policies. Our Board regularly discusses the Company’s organizational needs, managing its growth, competitive challenges, the potential of senior leadership, future development and possible emergency situations to help provide strategic plans.
Our Corporate Governance Principles provide that in a director election where the only director nominees are those nominated by our Board (an uncontested election), if a director nominee receives a greater number of votes withheld from his or her election than for his or her election (a “majority withheld vote”) the nominee is required to tender his or her resignation, after certification of the stockholder vote, for consideration by the Corporate Governance Committee. The Corporate Governance Committee will consider the resignation and recommend to our Board whether to accept it or take other action, including rejecting the tendered resignation and addressing the apparent underlying cause of the majority withheld vote.
In making its recommendation, the Corporate Governance Committee will consider all factors deemed relevant by its members, including without limitation (i) the underlying cause of the majority withheld vote (if it can be determined), (ii) the length of service and qualifications of the director whose resignation has been tendered, (iii) the director’s contributions to the Company, (iv) the current mix of skills and attributes of directors on our Board, (v) whether, by accepting the resignation, the Company will no longer be in compliance with any applicable law, rule, regulation or governing document, and (vi) whether or not accepting the resignation is in the best interests of the Company and its stockholders.
Our Board will act on the Corporate Governance Committee’s recommendation at its first regularly scheduled meeting following certification of the stockholder vote, or within 120 days after the certification if a regular board meeting is not scheduled within that time. Our Board will consider the
same criteria as the Corporate Governance Committee, as well as any additional information and factors it believes are relevant. Our Board’s decision and process will then be disclosed in a periodic or current report filed with the Securities and Exchange Commission (SEC).
Director Independence; Board’s Leadership Structure
Our Board determined that the following directors are “independent” within the meaning of the New York Stock Exchange (NYSE) listing standards: Harold J. Bouillion, James M. Funk, Peter D. Kinnear, Janiece M. Longoria, Michael M. McShane and W. Matt Ralls. Our Board has also affirmatively determined that each member of our standing committees (the Audit Committee, Compensation Committee and Corporate Governance Committee) has no material relationship with the Company and satisfies the independence criteria (including the enhanced criteria applicable to audit and compensation committees) set forth in the NYSE listing standards and SEC rules.
Our Board takes a flexible approach to the issue of whether the offices of Chairman and CEO should be separate or combined, considering the tenure and experience of the CEO along with the broader economic and operating environment of the Company, allowing for regular evaluation as to which structure will best serve the Company. We previously separated the role of Chairman and CEO and maintain such separation at this time.
Our Board determined that the separation of the Chairman and CEO roles would maximize management’s efficiency by allowing our CEO to focus on ourday-to-day business, while allowing the Chairman to lead our Board in its fundamental role of providing guidance to and oversight of management.
As described above,six of our eight current directors are independent, and our Board believes that the independent directors provide effective oversight of management. Moreover, ournon-management directors meet regularly in executive session and provide feedback to the Board during the course of Board meetings.
| | 5 | |||
Table of Contents
|
CORPORATE GOVERNANCE
|
|
Our Board annually elects anon-management Lead Director who has been recommended by the Corporate Governance Committee. The Lead Director communicates any issues discussed by thenon-management directors back to the CEO and Chairman, confers with the CEO and Chairman at intervals between Board meetings, and assists in planning for Board and Board committee meetings. In addition, he acts as a liaison between our Board and the CEO and Chairman to ensure close communication and coordination between them and to promote a harmonious and effective relationship. Mr. Funk currently serves as our Lead Director.
Our Board believes that the foregoing leadership structure and polices strengthen board leadership,
foster cohesive decision-making at the board level, solidify director collegiality, improve problem solving and enhance strategy formulation and implementation.
Meetings of our Board; Meeting Attendance
Each of our directors attended 100% of the four Board meetings in 2016 and at least 75% of the meetings of any committees of which he or she was a member. On a combined basis, our directors attended 97.8% of all Board and committee meetings in 2016.
Additionally, our Board has adopted a policy that recommends that all directors personally attend each annual meeting of stockholders. All of our directors attended our 2016 annual meeting of stockholders.
Our Board has three standing committees: an Audit Committee, a Compensation Committee and a Nominating and Corporate Governance Committee. These committees regularly report back to the full Board with specific findings and recommendations in their areas of oversight and liaise regularly with the Chairman and Lead Director. The current members and primary functions of each board committee are described below.
Director
| Audit*
| Compensation
| Nominating and Corporate Governance
| |||
H.J. Bouillion
|
CHAIR
|
✓
| ||||
J.M. Funk
|
✓
|
✓
| ||||
P.D. Kinnear
|
✓
|
CHAIR
| ||||
J.M. Longoria
|
✓
|
✓
| ||||
M.M. McShane
|
✓
|
✓
| ||||
W.M. Ralls
|
CHAIR
|
✓
|
| * | Messrs. Bouillion, Kinnear and McShane are each an “audit committee financial expert” as defined by the SEC |
Audit Committee
|
Number of Meetings in 2016: 5
|
| • | Retain, terminate, oversee, and evaluate the independent registered public accounting firm |
| • | Review and discuss annual and quarterly financial statements and earnings releases |
| • | Review critical accounting policies, accounting treatments and determine if there are any recommendations to improve controls or procedures |
| • | Discuss risk assessment, legal matters or any matters pertaining to the integrity of management |
| • | Please also see “Audit Committee Report” included in this Proxy Statement |
Compensation Committee
|
Number of Meetings in 2016: 4
|
| • | Evaluate and approve the Company’s executive officers’ compensation philosophy |
| • | Review and approve corporate goals and objectives for executive officers’ compensation |
| • | Review incentive compensation and other stock-based plans for the Company’s executive officers |
| • | Please also see “Executive Compensation—Compensation Discussion & Analysis” included in this Proxy Statement |
| 6 | | |||
Table of Contents
|
CORPORATE GOVERNANCE
|
|
Nominating and Corporate Governance Committee
|
Number of Meetings in 2016: 4
|
| • | Lead search for director nominees and recommend director nominees to our Board |
| • | Review committee structure and committee appointments |
| • | Recommend to our Board an annual self-evaluation process |
| • | Review director compensation |
| • | Recommend to our Board and implement our Corporate Governance Principles |
Each of our Board’s standing committees has adopted a written charter that has been approved by our Board. Copies of these charters, as well as copies of our Corporate Governance Principles andOur Shared Core Values at Work (Code of Conduct), are available in the Corporate Governance section of our website at www.superiorenergy.com and are available in print upon request to our Secretary, Superior Energy Services, Inc., 1001 Louisiana Street, Suite 2900, Houston, Texas 77002.
Since May 2007, the Compensation Committee has engaged Pearl Meyer & Partners (PM&P), an independent compensation consultant, to advise the Compensation Committee on matters relating to executive compensation and assist it in maintaining and administering our executive compensation programs. The Compensation Committee annually requests PM&P to conduct an executive compensation review to evaluate the compensation of our senior executives relative to an industry peer group selected by the Compensation Committee with input from the compensation consultant and management and published market survey data. See “Executive Compensation — Compensation Discussion and Analysis — How We Make Compensation Decisions — Role of Compensation Consultants” herein for more information.
Our stock incentive plan permits the Compensation Committee to delegate to appropriate personnel its authority to make awards to employees other than those subject to Section 16 of the Securities Exchange Act of 1934 (Exchange Act) and other than with respect to awards intended to qualify as “performance-based compensation” under 162(m) of the Internal Revenue Code. The Compensation Committee has delegated authority to our CEO to make or alter awards under our long-term incentive plan to such participants, subject to the following conditions:
| • | the CEO may grant awards relating to no more than 100,000 shares of our common stock in any fiscal year, and awards relating to no more than 20,000 shares to any one participant; |
| • | the CEO may grant no more than 30,000 performance share units (PSUs) in any fiscal year, and no more than 5,000 PSUs to any one participant; |
| • | the CEO may cancel, modify, or waive rights under awards related to no more than 20,000 shares and 5,000 PSUs held by a participant; |
| • | the CEO must approve the grant in writing during an open window period, with the grant date being the date of the written approval or a future date; and |
| • | the CEO must report the grants, cancellations or alterations to the Compensation Committee at its next meeting. |
Director Nominee Qualifications
The Corporate Governance Committee is responsible for reviewing with our Board, on an annual basis, the appropriate skills and characteristics required of directors in accordance with our Corporate Governance Principles and evaluating whether the current members of our Board as a group possess those skills and characteristics. Our Corporate Governance Principles provide that our Board will nominate director candidates who represent a mix of backgrounds and experiences that enhance the quality of our Board’s deliberations and decisions. Our Board believes that a diverse membership with varying perspectives and breadth of experience is an important attribute of a well-functioning board. As a result, our Board will seek diversity of background, experience, gender, race and skills among its members.
When seeking new candidates for director, the Corporate Governance Committee will identify potential director nominees through business and other contacts. The Corporate Governance Committee will also consider new candidates for director recommended by stockholders in accordance with the procedures described in our Bylaws and may also choose to retain a professional search firm to identify
| | 7 | |||
Table of Contents
|
CORPORATE GOVERNANCE
|
|
potential director nominees. We did not pay any fee to any third party to identify or evaluate, or assist in identifying or evaluating, potential director nominees for election at the annual meeting.
When the Corporate Governance Committee selects candidates, it is looking for director nominees:
| • | with a mix of backgrounds and experiences to bring diversity and desired skills to our Board; |
| • | having substantial experience with one or more publicly-traded domestic or multinational companies; |
| • | having achieved high distinction or success in their respective fields; |
| • | displaying the personal attributes necessary to be an effective director, including having unquestioned integrity, sound judgment, independence in fact and mindset, and the ability to operate collaboratively; and |
| • | commitment to the Company and its stockholders. |
Our Board is particularly interested in maintaining a mix that includes, but is not necessarily limited to, active or retired chief executive officers and senior executives, particularly those with significant management experience in operations, international business, finance, accounting, law or significant targeted expansion areas for the Company. The committee evaluates a potential director nominee by considering whether the potential candidate meets the expectations described above, as well as considering the following factors:
| • | whether the potential director nominee has experience and expertise that is relevant to our business and/or industry, including any specialized business or legal experience, technical expertise, or other specialized skills, and whether the potential director nominee has knowledge regarding issues affecting us; |
| • | whether the potential director nominee is independent, whether he or she is free of any conflict of interest or the appearance of any conflict of interest with the best interests of the Company or of our stockholders, and whether he or she is willing and able to represent the interests of all of our stockholders; and |
| • | whether there are factors that could affect the ability or willingness of the potential director nominee to devote sufficient time to Board activities and to enhance his or her understanding of our business. |
There are no differences in the manner in which the Corporate Governance Committee evaluates a candidate for nomination as a director suggested by stockholders using the process set forth in our Bylaws. See “2018 Stockholder Nominations and Proposals” for information on a stockholder proposing a candidate for consideration for nomination as a director, in accordance with our Bylaws and Corporate Governance Principles. For the annual meeting, we did not receive notice of director nominations from any stockholder.
When reviewing an incumbent director for potentialre-election, the Corporate Governance Committee considers the incumbent director’s service to us during his or her term, including the number of meetings attended, level of participation, and overall contribution to our Board. As provided in our Corporate Governance Principles, a director is expected to retire at the annual meeting following his or her 75th birthday, unless asked by our Board to continue to serve.
Role of our Board in Stockholder Outreach
As discussed more fully in the “Stockholder Outreach” section below, our Board believes in the importance of the Company engaging with our stockholders to gain feedback regarding our compensation and governance practices, to answer questions about the Company and to respond as appropriate to stockholder concerns. Our Board receives reports from our engagement team, summarizing the responses and viewpoints of our stockholders. Further, while senior management routinely engage with stockholders, the Board reviews and considers the degree of engagement and stockholder requests in order to determine whether direct Board member participation would be appropriate and beneficial. To that end, the Chair of our Compensation Committee has participated directly in discussions with certain of our largest stockholders to ensure a direct line of communication. Our Board appreciates the time taken and responses provided by our stockholders and looks forward to continuing such outreach going forward.
| 8 | | |||
Table of Contents
|
CORPORATE GOVERNANCE
|
|
Role of our Board in Succession Planning
Succession planning is a critical board function. Long-term succession planning involves assessing the Company’s business goals, determining the skills and experience necessary for future executives to help the Company achieve those goals, and an open dialogue between the Board and management to assess talent and prepare for transition. Reviewing the company’s leadership development and “bench strength” is a key component of analyzing internal potential for future executives. To that end, our Board is engaged in succession planning and management development activities, seeking input from members of our Board and senior management regarding candidates for potential successors to the CEO and other senior executives.
Role of our Board in Risk Oversight
Our Board is responsible for the oversight of risk, while assessing and managing risk is the responsibility of management. It is management’s responsibility to anticipate, identify and communicate risks to our Board and its committees, so that our Board can better understand the risks the Company faces, the steps management takes to manage these risks and the level of risk that is appropriate for the Company at any given time. Management performs an annual enterprise risk management exercise to gather empirical data on risks confronting the Company, monitor changes over time, and determine optimal approaches to address identified key risks. Additionally, management meets regularly to discuss our business strategies, challenges, identified risks and opportunities, and management reviews those items with our Board at each regularly scheduled meeting.
While our Board has primary responsibility for risk oversight, each of its standing committees support our Board by addressing various risks in their respective areas of oversight. For instance, the Audit Committee maintains responsibility related to our financial reporting, audit process, and internal control over financial reporting and disclosure controls and procedures. The Compensation Committee endeavors to develop a program of incentives that encourages an appropriate level of risk-taking behavior consistent
with our long-term business strategy and also reviews the leadership development of our employees. The Corporate Governance Committee conducts assessments of nominees to our Board and is charged with developing and recommending to our Board any policies, corporate governance principles and the structure, leadership and membership of our Board committees, including those policies and principles related to, affecting or concerning risk oversight of our Board and its committees.
Director Stock Ownership Guidelines
Within three years of joining the Board, eachnon-management director is expected to own shares of our common stock equal in value to five times the annual retainer paid to him or her. All of our directors with at least three years of tenure on our Board exceed the required ownership level. See “Ownership of Securities — Management and Director Stock Ownership.”
Stockholders and other interested parties may communicate directly with one or more members of our Board, or thenon-management directors as a group, by sending a letter by mail c/o Secretary, Superior Energy Services, Inc., 1001 Louisiana Street, Suite 2900, Houston, Texas 77002. The Secretary will forward the communication directly to the appropriate director or directors.
Compensation Committee Interlocks and Insider Participation
During 2016, none of Messrs. Bouillion, Funk, McShane or Ralls (Chair), who comprised the Compensation Committee, were officers or employees of the Company or any of our subsidiaries or had any relationships requiring disclosure in this proxy statement under “Certain Transactions,” and none of our executive officers served as a member of the compensation committee of another entity or as a director of another entity whose executive officers served on our Board or the Compensation Committee. No member of the Compensation Committee is a former officer of the Company.
| | 9 | |||
Table of Contents
|
In response to the market downturn and in order to align with compensation reductions of our management, our Board voted unanimously to reduce by 15% the annual retainer paid tonon-management directors effective April 1, 2016. As a result, during 2016 ournon-management directors received:
| • | an annual retainer of $85,000; |
| • | an additional annual fee of $20,000 for the chair of the Audit Committee; |
| • | an additional annual fee of $15,000 for the chair of the Compensation Committee; |
| • | an additional annual fee of $10,000 for the chair of the Corporate Governance Committee; |
| • | an additional annual fee of $25,000 for the Lead Director; and |
| • | an additional annual fee of $125,000 for thenon-executive chairman of the Board. |
Mr. Hall has served as Chairman of the Board since 1995, during which time he received no additional annual fee for serving as Chairman. In order to better align with market norms, the Board voted unanimously to fix the additional annualized fee for thenon-executive chairman of the Board at $125,000, effective April 1, 2016.
To better align thenon-management directors’ compensation with the financial interests of our stockholders, a significant portion of their compensation is paid in the form of restricted stock units (RSUs) with grant date fair values of approximately $200,000. The RSUs are granted on the day following each annual meeting of our
stockholders, with the number of RSUs granted determined by dividing $200,000 by the closing price of our common stock on the day of the annual meeting, and rounding up to the next whole RSU. In addition, if the director’s initial election or appointment does not occur at an annual meeting, then he or she will receive a pro rata number of RSUs based on the number of full calendar months between the date of election or appointment and the first anniversary of the previous annual meeting.
The RSUs vest and pay out in shares of our common stock on the date of the next year’s annual meeting, subject to the applicable director’s continued service through such date and further subject to each director’s ability to elect to defer receipt of the shares of our common stock under our Directors Deferred Compensation Plan.
Under our Directors Deferred Compensation Plan,non-management directors may elect to defer compensation received from the Company for service on our Board. Deferred cash compensation will earn a rate of return based on hypothetical investments in certain mutual funds from which the director may select, or may be converted to deferred stock units. Both the deferred stock units and any deferred restricted stock units will be paid out in shares of our common stock and will be credited with dividend equivalents for any dividends paid on our common stock. Director participants may elect the timing of the distributions of their deferred compensation, which may be made in a lump sum payment or installments, provided that all payments are made no later than 10 years following the director’s termination of service on our Board.
In 2016 our Board voluntarily determined to reduce their own annual retainers by 15% in a show of solidarity with stockholders and alignment with management.
|
| 10 | | |||
Table of Contents
|
DIRECTOR COMPENSATION
|
|
The table below summarizes the compensation of ournon-management directors for 2016. As CEO and President, Mr. Dunlap does not receive any additional compensation for his service as a director. His compensation as an executive is reflected in the “2016 Summary Compensation Table” under “Executive Compensation.” Allnon-management directors are reimbursed for reasonable expenses incurred in attending Board and committee meetings.
2016 Director Compensation
| Name | Fees Earned Or Paid in Cash(1) | Stock
| All Other
| Total | ||||
Mr. Bouillion
| $108,750
| $200,015
| $3,003
| $311,767
| ||||
Mr. Funk
| $113,750
| $200,015
| $3,309
| $317,074
| ||||
Mr. Hall
| $182,500
| $200,015
| $1,181
| $383,696
| ||||
Mr. Kinnear
| $98,750
| $200,015
| $ 927
| $299,692
| ||||
Ms. Longoria
| $88,750
| $200,015
| $ 0
| $288,765
| ||||
Mr. McShane
| $88,750
| $200,015
| $835
| $289,600
| ||||
Mr. Ralls
| $111,250
| $200,015
| $835
| $312,100
| ||||
| (1) | Amounts shown reflect fees earned by the directors as retainers or fees for their service on our Board during 2016. Mr. Ralls elected to defer his cash retainer into deferred stock units. Mr. Ralls was inadvertently paid an excess annual retainer amount equal to $7,500 in 2016 which has been offset against his Q1 2017 retainer payment. |
| (2) | Amounts reflect the aggregate grant date fair value of the RSU awards calculated in accordance with FASB ASC Topic 718 at the closing sales price of our common stock on the date of grant. On May 25, 2016, eachnon-employee director received an award of 12,431 RSUs, with a grant date fair value of $16.09 per unit. The aggregate RSUs held by our directors as of December 31, 2016 were as follows: Mr. Bouillion – 49,964 RSUs; Mr. Funk – 71,741 RSUs; Mr. Hall – 27,194 RSUs; Mr. Kinnear – 24,021 RSUs; Ms. Longoria – 12,431 RSUs; and Mr. McShane – 22,868 RSUs; Mr. Ralls – 31,383 RSUs and 13,683 DSUs. |
| (3) | The amounts reflected in “All Other Compensation” include accrued dividend equivalents on outstanding RSUs that were granted prior to the Company’s commencement of paying dividends on its common stock (accordingly the payment of dividends was not part of the grant date valuation of these awards). |
| | 11 | |||
Table of Contents
|
The following table shows the number of shares of our common stock beneficially owned by holders as of March 31, 2017, known by us to beneficially own more than 5% of the outstanding shares of our common stock. The information in the table is based on our review of filings with the SEC.
Name and Address of Beneficial Owner
| Amount and Nature of Beneficial Ownership | Percent of Class(1)
| ||
BlackRock, Inc. 40 East 52nd Street New York, New York 10022 | 18,474,442(2) | 12.1% | ||
The Vanguard Group 100 Vanguard Boulevard Malvern, Pennsylvania 19355 | 12,005,962(3) | 7.9% | ||
Victory Capital Management Inc. 4900 Tiedeman Road, 4th Floor Brooklyn, Ohio 44144 | 9,082,128(4) | 5.9% | ||
FMR, LLC 245 Summer Street Boston, Massachusetts 02210 | 7,748,797(5) | 5.1% |
| (1) | Based on 152,831,563 shares of our common stock outstanding as of March 31, 2017. |
| (2) | In the Schedule 13G filed on January 17, 2017, BlackRock, Inc. reported that it has the sole power to dispose or direct the disposition of all the shares reported and the sole power to vote or direct the vote of 17,771,240 shares of our common stock. |
| (3) | In the Schedule 13G filed on February 10, 2017, the Vanguard Group reported that it has (i) the sole power to dispose or direct the disposition of 11,905,956 shares, (ii) the shared power to dispose or direct the disposition of 100,006 shares, (iii) the sole power to vote or direct the vote of 89,005 shares, and (iv) the shared power to vote or direct the vote of 18,001 shares of our common stock. |
| (4) | In the Schedule 13G filed on February 13, 2017, Victory Capital Management, Inc. reported that it has the sole power to dispose or direct the disposition of all the shares reported and the sole power to vote or direct the vote of 8,555,035 shares of our common stock. |
| (5) | In the Schedule 13G filed on February 14, 2017, FMR, LLC reported that it has the sole power to dispose or direct the disposition of all the shares reported and the sole power to vote or direct the vote of 723 shares of our common stock. |
| 12 | | |||
Table of Contents
|
OWNERSHIP OF SECURITIES
|
|
Management and Director Stock Ownership
The following table shows the number of shares of our common stock beneficially owned as of March 31, 2017, by (i) our currentnon-management directors, (ii) our “named executive officers,” as defined below in “Executive Compensation — Compensation Discussion and Analysis,” and (iii) all of our current directors and executive officers as a group. The information in the table is based on our review of filings with the SEC. Each person listed below has sole voting and investment power with respect to the shares beneficially owned unless otherwise stated.
Name of Beneficial Owner
| Amount and Nature of Beneficial Ownership(1) |
Percent of
| ||
NON-MANAGEMENT DIRECTORS:(2)
| ||||
Harold J. Bouillion
| 81,666
| *
| ||
James M. Funk
| 80,969
| *
| ||
Terence E. Hall
| 1,055,160
| *
| ||
Peter D. Kinnear
| 56,197
| *
| ||
Janiece M. Longoria
| 22,619
| *
| ||
Michael M. McShane
| 85,212
| *
| ||
W. Matt Ralls
| 101,443
| *
| ||
NAMED EXECUTIVE OFFICERS
| ||||
David D. Dunlap
| 1,607,106
| 1.05
| ||
Robert S. Taylor
| 627,144
| *
| ||
Brian K. Moore
| 593,598
| *
| ||
A. Patrick Bernard
| 434,739
| *
| ||
William B. Masters
| 385,610
| *
| ||
All directors and executive officers as a group (13 persons)(4)
| 5,326,393
| 3.49%
| ||
| * | Less than 1%. |
| (1) | Includes the number of shares subject to options that are exercisable within 60 days, as follows: Mr. Hall (757,652); Mr. Dunlap (1,121,449); Mr. Taylor (440,824); Mr. Moore (324,074); Mr. Bernard (318,159); Mr. Masters (275,083); and all directors and executive officers as a group (3,237,241). |
| (2) | Includes the number of shares thenon-management director will receive upon vesting of RSUs or the payout of deferred stock units, as noted, within 60 days, as follows: Mr. Bouillon (49,964); Mr. Funk (48,442, plus 20,566 deferred RSUs); Mr. Hall (27,194); Mr. Kinnear (24,021); Ms. Longoria (12,431); Mr. McShane (22,868); and Mr. Ralls (22,868, plus 22,198 deferred RSUs). Each RSU granted to directors prior to 2013 vested immediately upon grant, but the shares of Company common stock payable upon vesting will not be delivered to the director until he ceases to serve on our Board. Beginning with the 2013 grants, the RSUs vest and pay out in shares of our common stock the year following the grant, subject to each director’s ability to elect to defer receipt of the shares. |
| (3) | Based on 152,831,563 shares of our common stock outstanding as of March 31, 2017. |
| (4) | One executive officer (not a named executive officer) had previously pledged 7,778 shares to secure a personal line of credit. This pledge was in place prior to the adoption of our anti-pledging policy in 2013. |
| | 13 | |||
Table of Contents
|
OWNERSHIP OF SECURITIES
|
|
Section 16(a) Beneficial Ownership Reporting Compliance
Section 16(a) of the Exchange Act requires our directors and executive officers to file with the SEC reports of ownership and changes in ownership of our equity securities. Based solely upon our review of the Forms 3, 4 and 5 filed during 2016, and written representations from our directors and executive officers, we believe that all required reports were timely filed during 2016.
| 14 | | |||
Table of Contents
ADVISORY VOTE ON OUR NAMED EXECUTIVE OFFICERS’ 2016 COMPENSATION (PROPOSAL 2)
|
In accordance with Section 14A of the Exchange Act and the related rules of the SEC, our stockholders have the opportunity to cast an advisory,non-binding vote to approve the compensation of our named executive officers as disclosed in this proxy statement (our“say-on-pay” proposal). This vote is not intended to address any specific item of compensation but rather the overall compensation of our named executive officers for 2016 and our compensation philosophy and practices. In considering how to vote on this proposal, we urge you to carefully consider the information in the “Executive Compensation” section of this proxy statement, namely the Compensation Discussion and Analysis, including its Executive Summary and the compensation tables and accompanying narrative disclosures.
The Compensation Committee of the Board designs, implements and administers our compensation program for our executive officers, including our named executive officers. As noted in the Compensation Discussion and Analysis, the majority of our executives’ target direct compensation isat-risk, with a significant percentage of the target compensation (87% for our CEO and an average of nearly 78% for our other current named executive officers) based on annual and long-term performance measures. Our core executive compensation philosophy and practice continue to be based on pay for performance with an understanding of current market conditions, and we believe that our compensation program is strongly aligned with the long-term interests of our stockholders.
At last year’s annual meeting, we provided our stockholders with the opportunity to cast anon-binding advisory vote regarding the 2015 compensation of our named executive officers as disclosed in our proxy statement for the 2016 annual meeting of stockholders. Showing strong support for our efforts to align compensation with results and total shareholder return during the recent market downturn, our stockholders approved the 2016say-on-pay proposal
by an affirmative vote of 97% of the holders of shares of our common stock present and entitled to vote on the proposal.
We are again asking our stockholders to vote on the following resolution:
RESOLVED, that the stockholders of Superior Energy Services, Inc. (the Company) approve, on an advisory basis, the compensation of the Company’s named executive officers for 2016 as disclosed in the Company’s proxy statement for the 2017 annual meeting of stockholders pursuant to the rules of the Securities and Exchange Commission.
While thissay-on-pay vote is not binding, the Company, our Board and the Compensation Committee value the opinions of our stockholders and will consider the outcome of the vote when making future compensation decisions for our named executive officers. We invite stockholders who wish to communicate with our Board on executive compensation matters or any other matter to contact us as provided under “Corporate Governance — Communications with our Board.” Additionally, the Company engages our larger stockholders at least annually to discuss both compensation and governance matters as discussed more fully in the “Stockholder Outreach” section of this proxy.
Vote Required
The approval, by an advisory vote, of the compensation of our named executive officers requires the affirmative vote of the holders of a majority of the shares of our common stock present in person or by proxy at the annual meeting and entitled to vote on such proposal. It is expected that, unless the Board modifies its policy on the frequency of futuresay-on-pay advisory votes, we will hold our next“say-on-pay” vote at our 2018 annual meeting of stockholders.
Our Board unanimously recommends a voteFOR Proposal 2.
| ||||
| | 15 | |||
Table of Contents
ADVISORY VOTE ON THE FREQUENCY OF FUTURE ADVISORY VOTES ON OUR NAMED EXECUTIVE OFFICERS’ COMPENSATION (PROPOSAL 3)
|
Our stockholders have the opportunity to cast an advisory,non-binding vote on how often we should include asay-on-pay proposal in our proxy materials for future annual shareholder meetings or any special shareholder meeting for which we must include executive compensation information in the proxy statement for that meeting (our“say-on-frequency” proposal). Under thissay-on-frequency proposal, our stockholders may vote to have thesay-on-pay vote every year, every two years, or every three years. Our stockholders voted on a similar proposal in 2011 with the majority voting to hold asay-on-pay vote every year.
We share the concerns of some investors that annualsay-on-pay votes may (i) pressure compensation committees to try to adjust long-term compensation plans to mirror near-term, cyclical stock price movements, and (ii) be unnecessary, as investors can already express pay concerns through their annual votes on compensation committee members. However, at this time we continue to believe that annualsay-on-pay votes remain the market norm and allow our stockholders to express their views timely on our executive compensation program.
While thissay-on-frequency vote is not binding, the Company, our Board and the Compensation Committee value the opinions of our stockholders and will consider the outcome of the vote when making future decisions regarding the frequency of conducting asay-on-pay vote. Stockholders may cast their advisory vote to conduct advisory votes on executive compensation every “1 Year,” “2 Years,” “3 Years,” or “Abstain.” The Board recommends a vote on Proposal 3 to holdsay-on-pay votes every 1 Year.
Vote Required
The approval, by an advisory vote, of the frequency of votes on the compensation of our named executive officers requires the affirmative vote of the holders of a majority of the shares of our common stock present in person or by proxy at the annual meeting and entitled to vote on such proposal. Our“say-on-frequency” vote currently occurs once every six years. Accordingly, we expect to hold the next“say-on-frequency” vote at our 2023 annual meeting of stockholders.
Our Board unanimously recommends a vote on Proposal 3 to hold future“say-on-pay” votesEVERY 1 YEAR.
| ||||
| 16 | | |||
Table of Contents
RATIFICATION OF THE APPOINTMENT OF OUR INDEPENDENT REGISTERED PUBLIC ACCOUNTING FIRM (PROPOSAL 4)
|
The Audit Committee has selected KPMG as our independent registered public accounting firm (independent auditor) for the fiscal year ending December 31, 2017, which, as a matter of good corporate practice, we submit to our stockholders for ratification. If the selection is not ratified by our stockholders, the Audit Committee will consider whether it is appropriate to select another independent auditor. Even if the selection is ratified, the Audit Committee in its discretion may select a different independent auditor at any time during the year if it determines that such a change would be in the best interests of the Company and our stockholders.
KPMG has audited the Company’s financial statements since 1995. The Audit Committee took a number of factors into consideration in determining whether to reappoint KPMG as the Company’s independent auditor, including KPMG’s historical and
recent performance of the Company’s audit, KPMG’s capabilities and expertise, its tenure as the Company’s independent auditor and its familiarity with our business and operations, the appropriateness of its professional fees and its independence.
Representatives of KPMG are expected to be present at the annual meeting and will have an opportunity to make a statement if they desire to do so. They will also be available to respond to appropriate questions from our stockholders.
Vote Required
The ratification of the appointment of KPMG as our independent auditor for 2017 requires the affirmative vote of the holders of a majority of the shares of our common stock present in person or by proxy at the annual meeting and entitled to vote on such proposal.
The Audit Committee and our Board unanimously recommend a voteFOR Proposal 4.
| ||||
| | 17 | |||
Table of Contents
|
RATIFICATION OF THE APPOINTMENT OF OUR INDEPENDENT REGISTERED PUBLIC ACCOUNTING FIRM (PROPOSAL 4)
|
|
Fees Paid to Independent Registered Public Accounting Firm
The following is a summary and description of fees billed to the Company for professional services rendered by KPMG in 2016 and 2015.
Fiscal Year Ended December 31,
| ||||||||
| 2016 | 2015 | |||||||
Audit Fees(1) | $ | 3,103,882 | $ | 3,146,945 | ||||
Audit-Related Fees | — | — | ||||||
Tax and StatutoryReporting | $ | 228,616 | $ | 166,892 | ||||
All Other Fees | — | — | ||||||
| (1) | Audit fees were for the audit of the annual consolidated financial statements and review of the quarterly consolidated financial statements, for the audit of internal control over financial reporting, and for services normally provided by KPMG in connection with statutory audits and review of documents filed with the SEC. |
| (2) | Reflects fees for professional services rendered for tax compliance, tax advice, tax planning, statutory reporting, and other international, federal and state projects. |
The Audit Committee mustpre-approve all audit and permissiblenon-audit services provided by the independent auditor, and follows established approval procedures to ensure that the independent auditor’s independence will not be impaired. Regarding services requiring specificpre-approval, the Company’s Chief Financial Officer submits requests along with a joint statement from the independent auditor as to whether, in their view, the request for services is consistent with the SEC’s rules on auditor independence.
The Audit Committee delegatedpre-approval authority for routine audit, audit-related and tax services specifically listed in thepre-approval policy to its chair for any individual service estimated to involve a fee of less than $75,000, and the chair reports anypre-approval decisions to the Audit Committee at its next scheduled meeting. The Audit Committee does not delegate to management its responsibility topre-approve services to be performed by the Company’s independent auditor.
All audit and tax fees described above were approved by the Audit Committee before services were rendered.
| 18 | | |||
Table of Contents
|
The Audit Committee assists the Board in its oversight of the integrity of the Company’s financial statements, the independent auditor’s qualifications, independence and performance, the performance of the Company’s internal audit function and the Company’s compliance with legal and regulatory requirements. The Audit Committee is comprised of fournon-employee directors, each of whom meet the independence and financial literacy requirements under the SEC rules and NYSE listing standards, including the heightened NYSE independence requirements for audit committee members, and three of whom qualify as an “audit committee financial expert” as defined by the SEC.
The Audit Committee operates under a written charter adopted by the Board that complies with all current regulatory requirements. The charter is reviewed at least annually. A copy of the charter can be found on the Company’s website atwww.superiorenergy.com/about/corporate-governance/.
Management is responsible for preparing and presenting the Company’s financial statements, and for maintaining appropriate accounting and financial reporting policies and practices, as well as internal controls and procedures designed to assure compliance with accounting standards and applicable laws and regulations. KPMG, our independent auditor, is responsible for performing an independent audit of our financial statements in accordance with generally accepted auditing standards, and expressing opinions on the conformity of the Company’s audited financial statements with generally accepted accounting principles and on the Company’s internal control over financial reporting. The members of the Audit Committee rely, without independent verification, on the information provided and representations made to them by management and KPMG.
In performing its oversight function, over the course of the year the Audit Committee, among other matters:
| • | reviewed and discussed with management, the Company’s internal auditor and KPMG the Company’s quarterly and annual earnings press releases, consolidated financial statements and Form10-Q’s filed with the SEC, including disclosures under “Management’s Discussion and Analysis of Financial Condition and Results of Operations”; |
| • | reviewed and discussed with management, the Company’s internal auditor and KPMG the Company’s audited financial statements and related footnotes for the year ended December 31, 2016, including disclosures under “Management’s Discussion and Analysis of Financial Condition and Results of Operations”; |
| • | reviewed and discussed with management, the Company’s internal auditor and KPMG management’s assessment of the effectiveness of the Company’s internal controls over financial reporting and KPMG’s evaluation of the Company’s internal controls over financial reporting; |
| • | inquired about significant business and financial reporting risks, reviewed the Company’s risk management process, and assessed the steps management is taking to control these risks; |
| • | met in quarterly executive sessions with the CEO, the internal auditor, and KPMG, including to discuss the results of their examinations, their evaluations of internal controls, and the overall quality of the Company’s financial reporting; |
| • | discussed with KPMG the matters required to be discussed by the independent auditor with the Audit Committee under the Public Company Accounting Oversight Board (PCAOB) applicable auditing standards, including Auditing Standard No. 16,Communications with Audit Committees; and |
| • | reviewed the policies and procedures for the engagement of KPMG, including the scope of the audit, audit fees, auditor independence matters and the extent to which KPMG may be retained to performnon-audit services. |
The Audit Committee leads in the selection of the lead audit engagement partner, working with KPMG with input from management, and annually reviews and assesses the performance of the KPMG audit team, including the lead audit engagement partner. As part of its auditor engagement process, the Audit Committee also considers whether to rotate the independent registered public accounting firm. Following this assessment and evaluation, the Audit Committee concluded that the selection of KPMG as the independent registered public accounting firm for fiscal year 2017 is in the best interest of the Company and its shareholders.
| | 19 | |||
Table of Contents
|
AUDIT COMMITTEE REPORT
|
|
The Audit Committee also reviewed KPMG’s independence, and as part of that review, received and discussed the written disclosures and the letter from KPMG required by applicable requirements of the PCAOB regarding the independent auditor’s communications with the Audit Committee concerning independence. Additionally, as further described under“Pre-Approval Process,” the Company maintains an auditor independence policy that requirespre-approval of all audit and permissiblenon-audit services provided by the independent registered public accounting firm. The Audit Committee considers whether KPMG’s provision of thesenon-audit services to us is consistent with its independence, and concluded that it is.
Based on the reviews and discussions described above, and subject to the limitations on the roles and responsibilities of the Audit Committee referred to above and in its charter, the Audit Committee recommended to the Board that the Company’s audited financial statements be included in our Annual Report on Form10-K for the fiscal year ended December 31, 2016 for filing with the SEC.
THE AUDIT COMMITTEE
|
Harold J Bouillion (Chair) |
Peter D Kinnear |
Janiece M. Longoria |
Michael M McShane |
| 20 | | |||
Table of Contents
|
Our practice has been that any transaction which would require disclosure under Item 404(a) of RegulationS-K of the rules and regulations of the SEC, with respect to a director or executive officer, must be reviewed and approved by our Audit Committee. The Audit Committee reviews and investigates any matters pertaining to the integrity of our executive officers and directors, including conflicts of interest, or adherence to standards of business conduct required by our policies. We are currently not a party to any transactions requiring such disclosure.
| | 21 | |||
Table of Contents
| 22 | | |||
Table of Contents
|
COMPENSATION DISCUSSIONAND ANALYSIS (CD&A)
This CD&A is designed to provide stockholders with an understanding of our compensation philosophy and objectives, as well as the analysis that we performed in setting executive compensation for 2016. It discusses the Compensation Committee’s (referred to as the Committee in this CD&A) determination of how and why, in addition to what, compensation actions were taken during 2016 for our Chief Executive Officer, our Chief Financial Officer and our three other most highly compensated executive officers (the named executive officers or NEOs):
• David D. Dunlap, our President and Chief Executive Officer;
• Robert S. Taylor, our Executive Vice President, Chief Financial Officer and Treasurer;
• Brian K. Moore, our Executive Vice President;
• A. Patrick Bernard, our Executive Vice President; and
• William B. Masters, our Executive Vice President, General Counsel and Secretary.
EXECUTIVE SUMMARY
A Note from Our Compensation Committee Chair
“The severe industry downturn over the past two years has highlighted the challenge of balancing shareholder returns and executive compensation. Achieving that balance, which is a fundamental principle of our compensation philosophy, requires that we continually evaluate pay levels and performance targets in our compensation plans to reflect current market conditions and outlook. We strive to achieve a compensation program that ensures the ability to attract and retain a talented management team that can steer the company through these market cycles, and aligns management’s compensation with shareholder returns over the long-term.
In crafting our short-term incentives, we give careful consideration to setting performance objectives that focus
management’s attention on the highest priorities for maximizing the company’s performance for the current year. Our long-term incentive compensation plan, which represents the majority of our management team’s compensation, is intended to align management’s long-term interests with those of our shareholders, consistent with the company’s long-term strategy. Accordingly, the performance objectives of our long-term plans are (i) focused on total shareholder return and return on assets, and (ii) evaluated periodically to ensure appropriate targets are set.
On behalf of the Committee, I want to assure our shareholders that we take very seriously our responsibility for striking the balance discussed above. We appreciate your support and are confident that your management team is responding appropriately and effectively to changes in market conditions.”
-Matt Ralls
SPN Compensation Committee, Chair
| | 23 | |||
Table of Contents
|
EXECUTIVE COMPENSATION
|
|
Our 2016 Performance and 2017 Outlook
2016 presented a challenging year for our industry, with stubbornly low oil and gas prices pressuring our customers to continue to curtail their operations and reduce their capital expenditures. Against this backdrop, we took significant andpro-active steps to continue to reduce our cost structure, preserve liquidity, and position ourselves for the upcycle. To that end, we reduced our capital expenditures by 78% and our general and administrative (G&A) expenses by 32%. We maintained our worldwide days sales outstanding (DSO) at 74 days—only athree-day increase over 2014 and 2015 levels—and preserved $188 million in cash on hand as ofyear-end 2016. Importantly, we were able to preserve this level of cash afterpaying-off $325.0 million on our credit facility to extinguish the outstanding debt balance. Additionally, we extended the term of this credit facility by an additional two years, so that we have no current debt maturities until 2019.
However, the second half of 2016 witnessed incremental improvement of commodity prices, reversing the downward trend that began two years earlier. As many of our customers gradually increased activity levels and spend, we activated idle equipment, emerged as an early responder to the market recovery, seized market share and increased revenue by the fourth quarter of 2016. Buoyed by this performance, our stock price improved by better than 25% during 2016.
Looking ahead, we remain optimistic about a sustainable industry recovery throughout 2017, though we appreciate it will benon-linear. We feel confident the steps we have taken during this downturn have positioned us for growth as we pursue long-term stockholder value creation.
In 2016, wereduced the base salaries for our named executive officersby 15%, and maintained the37.5%reduced annual incentive plan (AIP) payout opportunities implemented in 2015.
|
Summary of 2016 Incentive Measures, Company Results and 2016 Payouts
Our financial and operational performance during 2016, discussed in more detail in the Proxy Summary section above, resulted in payouts under our annual incentive program and performance share units which were largely consistent with those in 2015 (and significantly reduced from 2014 levels). The following components and results of our 2016 incentive programs are discussed in detail later in this CD&A.
Incentive Program Element
|
Performance Category
|
Performance Metric
|
Company Performance v. Target
|
Resulting
|
Overall Payout Value
| |||||||
Annual Incentive Program (AIP) | Financial |
EBITDA (75% of Award)
| Below Minimum |
0% of Target (No Payout)
| 31.25% of Target | |||||||
| Operational | Key Operational (25% of Award) | Above Target | 125% of Target | |||||||||
Long-Term Incentive (LTI) Program - Performance Share Units (PSUs): 2014-2016 Cycle
| Financial |
Return on Invested (50% of Award)
| 54th Percentile | 116% of Target | 105% of Target | |||||||
| Stock Price |
TSR Percentile Rank (50% of Award)
| 47th Percentile | 94% of Target |
As each of the two LTI program components contribute toward half of the measured performance, the financial component (ROIC) contributes 58% of the overall payout value, and the stock price component (TSR) contributes 47% of the overall payout.
| 24 | | |||
Table of Contents
|
EXECUTIVE COMPENSATION
|
|
APPROACH TO 2016 COMPENSATION
In designing the 2016 executive compensation program, the Committee remained committed to balancing incentivization and strategy alignment with stockholder interests. To that end, the Committee decided to take the following action with respect to 2016 compensation:
Base Salary Reductions for Named Executive Officers – After determining not to increase base salaries in 2015, the Committee elected, upon management’s recommendation, to reduce by 15% the base salaries of the NEOs effective as of April 1, 2016.
Revised Annual Incentive Program (AIP) – The Committee determined to maintain the 37.5% reduced potential payout opportunities (as a percentage of salary) for all executives. The financial component of the annual incentive program, which represents 75% of the target payout, remained based on earnings before interest, taxes, depreciation and amortization (EBITDA).1
Named Executive Officer
|
2014 Target (Normal Target)
|
2016 Target (Reduced Target)
| ||
Mr. Dunlap
|
120%
|
75%
| ||
Mr. Taylor
|
80%
|
50%
| ||
Mr. Moore
|
75%
|
46.88%
| ||
Mr. Bernard
|
70%
|
43.75%
| ||
Mr. Masters
|
70%
|
43.75%
|
| • | Additionally, the Committee changed the operational component of the program, which represents the remaining 25% of the target payout, to reflect the Committee’s assessment of the Company’s achievement of quantitative metrics more focused on our strategy of reducing costs and preserving liquidity. To that end, the four key operational objectives focused on: |
✓ reducing general and administrative costs;
✓ preserving cash and generating free cash flow;
✓ managing days sales outstanding (DSO); and
✓ managing days payables outstanding (DPO).
The Committee implemented these changes to keep our NEOs focused on managing the downturn within our industry and preparing for the upcycle. Specifically, the changes reflect the Committee’s aim to conform our cost structure to a reduced revenue base and to conserve cash in order to maximize financial flexibility going forward.
As in years past,the entire amount of the AIP payout remained subject to a reduction of up to 15% based on the Company’s overall safety performance for the year.
Revised LTI Program –The Committee granted 50% of our executives’ annual long-term equity awards in the form of options (instead of 25% restricted stock units and 25% options) in order to better align the interests of our executives with those of our stockholders by focusing them on share price appreciation. The other 50% of the annual long-term equity awards remained PSUs.
The Committee feels the actions described above were appropriate in the market environment faced in early 2016, and that the structure of the 2016 program continued to achieve the balance of incentivization and alignment with stockholder interests.
| (1) | EBITDA is anon-GAAP financial measure. The Company provides reconciliations to the nearest GAAP measure for these and othernon-GAAP measures on a quarterly basis (http://ir.superiorenergy.com/phoenix.zhtml?c=97570&p=irol-nonGaap). |
| | 25 | |||
Table of Contents
|
EXECUTIVE COMPENSATION
|
|
2016 Market Activity
The first quarter of 2016 presented an extremely challenging market environment due to the sudden and significant downturn in crude oil prices. However, commodity prices began to stabilize during the second half of the year. This improvement in oil prices was related to macroeconomic forces, such as a leveling of supply resulting in part from OPEC and certain keynon-OPEC nations agreeing to cap levels of production temporarily. The result was that 2016 marked a continuation of the considerable volatility seen in recent years in oilfield service stock prices.
The change in oil prices and relative effect on the OSX and our stock price (SPN) during 2016 is displayed in the following chart:
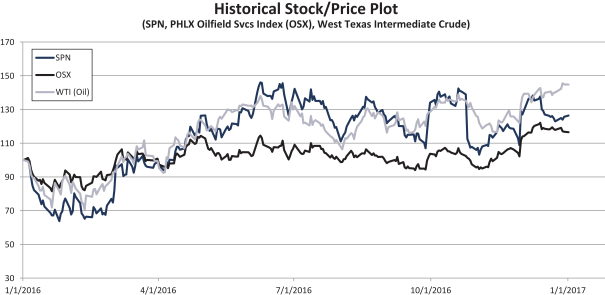
As seen in the chart above, the Company’s stock price outperformed the OSX index, improving approximately25% during 2016, yielding a strong return for our stockholders.
The structure of our executive compensation program for a given year is determined prior to or in the beginning of the calendar year. Specifically, base salary adjustments, if any, are normally effective January 1st, and the parameters of our AIP are established and grants under our LTI program are made effective early in the first quarter.
Over 87% of our CEO’s target direct compensation is incentive-based, with a balance between incentives linked to the financial and operational performance of the Company and incentives that are tied directly to stock performance. The Committee believes it is important to have this balance so that executives are focused on both stockholder return and the financial metrics that promote the long-term vitality of the Company. This is particularly important in a cyclical industry like ours.
| 26 | | |||
Table of Contents
|
EXECUTIVE COMPENSATION
|
|
The graph below clearly illustrates the parallel movement of our CEO’s compensation with our total shareholder return (TSR) from 2014 to 2015, and the strongpay-for-performance correlation as CEO compensation declined in lock-step with TSR during that time. Overall, CEO compensation was reduced nearly 25% in 2015 compared to 2014, including an 84% reduction in the AIP component, as noted below. Further, CEO compensation increased by a comparatively modest 7.1% in 2016, considerably trailing our strong TSR in 2016 as our stock price improved approximately 25% during the year.
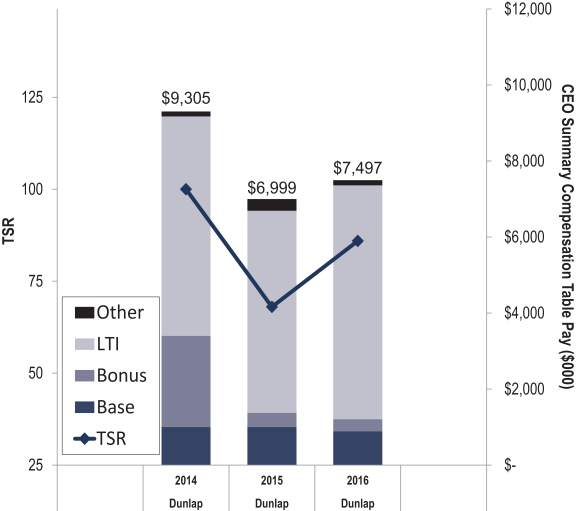
| | 27 | |||
Table of Contents
|
EXECUTIVE COMPENSATION
|
|
Responding to the market downturn, the Committee significantly reduced the payout opportunities under our annual incentive plan by 37.5% during 2015 and 2016, as illustrated in the graph below. Achieving a payout under the financial component (representing 75% of the AIP) continues to be challenging given that the threshold payment requires achieving an EBITDA target approximately equal to 87% of our pro forma budget for the year, with target and maximum payouts having EBITDA targets approximately equal to 100% and 126% of our budget, respectively. These ambitious targets are designed to ensure alignment of compensation with our operational performance.
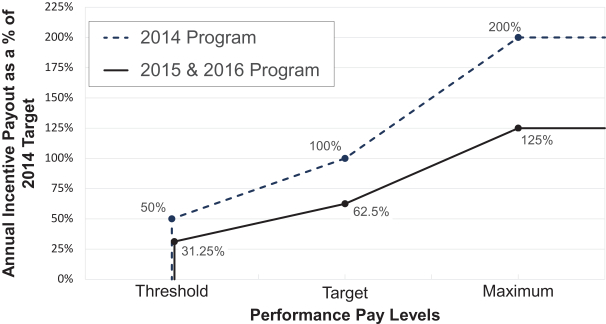
Compensation Best Practices
We strive to align executive compensation with stockholder interests, and to incorporate strong governance standards within our compensation program, such as:
Ø 50% of Long-Term Incentives are Performance-Based – during 2016, we granted a combination of stock options and PSUs under our long-term incentive program, with half of the grant date value awarded in PSUs that pay out based on our relative achievement against our peers under TSR and return on assets (ROA) metrics.
Ø Annual Incentives Based on Performance – our annual incentive awards are based on Company financial, operational and performance measures as determined by the Committee.
Ø Balanced Mix of Performance-Based Compensation – we provide a balanced mix of performance-based compensation designed to motivate our executives to improve both our
financial and stock-price performance and maintain alignment with both short and long-term objectives.
Ø Anti-Hedging and Anti-Pledging Policies – we prohibit our executives and directors from hedging and pledging Company securities.
Ø Broad-based Long-Term Incentive Program – we grant long-term incentive awards broadly within the Company. In 2016, we granted awards to 488non-executive management employees in an effort to promote stock ownership and alignment of stockholder interests within our organization.
Ø “Double Trigger” Payments – our change of control program provides for change of control cash severance payments only if a qualifying termination of employment occurs in connection with the change in control.
| 28 | | |||
Table of Contents
|
EXECUTIVE COMPENSATION
|
|
Ø Clawback Policy – our annual incentive awards and long-term incentive awards are subject to a clawback policy, which applies to all of our executive officers and provides for the forfeiture of these awards or the return of any related gain in the event of a restatement of our financial statements.
Ø No Excise TaxGross-Ups – we do not provide excise taxgross-ups in any executive employment agreement or severance or change of control program.
Ø Robust Stock Ownership Guidelines for CEO – we require our executive officers and directors to maintain certain levels of ownership in the Company, thus aligning their interests with our stockholders’ interests, and all of our executives currently exceed their ownership requirements by a significant amount. The
ownership level for our chief executive officer is six times his base salary.
Ø Holding Requirement on Equity Shares – our stock ownership guidelines require that our executives maintain ownership of at least 50% of the netafter-tax shares of common stock acquired from the Company pursuant to any equity-based awards, unless the executive has met his individual ownership requirement.
Ø Engagement of Independent Compensation Consultant – our Committee retains an independent compensation consultant who reports directly to the Committee and does not provide any other services to management or the Company.
Ø Review of Tally Sheets – our Committee annually reviews tally sheets summarizing the compensation of our executive officers.
Results of 2016Say-on-Pay Vote and Our Response
At our 2016 Annual Meeting, our stockholders approved our annualsay-on-pay proposal by an affirmative vote of97% of the holders of shares of our common stock present and entitled to vote on the proposal. Our stockholders showed strong support for our efforts to align compensation with performance results and TSR during the recent market downturn. We were also pleased in 2016 to have received positive recommendations from two leading proxy advisory firms that supported oursay-on-pay proposal.
Following the vote held at our 2016 Annual Meeting, we continued our annual effort to engage with a broad cross-section of our stockholders. Through our stockholder outreach program, we seek feedback on a variety of topics, including our operations, compensation and governance programs. Our stockholder outreach efforts are discussed in more detail above, under “Stockholder Outreach.” Based on the compensation feedback we received, we felt that our stockholders were generally supportive of our executive compensation philosophy and programs, and appreciated our continued focus on alignment of compensation, performance and TSR. The Committee’s efforts in 2017 to balance incentivization and stockholder interests are discussed below in the section titled “Approach to 2017 Compensation.” We have continued our ongoing dialogue with our stockholders, and intend to continue to fully evaluate and be responsive to the feedback we receive.
| | 29 | |||
Table of Contents
|
EXECUTIVE COMPENSATION
|
|
How We View Compensation – Total Target Direct Compensation
Our executive compensation program is heavily performance-based, linking executive pay, Company performance and results for stockholders, and is appropriately balanced with short and long-term incentives. The primary components of our executive compensation program are base salary, annual and long-term incentives (which we collectively refer to as our executives’ “direct compensation”). Consistent with this approach, our program features a minimal level of fixed compensation in the form of base salary for our executives (approximately 13% for our CEO and an average of approximately 23% for our other current named executive officers), while annual and long-term incentives comprise over three-quarters of our executives’ target direct compensation. In addition, 50% of the compensation for our CEO and our other current named executive officers is based on annual and long-term performance. Our program also features elements of compensation that vary with stock price (comprised of stock options and PSUs for 2016). The following charts illustrate the target mix of direct compensation elements for our CEO, and our other current named executive officers (an average) during 2016.
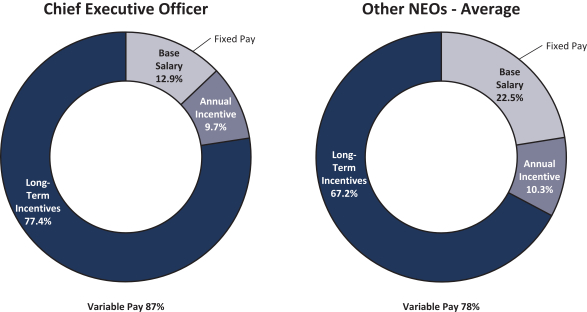
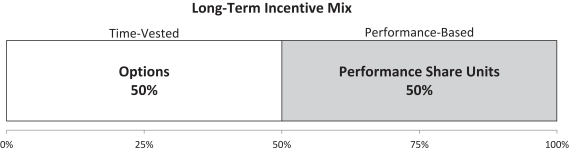
| 30 | | |||
Table of Contents
|
EXECUTIVE COMPENSATION
|
|
Historical Impact of Financial Performance on Executive Pay
The charts below show how the annual and long-term performance components of our program have paid out, or not paid out, over the last three years, commensurate with our results under the applicable performance components:
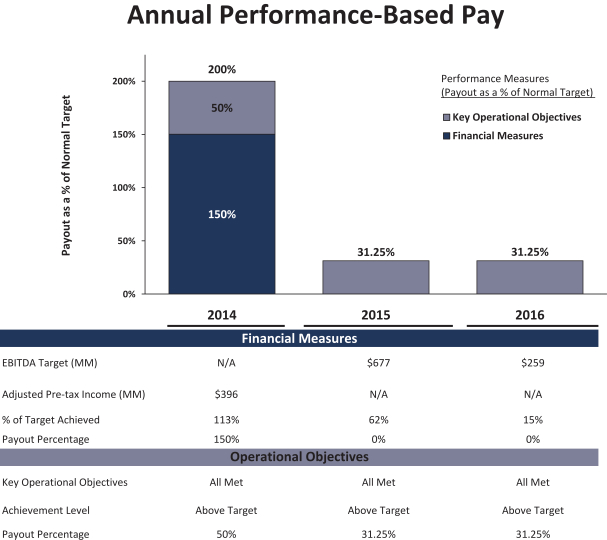
As noted above, our 2016 AIP measured performance based on our achievement ofpre-established EBITDA targets and selected quantitative operational objectives. As described further above, our performance was below the EBITDA target set for 2016, and under the threshold goal required for a payout of this portion under the program. In addition, the Committee determined that the Company had achieved above target performance under the operational objectives.
| | 31 | |||
Table of Contents
|
EXECUTIVE COMPENSATION
|
|
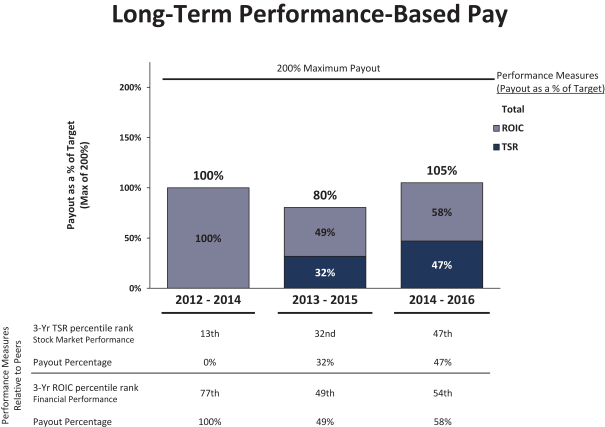
Target Total Direct Compensation v. Realizable Pay Analysis
In making its compensation decisions, the Committee focuses on target total direct compensation of our executives, and also evaluates target compensation against the compensation that is ultimately realized by our executives. The charts below highlight, for our CEO and our other named executive officers as a group, the differences between the target total direct compensation opportunity approved by the Committee, the 2016 compensation reported in the Summary Compensation Table and the “realizable” pay resulting from our performance. The following summarizes how target total direct compensation and realizable compensation are calculated, and how they differ from the amounts reported in the Summary Compensation Table.
Target Total Direct Compensation:
| Ø | Includes base salary, target annual incentive award for the fiscal year, and the total grant date value of long-term incentives granted for that fiscal year, but does not include All Other Compensation from the Summary Compensation Table. |
| Ø | Target total direct compensation differs from the compensation reflected in the Summary Compensation Table, which reports actual annual incentive award and PSU payouts and the grant date value of stock options. |
Realizable Compensation:
| Ø | Approximates the executives’ “take-home pay,“ and includes base salary, actual annual incentive awards and PSU payouts for the fiscal year, the value received from restricted stock or restricted stock units vesting and stock option exercises during the year, as well as the change in intrinsic value of all outstanding exercisable options. |
| 32 | | |||
Table of Contents
|
EXECUTIVE COMPENSATION
|
|
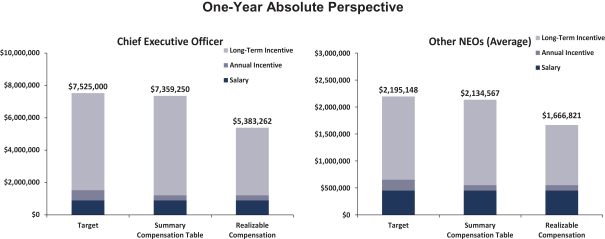
The realizable compensation of our CEO and other named executive officers was well below the target direct compensation and also lower than the values reported in the Summary Compensation Table. The realizable compensation for our CEO was about 27% below the values in the Summary Compensation Table and approximately 28% below the target direct compensation. Similarly, for our other named executive officers, the realizable compensation was about 22% below the values in the Summary Compensation Table and approximately 24% below the target direct compensation.
Three-Year Relative Perspective
To demonstrate the alignment of our CEO’s pay with our performance, the following graph compares our CEO’s realizable pay as a percent of target total direct compensation for the three-year period from 2014 through 2016 to our TSR performance relative to our Compensation Peer Group (as later defined) over the same period.
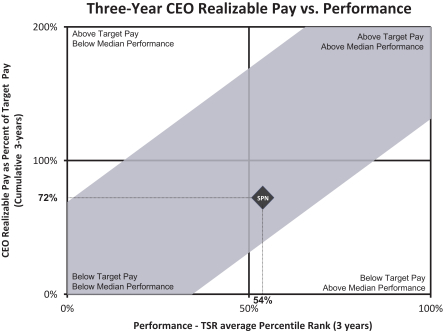
| | 33 | |||
Table of Contents
|
EXECUTIVE COMPENSATION
|
|
EXECUTIVE COMPENSATION PHILOSOPHY
The Committee is responsible for designing, implementing, and administering our executive compensation program. The Committee seeks to increase stockholder value by:
| Ø | rewarding performance; and |
| Ø | ensuring that we can attract and retain executives with the skills, educational background, experience and personal qualities needed to successfully manage and contribute to growing our business. |
In structuring our executive compensation program, the Committee is guided by the following principles:
|
| Principle
|
| Implementation
| |||
| Compensation should be performance driven and incentive compensation should comprise the largest part of an executive’s compensation package. | Ø The largest portion of our target executive compensation (87% for the CEO and 78% for the other NEOs) is comprised of LTI and AIP and is thereforeat-risk and performance based.
Ø Base salary, the only fixed element of compensation in our executive compensation program, accounts for approximately 13% of our CEO’s compensation and an average of 23% of our other named executive officers’ compensation.
| |||||
| Compensation levels should be competitive in order to attract and retain talented executives. | Ø The Committee annually seeks input from its independent compensation consultant regarding the competitiveness of our pay strategy relative to the market. We have established a process for evaluating the competitiveness of all elements of direct compensation.
| |||||
| Incentive compensation should balance short and long-term performance, including balancing short-term growth with long-term returns. | Ø Our AIP rewards executives for the achievement of annual goals based on our profitability and achievement of operational metrics.
Ø We provide long-term incentive opportunities that have significantly more potential reward value to the executive if goals are met and our share price grows.
Ø In order to encourage our executives to prudently grow our business without sacrificing long-term returns, the performance metrics used for our PSUs are our three-year relative TSR as compared to our peers and our three-year relative ROIC for PSUs granted prior to 2015 and our three-year relative ROA for PSUs granted in 2015 and thereafter.
Ø The Committee annually evaluates with its independent compensation consultant whether the program is balanced in terms of base pay and incentives, both short and long-term.
| |||||
| Compensation programs should provide an element of retention and motivate executives to stay with the Company long-term. | Ø Executives forfeit their opportunity to earn a payout of their PSUs if they voluntarily leave the Company before the three-year performance cycle is complete, except in the case of retirement. Also, the use of time-vested stock options provides a strong incentive for employees to stay with the Company.
Ø The retirement benefits provided under the Supplemental Executive Retirement Plan (SERP) increase the longer the executive remains with the Company.
| |||||
| Compensation programs should encourage executives to own Company stock, thus aligning their interests with our stockholders. | Ø Our stock ownership guidelines require our executive officers to own shares of Company stock equivalent to a stated multiple of the executive’s base salary. The multiple varies depending on the executive’s job title. See “Executive Compensation Policies — Stock Ownership Guidelines” for more information.
Ø All of our executives far exceed these ownership requirements. We grant shares of time-vesting RSUs as one of our long-term incentives, and may also elect to pay up to 50% of the value of our PSUs in common stock.
| |||||
| 34 | | |||
Table of Contents
|
EXECUTIVE COMPENSATION
|
|
HOW WE MAKE COMPENSATION DECISIONS
Role of Management in Setting Compensation
Our CEO recommends the compensation of our executive officers, other than himself. Each year, the CEO makes recommendations to the Committee regarding salary adjustments, percentage annual incentive targets under the AIP and long-term incentive grants to our other executive officers. In formulating his recommendations, the CEO considers various factors, including his subjective analysis of each executive’s performance and contributions to the Company, the performance of his business units (if applicable to the particular officer), experience level, tenure in position, the average base pay level for similar positions, and the Company’s performance. Although the Committee considers the CEO’s recommendations with respect to other executive officers, the Committee makes all final determinations regarding executive compensation (including determinations regarding the compensation of our CEO).
Role of Compensation Consultant
Since May 2007, the Committee has engaged Pearl Meyer & Partners, LLC (Pearl Meyer) as its independent executive compensation consultant to advise the Committee on matters relating to executive compensation and assist it in developing and implementing our executive compensation program. The Committee also discussed this CD&A with Pearl Meyer. As required by SEC and NYSE rules, the Committee has assessed the independence of Pearl Meyer and concluded that Pearl Meyer’s work did not raise any conflicts of interest during 2016. In making this determination, the Committee noted that during fiscal year 2016:
| • | Pearl Meyer only provided advisory services related to executive and director compensation; |
| • | Fees from the Company represented less than 1% of Pearl Meyer’s total revenue; |
| • | Pearl Meyer maintained a conflicts policy to prevent a conflict of interest or any other independence issues; |
| • | None of the team assigned to the Company had any business or personal relationship with members of the Committee outside of the engagement; |
| • | None of the team assigned to the Company had any business or personal relationship with any Company executive officer outside of the engagement; and |
| • | None of the team assigned to the Company maintained any individual position in our common stock. |
Peer Groups, Annual Benchmarking Process and Survey Data
The Committee evaluates the Company’s executive compensation practices and financial performance by reference to two different peer groups as described below: the Performance Peer Group and the Compensation Peer Group. The Performance Peer Group is comprised of oilfield service companies which were chosen due to similarity of services provided, operating footprint, business focus, capital structure and competitive conditions. The Compensation Peer Group is a narrower group of companies within our Performance Peer Group which would be considered peers for executive talent purposes. This second group is more similar to the Company in terms of size and scope of operations, although, due to the limited number of companies directly similar in size, we include companies that are both somewhat smaller and larger than the Company. Additionally, we have excluded certain Performance Peer Group companies from the Compensation Peer Group because of dissimilarity in pay approach and structures.
The Committee periodically reviews the companies comprising each peer group, and revises each group as it deems appropriate after consultation with Pearl Meyer and to reflect consolidation and changes in the industry.
| | 35 | |||
Table of Contents
|
EXECUTIVE COMPENSATION
|
|
Performance Peer Group* | ||||
Performance
g
Used to measure our financial performance under our LTI program, in particular the PSUs. |
• Baker Hughes, Inc. • Halliburton Co. • Helmerich & Payne, Inc. • Nabors Industries Ltd. • Oceaneering International, Inc. • Patterson-UTI Energy, Inc. • Schlumberger Ltd. • FMC Technologies, Inc. |
• Basic Energy Services, Inc. • Helix Energy Solutions, Group, Inc. • Key Energy Services, Inc. • National Oilwell Varco, Inc. • Oil States International, Inc. • RPC, Inc. • Weatherford International, Ltd. | ||
*Reference group for the PSUs granted in 2016
| ||||
Compensation Peer Group | ||||
Compensation
g
Used to evaluate and benchmark executive compensation. |
• Baker Hughes, Inc. • Cameron International Corp. • FMC Technologies, Inc. • Halliburton Co. • Key Energy Services, Inc. • Oceaneering International, Inc. • Weatherford International, Ltd.
|
• Basic Energy Services, Inc. • Ensco plc • Helix Energy Solutions Group, Inc. • National Oilwell Varco, Inc. • Oil States International, Inc. • RPC, Inc. | ||
The Compensation Peer Group set forth above had a trailing twelve month median revenue of $2.776 billion as of December 31, 2016, compared to our trailing twelve month revenue of $1.450 billion. When this Compensation Peer Group was initially established inmid-2015, the revenue differential against the group was only about 5.3%, and this has widened in the subsequent two years due to the disparate effects on members of the group during the recent industry downturn. The Compensation Peer Group set forth above was used with respect to compensation determinations made at the end of 2015 (for purposes of setting 2016 compensation). Since that time, we removed Cameron International Corp. from this peer group inmid-2016 (following its acquisition by Schlumberger Ltd.) and addedPatterson-UTI Energy, Inc.
At the Committee’s request, Pearl Meyer conducts an annual executive compensation review to benchmark the Company’s senior executive compensation relative to the Compensation Peer Group with supplemental data from published market surveys. The Committee uses this report to evaluate whether the executive compensation levels, including base salary and actual incentive payouts, are within industry norms and the Company’s stated strategy. For 2016 executive compensation, the Committee set base salary amounts, annual incentive plan percentages and long-term incentive award values in December 2015 with reference to the Compensation Peer Group.
Pearl Meyer supplements data from the Compensation Peer Group with broad-based compensation survey data to develop a comprehensive view of the competitive market data. The Committee believes that this use of survey data is an important element of our compensation evaluation. Compensation survey data includes companies from the broader energy industry that influence the competitive market for executive compensation levels. Further, the survey data also includes data from companies that are comparable to us in terms of size and scale.
Review of Tally Sheets
The Committee has reviewed and evaluated an executive tally sheet that contained a listing and quantification (as appropriate) of each component of our compensation program during 2016 for all of our executive officers, including special executive benefits and perquisites, as well as accumulated values (e.g., stock option holdings) and other contingent compensation such as severance arrangements. The Committee believes that our balance of annual and long-term compensation elements, our mix of long-term incentive vehicles and our stock ownership guidelines that encourage executive ownership result in a compensation program that aligns our executives’ interests with those of our stockholders and does not encourage our management to take unreasonable risks relating to our business. The various components of our executive compensation program are described in detail below.
| 36 | | |||
Table of Contents
|
EXECUTIVE COMPENSATION
|
|
COMPONENTS OF EXECUTIVE COMPENSATION
The main components of our executive compensation program are base salary, annual incentive and long-term incentives. Our executives also participate in a supplemental executive retirement plan. Overall, the Company positions the majority of the executive compensation program to beat-risk with much of the compensation based on measurable performance, with a specific emphasis on the long-term performance of the Company. As an executive’s level of responsibility increases, a greater portion of total compensation is at-risk, creating the potential for greater variability in the individual’s compensation from year to year.
As reflected in the charts set forth above in the Executive Summary, the CEO’s component mix is more heavily weighted towards long-term performance and reflects the Committee’s view that his role in setting the strategic direction of the Company gives him greater influence on the ultimate performance level achieved. The Committee believes that its current combination of compensation elements provides an appropriate mix of fixed and variable pay, balancing short and long-term performance, and encouraging executive retention.
Base Salary
The primary role of the Company’s base salary element is to compensate executives for the experience, education, personal qualities and other qualifications that are key for their specific role within the Company. In establishing the base salaries for our executives, we have historically targeted the median salaries of similarly-situated executives in the Company’s Compensation Peer Group and strive to set base salaries at consistent levels for positions with similar responsibilities.
In response to market conditions, the Committee reduced base salaries by 15% for the CEO and all of the named executive officers for 2016 (compared to their respective 2015 base salaries).
Annual Incentive Award
The purpose of the Company’s AIP is to reward executives for achievement of annual operational, financial and safety goals. Although the Committee sets annual incentive target levels that result in median payouts when performance objectives are
met, this program provides executives with the opportunity to earn higher payments depending on the extent to which these performance objectives are exceeded.
Program Parameters for 2016
In March 2016, the Committee approved the parameters of the annual incentive program for 2016. Under the program, our named executive officers were eligible to receive an annual incentive award based on a target percentage of their base salary. As discussed previously, the Committee maintained the 37.5% reduced payout levels for each named executive officer (which it first implemented with respect to 2015 payout levels compared to 2014 levels). Our AIP is designed to focus management’s attention on key financial and operational metrics, which are weighted as follows:
75% of the total payout is based on the achievement of an EBITDA target and 25% of the total payout is based on the Committee’s assessment of the Company’s achievement of the other key operational metrics. The overall incentive payout ranges from 0% to 125% (reduced from 0% to 200% range in prior years) of each executive’s target award opportunity based on these factors, and is subject to a reduction of up to 15% based on the Company’s overall safety performance for the year.
Financial Metric: The Committee again determined to use EBITDA as the primary financial metric for our AIP program. As a financial metric, EBITDA is more closely linked to cash flows and encourages management to focus on improving efficiency from existing operations. The quantitative portion of the annual incentive award provides for threshold, target and maximum payout levels, as a percentage of salary, based upon the achievement of 87%, 100% and 113% of the EBITDA target. Based on the business outlook at the time, the Committee set the EBITDA target for the 2016 program at $258.6 million, which the Committee felt was both aggressive and appropriate.
Operational Metrics: With respect to operational metrics, the Committee established key 2016 objectives to reduce G&A costs, manage our DSO and DPO, and preserve cash. The payout levels with respect to this portion of the award were determined based on below target, at target and above target achievements.
| | 37 | |||
Table of Contents
|
EXECUTIVE COMPENSATION
|
|
Safety Component: As in prior years, the Committee could reduce the ultimate payout to each executive by up to 15% based on the Company’s performance relative to various safety metrics and a grading system that make up the executive team safety scorecard. The 2016 safety scorecard contained three results-oriented metrics that measure the number of safety incidents and seven leading indicators that were designed to
encourage behaviors by the Company’s employees in order to decrease the number of safety incidents.
The possible total award payout levels for 2016 for each named executive officer, stated as a percentage of the officer’s base salary and taking into account the 37.5% payout level reduction discussed above, are set forth in the table below.
Named Executive Officer
|
Minimum
|
Target
|
Maximum
| |||
Mr. Dunlap
|
37.50%
|
75.00%
|
150.00%
| |||
Mr. Taylor
|
25.00%
|
50.00%
|
100.00%
| |||
Mr. Moore
|
23.44%
|
46.88%
|
93.75%
| |||
Mr. Bernard
|
21.88%
|
43.75%
|
87.50%
| |||
Mr. Masters
|
21.88%
|
43.75%
|
87.50%
|
Determination of 2016 Results
In January 2017, the Committee reviewed the Company’s financial results for 2016 and evaluated a detailed report regarding management’s efforts and accomplishments with respect to the key operational objectives. As for the financial metric, the Company achieved 15% of the EBITDA target established for 2016, which was below the threshold necessary for achievement of a payout. As for the key operational objectives, several of these objectives were deemed most critical for reducing costs and generating free cash flow in order to optimize liquidity in the current market downturn and position the Company to respond quickly when more favorable market conditions return. The DSO calculation includes net trade receivables to total revenue. The DPO calculation measures the Company’s trade accounts payable to expenses in cost of services which flow through trade accounts payable. Importantly, we were able to preserve cash afterpaying-off $325.0 million on our credit facility to extinguish the outstanding debt balance. We also deployed cash to reactivate idle equipment and to ready the Company for an upcycle in the market, so that we would be a first responder. These actions were supported by the Committee and the Board as prudent uses of cash under the existing and anticipated market conditions.
Due to the Company’s strong level of performance with respect to the key operational objectives, particularly in light of the current market environment, the Committee determined it was appropriate to approve an overall payout of 31.25% of the normal target level for this component. In its assessment of these operational objectives and determining the appropriate payout, the Committee noted the following achievements which, with the exception of generating positive cash flow, significantly exceeded target levels:
| • | Reduction in G&A Costs: Targeted a reduction of 30% to 36% from 2015 G&A expenses. We achieved a 32% reduction in 2016. |
| • | Manage DSO: Targeted to end 2016 with a DSO of 74 to 79 days. We achieved a DSO of 74 days. |
| • | Manage DPO: Targeted to end 2016 with a DPO of 44 to 49 days. We achieved a DPO of 50 days. |
| • | Generate Positive Cash Flow: Targeted positive free cash flow during 2016. We were able to preserve $188 million in cash on hand as ofyear-end 2016. |
Goal
|
% of Award
|
Target
|
Resulting
|
Overall Payout
| ||||
EBITDA Target
|
75%
|
15%
|
0%
| 31.25% | ||||
Key Operational Objectives
|
25%
|
Above Target
|
125%
|
| 38 | | |||
Table of Contents
|
EXECUTIVE COMPENSATION
|
|
In light of the Company’s strong safety record during 2016, the Committee determined not to exercise its discretion to reduce the ultimate payout to each executive. Specifically, we improved our year-over-year safety performance, as our Total Recordable Incident Rate, tracking less severe recordable injuries, improved by 12%, and our Lost Time Incident Rate, tracking more severe recordable injuries, improved by 40%.
Long-Term Incentives
The purpose of our long-term incentive program (the LTI program) is to focus executives on long-term Company goals, growth and the creation of stockholder value. Under the 2016 LTI program, the Committee granted 50% of the awards to our executives in the form of PSUs and 50% in the form of options. In past years we have awarded 25% in restricted stock units and 25% in options; however, in response to the market downturn, the Committee increased the options component for 2016 grants in order to better align the interests of our executives with those of our stockholders by focusing our executives on share price appreciation.
Consistent with the Company’s compensation philosophy, the Committee believes stock-based incentive awards are one of the best ways to align the interests of our executives with those of our stockholders. In addition, the terms of the PSUs reflect the Committee’s belief that executive compensation should be tied to Company performance. The PSUs provide our executives the opportunity to earn additional compensation based on the Company’s performance. The executives’ compensation could be below the 25th percentile of the market for below threshold performance and at or above the 75th percentile of the market if the Company achieves the maximum level of performance relative to its peers as described below.
2016 LTI ProgramAt-A-Glance
Component of LTI Program
|
Terms
|
How the Award Furthers our Compensation Principles
| ||
Stock Options (50% of grant value) |
• Exercise price at fair market value on grant date • Vestsin equal annual installments over 3-year period, subject to continued service • 10-yearterm
|
• Motivatesexecutives to continue to grow the value of the Company’s stock over the long term as the value of the stock option depends entirely on the long-term appreciation of the Company’s stock price.
| ||
PSUs (50% of grant value) |
• 3-yearperformance period • Initialvalue of $100 per unit • Payoutrange $0 to $200 per unit based on performance compared to our Performance Peer Group • Performancemeasures: ○ 50%Relative ROA ○ 50%Relative TSR • Payoutin cash, although up to 50% of value may be paid in shares of stock in the Committee’s discretion
|
• Performancecriteria link the Company’s long-term performance directly to compensation received by executive officers and other key employees and encourage them to make significant contributions towards increasing ROA and, ultimately, stockholder returns. • Useof TSR to better align the interests of our executives with those of our stockholders. |
2016 LTI Program Awards
After considering Pearl Meyer’s market study and in order to remain competitive with the market median and the competitive market for executive talent in the Company’s business areas, and taking into account Mr. Dunlap’s recommendations for the executives other than himself, the Committee set the target percentages of the named executive officers’ 2016 LTI awards based on each officer’s position with the Company, which percentages were consistent with their respective 2015 award levels.
| | 39 | |||
Table of Contents
|
EXECUTIVE COMPENSATION
|
|
The award mix for executive officers during 2016 remained 50% in PSUs, but increased from 25% to 50% in stock options and eliminated the 25% in RSUs. The table below shows the 2016 target LTI percentages and the approximate total value of the 2016 LTI grants (amounts reflected in Summary Compensation Table for stock options and PSUs reflect actual grant date fair values).
Named Executive Officer
|
2016 LTI % of Salary
|
Total Value Granted as PSUs
|
Total Value Granted as Options
|
Total Value of 2016 LTI Awards
| ||||||
Mr. Dunlap
|
600%
|
$3,000,000
|
$
|
3,000,000
|
|
$6,000,000
| ||||
Mr. Taylor
|
360%
|
973,440
|
|
973,440
|
|
1,946,880
| ||||
Mr. Moore
|
300%
|
885,750
|
|
885,750
|
|
1,771,500
| ||||
Mr. Bernard
|
300%
|
627,750
|
|
627,750
|
|
1,255,500
| ||||
Mr. Masters
|
250%
|
602,000
|
|
602,000
|
|
1,204,000
| ||||
Structure of PSUs
For the PSUs granted for the 2016-2018 cycle, under both performance criteria, the maximum, target and threshold levels are met when our ROA and TSR are in the 75th percentile, 50th percentile and 25th percentile, respectively, as compared to the ROA and TSR of the Performance Peer Group, as described in the table below:
Performance Level Relative to Performance Peer Group
|
Percent of Date-of-Grant Value of PSU Received for Relative ROA Level
|
Percent of Date-of-Grant Value of PSU Received for Relative TSR Level
|
Total Percent of Date-of-Grant Value of PSU Received
| |||
(Below 25th Percentile)
|
0%
|
0%
|
0%
| |||
Threshold (25th Percentile)
|
25%
|
25%
|
50%
| |||
Target (50th Percentile)
|
50%
|
50%
|
100%
| |||
Maximum (75th Percentile or above)
|
100%
|
100%
|
200%
|
For all PSUs granted, results that fallin-between the “maximum,” “target” and “threshold” levels of both performance criteria will be calculated based on a sliding scale. For purpose of determining the Company’s ROA rank in the Performance Peer Group, we generate the results using income from operations data and net operating asset data derived from financial statements as reported by each peer company in theiryear-end annual report on Form10-K, uniformly adjusted for anynon-operational charges as determined by established, independent third-party financial data providers. All calculations are validated by the Committee’s independent compensation consultant.
The PSUs granted during 2016 also have a three-year performance period, commencing January 1, 2016 and ending December 31, 2018. The PSUs vest on December 31, 2018, subject to continued employment through the vesting date.
Payout of 2014-2016 PSUs
The PSUs granted for the performance period beginning in January 2014 vested at the end of 2016, and were paid out to the PSU recipients in April 2017 under the terms of the award. The Company ranked in the 54th percentile of relative ROIC (the metric used before ROA was implemented) and in the 47th percentile of relative TSR, each achieving a performance level between minimum and maximum and both as compared to its peers, resulting in a payout to the named executive officers of $105 per PSU. The terms of the award provide for a cash payout, unless the Committee elects to pay up to 50% of the cash value in shares of our common stock.
| 40 | | |||
Table of Contents
|
EXECUTIVE COMPENSATION
|
|
The Committee elected to pay the award in cash. The total value of the payout received by each named executive officer is reflected in the table below and in the “Summary Compensation Table” herein under the column“Non-Equity Incentive Plan Compensation.”
Named Executive Officer
|
Number of Units
|
Value of PSU Payout
| ||
Mr. Dunlap
|
30,000
|
$3,153,000
| ||
Mr. Taylor
|
9,734
|
$1,023,043
| ||
Mr. Moore
|
8,858
|
$930,976
| ||
Mr. Bernard
|
6,278
|
$659,818
| ||
Mr. Masters
|
6,020
|
$632,702
|
Perquisites
Particularly in the current environment, we seek to maintain a cost conscious culture, and specifically in connection with the benefits and modest perquisites provided to executives. Consistent with this culture, our approach is to tie the vast majority of our executives’ compensation to performance. The Company does provide each of our executive officers an automobile allowance, including fuel and maintenance costs, and also reimburses them for periodic travel, as well as for all deductibles,co-pays, and other out of pocket expenses associated with our health insurance programs through a program called ArmadaCare, and provides them with other limited perquisites. These perquisites are intended to ensure our executive officers are able to devote their full business time to the affairs of the Company. The attributed costs of the personal benefits described above for the named executive officers for 2016, are included in the “Summary Compensation Table” herein. The Committee believes the provision of such benefits was modest and appropriate in 2016.
Post-Employment Compensation
In addition to the annual compensation received by executive officers during 2016 and benefits under the Company’s 401(k) plan, which we provide to all eligible employees, we also provide post-employment benefits to our executive officers: a supplemental executive retirement plan; anon-qualified deferred compensation plan; and certain severance and change of control benefits pursuant to employment agreements that we have entered into with our executive officers. For more information on these plans, see the sections below entitled “Retirement Benefit Programs” and “Potential Payments upon Termination or Change of Control”. For
more information on the contributions, earnings and aggregate account balances for each named executive officer, see the table below entitled “Nonqualified Deferred Compensation for Fiscal Year 2016”.
As described in more detail under “Potential Payments upon Termination or Change of Control” below, we entered into employment agreements with all of our executive officers whereby the executives are entitled to severance benefits in the event of an involuntary termination of employment under certain conditions. The Company has determined that it is appropriate to provide our executives with severance benefits under these circumstances in light of their positions with the Company and as part of their overall compensation package. The severance benefits for our executives are generally designed to approximate the benefits each would have received had he remained employed by the Company through the remainder of the term covered by his employment agreement.
We recognize that the occurrence, or potential occurrence, of a change of control transaction will create uncertainty regarding the continued employment of our executive officers and distract them from effectively performing their duties for the Company. This uncertainty results from the fact that many change of control transactions result in significant organizational changes, particularly at the senior executive level. In order to encourage our executive officers to remain employed with the Company during an important time when their prospects for continued employment following the transaction are often uncertain, we provide our executive officers with enhanced severance benefits under our Change of Control Severance Plan if their employment is terminated by the Company without cause or, in certain cases, by the executive in
| | 41 | |||
Table of Contents
|
EXECUTIVE COMPENSATION
|
|
connection with a change of control (a double-trigger benefit). Because we believe that a termination by the executive for good reason may be conceptually the same as a termination by the Company without cause, and because we believe that in the context of a change of control, potential acquirers would otherwise have an incentive to constructively terminate the executive’s employment to avoid paying severance, we believe it is appropriate to provide severance benefits in these circumstances. The change of control-related severance payments are made from a transaction sharing pool that is calculated as of the date of the change of control and based on the transaction value of the Company at the time of the change of control (with the transaction pool increasing or decreasing as the transaction value increases or decreases, respectively). Under the Change of Control Severance Plan, the payment of cash severance benefits is only triggered by an actual or constructive termination of employment. The impact of a change of control on our long-term incentive awards is governed by the applicable award agreement, which currently provide for accelerated vesting upon a change of control of the Company. The terms of the employment agreements and the Change of Control Severance Plan and the benefits provided thereby are discussed more fully in the section entitled “Potential Payments Upon Termination or Change of Control” below.
EXECUTIVE COMPENSATION POLICIES
Stock Ownership Guidelines and Holding Requirement
The Company has encouraged stock ownership through equity awards to our executives. We believe it is important that the interests of our executives and directors be aligned with the long-term interests of our stockholders. We have adopted stock ownership guidelines applicable to our executive officers. Under the guidelines, required ownership levels are as follows:
Position
|
Stock Value as a Multiple of Base Salary
| |
Chief Executive Officer
|
6x
| |
Chief Financial Officer
|
3x
| |
Executive Vice Presidents
|
2x
|
Additionally, we included a requirement that our executives maintain ownership of at least 50% of the netafter-tax shares of common stock acquired from the Company pursuant to any equity-based awards
received from the Company, unless the executive has met his individual ownership requirement. The required share amount is determined as of the date the officer becomes subject to the guidelines, and is calculated by dividing such officer’s applicable base salary multiple by the365-day average closing price of our common stock as reported on the NYSE, and then rounding to the nearest 100 shares. The target ownership level does not change with changes in base salary or common stock price, but will change in the event the officer’s position level changes. Our executive officers are required to achieve their required ownership levels within five years from the date they become subject to the guidelines. The Committee will administer the guidelines and will periodically review each participant’s compliance (or progress towards compliance) and may impose additional requirements the Committee determines are necessary or appropriate to achieve the purposes of this program. As of the date of this proxy statement, all of our named executive officers had significantly exceeded their required ownership levels. See “Ownership of Securities — Management and Director Stock Ownership” for the number of shares of our common stock beneficially owned by our named executive officers as of the date of this proxy statement.
Timing of Long-Term Incentive Awards
The Committee makes LTI awards effective in the first quarter of each year, which corresponds to our Committee’s view of the year to which the awards relate.
Policy Regarding Section 162(m) of the Internal Revenue Code
Section 162(m) of the Internal Revenue Code (Section 162(m)) generally limits our ability to take a federal income tax deduction for compensation paid to our CEO and certain other named executive officers in excess of $1 million, except for qualified performance-based compensation. The stock options and PSUs we grant under the LTI program are generally designed to qualify as performance-based compensation under Section 162(m). In addition, under our incentive award plan, the Committee has the ability to structure our annual incentive program under Section 162(m) in the future if it elects to do so. While the Committee will seek to utilize deductible forms of compensation to the extent practicable, it believes it is important to
| 42 | | |||
Table of Contents
|
EXECUTIVE COMPENSATION
|
|
preserve flexibility in administering compensation programs. Accordingly, the Company has not adopted a policy that all compensation must qualify as deductible under Section 162(m).
Accounting for Stock-Based Compensation
We have followed FASB ASC Topic 718 in accounting for stock-based compensation awards. FASB ASC Topic 718 requires companies to calculate the grant date “fair value” of their stock-based awards using a variety of assumptions. FASB ASC Topic 718 also requires companies to recognize the compensation
cost of their stock-based awards in their income statements over the period that an employee is required to render service in exchange for the award. We expect that we will regularly consider the accounting implications of significant compensation decisions, especially in connection with decisions that relate to our equity incentive award plans and programs. As accounting standards change, we may revise certain programs to appropriately align accounting expenses of our equity awards with our overall executive compensation philosophy and objectives.
| | 43 | |||
Table of Contents
|
EXECUTIVE COMPENSATION
|
|
COMPENSATION COMMITTEE REPORTON EXECUTIVE COMPENSATION
The Compensation Committee of the Board has reviewed and discussed the Compensation Discussion and Analysis with management, and based on such review and discussions, the Compensation Committee recommended to the Board that the Compensation Discussion and Analysis be included in this proxy statement.
| THE COMPENSATION COMMITTEE: |
W. Matt Ralls (Chair) |
Harold J. Bouillion |
James M. Funk |
Michael M. McShane |
| 44 | | |||
Table of Contents
|
EXECUTIVE COMPENSATION
|
|
The following table summarizes the compensation of our “named executive officers” for the three years ended December 31, 2016.
2016 Summary Compensation Table
Name and Principal Position | Year | Salary | Bonus | Stock Awards(1) | Option Awards(2) | Non-Equity Incentive Plan Compensation(3) | All Other Compensation(4) | Total | ||||||||||||||||||||||||
David D. Dunlap | 2016 | $ | 887,500 | $ | 0 | $ | 0 | $ | 3,000,000 | $ | 3,471,750 | $ | 137,375 | $ | 7,496,625 | |||||||||||||||||
President & Chief | 2015 | 1,000,000 | 0 | 1,500,003 | 1,500,000 | 2,690,520 | 308,179 | 6,998,702 | ||||||||||||||||||||||||
Executive Officer | 2014 | 1,000,000 | 0 | 1,500,001 | 1,499,998 | 5,175,000 | 129,972 | 9,304,971 | ||||||||||||||||||||||||
Robert S. Taylor | 2016 | $ | 479,960 | $ | 0 | $ | 0 | $ | 973,440 | $ | 1,137,963 | $ | 206,626 | $ | 2,797,989 | |||||||||||||||||
Executive Vice | 2015 | 540,800 | 0 | 811,208 | 486,719 | 880,508 | 348,951 | 3,068,186 | ||||||||||||||||||||||||
President, Chief Financial Officer, and Treasurer |
| 2014
|
|
| 540,800
|
|
| 0
|
|
| 811,234
|
|
| 486,722
|
|
| 1,765,280
|
|
| 339,570
|
|
| 3,943,606
|
| ||||||||
Brian K. Moore | 2016 | $ | 524,069 | $ | 0 | $ | 0 | $ | 885,750 | $ | 1,048,615 | $ | 129,052 | $ | 2,587,485 | |||||||||||||||||
Executive | 2015 | 590,500 | 0 | 738,131 | 442,875 | 816,652 | 277,709 | 2,865,867 | ||||||||||||||||||||||||
Vice President | 2014 | 590,500 | 0 | 738,144 | 442,875 | 885,750 | 145,869 | 2,803,138 | ||||||||||||||||||||||||
A. Patrick Bernard | 2016 | $ | 371,419 | $ | 0 | $ | 0 | $ | 627,750 | $ | 737,633 | $ | 138,767 | $ | 1,875,568 | |||||||||||||||||
Executive | 2015 | 418,500 | 0 | 523,135 | 313,875 | 572,259 | 312,777 | 2,140,546 | ||||||||||||||||||||||||
Vice President | 2014 | 418,500 | 0 | 523,139 | 313,876 | 1,183,800 | 147,359 | 2,586,673 | ||||||||||||||||||||||||
William B. Masters | 2016 | $ | 427,420 | $ | 0 | $ | 0 | $ | 602,000 | $ | 722,250 | $ | 102,587 | $ | 1,854,257 | |||||||||||||||||
Executive Vice | 2015 | 481,600 | 0 | 501,658 | 301,000 | 545,379 | 167,473 | 1,997,110 | ||||||||||||||||||||||||
President and General Counsel |
| 2014
|
|
| 481,600
|
|
| 0
|
|
| 501,654
|
|
| 300,998
|
|
| 1,205,440
|
|
| 68,477
|
|
| 2,558,169
|
| ||||||||
| (1) | Please see the “Grants of Plan-Based Awards Table” for more information regarding the stock awards we granted in 2016. |
| (2) | The Black-Scholes option model was used to determine the grant date fair value of the options that we granted to the named executive officers during 2016. For a discussion of valuation assumptions, see Note 7 to our consolidated financial statements included in our Annual Report on Form10-K for the fiscal year ended December 31, 2016. See the “Grants of Plan-Based Awards Table” for more information regarding the option awards we granted in 2016. |
| (3) | Amounts disclosed for 2016 reflect the annual cash incentive awards received by our named executive officers and the aggregate cash payout of PSUs with a performance period ending on the last day of 2016. Please see the “Executive Compensation — Compensation Discussion and Analysis — Long-Term Incentives” for more information regarding the PSUs. |
Name |
Annual Cash |
Aggregate PSU | ||||||
Mr. Dunlap | $318,750 | $ 3,153,000 | ||||||
Mr. Taylor | $114,920 | $ 1,023,043 | ||||||
Mr. Moore | $117,639 | $ 930,976 | ||||||
Mr. Bernard | $77,815 | $ 659,818 | ||||||
Mr. Masters | $89,548 | $ 632,702 | ||||||
| | 45 | |||
Table of Contents
|
EXECUTIVE COMPENSATION
|
|
| (4) | For 2016, includes (i) annual contributions to the executive’s retirement account under the supplemental executive retirement plan and matching contributions to our 401(k) plan, (ii) life insurance premiums paid by the Company for the benefit of the executives, and (iii) the value of perquisites, consisting of premium payments made under the ArmadaCare program during 2016, the provision of an automobile allowance, including fuel and maintenance costs, and commuting expenses, as set forth below: |
| Name | Retirement Plans | Life Insurance | ArmadaCare | Automobile and Commuting | ||||||||
Mr. Dunlap | $105,461 | $1,278 | $12,636 | $18,000 | ||||||||
Mr. Taylor | $164,702 | $1,278 | $12,636 | $28,010 | ||||||||
Mr. Moore | $109,726 | $1,278 | $8,448 | $9,600 | ||||||||
Mr. Bernard | $103,386 | $1,278 | $12,636 | $21,467 | ||||||||
Mr. Masters | $63,988 | $1,278 | $12,636 | $24,685 | ||||||||
The following table presents additional information regarding stock and option awards, as well asnon-equity incentive plan awards granted to our named executive officers during the year ended December 31, 2016.
Grants of Plan-Based Awards During 2016
| Name | Grant Date(2) |
No. of Units
|
Estimated Future Payouts Under Non-Equity Incentive Plan Awards
|
All Other
|
All Other
|
Exercise
|
Grant Date
| |||||||||||||||||||||||||||||
Threshold
|
Target
|
Maximum
| ||||||||||||||||||||||||||||||||||
David D. Dunlap |
| |||||||||||||||||||||||||||||||||||
Annual Bonus(1) | $ | 318,750 | $ | 637,500 | $ | 1,275,000 | ||||||||||||||||||||||||||||||
PSUs | 1/15/2016 | 30,000 | 1,500,000 | 3,000,000 | 6,000,000 | |||||||||||||||||||||||||||||||
Stock Options | 1/15/2016 | 831,025 | $ | 9.76 | 3,000,000 | |||||||||||||||||||||||||||||||
Robert S. Taylor |
| |||||||||||||||||||||||||||||||||||
Annual Bonus(1) | $ | 114,920 | $ | 229,840 | $ | 459,680 | ||||||||||||||||||||||||||||||
PSUs | 1/15/2016 | 9,734 | 486,700 | 973,400 | 1,946,800 | |||||||||||||||||||||||||||||||
Stock Options | 1/15/2016 | 269,651 | 9.76 | 973,440 | ||||||||||||||||||||||||||||||||
Brian K. Moore |
| |||||||||||||||||||||||||||||||||||
Annual Bonus(1) | $ | 117,639 | $ | 235,277 | $ | 470,555 | ||||||||||||||||||||||||||||||
PSUs | 1/15/2016 | 8,858 | 442,900 | 885,800 | 1,771,600 | |||||||||||||||||||||||||||||||
Stock Options | 1/15/2016 | 245,360 | 9.76 | 885,750 | ||||||||||||||||||||||||||||||||
A. Patrick Bernard |
| |||||||||||||||||||||||||||||||||||
Annual Bonus(1) | $ | 77,815 | $ | 155,630 | $ | 311,259 | ||||||||||||||||||||||||||||||
PSUs | 1/15/2016 | 6,278 | 313,900 | 627,800 | 1,255,600 | |||||||||||||||||||||||||||||||
Stock Options | 1/15/2016 | 173,892 | 9.76 | 627,750 | ||||||||||||||||||||||||||||||||
William B. Masters |
| |||||||||||||||||||||||||||||||||||
Annual Bonus(1) | $ | 89,548 | $ | 179,095 | $ | 358,190 | ||||||||||||||||||||||||||||||
PSUs | 1/15/2016 | 6,020 | 301,000 | 602,000 | 1,204,00 | |||||||||||||||||||||||||||||||
Stock Options | 1/15/2016 | 166,759 | 9.76 | 602,000 | ||||||||||||||||||||||||||||||||
| (1) | The amounts shown reflect possible payments under our annual incentive bonus program for fiscal year 2016 under which the named executive officers were eligible to receive a cash bonus based on a target percentage of base salary upon our achievement of certainpre-established performance measures. Please see “Executive Compensation — Compensation Discussion and Analysis” for more information regarding our annual incentive program. |
| (2) | On December 7, 2015, the Compensation Committee approved the PSU and stock options awards for each of our named executive officers, which were effective January 15, 2016. |
| 46 | | |||
Table of Contents
|
EXECUTIVE COMPENSATION
|
|
| (3) | The amounts shown reflect grants of PSUs under our incentive award plan. The PSUs have a three-year performance period. The performance period for the PSUs granted on January 15, 2016 is January 1, 2016 through December 31, 2018. In addition, the PSUs vest on December 31, 2018, subject to continued employment through the applicable vesting date. Please see “Executive Compensation — Compensation Discussion and Analysis” for more information regarding the PSUs and the LTI awards made by the Compensation Committee. |
| (4) | The stock options were granted under our incentive award plan, and vestone-third annually over a three-year period, commencing January 15, 2016. Please see “Executive Compensation — Compensation Discussion and Analysis” for more information regarding the LTI awards made by the Compensation Committee. |
The following table sets forth the outstanding equity awards held by our named executive officers as of December 31, 2016.
Outstanding Equity Awards at 2016Year-End
Name
|
Option Awards
|
Stock Awards
| ||||||||||||||
Number of Securities Underlying Unexercised Options (#) Exercisable | Number of Securities Underlying Unexercised Options (#) Unexercisable(1) | Option Exercise Price | Option Expiration Date | Number of Shares or Units of Stock That Have Not Vested(2) | Market Value of Shares or Units of Stock That Have Not Vested(3) | Equity Incentive Plan Awards: Number of Unearned Shares, Units or Other Rights That Have Not Vested (4) | Equity Incentive Plan Awards: Market or Payout Value of Unearned Shares, Units or Other Rights That Have Not Vested(3)
| |||||||||
David D. Dunlap | 144,370 | — | $25.49 | 04/28/2020 | 77,120 | $ 1,301,786 | — | — | ||||||||
| 60,211 | — | $34.60 | 12/10/2020 | |||||||||||||
| 66,716 | — | $28.59 | 12/08/2021 | |||||||||||||
| 36,960 | — | $28.57 | 02/10/2022 | |||||||||||||
| 160,356 | — | $23.03 | 01/15/2023 | |||||||||||||
| 143,885 | 71,942 | $26.02 | 01/15/2024 | |||||||||||||
| 80,000
| 160,000
| $17.27
| 01/15/2025
| |||||||||||||
—
|
831,025
|
$ 9.76
|
01/15/2026
| |||||||||||||
Robert S. Taylor | 15,908 | — | $35.84 | 12/06/2017 | 25,023 | $ 422,388 | — | — | ||||||||
| 41,186 | — | $12.86 | 12/04/2018 | |||||||||||||
| 27,655 | — | $20.30 | 12/10/2019 | |||||||||||||
| 40,725 | — | $21.93 | 04/01/2020 | |||||||||||||
| 18,246 | — | $34.60 | 12/10/2020 | |||||||||||||
| 20,237 | — | $28.59 | 12/08/2021 | |||||||||||||
| 13,419 | — | $28.57 | 02/10/2022 | |||||||||||||
| 51,615 | — | $23.03 | 01/15/2023 | |||||||||||||
| 46,688 | 23,344 | $26.02 | 01/15/2024 | |||||||||||||
| 25,959 | 51,916 | $17.27 | 01/15/2025 | |||||||||||||
| —
| 269,651
| $ 9.76
| 01/15/2026
| |||||||||||||
Brian K. Moore | 20,998 | — | $16.56 | 01/31/2017 | 22,770 | $ 384,358 | — | — | ||||||||
| 31,437 | — | $16.29 | 03/20/2017 | |||||||||||||
| 44,276 | — | $23.29 | 01/31/2021 | |||||||||||||
| 40,077 | — | $28.09 | 01/31/2022 | |||||||||||||
| 46,971 | — | $23.03 | 01/15/2023 | |||||||||||||
| 42,482 | 21,241 | $26.02 | 01/15/2024 | |||||||||||||
| 23,620 | 47,240 | $17.27 | 01/15/2025 | |||||||||||||
—
|
245,360
|
$ 9.76
|
01/15/2026
| |||||||||||||
| | 47 | |||
Table of Contents
|
EXECUTIVE COMPENSATION
|
|
Name
|
Option Awards
|
Stock Awards
| ||||||||||||||
Number of Securities Underlying Unexercised Options (#) Exercisable | Number of Securities Underlying Unexercised Options (#) Unexercisable(1) | Option Exercise Price | Option Expiration Date | Number of Shares or Units of Stock That Have Not Vested(2) | Market Value of Shares or Units of Stock That Have Not Vested(3) | Equity Incentive Plan Awards: Number of Unearned Shares, Units or Other Rights That Have Not Vested (4) | Equity Incentive Plan Awards: Market or Payout Value of Unearned Shares, or Other Rights That Have Not Vested(3)
| |||||||||
A. Patrick Bernard | 13,729 | — | $35.84 | 12/06/2017 | 16,137 | $272,393 | — | — | ||||||||
| 33,824 | — | $12.86 | 12/04/2018 | |||||||||||||
| 22,712 | — | $20.30 | 12/10/2019 | |||||||||||||
| 40,725 | — | $21.93 | 04/01/2020 | |||||||||||||
| 14,984 | — | $34.60 | 12/10/2020 | |||||||||||||
| 16,621 | — | $28.59 | 12/08/2021 | |||||||||||||
| 5,666 | — | $28.57 | 02/10/2022 | |||||||||||||
| 33,291 | — | $23.03 | 01/15/2023 | |||||||||||||
| 30,108 | 15,054 | $26.02 | 01/15/2024 | |||||||||||||
| 16,740 | 33,480 | $17.27 | 01/15/2025 | |||||||||||||
— |
173,892 |
$ 9.76 |
01/15/2026 | |||||||||||||
William B. Masters | 8,413 | — | $40.69 | 02/28/2018 | 15,475 | $ 261,218 | — | — | ||||||||
| 25,227 | — | $12.86 | 12/04/2018 | |||||||||||||
| 16,939 | — | $20.30 | 12/10/2019 | |||||||||||||
| 32,000 | — | $21.93 | 04/01/2020 | |||||||||||||
| 11,175 | — | $34.60 | 12/10/2020 | |||||||||||||
| 12,395 | — | $28.59 | 12/08/2021 | |||||||||||||
| 7,461 | — | $28.57 | 02/10/2022 | |||||||||||||
| 30,470 | — | $23.03 | 01/15/2023 | |||||||||||||
| 28,873 | 14,436 | $26.02 | 01/15/2024 | |||||||||||||
| 16,054 | 32,106 | $17.27 | 01/15/2025 | |||||||||||||
—
|
166,759
|
$ 9.76
|
01/15/2026
| |||||||||||||
| (1) | Options will vest ratably over a three-year period from the date of grant, subject to continued employment through the vesting date. |
| (2) | The restricted stock units held by our named executive officers as of December 31, 2016 vest as follows, subject to continued service through the vesting date: |
| Name |
Total Unvested RSUs
| Vesting Schedule | ||
Mr. Dunlap | 77,120 | 48,168 shares vesting on 1/15/17 | ||
| 28,952 shares vesting on 1/15/18
| ||||
Mr. Taylor | 25,023 | 15,629 shares vesting on 1/15/17 | ||
| 9,394 shares vesting on 1/15/18
| ||||
Mr. Moore | 22,770 | 14,222 shares vesting on 1/15/17 | ||
| 8,548 shares vesting on 1/15/18
| ||||
Mr. Bernard | 16,137 | 10,079 shares vesting on 1/15/17 | ||
| 6,058 shares vesting on 1/15/18
| ||||
Mr. Masters | 15,475 | 9,665 shares vesting on 1/15/17 | ||
| 5,810 shares vesting on 1/15/18
|
| (3) | Based on the closing price of our common stock on December 30, 2016 of $16.88, as reported on the NYSE. |
| (4) | PSUs have a three-year performance period and vest on December 31, 2018, subject to continued employment through the applicable vesting date. |
| 48 | | |||
Table of Contents
|
EXECUTIVE COMPENSATION
|
|
The following table sets forth certain information regarding the exercise of stock options and the vesting of restricted stock and restricted stock units during the fiscal year ended December 31, 2016 for each of the named executive officers.
Option Exercises and Stock Vested in 2016
Option Awards
| Stock Awards
| |||||||
Number of Shares Acquired on Exercise
|
Value Realized on Exercise
|
Number of Shares Acquired on Vesting
|
Value Realized on Vesting(1)
| |||||
David D. Dunlap
|
—
|
—
|
69,010
|
$673,538
| ||||
Robert S. Taylor
|
—
|
—
|
22,339
|
$218,029
| ||||
Brian K. Moore
|
—
|
—
|
20,326
|
$198,382
| ||||
A. Patrick Bernard
|
—
|
—
|
14,407
|
$140,612
| ||||
William B. Masters
|
—
|
—
|
11,500
|
$112,240
| ||||
| (1) | Value realized is calculated based on the closing sale price on the vesting date of the award. No options were exercised in 2016 by our NEOs. |
Supplemental Executive Retirement Plan (SERP)
The SERP provides retirement benefits to the Company’s executive officers and certain other designated key employees. The SERP is an unfunded,non-qualified defined contribution retirement plan, and all contributions under the SERP are in the form of credits to a notional account maintained for each participant. The Company may elect to set aside funds in a rabbi trust to cover the benefits under the SERP, though such funds remain subject to the claims of the Company’s creditors.
Contributions: Under the SERP, the Company generally makes annual contributions ranging from 2.5% to 25% of salary and annual cash bonus based on the participant’s age and years of service. Executives whose combined age and years of service was at least 55 as of December 31, 2008, receive higher annual contributions, ranging from 10% to 35% of base salary and annual cash bonus. The highest annual contribution made for an executive during 2016 was 25%. The Compensation Committee, in its sole
discretion, may also make discretionary contributions to a participant’s SERP account.
Vesting: A participant vests in his SERP account upon the earliest to occur of: (i) attaining six years of service (including service prior to the adoption of the SERP), upon which amounts in the SERP account vest in 20% annual increments provided the participant remains employed; (ii) attaining age 65; (iii) a change of control; (iv) becoming disabled; or (v) termination of the participant’s employment without cause by the Company. Regardless of their vested status, participants will forfeit all benefits under the SERP if they are terminated for cause or, if within 36 months after a termination without cause, engage in any activity in competition with any activity of the Company or inimical, contrary or harmful to the interests of the Company.
Earnings: Following the end of each plan year, SERP credits are adjusted to reflect earnings on the average daily balance of the notional accounts during the year, at a rate of interest equal to the Company’safter-tax long-term borrowing rate for the year.
Payout: Upon separation from service, participants are paid their vested SERP accounts in a lump sum or installments, as elected by the participant, commencing seven months after separation from service.
| | 49 | |||
Table of Contents
|
EXECUTIVE COMPENSATION
|
|
Nonqualified Deferred Compensation Plan (NQDC Plan)
The NQDC Plan provides an income deferral opportunity for executive officers and certain senior managers of the Company who qualify for participation. Participants may also defer all or a portion of the common stock due upon vesting of restricted stock unit awards. The NQDC Plan is unfunded, but the Company may elect to set aside funds in a rabbi trust to cover the benefits under the plan, though such funds remain subject to the claims of the Company’s creditors.
Contributions: Participants in the NQDC Plan may make an advance election each year to defer up to 75% of base salary, 100% of their annual bonus and 50% of the cash payout value of any PSUs. The Compensation Committee, in its sole discretion, may provide a match of up to 100% of the deferrals; however, the Company has never elected to grant a match.
Vesting: Participants are immediately 100% vested in their benefits under the NQDC Plan, with the exception of matching contributions, which, if made,
would vest according to the same schedule provided under the Company’s 401(k) plan.
Earnings: Participants may choose from a variety of investment choices to invest their deferrals over the deferral period. Participants earn a rate of return on their NQDC Plan account that approximates the rate of return that would be provided by certain specified mutual funds that participants may designate from a list of available funds selected by the NQDC Plan administrative committee.
Payout: Benefits are paid in either alump-sum or in equal annual installments over a2- to15-year period, as elected by the participant. Generally, benefits that are due as a result of a termination of service are paid or commence in the seventh month after termination. However, only participants who are at least age 55 with at least five years of service at termination will be eligible to receive or continue receiving installment distributions following termination.
See “Executive Compensation — Compensation Discussion and Analysis” for more information on these retirement programs.
Nonqualified Deferred Compensation for 2016
| Name |
Executive Contributions in 2016(1) | Registrant Contributions in 2016(2) | Aggregate Earnings in 2016 | Aggregate Withdrawals/ Distributions | Aggregate Balance at 12/31/16 | |||||||
David D. Dunlap | ||||||||||||
NQDC Plan | — | — | $ 43,430(3) | — | $326,959 | |||||||
SERP
| —
| $ 94,861
| $ 29,198(4)
| —
|
| $ 833,045
| (6)
| |||||
Robert S. Taylor | ||||||||||||
NQDC Plan | — | — | — | — | — | |||||||
SERP
| —
| $154,102
| $ 60,038(4)
| —
|
| $1,671,313
| (6)
| |||||
Brian K. Moore | ||||||||||||
NQDC Plan | — | — | — | — | — | |||||||
SERP
| —
| $ 99,574
| $ 17,768(4)
| —
|
| $ 548,986
| (6)
| |||||
A. Patrick Bernard | ||||||||||||
NQDC Plan | $226,077 | — | $571,294(3) | — | $6,348,391 | (5) | ||||||
SERP
| —
| $ 92,786
| $ 35,864(4)
| —
|
| $ 999,061
| (6)
| |||||
William B. Masters | ||||||||||||
NQDC Plan | $195,669 | — | $ 72,261(3) | — | $ 601,653 | (5) | ||||||
SERP | — | $ 53,388 | $ 17,461(4) | — | $ 494,728 | (6) | ||||||
| (1) | Of the contributions reflected in this column, the following contributions are part of the total compensation for 2016 and are included under the salary column in the “Summary Compensation Table” herein: Mr. Bernard — $37,238 and Mr. Masters — $42,853. The remainder of the contributions reported in this column for Mr. Bernard and Mr. Masters were part of the total compensation reported for 2015 but paid in 2016. |
| (2) | The amounts reflected are part of each executive’s total compensation for 2016, and are included under the all other compensation column in the “Summary Compensation Table” herein. |
| 50 | | |||
Table of Contents
|
EXECUTIVE COMPENSATION
|
|
| (3) | With regard to the NQDC Plan, participant contributions are treated as if invested in one or more investment vehicles selected by the participant. The annual rate of return for these funds for fiscal year 2016 was as follows: |
| Fund
|
One Year Total Return
| |
Nationwide VIT Money Market V
|
0.03%
| |
JPMorgan IT Core Bond 1
|
2.12%
| |
PIMCO VIT Real Return Admin
|
5.18%
| |
MFS VIT Value Svc
|
13.78%
| |
Dreyfus Stock Index Initial
|
11.71%
| |
American Funds IS Growth 2
|
9.49%
| |
JPMorgan IT Mid Cap Value 1
|
14.69%
| |
Janus Aspen Enterprise Svc
|
12.10%
| |
DFA VA U.S. Targeted Value
|
27.49%
| |
Vanguard VIF Small Company Growth Inv
|
14.94%
| |
MFS VIT II International Value Svc
|
3.84%
| |
American Funds IS International 2
|
3.53%
| |
Invesco VIF Global Real Estate I |
2.04% |
| (4) | Pursuant to the terms of the SERP, aggregate earnings for 2016 were calculated at a rate of interest equal to 4.11%, which was ourafter-tax long-term borrowing rate. |
| (5) | With regard to the NQDC Plan, of the contributions reflected in this column, $232,298 and $555,925 of Mr. Bernard’s contributions are part of his total compensation for 2015 and 2014, respectively, and $192,802 and $219,517 and of Mr. Masters’ contributions are part of his total compensation for 2015 and 2014, respectively, each of which are included under the applicable columns in the “Summary Compensation Table” herein. |
| (6) | With regard to the SERP, the following amounts reflected in this column for each named executive officer are part of his total compensation for 2015 and are included under the all other compensation column in the “Summary Compensation Table”: Mr. Dunlap — $257,885, Mr. Taylor — $285,376, Mr. Moore — $224,844, Mr. Bernard — $153,074 and Mr. Masters — $117,436. The following amounts reflected in this column for each named executive officer are part of his total compensation for 2014 and are included under the all other compensation column in the “Summary Compensation Table”: Mr. Dunlap — $75,000, Mr. Taylor — $108,160, Mr. Moore — $88,575, Mr. Bernard — $62,775 and Mr. Masters — $36,120. |
| | 51 | |||
Table of Contents
|
EXECUTIVE COMPENSATION
|
|
POTENTIAL PAYMENTS UPON TERMINATIONOR CHANGEOF CONTROL
In addition to the post-employment benefits provided under the Company’s 401(k) plan, the SERP and the NQDC Plan (described above), we have also entered into employment agreements with each of our named executive officers entitling them to severance benefits upon a termination of employment by the Company under certain conditions or in connection with a change of control of the Company, as discussed below. See also “Executive Compensation — Compensation Discussion and Analysis” for additional information.
Set forth below is a description of the employment agreements and Change of Control Severance Plan in place with each of our named executive officers. As required by the SEC’s disclosure rules, we have included disclosure quantifying the potential payments to our named executives under various termination and change of control scenarios based on the agreements in place as of December 31, 2016.
Executive Employment Agreements and Severance Program
Employment Agreements — All Executive Officers. All of our executives are party to the same form of employment agreement. The initial term of each employment agreement is three years, and the term automatically extends for an additional year on the second anniversary and each anniversary thereof unless either the executive or the Company provides at least 60 days prior written notice of that party’s election not to extend the term. The employment agreements provide that our executive officers will:
| • | receive a base salary, |
| • | be eligible for annual incentive bonuses and long-term incentive awards as approved by the Compensation Committee, |
| • | participate in the retirement and welfare benefit plans of the Company, and |
| • | be participants in our Change of Control Severance Plan. |
Termination due to Incapacity, No Cause, Good Reason. Under the employment agreements, if (i) the Company terminates an executive’s employment due to the executive’s incapacity, (ii) the Company terminates the executive’s employment
without cause, or (iii) the executive terminates his employment for good reason, and such termination under (ii) or (iii) is not in connection with a change of control, then, subject to the executive’s execution of a release of claims (other than with respect to Accrued Amounts), the Company will be required to pay or provide to the executive:
| • | the executive’s base salary through the date of termination, any earned but unpaid cash incentive compensation for the preceding calendar year, any rights under the terms of equity awards and any medical or other welfare benefits required by law (the Accrued Amounts); |
| • | a lump sum payment on the first business day following the date that is 60 days after the date of termination equal to the sum of: |
| ○ | two times the sum of the executive’s (1) annual salary plus (2) target annual bonus; plus |
| ○ | the executive’s target annual bonus for the year of termination,pro-rated for days of employment during such year; and |
| • | Company-paid healthcare continuation benefits for a period of up to 24 months for the executive and the executive’s spouse and/or family, as applicable (the Welfare Continuation Benefit). |
The payments and benefits described in connection with such terminations are subject to the executive’s timely execution of a release of claims against the Company.
Termination for No Cause or Good Reason with Change of Control. If the executive is terminated by the Company without cause or if the executive terminates his employment for good reason and such termination occurs within six months before or 24 months after a change of control, then, subject to the executive’s execution of a release of claims (other than with respect to Accrued Amounts), the Company will be required to pay or provide to the executive:
| • | the Accrued Amounts; |
| • | a cash severance payment pursuant to the terms of our Change of Control Severance Plan (described further below in this section); |
| 52 | | |||
Table of Contents
|
EXECUTIVE COMPENSATION
|
|
| • | on the first business day following the date that is 60 days after the date of termination, a lump sum amount equal to the executive’s target annual bonus for the year of termination,pro-rated for days of employment during such year; |
| • | outplacement services for one year after termination at a cost of up to $10,000; and |
| • | the Welfare Continuation Benefit. |
The executive is liable for any taxes, including any excise taxes on excess parachute payments, on the executive due to payments or benefits pursuant to the employment agreement and the Change of Control Severance Plan.
Termination for Cause, Death or Without Good Reason. If the executive is terminated by the Company for cause, due to the executive’s death or by the executive without good reason, then the Company will only be required to pay to the executive (or to the executive’s estate) the Accrued Amounts.
Each employment agreement contains an indefinite confidentiality and protection of information covenant and a mutualnon-disparagement covenant extending for one year after termination of employment. If the executive is terminated by the Company for cause or if the executive terminates the executive’s employment without good reason, the executive will be bound by anon-compete andnon-solicitation covenant extending for one year after the date of the executive’s termination.
Change of Control Severance Plan. Each executive participates in the Company’s Change of Control Severance Plan and is eligible to receive certain cash severance payments upon a termination of employment without cause or for good reason that occurs within six months before or twenty-four months after a change of control. The potential severance
payments due under the plan are determined as of the date of the change of control, based on a sharing pool that is calculated as a percentage of the transaction value (with such sharing pool increasing or decreasing as such transaction value increases or decreases, respectively). Although the potential severance payment due each participant in the plan is determined as of the date of the change of control, payments are only made if and when a participant experiences a qualifying termination within six months before or 24 months after the change of control, as discussed above. The Company does not provide excise taxgross-ups under our severance plan.
Calculation of change of control severance benefits. Under the plan, at the time of a change of control, the Compensation Committee will determine each participant’s severance benefit as if the participant had experienced a qualifying termination on the date of the change of control. The severance benefit determined by the Compensation Committee to be potentially payable to each participant is final and binding.
The severance benefit is equal to each participant’s portion of the sharing pool, which is the total cash available under the plan to be distributed to all the participants as cash severance. As noted above, each participant’s severance benefit will be determined based on the assumption that the participant is terminated on the date of the change of control, and will also be determined according to two principles: (1) each participant receives as “netafter-tax benefit” the same percentage (to within +/- 0.1%) of the total netafter-tax benefit that would be received by all participants under the plan as his or her percentage interest; and (2) the total netafter-tax benefit received by all participants is maximized. Under the plan, each participant’s “netafter-tax benefit” is the sum of the participant’s total change of control value and severance benefit, reduced by the total tax liability (as such terms are defined in the plan).
| | 53 | |||
Table of Contents
|
EXECUTIVE COMPENSATION
|
|
Determination of “sharing pool.” The total severance benefits payable under the plan may not exceed the “sharing pool.” The sharing pool is determined based on the transaction value (as defined in the plan, but generally includes the consideration paid for the outstanding shares of our common stock plus any debt assumed less cash assumed) at the time of the change of control, as follows:
| Transaction Value (in Billions) | Sharing Pool (6 Executives) |
Sharing Pool as a
| ||
$1.0
|
$14,500,000
|
1.45%
| ||
$2.0
|
$17,725,601
|
0.89%
| ||
$2.5 |
$18,476,908
|
0.74%
| ||
$3.0
|
$19,245,266
|
0.64%
| ||
$3.5
|
$20,031,202
|
0.57%
| ||
$4.0
|
$20,835,260
|
0.52%
| ||
$4.5
|
$21,658,000
|
0.48%
| ||
$5.0
|
$22,500,000
|
0.45%
| ||
$5.5
|
$23,342,000
|
0.42%
| ||
$6.0
|
$24,203,260
|
0.40%
| ||
$6.5
|
$25,084,358
|
0.39%
| ||
$7.0
|
$25,985,889
|
0.37%
| ||
$7.5
|
$26,908,465
|
0.36%
| ||
$8.0
|
$27,852,719
|
0.35%
| ||
$8.5
|
$28,819,301
|
0.34%
| ||
$9.0
|
$29,808,880
|
0.33%
| ||
$9.5
|
$30,822,146
|
0.32%
| ||
$10.0
|
$31,859,811
|
0.32%
| ||
$10.5
|
$32,922,605
|
0.31%
| ||
$11.0
|
$34,011,283
|
0.31%
| ||
$20.0
|
$40,000,000
|
0.20%
|
If the actual transaction value at the time of a change of control falls between the transaction values shown above, the sharing pool will be interpolated, and the Compensation Committee will determine the sharing pool should the applicable transaction value fall outside the values above. In addition, the sharing pool values will be adjusted if new participants are added to or removed from the plan between the effective date of the plan and the date of the change of control. Specifically, the sharing pool will be decreased or increased, as applicable, by the amount that is equal to the applicable transaction value multiplied by 0.07% or 0.04% if the individual is in the top half or bottom half, respectively, of participants ranked by their “combined compensation” (as defined in the plan), as determined by the Compensation Committee. Under
the plan, a participant’s “combined compensation” is the sum of the participant’s base salary, target bonus, and unvested long-term incentives, as those terms are defined in the plan.
Calculation of participant’s percentage interest in the sharing pool. Each participant’s interest, or “participation alignment,” in the sharing pool is initially determined by dividing the participant’s “combined compensation” by the sum of the combined compensation for all participants, thus resulting in a percentage amount for each participant which, in total, add up to 100%. The difference between the participation alignment of the participant with the highest combined compensation and the participation alignment of the participant with the second highest combined compensation of all the participants as of
| 54 | | |||
Table of Contents
|
EXECUTIVE COMPENSATION
|
|
the date of the change of control may not exceed the percentage that is equal to (1/n)% +12%, wheren is the number of participants as of the date of the change of control. If necessary, the participation alignment of the participant with the highest combined compensation as of the date of the change of control will be decreased and the participation alignments of each of the other participants increased on a pro rata basis such that (1) the rule contained in the preceding sentence is respected and (2) the sum of the participation alignments of all participants is equal to 100% (effectively capping the highest paid executive’s benefit).
Equity Awards
As described above, under the applicable award agreements for our outstanding equity awards, such awards will vest in full upon a change of control of the Company. In addition, the award agreements provide that outstanding equity awards will vest in full upon the applicable executives’ death or incapacity.
Upon the termination of an executive’s employment due to retirement or a termination without cause by the Company, the Compensation Committee, in its discretion, may elect to accelerate the vesting of such awards. In addition, upon the termination of an executive’s employment prior to the end of the applicable performance period due to retirement, death, disability or a termination by the Company without cause, apro-rata portion of the executive’s
PSUs will remain outstanding and will be valued and paid in accordance with their terms.
Except as otherwise noted, the following table quantifies the potential payments to our named executive officers under their employment arrangements and our Change of Control Severance Plan discussed above, for various scenarios involving a change of control or termination of employment of each of our named executive officers, assuming a December 31, 2016 termination date, and where applicable, using the closing price of our common stock of $16.88 (as reported on the NYSE as of December 30, 2016). Excluded are benefits provided to all employees, such as accrued vacation and benefits provided by third parties under our life and other insurance policies. Also excluded are benefits our named executive officers would receive upon termination of employment under the SERP and the NQDC Plan, as described above, as well as benefits under our 401(k) plan. The table also assumes the following:
| • | the number of participants in the Change of Control Severance Plan is six; |
| • | the transaction value on December 31, 2016 is $3.567 billion (estimated value assumes equity based on December 31, 2016 stock price plus all outstanding debt on the December 31, 2016 balance sheet); and |
| • | the corresponding sharing pool is $20,138,620. |
| | 55 | |||
Table of Contents
|
EXECUTIVE COMPENSATION
|
|
| Name |
Lump Sum Severance Payment
| Outstanding Unvested Options | Outstanding Restricted Stock/RSUs | Outstanding PSUs | Health Benefits | Tax Gross-Up | Total | |||||||||||||||||||||
David D. Dunlap | ||||||||||||||||||||||||||||
• Retirement | n/a | n/a | n/a | (2) | n/a | n/a | — | |||||||||||||||||||||
• Death | n/a | $5,916,898 | $1,301,786 | (2) | n/a | n/a | $7,218,684 | |||||||||||||||||||||
• Disability/Incapacity | $ 3,612,500 | $5,916,898 | $1,301,786 | (2) | $31,768 | n/a | $10,862,952 | |||||||||||||||||||||
• Termination– No Cause | $ 3,612,500 | n/a | n/a | (2) | $31,768 | n/a | $ 3,644,268 | |||||||||||||||||||||
• Termination – Good Reason | $ 3,612,500 | n/a | n/a | (2) | $31,768 | n/a |
| $ 3,644,268 |
| |||||||||||||||||||
• Termination in connection with Change of Control(1)
|
| $11,212,425
|
|
| $5,916,898
|
|
| $1,301,786
|
|
| $12,000,000
|
|
| $31,768
|
|
| n/a
|
|
| $30,462,877
|
| |||||||
Robert S. Taylor | ||||||||||||||||||||||||||||
• Retirement | n/a | n/a | n/a | (2) | n/a | n/a | — | |||||||||||||||||||||
• Death | n/a | $1,919,915 | $ 422,388 | (2) | n/a | n/a | $ 2,342,303 | |||||||||||||||||||||
• Disability/Incapacity | $ 1,608,880 | $1,919,915 | $ 422,388 | (2) | $31,768 | n/a | $ 3,982,951 | |||||||||||||||||||||
• Termination – No Cause | $ 1,608,880 | n/a | n/a | (2) | $31,768 | n/a | $ 1,640,648 | |||||||||||||||||||||
• Termination – Good Reason | $ 1,608,880 | n/a | n/a | (2) | $31,768 | n/a | $ 1,640,648 | |||||||||||||||||||||
• Termination in connection with Change of Control(1)
|
| $ 1,874,731
|
|
| $1,919,915
|
|
| $ 422,388
|
|
| $ 3,893,600
|
|
| $31,768
|
|
| n/a
|
|
| $ 8,142,402
|
| |||||||
Brian K. Moore | ||||||||||||||||||||||||||||
• Retirement | n/a | n/a | n/a | (2) | n/a | n/a | — | |||||||||||||||||||||
• Death | n/a | $1,746,963 | $ 384,358 | (2) | n/a | n/a | $ 2,131,321 | |||||||||||||||||||||
• Disability/Incapacity | $ 1,709,682 | $1,746,963 | $ 384,358 | (2) | $22,278 | n/a | $ 3,863,281 | |||||||||||||||||||||
• Termination – No Cause | $ 1,709,682 | n/a | n/a | (2) | $22,278 | n/a | $ 1,731,960 | |||||||||||||||||||||
• Termination – Good Reason | $ 1,709,682 | n/a | n/a | (2) | $22,278 | n/a | $ 1,731,960 | |||||||||||||||||||||
• Termination in connection with Change in Control
|
| $ 1,892,949
|
|
| $1,746,963
|
|
| $ 384,358
|
|
| $ 3,543,200
|
|
| $22,278
|
|
| n/a
|
|
| $ 7,589,748
|
| |||||||
A. Patrick Bernard | ||||||||||||||||||||||||||||
• Retirement | n/a | n/a | n/a | (2) | n/a | n/a | — | |||||||||||||||||||||
• Death | n/a | $1,238,111 | $ 272,393 | (2) | n/a | n/a | $ 1,510,504 | |||||||||||||||||||||
• Disability/Incapacity | $ 1,178,339 | $1,238,111 | $ 272,393 | (2) | $31,768 | n/a | $ 2,720,611 | |||||||||||||||||||||
• Termination – No Cause | $ 1,178,339 | n/a | n/a | (2) | $31,768 | n/a | $ 1,210,107 | |||||||||||||||||||||
• Termination – Good Reason | $ 1,178,339 | n/a | n/a | (2) | $31,768 | n/a | $ 1,210,107 | |||||||||||||||||||||
• Termination in connection with Change of Control(1)
|
| $ 1,302,764
|
|
| $1,238,111
|
|
| $ 272,393
|
|
| $ 2,511,200
|
|
| $31,768
|
|
| n/a
|
|
| $ 5,356,236
|
| |||||||
William B. Masters | ||||||||||||||||||||||||||||
• Retirement | n/a | n/a | n/a | (2) | n/a | n/a | — | |||||||||||||||||||||
• Death | n/a | $1,187,324 | $ 261,218 | (2) | n/a | n/a | $ 1,448,542 | |||||||||||||||||||||
• Disability/Incapacity | $ 1,356,005 | $1,187,324 | $ 261,218 | (2) | $31,768 | n/a | $ 2,836,315 | |||||||||||||||||||||
• Termination – No Cause | $ 1,356,005 | n/a | n/a | (2) | $31,768 | n/a | $ 1,387,773 | |||||||||||||||||||||
• Termination – Good Reason | $ 1,356,005 | n/a | n/a | (2) | $31,768 | n/a | $ 1,387,773 | |||||||||||||||||||||
• Termination in connection with Change of Control(1)
|
| $ 2,866,862
|
|
| $1,187,324
|
|
| $ 261,218
|
|
| $ 2,408,000
|
|
| $31,768
|
|
| n/a
|
|
| $ 6,755,172
|
| |||||||
| 56 | | |||
Table of Contents
|
EXECUTIVE COMPENSATION
|
|
| (1) | Certain of the benefits described in the table would be achieved in the event of a change of control alone, and would not require a termination of the executive’s employment. In particular, pursuant to the terms of our incentive award plans and the individual award agreements, upon a change of control as defined in the plans, (i) all outstanding stock options would immediately vest, (ii) all restrictions on outstanding restricted shares and RSUs would lapse and (iii) all outstanding PSUs would be paid out as if the maximum level of performance had been achieved. In addition to the amounts set forth in the table above, upon a qualifying termination in connection with a change in control, each executive is also entitled to outplacement assistance of up to $10,000, and the lump sum severance payment due to each executive would consist of the following: |
| Name |
Change of Control Severance Plan Payment
| Target Bonus Payment
| ||||||
Mr. Dunlap
|
$
|
10,574,925
|
|
$
|
637,500
|
| ||
Mr. Taylor
|
$
|
1,644,891
|
|
$
|
229,840
|
| ||
Mr. Moore
|
$
|
1,657,044
|
|
$
|
235,905
|
| ||
Mr. Bernard
|
$
|
1,146,245
|
|
$
|
156,519
|
| ||
Mr. Masters
|
$
|
2,686,743
|
|
$
|
180,118
|
| ||
| (2) | Pursuant to the terms of the PSU award agreements, if an executive’s employment terminates prior to the end of the applicable performance period as a result of retirement, death, disability, or termination for any reason other than the voluntary termination by the executive or termination by the Company for cause, then the executive retains apro-rata portion of outstanding award based on his employment during the performance period, and the remaining units will be forfeited. The retained units will be valued and paid out to the executive in accordance with their original payment schedule based on the Company’s achievement of the applicable performance criteria. Upon a voluntary termination by the executive or a termination by the Company for cause, all outstanding units are forfeited. |
| | 57 | |||
Table of Contents
| 58 | | |||
Table of Contents
QUESTIONS AND ANSWERS ABOUT THE 2017 ANNUAL MEETING
|
Why am I receiving this proxy statement?
Our Board is soliciting your proxy to vote at the annual meeting because you owned shares of our common stock at the close of business on April 3, 2017, the record date for the annual meeting, and are entitled to vote at the annual meeting. This Proxy Statement, along with a proxy card or a voting instruction card
and a copy of our 2016 Annual Report, are being mailed to our stockholders on or about April 12, 2017. This proxy statement summarizes the information you need to know to vote at the annual meeting. You do not need to attend the annual meeting to vote your shares of our common stock.
On what matters will I be voting?
At the annual meeting, our stockholders will be asked to (i) elect the eight director nominees, (ii) hold an advisory vote on the compensation of our named executive officers (the“say-on-pay” proposal), (iii) hold an advisory vote on the frequency of future advisory
votes on the compensation of our named executive officers (the“say-on-frequency” proposal), and (iv) ratify the appointment of KPMG as our independent registered public accounting firm for 2017.
When and where will the annual meeting be held?
The meeting will be held at 9:00 a.m., Central Daylight Time, on Tuesday, May 23, 2017, at our headquarters located at 1001 Louisiana Street, Houston, Texas,
77002. To obtain directions to our headquarters and vote in person, please contact us at(713) 654-2200.
How many votes may I cast?
You have one vote for every share of our common stock that you owned on the record date for the annual meeting.
How many shares of our common stock are eligible to be voted?
As of the record date for the annual meeting, we had 152,831,563 shares of our common stock outstanding, each of which entitles the holder to one vote.
How many shares of our common stock must be present to hold the annual meeting?
Our Bylaws provide that a majority of the outstanding shares of our common stock entitled to vote generally in the election of directors, represented in person or by proxy, constitutes a quorum at a meeting of our stockholders. As of the record date, 76,415,782 shares of our common stock constitute a quorum. If
you are a beneficial owner (as defined below) of shares of our common stock and you do not instruct your broker, bank or other nominee how to vote your shares on any of the proposals, your shares will be counted as present at the annual meeting for purposes of determining whether a quorum exists. In
| | 59 | |||
Table of Contents
|
QUESTIONS AND ANSWERS ABOUT THE 2017 ANNUAL MEETING
|
|
addition, stockholders of record who are present at the annual meeting in person or by proxy will be counted as present at the annual meeting for purposes of
determining whether a quorum exists, whether or not such holder abstains from voting on any or all of the proposals.
What are my voting options on each proposal? How does our Board recommend that I vote? How many votes are required to approve each proposal?
| Proposal | Your Voting Options | Board’s Recommendation | Vote Required to Approve the Proposal | |||
| No. 1: Election of the eight director nominees | You may vote “FOR” each nominee or choose to “WITHHOLD” your vote for all or none or one of the nominees | FOR each of the eight director nominees | Directors will be elected byplurality. That means the nominees who receive the greatest number of “for” votes will be elected, except that a nominee who receives a greater number of “withhold” than “for” votes must tender his resignation
| |||
| No. 2: Approval of thesay-on-pay proposal (advisory) | You may vote “FOR” or “AGAINST” this proposal or “ABSTAIN” from voting | FOR approval of our executive compensation for 2016 as disclosed in this proxy statement
| Affirmative vote of the holders of a majority of the shares of our common stock present and entitled to vote on the proposal | |||
| No. 3: Frequency of futuresay-on-pay votes (advisory) | You may vote “EVERY 1 YEAR,” “EVERY 2 YEARS,” or “EVERY 3 YEARS” on this proposal or “ABSTAIN” from voting | To holdsay-on-pay advisory votes on our executive officers’ compensation EVERY 1 YEAR
| Affirmative vote of the holders of a majority of the shares of our common stock present and entitled to vote on the proposal | |||
| No. 4: Ratification of KPMG as our independent registered public accounting firm for 2017 | You may vote “FOR” or “AGAINST” this proposal or “ABSTAIN” from voting | FOR ratification of our selection of KPMG as our independent auditor for 2017
| Affirmative vote of the holders of a majority of the shares of our common stock present and entitled to vote on the proposal |
What is the difference between holding shares as a stockholder of record and as a beneficial owner?
If your shares of our common stock are registered directly in your name with our transfer agent, American Stock Transfer and Trust Company, you are considered, with respect to those shares, the “stockholder of record.” In this case, we have sent the proxy materials directly to you.
If your shares of our common stock are held in a stock brokerage account or by a bank or other nominee, you are considered the “beneficial owner” of such shares held in “street name.” In this case, the proxy materials have been forwarded to you by your broker, bank or
other nominee. As the beneficial owner, you have the right to direct your broker, bank or other nominee how to vote your shares by using the voting instruction card included in the mailing or by following their instructions for voting by telephone or Internet. You should also be aware that you may not vote shares held in street name by returning a proxy card directly to us or by voting in person at the annual meeting unless you provide a “legal proxy,” which you must obtain from your broker, bank or other nominee.
| 60 | | |||
Table of Contents
|
QUESTIONS AND ANSWERS ABOUT THE 2017 ANNUAL MEETING
|
|
What happens if I complete the proxy or voting instruction card? What if I don’t vote for a proposal? On which proposals may my shares be voted without receiving voting instructions from me?
If you properly complete, sign, date and return a proxy or voting instruction form, your shares will be voted as you specify.
If you are a stockholder of record and you do not submit voting instructions on your returned proxy card, your shares of our common stock will be voted in accordance with the recommendations of our Board, as provided above.
If you are a beneficial owner, under the rules of the NYSE, your broker, bank or other nominee may generally vote your shares on routine matters without
receiving voting instructions from you but cannot vote your shares onnon-routine matters. Of the proposals, only the ratification of the appointment of KPMG as our independent registered public accounting firm for 2017 is a routine matter. If your broker, bank or other nominee does not receive instructions from you on how to vote your shares on the remainder of the proposals, the organization will not have the authority to vote your shares of our common stock on those matters. This is generally referred to as a “brokernon-vote.”
What are the effects of abstentions and brokernon-votes on each proposal?
Abstentions will:
| • | have no effect on the election of directors (Proposal 1). |
| • | have the effect of a vote “AGAINST” the remainder of the proposals (Proposal 2, Proposal 3 and Proposal 4). |
Brokernon-votes will:
| • | have no effect on the election of directors (Proposal 1), thesay-on-pay proposal (Proposal 2) and thesay-on-frequency proposal (Proposal |
3), as the stockholder of record of these shares is not entitled to vote on the specific matter without instructions from the beneficial owner. |
| • | not occur with respect to ratification of the appointment of KPMG as our independent registered public accounting firm for 2017 (Proposal 4), as this is a routine matter and a broker, bank or other nominee can vote on Proposal 4 without instructions from the beneficial owner. However, if the broker, bank or other nominee does not vote on Proposal 4, an abstention will occur. |
How do I vote?
You may vote using any of the following methods depending on if you are a stockholder of record or a beneficial owner.
| Proxy card or voting instruction card by mail: Be sure to complete, sign and date such card and return it in the prepaid envelope. | |
| Telephone or Internet: Stockholders of record can vote via the Internet 24 hours a day, seven days a week until 11:59 p.m. on May 22, 2017 atwww.voteproxy.com. Please have your proxy card available when you access the website. The availability of telephone and Internet voting for beneficial owners will depend on the voting processes of your broker, bank or other nominee. | |


Therefore, we recommend that you follow the instructions on how to submit your voting instructions in the materials you receive from such organization. | ||
| In person at the annual meeting: All stockholders may vote in person at the annual meeting. You may also be represented by another person at the annual meeting by properly designating such person as your proxy. If you are a beneficial owner of shares of our common stock, you must obtain a legal proxy from your broker, bank or other nominee and present it to the inspectors of election with your ballot when you vote your shares at the annual meeting. | |

| | 61 | |||
Table of Contents
|
QUESTIONS AND ANSWERS ABOUT THE 2017 ANNUAL MEETING
|
|
Can I change my vote?
Yes. Your proxy can be revoked or changed at any time before it is used to vote your shares of our common stock by notice in writing to our Secretary, by our timely receipt of another proxy with a later date or
by voting in person at the meeting. Your attendance alone at the annual meeting will not be enough to revoke your proxy.
Who pays for soliciting proxies?
We pay all expenses incurred in connection with the solicitation of proxies to vote at the annual meeting. We have retained Georgeson LLC, 480 Washington Boulevard, 26th Floor, Jersey City, New Jersey 07310, for an estimated fee of $11,500 plus reimbursement of certain reasonable expenses, to assist in the solicitation of proxies and otherwise in connection with the annual meeting. We and our proxy solicitor will also request banks, brokers and other nominees holding shares of our common stock beneficially
owned by others to send this Proxy Statement, the proxy card and our 2016 Annual Report to, and obtain voting instructions from, the beneficial owners and will reimburse such organization for their reasonable expenses in so doing. Solicitation of proxies by mail may be supplemented by telephone, email and other electronic means, advertisements and personal solicitation by our directors, officers and employees. No additional compensation will be paid to directors, officers or employees for such solicitation efforts.
Could other matters be decided at the meeting?
Our Board does not expect to bring any other matter before the annual meeting, and it is not aware of any other matter that may be considered at the meeting. In addition, pursuant to our Bylaws, the time has elapsed for any stockholder to properly bring a matter before
the meeting. However, if any other matter does properly come before the annual meeting, the proxy holder will vote any shares of our common stock for which he holds a proxy in his discretion.
What happens if the meeting is postponed or adjourned?
Your proxy will still be good and may be used to vote your shares at the postponed or adjourned meeting.
You will still be able to change or revoke your proxy until it is used to vote your shares.
| 62 | | |||
Table of Contents
2018 STOCKHOLDER NOMINATIONS AND
|
If you want us to consider including a proposal in next year’s proxy statement, you must deliver it in writing c/o Secretary, Superior Energy Services, Inc., 1001 Louisiana Street, Suite 2900, Houston, Texas 77002, by December 15, 2017.
Our Bylaws require that stockholders who wish to make a nomination for the election of a director or to bring any other matter before a meeting of the stockholders must give written notice of their intent to our Secretary not more than 120 days and not less than 90 days in advance of the first anniversary of the preceding year’s annual meeting of stockholders. For our 2018 annual meeting, a stockholder’s notice must be received by our Secretary between and including January 23, 2018 and February 22, 2018. Such notice must comply with the requirements set forth in our Bylaws. A copy of our Bylaws is available upon request c/o Secretary, Superior Energy Services, Inc., 1001 Louisiana Street, Suite 2900, Houston, Texas 77002. We urge our stockholders to send their proposals by certified mail, return receipt requested.
By Order of the Board of Directors, |
|
WILLIAM B. MASTERS |
Executive Vice President, General Counsel and |
Secretary |
Houston, Texas
April 12, 2017
| | 63 | |||
Table of Contents

Superior Energy Services, Inc.
1001 Louisiana Street, Suite 2900
Houston, TX 77002
713-654-2200
www.superiorenergy.com
Table of Contents
0 ⬛
SUPERIOR ENERGY SERVICES, INC.
1001 LOUISIANA STREET
HOUSTON, TEXAS 77002
YOUR PROXY IS SOLICITED BY THE BOARD OF DIRECTORS
FOR USE AT THE ANNUAL MEETING OF STOCKHOLDERS ON MAY 23, 2017.
By signing this proxy card, you revoke all prior proxies and appoint Porter Nolan, with full power of substitution, to represent you and to vote your shares on the matters shown on the reverse side of this proxy card at our annual meeting of stockholders to be held at 9:00 a.m. Central Time on Tuesday, May 23, 2017, at our headquarters located at 1001 Louisiana Street, Houston, Texas 77002 and any adjournments thereof. To obtain directions to our headquarters, please contact us at (713)654-2200.
(CONTINUED AND TO BE SIGNED ON THE REVERSE SIDE)
⬛ 1.1 | 14475 ⬛ |
Table of Contents
ANNUAL MEETING OF STOCKHOLDERS OF
SUPERIOR ENERGY SERVICES, INC.
May 23, 2017
SUBMITTING YOUR PROXY AND VOTING INSTRUCTIONS
|
INTERNET- Access “www.voteproxy.com” and follow the on-screen instructions or scan the QR code with your smartphone. Have your proxy card available when you access the web page.
TELEPHONE - Call toll-free1-800-PROXIES(1-800-776-9437) in the United States or1-718-921-8500from foreign countries from any touch-tone telephone and follow the instructions. Have your proxy card available when you call.
Submit your proxy and voting instructions online/phone until 11:59 p.m. Central Time the day before the meeting.
|
| |||||||||
MAIL- Sign, date and mail your proxy card in the envelope provided as soon as possible.
IN PERSON- You may vote your shares in person by attending the Annual Meeting.
GO GREEN- e-Consent makes it easy to go paperless. With e-Consent, you can quickly access your proxy materials, statements and other eligible documents online, while reducing costs, clutter and paper waste. Enroll today via www.astfinancial.com to enjoy online access. |
COMPANY NUMBER
| |||||||||
ACCOUNT NUMBER
| ||||||||||
|

IMPORTANT NOTICE REGARDING THE AVAILABILITY OF PROXY MATERIALS FOR THE STOCKHOLDER MEETING TO BE HELD ON MAY 23, 2017 The accompanying proxy statement and the 2016 annual report are available at https://materials.proxyvote.com/868157
|
i Please detach along perforated line and mail this proxy card in the envelope providedIF you are not submitting your proxy and voting instructions via the Internet or telephone.i
| ∎ | 20830403000000000000 0 | 052317 | ||||||||||||||||
SUPERIOR’S BOARD OF DIRECTORS RECOMMENDS THAT STOCKHOLDERS VOTE “FOR” PROPOSALS 1, 2 AND 4, AND FOR “EVERY 1 YEAR” ON PROPOSAL 3. PLEASE SIGN, DATE AND RETURN PROMPTLY IN THE ENCLOSED ENVELOPE. PLEASE MARK YOUR VOTING INSTRUCTIONS IN BLUE OR BLACK INK AS SHOWN HERE ☒. | ||||||||||||||||
| FOR | AGAINST | ABSTAIN | ||||||||||||||||||||
1. Election of the eight director nominees.
NOMINEES: | 2. Approval, on an advisory basis, of the compensation of our named executive officers as disclosed in the accompanying proxy statement. | ☐ | ☐ | ☐ | ||||||||||||||||||
☐
☐
☐ |
FOR ALL NOMINEES
WITHHOLD AUTHORITY FOR ALL NOMINEES
FOR ALL EXCEPT (See instructions below) | O Harold J. Bouillion O David D. Dunlap O James M. Funk O Terence E. Hall O Peter D. Kinnear O Janiece M. Longoria O Michael M. McShane O W. Matt Ralls |
3. Adoption of the frequency, on an advisory basis, of future votes of the compensation of our named executive officers.
4. Ratification of the appointment of KPMG LLP as our independent registered public accounting firm for 2017.
| Every 1 year ☐ | Every 2 years ☐
FOR ☐ | Every ☐
AGAINST ☐ |
ABSTAIN ☐
ABSTAIN ☐ | |||||||||||||||
IF YOU WISH YOUR SHARES TO BE VOTED ON ALL MATTERS AS SUPERIOR’S BOARD OF DIRECTORS RECOMMENDS, OR IF YOU WISH YOUR SHARES TO BE VOTED AS YOU SPECIFY ON A MATTER OR ALL MATTERS, PLEASE MARK THE APPROPRIATE BOXES ON THIS VOTING INSTRUCTION CARD, SIGN, DATE AND RETURN IT IN THE ENCLOSED ENVELOPE AS SOON AS POSSIBLE. | ||||||||||||||||||||||
INSTRUCTIONS: To withhold authority to vote for any individual nominee(s), mark“FOR ALL EXCEPT”and fill in the circle next to each nominee you wish to withhold, as shown here: 🌑 |
THE STOCKHOLDER OF RECORD WILL VOTE YOUR SHARES AS YOU SPECIFIED ON THIS VOTING INSTRUCTION CARD; HOWEVER, IF NO VOTING INSTRUCTIONS ARE INDICATED ON THIS VOTING INSTRUCTION CARD, THE STOCKHOLDER OF RECORD CAN ONLY VOTE YOUR SHARES ON PROPOSAL 4 (RATIFICATION OF AUDITORS) WITHOUT YOUR INSTRUCTIONS. | |||||||||||||||||||||
PLEASE MARK, SIGN, DATE AND RETURN THIS VOTING INSTRUCTION CARD PROMPTLY USING THE ENCLOSED ENVELOPE. | ||||||||||||||||||||||
| To change the address on your account, please check the box at right and indicate your new address in the address space above. Please note that changes to the registered name(s) on the account may not be submitted via this method. | ☐ | |||||||||||||||||||||
Signature of Stockholder | Date: | Signature of Stockholder | Date: |
| ∎ | Note: | Please sign exactly as your name or names appear on this proxy card. When shares are held jointly, each holder should sign. When signing as executor, administrator, attorney, trustee or guardian, please give full title as such. If the signer is a corporation, please sign full corporate name by duly authorized officer, giving full title as such. If signer is a partnership, please sign in partnership name by authorized person. | ∎ | |||||||||||||||||
Table of Contents
ANNUAL MEETING OF STOCKHOLDERS OF
SUPERIOR ENERGY SERVICES, INC.
May 23, 2017
IMPORTANT NOTICE REGARDING THE AVAILABILITY OF PROXY MATERIALS
FOR THE STOCKHOLDER MEETING TO BE HELD ON MAY 23, 2017
The accompanying proxy statement and the 2016 annual report are available
at https://materials.proxyvote.com/868157
Please mark, sign, date,
and return your voting
instruction card in the
envelope provided as soon
as possible.
i Please detach along perforated line and mail this voting instruction card in the envelope provided.i
| ∎ | 20830403000000000000 0 | 052317 | ||||||||||||||||
SUPERIOR’S BOARD OF DIRECTORS RECOMMENDS THAT STOCKHOLDERS VOTE “FOR” PROPOSALS 1, 2 AND 4, AND FOR “EVERY 1 YEAR” ON PROPOSAL 3. PLEASE SIGN, DATE AND RETURN PROMPTLY IN THE ENCLOSED ENVELOPE. PLEASE MARK YOUR VOTING INSTRUCTIONS IN BLUE OR BLACK INK AS SHOWN HERE ☒. | ||||||||||||||||
| FOR | AGAINST | ABSTAIN | ||||||||||||||||||||
1. Election of the eight director nominees.
NOMINEES: | 2. Approval, on an advisory basis, of the compensation of our named executive officers as disclosed in the accompanying proxy statement. | ☐ | ☐ | ☐ | ||||||||||||||||||
☐
☐
☐ |
FOR ALL NOMINEES
WITHHOLD AUTHORITY FOR ALL NOMINEES
FOR ALL EXCEPT (See instructions below) | O Harold J. Bouillion O David D. Dunlap O James M. Funk O Terence E. Hall O Peter D. Kinnear O Janiece M. Longoria O Michael M. McShane O W. Matt Ralls |
3. Adoption of the frequency, on an advisory basis, of future votes of the compensation of our named executive officers.
4. Ratification of the appointment of KPMG LLP as our independent registered public accounting firm for 2017.
| Every 1 year ☐ | Every 2 years ☐
FOR ☐ | Every ☐
AGAINST ☐ |
ABSTAIN ☐
ABSTAIN ☐ | |||||||||||||||
IF YOU WISH YOUR SHARES TO BE VOTED ON ALL MATTERS AS SUPERIOR’S BOARD OF DIRECTORS RECOMMENDS, OR IF YOU WISH YOUR SHARES TO BE VOTED AS YOU SPECIFY ON A MATTER OR ALL MATTERS, PLEASE MARK THE APPROPRIATE BOXES ON THIS VOTING INSTRUCTION CARD, SIGN, DATE AND RETURN IT IN THE ENCLOSED ENVELOPE AS SOON AS POSSIBLE.
| ||||||||||||||||||||||
INSTRUCTIONS: To withhold authority to vote for any individual nominee(s), mark“FOR ALL EXCEPT”and fill in the circle next to each nominee you wish to withhold, as shown here: 🌑 | THE STOCKHOLDER OF RECORD WILL VOTE YOUR SHARES AS YOU SPECIFIED ON THIS VOTING INSTRUCTION CARD; HOWEVER, IF NO VOTING INSTRUCTIONS ARE INDICATED ON THIS VOTING INSTRUCTION CARD, THE STOCKHOLDER OF RECORD CAN ONLY VOTE YOUR SHARES ON PROPOSAL 4 (RATIFICATION OF AUDITORS) WITHOUT YOUR INSTRUCTIONS. | |||||||||||||||||||||
PLEASE MARK, SIGN, DATE AND RETURN THIS VOTING INSTRUCTION CARD PROMPTLY USING THE ENCLOSED ENVELOPE. | ||||||||||||||||||||||
Signature of Beneficial Owner | Date: | Signature of Beneficial Owner | Date: |
| ∎ | Note: | Please sign exactly as your name or names appear on this voting instruction card. When shares are owned jointly, each owner should sign. When signing as executor, administrator, attorney, trustee or guardian, please give full title as such. If the signer is a corporation, please sign full corporate name by duly authorized officer, giving full title as such. If signer is a partnership, please sign in partnership name by authorized person. | ∎ | |||||||||||||||||