Exhibit 99.2

Exhibit 99.2 First Quarter 2019 Earnings Results Presentation April 15, 2019
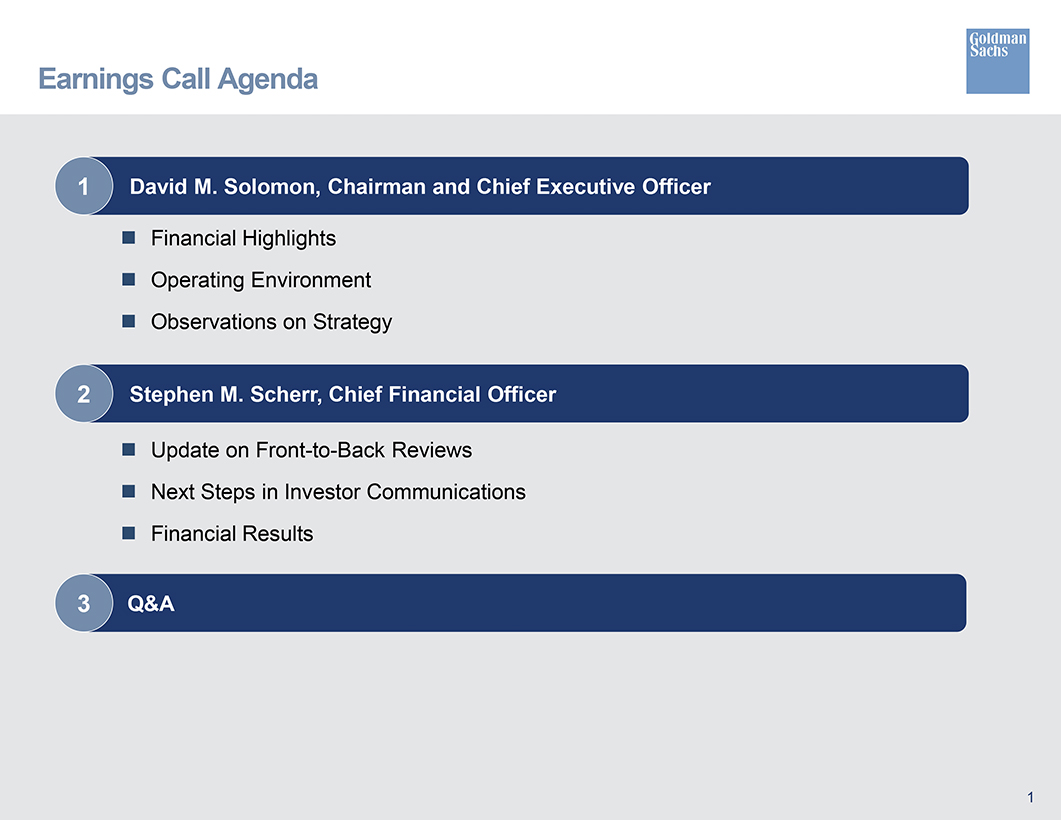
Earnings Call Agenda 1 David M. Solomon, Chairman and Chief Executive Officer Financial Highlights Operating Environment Observations on Strategy 2 Stephen M. Scherr, Chief Financial Officer Update onFront-to-Back Reviews Next Steps in Investor Communications Financial Results 3 Q&A
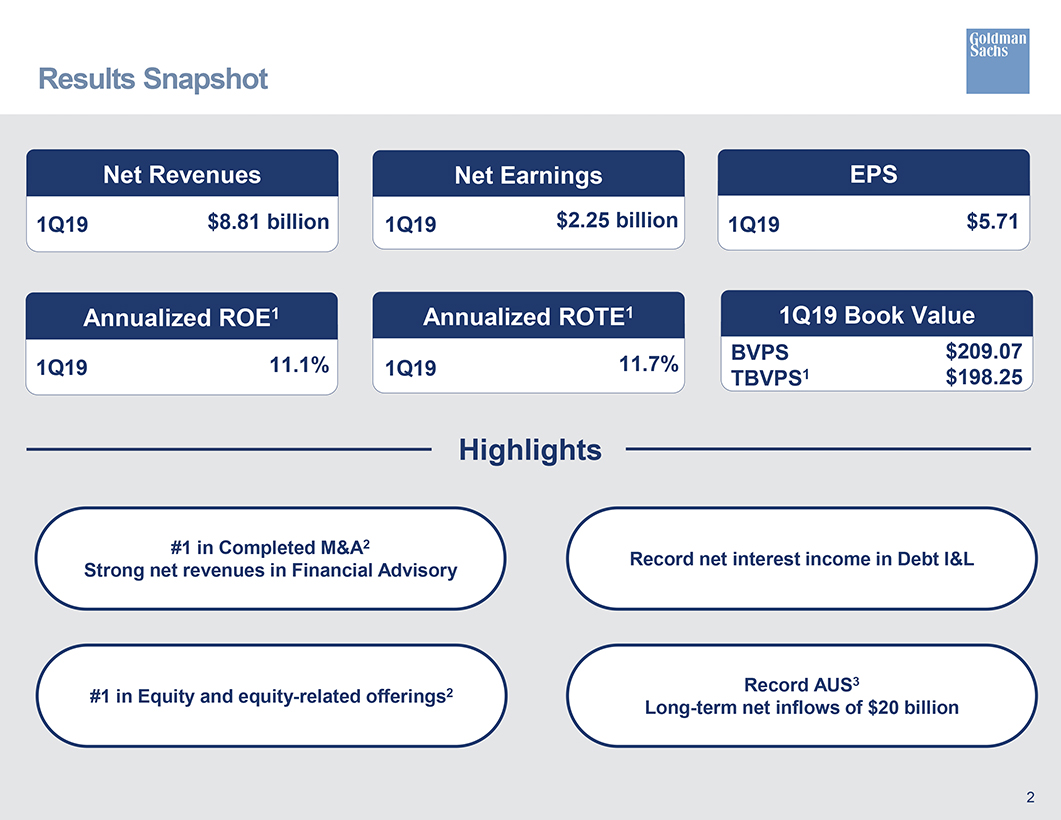
Results Snapshot Net Revenues Net Earnings EPS 1Q19 $8.81 billion 1Q19 $2.25 billion 1Q19 $5.71 Annualized OE1 Annualized ROTE1 1Q19 Book Value VPS $209.07 1Q19 11.1% 1Q19 11.7% 1 TBVPS $198.25 Highlights #1 in Completed M&A2 Record net interest income in Debt I&L Strong net revenues in Financial AdvisoryRecord AUS3 #1 in Equity and equity-related offerings2 Long-term net inflows of $20 billion
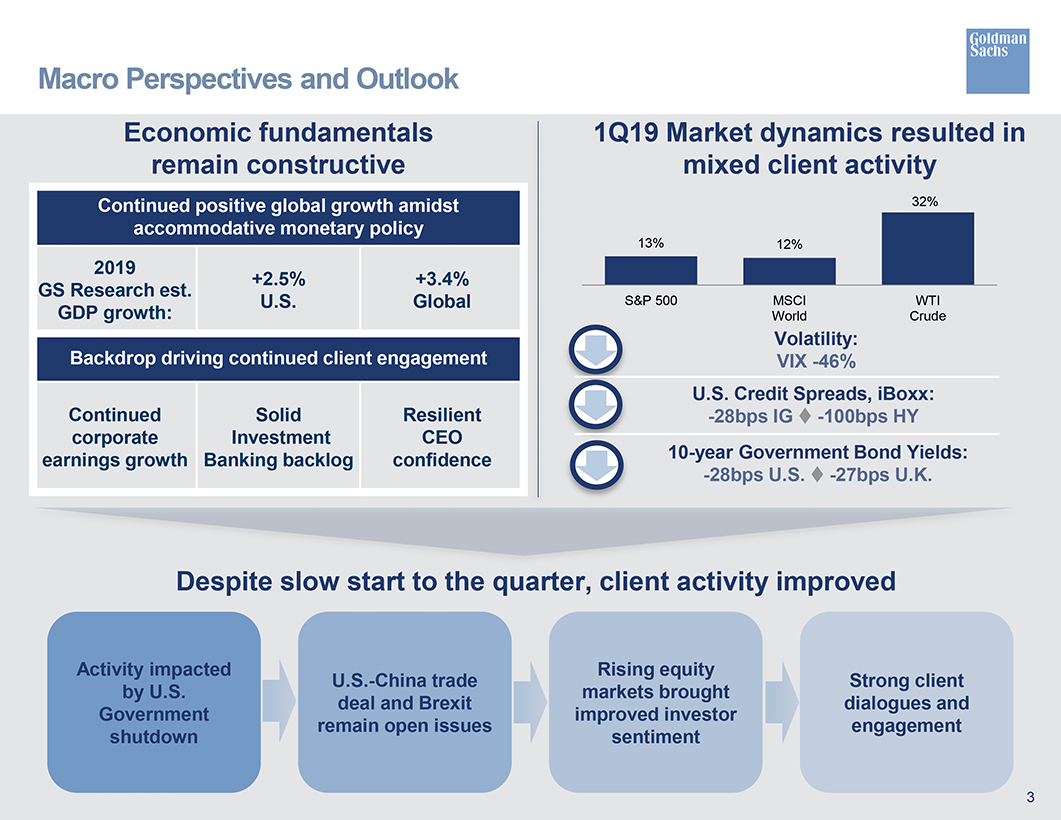
Macro Perspectives and Outlook Economic fundamentals 1Q19 Market dynamics resulted in remain constructive mixed client activity Continued positive global growth amidst 32% accommodative monetary policy 13% 12% 2019 +2.5% +3.4% GS Research est. U.S. Global S&P 500 MSCI WTIGDP growth: World Crude Backdrop driving continued client engagement Volatility: VIX-46% U.S. Credit Spreads, iBoxx: Continued Solid Resilient -28bps IG -100bps HY corporate Investment CEO earnings growth Banking backlog confidence10-year Government Bond Yields: -28bps U.S. -27bps U.K. Despite slow start to the quarter, client activity improved Activity impacted Rising equity U.S.-China trade Strong client by U.S. markets brought deal and Brexit dialogues and Government improved investor remain open issues engagement shutdown sentiment
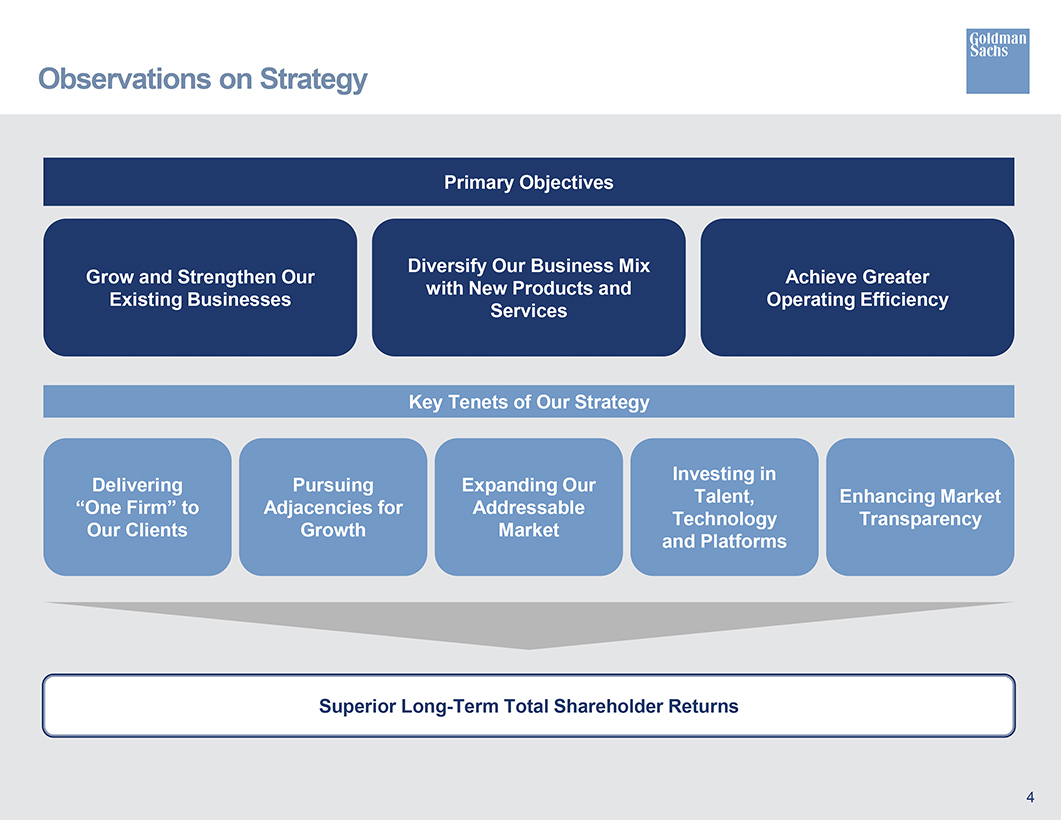
Observations on Strategy Primary Objectives Diversify Our Business Mix Grow and Strengthen Our Achieve Greater with New Products and Existing Businesses Operating Efficiency Services Key Tenets of Our Strategy Investing in Delivering Pursuing Expanding Our alent, Enhancing Market “One Firm” to Adjacencies for Addressable Technology Transparency Our Clients Growth Market and Platforms Superior Long-Term Total Shareholder Returns
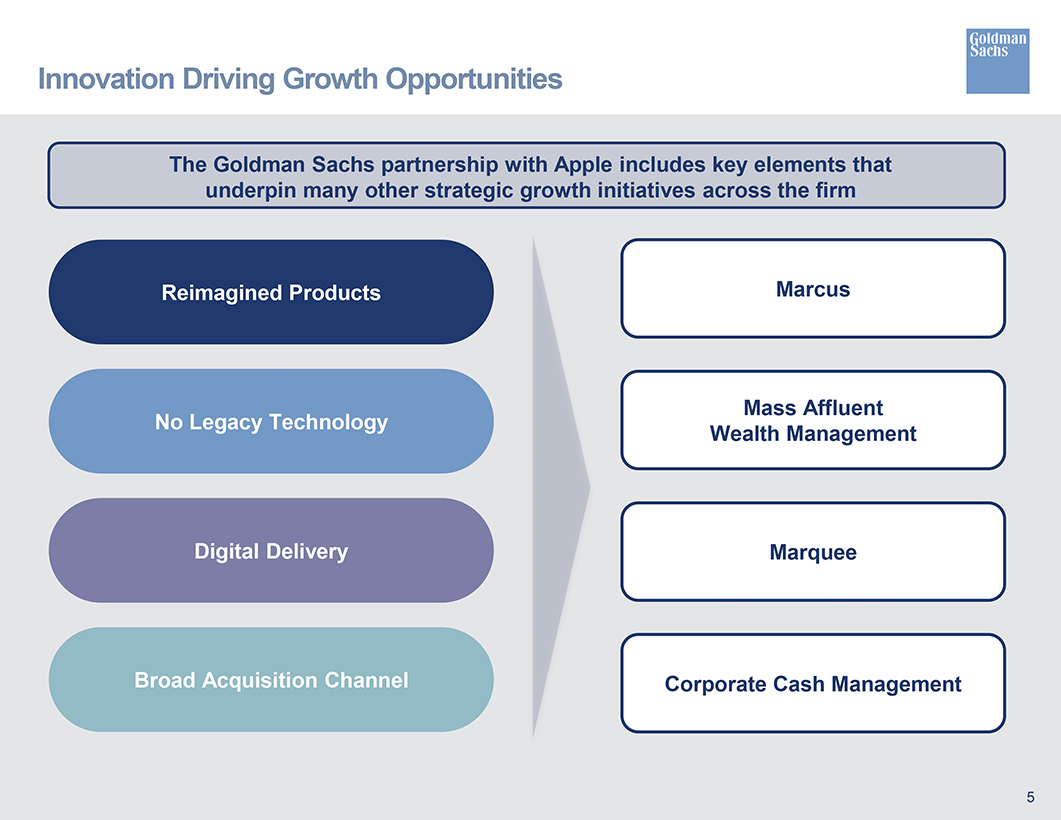
Innovation Driving Growth Opportunities The Goldman Sachs partnership with Apple includes key elements that underpin many other strategic growth initiatives across the firm Reimagined Products Marcus Mass Affluent No Legacy Technology Wealth Management Digital Delivery Marquee Broad Acquisition Channel Corporate Cash Management
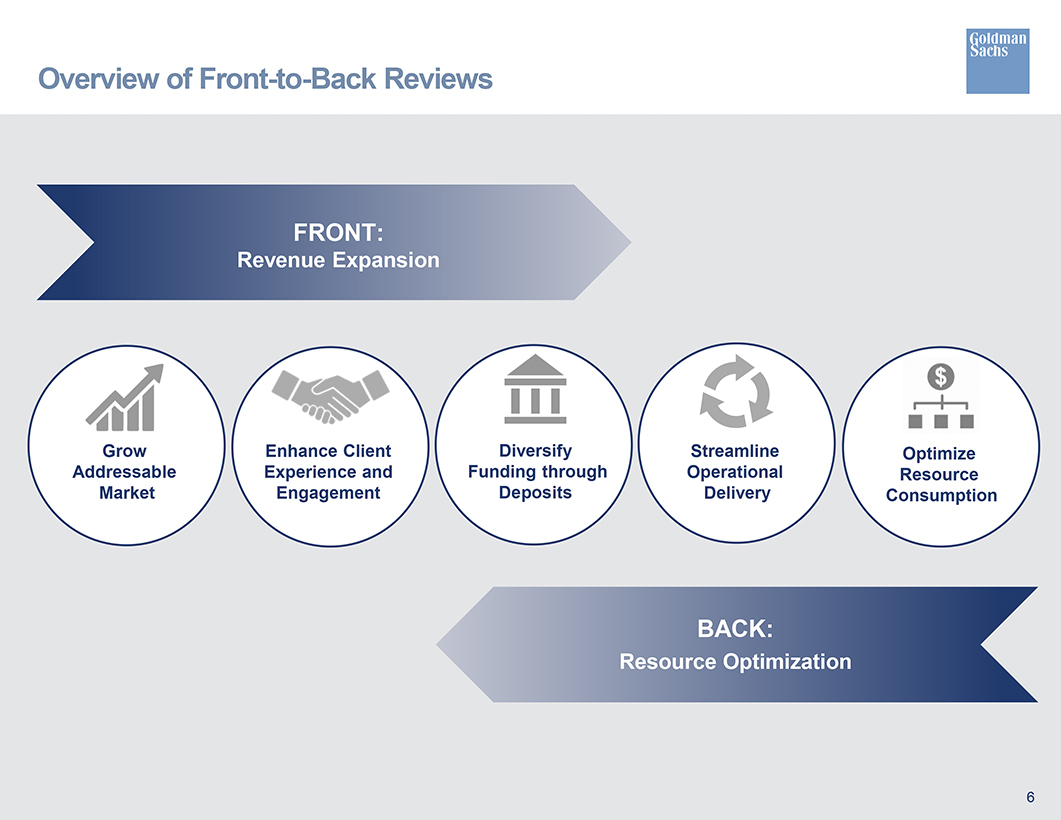
Overview ofFront-to-Back Reviews FRONT: Revenue Expansion Grow Diversify Streamline Optimize Addressable Experience and Funding through Operational Resource Market Engagement Deposits Delivery Consumption BACK: Resource Optimization
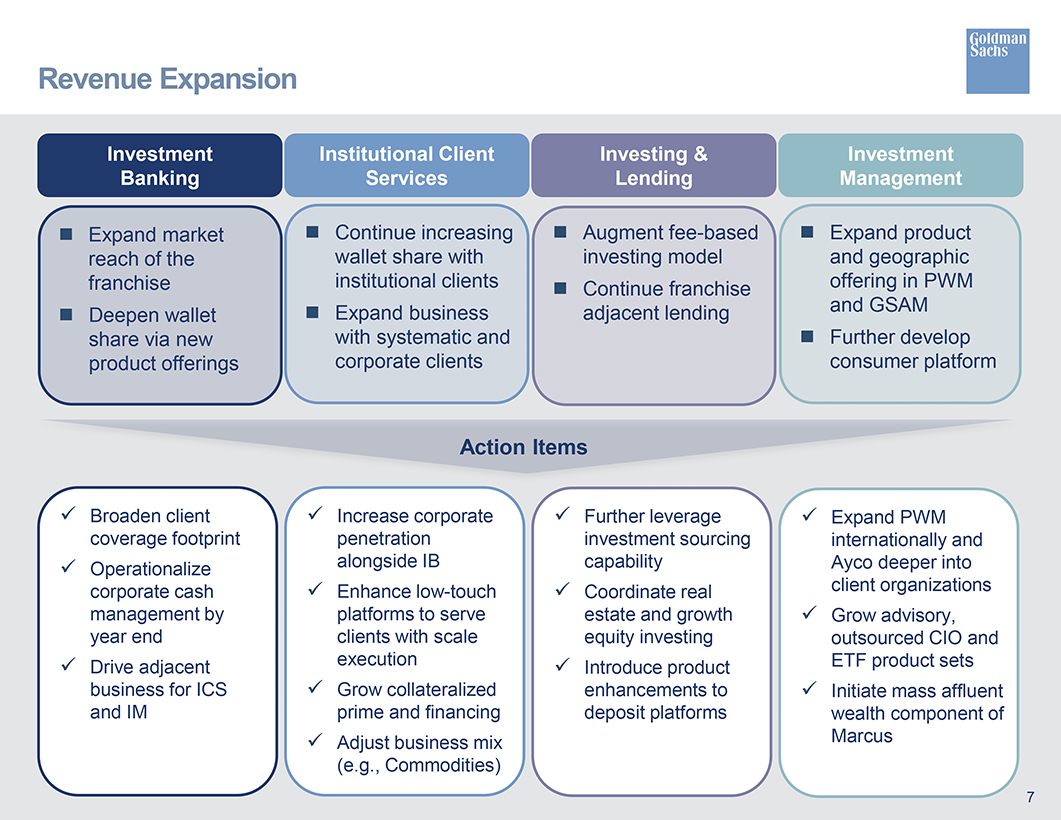
Revenue Expansion Investment Institutional Client Investing & Investment Banking Services Lending Management ï® Expand market ï® Continue increasing ï® Augmentfee-based ï® Expand product reach of the wallet share with investing model and geographic franchise institutional clients ï® Continue franchise offering in PWM ï® Expand business adjacent lending and GSAM ï® Deepen wallet share via new with systematic and ï® Further develop product offerings corporate clients consumer platform Action Items  Broaden client  Increase corporate  Further leverage  Expand PWM coverage footprint penetration investment sourcing internationally and  Operationalize alongside IB capability Ayco deeper into corporate cash  Enhancelow-touch  Coordinate real client organizations management by platforms to serve estate and growth  Grow advisory, year end clients with scale equity investing outsourced CIO and  Drive adjacent execution  Introduce product ETF product sets business for ICS  Grow collateralized enhancements to  Initiate mass affluent and IM prime and financing deposit platforms wealth component of  Adjust business mix Marcus (e.g., Commodities) 7
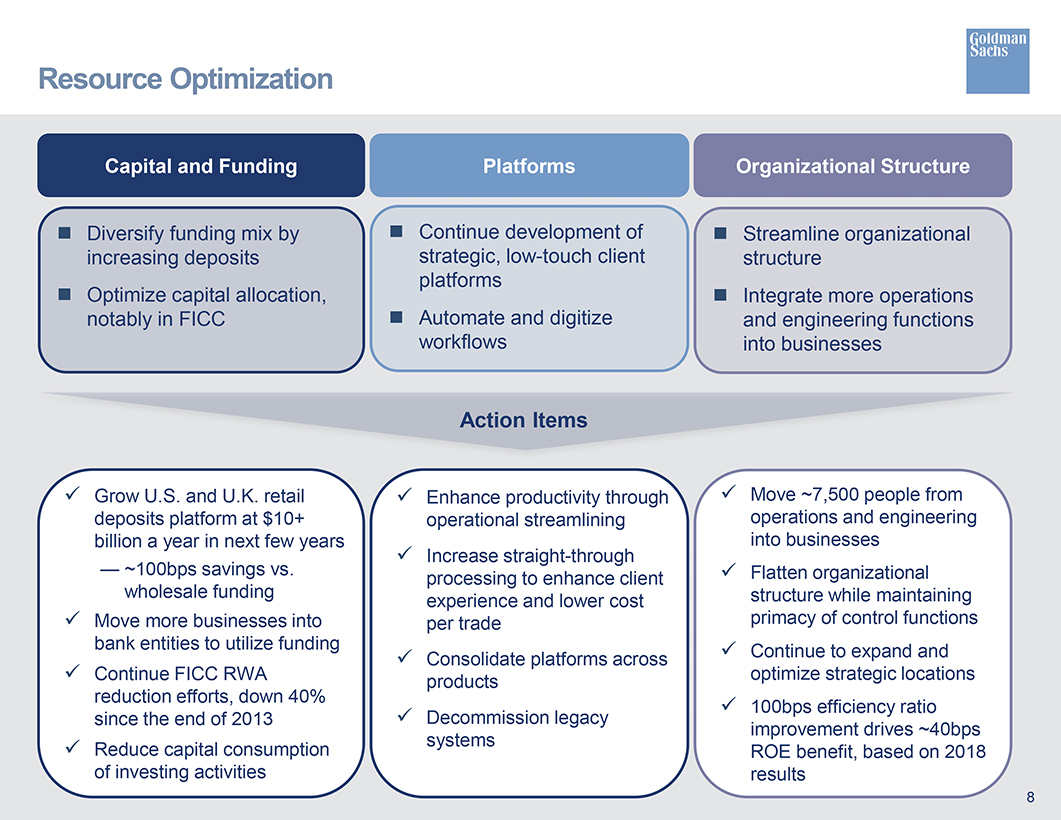
Resource Optimization Capital and Funding Platforms Organizational Structure ï® Diversify funding mix by ï® Continue development of ï® Streamline organizational increasing deposits strategic,low-touch client structure platforms ï® Optimize capital allocation, ï® Integrate more operations notably in FICC ï® Automate and digitize and engineering functions workflows into businesses Action Items  Grow U.S. and U.K. retail  Enhance productivity through  Move ~7,500 people from deposits platform at $10+ operational streamlining operations and engineering billion a year in next few years into businesses  Increase straight-through — ~100bps savings vs. processing to enhance client  Flatten organizational wholesale funding experience and lower cost structure while maintaining  Move more businesses into per trade primacy of control functions bank entities to utilize funding  Continue to expand and  Consolidate platforms across  Continue FICC RWA products optimize strategic locations reduction efforts, down 40%  100bps efficiency ratio since the end of 2013  Decommission legacy improvement drives ~40bps  Reduce capital consumption systems ROE benefit, based on 2018 of investing activities results 8
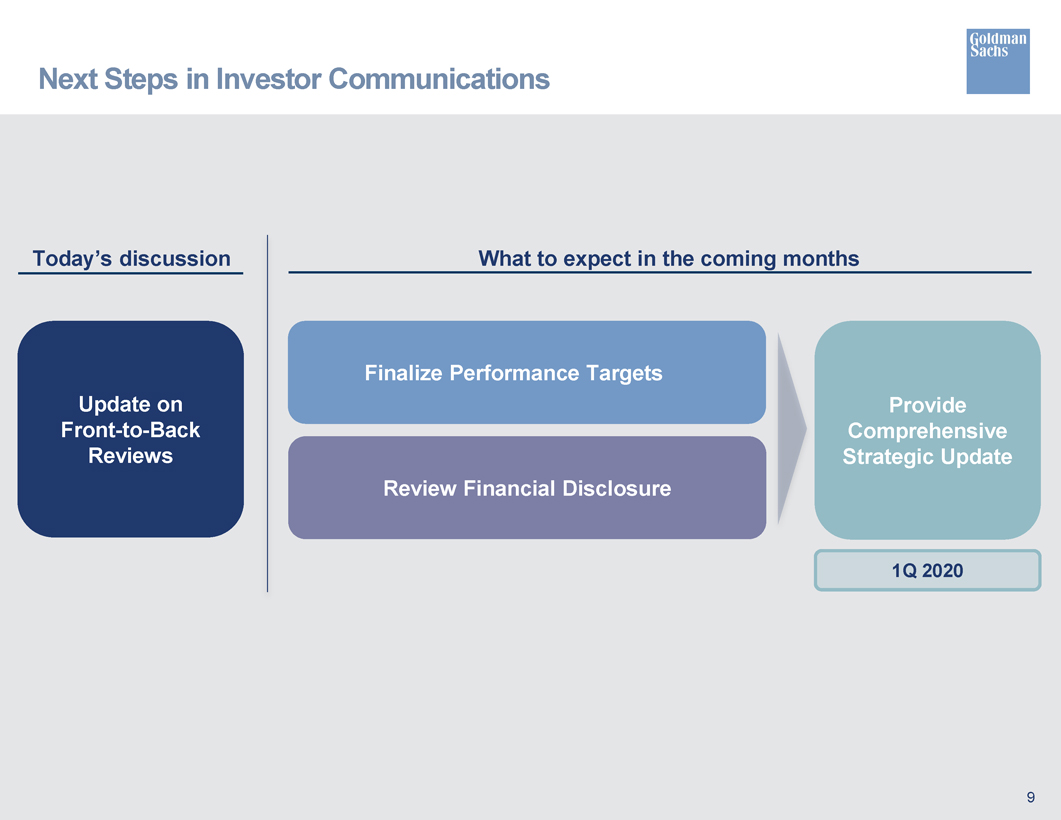
Next Steps in Investor Communications Today’s discussion What to expect in the coming months Finalize Performance Targets Update on Provide Front-to-Back Comprehensive Reviews Strategic Update Review Financial Disclosure
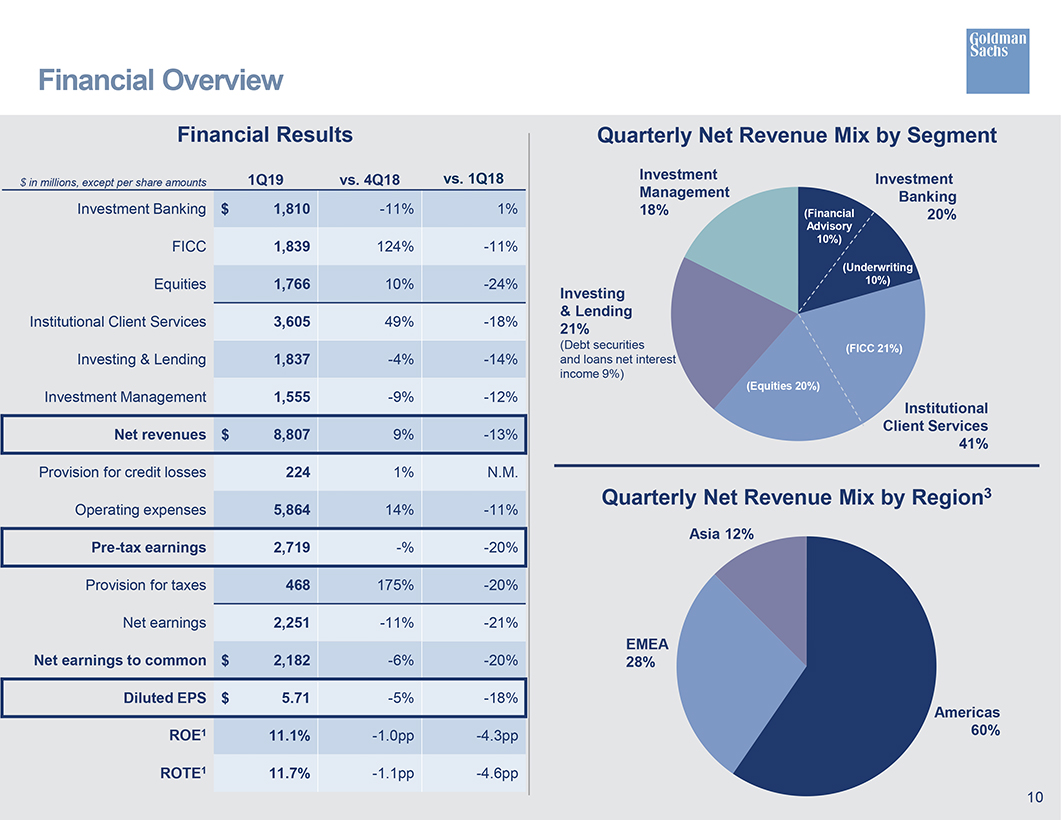
Financial Overview Financial Results Quarterly Net Revenue Mix by Segment 1Q19 vs. 4Q18 vs. 1Q18 Investment Investment $ in millions, except per share amounts Management Banking Investment Banking $1,810-11% 1% 18% (Financial 20% Advisory FICC 1,839 124%-11% 10%) (Underwriting Equities 1,766 10%-24% 10%) Investing & Lending Institutional Client Services 3,605 49%-18% 21% (Debt securities (FICC 21%) Investing & Lending 1,837-4%-14% and loans net interest income 9%) (Equities 20%) Investment Management 1,555-9%-12% Institutional Cl client Services Net revenues $8,807 9%-13% 41% Provision for credit losses 224 1% N.M. Quarterly Net Revenue Mix by Region3 Operating expenses 5,864 14%-11% sia 12%Pre-tax earnings 2,719 -%-20% Provision for taxes 68 175%-20% Net earnings 2,251-11%-21% MEA Net earnings to common $2,182-6%-20% 28% Diluted EPS $5.71-5%-18% Americas ROE1 11.1%-1.0pp-4.3pp 60% ROTE1 11.7%-1.1pp-4.6pp 10
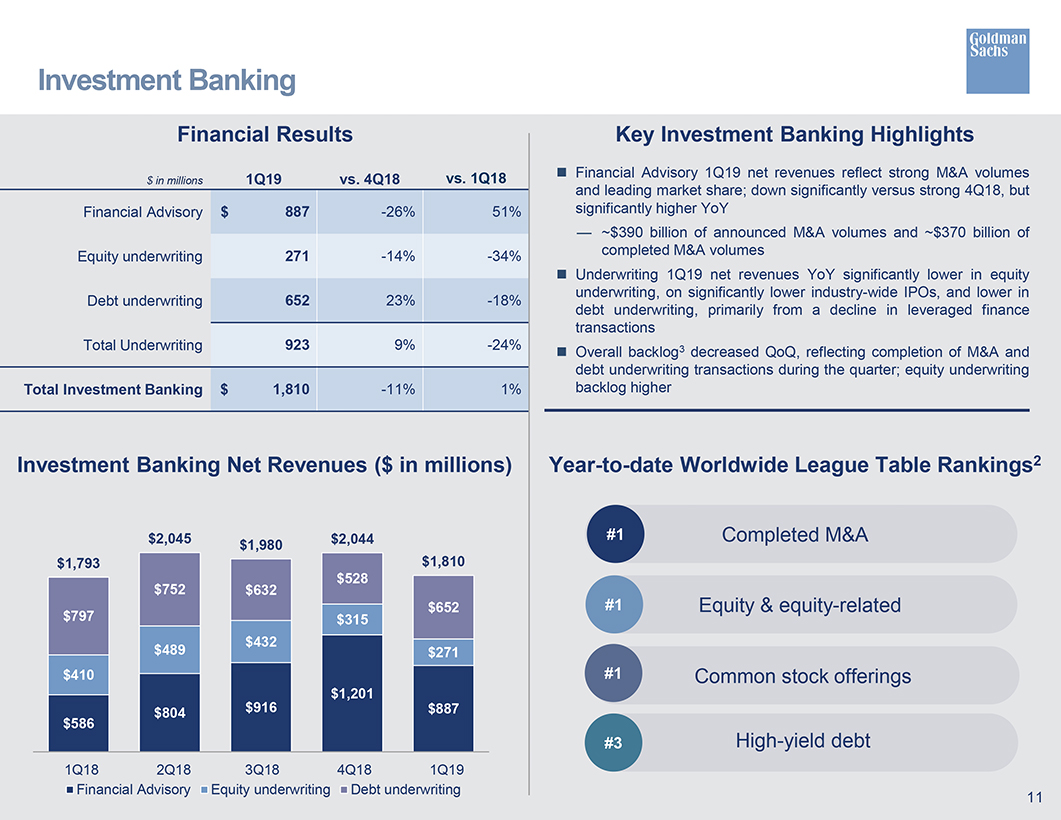
Investment Banking Financial Results Key Investment Banking Highlights vs. 1Q18 ï® Financial Advisory 1Q19 net revenues reflect strong M&A volumes $ in millions 1Q19 vs. 4Q18 and leading market share; down significantly versus strong 4Q18, but Financial Advisory $ 887-26% 51% significantly higher YoY ~$390 billion of announced M&A volumes and ~$370 billion of Equity underwriting 271-14%-34% completed M&A volumes ï® Underwriting 1Q19 net revenues YoY significantly lower in equity underwriting, on significantly lower industry-wide IPOs, and lower in Debt underwriting 652 23%-18% debt underwriting, primarily from a decline in leveraged finance transactions Total Underwriting 923 9%-24% Overall backlog3ï® decreased QoQ, reflecting completion of M&A and debt underwriting transactions during the quarter; equity underwriting Total Investment Banking $ 1,810-11% 1% backlog higher Investment Banking Net Revenues ($ in millions)Year-to-date Worldwide League Table Rankings2 $2,045 $2,044 #1 Completed M&A $1,980 $1,793 $1,810 $528 $752 $632 #1 $652 Equity & equity-related $797 $315 $432 $489 $271 $410 #1 Common stock offerings $916 $1,201 $586 $804 $887 #3 High-yield debt 1Q18 2Q18 3Q18 4Q18 1Q19 Financial Advisory Equity underwriting Debt underwriting 11
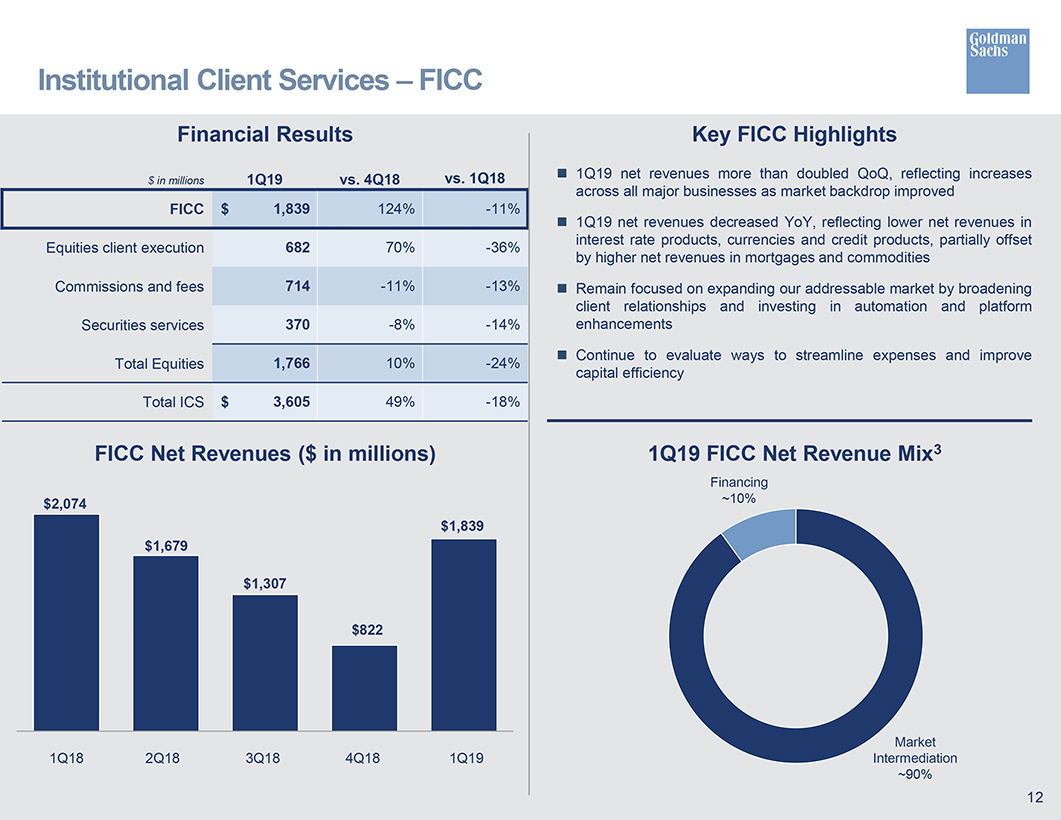
Institutional Client Services – FICC Financial Results Key FICC Highlights vs. 1Q18 1Q19 net revenues more than doubled QoQ, reflecting increases $ in millions 1Q19 vs. 4Q18 across all major businesses as market backdrop improved FICC $ 1,839 124% -11% 1Q19 net revenues decreased YoY, reflecting lower net revenues in interest rate products, currencies and credit products, partially offset Equities client execution 682 70% -36% by higher net revenues in mortgages and commodities Commissions and fees 714 -11% -13% Remain focused on expanding our addressable market by broadening client relationships and investing in automation and platform Securities services 370 -8% -14% enhancements Continue to evaluate ways to streamline expenses and improve Total Equities 1,766 10% -24% capital efficiency Total ICS $ 3,605 49% -18% FICC Net Revenues ($ in millions) 1Q19 FICC Net Revenue Mix3 Financing $2,074 ~10% $1,839 $1,679 $1,307 $822 Market 1Q18 2Q18 3Q18 4Q18 1Q19 Intermediation ~90% 12
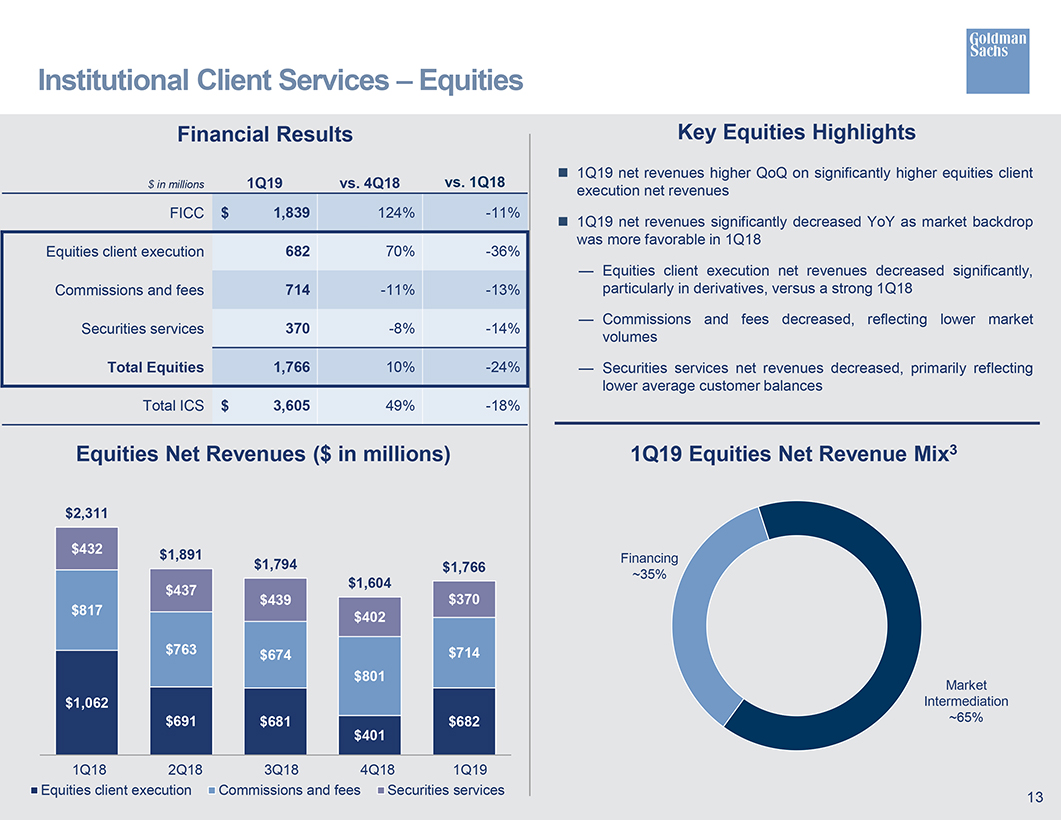
Institutional Client Services – Equities Financial Results Key Equities Highlights 1Q19 net revenues higher QoQ on significantly higher equities client $ in millions 1Q19 vs. 4Q18 vs. 1Q18 execution net revenues FICC $ 1,839 124%-11% ï® 1Q19 net revenues significantly decreased YoY as market backdrop was more favorable in 1Q18 Equities client execution 682 70%-36% Equities client execution net revenues decreased significantly, Commissions and fees 714-11%-13% particularly in derivatives, versus a strong 1Q18 Commissions and fees decreased, reflecting lower market Securities services 370-8%-14% volumes Total Equities 1,766 10%-24% — Securities services net revenues decreased, primarily reflecting lower average customer balances Total ICS $ 3,605 49%-18% Equities Net Revenues ($ in millions) 1Q19 Equities Net Revenue Mix3 $2,311 $432 $1,891 $1,794 Financing $1,766 35% $1,604 $437 $439 $370 $817 $402 $763 $674 $714 $801 Market $1,062 Intermediation $691 $681 $682 ~65% $401 1Q18 2Q18 3Q18 4Q18 1Q19 Equities client execution Commissions and fees Securities services
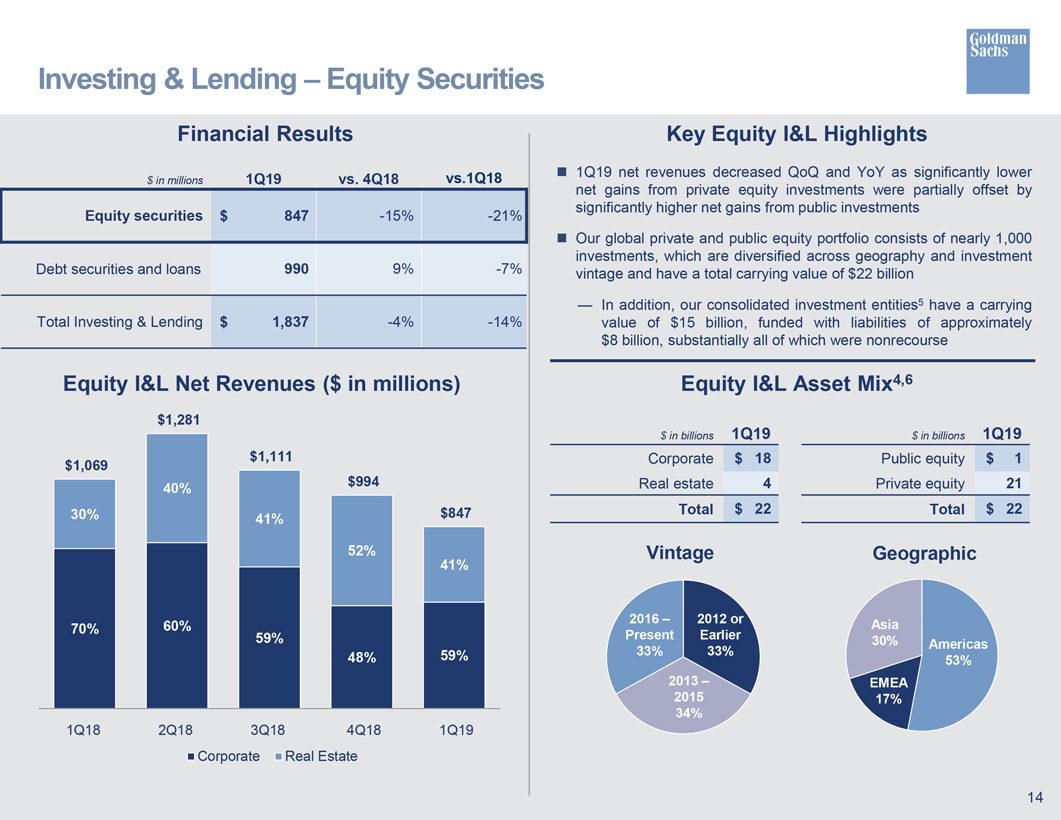
Investing & Lending Equity Securities Financial Results $ in millions 1Q19 vs. 4Q18 vs.1Q18 Equity securities $ 847 -15% -21% Debt securities and loans 990 9% -7% Total Investing & Lending $ 1,837 -4% -14% Equity I&L Net Revenues ($ in millions) $1,281 $1,111 $1,069 40% $994 30% 41% $847 52% 41% 70% 60% 59% 48% 59% 1Q18 2Q18 3Q18 4Q18 1Q19 Corporate Real Estate Key Equity I&L Highlights 1Q19 net revenues decreased QoQ and YoY as significantly lower net gains from private equity investments were partially offset by significantly higher net gains from public investments Our global private and public equity portfolio consists of nearly 1,000 investments, which are diversified across geography and investment vintage and have a total carrying value of $22 billion In addition, our consolidated investment entities5 have a carrying value of $15 billion, funded with liabilities of approximately $8 billion, substantially all of which were nonrecourse Equity I&L Asset Mix4,6 $ in billions 1Q19 Corporate $ 18 Real estate 4 Total $ 22 $ in billions 1Q19 Public equity $ 1 Private equity 21 Total $ 22 Vintage 2016 2012 or Present Earlier 33% 33% 2013 2015 34% Geographic Asia 30% Americas 53% EMEA 17%
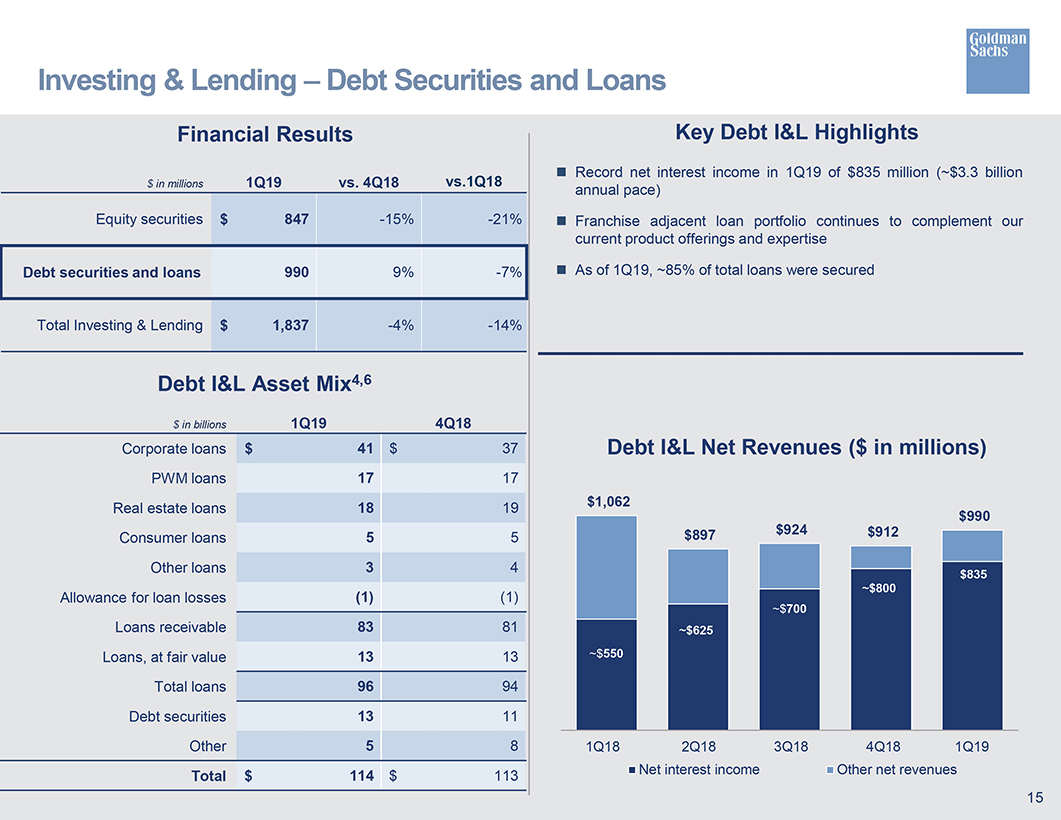
Investing & Lending – Debt Securities and Loans Financial Results Key Debt I&L Highlights Record net interest income in 1Q19 of $835 million (~$3.3 billion $ in millions 1Q19 vs. 4Q18 vs.1Q18 annual pace) Equitysecurities $ 847 -15%-21% ï® Franchise adjacent loan portfolio continues to complement our current productofferings and expertise Debt securities and loans 990 9%-7% ï® As of 1Q19, ~85% of total loans were secured Total Investing & Lending $ 1,837-4%-14% Debt I&L Asset Mix4,6 $ in billions 1Q19 4Q18 Corporate loans $ 41 $ 37 Debt I&L Net Revenues ($ in millions) PWM loans 17 17 Real estate loans 18 19 $1,062 $990 $897 $924 $912 Consumer loans 5 5 Other loans 3 4 $835 ~$800 Allowance for loan losses (1) (1) ~$700 Loans receivable 83 81 ~$625 Loans, at fair value 13 13 ~$550 Total loans 96 94 Debt securities 13 11 Other 5 8 1Q18 2Q18 3Q18 4Q18 1Q19 Net interest income Other net revenuesTotal $ 114 $ 113 15
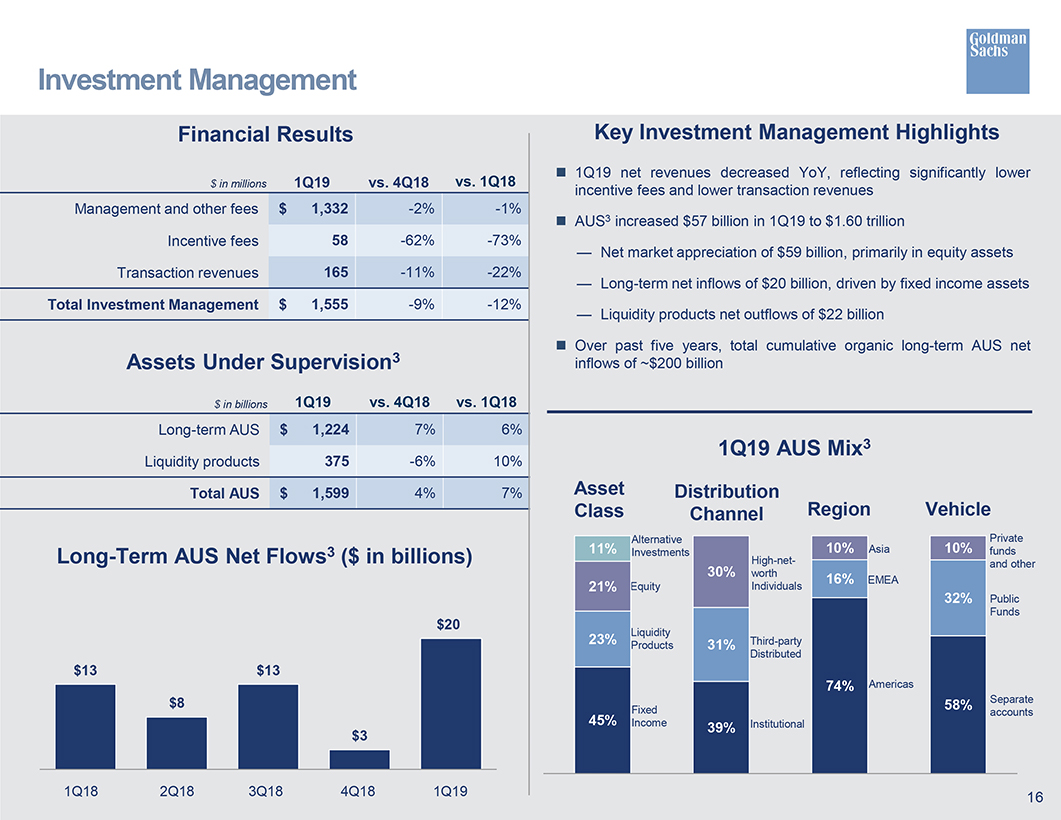
Investment Management Financial Results Key Investment Management Highlights 1Q19 net revenues decreased YoY, reflecting significantly lower $ in millions 1Q19 vs. 4Q18 vs. 1Q18 incentive fees and lower transaction revenues Management and other fees $ 1,332-2%-1% ï® AUS3 increased $57 billion in 1Q19 to $1.60 trillion Incentive fees 58-62%-73% Net market appreciation of $59 billion, primarily in equity assets Transaction revenues 165-11%-22% — Long-term net inflows of $20 billion, driven by fixed income assets Total Investment Management $ 1,555-9%-12% — Liquidity products net outflows of $22 billion ï® Over past five years, total cumulative organic long-term AUS net Assets Under Supervision3 inflows of ~$200 billion $ in billions 1Q19 vs. 4Q18 vs. 1Q18 Long-term AUS $ 1,224 7% 6% 3 1Q19 AUS MixLiquidity products 375-6% 10% Total AUS $ 1,599 4% 7% Asset Distribution Class Channel Region Vehicle Alternative Private Long-Term AUS Net Flows3 ($ in billions) 11% InvestmentsHigh-net- 10% Asia 10% funds and other 30% worth 16% EMEA 21% Equity Individuals 32% Public $20 Funds 23% Liquidity Products 31% Third-party Distributed $13 $13 74% Americas $8 Fixed 58% Separate accounts 45% Income Institutional 9% $3 1Q18 2Q18 3Q18 4Q18 1Q19 16
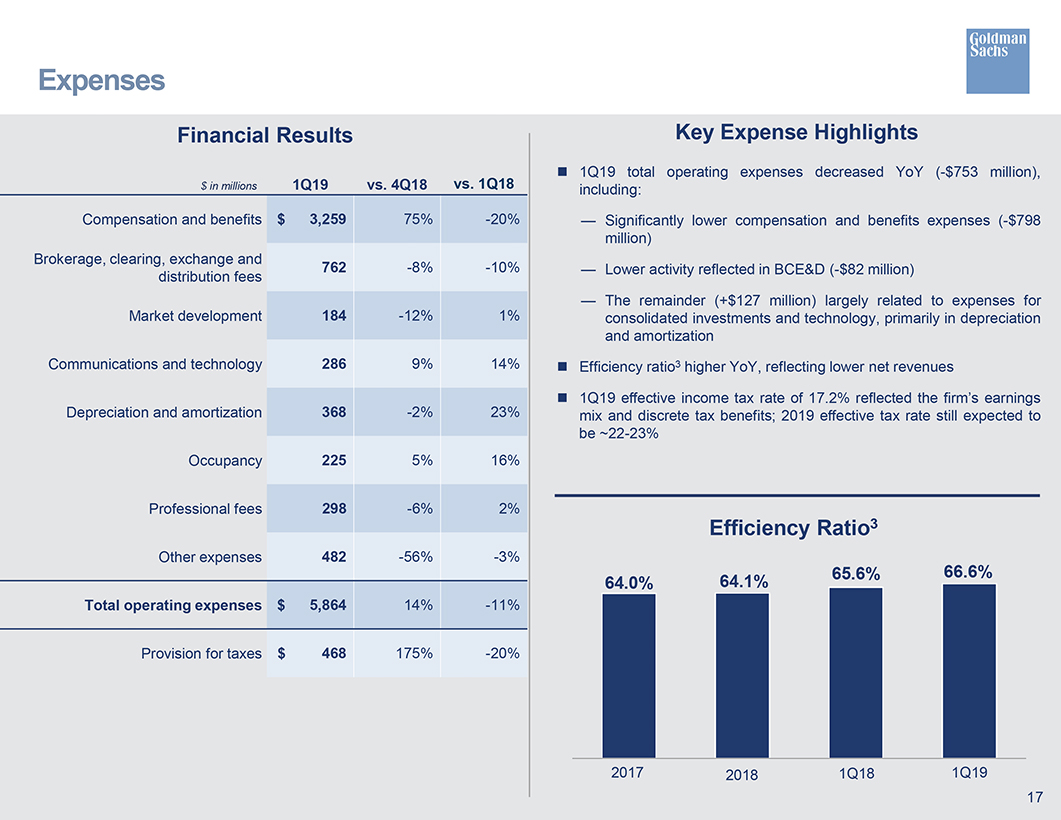
Expenses Financial Results Key Expense Highlights 1Q19 total operating expenses decreased YoY (-$753 million), $ in millions 1Q19 vs. 4Q18 vs. 1Q18 including: Compensation and benefits $ 3,259 75%-20% — Significantly lower compensation and benefits expenses (-$798 million) Brokerage, clearing, exchange and 762-8%-10% — Lower activity reflected in BCE&D (-$82 million) distribution fees The remainder (+$127 million) largely related to expenses for Market development 184-12% 1% consolidated investments and technology, primarily in depreciation and amortization Communications and technology 286 9% 14% ï® Efficiency ratio3 higher YoY, reflecting lower net revenues ï® 1Q19 effective income tax rate of 17.2% reflected the firm’s earnings Depreciation and amortization 368-2% 23% mix and discrete tax benefits; 2019 effective tax rate still expected to be~22-23% Occupancy 225 5% 16% Professional fees 298-6% 2% Efficiency Ratio3 Other expenses 482-56%-3% 65.6% 66.6% 64.0% 64.1% Total operating expenses $ 5,864 14%-11% Provision for taxes $ 468 175%-20% 2017 2018 1Q18 1Q19 17
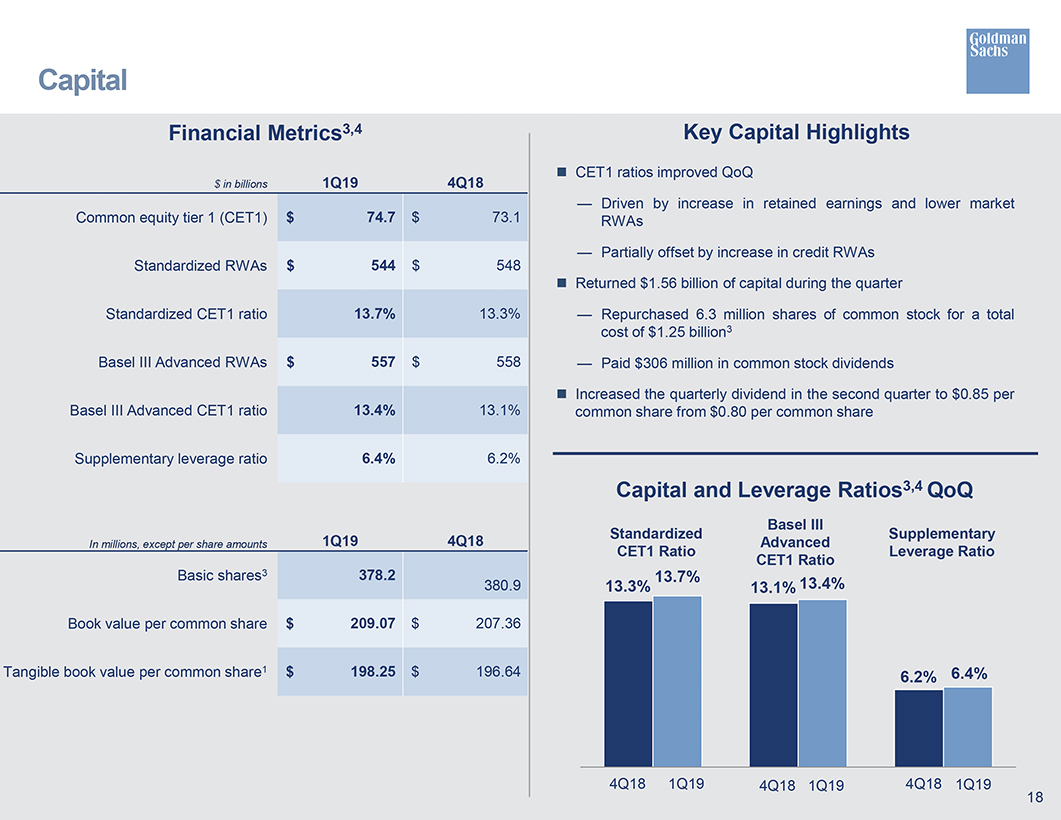
Capital Financial Metrics3,4 Key Capital Highlights $ in billions ï® CET1 ratios improved QoQ 1Q19 4Q18 — Driven by increase in retained earnings and lower market Common equity tier 1 (CET1) $ 74.7 $ 73.1 RWAs Partially offset by increase in credit RWAs Standardized RWAs $ 544 $ 548 ï® Returned $1.56 billion of capital during the quarter Standardized CET1 ratio 13.7% 13.3% — Repurchased 6.3 million shares of common stock for a total cost of $1.25 billion3 Basel III Advanced RWAs $ 557 $ 558 — Paid $306 million in common stock dividends ï® Increased the quarterly dividend in the second quarter to $0.85 per Basel III Advanced CET1 ratio 13.4% 13.1% common share from $0.80 per common share Supplementary leverage ratio 6.4% 6.2% Capital and Leverage Ratios3,4 QoQ Basel III 1Q19 4Q18 Standardized Supplementary In millions, except per share amounts Advanced CET1 Ratio Leverage Ratio CET1 Ratio Basic shares3 378.2 13.7% 380.9 13.3% 13.1% 13.4% Book value per common share $ 209.07 $ 207.36 Tangible book value per common share1 $ 198.25 $ 196.64 6.2% 6.4% 4Q18 1Q19 4Q18 1Q19 4Q18 1Q19 18
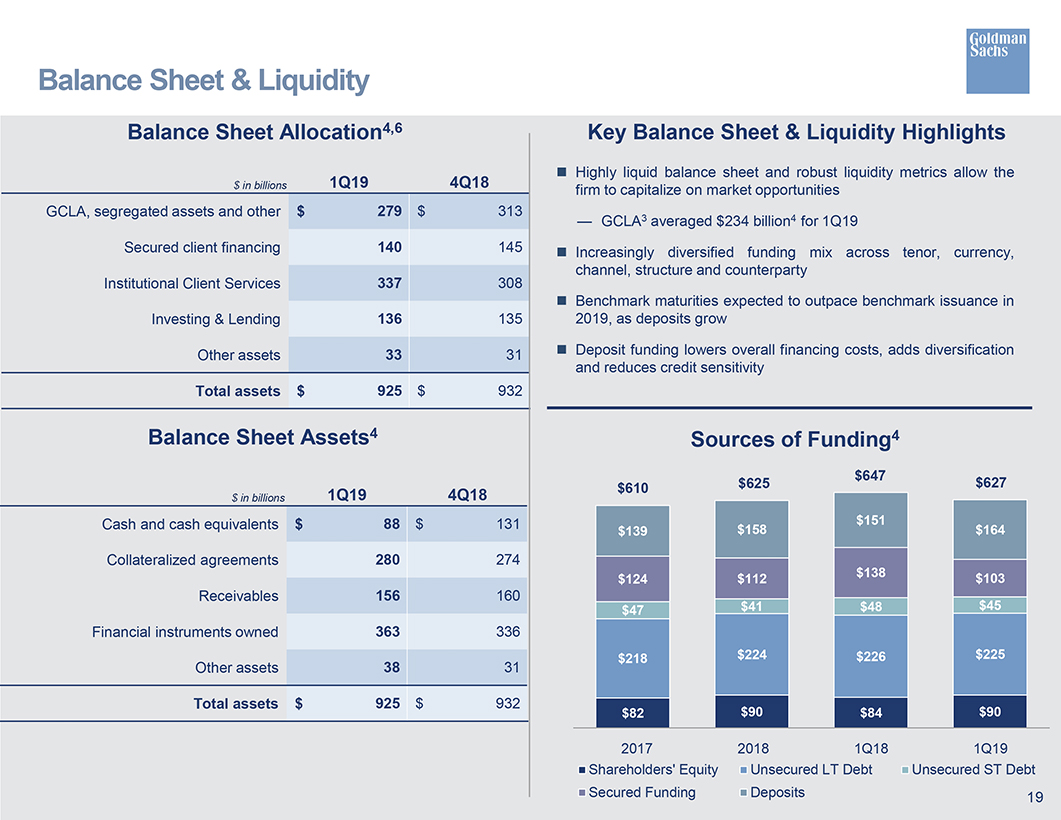
Balance Sheet & Liquidity Balance Sheet Allocation4,6 Key Balance Sheet & Liquidity Highlights Highly liquid balance sheet and robust liquidity metrics allow the $ in billions 1Q19 4Q18 firm to capitalize on market opportunities GCLA, segregated assets and other $ 279 $ 313 — GCLA3 averaged $234 billion4 for 1Q19 Secured client financing 140 145 ï® Increasingly diversified funding mix across tenor, currency, channel, structure and counterparty Institutional Client Services 337 308 ï® Benchmark maturities expected to outpace benchmark issuance in Investing & Lending 136 135 2019, as deposits grow Other assets 33 31 ï® Deposit funding lowers overall financing costs, adds diversification and reduces credit sensitivity Total assets $ 925 $ 932 Balance Sheet Assets4 Sources of Funding4 $647 $627 $610 $625 $ in billions 1Q19 4Q18 Cash and cash equivalents $ 88 $ 131 $151 $139 $158 $164 Collateralized agreements 280 274 $124 $112 $138 $103 Receivables 156 160 $47 $41 $48 $45 Financial instruments owned 363 336 $218 $224 $226 $225 Other assets 38 31 Total assets $ 925 $ 932 $82 $90 $84 $90 2017 2018 1Q18 1Q19 Shareholders’ Equity Unsecured LT Debt Unsecured ST Debt Secured Funding Deposits 19
Cautionary Note on Forward-Looking Statements This presentation contains “forward-looking statements” within the meaning of the safe harbor provisions of the U.S. Private Securities Litigation Reform Act of 1995. Forward-looking statements are not historical facts, but instead represent only the firm’s beliefs regarding future events, many of which, by their nature, are inherently uncertain and outside of the firm’s control. It is possible that the firm’s actual results and financial condition may differ, possibly materially, from the anticipated results and financial condition indicated in these forward-looking statements. For information about some of the risks and important factors that could affect the firm’s future results and financial condition, see “Risk Factors” in Part I, Item 1A of the firm’s Annual Report on Form10-K for the year ended December 31, 2018. Information regarding the firm’s capital ratios, risk-weighted assets, supplementary leverage ratio, total assets and balance sheet data and global core liquid assets consists of preliminary estimates. These estimates are forward-looking statements and are subject to change, possibly materially, as the firm completes its financial statements. Statements regarding the projected growth of the firm’s U.S. and U.K. retail deposit platforms and associated interest expense savings are forward-looking statements and are subject to the risk that actual growth and savings may differ, possibly materially due to, among other things, market conditions and competition from other similar products. Statements about the firm engaging in corporate cash management are forward-looking statements based on the firm’s current expectations regarding its ability to implement and conduct corporate cash management. The timing of the firm’s ability to engage in, and the benefits to be received from, corporate cash management may change, possibly materially, from what is currently expected, and the firm may be unable to engage in corporate cash management along the timeline, or generate the revenues or achieve the anticipated expense savings (and operational risk exposure reductions), reflected in those statements. Statements regarding planned 2019 benchmark issuances are forward-looking statements and are subject to the risk that actual issuances may differ, possibly materially, due to changes in market conditions or the firm’s funding. Statements about the firm’s expected 2019 effective income tax rate constitute forward-looking statements. These statements are subject to the risk that the firm’s 2019 effective income tax rate may differ from the anticipated rate indicated in these forward-looking statements, possibly materially, due to, among other things, changes in the firm’s earnings mix, the firm’s profitability and the entities in which the firm generates profits, the assumptions the firm has made in forecasting its expected tax rate, as well as guidance that may be issued by the U.S. Internal Revenue Service. Statements about the firm’s investment banking transaction backlog also may constitute forward-looking statements. Such statements are subject to the risk that the terms of these transactions may be modified or that they may not be completed at all; therefore, the net revenues, if any, that the firm actually earns from these transactions may differ, possibly materially, from those currently expected. Important factors that could result in a modification of the terms of a transaction or a transaction not being completed include, in the case of underwriting transactions, a decline or continued weakness in general economic conditions, outbreak of hostilities, volatility in the securities markets generally or an adverse development with respect to the issuer of the securities and, in the case of financial advisory transactions, a decline in the securities markets, an inability to obtain adequate financing, an adverse development with respect to a party to the transaction or a failure to obtain a required regulatory approval. For information about other important factors that could adversely affect the firm’s investment banking transactions, see “Risk Factors” in Part I, Item 1A of the firm’s Annual Report on Form10-K for the year ended December 31, 2018. 20
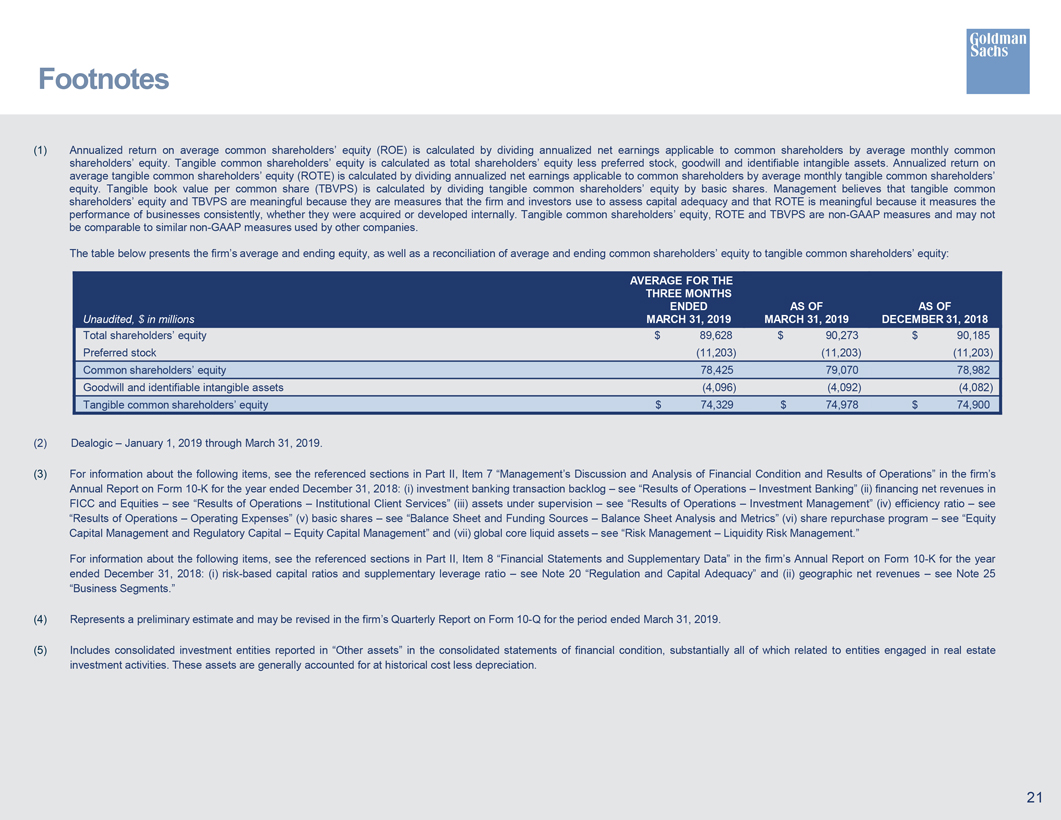
Footnotes (1) Annualized return on average common shareholders’ equity (ROE) is calculated by dividing annualized net earnings applicable to common shareholders by average monthly common shareholders’ equity. Tangible common shareholders’ equity is calculated as total shareholders’ equity less preferred stock, goodwill and identifiable intangible assets. Annualized return on average tangible common shareholders’ equity (ROTE) is calculated by dividing annualized net earnings applicable to common shareholders by average monthly tangible common shareholders’ equity. Tangible book value per common share (TBVPS) is calculated by dividing tangible common shareholders’ equity by basic shares. Management believes that tangible common shareholders’ equity and TBVPS are meaningful because they are measures that the firm and investors use to assess capital adequacy and that ROTE is meaningful because it measures the performance of businesses consistently, whether they were acquired or developed internally. Tangible common shareholders’ equity, ROTE and TBVPS are non-GAAP measures and may not be comparable to similar non-GAAP measures used by other companies. The table below presents the firm’s average and ending equity, as well as a reconciliation of average and ending common shareholders’ equity to tangible common shareholders’ equity: AVERAGE FOR THE THREE MONTHS ENDED AS OF AS OF Unaudited, $ in millions MARCH 31, 2019 MARCH 31, 2019 DECEMBER 31, 2018 Total shareholders’ equity $ 89,628 $ 90,273 $ 90,185 Preferred stock (11,203) (11,203) (11,203) Common shareholders’ equity 78,425 79,070 78,982 Goodwill and identifiable intangible assets (4,096) (4,092) (4,082) Tangible common shareholders’ equity $ 74,329 $ 74,978 $ 74,900 (2) Dealogic January 1, 2019 through March 31, 2019. (3) For information about the following items, see the referenced sections in Part II, Item 7 “Management’s Discussion and Analysis of Financial Condition and Results of Operations” in the firm’s Annual Report on Form 10-K for the year ended December 31, 2018: (i) investment banking transaction backlog see “Results of Operations Investment Banking” (ii) financing net revenues in FICC and Equities see “Results of Operations Institutional Client Services” (iii) assets under supervision see “Results of Operations Investment Management” (iv) efficiency ratio see “Results of Operations Operating Expenses” (v) basic shares see “Balance Sheet and Funding Sources Balance Sheet Analysis and Metrics” (vi) share repurchase program see “Equity Capital Management and Regulatory Capital Equity Capital Management” and (vii) global core liquid assets see “Risk Management Liquidity Risk Management.” For information about the following items, see the referenced sections in Part II, Item 8 “Financial Statements and Supplementary Data” in the firm’s Annual Report on Form 10-K for the year ended December 31, 2018: (i) risk-based capital ratios and supplementary leverage ratio see Note 20 “Regulation and Capital Adequacy” and (ii) geographic net revenues see Note 25 “Business Segments.” (4) Represents a preliminary estimate and may be revised in the firm’s Quarterly Report on Form 10-Q for the period ended March 31, 2019. (5) Includes consolidated investment entities reported in “Other assets” in the consolidated statements of financial condition, substantially all of which related to entities engaged in real estate investment activities. These assets are generally accounted for at historical cost less depreciation.
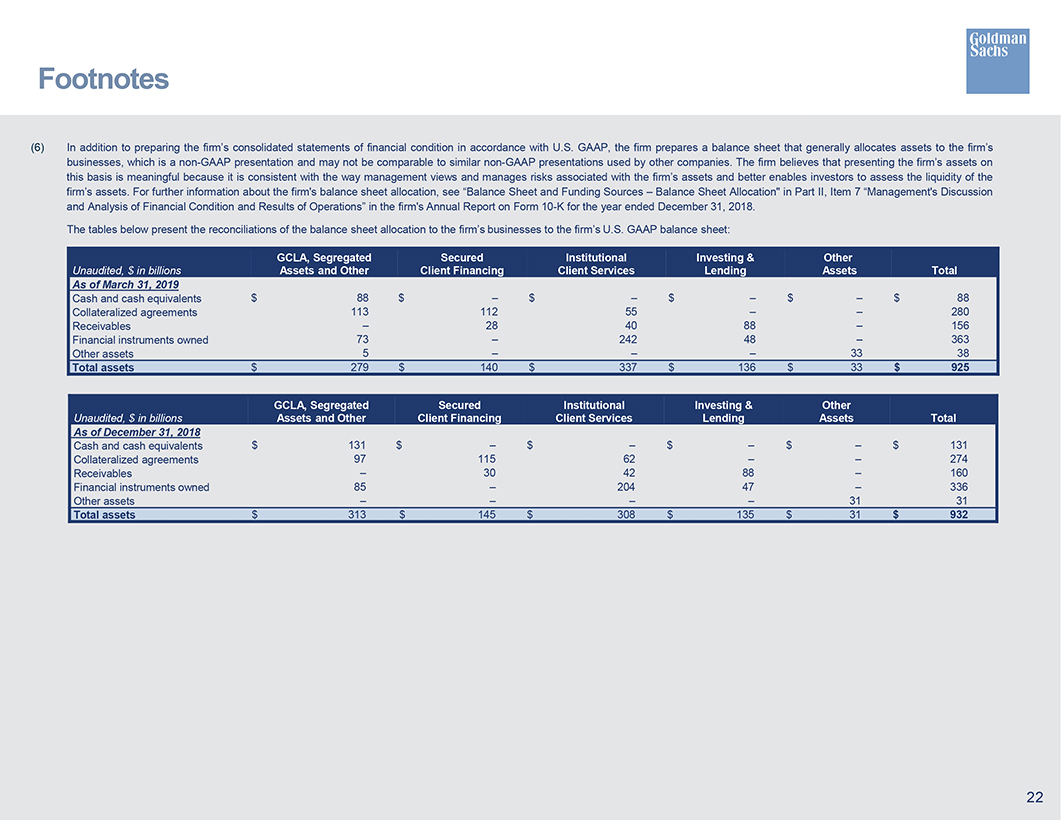
Footnotes(6) In addition to preparing the firm’s consolidated statements of financial condition in accordance with U.S. GAAP, the firm prepares a balance sheet that generally allocates assets to the firm’s businesses, which is anon-GAAP presentation and may not be comparable to similarnon-GAAP presentations used by other companies. The firm believes that presenting the firm’s assets on this basis is meaningful because it is consistent with the way management views and manages risks associated with the firm’s assets and better enables investors to assess the liquidity of the firm’s assets. For further information about the firm’s balance sheet allocation, see “Balance Sheet and Funding Sources – Balance Sheet Allocation” in Part II, Item 7 “Management’s Discussion and Analysis of Financial Condition and Results of Operations” in the firm’s Annual Report on Form10-K for the year ended December 31, 2018. The tables below present the reconciliations of the balance sheet allocation to the firm’s businesses to the firm’s U.S. GAAP balance sheet: GCLA, Segregated Secured Institutional Investing & Other Unaudited, $ in billions Assets and Other Client Financing Client Services Lending Assets Total As of March 31, 2019 Cash and cash equivalents $ 88 $ – $ – $ – $ – $ 88 Collateralized agreements 113 112 55 – – 280 Receivables – 28 40 88 – 156 Financial instruments owned 73 – 242 48 – 363 Other assets 5 – – – 33 38 Total assets $ 279 $ 140 $ 337 $ 136 $ 33 $ 925 GCLA, Segregated Secured Institutional Investing & Other Unaudited, $ in billions Assets and Other Client Financing Client Services Lending Assets Total As of December 31, 2018 Cash and cash equivalents $ 131 $ – $ – $ – $ – $ 131 Collateralized agreements 97 115 62 – – 274 Receivables – 30 42 88 – 160 Financial instruments owned 85 – 204 47 – 336 – – – – 31 31 Other assets Total assets $ 313 $ 145 $ 308 $ 135 $ 31 $ 932