Exhibit 99.2 Second Quarter 2019 Earnings Results Presentation July 16, 2019 Exhibit 99.2 Second Quarter 2019 Earnings Results Presentation July 16, 2019
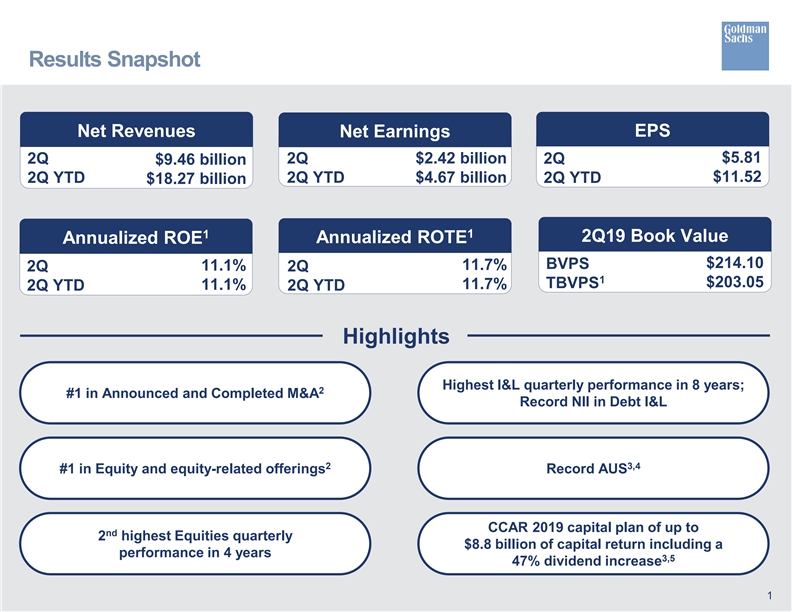
Results Snapshot Net Revenues Net Earnings EPS $5.81 2Q 2Q $2.42 billion 2Q $9.46 billion $11.52 2Q YTD 2Q YTD $4.67 billion 2Q YTD $18.27 billion 1 1 2Q19 Book Value Annualized ROTE Annualized ROE $214.10 BVPS 11.7% 11.1% 2Q 2Q 1 $203.05 TBVPS 11.7% 11.1% 2Q YTD 2Q YTD Highlights Highest I&L quarterly performance in 8 years; 2 #1 in Announced and Completed M&A Record NII in Debt I&L 2 3,4 #1 in Equity and equity-related offerings Record AUS CCAR 2019 capital plan of up to nd 2 highest Equities quarterly $8.8 billion of capital return including a performance in 4 years 3,5 47% dividend increase 1 Results Snapshot Net Revenues Net Earnings EPS $5.81 2Q 2Q $2.42 billion 2Q $9.46 billion $11.52 2Q YTD 2Q YTD $4.67 billion 2Q YTD $18.27 billion 1 1 2Q19 Book Value Annualized ROTE Annualized ROE $214.10 BVPS 11.7% 11.1% 2Q 2Q 1 $203.05 TBVPS 11.7% 11.1% 2Q YTD 2Q YTD Highlights Highest I&L quarterly performance in 8 years; 2 #1 in Announced and Completed M&A Record NII in Debt I&L 2 3,4 #1 in Equity and equity-related offerings Record AUS CCAR 2019 capital plan of up to nd 2 highest Equities quarterly $8.8 billion of capital return including a performance in 4 years 3,5 47% dividend increase 1
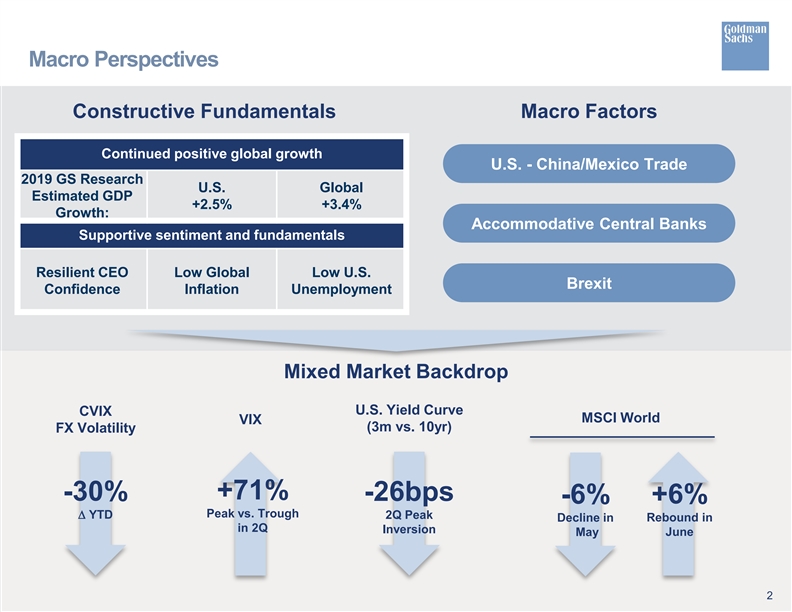
Macro Perspectives Constructive Fundamentals Macro Factors Continued positive global growth U.S. - China/Mexico Trade 2019 GS Research U.S. Global Estimated GDP +2.5% +3.4% Growth: Accommodative Central Banks Supportive sentiment and fundamentals Resilient CEO Low Global Low U.S. Brexit Confidence Inflation Unemployment Mixed Market Backdrop U.S. Yield Curve CVIX MSCI World VIX (3m vs. 10yr) FX Volatility +71% -30% -26bps -6% +6% Peak vs. Trough ∆ YTD 2Q Peak Decline in Rebound in in 2Q Inversion May June 2 Macro Perspectives Constructive Fundamentals Macro Factors Continued positive global growth U.S. - China/Mexico Trade 2019 GS Research U.S. Global Estimated GDP +2.5% +3.4% Growth: Accommodative Central Banks Supportive sentiment and fundamentals Resilient CEO Low Global Low U.S. Brexit Confidence Inflation Unemployment Mixed Market Backdrop U.S. Yield Curve CVIX MSCI World VIX (3m vs. 10yr) FX Volatility +71% -30% -26bps -6% +6% Peak vs. Trough ∆ YTD 2Q Peak Decline in Rebound in in 2Q Inversion May June 2
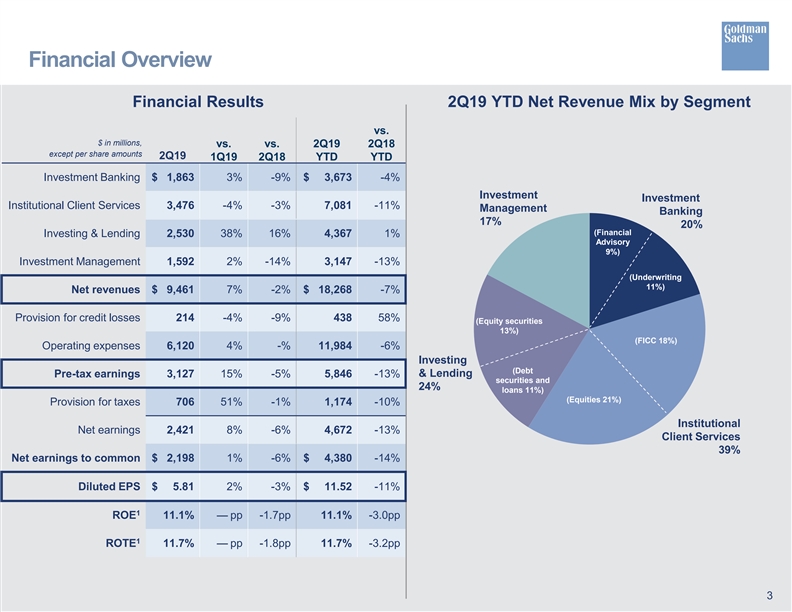
Financial Overview Financial Results 2Q19 YTD Net Revenue Mix by Segment vs. $ in millions, vs. vs. 2Q19 2Q18 except per share amounts 2Q19 1Q19 2Q18 YTD YTD Investment Banking $ 1,863 3% -9% $ 3,673 -4% Investment Investment Institutional Client Services 3,476 -4% -3% 7,081 -11% Management Banking 17% 20% (Financial Investing & Lending 2,530 38% 16% 4,367 1% Advisory 9%) Investment Management 1,592 2% -14% 3,147 -13% (Underwriting 11%) Net revenues $ 9,461 7% -2% $ 18,268 -7% Provision for credit losses 214 -4% -9% 438 58% (Equity securities 13%) (FICC 18%) Operating expenses 6,120 4% -% 11,984 -6% Investing (Debt & Lending Pre-tax earnings 3,127 15% -5% 5,846 -13% securities and 24% loans 11%) (Equities 21%) Provision for taxes 706 51% -1% 1,174 -10% Institutional Net earnings 2,421 8% -6% 4,672 -13% Client Services 39% Net earnings to common $ 2,198 1% -6% $ 4,380 -14% Diluted EPS $ 5.81 2% -3% $ 11.52 - 11% 1 ROE 11.1% — pp -1.7pp 11.1% -3.0pp 1 ROTE 11.7% — pp -1.8pp 11.7% -3.2pp 3 Financial Overview Financial Results 2Q19 YTD Net Revenue Mix by Segment vs. $ in millions, vs. vs. 2Q19 2Q18 except per share amounts 2Q19 1Q19 2Q18 YTD YTD Investment Banking $ 1,863 3% -9% $ 3,673 -4% Investment Investment Institutional Client Services 3,476 -4% -3% 7,081 -11% Management Banking 17% 20% (Financial Investing & Lending 2,530 38% 16% 4,367 1% Advisory 9%) Investment Management 1,592 2% -14% 3,147 -13% (Underwriting 11%) Net revenues $ 9,461 7% -2% $ 18,268 -7% Provision for credit losses 214 -4% -9% 438 58% (Equity securities 13%) (FICC 18%) Operating expenses 6,120 4% -% 11,984 -6% Investing (Debt & Lending Pre-tax earnings 3,127 15% -5% 5,846 -13% securities and 24% loans 11%) (Equities 21%) Provision for taxes 706 51% -1% 1,174 -10% Institutional Net earnings 2,421 8% -6% 4,672 -13% Client Services 39% Net earnings to common $ 2,198 1% -6% $ 4,380 -14% Diluted EPS $ 5.81 2% -3% $ 11.52 - 11% 1 ROE 11.1% — pp -1.7pp 11.1% -3.0pp 1 ROTE 11.7% — pp -1.8pp 11.7% -3.2pp 3
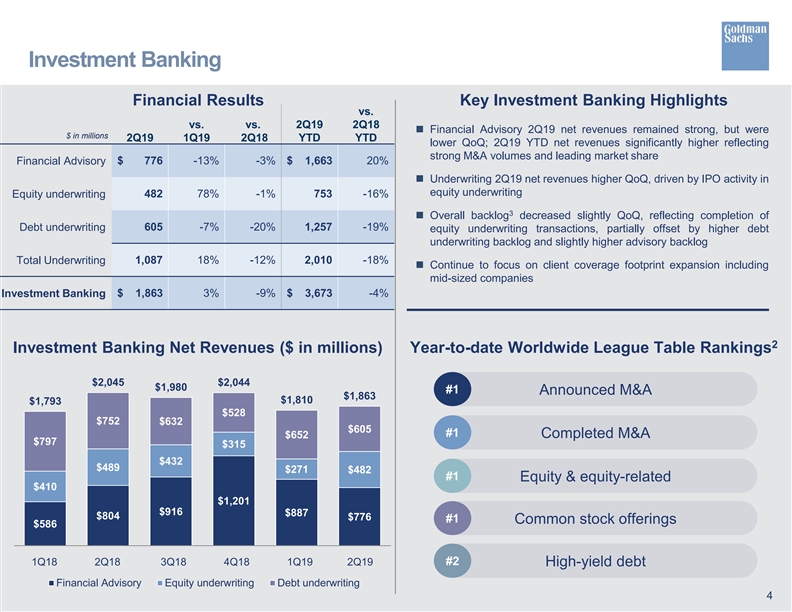
Investment Banking Financial Results Key Investment Banking Highlights vs. vs. vs. 2Q19 2Q18 n Financial Advisory 2Q19 net revenues remained strong, but were $ in millions 2Q19 1Q19 2Q18 YTD YTD lower QoQ; 2Q19 YTD net revenues significantly higher reflecting strong M&A volumes and leading market share $ 776 -13% -3% $ 1,663 20% Financial Advisory n Underwriting 2Q19 net revenues higher QoQ, driven by IPO activity in equity underwriting Equity underwriting 482 78% -1% 753 -16% 3 n Overall backlog decreased slightly QoQ, reflecting completion of Debt underwriting 605 -7% -20% 1,257 -19% equity underwriting transactions, partially offset by higher debt underwriting backlog and slightly higher advisory backlog Total Underwriting 1,087 18% -12% 2,010 -18% n Continue to focus on client coverage footprint expansion including mid-sized companies Investment Banking $ 1,863 3% -9% $ 3,673 -4% 2 Investment Banking Net Revenues ($ in millions) Year-to-date Worldwide League Table Rankings $2,045 $2,044 $1,980 #1 Announced M&A $1,863 $1,810 $1,793 $528 $752 $632 $605 #1 $652 Completed M&A $797 $315 $432 $489 $271 $482 #1 Equity & equity-related $410 $1,201 $916 $887 $804 $776 #1 Common stock offerings $586 #2 1Q18 2Q18 3Q18 4Q18 1Q19 2Q19 High-yield debt Financial Advisory Equity underwriting Debt underwriting 4 Investment Banking Financial Results Key Investment Banking Highlights vs. vs. vs. 2Q19 2Q18 n Financial Advisory 2Q19 net revenues remained strong, but were $ in millions 2Q19 1Q19 2Q18 YTD YTD lower QoQ; 2Q19 YTD net revenues significantly higher reflecting strong M&A volumes and leading market share $ 776 -13% -3% $ 1,663 20% Financial Advisory n Underwriting 2Q19 net revenues higher QoQ, driven by IPO activity in equity underwriting Equity underwriting 482 78% -1% 753 -16% 3 n Overall backlog decreased slightly QoQ, reflecting completion of Debt underwriting 605 -7% -20% 1,257 -19% equity underwriting transactions, partially offset by higher debt underwriting backlog and slightly higher advisory backlog Total Underwriting 1,087 18% -12% 2,010 -18% n Continue to focus on client coverage footprint expansion including mid-sized companies Investment Banking $ 1,863 3% -9% $ 3,673 -4% 2 Investment Banking Net Revenues ($ in millions) Year-to-date Worldwide League Table Rankings $2,045 $2,044 $1,980 #1 Announced M&A $1,863 $1,810 $1,793 $528 $752 $632 $605 #1 $652 Completed M&A $797 $315 $432 $489 $271 $482 #1 Equity & equity-related $410 $1,201 $916 $887 $804 $776 #1 Common stock offerings $586 #2 1Q18 2Q18 3Q18 4Q18 1Q19 2Q19 High-yield debt Financial Advisory Equity underwriting Debt underwriting 4
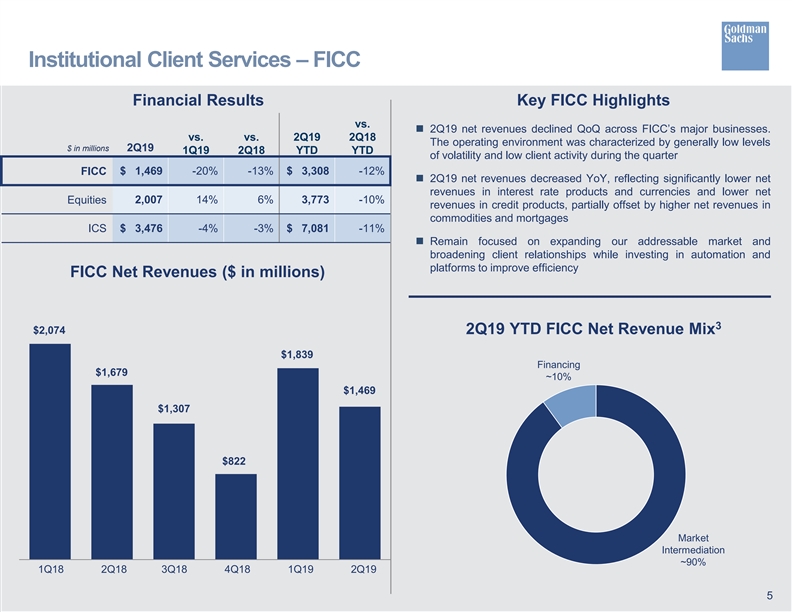
Institutional Client Services – FICC Financial Results Key FICC Highlights vs. n 2Q19 net revenues declined QoQ across FICC’s major businesses. vs. vs. 2Q19 2Q18 The operating environment was characterized by generally low levels $ in millions 2Q19 1Q19 2Q18 YTD YTD of volatility and low client activity during the quarter FICC $ 1,469 -20% -13% $ 3,308 -12% n 2Q19 net revenues decreased YoY, reflecting significantly lower net revenues in interest rate products and currencies and lower net 2,007 14% 6% 3,773 -10% Equities revenues in credit products, partially offset by higher net revenues in commodities and mortgages ICS $ 3,476 -4% -3% $ 7,081 -11% n Remain focused on expanding our addressable market and broadening client relationships while investing in automation and platforms to improve efficiency FICC Net Revenues ($ in millions) 3 $2,074 2Q19 YTD FICC Net Revenue Mix $1,839 Financing $1,679 ~10% $1,469 $1,307 $822 Market Intermediation ~90% 1Q18 2Q18 3Q18 4Q18 1Q19 2Q19 5 Institutional Client Services – FICC Financial Results Key FICC Highlights vs. n 2Q19 net revenues declined QoQ across FICC’s major businesses. vs. vs. 2Q19 2Q18 The operating environment was characterized by generally low levels $ in millions 2Q19 1Q19 2Q18 YTD YTD of volatility and low client activity during the quarter FICC $ 1,469 -20% -13% $ 3,308 -12% n 2Q19 net revenues decreased YoY, reflecting significantly lower net revenues in interest rate products and currencies and lower net 2,007 14% 6% 3,773 -10% Equities revenues in credit products, partially offset by higher net revenues in commodities and mortgages ICS $ 3,476 -4% -3% $ 7,081 -11% n Remain focused on expanding our addressable market and broadening client relationships while investing in automation and platforms to improve efficiency FICC Net Revenues ($ in millions) 3 $2,074 2Q19 YTD FICC Net Revenue Mix $1,839 Financing $1,679 ~10% $1,469 $1,307 $822 Market Intermediation ~90% 1Q18 2Q18 3Q18 4Q18 1Q19 2Q19 5
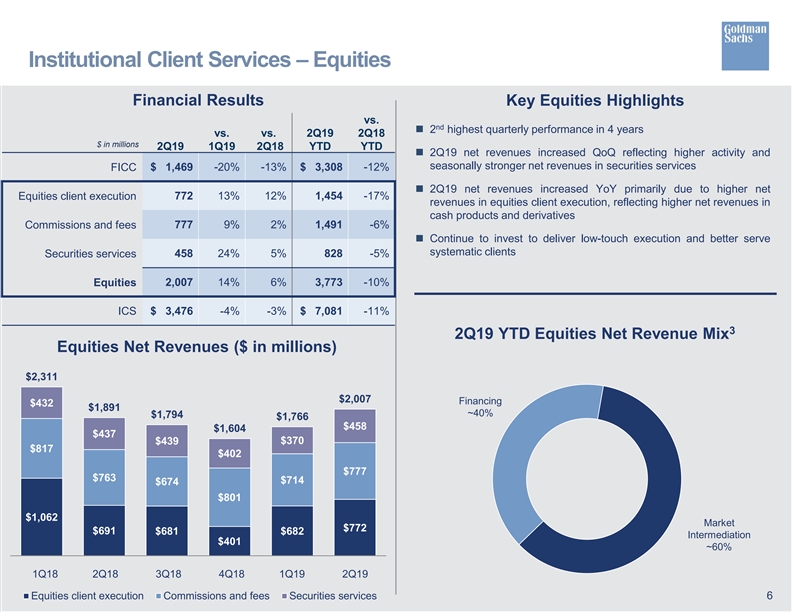
Institutional Client Services – Equities Financial Results Key Equities Highlights vs. nd n 2 highest quarterly performance in 4 years vs. vs. 2Q19 2Q18 $ in millions 2Q19 1Q19 2Q18 YTD YTD n 2Q19 net revenues increased QoQ reflecting higher activity and seasonally stronger net revenues in securities services FICC $ 1,469 -20% -13% $ 3,308 -12% n 2Q19 net revenues increased YoY primarily due to higher net Equities client execution 772 13% 12% 1,454 -17% revenues in equities client execution, reflecting higher net revenues in cash products and derivatives 777 9% 2% 1,491 -6% Commissions and fees n Continue to invest to deliver low-touch execution and better serve systematic clients Securities services 458 24% 5% 828 -5% Equities 2,007 14% 6% 3,773 -10% ICS $ 3,476 -4% -3% $ 7,081 -11% 3 2Q19 YTD Equities Net Revenue Mix Equities Net Revenues ($ in millions) $2,311 $2,007 Financing $432 $1,891 ~40% $1,794 $1,766 $458 $1,604 $437 $370 $439 $817 $402 $777 $763 $714 $674 $801 $1,062 Market $772 $691 $681 $682 Intermediation $401 ~60% 1Q18 2Q18 3Q18 4Q18 1Q19 2Q19 Equities client execution Commissions and fees Securities services 6 Institutional Client Services – Equities Financial Results Key Equities Highlights vs. nd n 2 highest quarterly performance in 4 years vs. vs. 2Q19 2Q18 $ in millions 2Q19 1Q19 2Q18 YTD YTD n 2Q19 net revenues increased QoQ reflecting higher activity and seasonally stronger net revenues in securities services FICC $ 1,469 -20% -13% $ 3,308 -12% n 2Q19 net revenues increased YoY primarily due to higher net Equities client execution 772 13% 12% 1,454 -17% revenues in equities client execution, reflecting higher net revenues in cash products and derivatives 777 9% 2% 1,491 -6% Commissions and fees n Continue to invest to deliver low-touch execution and better serve systematic clients Securities services 458 24% 5% 828 -5% Equities 2,007 14% 6% 3,773 -10% ICS $ 3,476 -4% -3% $ 7,081 -11% 3 2Q19 YTD Equities Net Revenue Mix Equities Net Revenues ($ in millions) $2,311 $2,007 Financing $432 $1,891 ~40% $1,794 $1,766 $458 $1,604 $437 $370 $439 $817 $402 $777 $763 $714 $674 $801 $1,062 Market $772 $691 $681 $682 Intermediation $401 ~60% 1Q18 2Q18 3Q18 4Q18 1Q19 2Q19 Equities client execution Commissions and fees Securities services 6
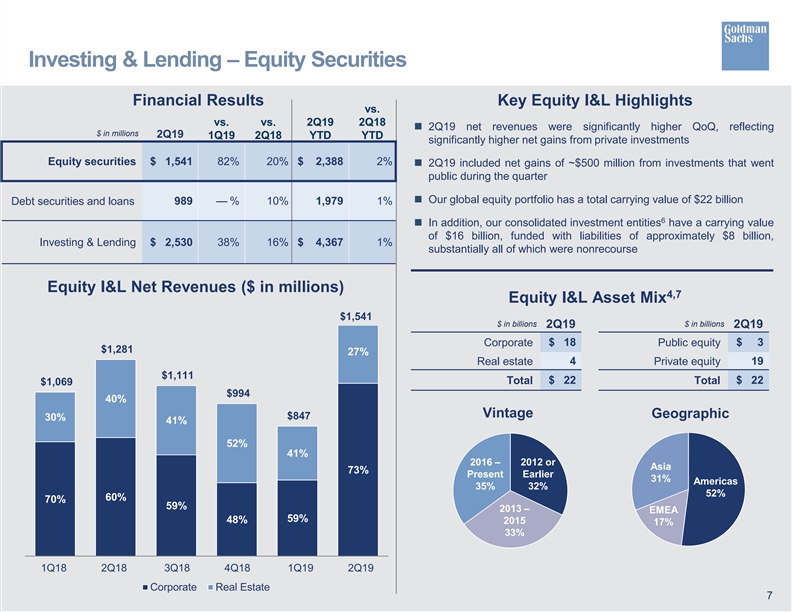
Investing & Lending – Equity Securities Financial Results Key Equity I&L Highlights vs. vs. vs. 2Q19 2Q18 n 2Q19 net revenues were significantly higher QoQ, reflecting $ in millions 2Q19 1Q19 2Q18 YTD YTD significantly higher net gains from private investments Equity securities $ 1,541 82% 20% $ 2,388 2% n 2Q19 included net gains of ~$500 million from investments that went public during the quarter n Our global equity portfolio has a total carrying value of $22 billion Debt securities and loans 989 — % 10% 1,979 1% 6 n In addition, our consolidated investment entities have a carrying value of $16 billion, funded with liabilities of approximately $8 billion, Investing & Lending $ 2,530 38% 16% $ 4,367 1% substantially all of which were nonrecourse Equity I&L Net Revenues ($ in millions) 4,7 Equity I&L Asset Mix $1,541 $ in billions $ in billions 2Q19 2Q19 Corporate $ 18 Public equity $ 3 $1,281 27% Real estate 4 Private equity 19 $1,111 Total $ 22 Total $ 22 $1,069 $994 40% Vintage Geographic $847 30% 41% 52% 41% 2016 – 2012 or Asia 73% Present Earlier 31% Americas 35% 32% 52% 60% 70% 59% 2013 – EMEA 59% 48% 2015 17% 33% 1Q18 2Q18 3Q18 4Q18 1Q19 2Q19 Corporate Real Estate 7 Investing & Lending – Equity Securities Financial Results Key Equity I&L Highlights vs. vs. vs. 2Q19 2Q18 n 2Q19 net revenues were significantly higher QoQ, reflecting $ in millions 2Q19 1Q19 2Q18 YTD YTD significantly higher net gains from private investments Equity securities $ 1,541 82% 20% $ 2,388 2% n 2Q19 included net gains of ~$500 million from investments that went public during the quarter n Our global equity portfolio has a total carrying value of $22 billion Debt securities and loans 989 — % 10% 1,979 1% 6 n In addition, our consolidated investment entities have a carrying value of $16 billion, funded with liabilities of approximately $8 billion, Investing & Lending $ 2,530 38% 16% $ 4,367 1% substantially all of which were nonrecourse Equity I&L Net Revenues ($ in millions) 4,7 Equity I&L Asset Mix $1,541 $ in billions $ in billions 2Q19 2Q19 Corporate $ 18 Public equity $ 3 $1,281 27% Real estate 4 Private equity 19 $1,111 Total $ 22 Total $ 22 $1,069 $994 40% Vintage Geographic $847 30% 41% 52% 41% 2016 – 2012 or Asia 73% Present Earlier 31% Americas 35% 32% 52% 60% 70% 59% 2013 – EMEA 59% 48% 2015 17% 33% 1Q18 2Q18 3Q18 4Q18 1Q19 2Q19 Corporate Real Estate 7
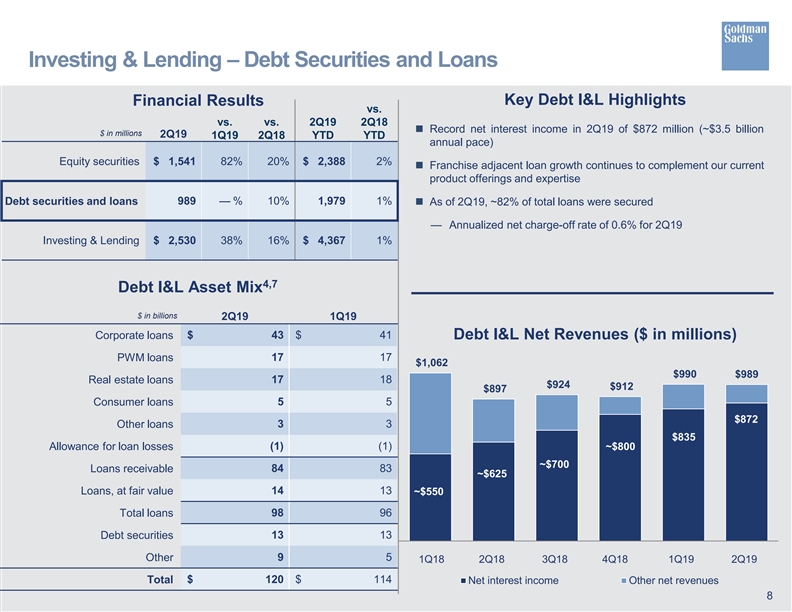
Investing & Lending – Debt Securities and Loans Key Debt I&L Highlights Financial Results vs. vs. vs. 2Q19 2Q18 n Record net interest income in 2Q19 of $872 million (~$3.5 billion $ in millions 2Q19 1Q19 2Q18 YTD YTD annual pace) Equity securities $ 1,541 82% 20% $ 2,388 2% n Franchise adjacent loan growth continues to complement our current product offerings and expertise Debt securities and loans 989 — % 10% 1,979 1% n As of 2Q19, ~82% of total loans were secured — Annualized net charge-off rate of 0.6% for 2Q19 Investing & Lending $ 2,530 38% 16% $ 4,367 1% 4,7 Debt I&L Asset Mix $ in billions 2Q19 1Q19 Corporate loans $ 43 $ 41 Debt I&L Net Revenues ($ in millions) PWM loans 17 17 $1,062 $990 $989 17 18 Real estate loans $924 $912 $897 5 5 Consumer loans $872 Other loans 3 3 $835 Allowance for loan losses (1) (1) ~$800 ~$700 Loans receivable 84 83 ~$625 14 13 Loans, at fair value ~$550 Total loans 98 96 Debt securities 13 13 Other 9 5 1Q18 2Q18 3Q18 4Q18 1Q19 2Q19 Total $ 120 $ 114 Net interest income Other net revenues 8 Investing & Lending – Debt Securities and Loans Key Debt I&L Highlights Financial Results vs. vs. vs. 2Q19 2Q18 n Record net interest income in 2Q19 of $872 million (~$3.5 billion $ in millions 2Q19 1Q19 2Q18 YTD YTD annual pace) Equity securities $ 1,541 82% 20% $ 2,388 2% n Franchise adjacent loan growth continues to complement our current product offerings and expertise Debt securities and loans 989 — % 10% 1,979 1% n As of 2Q19, ~82% of total loans were secured — Annualized net charge-off rate of 0.6% for 2Q19 Investing & Lending $ 2,530 38% 16% $ 4,367 1% 4,7 Debt I&L Asset Mix $ in billions 2Q19 1Q19 Corporate loans $ 43 $ 41 Debt I&L Net Revenues ($ in millions) PWM loans 17 17 $1,062 $990 $989 17 18 Real estate loans $924 $912 $897 5 5 Consumer loans $872 Other loans 3 3 $835 Allowance for loan losses (1) (1) ~$800 ~$700 Loans receivable 84 83 ~$625 14 13 Loans, at fair value ~$550 Total loans 98 96 Debt securities 13 13 Other 9 5 1Q18 2Q18 3Q18 4Q18 1Q19 2Q19 Total $ 120 $ 114 Net interest income Other net revenues 8
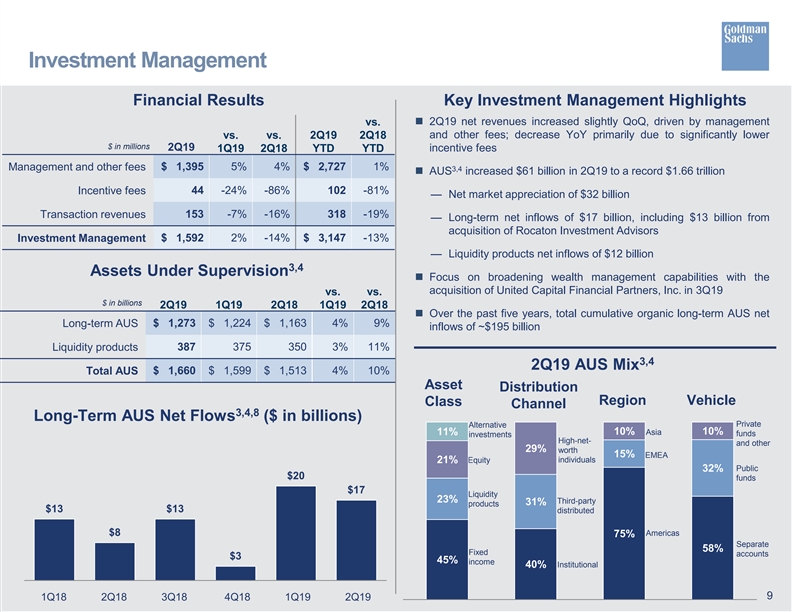
Investment Management Financial Results Key Investment Management Highlights n 2Q19 net revenues increased slightly QoQ, driven by management vs. and other fees; decrease YoY primarily due to significantly lower vs. vs. 2Q19 2Q18 $ in millions 2Q19 1Q19 2Q18 YTD YTD incentive fees $ 1,395 5% 4% $ 2,727 1% Management and other fees 3,4 n AUS increased $61 billion in 2Q19 to a record $1.66 trillion Incentive fees 44 -24% -86% 102 -81% — Net market appreciation of $32 billion Transaction revenues 153 -7% -16% 318 -19% — Long-term net inflows of $17 billion, including $13 billion from acquisition of Rocaton Investment Advisors Investment Management $ 1,592 2% -14% $ 3,147 -13% — Liquidity products net inflows of $12 billion 3,4 Assets Under Supervision n Focus on broadening wealth management capabilities with the acquisition of United Capital Financial Partners, Inc. in 3Q19 vs. vs. $ in billions 2Q19 1Q19 2Q18 1Q19 2Q18 n Over the past five years, total cumulative organic long-term AUS net Long-term AUS $ 1,273 $ 1,224 $ 1,163 4% 9% inflows of ~$195 billion Liquidity products 387 375 350 3% 11% 3,4 2Q19 AUS Mix $ 1,660 $ 1,599 $ 1,513 4% 10% Total AUS Asset Distribution Region Vehicle Class Channel 3,4,8 Long-Term AUS Net Flows ($ in billions) Private Alternative 11% 10% Asia 10% funds investments High-net- and other 29% worth 15% EMEA 21% Equity individuals Public 32% $20 funds $17 Liquidity 23% Third-party 31% products $13 $13 distributed $8 Americas 75% Separate 58% Fixed accounts $3 45% income Institutional 40% 9 1Q18 2Q18 3Q18 4Q18 1Q19 2Q19 Investment Management Financial Results Key Investment Management Highlights n 2Q19 net revenues increased slightly QoQ, driven by management vs. and other fees; decrease YoY primarily due to significantly lower vs. vs. 2Q19 2Q18 $ in millions 2Q19 1Q19 2Q18 YTD YTD incentive fees $ 1,395 5% 4% $ 2,727 1% Management and other fees 3,4 n AUS increased $61 billion in 2Q19 to a record $1.66 trillion Incentive fees 44 -24% -86% 102 -81% — Net market appreciation of $32 billion Transaction revenues 153 -7% -16% 318 -19% — Long-term net inflows of $17 billion, including $13 billion from acquisition of Rocaton Investment Advisors Investment Management $ 1,592 2% -14% $ 3,147 -13% — Liquidity products net inflows of $12 billion 3,4 Assets Under Supervision n Focus on broadening wealth management capabilities with the acquisition of United Capital Financial Partners, Inc. in 3Q19 vs. vs. $ in billions 2Q19 1Q19 2Q18 1Q19 2Q18 n Over the past five years, total cumulative organic long-term AUS net Long-term AUS $ 1,273 $ 1,224 $ 1,163 4% 9% inflows of ~$195 billion Liquidity products 387 375 350 3% 11% 3,4 2Q19 AUS Mix $ 1,660 $ 1,599 $ 1,513 4% 10% Total AUS Asset Distribution Region Vehicle Class Channel 3,4,8 Long-Term AUS Net Flows ($ in billions) Private Alternative 11% 10% Asia 10% funds investments High-net- and other 29% worth 15% EMEA 21% Equity individuals Public 32% $20 funds $17 Liquidity 23% Third-party 31% products $13 $13 distributed $8 Americas 75% Separate 58% Fixed accounts $3 45% income Institutional 40% 9 1Q18 2Q18 3Q18 4Q18 1Q19 2Q19
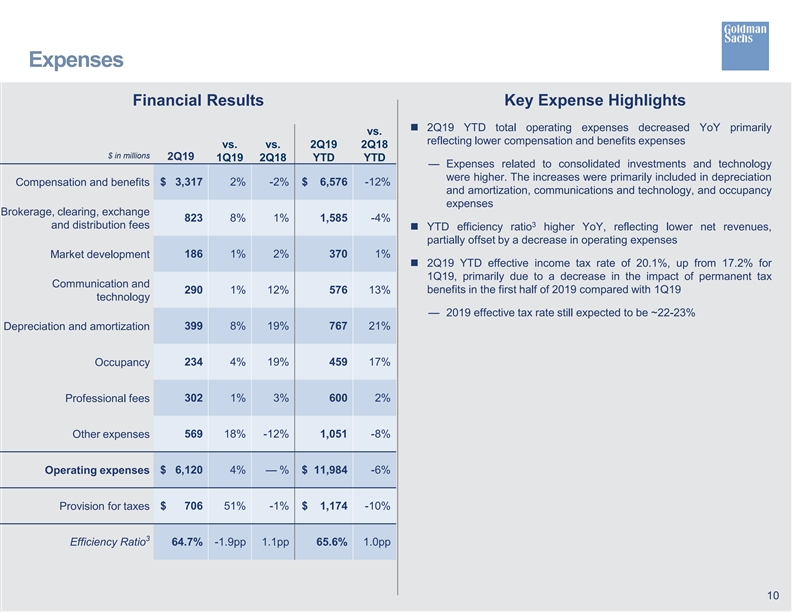
Expenses Financial Results Key Expense Highlights n 2Q19 YTD total operating expenses decreased YoY primarily vs. reflecting lower compensation and benefits expenses vs. vs. 2Q19 2Q18 $ in millions 2Q19 1Q19 2Q18 YTD YTD — Expenses related to consolidated investments and technology were higher. The increases were primarily included in depreciation Compensation and benefits $ 3,317 2% -2% $ 6,576 -12% and amortization, communications and technology, and occupancy expenses Brokerage, clearing, exchange 823 8% 1% 1,585 -4% 3 and distribution fees n YTD efficiency ratio higher YoY, reflecting lower net revenues, partially offset by a decrease in operating expenses Market development 186 1% 2% 370 1% n 2Q19 YTD effective income tax rate of 20.1%, up from 17.2% for 1Q19, primarily due to a decrease in the impact of permanent tax Communication and benefits in the first half of 2019 compared with 1Q19 290 1% 12% 576 13% technology — 2019 effective tax rate still expected to be ~22-23% Depreciation and amortization 399 8% 19% 767 21% Occupancy 234 4% 19% 459 17% Professional fees 302 1% 3% 600 2% Other expenses 569 18% -12% 1,051 -8% Operating expenses $ 6,120 4% — % $ 11,984 -6% Provision for taxes $ 706 51% -1% $ 1,174 -10% 3 Efficiency Ratio 64.7% -1.9pp 1.1pp 65.6% 1.0pp 10 Expenses Financial Results Key Expense Highlights n 2Q19 YTD total operating expenses decreased YoY primarily vs. reflecting lower compensation and benefits expenses vs. vs. 2Q19 2Q18 $ in millions 2Q19 1Q19 2Q18 YTD YTD — Expenses related to consolidated investments and technology were higher. The increases were primarily included in depreciation Compensation and benefits $ 3,317 2% -2% $ 6,576 -12% and amortization, communications and technology, and occupancy expenses Brokerage, clearing, exchange 823 8% 1% 1,585 -4% 3 and distribution fees n YTD efficiency ratio higher YoY, reflecting lower net revenues, partially offset by a decrease in operating expenses Market development 186 1% 2% 370 1% n 2Q19 YTD effective income tax rate of 20.1%, up from 17.2% for 1Q19, primarily due to a decrease in the impact of permanent tax Communication and benefits in the first half of 2019 compared with 1Q19 290 1% 12% 576 13% technology — 2019 effective tax rate still expected to be ~22-23% Depreciation and amortization 399 8% 19% 767 21% Occupancy 234 4% 19% 459 17% Professional fees 302 1% 3% 600 2% Other expenses 569 18% -12% 1,051 -8% Operating expenses $ 6,120 4% — % $ 11,984 -6% Provision for taxes $ 706 51% -1% $ 1,174 -10% 3 Efficiency Ratio 64.7% -1.9pp 1.1pp 65.6% 1.0pp 10
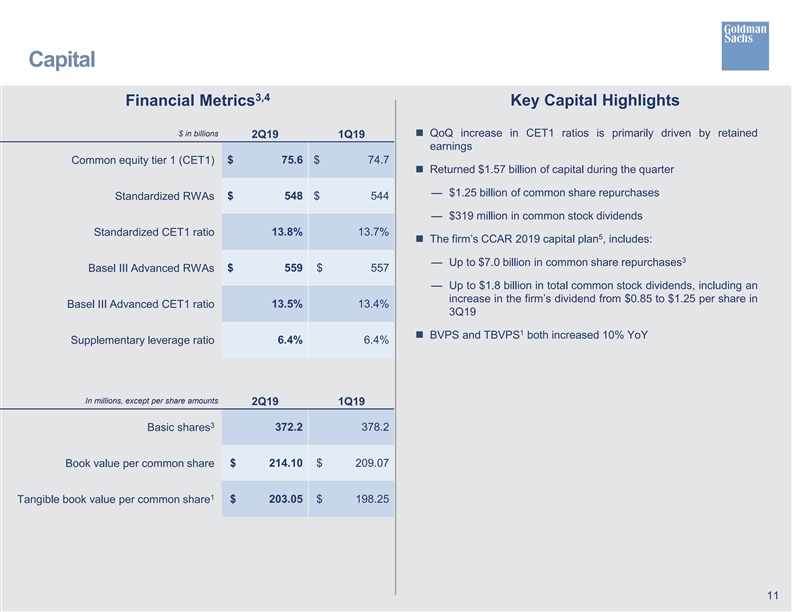
Capital 3,4 Financial Metrics Key Capital Highlights $ in billions n QoQ increase in CET1 ratios is primarily driven by retained 2Q19 1Q19 earnings Common equity tier 1 (CET1) $ 75.6 $ 74.7 n Returned $1.57 billion of capital during the quarter — $1.25 billion of common share repurchases Standardized RWAs $ 548 $ 544 — $319 million in common stock dividends Standardized CET1 ratio 13.8% 13.7% 5 n The firm’s CCAR 2019 capital plan , includes: 3 — Up to $7.0 billion in common share repurchases Basel III Advanced RWAs $ 559 $ 557 — Up to $1.8 billion in total common stock dividends, including an increase in the firm’s dividend from $0.85 to $1.25 per share in Basel III Advanced CET1 ratio 13.5% 13.4% 3Q19 1 n BVPS and TBVPS both increased 10% YoY Supplementary leverage ratio 6.4% 6.4% In millions, except per share amounts 2Q19 1Q19 3 Basic shares 372.2 378.2 Book value per common share $ 214.10 $ 209.07 1 Tangible book value per common share $ 203.05 $ 198.25 11 Capital 3,4 Financial Metrics Key Capital Highlights $ in billions n QoQ increase in CET1 ratios is primarily driven by retained 2Q19 1Q19 earnings Common equity tier 1 (CET1) $ 75.6 $ 74.7 n Returned $1.57 billion of capital during the quarter — $1.25 billion of common share repurchases Standardized RWAs $ 548 $ 544 — $319 million in common stock dividends Standardized CET1 ratio 13.8% 13.7% 5 n The firm’s CCAR 2019 capital plan , includes: 3 — Up to $7.0 billion in common share repurchases Basel III Advanced RWAs $ 559 $ 557 — Up to $1.8 billion in total common stock dividends, including an increase in the firm’s dividend from $0.85 to $1.25 per share in Basel III Advanced CET1 ratio 13.5% 13.4% 3Q19 1 n BVPS and TBVPS both increased 10% YoY Supplementary leverage ratio 6.4% 6.4% In millions, except per share amounts 2Q19 1Q19 3 Basic shares 372.2 378.2 Book value per common share $ 214.10 $ 209.07 1 Tangible book value per common share $ 203.05 $ 198.25 11
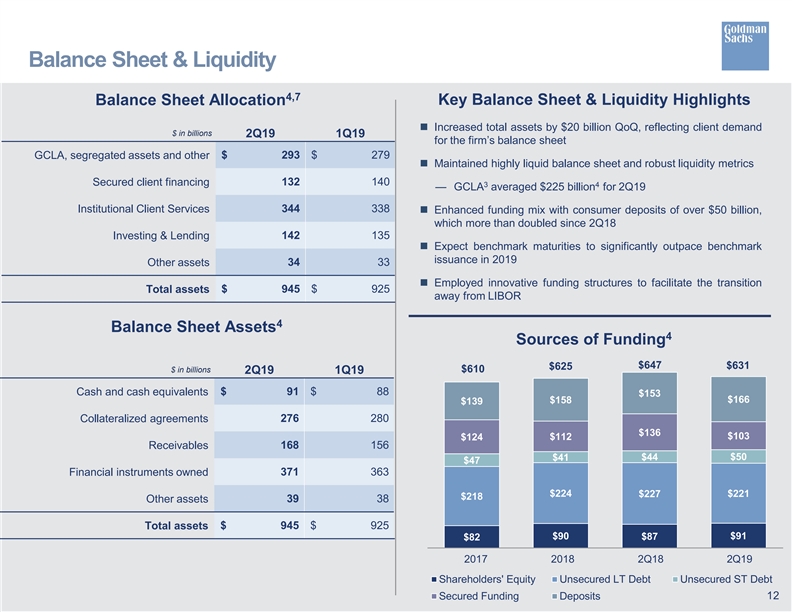
Balance Sheet & Liquidity 4,7 Balance Sheet Allocation Key Balance Sheet & Liquidity Highlights n Increased total assets by $20 billion QoQ, reflecting client demand $ in billions 2Q19 1Q19 for the firm’s balance sheet GCLA, segregated assets and other $ 293 $ 279 n Maintained highly liquid balance sheet and robust liquidity metrics Secured client financing 132 140 3 4 — GCLA averaged $225 billion for 2Q19 344 338 Institutional Client Services n Enhanced funding mix with consumer deposits of over $50 billion, which more than doubled since 2Q18 Investing & Lending 142 135 n Expect benchmark maturities to significantly outpace benchmark issuance in 2019 Other assets 34 33 n Employed innovative funding structures to facilitate the transition Total assets $ 945 $ 925 away from LIBOR 4 Balance Sheet Assets 4 Sources of Funding $647 $631 $625 $610 $ in billions 2Q19 1Q19 $ 91 $ 88 Cash and cash equivalents $153 $158 $166 $139 Collateralized agreements 276 280 $136 $103 $112 $124 Receivables 168 156 $44 $50 $41 $47 Financial instruments owned 371 363 $224 $227 $221 $218 39 38 Other assets Total assets $ 945 $ 925 $91 $90 $87 $82 2017 2018 2Q18 2Q19 Shareholders' Equity Unsecured LT Debt Unsecured ST Debt 12 Secured Funding Deposits Balance Sheet & Liquidity 4,7 Balance Sheet Allocation Key Balance Sheet & Liquidity Highlights n Increased total assets by $20 billion QoQ, reflecting client demand $ in billions 2Q19 1Q19 for the firm’s balance sheet GCLA, segregated assets and other $ 293 $ 279 n Maintained highly liquid balance sheet and robust liquidity metrics Secured client financing 132 140 3 4 — GCLA averaged $225 billion for 2Q19 344 338 Institutional Client Services n Enhanced funding mix with consumer deposits of over $50 billion, which more than doubled since 2Q18 Investing & Lending 142 135 n Expect benchmark maturities to significantly outpace benchmark issuance in 2019 Other assets 34 33 n Employed innovative funding structures to facilitate the transition Total assets $ 945 $ 925 away from LIBOR 4 Balance Sheet Assets 4 Sources of Funding $647 $631 $625 $610 $ in billions 2Q19 1Q19 $ 91 $ 88 Cash and cash equivalents $153 $158 $166 $139 Collateralized agreements 276 280 $136 $103 $112 $124 Receivables 168 156 $44 $50 $41 $47 Financial instruments owned 371 363 $224 $227 $221 $218 39 38 Other assets Total assets $ 945 $ 925 $91 $90 $87 $82 2017 2018 2Q18 2Q19 Shareholders' Equity Unsecured LT Debt Unsecured ST Debt 12 Secured Funding Deposits
Cautionary Note on Forward-Looking Statements This presentation contains “forward-looking statements” within the meaning of the safe harbor provisions of the U.S. Private Securities Litigation Reform Act of 1995. Forward-looking statements are not historical facts, but instead represent only the firm’s beliefs regarding future events, many of which, by their nature, are inherently uncertain and outside of the firm’s control. It is possible that the firm’s actual results and financial condition may differ, possibly materially, from the anticipated results and financial condition indicated in these statements. It is also possible that the firm’s capital actions may differ, possibly materially, from those permitted by the firm’s CCAR 2019 capital plan. For information about some of the risks and important factors that could affect the firm’s future results and financial condition and actual capital actions and the forward-looking statements below, see “Risk Factors” in Part I, Item 1A of the firm’s Annual Report on Form 10-K for the year ended December 31, 2018. Information regarding the firm’s assets under supervision, capital ratios, risk-weighted assets, supplementary leverage ratio, balance sheet data and global core liquid assets (GCLA) consists of preliminary estimates. These estimates are forward-looking statements and are subject to change, possibly materially, as the firm completes its financial statements. Statements regarding (i) the firm’s planned 2019 benchmark issuances, (ii) the amount of GCLA the firm expects to hold, (iii) the firm’s expected 2019 effective income tax rate, (iv) estimated GDP growth, (v) the timing and profitability of business initiatives, (vi) the firm’s stress capital buffer (SCB) and (vii) the firm’s investment banking transaction backlog are forward-looking statements. Statements regarding the firm’s planned 2019 benchmark issuances and the amount of GCLA the firm expects to hold are subject to the risk that actual issuances and GCLA levels may differ, possibly materially, due to changes in market conditions, business opportunities or the firm’s funding and projected liquidity needs. Statements about the firm's expected 2019 effective income tax rate are subject to the risk that the firm's 2019 effective income tax rate may differ from the anticipated rate indicated, possibly materially, due to, among other things, changes in the firm's earnings mix or profitability, the entities in which the firm generates profits and the assumptions made in forecasting the firm’s expected tax rate and potential future guidance from the U.S. IRS. Statements regarding estimated GDP growth are subject to the risk that actual GDP growth may differ, possibly materially, due to, among other things, changes in general economic conditions. Statements about the timing and benefits of business initiatives are based on the firm’s current expectations regarding our ability to implement these initiatives and may change, possibly materially, from what is currently expected. Statements about the firm’s SCB are based on the firm’s current interpretation, expectations and understanding of the proposed rule. The firm’s actual SCB will depend on the final rule and the results of the supervisory stress tests and the methodology used to calculate the firm’s SCB may differ, possibly materially, from that used for purposes of these statements. Statements about the firm’s investment banking transaction backlog are subject to the risk that transactions may be modified or not completed at all and associated net revenues may not be realized or may be materially less than those currently expected. Important factors that could have such a result include, for underwriting transactions, a decline or weakness in general economic conditions, outbreak of hostilities, volatility in the securities markets or an adverse development with respect to the issuer of the securities and, for financial advisory transactions, a decline in the securities markets, an inability to obtain adequate financing, an adverse development with respect to a party to the transaction or a failure to obtain a required regulatory approval. 13 Cautionary Note on Forward-Looking Statements This presentation contains “forward-looking statements” within the meaning of the safe harbor provisions of the U.S. Private Securities Litigation Reform Act of 1995. Forward-looking statements are not historical facts, but instead represent only the firm’s beliefs regarding future events, many of which, by their nature, are inherently uncertain and outside of the firm’s control. It is possible that the firm’s actual results and financial condition may differ, possibly materially, from the anticipated results and financial condition indicated in these statements. It is also possible that the firm’s capital actions may differ, possibly materially, from those permitted by the firm’s CCAR 2019 capital plan. For information about some of the risks and important factors that could affect the firm’s future results and financial condition and actual capital actions and the forward-looking statements below, see “Risk Factors” in Part I, Item 1A of the firm’s Annual Report on Form 10-K for the year ended December 31, 2018. Information regarding the firm’s assets under supervision, capital ratios, risk-weighted assets, supplementary leverage ratio, balance sheet data and global core liquid assets (GCLA) consists of preliminary estimates. These estimates are forward-looking statements and are subject to change, possibly materially, as the firm completes its financial statements. Statements regarding (i) the firm’s planned 2019 benchmark issuances, (ii) the amount of GCLA the firm expects to hold, (iii) the firm’s expected 2019 effective income tax rate, (iv) estimated GDP growth, (v) the timing and profitability of business initiatives, (vi) the firm’s stress capital buffer (SCB) and (vii) the firm’s investment banking transaction backlog are forward-looking statements. Statements regarding the firm’s planned 2019 benchmark issuances and the amount of GCLA the firm expects to hold are subject to the risk that actual issuances and GCLA levels may differ, possibly materially, due to changes in market conditions, business opportunities or the firm’s funding and projected liquidity needs. Statements about the firm's expected 2019 effective income tax rate are subject to the risk that the firm's 2019 effective income tax rate may differ from the anticipated rate indicated, possibly materially, due to, among other things, changes in the firm's earnings mix or profitability, the entities in which the firm generates profits and the assumptions made in forecasting the firm’s expected tax rate and potential future guidance from the U.S. IRS. Statements regarding estimated GDP growth are subject to the risk that actual GDP growth may differ, possibly materially, due to, among other things, changes in general economic conditions. Statements about the timing and benefits of business initiatives are based on the firm’s current expectations regarding our ability to implement these initiatives and may change, possibly materially, from what is currently expected. Statements about the firm’s SCB are based on the firm’s current interpretation, expectations and understanding of the proposed rule. The firm’s actual SCB will depend on the final rule and the results of the supervisory stress tests and the methodology used to calculate the firm’s SCB may differ, possibly materially, from that used for purposes of these statements. Statements about the firm’s investment banking transaction backlog are subject to the risk that transactions may be modified or not completed at all and associated net revenues may not be realized or may be materially less than those currently expected. Important factors that could have such a result include, for underwriting transactions, a decline or weakness in general economic conditions, outbreak of hostilities, volatility in the securities markets or an adverse development with respect to the issuer of the securities and, for financial advisory transactions, a decline in the securities markets, an inability to obtain adequate financing, an adverse development with respect to a party to the transaction or a failure to obtain a required regulatory approval. 13
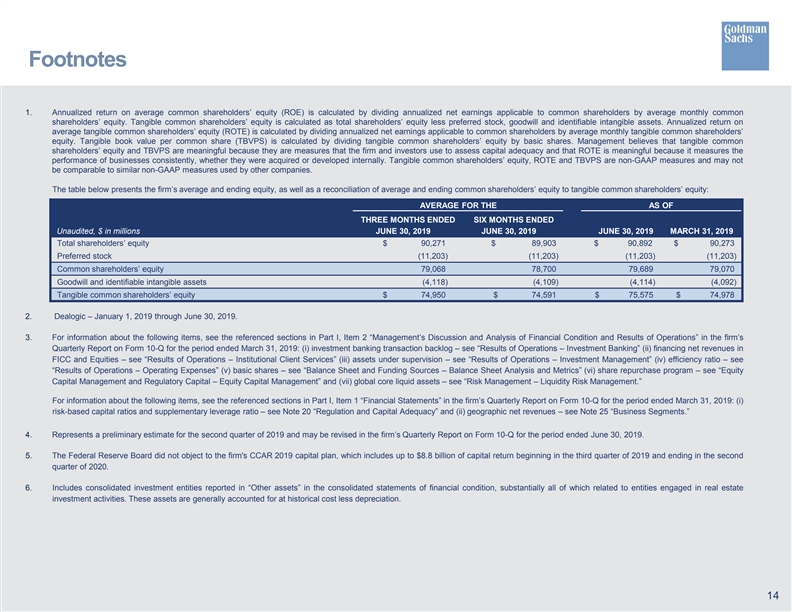
Footnotes 1. Annualized return on average common shareholders’ equity (ROE) is calculated by dividing annualized net earnings applicable to common shareholders by average monthly common shareholders’ equity. Tangible common shareholders’ equity is calculated as total shareholders’ equity less preferred stock, goodwill and identifiable intangible assets. Annualized return on average tangible common shareholders’ equity (ROTE) is calculated by dividing annualized net earnings applicable to common shareholders by average monthly tangible common shareholders’ equity. Tangible book value per common share (TBVPS) is calculated by dividing tangible common shareholders’ equity by basic shares. Management believes that tangible common shareholders’ equity and TBVPS are meaningful because they are measures that the firm and investors use to assess capital adequacy and that ROTE is meaningful because it measures the performance of businesses consistently, whether they were acquired or developed internally. Tangible common shareholders’ equity, ROTE and TBVPS are non-GAAP measures and may not be comparable to similar non-GAAP measures used by other companies. The table below presents the firm’s average and ending equity, as well as a reconciliation of average and ending common shareholders’ equity to tangible common shareholders’ equity: AVERAGE FOR THE AS OF THREE MONTHS ENDED SIX MONTHS ENDED Unaudited, $ in millions JUNE 30, 2019 JUNE 30, 2019 JUNE 30, 2019 MARCH 31, 2019 Total shareholders’ equity $ 90,271 $ 89,903 $ 90,892 $ 90,273 Preferred stock (11,203) (11,203) (11,203) (11,203) Common shareholders’ equity 79,068 78,700 79,689 79,070 Goodwill and identifiable intangible assets (4,118) (4,109) (4,114) (4,092) Tangible common shareholders’ equity $ 74,950 $ 74,591 $ 75,575 $ 74,978 2. Dealogic – January 1, 2019 through June 30, 2019. 3. For information about the following items, see the referenced sections in Part I, Item 2 “Management’s Discussion and Analysis of Financial Condition and Results of Operations” in the firm’s Quarterly Report on Form 10-Q for the period ended March 31, 2019: (i) investment banking transaction backlog – see “Results of Operations – Investment Banking” (ii) financing net revenues in FICC and Equities – see “Results of Operations – Institutional Client Services” (iii) assets under supervision – see “Results of Operations – Investment Management” (iv) efficiency ratio – see “Results of Operations – Operating Expenses” (v) basic shares – see “Balance Sheet and Funding Sources – Balance Sheet Analysis and Metrics” (vi) share repurchase program – see “Equity Capital Management and Regulatory Capital – Equity Capital Management” and (vii) global core liquid assets – see “Risk Management – Liquidity Risk Management.” For information about the following items, see the referenced sections in Part I, Item 1 “Financial Statements” in the firm’s Quarterly Report on Form 10-Q for the period ended March 31, 2019: (i) risk-based capital ratios and supplementary leverage ratio – see Note 20 “Regulation and Capital Adequacy” and (ii) geographic net revenues – see Note 25 “Business Segments.” 4. Represents a preliminary estimate for the second quarter of 2019 and may be revised in the firm’s Quarterly Report on Form 10-Q for the period ended June 30, 2019. 5. The Federal Reserve Board did not object to the firm's CCAR 2019 capital plan, which includes up to $8.8 billion of capital return beginning in the third quarter of 2019 and ending in the second quarter of 2020. 6. Includes consolidated investment entities reported in “Other assets” in the consolidated statements of financial condition, substantially all of which related to entities engaged in real estate investment activities. These assets are generally accounted for at historical cost less depreciation. 14 Footnotes 1. Annualized return on average common shareholders’ equity (ROE) is calculated by dividing annualized net earnings applicable to common shareholders by average monthly common shareholders’ equity. Tangible common shareholders’ equity is calculated as total shareholders’ equity less preferred stock, goodwill and identifiable intangible assets. Annualized return on average tangible common shareholders’ equity (ROTE) is calculated by dividing annualized net earnings applicable to common shareholders by average monthly tangible common shareholders’ equity. Tangible book value per common share (TBVPS) is calculated by dividing tangible common shareholders’ equity by basic shares. Management believes that tangible common shareholders’ equity and TBVPS are meaningful because they are measures that the firm and investors use to assess capital adequacy and that ROTE is meaningful because it measures the performance of businesses consistently, whether they were acquired or developed internally. Tangible common shareholders’ equity, ROTE and TBVPS are non-GAAP measures and may not be comparable to similar non-GAAP measures used by other companies. The table below presents the firm’s average and ending equity, as well as a reconciliation of average and ending common shareholders’ equity to tangible common shareholders’ equity: AVERAGE FOR THE AS OF THREE MONTHS ENDED SIX MONTHS ENDED Unaudited, $ in millions JUNE 30, 2019 JUNE 30, 2019 JUNE 30, 2019 MARCH 31, 2019 Total shareholders’ equity $ 90,271 $ 89,903 $ 90,892 $ 90,273 Preferred stock (11,203) (11,203) (11,203) (11,203) Common shareholders’ equity 79,068 78,700 79,689 79,070 Goodwill and identifiable intangible assets (4,118) (4,109) (4,114) (4,092) Tangible common shareholders’ equity $ 74,950 $ 74,591 $ 75,575 $ 74,978 2. Dealogic – January 1, 2019 through June 30, 2019. 3. For information about the following items, see the referenced sections in Part I, Item 2 “Management’s Discussion and Analysis of Financial Condition and Results of Operations” in the firm’s Quarterly Report on Form 10-Q for the period ended March 31, 2019: (i) investment banking transaction backlog – see “Results of Operations – Investment Banking” (ii) financing net revenues in FICC and Equities – see “Results of Operations – Institutional Client Services” (iii) assets under supervision – see “Results of Operations – Investment Management” (iv) efficiency ratio – see “Results of Operations – Operating Expenses” (v) basic shares – see “Balance Sheet and Funding Sources – Balance Sheet Analysis and Metrics” (vi) share repurchase program – see “Equity Capital Management and Regulatory Capital – Equity Capital Management” and (vii) global core liquid assets – see “Risk Management – Liquidity Risk Management.” For information about the following items, see the referenced sections in Part I, Item 1 “Financial Statements” in the firm’s Quarterly Report on Form 10-Q for the period ended March 31, 2019: (i) risk-based capital ratios and supplementary leverage ratio – see Note 20 “Regulation and Capital Adequacy” and (ii) geographic net revenues – see Note 25 “Business Segments.” 4. Represents a preliminary estimate for the second quarter of 2019 and may be revised in the firm’s Quarterly Report on Form 10-Q for the period ended June 30, 2019. 5. The Federal Reserve Board did not object to the firm's CCAR 2019 capital plan, which includes up to $8.8 billion of capital return beginning in the third quarter of 2019 and ending in the second quarter of 2020. 6. Includes consolidated investment entities reported in “Other assets” in the consolidated statements of financial condition, substantially all of which related to entities engaged in real estate investment activities. These assets are generally accounted for at historical cost less depreciation. 14
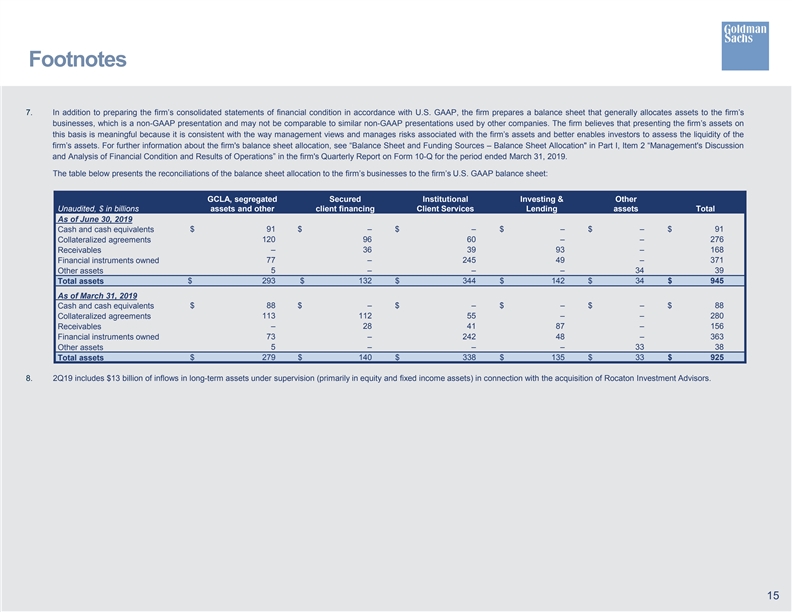
Footnotes 7. In addition to preparing the firm’s consolidated statements of financial condition in accordance with U.S. GAAP, the firm prepares a balance sheet that generally allocates assets to the firm’s businesses, which is a non-GAAP presentation and may not be comparable to similar non-GAAP presentations used by other companies. The firm believes that presenting the firm’s assets on this basis is meaningful because it is consistent with the way management views and manages risks associated with the firm’s assets and better enables investors to assess the liquidity of the firm’s assets. For further information about the firm's balance sheet allocation, see “Balance Sheet and Funding Sources – Balance Sheet Allocation in Part I, Item 2 “Management's Discussion and Analysis of Financial Condition and Results of Operations” in the firm's Quarterly Report on Form 10-Q for the period ended March 31, 2019. The table below presents the reconciliations of the balance sheet allocation to the firm’s businesses to the firm’s U.S. GAAP balance sheet: GCLA, segregated Secured Institutional Investing & Other Unaudited, $ in billions assets and other client financing Client Services Lending assets Total As of June 30, 2019 Cash and cash equivalents $ 91 $ – $ – $ – $ – $ 91 120 96 60 – – 276 Collateralized agreements – 36 39 93 – 168 Receivables Financial instruments owned 77 – 245 49 – 371 5 – – – 34 39 Other assets Total assets $ 293 $ 132 $ 344 $ 142 $ 34 $ 945 As of March 31, 2019 $ 88 $ – $ – $ – $ – $ 88 Cash and cash equivalents Collateralized agreements 113 112 55 – – 280 Receivables – 28 41 87 – 156 73 – 242 48 – 363 Financial instruments owned Other assets 5 – – – 33 38 Total assets $ 279 $ 140 $ 338 $ 135 $ 33 $ 925 8. 2Q19 includes $13 billion of inflows in long-term assets under supervision (primarily in equity and fixed income assets) in connection with the acquisition of Rocaton Investment Advisors. 15 Footnotes 7. In addition to preparing the firm’s consolidated statements of financial condition in accordance with U.S. GAAP, the firm prepares a balance sheet that generally allocates assets to the firm’s businesses, which is a non-GAAP presentation and may not be comparable to similar non-GAAP presentations used by other companies. The firm believes that presenting the firm’s assets on this basis is meaningful because it is consistent with the way management views and manages risks associated with the firm’s assets and better enables investors to assess the liquidity of the firm’s assets. For further information about the firm's balance sheet allocation, see “Balance Sheet and Funding Sources – Balance Sheet Allocation in Part I, Item 2 “Management's Discussion and Analysis of Financial Condition and Results of Operations” in the firm's Quarterly Report on Form 10-Q for the period ended March 31, 2019. The table below presents the reconciliations of the balance sheet allocation to the firm’s businesses to the firm’s U.S. GAAP balance sheet: GCLA, segregated Secured Institutional Investing & Other Unaudited, $ in billions assets and other client financing Client Services Lending assets Total As of June 30, 2019 Cash and cash equivalents $ 91 $ – $ – $ – $ – $ 91 120 96 60 – – 276 Collateralized agreements – 36 39 93 – 168 Receivables Financial instruments owned 77 – 245 49 – 371 5 – – – 34 39 Other assets Total assets $ 293 $ 132 $ 344 $ 142 $ 34 $ 945 As of March 31, 2019 $ 88 $ – $ – $ – $ – $ 88 Cash and cash equivalents Collateralized agreements 113 112 55 – – 280 Receivables – 28 41 87 – 156 73 – 242 48 – 363 Financial instruments owned Other assets 5 – – – 33 38 Total assets $ 279 $ 140 $ 338 $ 135 $ 33 $ 925 8. 2Q19 includes $13 billion of inflows in long-term assets under supervision (primarily in equity and fixed income assets) in connection with the acquisition of Rocaton Investment Advisors. 15