
Exhibit 99.2 Second Quarter 2021 Earnings Results Presentation July 13, 2021Exhibit 99.2 Second Quarter 2021 Earnings Results Presentation July 13, 2021
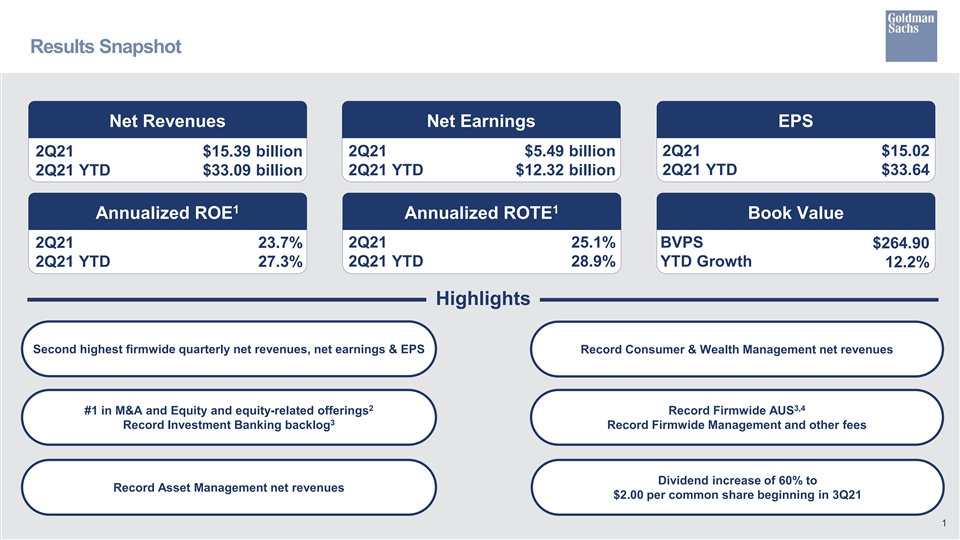
Results Snapshot Net Revenues Net Earnings EPS 2Q21 $5.49 billion 2Q21 $15.02 2Q21 $15.39 billion 2Q21 YTD $12.32 billion 2Q21 YTD $33.64 2Q21 YTD $33.09 billion 1 1 Annualized ROE Annualized ROTE Book Value 2Q21 23.7% 2Q21 25.1% BVPS $264.90 2Q21 YTD 27.3% 2Q21 YTD 28.9% YTD Growth 12.2% Highlights Second highest firmwide quarterly net revenues, net earnings & EPS Record Consumer & Wealth Management net revenues 2 3,4 #1 in M&A and Equity and equity-related offerings Record Firmwide AUS 3 Record Investment Banking backlog Record Firmwide Management and other fees Dividend increase of 60% to Record Asset Management net revenues $2.00 per common share beginning in 3Q21 1Results Snapshot Net Revenues Net Earnings EPS 2Q21 $5.49 billion 2Q21 $15.02 2Q21 $15.39 billion 2Q21 YTD $12.32 billion 2Q21 YTD $33.64 2Q21 YTD $33.09 billion 1 1 Annualized ROE Annualized ROTE Book Value 2Q21 23.7% 2Q21 25.1% BVPS $264.90 2Q21 YTD 27.3% 2Q21 YTD 28.9% YTD Growth 12.2% Highlights Second highest firmwide quarterly net revenues, net earnings & EPS Record Consumer & Wealth Management net revenues 2 3,4 #1 in M&A and Equity and equity-related offerings Record Firmwide AUS 3 Record Investment Banking backlog Record Firmwide Management and other fees Dividend increase of 60% to Record Asset Management net revenues $2.00 per common share beginning in 3Q21 1
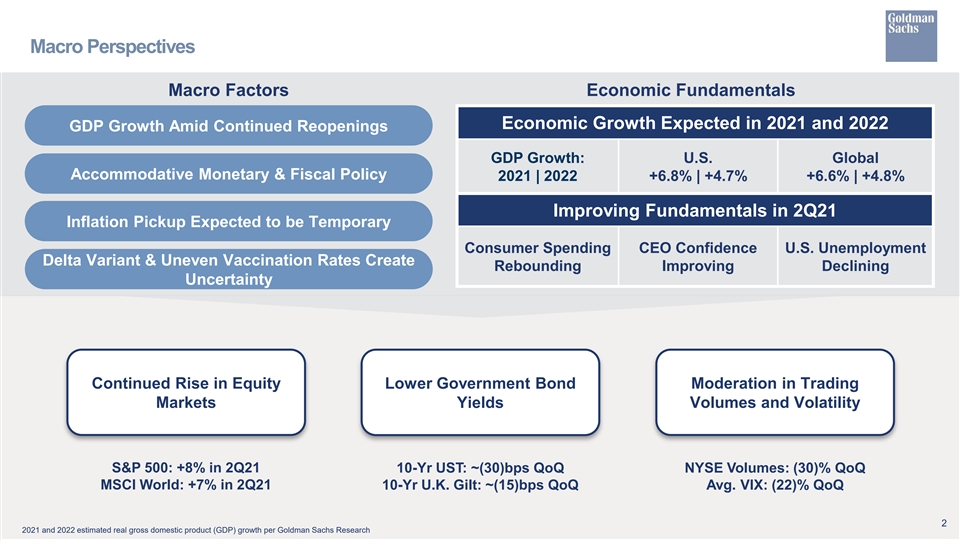
Macro Perspectives Macro Factors Economic Fundamentals Economic Growth Expected in 2021 and 2022 GDP Growth Amid Continued Reopenings GDP Growth: U.S. Global Accommodative Monetary & Fiscal Policy 2021 | 2022 +6.8% | +4.7% +6.6% | +4.8% Improving Fundamentals in 2Q21 Inflation Pickup Expected to be Temporary Consumer Spending CEO Confidence U.S. Unemployment Delta Variant & Uneven Vaccination Rates Create Rebounding Improving Declining Uncertainty Continued Rise in Equity Lower Government Bond Moderation in Trading Markets Yields Volumes and Volatility S&P 500: +8% in 2Q21 10-Yr UST: ~(30)bps QoQ NYSE Volumes: (30)% QoQ MSCI World: +7% in 2Q21 10-Yr U.K. Gilt: ~(15)bps QoQ Avg. VIX: (22)% QoQ 2 2021 and 2022 estimated real gross domestic product (GDP) growth per Goldman Sachs ResearchMacro Perspectives Macro Factors Economic Fundamentals Economic Growth Expected in 2021 and 2022 GDP Growth Amid Continued Reopenings GDP Growth: U.S. Global Accommodative Monetary & Fiscal Policy 2021 | 2022 +6.8% | +4.7% +6.6% | +4.8% Improving Fundamentals in 2Q21 Inflation Pickup Expected to be Temporary Consumer Spending CEO Confidence U.S. Unemployment Delta Variant & Uneven Vaccination Rates Create Rebounding Improving Declining Uncertainty Continued Rise in Equity Lower Government Bond Moderation in Trading Markets Yields Volumes and Volatility S&P 500: +8% in 2Q21 10-Yr UST: ~(30)bps QoQ NYSE Volumes: (30)% QoQ MSCI World: +7% in 2Q21 10-Yr U.K. Gilt: ~(15)bps QoQ Avg. VIX: (22)% QoQ 2 2021 and 2022 estimated real gross domestic product (GDP) growth per Goldman Sachs Research
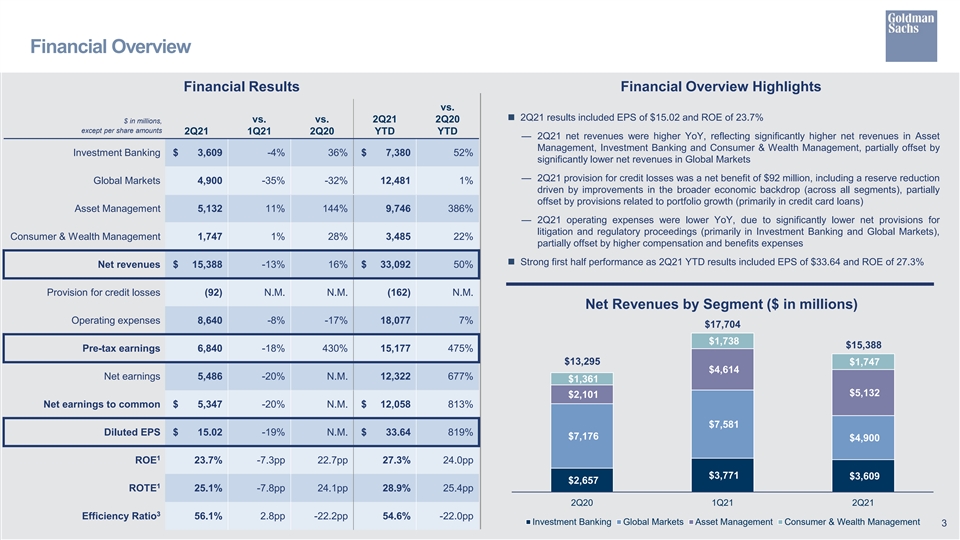
Financial Overview Financial Results Financial Overview Highlights vs. n 2Q21 results included EPS of $15.02 and ROE of 23.7% $ in millions, vs. vs. 2Q21 2Q20 except per share amounts 2Q21 1Q21 2Q20 YTD YTD — 2Q21 net revenues were higher YoY, reflecting significantly higher net revenues in Asset Management, Investment Banking and Consumer & Wealth Management, partially offset by Investment Banking $ 3,609 -4% 36% $ 7,380 52% significantly lower net revenues in Global Markets — 2Q21 provision for credit losses was a net benefit of $92 million, including a reserve reduction Global Markets 4,900 -35% -32% 12,481 1% driven by improvements in the broader economic backdrop (across all segments), partially offset by provisions related to portfolio growth (primarily in credit card loans) Asset Management 5,132 11% 144% 9,746 386% — 2Q21 operating expenses were lower YoY, due to significantly lower net provisions for litigation and regulatory proceedings (primarily in Investment Banking and Global Markets), Consumer & Wealth Management 1,747 1% 28% 3,485 22% partially offset by higher compensation and benefits expenses n Strong first half performance as 2Q21 YTD results included EPS of $33.64 and ROE of 27.3% Net revenues $ 15,388 -13% 16% $ 33,092 50% Provision for credit losses (92) N.M. N.M. (162) N.M. Net Revenues by Segment ($ in millions) Operating expenses 8,640 -8% -17% 18,077 7% $17,704 $1,738 $15,388 Pre-tax earnings 6,840 -18% 430% 15,177 475% $13,295 $1,747 $4,614 Net earnings 5,486 -20% N.M. 12,322 677% $1,361 $5,132 $2,101 Net earnings to common $ 5,347 -20% N.M. $ 12,058 813% $7,581 Diluted EPS $ 15.02 -19% N.M. $ 33.64 819% $7,176 $4,900 1 ROE 23.7% -7.3pp 22.7pp 27.3% 24.0pp $3,771 $3,609 $2,657 1 25.1% -7.8pp 24.1pp 28.9% 25.4pp ROTE 2Q20 1Q21 2Q21 3 Efficiency Ratio 56.1% 2.8pp -22.2pp 54.6% -22.0pp Investment Banking Global Markets Asset Management Consumer & Wealth Management 3Financial Overview Financial Results Financial Overview Highlights vs. n 2Q21 results included EPS of $15.02 and ROE of 23.7% $ in millions, vs. vs. 2Q21 2Q20 except per share amounts 2Q21 1Q21 2Q20 YTD YTD — 2Q21 net revenues were higher YoY, reflecting significantly higher net revenues in Asset Management, Investment Banking and Consumer & Wealth Management, partially offset by Investment Banking $ 3,609 -4% 36% $ 7,380 52% significantly lower net revenues in Global Markets — 2Q21 provision for credit losses was a net benefit of $92 million, including a reserve reduction Global Markets 4,900 -35% -32% 12,481 1% driven by improvements in the broader economic backdrop (across all segments), partially offset by provisions related to portfolio growth (primarily in credit card loans) Asset Management 5,132 11% 144% 9,746 386% — 2Q21 operating expenses were lower YoY, due to significantly lower net provisions for litigation and regulatory proceedings (primarily in Investment Banking and Global Markets), Consumer & Wealth Management 1,747 1% 28% 3,485 22% partially offset by higher compensation and benefits expenses n Strong first half performance as 2Q21 YTD results included EPS of $33.64 and ROE of 27.3% Net revenues $ 15,388 -13% 16% $ 33,092 50% Provision for credit losses (92) N.M. N.M. (162) N.M. Net Revenues by Segment ($ in millions) Operating expenses 8,640 -8% -17% 18,077 7% $17,704 $1,738 $15,388 Pre-tax earnings 6,840 -18% 430% 15,177 475% $13,295 $1,747 $4,614 Net earnings 5,486 -20% N.M. 12,322 677% $1,361 $5,132 $2,101 Net earnings to common $ 5,347 -20% N.M. $ 12,058 813% $7,581 Diluted EPS $ 15.02 -19% N.M. $ 33.64 819% $7,176 $4,900 1 ROE 23.7% -7.3pp 22.7pp 27.3% 24.0pp $3,771 $3,609 $2,657 1 25.1% -7.8pp 24.1pp 28.9% 25.4pp ROTE 2Q20 1Q21 2Q21 3 Efficiency Ratio 56.1% 2.8pp -22.2pp 54.6% -22.0pp Investment Banking Global Markets Asset Management Consumer & Wealth Management 3
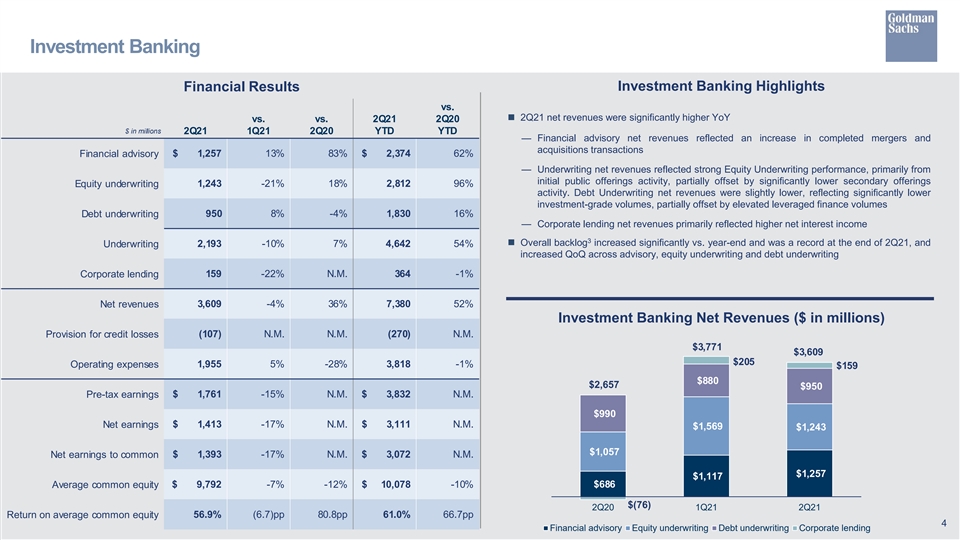
Investment Banking Financial Results Investment Banking Highlights vs. n 2Q21 net revenues were significantly higher YoY vs. vs. 2Q21 2Q20 $ in millions 2Q21 1Q21 2Q20 YTD YTD — Financial advisory net revenues reflected an increase in completed mergers and acquisitions transactions Financial advisory $ 1,257 13% 83% $ 2,374 62% — Underwriting net revenues reflected strong Equity Underwriting performance, primarily from initial public offerings activity, partially offset by significantly lower secondary offerings Equity underwriting 1,243 -21% 18% 2,812 96% activity. Debt Underwriting net revenues were slightly lower, reflecting significantly lower investment-grade volumes, partially offset by elevated leveraged finance volumes Debt underwriting 950 8% -4% 1,830 16% — Corporate lending net revenues primarily reflected higher net interest income 3 n Overall backlog increased significantly vs. year-end and was a record at the end of 2Q21, and Underwriting 2,193 -10% 7% 4,642 54% increased QoQ across advisory, equity underwriting and debt underwriting Corporate lending 159 -22% N.M. 364 -1% 3,609 -4% 36% 7,380 52% Net revenues Investment Banking Net Revenues ($ in millions) (107) N.M. N.M. (270) N.M. Provision for credit losses $3,771 $3,609 $205 1,955 5% -28% 3,818 -1% Operating expenses $159 $880 $2,657 $950 Pre-tax earnings $ 1,761 -15% N.M. $ 3,832 N.M. $990 Net earnings $ 1,413 -17% N.M. $ 3,111 N.M. $1,569 $1,243 $1,057 Net earnings to common $ 1,393 -17% N.M. $ 3,072 N.M. $1,257 $1,117 Average common equity $ 9,792 -7% -12% $ 10,078 -10% $686 $(76) 2Q20 1Q21 2Q21 Return on average common equity 56.9% (6.7)pp 80.8pp 61.0% 66.7pp 4 Financial advisory Equity underwriting Debt underwriting Corporate lendingInvestment Banking Financial Results Investment Banking Highlights vs. n 2Q21 net revenues were significantly higher YoY vs. vs. 2Q21 2Q20 $ in millions 2Q21 1Q21 2Q20 YTD YTD — Financial advisory net revenues reflected an increase in completed mergers and acquisitions transactions Financial advisory $ 1,257 13% 83% $ 2,374 62% — Underwriting net revenues reflected strong Equity Underwriting performance, primarily from initial public offerings activity, partially offset by significantly lower secondary offerings Equity underwriting 1,243 -21% 18% 2,812 96% activity. Debt Underwriting net revenues were slightly lower, reflecting significantly lower investment-grade volumes, partially offset by elevated leveraged finance volumes Debt underwriting 950 8% -4% 1,830 16% — Corporate lending net revenues primarily reflected higher net interest income 3 n Overall backlog increased significantly vs. year-end and was a record at the end of 2Q21, and Underwriting 2,193 -10% 7% 4,642 54% increased QoQ across advisory, equity underwriting and debt underwriting Corporate lending 159 -22% N.M. 364 -1% 3,609 -4% 36% 7,380 52% Net revenues Investment Banking Net Revenues ($ in millions) (107) N.M. N.M. (270) N.M. Provision for credit losses $3,771 $3,609 $205 1,955 5% -28% 3,818 -1% Operating expenses $159 $880 $2,657 $950 Pre-tax earnings $ 1,761 -15% N.M. $ 3,832 N.M. $990 Net earnings $ 1,413 -17% N.M. $ 3,111 N.M. $1,569 $1,243 $1,057 Net earnings to common $ 1,393 -17% N.M. $ 3,072 N.M. $1,257 $1,117 Average common equity $ 9,792 -7% -12% $ 10,078 -10% $686 $(76) 2Q20 1Q21 2Q21 Return on average common equity 56.9% (6.7)pp 80.8pp 61.0% 66.7pp 4 Financial advisory Equity underwriting Debt underwriting Corporate lending

Global Markets Financial Results Global Markets Highlights vs. vs. vs. 2Q21 2Q20n 2Q21 net revenues were significantly lower YoY compared with a very strong 2Q20, $ in millions corresponding with lower activity in FICC. The prior year period reflected heightened volatility 2Q21 1Q21 2Q20 YTD YTD and significant market dislocations FICC $ 2,320 -40% -45% $ 6,213 -14% n On a sequential basis, the 2Q21 operating environment was characterized by less favorable market-making conditions and more modest yet solid client activity levels 2,580 -30% -12% 6,268 22% Equities — During the quarter, volatility and interest rates were lower and equity prices were generally Net revenues 4,900 -35% -32% 12,481 1% higher Provision for credit losses 14 N.M. -92% (6) N.M. 3,373 -19% -35% 7,558 -6% Operating expenses Pre-tax earnings $ 1,513 -56% -17% $ 4,929 21% Global Markets Net Revenues ($ in millions) Net earnings $ 1,201 -57% 187% $ 4,002 64% $7,581 $7,176 $ 1,121 -59% 268% $ 3,851 70% Net earnings to common $2,941 $3,688 Average common equity $ 44,430 8% 4% $ 42,741 4% $4,900 Return on average common equity 10.1% (16.5)pp 7.2pp 18.0% 6.9pp $2,580 $4,235 $3,893 $2,320 2Q20 1Q21 2Q21 5 FICC EquitiesGlobal Markets Financial Results Global Markets Highlights vs. vs. vs. 2Q21 2Q20n 2Q21 net revenues were significantly lower YoY compared with a very strong 2Q20, $ in millions corresponding with lower activity in FICC. The prior year period reflected heightened volatility 2Q21 1Q21 2Q20 YTD YTD and significant market dislocations FICC $ 2,320 -40% -45% $ 6,213 -14% n On a sequential basis, the 2Q21 operating environment was characterized by less favorable market-making conditions and more modest yet solid client activity levels 2,580 -30% -12% 6,268 22% Equities — During the quarter, volatility and interest rates were lower and equity prices were generally Net revenues 4,900 -35% -32% 12,481 1% higher Provision for credit losses 14 N.M. -92% (6) N.M. 3,373 -19% -35% 7,558 -6% Operating expenses Pre-tax earnings $ 1,513 -56% -17% $ 4,929 21% Global Markets Net Revenues ($ in millions) Net earnings $ 1,201 -57% 187% $ 4,002 64% $7,581 $7,176 $ 1,121 -59% 268% $ 3,851 70% Net earnings to common $2,941 $3,688 Average common equity $ 44,430 8% 4% $ 42,741 4% $4,900 Return on average common equity 10.1% (16.5)pp 7.2pp 18.0% 6.9pp $2,580 $4,235 $3,893 $2,320 2Q20 1Q21 2Q21 5 FICC Equities
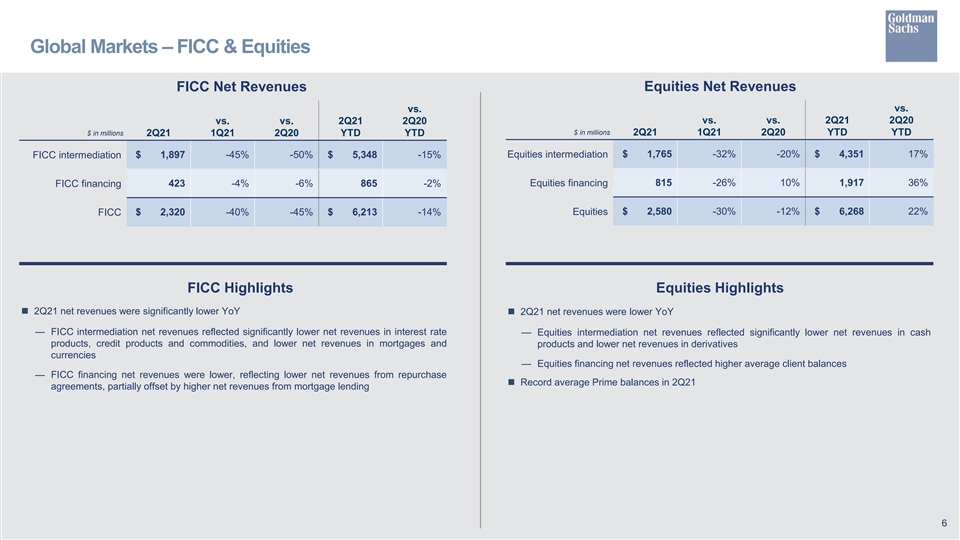
Global Markets – FICC & Equities FICC Net Revenues Equities Net Revenues vs. vs. vs. vs. 2Q21 2Q20 vs. vs. 2Q21 2Q20 $ in millions $ in millions 2Q21 1Q21 2Q20 YTD YTD 2Q21 1Q21 2Q20 YTD YTD $ 1,765 -32% -20% $ 4,351 17% FICC intermediation $ 1,897 -45% -50% $ 5,348 -15% Equities intermediation Equities financing 815 -26% 10% 1,917 36% FICC financing 423 -4% -6% 865 -2% $ 2,320 -40% -45% $ 6,213 -14% Equities $ 2,580 -30% -12% $ 6,268 22% FICC FICC Highlights Equities Highlights n 2Q21 net revenues were significantly lower YoY n 2Q21 net revenues were lower YoY — FICC intermediation net revenues reflected significantly lower net revenues in interest rate — Equities intermediation net revenues reflected significantly lower net revenues in cash products, credit products and commodities, and lower net revenues in mortgages and products and lower net revenues in derivatives currencies — Equities financing net revenues reflected higher average client balances — FICC financing net revenues were lower, reflecting lower net revenues from repurchase n Record average Prime balances in 2Q21 agreements, partially offset by higher net revenues from mortgage lending 6Global Markets – FICC & Equities FICC Net Revenues Equities Net Revenues vs. vs. vs. vs. 2Q21 2Q20 vs. vs. 2Q21 2Q20 $ in millions $ in millions 2Q21 1Q21 2Q20 YTD YTD 2Q21 1Q21 2Q20 YTD YTD $ 1,765 -32% -20% $ 4,351 17% FICC intermediation $ 1,897 -45% -50% $ 5,348 -15% Equities intermediation Equities financing 815 -26% 10% 1,917 36% FICC financing 423 -4% -6% 865 -2% $ 2,320 -40% -45% $ 6,213 -14% Equities $ 2,580 -30% -12% $ 6,268 22% FICC FICC Highlights Equities Highlights n 2Q21 net revenues were significantly lower YoY n 2Q21 net revenues were lower YoY — FICC intermediation net revenues reflected significantly lower net revenues in interest rate — Equities intermediation net revenues reflected significantly lower net revenues in cash products, credit products and commodities, and lower net revenues in mortgages and products and lower net revenues in derivatives currencies — Equities financing net revenues reflected higher average client balances — FICC financing net revenues were lower, reflecting lower net revenues from repurchase n Record average Prime balances in 2Q21 agreements, partially offset by higher net revenues from mortgage lending 6
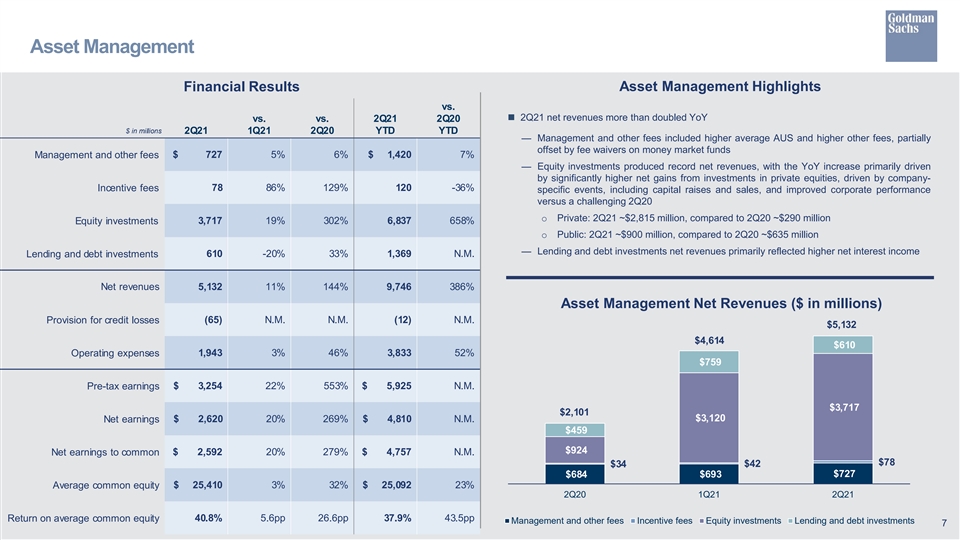
Asset Management Financial Results Asset Management Highlights vs. n 2Q21 net revenues more than doubled YoY vs. vs. 2Q21 2Q20 $ in millions 2Q21 1Q21 2Q20 YTD YTD — Management and other fees included higher average AUS and higher other fees, partially offset by fee waivers on money market funds Management and other fees $ 727 5% 6% $ 1,420 7% — Equity investments produced record net revenues, with the YoY increase primarily driven by significantly higher net gains from investments in private equities, driven by company- Incentive fees 78 86% 129% 120 -36% specific events, including capital raises and sales, and improved corporate performance versus a challenging 2Q20 o Private: 2Q21 ~$2,815 million, compared to 2Q20 ~$290 million Equity investments 3,717 19% 302% 6,837 658% o Public: 2Q21 ~$900 million, compared to 2Q20 ~$635 million — Lending and debt investments net revenues primarily reflected higher net interest income Lending and debt investments 610 -20% 33% 1,369 N.M. Net revenues 5,132 11% 144% 9,746 386% Asset Management Net Revenues ($ in millions) Provision for credit losses (65) N.M. N.M. (12) N.M. $5,132 $4,614 $610 1,943 3% 46% 3,833 52% Operating expenses $759 $ 3,254 22% 553% $ 5,925 N.M. Pre-tax earnings $3,717 $2,101 $3,120 $ 2,620 20% 269% $ 4,810 N.M. Net earnings $459 $924 $ 2,592 20% 279% $ 4,757 N.M. Net earnings to common $78 $34 $42 $727 $684 $693 $ 25,410 3% 32% $ 25,092 23% Average common equity 2Q20 1Q21 2Q21 40.8% 5.6pp 26.6pp 37.9% 43.5pp Return on average common equity Management and other fees Incentive fees Equity investments Lending and debt investments 7Asset Management Financial Results Asset Management Highlights vs. n 2Q21 net revenues more than doubled YoY vs. vs. 2Q21 2Q20 $ in millions 2Q21 1Q21 2Q20 YTD YTD — Management and other fees included higher average AUS and higher other fees, partially offset by fee waivers on money market funds Management and other fees $ 727 5% 6% $ 1,420 7% — Equity investments produced record net revenues, with the YoY increase primarily driven by significantly higher net gains from investments in private equities, driven by company- Incentive fees 78 86% 129% 120 -36% specific events, including capital raises and sales, and improved corporate performance versus a challenging 2Q20 o Private: 2Q21 ~$2,815 million, compared to 2Q20 ~$290 million Equity investments 3,717 19% 302% 6,837 658% o Public: 2Q21 ~$900 million, compared to 2Q20 ~$635 million — Lending and debt investments net revenues primarily reflected higher net interest income Lending and debt investments 610 -20% 33% 1,369 N.M. Net revenues 5,132 11% 144% 9,746 386% Asset Management Net Revenues ($ in millions) Provision for credit losses (65) N.M. N.M. (12) N.M. $5,132 $4,614 $610 1,943 3% 46% 3,833 52% Operating expenses $759 $ 3,254 22% 553% $ 5,925 N.M. Pre-tax earnings $3,717 $2,101 $3,120 $ 2,620 20% 269% $ 4,810 N.M. Net earnings $459 $924 $ 2,592 20% 279% $ 4,757 N.M. Net earnings to common $78 $34 $42 $727 $684 $693 $ 25,410 3% 32% $ 25,092 23% Average common equity 2Q20 1Q21 2Q21 40.8% 5.6pp 26.6pp 37.9% 43.5pp Return on average common equity Management and other fees Incentive fees Equity investments Lending and debt investments 7

Asset Management – Asset Mix 4 4 Equity Investments of $21 billion Lending and Debt Investments of $31 billion $17 Billion Private, $4 Billion Public 7% 13% 8% By Vintage By Region 29% 8% 42% 53% 2018-present Americas By Industry Loan Portfolio $16 billion 32% 26% 12% Loans 2015-2017 Asia 26% 21% $15 billion 2014 or earlier EMEA 19% Debt Investments 17% 87% Real Estate: Mixed Use 5%, Office 4%, Multifamily 3%, Other 5% 5 4 Consolidated Investment Entities of $18 billion 5 Funded with liabilities of ~$10 billion 3% 4% 4% 5% By Vintage By Region By Accounting By Region 7% 7% 25% Classification 35% 69% 63% 11% 46% 8% 10% 2018-present Americas Loans at FV Americas By Industry By Asset Class 29% 12% 41% 21% 2015-2017 Asia Loans at amortized cost Asia 14% 12% 48% 33% 2% 25% 2014 or earlier EMEA Debt investments at FV EMEA 24% 14% 15% 13% 8Asset Management – Asset Mix 4 4 Equity Investments of $21 billion Lending and Debt Investments of $31 billion $17 Billion Private, $4 Billion Public 7% 13% 8% By Vintage By Region 29% 8% 42% 53% 2018-present Americas By Industry Loan Portfolio $16 billion 32% 26% 12% Loans 2015-2017 Asia 26% 21% $15 billion 2014 or earlier EMEA 19% Debt Investments 17% 87% Real Estate: Mixed Use 5%, Office 4%, Multifamily 3%, Other 5% 5 4 Consolidated Investment Entities of $18 billion 5 Funded with liabilities of ~$10 billion 3% 4% 4% 5% By Vintage By Region By Accounting By Region 7% 7% 25% Classification 35% 69% 63% 11% 46% 8% 10% 2018-present Americas Loans at FV Americas By Industry By Asset Class 29% 12% 41% 21% 2015-2017 Asia Loans at amortized cost Asia 14% 12% 48% 33% 2% 25% 2014 or earlier EMEA Debt investments at FV EMEA 24% 14% 15% 13% 8
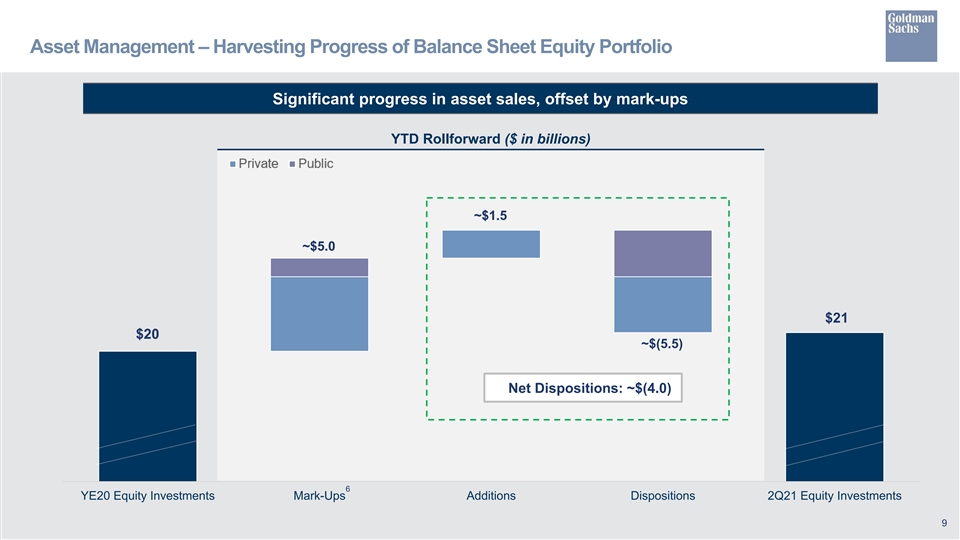
Asset Management – Harvesting Progress of Balance Sheet Equity Portfolio Significant progress in asset sales, offset by mark-ups YTD Rollforward ($ in billions) ~ ~$1. $1.5 5 ~ ~$5. $5.0 0 $21 $20 $20 ~$(5.5) Net Dispositions: ~$(4.0) 6 YE20 Equity Investments Mark-Ups Additions Dispositions 2Q21 Equity Investments 9Asset Management – Harvesting Progress of Balance Sheet Equity Portfolio Significant progress in asset sales, offset by mark-ups YTD Rollforward ($ in billions) ~ ~$1. $1.5 5 ~ ~$5. $5.0 0 $21 $20 $20 ~$(5.5) Net Dispositions: ~$(4.0) 6 YE20 Equity Investments Mark-Ups Additions Dispositions 2Q21 Equity Investments 9

Consumer & Wealth Management Financial Results Consumer & Wealth Management Highlights vs. n 2Q21 net revenues were a record and significantly higher YoY vs. vs. 2Q21 2Q20 $ in millions 2Q21 1Q21 2Q20 YTD YTD — Wealth management net revenues primarily reflected the impact of higher average AUS and higher loan balances $ 1,109 3% 18% $ 2,186 15% Management and other fees — Consumer banking net revenues reflected higher deposit and credit card balances Incentive fees 15 -42% 50% 41 -48% Private banking and lending 260 -2% 68% 524 55% 1,384 1% 25% 2,751 19% Wealth management Consumer banking 363 -2% 41% 734 36% Consumer & Wealth Management Net Revenues ($ in millions) Net revenues 1,747 1% 28% 3,485 22% $1,738 $1,747 Provision for credit losses 66 10% -79% 126 -74% $363 $371 $1,361 1,369 -9% 14% 2,868 17% Operating expenses $260 $258 $264 $15 $26 $155 Pre-tax earnings $ 312 74% N.M. $ 491 N.M. $10 Net earnings $ 252 71% N.M. $ 399 N.M. $1,109 $1,077 $938 Net earnings to common $ 241 76% N.M. $ 378 N.M. $ 10,459 2% 39% $ 10,335 42% Average common equity 2Q20 1Q21 2Q21 Return on average common equity 9.2% 3.9pp 16.1pp 7.3% 9.1pp Management and other fees Incentive fees Private banking and lending Consumer banking 10Consumer & Wealth Management Financial Results Consumer & Wealth Management Highlights vs. n 2Q21 net revenues were a record and significantly higher YoY vs. vs. 2Q21 2Q20 $ in millions 2Q21 1Q21 2Q20 YTD YTD — Wealth management net revenues primarily reflected the impact of higher average AUS and higher loan balances $ 1,109 3% 18% $ 2,186 15% Management and other fees — Consumer banking net revenues reflected higher deposit and credit card balances Incentive fees 15 -42% 50% 41 -48% Private banking and lending 260 -2% 68% 524 55% 1,384 1% 25% 2,751 19% Wealth management Consumer banking 363 -2% 41% 734 36% Consumer & Wealth Management Net Revenues ($ in millions) Net revenues 1,747 1% 28% 3,485 22% $1,738 $1,747 Provision for credit losses 66 10% -79% 126 -74% $363 $371 $1,361 1,369 -9% 14% 2,868 17% Operating expenses $260 $258 $264 $15 $26 $155 Pre-tax earnings $ 312 74% N.M. $ 491 N.M. $10 Net earnings $ 252 71% N.M. $ 399 N.M. $1,109 $1,077 $938 Net earnings to common $ 241 76% N.M. $ 378 N.M. $ 10,459 2% 39% $ 10,335 42% Average common equity 2Q20 1Q21 2Q21 Return on average common equity 9.2% 3.9pp 16.1pp 7.3% 9.1pp Management and other fees Incentive fees Private banking and lending Consumer banking 10

Asset Management and Consumer & Wealth Management Details 3,4 3,4 Firmwide Assets Under Supervision Highlights $ in billions 2Q21 1Q21 2Q20 n Firmwide AUS increased $101 billion during the quarter to a record $2.31 trillion, as Asset Management AUS increased $66 billion and Consumer & Wealth Management AUS increased Asset Management $ 1,633 $ 1,567 $ 1,499 $35 billion Consumer & Wealth Management 672 637 558 — Long-term net inflows of $22 billion, primarily driven by fixed income and alternative assets Firmwide AUS $ 2,305 $ 2,204 $ 2,057 — Liquidity products net inflows of $16 billion — Net market appreciation of $63 billion, primarily driven by equity and fixed income assets n Firmwide Management and other fees increased 13% YoY to a record $1.84 billion Firmwide Management and Other Fees/Incentive Fees 3,4 2Q21 AUS Mix vs. vs. vs. 2Q21 2Q20 9% $ in millions 2Q21 1Q21 2Q20 YTD YTD 29% $ 727 5% 6% $ 1,420 7% Asset Management 36% 40% 24% Asset Distribution 1,109 3% 18% 2,186 15% Consumer & Wealth Management Class Channel Total Management and other fees $ 1,836 4% 13% $ 3,606 12% 27% 35% Asset Management $ 78 86% 129% $ 120 -36% 15 -42% 50% 41 -48% Consumer & Wealth Management 8% 12% Total Incentive fees $ 93 37% 111% $ 161 -40% 14% Region Vehicle 33% 55% 78% 11Asset Management and Consumer & Wealth Management Details 3,4 3,4 Firmwide Assets Under Supervision Highlights $ in billions 2Q21 1Q21 2Q20 n Firmwide AUS increased $101 billion during the quarter to a record $2.31 trillion, as Asset Management AUS increased $66 billion and Consumer & Wealth Management AUS increased Asset Management $ 1,633 $ 1,567 $ 1,499 $35 billion Consumer & Wealth Management 672 637 558 — Long-term net inflows of $22 billion, primarily driven by fixed income and alternative assets Firmwide AUS $ 2,305 $ 2,204 $ 2,057 — Liquidity products net inflows of $16 billion — Net market appreciation of $63 billion, primarily driven by equity and fixed income assets n Firmwide Management and other fees increased 13% YoY to a record $1.84 billion Firmwide Management and Other Fees/Incentive Fees 3,4 2Q21 AUS Mix vs. vs. vs. 2Q21 2Q20 9% $ in millions 2Q21 1Q21 2Q20 YTD YTD 29% $ 727 5% 6% $ 1,420 7% Asset Management 36% 40% 24% Asset Distribution 1,109 3% 18% 2,186 15% Consumer & Wealth Management Class Channel Total Management and other fees $ 1,836 4% 13% $ 3,606 12% 27% 35% Asset Management $ 78 86% 129% $ 120 -36% 15 -42% 50% 41 -48% Consumer & Wealth Management 8% 12% Total Incentive fees $ 93 37% 111% $ 161 -40% 14% Region Vehicle 33% 55% 78% 11
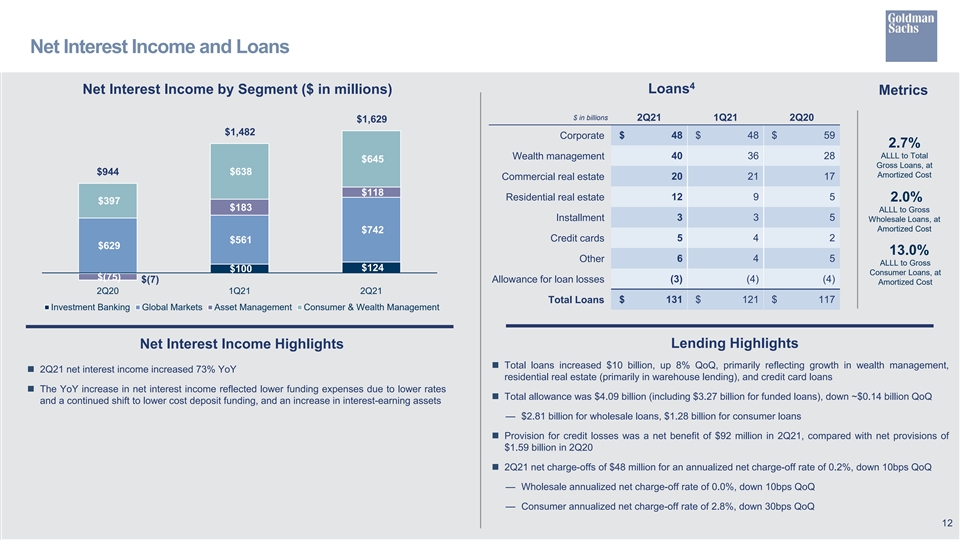
Net Interest Income and Loans 4 Loans Net Interest Income by Segment ($ in millions) Metrics $ in billions 2Q21 1Q21 2Q20 $1,629 $1,482 Corporate $ 48 $ 48 $ 59 2.7% 40 36 28 ALLL to Total Wealth management $645 Gross Loans, at $944 $638 Amortized Cost Commercial real estate 20 21 17 $118 12 9 5 Residential real estate 2.0% $397 $183 ALLL to Gross Installment 3 3 5 Wholesale Loans, at Amortized Cost $742 5 4 2 Credit cards $561 $629 13.0% Other 6 4 5 ALLL to Gross $124 $100 Consumer Loans, at $(75) (3) (4) (4) $(7) Allowance for loan losses Amortized Cost 2Q20 1Q21 2Q21 Total Loans $ 131 $ 121 $ 117 Investment Banking Global Markets Asset Management Consumer & Wealth Management Lending Highlights Net Interest Income Highlights n Total loans increased $10 billion, up 8% QoQ, primarily reflecting growth in wealth management, n 2Q21 net interest income increased 73% YoY residential real estate (primarily in warehouse lending), and credit card loans n The YoY increase in net interest income reflected lower funding expenses due to lower rates n Total allowance was $4.09 billion (including $3.27 billion for funded loans), down ~$0.14 billion QoQ and a continued shift to lower cost deposit funding, and an increase in interest-earning assets — $2.81 billion for wholesale loans, $1.28 billion for consumer loans n Provision for credit losses was a net benefit of $92 million in 2Q21, compared with net provisions of $1.59 billion in 2Q20 n 2Q21 net charge-offs of $48 million for an annualized net charge-off rate of 0.2%, down 10bps QoQ — Wholesale annualized net charge-off rate of 0.0%, down 10bps QoQ — Consumer annualized net charge-off rate of 2.8%, down 30bps QoQ 12Net Interest Income and Loans 4 Loans Net Interest Income by Segment ($ in millions) Metrics $ in billions 2Q21 1Q21 2Q20 $1,629 $1,482 Corporate $ 48 $ 48 $ 59 2.7% 40 36 28 ALLL to Total Wealth management $645 Gross Loans, at $944 $638 Amortized Cost Commercial real estate 20 21 17 $118 12 9 5 Residential real estate 2.0% $397 $183 ALLL to Gross Installment 3 3 5 Wholesale Loans, at Amortized Cost $742 5 4 2 Credit cards $561 $629 13.0% Other 6 4 5 ALLL to Gross $124 $100 Consumer Loans, at $(75) (3) (4) (4) $(7) Allowance for loan losses Amortized Cost 2Q20 1Q21 2Q21 Total Loans $ 131 $ 121 $ 117 Investment Banking Global Markets Asset Management Consumer & Wealth Management Lending Highlights Net Interest Income Highlights n Total loans increased $10 billion, up 8% QoQ, primarily reflecting growth in wealth management, n 2Q21 net interest income increased 73% YoY residential real estate (primarily in warehouse lending), and credit card loans n The YoY increase in net interest income reflected lower funding expenses due to lower rates n Total allowance was $4.09 billion (including $3.27 billion for funded loans), down ~$0.14 billion QoQ and a continued shift to lower cost deposit funding, and an increase in interest-earning assets — $2.81 billion for wholesale loans, $1.28 billion for consumer loans n Provision for credit losses was a net benefit of $92 million in 2Q21, compared with net provisions of $1.59 billion in 2Q20 n 2Q21 net charge-offs of $48 million for an annualized net charge-off rate of 0.2%, down 10bps QoQ — Wholesale annualized net charge-off rate of 0.0%, down 10bps QoQ — Consumer annualized net charge-off rate of 2.8%, down 30bps QoQ 12

Expenses Financial Results Expense Highlights vs. n 2Q21 total operating expenses decreased YoY vs. vs. 2Q21 2Q20 2Q21 1Q21 2Q20 YTD YTD $ in millions — Non-compensation expenses down 43%, reflecting: o Significantly lower net provisions for litigation and regulatory proceedings (net Compensation and benefits $ 5,263 -13% 18% $ 11,306 47% provisions were $226 million in 2Q21, compared with $2.96 billion in 2Q20) o Higher transaction based expenses Transaction based 1,125 -10% 11% 2,381 16% o Higher technology expenses — Compensation and benefits expenses up 18% (reflecting strong performance) Market development 115 44% 29% 195 -19% n 2Q21 YTD effective income tax rate was 18.8%, up from 18.0% for 1Q21, primarily due to a decrease in the impact of tax benefits on the settlement of employee share-based awards in Communications and technology 371 -1% 8% 746 12% the first half of 2021 compared with the first quarter of 2021 Depreciation and amortization 520 4% 4% 1,018 9% 3 Efficiency Ratio Occupancy 241 -2% 3% 488 4% 76.6% Professional fees 344 -4% 11% 704 7% +14.3pp 54.6% Other expenses 661 14% -81% 1,239 -70% +0.9pp Total operating expenses $ 8,640 -8% -17% $ 18,077 7% Provision for taxes $ 1,354 -10% 47% $ 2,855 171% Effective Tax Rate 18.8% -21.1pp 2Q20 YTD 2Q21 YTD Excluding Litigation Impact of Litigation 13Expenses Financial Results Expense Highlights vs. n 2Q21 total operating expenses decreased YoY vs. vs. 2Q21 2Q20 2Q21 1Q21 2Q20 YTD YTD $ in millions — Non-compensation expenses down 43%, reflecting: o Significantly lower net provisions for litigation and regulatory proceedings (net Compensation and benefits $ 5,263 -13% 18% $ 11,306 47% provisions were $226 million in 2Q21, compared with $2.96 billion in 2Q20) o Higher transaction based expenses Transaction based 1,125 -10% 11% 2,381 16% o Higher technology expenses — Compensation and benefits expenses up 18% (reflecting strong performance) Market development 115 44% 29% 195 -19% n 2Q21 YTD effective income tax rate was 18.8%, up from 18.0% for 1Q21, primarily due to a decrease in the impact of tax benefits on the settlement of employee share-based awards in Communications and technology 371 -1% 8% 746 12% the first half of 2021 compared with the first quarter of 2021 Depreciation and amortization 520 4% 4% 1,018 9% 3 Efficiency Ratio Occupancy 241 -2% 3% 488 4% 76.6% Professional fees 344 -4% 11% 704 7% +14.3pp 54.6% Other expenses 661 14% -81% 1,239 -70% +0.9pp Total operating expenses $ 8,640 -8% -17% $ 18,077 7% Provision for taxes $ 1,354 -10% 47% $ 2,855 171% Effective Tax Rate 18.8% -21.1pp 2Q20 YTD 2Q21 YTD Excluding Litigation Impact of Litigation 13
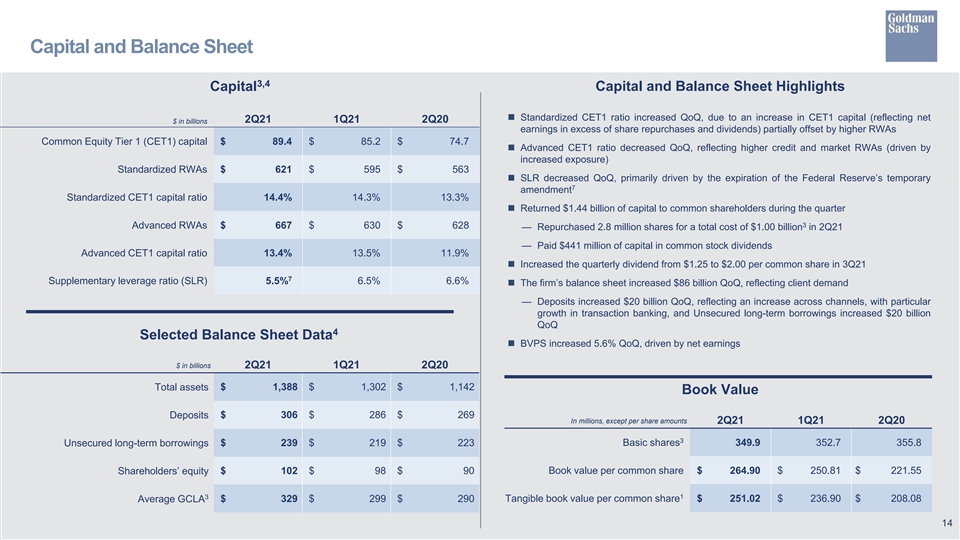
Capital and Balance Sheet 3,4 Capital Capital and Balance Sheet Highlights n Standardized CET1 ratio increased QoQ, due to an increase in CET1 capital (reflecting net 2Q21 1Q21 2Q20 $ in billions earnings in excess of share repurchases and dividends) partially offset by higher RWAs Common Equity Tier 1 (CET1) capital $ 89.4 $ 85.2 $ 74.7 n Advanced CET1 ratio decreased QoQ, reflecting higher credit and market RWAs (driven by increased exposure) Standardized RWAs $ 621 $ 595 $ 563 n SLR decreased QoQ, primarily driven by the expiration of the Federal Reserve’s temporary 7 amendment Standardized CET1 capital ratio 14.4% 14.3% 13.3% n Returned $1.44 billion of capital to common shareholders during the quarter 3 Advanced RWAs $ 667 $ 630 $ 628 — Repurchased 2.8 million shares for a total cost of $1.00 billion in 2Q21 — Paid $441 million of capital in common stock dividends Advanced CET1 capital ratio 13.4% 13.5% 11.9% n Increased the quarterly dividend from $1.25 to $2.00 per common share in 3Q21 7 Supplementary leverage ratio (SLR) 5.5% 6.5% 6.6% n The firm’s balance sheet increased $86 billion QoQ, reflecting client demand — Deposits increased $20 billion QoQ, reflecting an increase across channels, with particular growth in transaction banking, and Unsecured long-term borrowings increased $20 billion QoQ 4 Selected Balance Sheet Data n BVPS increased 5.6% QoQ, driven by net earnings $ in billions 2Q21 1Q21 2Q20 $ 1,388 $ 1,302 $ 1,142 Total assets Book Value $ 306 $ 286 $ 269 Deposits In millions, except per share amounts 2Q21 1Q21 2Q20 3 Unsecured long-term borrowings $ 239 $ 219 $ 223 Basic shares 349.9 352.7 355.8 Shareholders’ equity $ 102 $ 98 $ 90 Book value per common share $ 264.90 $ 250.81 $ 221.55 3 1 Average GCLA $ 329 $ 299 $ 290 Tangible book value per common share $ 251.02 $ 236.90 $ 208.08 14Capital and Balance Sheet 3,4 Capital Capital and Balance Sheet Highlights n Standardized CET1 ratio increased QoQ, due to an increase in CET1 capital (reflecting net 2Q21 1Q21 2Q20 $ in billions earnings in excess of share repurchases and dividends) partially offset by higher RWAs Common Equity Tier 1 (CET1) capital $ 89.4 $ 85.2 $ 74.7 n Advanced CET1 ratio decreased QoQ, reflecting higher credit and market RWAs (driven by increased exposure) Standardized RWAs $ 621 $ 595 $ 563 n SLR decreased QoQ, primarily driven by the expiration of the Federal Reserve’s temporary 7 amendment Standardized CET1 capital ratio 14.4% 14.3% 13.3% n Returned $1.44 billion of capital to common shareholders during the quarter 3 Advanced RWAs $ 667 $ 630 $ 628 — Repurchased 2.8 million shares for a total cost of $1.00 billion in 2Q21 — Paid $441 million of capital in common stock dividends Advanced CET1 capital ratio 13.4% 13.5% 11.9% n Increased the quarterly dividend from $1.25 to $2.00 per common share in 3Q21 7 Supplementary leverage ratio (SLR) 5.5% 6.5% 6.6% n The firm’s balance sheet increased $86 billion QoQ, reflecting client demand — Deposits increased $20 billion QoQ, reflecting an increase across channels, with particular growth in transaction banking, and Unsecured long-term borrowings increased $20 billion QoQ 4 Selected Balance Sheet Data n BVPS increased 5.6% QoQ, driven by net earnings $ in billions 2Q21 1Q21 2Q20 $ 1,388 $ 1,302 $ 1,142 Total assets Book Value $ 306 $ 286 $ 269 Deposits In millions, except per share amounts 2Q21 1Q21 2Q20 3 Unsecured long-term borrowings $ 239 $ 219 $ 223 Basic shares 349.9 352.7 355.8 Shareholders’ equity $ 102 $ 98 $ 90 Book value per common share $ 264.90 $ 250.81 $ 221.55 3 1 Average GCLA $ 329 $ 299 $ 290 Tangible book value per common share $ 251.02 $ 236.90 $ 208.08 14
Cautionary Note Regarding Forward-Looking Statements This presentation contains “forward-looking statements” within the meaning of the safe harbor provisions of the U.S. Private Securities Litigation Reform Act of 1995. Forward-looking statements are not historical facts or statements of current conditions, but instead represent only the firm’s beliefs regarding future events, many of which, by their nature, are inherently uncertain and outside of the firm’s control. It is possible that the firm’s actual results, financial condition and liquidity may differ, possibly materially, from the anticipated results, financial condition and liquidity in these forward-looking statements. For information about some of the risks and important factors that could affect the firm’s future results, financial condition and liquidity and the forward-looking statements below, see “Risk Factors” in Part I, Item 1A of the firm’s Annual Report on Form 10-K for the year ended December 31, 2020. Information regarding the firm’s assets under supervision, capital ratios, risk-weighted assets, supplementary leverage ratio, balance sheet data and global core liquid assets (GCLA) consists of preliminary estimates. These estimates are forward-looking statements and are subject to change, possibly materially, as the firm completes its financial statements. Statements regarding (i) estimated GDP growth and inflation trends, (ii) the impact of the COVID-19 pandemic on the firm’s business, results, financial position and liquidity, (iii) the timing, profitability, benefits and other prospective aspects of business initiatives and the achievability of medium- and long-term targets and goals, (iv) the future state of the firm’s liquidity and regulatory capital ratios, (v) the firm’s prospective capital distributions (including dividends and repurchases), (vi) the firm’s future effective income tax rate, (vii) the firm’s investment banking transaction backlog, and (viii) the firm’s planned 2021 debt benchmark issuances are forward-looking statements. Statements regarding estimated GDP growth and inflation trends are subject to the risk that actual GDP growth and inflation trends may differ, possibly materially, due to, among other things, changes in general economic conditions. Statements about the effects of the COVID-19 pandemic on the firm’s business, results, financial position and liquidity are subject to the risk that the actual impact may differ, possibly materially, from what is currently expected. Statements about the timing, profitability, benefits and other prospective aspects of business initiatives and the achievability of medium and long-term targets and goals are based on the firm’s current expectations regarding the firm’s ability to implement these initiatives and achieve these targets and goals and may change, possibly materially, from what is currently expected. Statements about the future state of the firm’s liquidity and regulatory capital ratios, as well as its prospective capital distributions, are subject to the risk that the firm’s actual liquidity, regulatory capital ratios and capital distributions may differ, possibly materially, from what is currently expected. Statements about the firm’s future effective income tax rate are subject to the risk that the firm’s future effective income tax rate may differ from the anticipated rate indicated, possibly materially, due to, among other things, changes in the tax rates applicable to the firm, the firm’s earnings mix or profitability, the entities in which the firm generates profits and the assumptions made in forecasting the firm’s expected tax rate, and potential future guidance from the U.S. IRS. Statements about the firm’s investment banking transaction backlog are subject to the risk that transactions may be modified or may not be completed at all and related net revenues may not be realized or may be materially less than expected. Important factors that could have such a result include, for underwriting transactions, a decline or weakness in general economic conditions, an outbreak of hostilities, volatility in the securities markets or an adverse development with respect to the issuer of the securities and, for financial advisory transactions, a decline in the securities markets, an inability to obtain adequate financing, an adverse development with respect to a party to the transaction or a failure to obtain a required regulatory approval. Statements regarding the firm’s planned 2021 debt benchmark issuances are subject to the risk that actual issuances may differ, possibly materially, due to changes in market conditions, business opportunities or the firm’s funding needs. 15Cautionary Note Regarding Forward-Looking Statements This presentation contains “forward-looking statements” within the meaning of the safe harbor provisions of the U.S. Private Securities Litigation Reform Act of 1995. Forward-looking statements are not historical facts or statements of current conditions, but instead represent only the firm’s beliefs regarding future events, many of which, by their nature, are inherently uncertain and outside of the firm’s control. It is possible that the firm’s actual results, financial condition and liquidity may differ, possibly materially, from the anticipated results, financial condition and liquidity in these forward-looking statements. For information about some of the risks and important factors that could affect the firm’s future results, financial condition and liquidity and the forward-looking statements below, see “Risk Factors” in Part I, Item 1A of the firm’s Annual Report on Form 10-K for the year ended December 31, 2020. Information regarding the firm’s assets under supervision, capital ratios, risk-weighted assets, supplementary leverage ratio, balance sheet data and global core liquid assets (GCLA) consists of preliminary estimates. These estimates are forward-looking statements and are subject to change, possibly materially, as the firm completes its financial statements. Statements regarding (i) estimated GDP growth and inflation trends, (ii) the impact of the COVID-19 pandemic on the firm’s business, results, financial position and liquidity, (iii) the timing, profitability, benefits and other prospective aspects of business initiatives and the achievability of medium- and long-term targets and goals, (iv) the future state of the firm’s liquidity and regulatory capital ratios, (v) the firm’s prospective capital distributions (including dividends and repurchases), (vi) the firm’s future effective income tax rate, (vii) the firm’s investment banking transaction backlog, and (viii) the firm’s planned 2021 debt benchmark issuances are forward-looking statements. Statements regarding estimated GDP growth and inflation trends are subject to the risk that actual GDP growth and inflation trends may differ, possibly materially, due to, among other things, changes in general economic conditions. Statements about the effects of the COVID-19 pandemic on the firm’s business, results, financial position and liquidity are subject to the risk that the actual impact may differ, possibly materially, from what is currently expected. Statements about the timing, profitability, benefits and other prospective aspects of business initiatives and the achievability of medium and long-term targets and goals are based on the firm’s current expectations regarding the firm’s ability to implement these initiatives and achieve these targets and goals and may change, possibly materially, from what is currently expected. Statements about the future state of the firm’s liquidity and regulatory capital ratios, as well as its prospective capital distributions, are subject to the risk that the firm’s actual liquidity, regulatory capital ratios and capital distributions may differ, possibly materially, from what is currently expected. Statements about the firm’s future effective income tax rate are subject to the risk that the firm’s future effective income tax rate may differ from the anticipated rate indicated, possibly materially, due to, among other things, changes in the tax rates applicable to the firm, the firm’s earnings mix or profitability, the entities in which the firm generates profits and the assumptions made in forecasting the firm’s expected tax rate, and potential future guidance from the U.S. IRS. Statements about the firm’s investment banking transaction backlog are subject to the risk that transactions may be modified or may not be completed at all and related net revenues may not be realized or may be materially less than expected. Important factors that could have such a result include, for underwriting transactions, a decline or weakness in general economic conditions, an outbreak of hostilities, volatility in the securities markets or an adverse development with respect to the issuer of the securities and, for financial advisory transactions, a decline in the securities markets, an inability to obtain adequate financing, an adverse development with respect to a party to the transaction or a failure to obtain a required regulatory approval. Statements regarding the firm’s planned 2021 debt benchmark issuances are subject to the risk that actual issuances may differ, possibly materially, due to changes in market conditions, business opportunities or the firm’s funding needs. 15
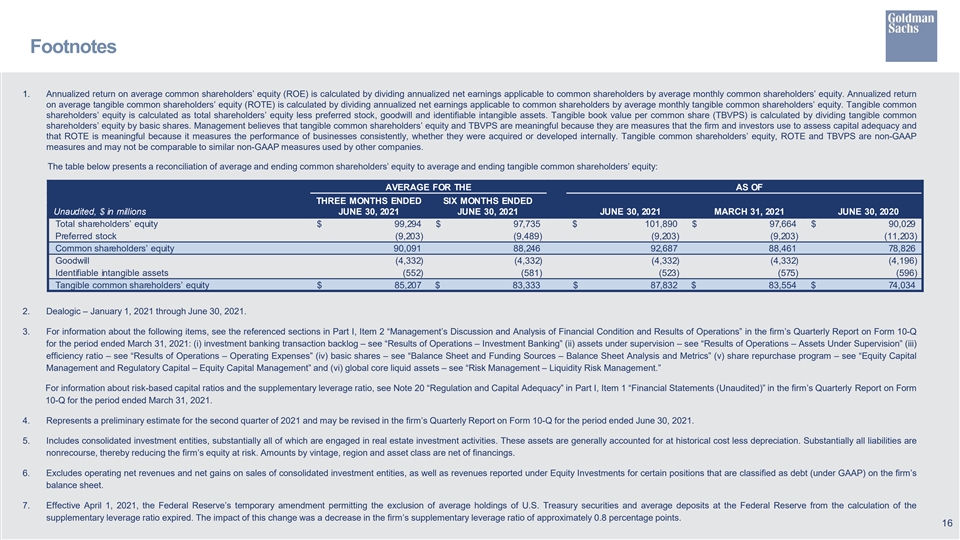
Footnotes 1. Annualized return on average common shareholders’ equity (ROE) is calculated by dividing annualized net earnings applicable to common shareholders by average monthly common shareholders’ equity. Annualized return on average tangible common shareholders’ equity (ROTE) is calculated by dividing annualized net earnings applicable to common shareholders by average monthly tangible common shareholders’ equity. Tangible common shareholders’ equity is calculated as total shareholders’ equity less preferred stock, goodwill and identifiable intangible assets. Tangible book value per common share (TBVPS) is calculated by dividing tangible common shareholders’ equity by basic shares. Management believes that tangible common shareholders’ equity and TBVPS are meaningful because they are measures that the firm and investors use to assess capital adequacy and that ROTE is meaningful because it measures the performance of businesses consistently, whether they were acquired or developed internally. Tangible common shareholders’ equity, ROTE and TBVPS are non-GAAP measures and may not be comparable to similar non-GAAP measures used by other companies. The table below presents a reconciliation of average and ending common shareholders’ equity to average and ending tangible common shareholders’ equity: AVERAGE FOR THE AS OF THREE MONTHS ENDED SIX MONTHS ENDED Unaudited, $ in millions JUNE 30, 2021 JUNE 30, 2021 JUNE 30, 2021 MARCH 31, 2021 JUNE 30, 2020 Total shareholders’ equity $ 99,294 $ 97,735 $ 101,890 $ 97,664 $ 90,029 Preferred stock (9,203) (9,489) (9,203) (9,203) (11,203) Common shareholders’ equity 90,091 88,246 92,687 88,461 78,826 Goodwill (4,332) (4,332) (4,332) (4,332) (4,196) Identifiable intangible assets (552) (581) (523) (575) (596) Tangible common shareholders’ equity $ 85,207 $ 83,333 $ 87,832 $ 83,554 $ 74,034 2. Dealogic – January 1, 2021 through June 30, 2021. 3. For information about the following items, see the referenced sections in Part I, Item 2 “Management’s Discussion and Analysis of Financial Condition and Results of Operations” in the firm’s Quarterly Report on Form 10-Q for the period ended March 31, 2021: (i) investment banking transaction backlog – see “Results of Operations – Investment Banking” (ii) assets under supervision – see “Results of Operations – Assets Under Supervision” (iii) efficiency ratio – see “Results of Operations – Operating Expenses” (iv) basic shares – see “Balance Sheet and Funding Sources – Balance Sheet Analysis and Metrics” (v) share repurchase program – see “Equity Capital Management and Regulatory Capital – Equity Capital Management” and (vi) global core liquid assets – see “Risk Management – Liquidity Risk Management.” For information about risk-based capital ratios and the supplementary leverage ratio, see Note 20 “Regulation and Capital Adequacy” in Part I, Item 1 “Financial Statements (Unaudited)” in the firm’s Quarterly Report on Form 10-Q for the period ended March 31, 2021. 4. Represents a preliminary estimate for the second quarter of 2021 and may be revised in the firm’s Quarterly Report on Form 10-Q for the period ended June 30, 2021. 5. Includes consolidated investment entities, substantially all of which are engaged in real estate investment activities. These assets are generally accounted for at historical cost less depreciation. Substantially all liabilities are nonrecourse, thereby reducing the firm’s equity at risk. Amounts by vintage, region and asset class are net of financings. 6. Excludes operating net revenues and net gains on sales of consolidated investment entities, as well as revenues reported under Equity Investments for certain positions that are classified as debt (under GAAP) on the firm’s balance sheet. 7. Effective April 1, 2021, the Federal Reserve’s temporary amendment permitting the exclusion of average holdings of U.S. Treasury securities and average deposits at the Federal Reserve from the calculation of the supplementary leverage ratio expired. The impact of this change was a decrease in the firm’s supplementary leverage ratio of approximately 0.8 percentage points. 16Footnotes 1. Annualized return on average common shareholders’ equity (ROE) is calculated by dividing annualized net earnings applicable to common shareholders by average monthly common shareholders’ equity. Annualized return on average tangible common shareholders’ equity (ROTE) is calculated by dividing annualized net earnings applicable to common shareholders by average monthly tangible common shareholders’ equity. Tangible common shareholders’ equity is calculated as total shareholders’ equity less preferred stock, goodwill and identifiable intangible assets. Tangible book value per common share (TBVPS) is calculated by dividing tangible common shareholders’ equity by basic shares. Management believes that tangible common shareholders’ equity and TBVPS are meaningful because they are measures that the firm and investors use to assess capital adequacy and that ROTE is meaningful because it measures the performance of businesses consistently, whether they were acquired or developed internally. Tangible common shareholders’ equity, ROTE and TBVPS are non-GAAP measures and may not be comparable to similar non-GAAP measures used by other companies. The table below presents a reconciliation of average and ending common shareholders’ equity to average and ending tangible common shareholders’ equity: AVERAGE FOR THE AS OF THREE MONTHS ENDED SIX MONTHS ENDED Unaudited, $ in millions JUNE 30, 2021 JUNE 30, 2021 JUNE 30, 2021 MARCH 31, 2021 JUNE 30, 2020 Total shareholders’ equity $ 99,294 $ 97,735 $ 101,890 $ 97,664 $ 90,029 Preferred stock (9,203) (9,489) (9,203) (9,203) (11,203) Common shareholders’ equity 90,091 88,246 92,687 88,461 78,826 Goodwill (4,332) (4,332) (4,332) (4,332) (4,196) Identifiable intangible assets (552) (581) (523) (575) (596) Tangible common shareholders’ equity $ 85,207 $ 83,333 $ 87,832 $ 83,554 $ 74,034 2. Dealogic – January 1, 2021 through June 30, 2021. 3. For information about the following items, see the referenced sections in Part I, Item 2 “Management’s Discussion and Analysis of Financial Condition and Results of Operations” in the firm’s Quarterly Report on Form 10-Q for the period ended March 31, 2021: (i) investment banking transaction backlog – see “Results of Operations – Investment Banking” (ii) assets under supervision – see “Results of Operations – Assets Under Supervision” (iii) efficiency ratio – see “Results of Operations – Operating Expenses” (iv) basic shares – see “Balance Sheet and Funding Sources – Balance Sheet Analysis and Metrics” (v) share repurchase program – see “Equity Capital Management and Regulatory Capital – Equity Capital Management” and (vi) global core liquid assets – see “Risk Management – Liquidity Risk Management.” For information about risk-based capital ratios and the supplementary leverage ratio, see Note 20 “Regulation and Capital Adequacy” in Part I, Item 1 “Financial Statements (Unaudited)” in the firm’s Quarterly Report on Form 10-Q for the period ended March 31, 2021. 4. Represents a preliminary estimate for the second quarter of 2021 and may be revised in the firm’s Quarterly Report on Form 10-Q for the period ended June 30, 2021. 5. Includes consolidated investment entities, substantially all of which are engaged in real estate investment activities. These assets are generally accounted for at historical cost less depreciation. Substantially all liabilities are nonrecourse, thereby reducing the firm’s equity at risk. Amounts by vintage, region and asset class are net of financings. 6. Excludes operating net revenues and net gains on sales of consolidated investment entities, as well as revenues reported under Equity Investments for certain positions that are classified as debt (under GAAP) on the firm’s balance sheet. 7. Effective April 1, 2021, the Federal Reserve’s temporary amendment permitting the exclusion of average holdings of U.S. Treasury securities and average deposits at the Federal Reserve from the calculation of the supplementary leverage ratio expired. The impact of this change was a decrease in the firm’s supplementary leverage ratio of approximately 0.8 percentage points. 16