
Exhibit 99.2 First Quarter 2023 Earnings Results Presentation April 18, 2023
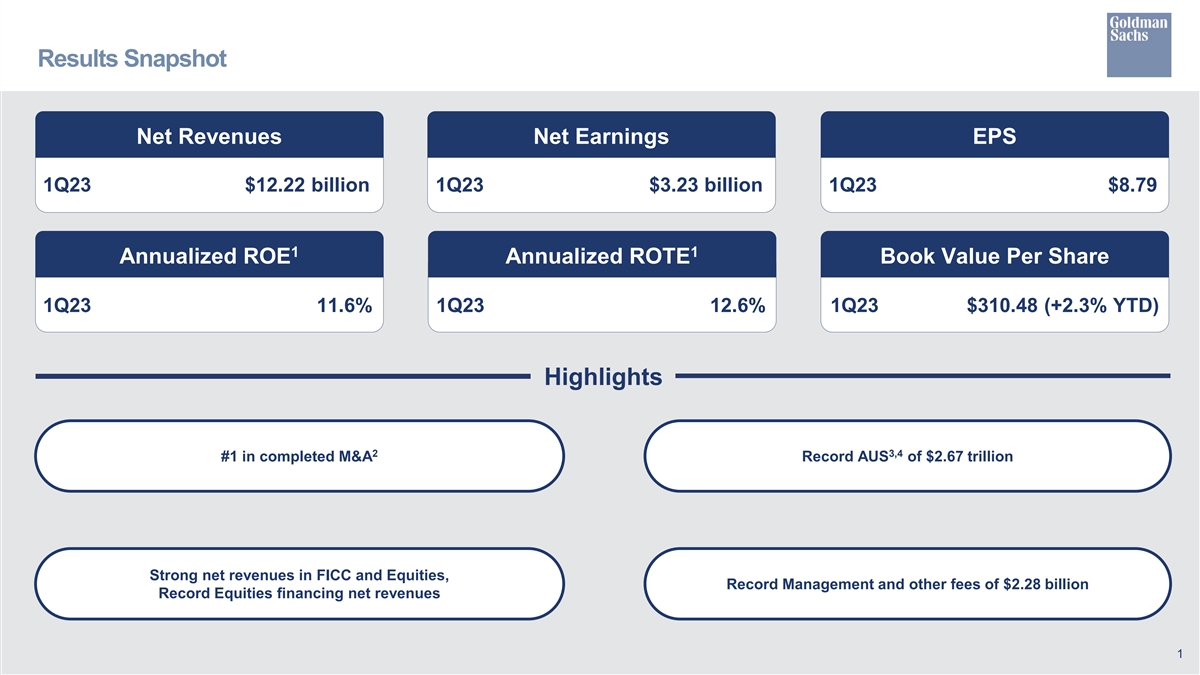
Results Snapshot Net Revenues Net Earnings EPS 1Q23 $12.22 billion 1Q23 $3.23 billion 1Q23 $8.79 1 1 Annualized ROE Annualized ROTE Book Value Per Share 1Q23 11.6% 1Q23 12.6% 1Q23 $310.48 (+2.3% YTD) Highlights 2 3,4 #1 in completed M&A Record AUS of $2.67 trillion Strong net revenues in FICC and Equities, Record Management and other fees of $2.28 billion Record Equities financing net revenues 1
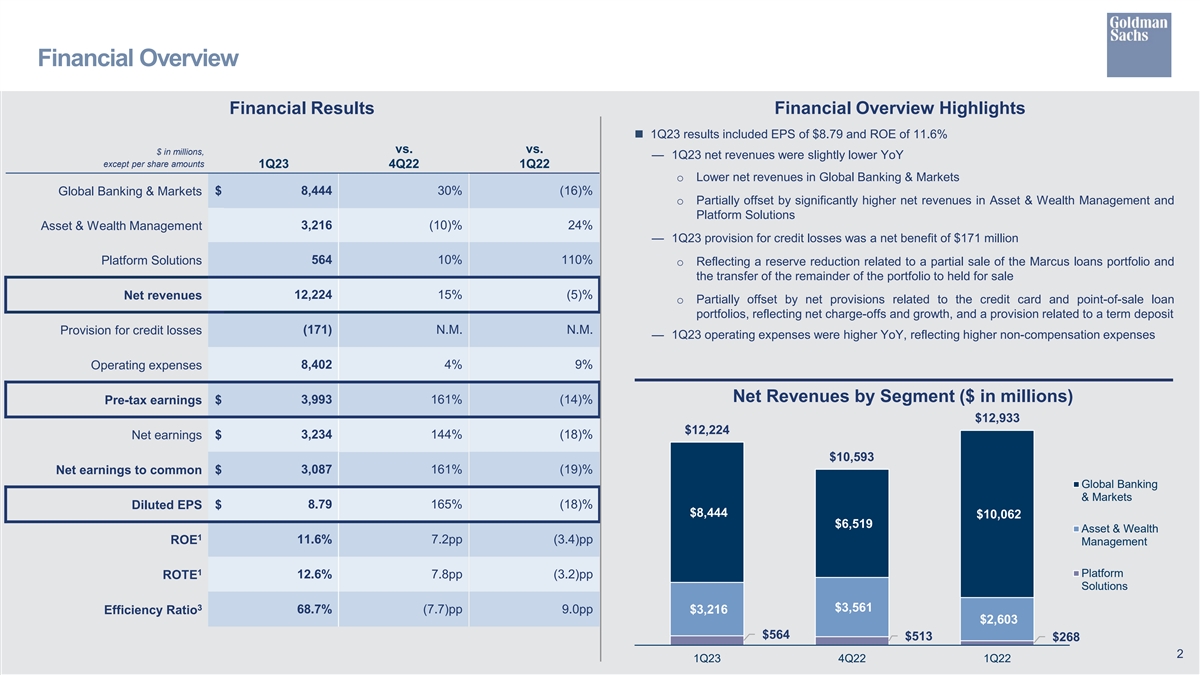
Financial Overview Financial Results Financial Overview Highlights n 1Q23 results included EPS of $8.79 and ROE of 11.6% vs. vs. $ in millions, — 1Q23 net revenues were slightly lower YoY except per share amounts 1Q23 4Q22 1Q22 o Lower net revenues in Global Banking & Markets $ 8,444 30% (16)% Global Banking & Markets o Partially offset by significantly higher net revenues in Asset & Wealth Management and Platform Solutions Asset & Wealth Management 3,216 (10)% 24% — 1Q23 provision for credit losses was a net benefit of $171 million 564 10% 110% Platform Solutions o Reflecting a reserve reduction related to a partial sale of the Marcus loans portfolio and the transfer of the remainder of the portfolio to held for sale 12,224 15% (5)% Net revenues o Partially offset by net provisions related to the credit card and point-of-sale loan portfolios, reflecting net charge-offs and growth, and a provision related to a term deposit (171) N.M. N.M. Provision for credit losses — 1Q23 operating expenses were higher YoY, reflecting higher non-compensation expenses 8,402 4% 9% Operating expenses Net Revenues by Segment ($ in millions) $ 3,993 161% (14)% Pre-tax earnings $12,933 $12,224 $ 3,234 144% (18)% Net earnings $10,593 $ 3,087 161% (19)% Net earnings to common Global Banking & Markets Diluted EPS $ 8.79 165% (18)% $8,444 $10,062 $6,519 Asset & Wealth 1 ROE 11.6% 7.2pp (3.4)pp Management 1 Platform ROTE 12.6% 7.8pp (3.2)pp Solutions 3 $3,561 68.7% (7.7)pp 9.0pp $3,216 Efficiency Ratio $2,603 $564 $513 $268 2 1Q23 4Q22 1Q22
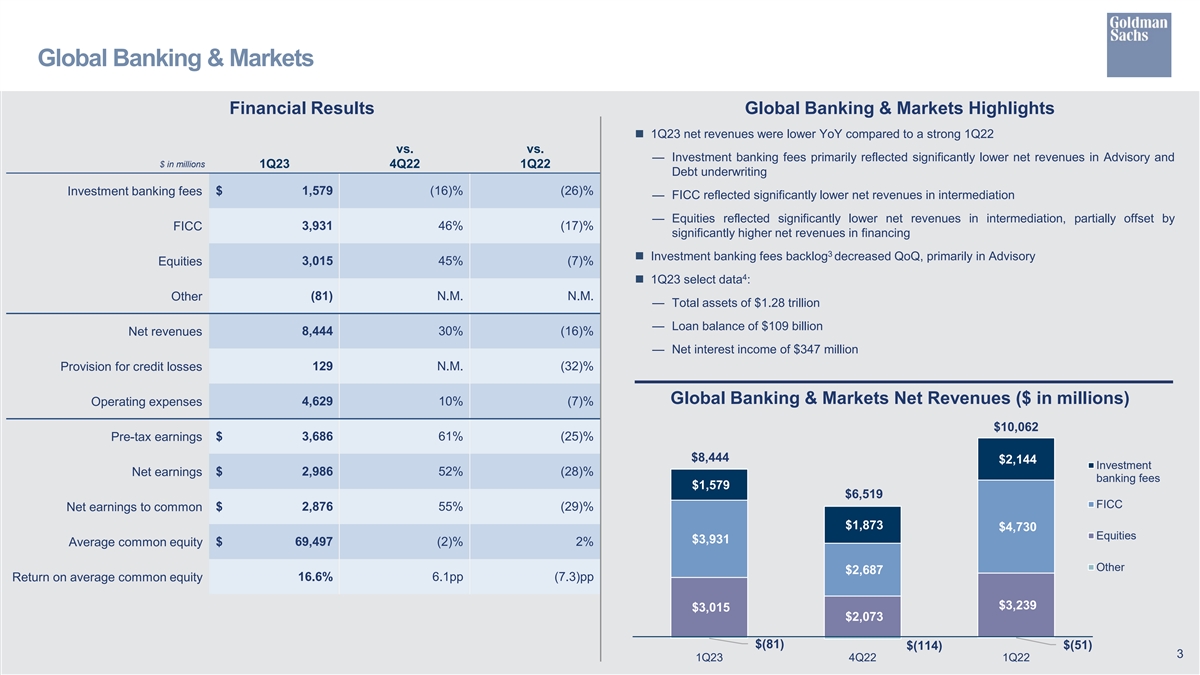
Global Banking & Markets Financial Results Global Banking & Markets Highlights n 1Q23 net revenues were lower YoY compared to a strong 1Q22 vs. vs. — Investment banking fees primarily reflected significantly lower net revenues in Advisory and $ in millions 1Q23 4Q22 1Q22 Debt underwriting Investment banking fees $ 1,579 (16)% (26)% — FICC reflected significantly lower net revenues in intermediation — Equities reflected significantly lower net revenues in intermediation, partially offset by FICC 3,931 46% (17)% significantly higher net revenues in financing 3 n Investment banking fees backlog decreased QoQ, primarily in Advisory 3,015 45% (7)% Equities 4 n 1Q23 select data : (81) N.M. N.M. Other — Total assets of $1.28 trillion — Loan balance of $109 billion 8,444 30% (16)% Net revenues — Net interest income of $347 million 129 N.M. (32)% Provision for credit losses Global Banking & Markets Net Revenues ($ in millions) Operating expenses 4,629 10% (7)% $10,062 Pre-tax earnings $ 3,686 61% (25)% $8,444 $2,144 Investment Net earnings $ 2,986 52% (28)% banking fees $1,579 $6,519 FICC Net earnings to common $ 2,876 55% (29)% $1,873 $4,730 Equities $3,931 Average common equity $ 69,497 (2)% 2% Other $2,687 Return on average common equity 16.6% 6.1pp (7.3)pp $3,239 $3,015 $2,073 $(81) $(114) $(51) 3 1Q23 4Q22 1Q22
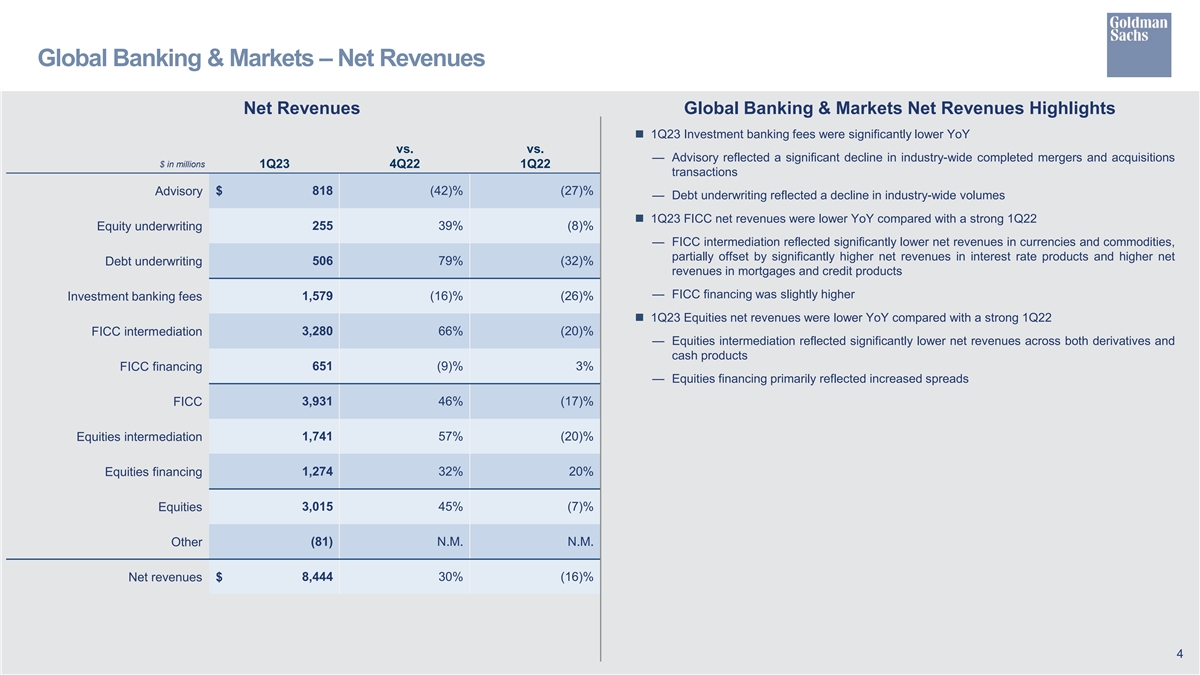
Global Banking & Markets – Net Revenues Net Revenues Global Banking & Markets Net Revenues Highlights n 1Q23 Investment banking fees were significantly lower YoY vs. vs. — Advisory reflected a significant decline in industry-wide completed mergers and acquisitions $ in millions 1Q23 4Q22 1Q22 transactions Advisory $ 818 (42)% (27)% — Debt underwriting reflected a decline in industry-wide volumes n 1Q23 FICC net revenues were lower YoY compared with a strong 1Q22 Equity underwriting 255 39% (8)% — FICC intermediation reflected significantly lower net revenues in currencies and commodities, partially offset by significantly higher net revenues in interest rate products and higher net 506 79% (32)% Debt underwriting revenues in mortgages and credit products — FICC financing was slightly higher 1,579 (16)% (26)% Investment banking fees n 1Q23 Equities net revenues were lower YoY compared with a strong 1Q22 3,280 66% (20)% FICC intermediation — Equities intermediation reflected significantly lower net revenues across both derivatives and cash products 651 (9)% 3% FICC financing — Equities financing primarily reflected increased spreads FICC 3,931 46% (17)% Equities intermediation 1,741 57% (20)% Equities financing 1,274 32% 20% Equities 3,015 45% (7)% Other (81) N.M. N.M. Net revenues $ 8,444 30% (16)% 4
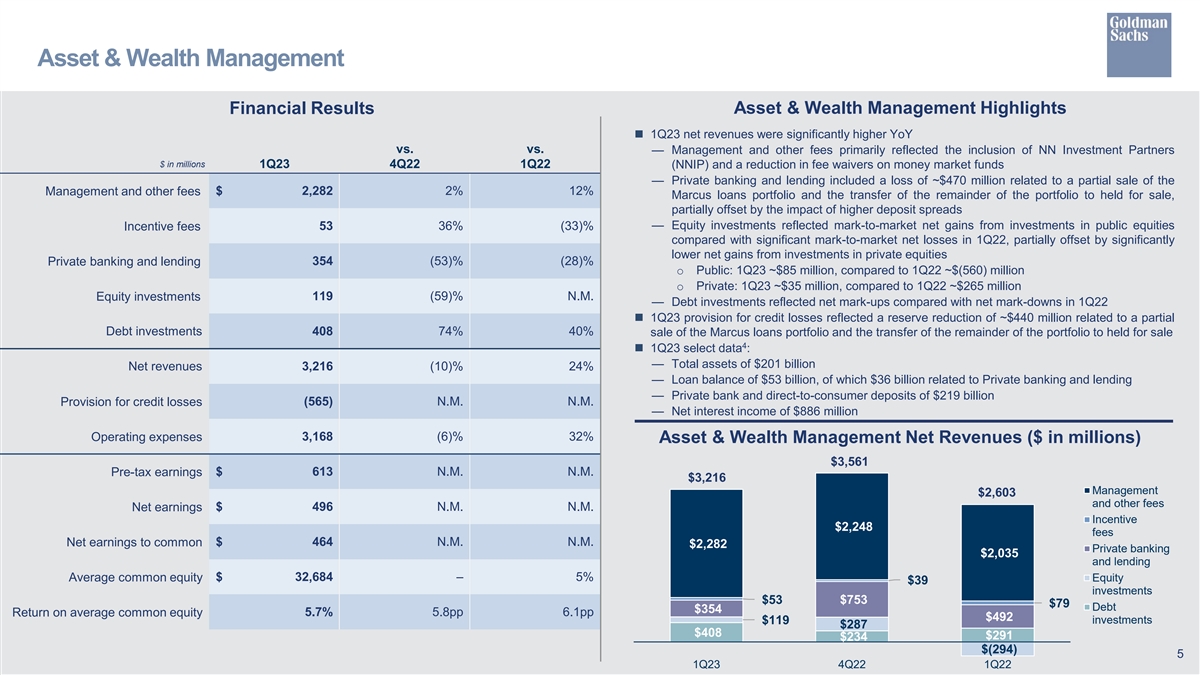
Asset & Wealth Management Financial Results Asset & Wealth Management Highlights n 1Q23 net revenues were significantly higher YoY vs. vs. — Management and other fees primarily reflected the inclusion of NN Investment Partners $ in millions 1Q23 4Q22 1Q22 (NNIP) and a reduction in fee waivers on money market funds — Private banking and lending included a loss of ~$470 million related to a partial sale of the $ 2,282 2% 12% Management and other fees Marcus loans portfolio and the transfer of the remainder of the portfolio to held for sale, partially offset by the impact of higher deposit spreads 53 36% (33)% — Equity investments reflected mark-to-market net gains from investments in public equities Incentive fees compared with significant mark-to-market net losses in 1Q22, partially offset by significantly lower net gains from investments in private equities 354 (53)% (28)% Private banking and lending o Public: 1Q23 ~$85 million, compared to 1Q22 ~$(560) million o Private: 1Q23 ~$35 million, compared to 1Q22 ~$265 million 119 (59)% N.M. Equity investments — Debt investments reflected net mark-ups compared with net mark-downs in 1Q22 n 1Q23 provision for credit losses reflected a reserve reduction of ~$440 million related to a partial Debt investments 408 74% 40% sale of the Marcus loans portfolio and the transfer of the remainder of the portfolio to held for sale 4 n 1Q23 select data : — Total assets of $201 billion Net revenues 3,216 (10)% 24% — Loan balance of $53 billion, of which $36 billion related to Private banking and lending — Private bank and direct-to-consumer deposits of $219 billion Provision for credit losses (565) N.M. N.M. — Net interest income of $886 million Operating expenses 3,168 (6)% 32% Asset & Wealth Management Net Revenues ($ in millions) $3,561 Pre-tax earnings $ 613 N.M. N.M. $3,216 Management $2,603 and other fees Net earnings $ 496 N.M. N.M. Incentive $2,248 fees Net earnings to common $ 464 N.M. N.M. $2,282 Private banking $2,035 and lending Average common equity $ 32,684 – 5% Equity $39 investments $53 $753 $79 Debt $354 Return on average common equity 5.7% 5.8pp 6.1pp $492 investments $119 $287 $408 $291 $234 $(294) 5 1Q23 4Q22 1Q22
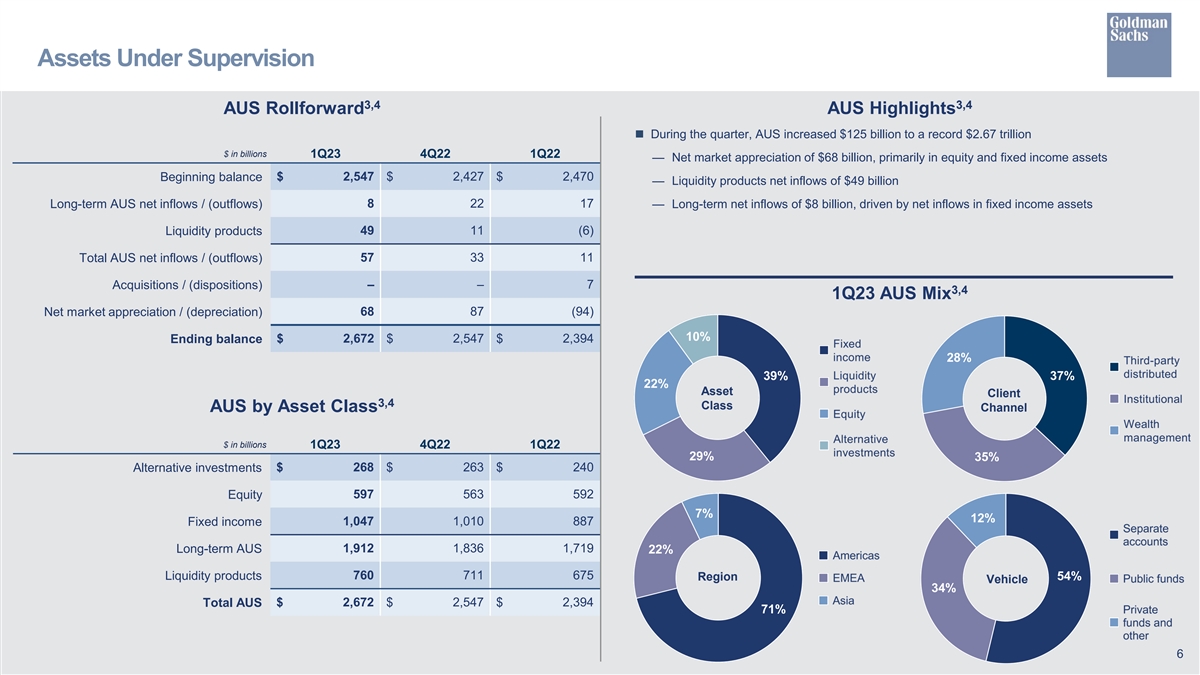
Assets Under Supervision 3,4 3,4 AUS Rollforward AUS Highlights n During the quarter, AUS increased $125 billion to a record $2.67 trillion $ in billions 1Q23 4Q22 1Q22 — Net market appreciation of $68 billion, primarily in equity and fixed income assets Beginning balance $ 2,547 $ 2,427 $ 2,470 — Liquidity products net inflows of $49 billion 8 22 17 Long-term AUS net inflows / (outflows) — Long-term net inflows of $8 billion, driven by net inflows in fixed income assets Liquidity products 49 11 (6) Total AUS net inflows / (outflows) 57 33 11 Acquisitions / (dispositions) – – 7 3,4 1Q23 AUS Mix Net market appreciation / (depreciation) 68 87 (94) 10% $ 2,672 $ 2,547 $ 2,394 Ending balance 28% 39% 37% 22% Asset Client 3,4 Class Channel AUS by Asset Class $ in billions 1Q23 4Q22 1Q22 29% 35% $ 268 $ 263 $ 240 Alternative investments Equity 597 563 592 7% 12% Fixed income 1,047 1,010 887 Long-term AUS 1,912 1,836 1,719 22% Liquidity products 760 711 675 54% Region Vehicle 34% $ 2,672 $ 2,547 $ 2,394 Total AUS 71% 6
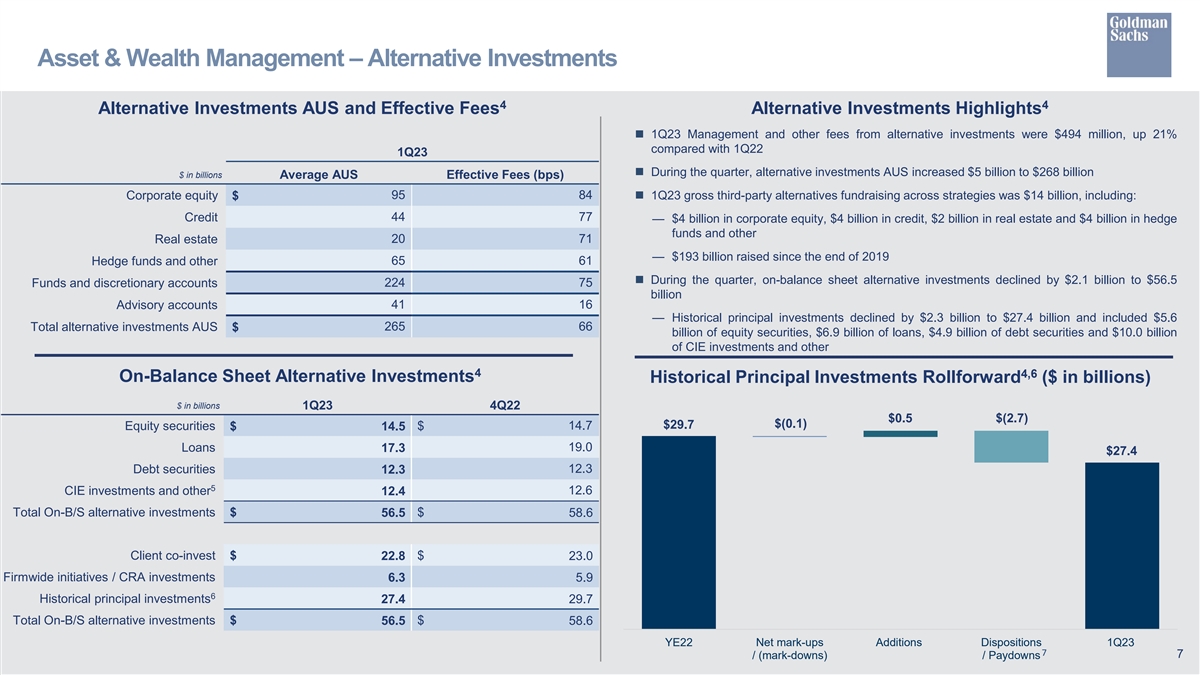
Asset & Wealth Management – Alternative Investments 4 4 Alternative Investments AUS and Effective Fees Alternative Investments Highlights n 1Q23 Management and other fees from alternative investments were $494 million, up 21% compared with 1Q22 1Q23 n During the quarter, alternative investments AUS increased $5 billion to $268 billion $ in billions Average AUS Effective Fees (bps) 95 84 Corporate equity $n 1Q23 gross third-party alternatives fundraising across strategies was $14 billion, including: Credit 44 77 — $4 billion in corporate equity, $4 billion in credit, $2 billion in real estate and $4 billion in hedge funds and other Real estate 20 71 — $193 billion raised since the end of 2019 Hedge funds and other 65 61 n During the quarter, on-balance sheet alternative investments declined by $2.1 billion to $56.5 Funds and discretionary accounts 224 75 billion Advisory accounts 41 16 — Historical principal investments declined by $2.3 billion to $27.4 billion and included $5.6 Total alternative investments AUS $ 265 66 billion of equity securities, $6.9 billion of loans, $4.9 billion of debt securities and $10.0 billion of CIE investments and other 4 4,6 On-Balance Sheet Alternative Investments Historical Principal Investments Rollforward ($ in billions) $ in billions 1Q23 4Q22 $0.5 $(2.7) $(0.1) $29.7 Equity securities $ 14.7 $ 14.5 19.0 Loans 17.3 $27.4 12.3 Debt securities 12.3 5 CIE investments and other 12.4 12.6 Total On-B/S alternative investments $ $ 56.5 58.6 Client co-invest $ 22.8 $ 23.0 Firmwide initiatives / CRA investments 6.3 5.9 6 Historical principal investments 27.4 29.7 Total On-B/S alternative investments $ 56.5 $ 58.6 YE22 Net mark-ups Additions Dispositions 1Q23 7 7 / (mark-downs) / Paydowns
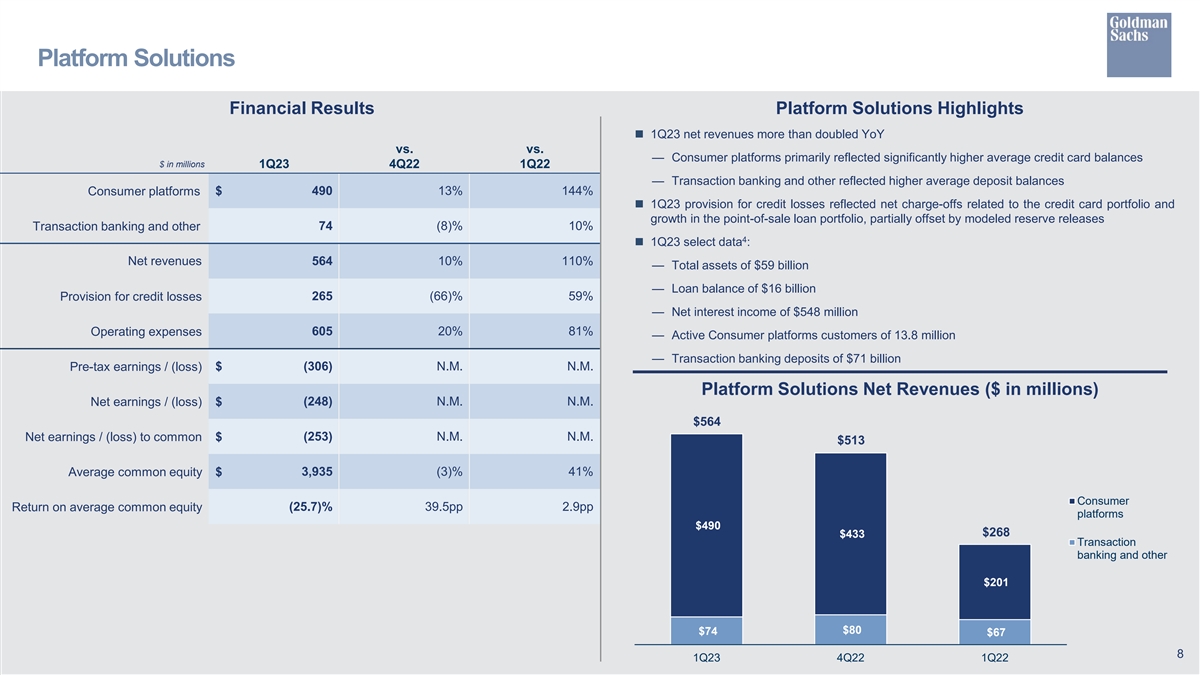
Platform Solutions Financial Results Platform Solutions Highlights n 1Q23 net revenues more than doubled YoY vs. vs. — Consumer platforms primarily reflected significantly higher average credit card balances $ in millions 1Q23 4Q22 1Q22 — Transaction banking and other reflected higher average deposit balances $ 490 13% 144% Consumer platforms n 1Q23 provision for credit losses reflected net charge-offs related to the credit card portfolio and growth in the point-of-sale loan portfolio, partially offset by modeled reserve releases 74 (8)% 10% Transaction banking and other 4 n 1Q23 select data : Net revenues 564 10% 110% — Total assets of $59 billion — Loan balance of $16 billion 265 (66)% 59% Provision for credit losses — Net interest income of $548 million 605 20% 81% Operating expenses — Active Consumer platforms customers of 13.8 million — Transaction banking deposits of $71 billion Pre-tax earnings / (loss) $ (306) N.M. N.M. Platform Solutions Net Revenues ($ in millions) Net earnings / (loss) $ (248) N.M. N.M. $564 Net earnings / (loss) to common $ (253) N.M. N.M. $513 Average common equity $ 3,935 (3)% 41% Consumer Return on average common equity (25.7)% 39.5pp 2.9pp platforms $490 $268 $433 Transaction banking and other $201 $80 $74 $67 8 1Q23 4Q22 1Q22
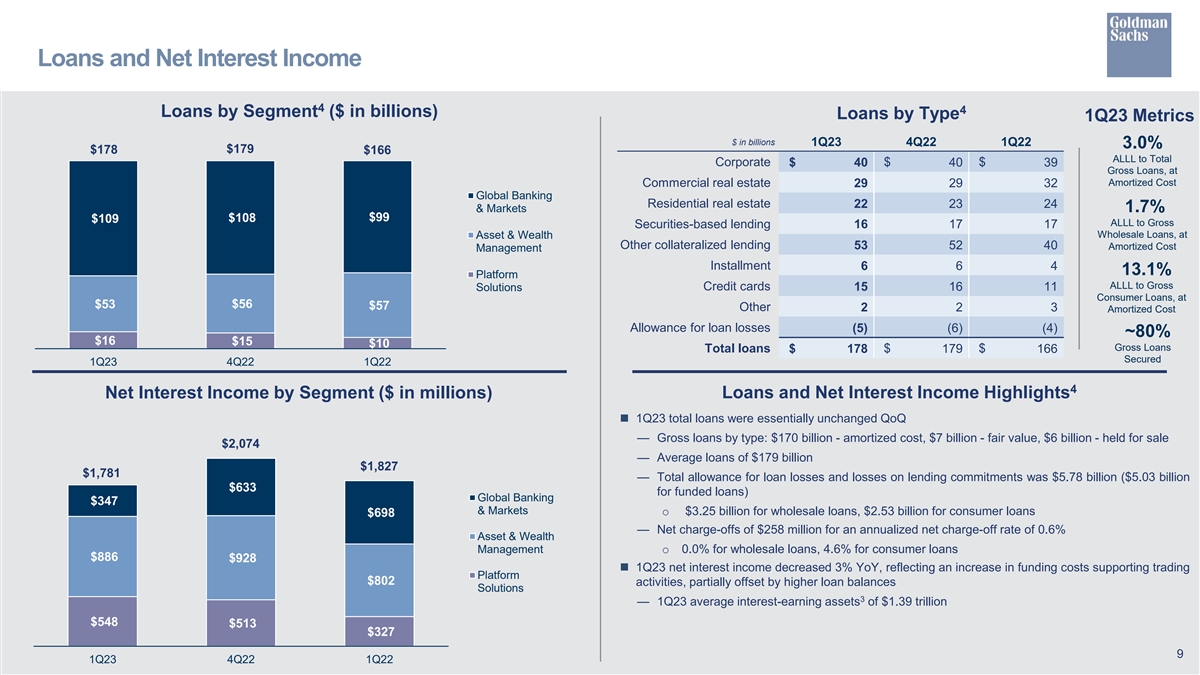
Loans and Net Interest Income 4 4 Loans by Segment ($ in billions) Loans by Type 1Q23 Metrics $ in billions 1Q23 4Q22 1Q22 3.0% $178 $179 $166 ALLL to Total Corporate $ 40 $ 40 $ 39 Gross Loans, at Amortized Cost Commercial real estate 29 29 32 Global Banking Residential real estate 22 23 24 & Markets 1.7% $99 $109 $108 ALLL to Gross Securities-based lending 16 17 17 Wholesale Loans, at Asset & Wealth Other collateralized lending 53 52 40 Amortized Cost Management Installment 6 6 4 13.1% Platform ALLL to Gross Credit cards Solutions 15 16 11 Consumer Loans, at $53 $56 $57 Other 2 2 3 Amortized Cost Allowance for loan losses (5) (6) (4) ~80% $16 $15 $10 Gross Loans Total loans $ 178 $ 179 $ 166 Secured 1Q23 4Q22 1Q22 4 Net Interest Income by Segment ($ in millions) Loans and Net Interest Income Highlights n 1Q23 total loans were essentially unchanged QoQ — Gross loans by type: $170 billion - amortized cost, $7 billion - fair value, $6 billion - held for sale $2,074 — Average loans of $179 billion $1,827 $1,781 — Total allowance for loan losses and losses on lending commitments was $5.78 billion ($5.03 billion $633 for funded loans) Global Banking $347 & Markets o $3.25 billion for wholesale loans, $2.53 billion for consumer loans $698 — Net charge-offs of $258 million for an annualized net charge-off rate of 0.6% Asset & Wealth Management o 0.0% for wholesale loans, 4.6% for consumer loans $886 $928 n 1Q23 net interest income decreased 3% YoY, reflecting an increase in funding costs supporting trading Platform $802 activities, partially offset by higher loan balances Solutions 3 — 1Q23 average interest-earning assets of $1.39 trillion $548 $513 $327 9 1Q23 4Q22 1Q22
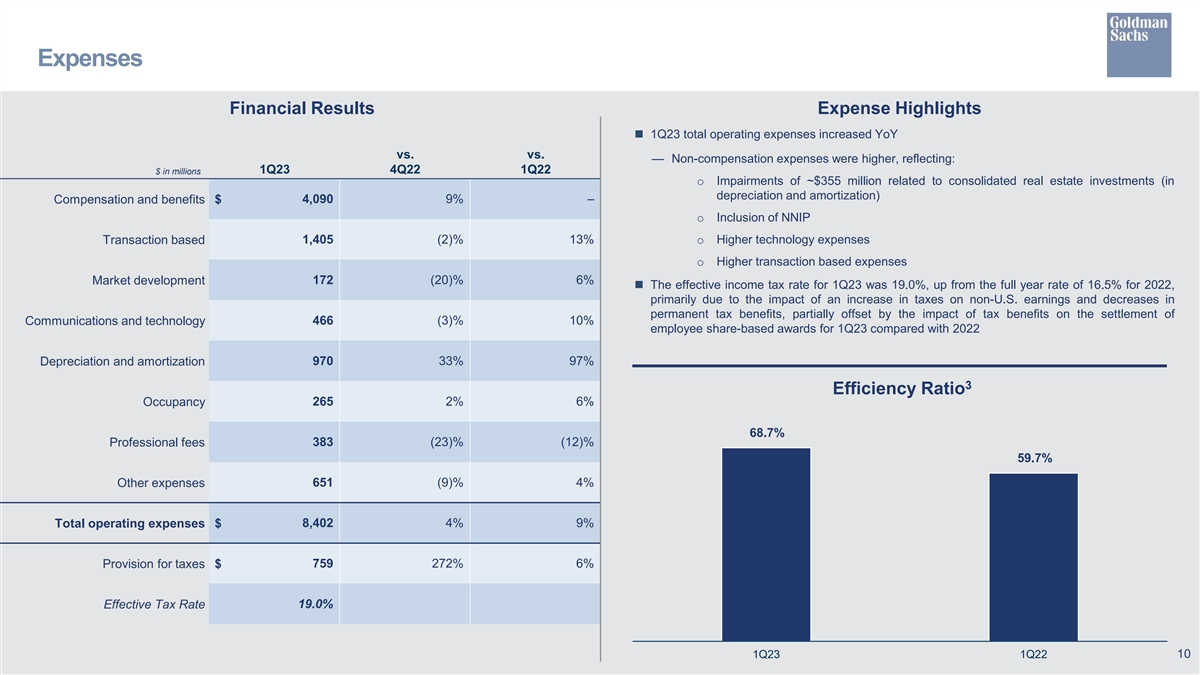
Expenses Financial Results Expense Highlights n 1Q23 total operating expenses increased YoY vs. vs. — Non-compensation expenses were higher, reflecting: 1Q23 4Q22 1Q22 $ in millions o Impairments of ~$355 million related to consolidated real estate investments (in depreciation and amortization) Compensation and benefits $ 4,090 9% – o Inclusion of NNIP Transaction based 1,405 (2)% 13% o Higher technology expenses o Higher transaction based expenses 172 (20)% 6% Market development n The effective income tax rate for 1Q23 was 19.0%, up from the full year rate of 16.5% for 2022, primarily due to the impact of an increase in taxes on non-U.S. earnings and decreases in permanent tax benefits, partially offset by the impact of tax benefits on the settlement of Communications and technology 466 (3)% 10% employee share-based awards for 1Q23 compared with 2022 970 33% 97% Depreciation and amortization 3 Efficiency Ratio Occupancy 265 2% 6% 68.7% Professional fees 383 (23)% (12)% 59.7% 651 (9)% 4% Other expenses Total operating expenses $ 8,402 4% 9% 759 272% 6% Provision for taxes $ Effective Tax Rate 19.0% 10 1Q23 1Q22
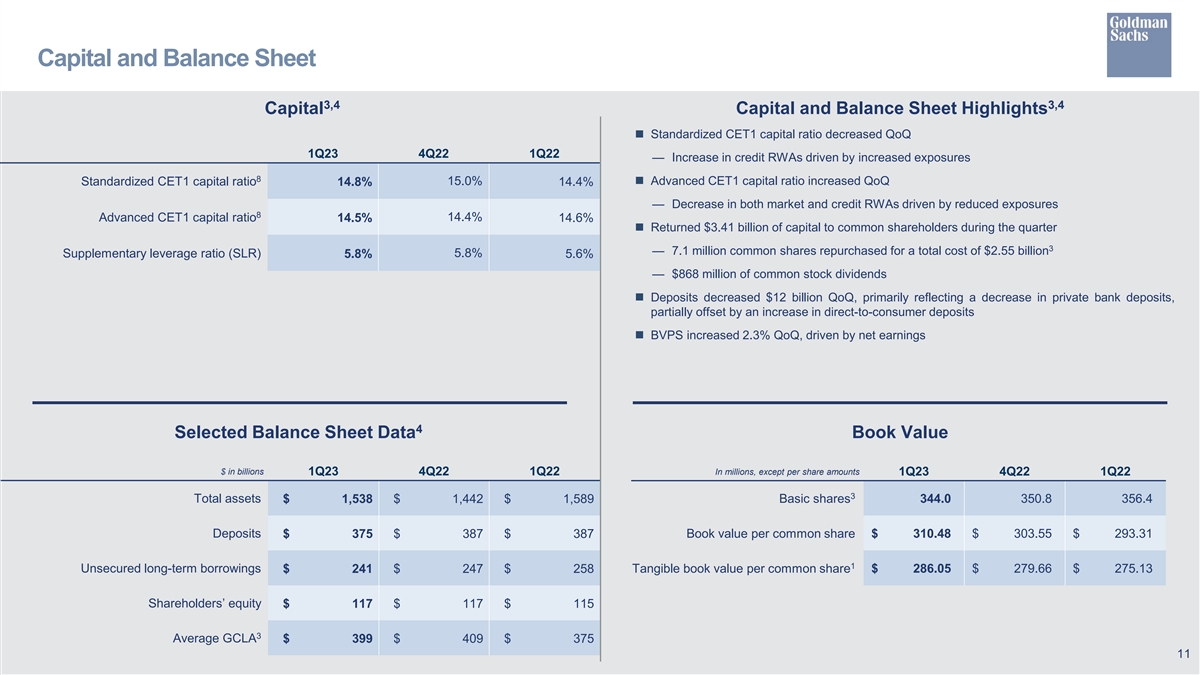
Capital and Balance Sheet 3,4 3,4 Capital Capital and Balance Sheet Highlights n Standardized CET1 capital ratio decreased QoQ 1Q23 4Q22 1Q22 — Increase in credit RWAs driven by increased exposures 8 15.0%n Advanced CET1 capital ratio increased QoQ Standardized CET1 capital ratio 14.8% 14.4% — Decrease in both market and credit RWAs driven by reduced exposures 8 Advanced CET1 capital ratio 14.4% 14.5% 14.6% n Returned $3.41 billion of capital to common shareholders during the quarter 3 — 7.1 million common shares repurchased for a total cost of $2.55 billion Supplementary leverage ratio (SLR) 5.8% 5.8% 5.6% — $868 million of common stock dividends n Deposits decreased $12 billion QoQ, primarily reflecting a decrease in private bank deposits, partially offset by an increase in direct-to-consumer deposits n BVPS increased 2.3% QoQ, driven by net earnings 4 Selected Balance Sheet Data Book Value $ in billions In millions, except per share amounts 1Q23 4Q22 1Q22 1Q23 4Q22 1Q22 3 Total assets Basic shares 344.0 350.8 356.4 $ 1,538 $ 1,442 $ 1, 589 Deposits Book value per common share $ 310.48 $ 303.55 $ 293.31 $ 375 $ 387 $ 387 1 Unsecured long-term borrowings Tangible book value per common share $ 286.05 $ 279.66 $ 275.13 $ 241 $ 247 $ 258 Shareholders’ equity $ 117 $ 117 $ 115 3 Average GCLA $ 399 $ 409 $ 375 11
Cautionary Note Regarding Forward-Looking Statements This presentation contains “forward-looking statements” within the meaning of the safe harbor provisions of the U.S. Private Securities Litigation Reform Act of 1995. Forward-looking statements are not historical facts or statements of current conditions, but instead represent only the firm’s beliefs regarding future events, many of which, by their nature, are inherently uncertain and outside of the firm’s control. It is possible that the firm’s actual results, financial condition and liquidity may differ, possibly materially, from the anticipated results, financial condition and liquidity in these forward-looking statements. For information about some of the risks and important factors that could affect the firm’s future results, financial condition and liquidity and the forward-looking statements below, see “Risk Factors” in Part I, Item 1A of the firm’s Annual Report on Form 10-K for the year ended December 31, 2022. Information regarding the firm’s assets under supervision, capital ratios, risk-weighted assets, supplementary leverage ratio, balance sheet data and global core liquid assets (GCLA) consists of preliminary estimates. These estimates are forward-looking statements and are subject to change, possibly materially, as the firm completes its financial statements. Statements regarding (i) estimated GDP growth or contraction, interest rate and inflation trends and volatility, (ii) the impact of the COVID-19 pandemic on the firm’s business, results, financial position and liquidity, (iii) the timing, profitability, benefits and other prospective aspects of business initiatives, business realignment and the achievability of medium- and long- term targets and goals, (iv) the future state of the firm’s liquidity and regulatory capital ratios (including the firm’s stress capital buffer and G-SIB buffer), (v) the firm’s prospective capital distributions (including dividends and repurchases), (vi) the firm’s future effective income tax rate, (vii) the firm’s Investment banking fees backlog and future results, (viii) the firm’s planned 2023 benchmark debt issuances, and (ix) the impact of Russia’s invasion of Ukraine and related sanctions and other developments on the firm’s business, results and financial position, are forward-looking statements. Statements regarding estimated GDP growth or contraction, interest rate and inflation trends and volatility are subject to the risk that actual GDP growth or contraction, interest rate and inflation trends and volatility may differ, possibly materially, due to, among other things, changes in general economic conditions and monetary and fiscal policy. Statements about the effects of the COVID-19 pandemic on the firm’s business, results, financial position and liquidity are subject to the risk that the actual impact may differ, possibly materially, from what is currently expected. Statements about the timing, profitability, benefits and other prospective aspects of business initiatives, business realignment and the achievability of medium- and long-term targets and goals are based on the firm’s current expectations regarding the firm’s ability to effectively implement these initiatives and realignment and achieve these targets and goals and may change, possibly materially, from what is currently expected. Statements about the future state of the firm’s liquidity and regulatory capital ratios (including the firm’s stress capital buffer and G-SIB buffer), as well as its prospective capital distributions, are subject to the risk that the firm’s actual liquidity, regulatory capital ratios and capital distributions may differ, possibly materially, from what is currently expected. Statements about the firm’s future effective income tax rate are subject to the risk that the firm’s future effective income tax rate may differ from the anticipated rate indicated, possibly materially, due to, among other things, changes in the tax rates applicable to the firm, the firm’s earnings mix or profitability, the entities in which the firm generates profits and the assumptions made in forecasting the firm’s expected tax rate, and potential future guidance from the U.S. IRS. Statements about the firm’s Investment banking fees backlog and future results are subject to the risk that transactions may be modified or may not be completed at all, and related net revenues may not be realized or may be materially less than expected. Important factors that could have such a result include, for underwriting transactions, a decline or weakness in general economic conditions, an outbreak or worsening of hostilities, including the escalation or continuation of the war between Russia and Ukraine, continuing volatility in the securities markets or an adverse development with respect to the issuer of the securities and, for financial advisory transactions, a decline in the securities markets, an inability to obtain adequate financing, an adverse development with respect to a party to the transaction or a failure to obtain a required regulatory approval. Statements regarding the firm’s planned 2023 benchmark debt issuances are subject to the risk that actual issuances may differ, possibly materially, due to changes in market conditions, business opportunities or the firm’s funding needs. Statements about the impact of Russia’s invasion of Ukraine and related sanctions and other developments on the firm’s business, results and financial position are subject to the risks that hostilities may escalate and expand, that sanctions may increase and that the actual impact may differ, possibly materially, from what is currently expected. 12
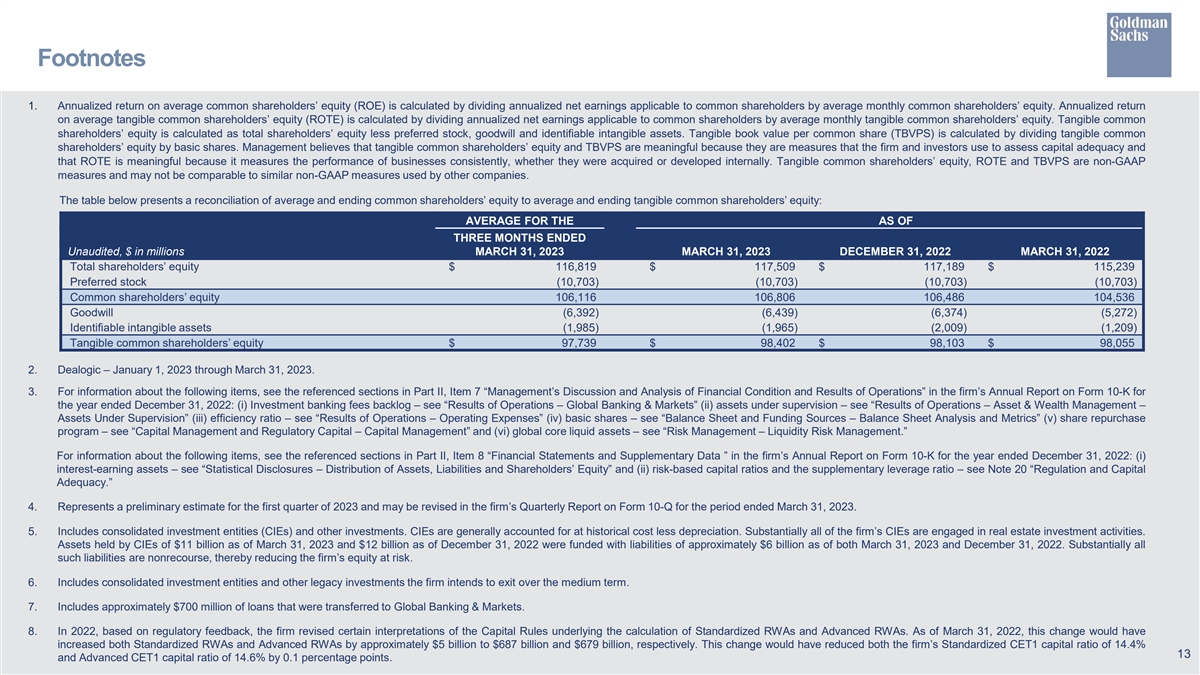
Footnotes 1. Annualized return on average common shareholders’ equity (ROE) is calculated by dividing annualized net earnings applicable to common shareholders by average monthly common shareholders’ equity. Annualized return on average tangible common shareholders’ equity (ROTE) is calculated by dividing annualized net earnings applicable to common shareholders by average monthly tangible common shareholders’ equity. Tangible common shareholders’ equity is calculated as total shareholders’ equity less preferred stock, goodwill and identifiable intangible assets. Tangible book value per common share (TBVPS) is calculated by dividing tangible common shareholders’ equity by basic shares. Management believes that tangible common shareholders’ equity and TBVPS are meaningful because they are measures that the firm and investors use to assess capital adequacy and that ROTE is meaningful because it measures the performance of businesses consistently, whether they were acquired or developed internally. Tangible common shareholders’ equity, ROTE and TBVPS are non-GAAP measures and may not be comparable to similar non-GAAP measures used by other companies. The table below presents a reconciliation of average and ending common shareholders’ equity to average and ending tangible common shareholders’ equity: AVERAGE FOR THE AS OF THREE MONTHS ENDED Unaudited, $ in millions MARCH 31, 2023 MARCH 31, 2023 DECEMBER 31, 2022 MARCH 31, 2022 Total shareholders’ equity $ 116,819 $ 117,509 $ 117,189 $ 115,239 Preferred stock (10,703) (10,703) (10,703) (10,703) Common shareholders’ equity 106,116 106,806 106,486 104,536 Goodwill (6,392) (6,439) (6,374) (5,272) Identifiable intangible assets (1,985) (1,965) (2,009) (1,209) Tangible common shareholders’ equity $ 97,739 $ 98,402 $ 98,103 $ 98,055 2. Dealogic – January 1, 2023 through March 31, 2023. 3. For information about the following items, see the referenced sections in Part II, Item 7 “Management’s Discussion and Analysis of Financial Condition and Results of Operations” in the firm’s Annual Report on Form 10-K for the year ended December 31, 2022: (i) Investment banking fees backlog – see “Results of Operations – Global Banking & Markets” (ii) assets under supervision – see “Results of Operations – Asset & Wealth Management – Assets Under Supervision” (iii) efficiency ratio – see “Results of Operations – Operating Expenses” (iv) basic shares – see “Balance Sheet and Funding Sources – Balance Sheet Analysis and Metrics” (v) share repurchase program – see “Capital Management and Regulatory Capital – Capital Management” and (vi) global core liquid assets – see “Risk Management – Liquidity Risk Management.” For information about the following items, see the referenced sections in Part II, Item 8 “Financial Statements and Supplementary Data ” in the firm’s Annual Report on Form 10-K for the year ended December 31, 2022: (i) interest-earning assets – see “Statistical Disclosures – Distribution of Assets, Liabilities and Shareholders’ Equity” and (ii) risk-based capital ratios and the supplementary leverage ratio – see Note 20 “Regulation and Capital Adequacy.” 4. Represents a preliminary estimate for the first quarter of 2023 and may be revised in the firm’s Quarterly Report on Form 10-Q for the period ended March 31, 2023. 5. Includes consolidated investment entities (CIEs) and other investments. CIEs are generally accounted for at historical cost less depreciation. Substantially all of the firm’s CIEs are engaged in real estate investment activities. Assets held by CIEs of $11 billion as of March 31, 2023 and $12 billion as of December 31, 2022 were funded with liabilities of approximately $6 billion as of both March 31, 2023 and December 31, 2022. Substantially all such liabilities are nonrecourse, thereby reducing the firm’s equity at risk. 6. Includes consolidated investment entities and other legacy investments the firm intends to exit over the medium term. 7. Includes approximately $700 million of loans that were transferred to Global Banking & Markets. 8. In 2022, based on regulatory feedback, the firm revised certain interpretations of the Capital Rules underlying the calculation of Standardized RWAs and Advanced RWAs. As of March 31, 2022, this change would have increased both Standardized RWAs and Advanced RWAs by approximately $5 billion to $687 billion and $679 billion, respectively. This change would have reduced both the firm’s Standardized CET1 capital ratio of 14.4% 13 and Advanced CET1 capital ratio of 14.6% by 0.1 percentage points.