October 2020 MOBU 5S ER Index Supplement Addendum to the MOBU 5S ER Index Supplement, the Prospectus Supplement and the Prospectus, each as may be amended from time to time, that form a part of Registration Statement No. 333-239610 | Filed Pursuant to Rule 424(b)(3) Registration Statement No. 333-239610 |
| GS Finance Corp. Medium-Term Notes, Series E | Medium-Term Notes, Series F guaranteed by The Goldman Sachs Group, Inc. |

GS Momentum Builder® Multi-Asset 5S ER Index |
The GS Momentum Builder® Multi-Asset 5S ER Index (the index) measures the extent to which the performance of the exchange-traded funds and a money market position (together with the ETFs, the underlying assets) included in the index outperform the sum of the return on the notional interest rate, which is a rate equal to 3-month USD LIBOR, plus 0.65% per annum (accruing daily). The money market position reflects the notional returns accruing to a hypothetical investor from an investment in a money market account denominated in U.S. dollars that accrues interest at the notional interest rate. The index rebalances on each index business day from among 15 underlying assets that have been categorized in the following asset classes: broad-based equities; fixed income; emerging markets; alternatives; commodities; inflation; and cash equivalent. The index attempts to track the positive price momentum in the underlying assets, subject to limitations on volatility and a minimum and maximum weight for each underlying asset and each asset class, each as described below.
Features of the index include:
● | daily rebalancing from among the 15 eligible underlying assets on each index business day (in this context, a base index rebalancing day) by calculating, for each day in the weight averaging period related to that base index rebalancing day, the combination of underlying assets that would have provided the highest historical return during three return look-back periods (nine months, six months and three months), subject to: |
| ● | a limit of 5% on the degree of variation in the daily closing prices or closing level, as applicable, of the aggregate of such underlying assets over the related realized volatility look-back periods (the prior six months, three months and one month for the nine-month, six-month and three-month return look-back periods, respectively); and |
| ● | a minimum and maximum weight for each underlying asset and each asset class; and |
● | the potential for daily total return index rebalancing into the money market position, based on whether the realized volatility of the underlying assets comprising the index exceeds the volatility cap of 6% for the applicable volatility cap period (the prior one month). |
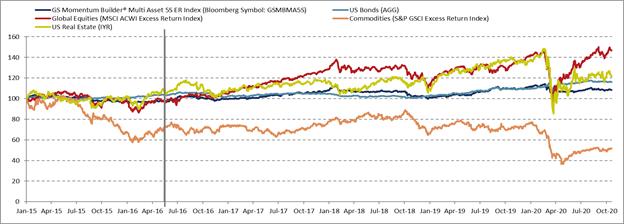
The following chart and table provide a comparison between the index (using historical information and hypothetical data, as explained below) and certain classes of assets (in each case, represented by a benchmark ETF or a benchmark index, which are distinct from the asset classes in which the 15 underlying assets have been categorized for purposes of this index) from January 1, 2015 to October 20, 2020.
|
Your investment in securities linked to the index involves certain risks. See “Selected Risk Factors” on page S-5 to read about investment risks relating to such securities.
Neither the Securities and Exchange Commission nor any other regulatory body has approved or disapproved of these securities or passed upon the accuracy or adequacy of this index supplement addendum, the applicable pricing supplement, the applicable product supplement, if any, the accompanying MOBU 5S ER index supplement, the accompanying prospectus supplement or the accompanying prospectus. Any representation to the contrary is a criminal offense.
The securities are not bank deposits and are not insured by the Federal Deposit Insurance Corporation or any other governmental agency, nor are they obligations of, or guaranteed by, a bank.
Goldman Sachs & Co. LLC
October 2020 MOBU 5S ER Index Supplement Addendum dated October 27, 2020.
GS Finance Corp. may use this index supplement addendum in the initial sale of the securities. In addition, Goldman Sachs & Co. LLC (GS&Co.), or any other affiliate of GS Finance Corp., may use this index supplement addendum in a market-making transaction in a security after its initial sale. Unless GS Finance Corp. or its agent informs the purchaser otherwise in the confirmation of sale, this index supplement addendum is being used in a market-making transaction.
About This Index Supplement Addendum This index supplement addendum constitutes a supplement to the documents listed below and therefore should be read in conjunction with such documents: ▪MOBU 5S ER index supplement no. 23 dated October 26, 2020 |
S-2
October 2020 MOBU 5S ER Index Supplement Addendum
Dated October 27, 2020
| ||||||
As of October 20, 2020 | GS Momentum Builder® Multi Asset 5S ER Index (Bloomberg Symbol: GSMBMA5S) | US Bonds (AGG) | Global Equities (MSCI ACWI Excess Return Index) | Commodities (S&P GSCI Excess Return Index) | US Real Estate (IYR) | |
Effective Performance (1 Month) | 0.21% | -0.34% | 4.13% | 4.05% | 3.67% | |
Effective Performance (6 Month) | 1.40% | 1.54% | 23.11% | 25.83% | 11.74% | |
Annualized* Performance (since January 2015) | 1.40% | 2.60% | 6.85% | -10.68% | 3.50% | |
Annualized* Realized Volatility (since January 2015)** | 5.22% | 4.41% | 15.00% | 22.74% | 20.79% | |
Return over Risk (since January 2015)*** | 0.27 | 0.59 | 0.46 | -0.47 | 0.17 | |
Maximum Peak-to-Trough Drawdown**** | -11.49% | -9.61% | -33.82% | -64.68% | -42.39% | |
* | Calculated on a per annum percentage basis. | |||||
** | Calculated on the same basis as realized volatility used in calculating the index. | |||||
*** | Calculated by dividing the annualized performance by the annualized realized volatility since January 1, 2015. | |||||
**** | The largest percentage decline experienced in the relevant measure from a previously occurring maximum level. | |||||
| ||||||
Benchmark ETF data and benchmark index data is based on the historical levels of the benchmark ETFs and benchmark indices, respectively. The historical index information from May 16, 2016 (the index launch date) to October 20, 2020 reflects the actual performance of the index. (In the chart, this historical index information can be found to the right of the vertical solid line marker.) The hypothetical index data from January 1, 2015 to May 15, 2016 is based on the historical levels of the eligible underlying assets, using the same methodology that is used to calculate the index. As a result, the above chart and table do not reflect the global financial crisis which began in 2008, which had a materially negative impact on certain of the benchmark ETFs, benchmark indices and eligible underlying assets and would have had a materially negative impact on the index. Please also note that the benchmark ETFs and benchmark indices that are used to represent asset classes for purposes of the above table and chart may not be eligible underlying assets for purposes of the index and in some cases differ from the eligible underlying assets that are used to represent classes of assets with the same or similar titles for purposes of the index. You should not take the historical index information, hypothetical index data or historical benchmark ETF and benchmark index data as an indication of the future performance of the index. | ||||||
Monthly Performance Since January 2015 |
The following chart sets forth hypothetical and historical monthly index performance data during the period from January 1, 2015 to September 30, 2020 based on based on the historical index information and hypothetical index data previously supplied above. You should not take the historical index information or hypothetical index data as an indication of the future performance of the index.
Year | Jan | Feb | Mar | Apr | May | Jun | Jul | Aug | Sep | Oct | Nov | Dec | Annual |
2020 | -0.22% | -2.04% | -2.00% | 0.14% | 0.63% | 0.28% | 1.88% | -0.43% | -0.90% |
|
|
| -2.69%* |
2019 | 1.61% | -0.54% | 1.87% | 0.15% | -0.18% | 2.62% | 0.42% | 3.69% | -1.19% | 0.53% | -0.47% | 1.29% | 10.11% |
2018 | 2.79% | -3.15% | -0.59% | -0.59% | 0.18% | 0.47% | -0.01% | 0.56% | -0.60% | -4.56% | 0.40% | -1.53% | -6.62% |
2017 | 0.35% | 0.73% | 0.36% | 0.80% | 1.08% | 0.34% | 1.67% | 0.71% | -0.61% | 0.90% | 0.93% | 1.28% | 8.86% |
2016 | -0.49% | 0.54% | 0.40% | 0.45% | -0.47%** | 3.63% | 1.59% | -0.98% | -0.66% | -1.49% | -0.28% | 0.23% | 2.40% |
2015 | 3.43%*** | -1.19% | -0.02% | -0.75% | 0.22% | -1.06% | 0.55% | -2.87% | -0.44% | 0.38% | -0.60% | -0.50% | -2.93%*** |
* To September 30, 2020
** Historical Performance begins May 16, 2016 (the index launch date)
*** From January 1, 2015
S-3
October 2020 MOBU 5S ER Index Supplement Addendum
Dated October 27, 2020
As of October 12, 2020, the following chart sets forth the weighting of each eligible underlying asset and the hypothetical and historical average percentage weightings of the eligible underlying assets, the highest percentage weightings of the eligible underlying assets and the percentage of index business days with positive weightings for the eligible underlying assets from January 1, 2015 to October 12, 2020 (the period for which eligible underlying assets is available). This data reflects the same historical information and hypothetical data as in the previous tables. You should not take the historical information or hypothetical data as an indication of the future performance of the index.
Eligible Underlying Asset | Weighting (as of October 12, 2020)* | Average Weighting | Highest Weighting | Percentage of Index Business Days When Underlying Asset is Included as an Index Underlying Asset |
SPDR® S&P 500® ETF Trust | 3.66% | 9.91% | 20.00% | 95.53% |
iShares® MSCI EAFE ETF | 0.41% | 4.13% | 20.01% | 64.19% |
iShares® MSCI Japan ETF | 5.19% | 3.37% | 10.00% | 74.71% |
iShares® 20+ Year Treasury Bond ETF | 7.30% | 9.00% | 20.00% | 92.30% |
iShares® iBoxx $ Investment Grade Corporate Bond ETF | 7.44% | 7.74% | 19.88% | 83.37% |
iShares® iBoxx $ High Yield Corporate Bond ETF | 6.44% | 5.36% | 20.00% | 88.73% |
iShares® 7-10 Year Treasury Bond ETF | 15.34% | 8.25% | 20.00% | 83.44% |
iShares® MSCI Emerging Markets ETF | 3.15% | 3.33% | 18.26% | 65.36% |
iShares® U.S. Real Estate ETF | 0.02% | 5.69% | 19.90% | 82.75% |
iShares® Preferred and Income Securities ETF | 6.30% | 4.65% | 10.00% | 90.93% |
iShares® Nasdaq Biotechnology ETF | 0.87% | 2.77% | 10.02% | 83.64% |
SPDR® S&P® Oil & Gas Exploration & Production ETF | 0.08% | 2.11% | 15.77% | 61.99% |
SPDR® Gold Trust | 10.88% | 6.92% | 19.93% | 83.99% |
iShares® TIPS Bond ETF | 9.69% | 2.60% | 10.00% | 82.27% |
Money Market Position | 23.24% | 24.16% | 50.00% | 98.69% |
Eligible Underlying Assets |
The following is a list of the eligible underlying assets for the index, including the related asset classes, asset class minimum and maximum weights and underlying asset minimum and maximum weights.
Asset Class |
|
| Underlying Asset | |||
Asset Class | Minimum Weight | Maximum Weight | Eligible Underlying Asset* | Ticker | Minimum Weight | Maximum Weight |
Broad-Based Equities | 0% | 50% | SPDR® S&P 500® ETF Trust | SPY | 0% | 20% |
iShares® MSCI EAFE ETF | EFA | 0% | 20% | |||
iShares® MSCI Japan ETF | EWJ | 0% | 10% | |||
Fixed Income | 0% | 50% | iShares® 20+ Year Treasury Bond ETF | TLT | 0% | 20% |
iShares® iBoxx $ Investment Grade Corporate Bond ETF | LQD | 0% | 20% | |||
iShares® iBoxx $ High Yield Corporate Bond ETF | HYG | 0% | 20% | |||
iShares® 7-10 Year Treasury Bond ETF | IEF | 0% | 20% | |||
Emerging Markets | 0% | 20% | iShares® MSCI Emerging Markets ETF | EEM | 0% | 20% |
Alternatives | 0% | 25% | iShares® U.S. Real Estate ETF | IYR | 0% | 20% |
iShares® Preferred and Income Securities ETF | PFF | 0% | 10% | |||
iShares® Nasdaq Biotechnology ETF | IBB | 0% | 10% | |||
Commodities | 0% | 25% | SPDR® S&P® Oil and Gas Exploration & Production ETF | XOP | 0% | 20% |
SPDR® Gold Trust | GLD | 0% | 20% | |||
Inflation | 0% | 10% | iShares® TIPS Bond ETF | TIP | 0% | 10% |
Cash Equivalent | 0% | 50%** | Money Market Position | N/A | 0% | 50%** |
* | The value of a share of an eligible ETF may reflect transaction costs and fees incurred or imposed by the investment advisor of the eligible ETF as well as the costs to the ETF to buy and sell its assets. These costs and fees are not included in the calculation of the index underlying the eligible ETF. |
** | With respect to the money market position, the related asset class maximum weight and underlying asset maximum weight limitations do not apply after the first rebalancing on each index business day and, therefore, the index may allocate its entire exposure to the money market position. |
S-4
October 2020 MOBU 5S ER Index Supplement Addendum
Dated October 27, 2020
An investment in securities linked to the index is subject to the risks described below as well as the risks and considerations described in the accompanying MOBU 5S ER index supplement no. 23, the applicable pricing supplement, the applicable product supplement, if any, the accompanying prospectus supplement and the accompanying prospectus. The following risk factors are discussed in greater detail in the applicable pricing supplement and the accompanying MOBU 5S ER index supplement no. 23.
▪ | The Index Measures the Performance of the Index Underlying Assets Less the Sum of the Return on the Notional Interest Rate Plus 0.65% Per Annum (Accruing Daily) |
▪ | Your Investment in the Securities May Be Subject to Concentration Risks. The assets underlying an eligible underlying asset may represent a particular market or commodity sector, a particular geographic region or some other sector or asset class. As a result, your investment in the securities may be concentrated in a single sector or asset class even though there are maximum weights for each underlying asset and each asset class |
▪ | You May Not Have Exposure to One or More of the Eligible Underlying Assets During the Term of the Securities |
▪ | The Weight of Each Index Underlying Asset Reflects the Average of the Average of the Weights of Such Index Underlying Asset Over Three Potential Portfolios For Each Day in the Applicable Weight Averaging Period |
▪ | The Index May Not Successfully Capture Price Momentum and May Not Achieve its Target Volatility |
▪ | Asset Class Maximum Weights Will in Many Cases Prevent All of the Eligible Underlying Assets in an Asset Class From Being Included in the Index at Their Underlying Asset Maximum Weights and May Also Prevent the Index From Having Exposure to Certain Types of Assets At Any Given Time |
▪ | Each Index Underlying Asset’s Weight Is Limited by Its Underlying Asset Maximum Weight, Its Asset Class Maximum Weight and the Volatility Constraint |
▪ | If the Level of the Index Changes, the Market Value of Your Securities May Not Change in the Same Manner |
▪ | Past Index Performance is No Guide to Future Performance |
▪ | The Lower Performance of One Index Underlying Asset May Offset an Increase in the Other Index Underlying Assets |
▪ | Because Historical Returns and Realized Volatility Are Measured on an Aggregate Basis, Index Underlying Assets Could Include Eligible Underlying Assets With a High Realized Volatility and Could Exclude Eligible Underlying Assets With a High Historical Return |
▪ | Correlation of Performances Among the Index Underlying Assets May Reduce the Performance of the Index |
▪ | The Policies of the Index Sponsor, Index Committee and Index Calculation Agent, and Changes That Affect |
the Index or the Eligible ETFs, Could Affect the Amount Payable on Your Securities and Their Market Value |
▪ | The Index Calculation Agent Will Have Authority to Make Determinations that Could Affect the Value of Your Securities and the Amount You Receive at Maturity. The Goldman Sachs Group, Inc. Owns a Non-Controlling Interest in the Index Calculation Agent |
▪ | As Index Sponsor, GS&Co. Can Replace the Index Calculation Agent at Any Time |
▪ | The Index Calculation Agent Can Resign Upon Notification to the Index Sponsor |
▪ | The Index Weightings May Be Ratably Rebalanced into the Money Market Position on Any or All Days During the Term of the Securities |
▪ | The Index May Perform Poorly During Periods Characterized by Increased Short-Term Volatility |
▪ | Index Market Disruption Events Could Affect the Level of the Index on Any Date |
▪ | The Index Has a Limited Operating History |
▪ | U.K. Regulators Will No Longer Persuade or Compel Banks to Submit Rates for Calculation of LIBOR After 2021; Interest Rate Benchmark May Be Discontinued |
▪ | Regulation and Reform of “Benchmarks”, Including LIBOR and Other Types of Benchmarks, May Cause such “Benchmarks” to Perform Differently Than in the Past, or to Disappear Entirely, or Have Other Consequences Which Cannot be Predicted |
▪ | The Historical Levels of the Notional Interest Rate Are Not an Indication of the Future Levels of the Notional Interest Rate |
Risks Related to the Eligible ETFs
Risks Related to All of the Eligible ETFs
▪ | The Eligible ETFs Are Passively Managed To Track an Index and May Not Perform as Well as an Actively Managed Fund or Another Investment |
▪ | Except to the Extent That The Goldman Sachs Group, Inc. is the Issuer of Equity, Debt Securities or Preferred Stock in an Underlying Index, There is No Affiliation Between Us and Any Issuer of Assets Held by Any Eligible ETF or Any Sponsor of Any Eligible ETF |
▪ | The Policies of the Eligible ETF Sponsors and/or Investment Advisor, and the Policies of Any Sponsor of an Underlying Index Tracked by an Eligible ETF, Could Affect the Level of the Index |
▪ | There is No Assurance That an Active Trading Market Will Continue for the Eligible ETFs or That There Will Be |
S-5
October 2020 MOBU 5S ER Index Supplement Addendum
Dated October 27, 2020
Liquidity in Any Such Trading Market; Further, Each Eligible ETF is Subject to Securities Lending Risks and Custody Risks |
▪ | The Eligible ETFs May Be Subject to Pricing Dislocations and Other Market Forces, Which May Adversely Affect the Level of the Index |
▪ | The Values of the Eligible ETFs May Not Completely Track the Level of the Indices Underlying Such Eligible ETFs |
▪ | The Eligible ETFs May Be Subject to Global or Regional Financial Risks, Which May Adversely Affect the Level of the Index |
Risks Related to Eligible ETFs Holding Foreign Assets (including the iShares® MSCI EAFE ETF, the iShares® MSCI Japan ETF, the iShares® iBoxx $ High Yield Corporate Bond ETF, the iShares® iBoxx $ Investment Grade Corporate Bond ETF, the iShares® Emerging Markets ETF and the iShares® Preferred and Income Securities ETF)
▪ | Your Securities Will Be Subject to Foreign Currency Exchange Rate Risk |
▪ | Regulators Are Investigating Potential Manipulation of Published Currency Exchange Rates |
▪ | Even Though Currencies Trade Around-The-Clock, Your Securities Will Not |
▪ | Intervention in the Foreign Currency Exchange Markets by the Countries Issuing Any Currency In Which an Asset Held by an Eligible ETF Trades or Is Denominated Could Adversely Affect the Level of the Index |
▪ | Suspensions or Disruptions of Market Trading in One or More Foreign Currencies May Adversely Affect the Value of Your Securities |
▪ | Your Investment in the Securities Will Be Subject to Risks Associated with Foreign Securities Markets |
Risks Related to Eligible ETFs Holding U.S. Government Debt Securities
▪ | Your Investment is Subject to Concentration Risks. Certain of the eligible ETFs invest in U.S. Treasury bonds that are all obligations of the United States and in securities with a similar remaining time to maturity. As a result, these eligible ETFs are concentrated in the performance of bonds issued by a single issuer and having the same general tenor and terms |
▪ | ETFs Holding U.S. Government Bonds May Change in Unexpected Ways |
Risks Related to Eligible ETFs Holding Debt Securities
▪ | Your Investment is Subject to Income Risk and Interest Rate Risk |
▪ | Your Investment is Subject to Investment-Grade Credit Risk |
Risks Related to the iShares® 20+ Year Treasury Bond ETF
▪ | The iShares® 20+ Year Treasury Bond ETF Recently Changed the Index it Tracks |
▪ | The Index Which the iShares® 20+ Year Treasury Bond ETF Tracks Is a New Index Without a Historical Track Record |
Risks Related to the iShares® 7-10 Year Treasury Bond ETF
▪ | The iShares® 7-10 Year Treasury Bond ETF Recently Changed the Index it Tracks |
▪ | The Index Which the iShares® 7-10 Year Treasury Bond ETF Tracks Is a New Index Without a Historical Track Record |
Risks Related to the iShares® Nasdaq Biotechnology ETF
Risks Related to the iShares® Preferred and Income Securities ETF
▪ | The iShares® Preferred and Income Securities ETF Has Limited Historical Information Tracking Its Underlying Index |
Risks Related to the iShares® TIPS Bond ETF
▪ | The iShares® TIPS Bond ETF includes inflation-protected bonds, which typically have lower yields than conventional fixed rate bonds because of their inflation adjustment feature |
Risks Related to the iShares® iBOXX $ High Yield Corporate Bond ETF
S-6
October 2020 MOBU 5S ER Index Supplement Addendum
Dated October 27, 2020
payments, and greater susceptibility to negative market sentiments leading to depressed prices and decrease in liquidity |
Risks Related to the iShares® U.S. Real Estate ETF
▪ | The iShares® U.S. Real Estate ETF invests in shares of companies that directly or indirectly invest in real estate. The performance of the real estate industry is affected by multiple factors, including general economic and political conditions, the availability of financing for real estate, governmental actions that affect real estate, liquidity in the real estate market and interest rates |
Risks related to SPDR® S&P® Oil & Gas Exploration & Production ETF
▪ | The SPDR® S&P® Oil & Gas Exploration & Production ETF is Concentrated in Oil & Gas Companies and Does Not Provide Diversified Exposure |
Risks related to SPDR® Gold Trust
▪ | Termination or Liquidation of the SPDR® Gold Trust Could Adversely Affect the Value of the Index |
▪ | Your Investment is Subject to Concentration Risks. The SPDR® Gold Trust is concentrated in a single commodity. As a result, the performance of the SPDR® Gold Trust will be concentrated in the performance of that specific commodity |
▪ | Fees and Expenses Payable by the SPDR® Gold Trust Are Charged Regardless of Profitability and May Result in a Depletion of its Assets |
▪ | Legal and Regulatory Changes Could Adversely Affect the Level of the Index |
▪ | Ongoing Commodities-Related Regulatory Investigations And Private Litigation Could Affect Prices for Commodities, Which Could Adversely Affect Your Securities |
▪ | Potential Discrepancies, or Future Changes, in the Calculation of the LBMA Gold Price PM Could Have an Adverse Effect on the Value of the SPDR® Gold Trust Shares |
▪ | The Value of the Shares of SPDR® Gold Trust Relates Directly to the Value of the Gold Held by SPDR® Gold Trust and Fluctuations in the Price of Gold Could Materially Adversely Affect an Investment in SPDR® Gold Trust’s Shares |
▪ | The Amount of Gold Represented by the Shares of SPDR® Gold Trust Will Continue to Be Reduced During the Life of SPDR® Gold Trust Due to SPDR® Gold Trust’s Expenses |
S-7