January 2023 S&P 500® Volatility Plus Daily Risk Control Index Supplement to the Underlier Supplement, the Prospectus Supplement and the Prospectus, each as may be amended from time to time, that form a part of Registration Statement No. 333-269296 | Filed Pursuant to Rule 424(b)(3) Registration Statement No. 333-269296 | |
| GS Finance Corp. Medium-Term Notes, Series F | Warrants, Series G guaranteed by The Goldman Sachs Group, Inc. | |

S&P 500® Volatility Plus Daily Risk Control Index
Overview
This section constitutes only a brief overview of the S&P 500® Volatility Plus Daily Risk Control Index. The index is described in more detail under “The Underliers — S&P 500® Volatility Plus Daily Risk Control Index” in the underlier supplement referred to in “About This Index Supplement” below. |
The S&P 500® Volatility Plus Daily Risk Control Index (current Bloomberg symbol: “SPXVPRCU Index”), which we also refer to in this index supplement as the “index,” is designed to provide leveraged exposure to the S&P 500® Index based on a dynamic volatility target, subject to a minimum exposure of 100% and a maximum exposure of 200%. The S&P 500® Index includes a representative sample of 500 companies in leading industries of the U.S. economy.
The index has a base date of December 31, 1991, with a base value of 100, as adjusted, and is calculated, maintained and published by S&P Dow Jones Indices LLC.
We have derived all information contained in this index supplement regarding the index from publicly available information. Additional information about the index is available on the following website: spglobal.com/spdji/en/indices/strategy/sp-500-volatility-plus-daily-risk-control-index. We are not incorporating by reference the website or any material it includes in this index supplement.
Your investment in securities linked to the index involves certain risks. See “Selected Risk Factors” on page S-6 to read about investment risks relating to such securities.
Neither the Securities and Exchange Commission nor any other regulatory body has approved or disapproved of these securities or passed upon the accuracy or adequacy of this index supplement, the applicable pricing supplement, the applicable product supplement, if any, the applicable general terms supplement, if any, the accompanying underlier supplement, the accompanying prospectus supplement or the accompanying prospectus. Any representation to the contrary is a criminal offense.
The securities are not bank deposits and are not insured by the Federal Deposit Insurance Corporation or any other governmental agency, nor are they obligations of, or guaranteed by, a bank.
Goldman Sachs & Co. LLC
January 2023 S&P 500® Volatility Plus Daily Risk Control Index Supplement dated February 13, 2023.
S-1
| January 2023 S&P 500® Volatility Plus Daily Risk Control Index Supplement Dated February 13, 2023 |

Index Performance Compared to its Parent Index
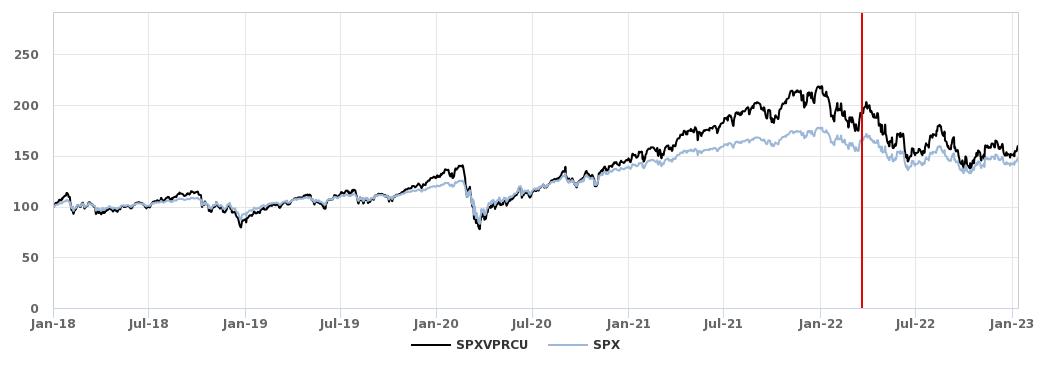
For comparative purposes, the graph below shows the performance, from January 2, 2018 through January 12, 2023, of the S&P 500® Volatility Plus Daily Risk Control Index (in blue) and the S&P 500® Index (in gray).
For comparative purposes, each of the S&P 500® Volatility Plus Daily Risk Control Index and the S&P 500® Index have been adjusted to have a closing level of 100.00 on January 2, 2018 by dividing the applicable closing level on each day by that index’s closing level on January 2, 2018 and multiplying the quotient by 100.00.
Since the S&P 500® Volatility Plus Daily Risk Control Index was launched on March 21, 2022 and has a limited operating history, the graph includes hypothetical performance data for the S&P 500® Volatility Plus Daily Risk Control Index prior to its launch of March 21, 2022. The hypothetical performance data for the S&P 500® Volatility Plus Daily Risk Control Index prior to March 21, 2022 used to create this graph was obtained from the index sponsor’s website, without independent verification. The daily historical closing levels of the S&P 500® Volatility Plus Daily Risk Control Index from March 21, 2022 to January 12, 2023 used to create this graph were obtained from Bloomberg Financial Services, without independent verification. (In the graph, historical closing levels can be found to the right of the vertical solid line marker.) The daily historical closing levels of the S&P 500® Index from January 2, 2018 through January 12, 2023 used to create this graph were obtained from Bloomberg Financial Services, without independent verification. You should not take this graph, the hypothetical performance data or historical closing levels of the indices used to create this graph as an indication of the future performance of any index, including the S&P 500® Volatility Plus Daily Risk Control Index, or the correlation (if any) between the level of the S&P 500® Volatility Plus Daily Risk Control Index and the level of the S&P 500® Index.
Comparative Performance of the S&P 500® Volatility Plus Daily Risk Control Index (SPXVPRCU) and the S&P 500® Index (SPX)
Index Annualized Return Compared to its Parent Index
The following table provides a comparison of the annualized returns of the S&P 500® Volatility Plus Daily Risk Control Index and the S&P 500® Index for the applicable period ended January 12, 2023 (using hypothetical performance data and historical closing levels, as described above). Annualized return represents the average rate of return per annum, calculated as the geometric average of the percentage change of the applicable index during the applicable time period. You should not take the hypothetical or historical annualized returns of the indices as an indication of the future performance of any index, including the S&P 500® Volatility Plus Daily Risk Control Index.
Comparison of Annualized Returns of the S&P 500® Volatility Plus Daily Risk Control Index and the S&P 500® Index
| 1 Year | 3 Years | 5 Years | Since January 2, 2018 |
S&P 500® Index | -15.72% | 6.85% | 7.41% | 8.08% |
S&P 500® Volatility Plus Daily Risk Control Index | -25.09%* | 6.71%* | 8.40%* | 9.78%* |
* Historical information begins March 21, 2022 (the index launch date). Hypothetical performance data, which was used for all data prior to March 21, 2022, was obtained from the index sponsor’s website, without independent verification.
S-2
| January 2023 S&P 500® Volatility Plus Daily Risk Control Index Supplement Dated February 13, 2023 |
Index Annualized Volatility Compared to its Parent Index
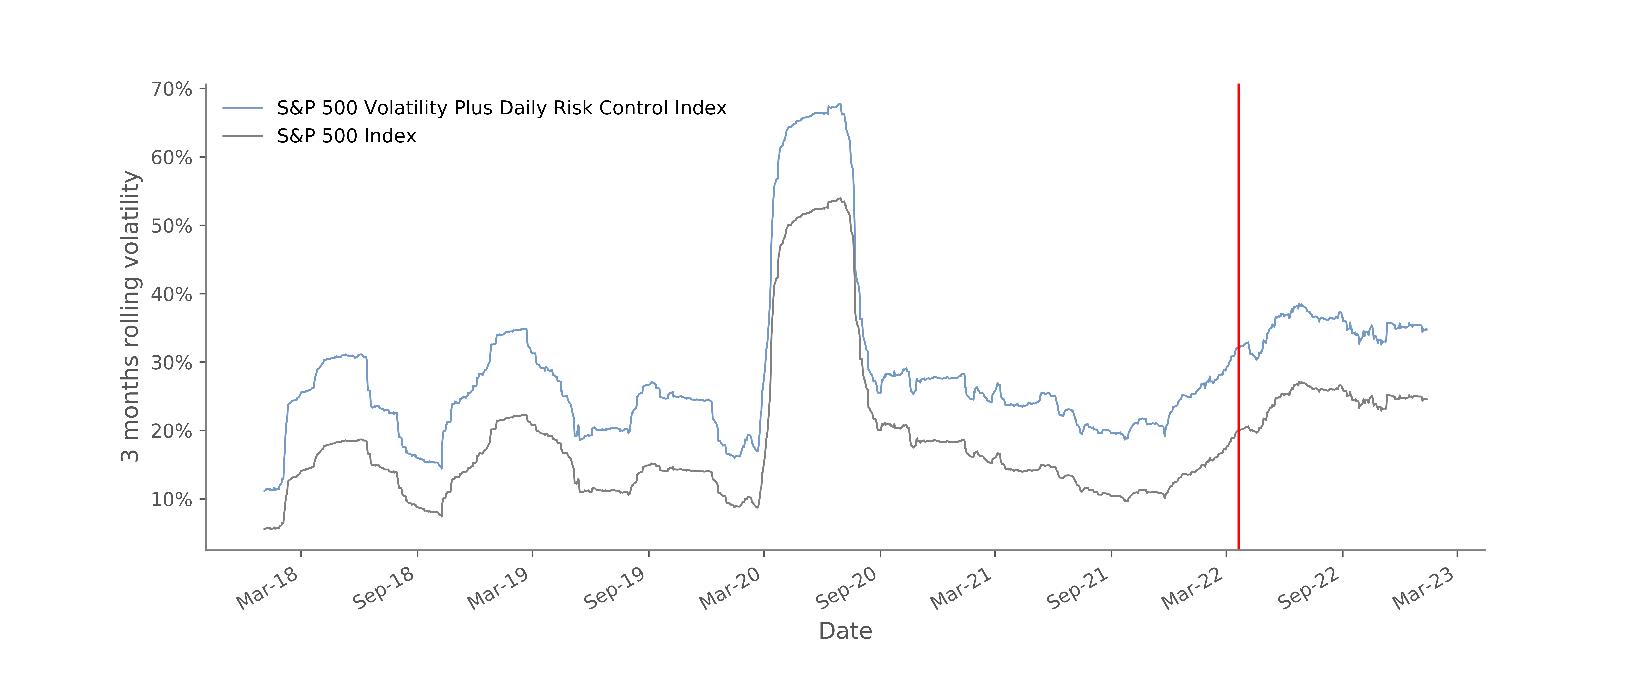
The following graph provides a comparison of the annualized volatility of the S&P 500® Volatility Plus Daily Risk Control Index and the S&P 500® Index from January 2, 2018 through January 12, 2023 (using hypothetical performance data and historical closing levels, as described above). In the graph, historical annualized volatility can be found to the right of the vertical solid line marker. For each day, annualized volatility is a measure of the historical variability of returns, and is calculated as the square root of 252 multiplied by the sample standard deviation of the daily logarithmic returns of the index during a 60 business day look-back period. You should not take the hypothetical or historical annualized volatility of the indices as an indication of the future performance of any index, including the S&P 500® Volatility Plus Daily Risk Control Index.
Comparison of Annualized Volatility of the S&P 500® Volatility Plus Daily Risk Control Index and the S&P 500® Index
S-3
| January 2023 S&P 500® Volatility Plus Daily Risk Control Index Supplement Dated February 13, 2023 |
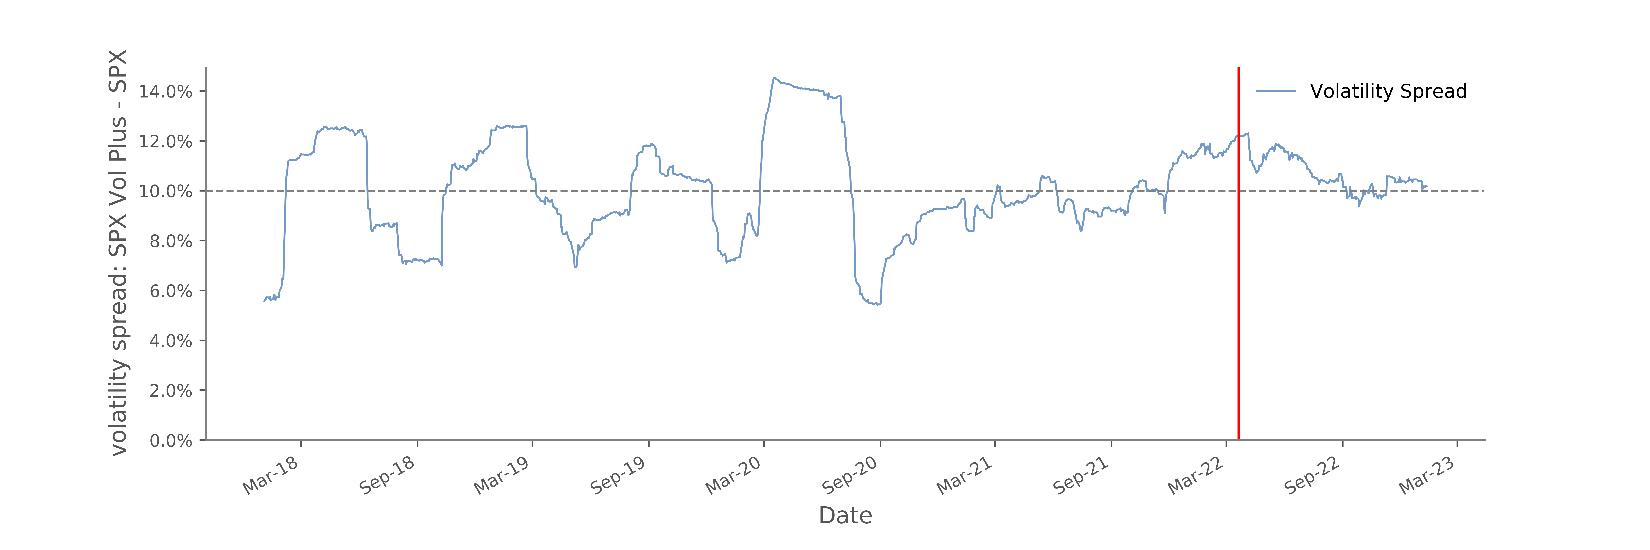
The following graph shows the percentage difference in the annualized volatility of the index compared to the S&P 500® Index from January 2, 2018 through January 12, 2023 (using hypothetical performance data and historical closing levels, as described above). In the graph, historical annualized volatility can be found to the right of the vertical solid line marker. For each day, annualized volatility is a measure of the historical variability of returns, and is calculated as the square root of 252 multiplied by the sample standard deviation of the daily logarithmic returns of the index during a 60 business day look-back period. The index is intended to provide investors with leveraged exposure to the S&P 500® Index based on a dynamic volatility target. The dynamic volatility target is the applicable realized volatility of the S&P 500® Index plus 10%. However, because of how the leverage factor is calculated, there is a lag of two index calculation days between the measurement of realized volatility of the S&P 500® Index and the calculation of the leverage factor. Therefore, the index will not reflect the most current volatility of the S&P 500® Index and the realized volatility of the index will not always be exactly 10% higher than the realized volatility of the S&P 500® Index. You should not take the hypothetical or historical annualized volatility of the indices as an indication of the future performance of any index, including the S&P 500® Volatility Plus Daily Risk Control Index.
Percentage Difference Between the Annualized Volatility of the S&P 500® Volatility Plus Daily Risk Control Index and the S&P 500® Index
S-4
| January 2023 S&P 500® Volatility Plus Daily Risk Control Index Supplement Dated February 13, 2023 |
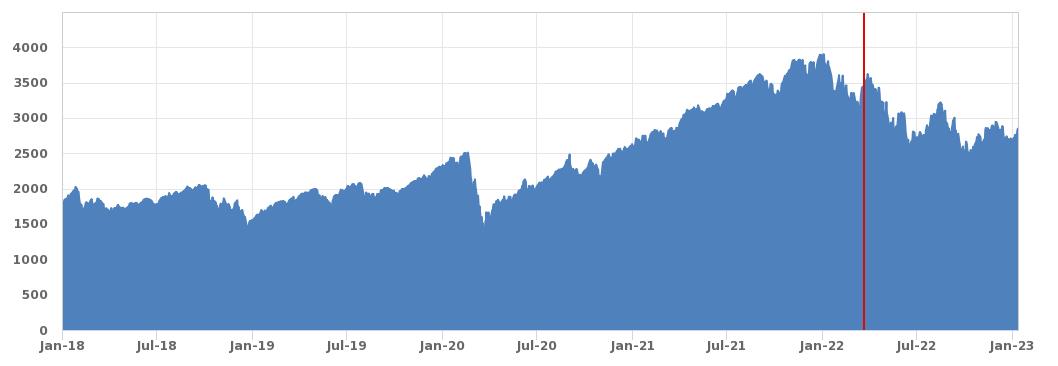
Index Exposure to the S&P 500® Index
The following graph displays the percentage of index exposure to the S&P 500® Index (in blue) and the performance the S&P 500® Index (in gray) during the period from January 2, 2018 through January 12, 2023 (using hypothetical performance data and historical closing levels, as described above). The S&P 500® Index has been adjusted to have a closing level of 100.00 on January 2, 2018 by dividing the applicable closing level on each day by the S&P 500® Index’s closing level on January 2, 2018 and multiplying the quotient by 100.00. In the graph, historical data can be found to the right of the vertical solid line marker. The percentage of index exposure to the S&P 500® Index on January 12, 2023 is 149%. You should not take the hypothetical performance data or historical levels of the index as an indication of its future performance.
Percentage of Index Exposure to the S&P 500® Index

S-5
| January 2023 S&P 500® Volatility Plus Daily Risk Control Index Supplement Dated February 13, 2023 |
An investment in securities linked to the index is subject to the risks described below as well as the risks and considerations described in the accompanying underlier supplement no. 32, the applicable pricing supplement, the applicable product supplement, if any, the applicable general terms supplement, if any, the accompanying prospectus supplement and the accompanying prospectus. The following risk factors are discussed in greater detail in the accompanying underlier supplement no. 32.
| • | The Estimated Value of Your Securities At the Time the Terms of Your Securities Are Set On the Trade Date (as Determined By Reference to Pricing Models Used By GS&Co.) Is Less Than the Original Issue Price Of Your Securities |
| • | Your Securities Are Subject to the Credit Risk of GS Finance Corp., as Issuer, and the Credit Risk of The Goldman Sachs Group, Inc., as Guarantor |
| • | The Market Value of Your Securities May Be Influenced by Many Unpredictable Factors |
| • | If the Value of an Underlier Changes, the Market Value of Your Securities May Not Change in the Same Manner |
| • | The Return on Your Securities Will Not Reflect Any Dividends Paid on an Underlier, or Any Underlier Stock, as Applicable |
| • | You Have No Shareholder Rights or Rights to Receive Any Shares of an Underlier or Any Underlier Stock, as Applicable |
| • | Past Performance is No Guide to Future Performance |
| • | The Policies of an Underlier Sponsor, and Changes that Affect an Underlier to Which Your Securities are Linked, or the Underlier Stocks Comprising Such Underlier, Could Affect the Amount Payable on Your Securities and Their Market Value |
| • | Except to the Extent That We or Our Affiliates May Currently or in the Future Own Securities of, or Engage in Business With, the Applicable Underlier Sponsor or the Underlier Stock Issuers, There Is No Affiliation Between the Underlier Stock Issuers or Any Underlier Sponsor and Us |
| • | There Is No Assurance that Calculating Realized Volatility as the Average of Short-Term Volatility and Long-Term Volatility Is the Best Way to Measure Realized Volatility |
| • | The S&P 500® Volatility Plus Daily Risk Control Index Will Not Reflect the Most Current Volatility of the S&P 500® Index |
| • | The Relative Performance of the S&P 500® Volatility Plus Daily Risk Control Index As Compared to the S&P 500® Index Cannot Be Predicted |
| • | The S&P 500® Volatility Plus Daily Risk Control Index is Subject to Risks Associated With Leveraged Exposure and There Is a Greater Risk You Will Not Receive a Coupon, If Applicable, and a Greater Risk You Will Receive Less than the Face Amount of Your Securities Relative to Securities Linked to the S&P 500® Index, Assuming All Other Terms Remain the Same |
| • | There Is No Guarantee that the S&P 500® Volatility Plus Daily Risk Control Index Will Achieve the Volatility Target |
| • | The S&P 500® Volatility Plus Daily Risk Control Index Will Have Leveraged Exposure to the S&P 500® Index in Falling Stock Markets |
| • | The S&P 500® Volatility Plus Daily Risk Control Index Has a Limited Operating History |
| • | If the Closing Level of the S&P 500® Volatility Plus Daily Risk Control Index Becomes Zero or Negative, the Closing Level of the S&P 500® Volatility Plus Daily Risk Control Index Will Remain Zero |
S-6
| January 2023 S&P 500® Volatility Plus Daily Risk Control Index Supplement Dated February 13, 2023 |
GS Finance Corp. may use this index supplement in the initial sale of the securities. In addition, Goldman Sachs & Co. LLC (GS&Co.), or any other affiliate of GS Finance Corp., may use this index supplement in a market-making transaction in a security after its initial sale. Unless GS Finance Corp. or its agent informs the purchaser otherwise in the confirmation of sale, this index supplement is being used in a market-making transaction.
This index supplement constitutes a supplement to the documents listed below and therefore should be read in conjunction with such documents: •Underlier supplement no. 32 dated February 13, 2023 •Applicable prospectus supplement: •For notes: oprospectus supplement dated February 13, 2023 •For warrants: |
S-7
We have not authorized anyone to provide any information or to make any representations other than those contained in or incorporated by reference in this index supplement, the accompanying underlier supplement no. 32, the accompanying prospectus supplement or the accompanying prospectus. We take no responsibility for, and can provide no assurance as to the reliability of, any other information that others may provide. This index supplement addendum is an offer to sell only the securities offered hereby, but only under circumstances and in jurisdictions where it is lawful to do so. The information contained in this index supplement addendum, the accompanying index supplement no. 32, the accompanying prospectus supplement and the accompanying prospectus is current only as of the respective dates of such documents.
TABLE OF CONTENTS
January 2023 S&P 500® Volatility Plus Daily Risk Control Index Supplement dated February 13, 2023 | |
S-1 | |
S-2 | |
S-6 | |
S-7 | |
|
|