| | OMB APPROVAL |
| | OMB Number: 3235-0570 |
| | Expires: November 30, 2005 |
| | Estimated average burden
hours per response. . . . 5.0 |
UNITED STATES
SECURITIES AND EXCHANGE COMMISSION
Washington, D.C. 20549
FORM N-CSR
CERTIFIED SHAREHOLDER REPORT OF REGISTERED
MANAGEMENT INVESTMENT COMPANIES
Investment Company Act file number 811-6640
American Strategic Income Portfolio Inc. II
(Exact name of registrant as specified in charter)
800 Nicollet Mall, Minneapolis, MN | | 55402 |
(Address of principal executive offices) | | (Zip code) |
Charles D. Gariboldi 800 Nicollet Mall, Minneapolis, MN 55402
(Name and address of agent for service)
Registrant’s telephone number, including area code: 800-677-3863
Date of fiscal year end: May 31
Date of reporting period: November 30, 2004
Form N-CSR is to be used by management investment companies to file reports with the Commission not later than 10 days after the transmission to stockholders of any report that is required to be transmitted to stockholders under Rule 30e-1 under the Investment Company Act of 1940 (17 CFR 270.30e-1). The Commission may use the information provided on Form N-CSR in its regulatory, disclosure review, inspection, and policymaking roles.
A registrant is required to disclose the information specified by Form N-CSR, and the Commission will make this information public. A registrant is not required to respond to the collection of information contained in Form N-CSR unless the Form displays a currently valid Office of Management and Budget (“OMB”) control number. Please direct comments concerning the accuracy of the information collection burden estimate and any suggestions for reducing the burden to Secretary, Securities and Exchange Commission, 450 Fifth Street, NW, Washington, DC 20549-0609. The OMB has reviewed this collection of information under the clearance requirements of 44 U.S.C. Section 3507.
Item 1. Report to Shareholders

AMERICAN | |
STRATEGIC | |
INCOME | |
PORTFOLIO | |
INC. II | |
| |
BSP | |
November 30, 2004
Semiannual Report

AMERICAN STRATEGIC INCOME PORTFOLIO INC. II
| | Table of Contents |
| | |
| | Financial Statements |
| | |
| | Notes to Financial Statements |
| | |
| | Schedule of Investments |
| | |
| | Notice to Shareholders |
As you may recall, at a shareholder meeting held on March 15, 2001, the fund’s shareholders approved a revised fundamental investment policy allowing the fund to invest up to 25% of its total assets in investment-grade preferred stock of real estate investment trusts (REITs). At the same time, the board of directors further restricted the fund’s investment in these securities to 10% of total assets. This additional investment restriction was nonfundamental, however, meaning that it was subject to change at any time by the board of directors, without shareholder approval. In order to provide the fund with additional investment flexibility, at a meeting held on December 7, 2004, the fund’s board of directors removed this restriction. The fund will continue to be subject to the policy limiting investments in investment-grade preferred stock of REITs to 25% of total assets.
As you are probably aware, the board of directors for American Strategic Income Portfolio Inc. II (the fund), as well as American Strategic Income Portfolio Inc., American Strategic Income Portfolio Inc. III, and American Select Portfolio Inc. (collectively, the existing funds), has approved a proposal to reorganize these four funds into the First American Strategic Real Estate Portfolio, Inc., a specialty finance company that would elect to be taxed as a real estate investment trust (REIT). Shareholders of the existing funds who do not wish to receive shares of the REIT will have the option of electing to exchange their shares for shares of First American Strategic Income Portfolio Inc., a newly formed closed-end management investment company with investment policies, restrictions, and strategies substantially similar to those of the existing funds. This transaction is subject to review by the Securities and Exchange Commission, approval by the fund’s shareholders, and certain other conditions. There is no assurance that the transaction will be completed.
NOT FDIC INSURED NO BANK GUARANTEE MAY LOSE VALUE
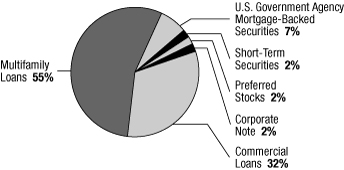
Portfolio Composition
As a percentage of total assets on November 30, 2004
Delinquent Loan Profile
The tables below show the percentages of single family loans and a private mortgage-backed security and multifamily and commercial loans in the portfolio that are 30, 60, 90, or 120 or more days delinquent as of November 30, 2004, based on the value outstanding.
Single family loans and a private
mortgage-backed security | | | | Multifamily and commercial loans | |
| Current | | | 74.9 | % | | Current | | | 100.0 | % | |
| 30 Days | | | 0.0 | % | | 30 Days | | | 0.0 | % | |
| 60 Days | | | 0.0 | % | | 60 Days | | | 0.0 | % | |
| 90 Days | | | 0.0 | % | | 90 Days | | | 0.0 | % | |
| 120+ Days | | | 25.1 | % | | 120+ Days | | | 0.0 | % | |
2004 Semiannual Report
American Strategic Income Portfolio II
1
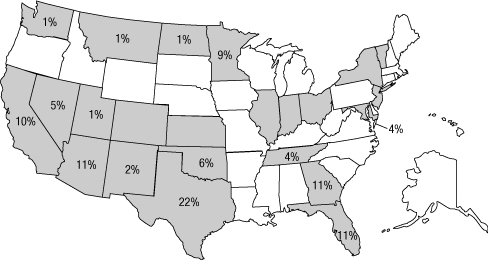
Geographical Distribution
We attempt to buy mortgage loans in many parts of the country to help avoid the risks of concentrating in one area. These percentages reflect the value of whole loans and participation mortgages as of November 30, 2004. Shaded areas without values indicate states in which the fund has invested less than 0.50% of its assets.
2004 Semiannual Report
American Strategic Income Portfolio II
2
Financial STATEMENTS (Unaudited)
Statement of Assets and Liabilities November 30, 2004
| Assets: | | | |
| Investments in unaffiliated securities, at value* (note 2) | | $ | 231,377,629 | | |
| Investment in affiliated money market fund, at value** (note 3) | | | 3,566,531 | | |
| Cash in bank on demand deposit | | | 855,932 | | |
| Receivable for accrued interest | | | 523,713 | | |
| Other assets | | | 423,993 | | |
| Total assets | | | 236,747,798 | | |
| Liabilities: | | | |
| Payable for investment securities purchased | | | 1,287,332 | | |
| Payable for reverse repurchase agreements (note 2) | | | 33,469,673 | | |
| Payable for investment management fees (note 3) | | | 98,813 | | |
| Payable for administrative fees (note 3) | | | 41,507 | | |
| Payable for interest expense | | | 65,458 | | |
| Payable for reorganization expenses (notes 3 and 6) | | | 201,658 | | |
| Total liabilities | | | 35,164,441 | | |
| Net assets applicable to outstanding capital stock | | $ | 201,583,357 | | |
| Composition of net assets: | | | |
| Capital stock and additional paid-in capital | | $ | 208,605,941 | | |
| Undistributed net investment income | | | 802,726 | | |
| Accumulated net realized loss on investments | | | (3,503,511 | ) | |
| Unrealized depreciation of investments | | | (4,321,799 | ) | |
| Total–representing net assets applicable to capital stock | | $ | 201,583,357 | | |
| *Investments in unaffiliated securities, at cost | | $ | 235,699,428 | | |
| **Investment in affiliated money market fund, at cost | | $ | 3,566,531 | | |
| Net asset value and market price of capital stock: | | | |
| Net assets outstanding | | $ | 201,583,357 | | |
Shares outstanding (authorized 1 billion shares of $0.01
par value) | | | 15,985,741 | | |
| Net asset value per share | | $ | 12.61 | | |
| Market price per share | | $ | 12.20 | | |
See accompanying Notes to Financial Statements.
2004 Semiannual Report
American Strategic Income Portfolio II
3
Financial STATEMENTS (Unaudited) continued
Statement of Operations For the Six Months Ended November 30, 2004
| Investment income: | | | |
| Interest from unaffiliated securities | | $ | 10,126,288 | | |
| Dividends | | | 2,699 | | |
| Dividends from affiliated money market fund | | | 27,590 | | |
| Total investment income | | | 10,156,577 | | |
| Expenses (note 3): | | | |
| Investment management fees | | | 635,575 | | |
| Administrative fees | | | 254,772 | | |
| Interest expense | | | 563,664 | | |
| Custodian fees | | | 20,381 | | |
| Transfer agent fees | | | 17,056 | | |
| Exchange listing and accounting fees | | | 20,755 | | |
| Reports to shareholders | | | 29,520 | | |
| Mortgage servicing fees | | | 95,941 | | |
| Directors fees | | | 6,456 | | |
| Audit and legal fees | | | 58,372 | | |
| Financial advisory and accounting fees | | | 14,743 | | |
| Other expenses | | | 37,500 | | |
| Total expenses | | | 1,754,735 | | |
| Net investment income | | | 8,401,842 | | |
Net realized and unrealized gains (losses) on
investments (note 4): | | | |
| Net realized gain on investments | | | 537,583 | | |
Net change in unrealized appreciation or depreciation of
investments | | | (5,899,643 | ) | |
| Net loss on investments | | | (5,362,060 | ) | |
| Net increase in net assets resulting from operations | | $ | 3,039,782 | | |
See accompanying Notes to Financial Statements.
2004 Semiannual Report
American Strategic Income Portfolio II
4
Statement of Cash Flows For the Six Months Ended November 30, 2004
| Cash flows from operating activities: | | | |
| Net increase in net assets resulting from operations | | $ | 3,039,782 | | |
Adjustments to reconcile net increase in net assets resulting
from operations to net cash provided by operating activities: | | | | | |
| Purchases of investments | | | (32,527,286 | ) | |
| Proceeds from paydowns and sales of investments | | | 64,259,483 | | |
| Net purchases of short-term securities | | | (559,736 | ) | |
| Net amortization of bond discount and premium | | | 3,926 | | |
| Net unrealized depreciation of investments | | | 5,899,643 | | |
| Net realized gain on investments | | | (537,583 | ) | |
| Decrease in accrued interest receivable | | | 128,810 | | |
| Decrease in other assets | | | 96,202 | | |
| Increase in accrued fees and expenses | | | 24,431 | | |
| Net cash provided by operating activities | | | 39,827,672 | | |
| Cash flows from financing activities: | | | |
| Net payments for reverse repurchase agreements | | | (29,576,713 | ) | |
| Distributions paid to shareholders | | | (8,872,089 | ) | |
| Net cash used in financing activities | | | (38,448,802 | ) | |
| Net increase in cash | | | 1,378,870 | | |
| Bank overdraft at beginning of period | | | (522,938 | ) | |
| Cash at end of period | | $ | 855,932 | | |
Supplemental disclosure of cash flow information:
Cash paid for interest | | $ | 574,398 | | |
See accompanying Notes to Financial Statements.
2004 Semiannual Report
American Strategic Income Portfolio II
5
Financial STATEMENTS (Unaudited) continued
Statements of Changes in Net Assets
| | | Six Months
Ended
11/30/04
(Unaudited) | | Year Ended
5/31/04 | |
| Operations: | |
| Net investment income | | $ | 8,401,842 | | | $ | 17,882,331 | | |
| Net realized gain on investments | | | 537,583 | | | | 806,361 | | |
| Net change in unrealized appreciation or depreciation of investments | | | (5,899,643 | ) | | | (2,836,227 | ) | |
| Net increase in net assets resulting from operations | | | 3,039,782 | | | | 15,852,465 | | |
| Distributions to shareholders (note 2): | |
| From net investment income | | | (8,872,089 | ) | | | (18,204,555 | ) | |
| Capital share transactions (note 2): | |
| Proceeds from 28,452 shares issued from reinvested dividends | | | - | | | | 378,262 | | |
| Total decrease in net assets | | | (5,832,307 | ) | | | (1,973,828 | ) | |
| Net assets at beginning of period | | | 207,415,664 | | | | 209,389,492 | | |
| Net assets at end of period | | $ | 201,583,357 | | | $ | 207,415,664 | | |
| Undistributed net investment income | | $ | 802,726 | | | $ | 1,272,973 | | |
See accompanying Notes to Financial Statements.
2004 Semiannual Report
American Strategic Income Portfolio II
6
Notes to Financial STATEMENTS (Unaudited)
| (1) Organization | | American Strategic Income Portfolio Inc. II (the fund) is registered under the Investment Company Act of 1940 (as amended) as a diversified, closed-end management investment company. The fund emphasizes investments in mortgage-related assets that directly or indirectly represent a participation in or are secured by and payable from mortgage loans. It may also invest in U.S. government securities, corporate debt securities, and preferred stock issued by real estate investment trusts. In addition, the fund may borrow using reverse repurchase agreements and revolving credit facilities. Fund shares are listed on the New York Stock Exchange under the symbol BSP. | |
|
| (2) Summary of Significant Accounting Policies | | Security Valuations | |
|
| | | Security valuations for the fund's investments (other than whole loans) are furnished by independent pricing services that have been approved by the fund's board of directors. Investments in equity securities that are traded on a national securities exchange are stated at the last quoted sales price if readily available for such securities on each business day. For securities traded on the Nasdaq national market system, the fund utilizes the Nasdaq Official Closing Price which compares the last trade to the bid/ask price of a security. If the last trade is within the bid/ask range, then that price will be the closing price. If the last trade is outside the bid/ask range, and falls above the ask, the ask price will be the closing price. If the last trade is below the bid, the bid will be the closing price. Other equity securities traded in the over-the-counter market and listed equity securities for which no sale was rep orted on that date are stated at the last quoted bid price. Debt obligations exceeding 60 days to maturity are valued by an independent pricing service. The pricing service may employ methodologies that | |
|
2004 Semiannual Report
American Strategic Income Portfolio II
7
Notes to Financial STATEMENTS (Unaudited) continued
| utilize actual market transactions, broker-dealer supplied valuations, or other formula-driven valuation techniques. These techniques generally consider such factors as yields or prices of bonds of comparable quality, type of issue, coupon, maturity, ratings, and general market conditions. Securities for which prices are not available from an independent pricing service but where an active market exists are valued using market quotations obtained from one or more dealers that make markets in the securities or from a widely used quotation system. When market quotations are not readily available, securities are valued at fair value as determined in good faith by procedures established and approved by the fund's board of directors. Some of the factors which may be considered by the board of directors in determining fair value are fundamental analytical data relating to the investment; the nature and duration of any restric tions on disposition; trading in similar securities of the same issuer or comparable companies; information from broker-dealers; and an evaluation of the forces that influence the market in which the securities are purchased and sold. If events occur that materially affect the value of securities (including non-U.S. securities) between the close of trading in those securities and the close of regular trading on the New York Stock Exchange, the securities will be valued at fair value. As of November 30, 2004, the fund held fair value securities with a value of $211,828,528 or 105.1% of net assets. Debt obligations with 60 days or less remaining until maturity may be valued at their amortized cost which approximates market value. Security valuations are performed once a week and at the end of each month. | |
|
| The fund's investments in whole loans (single family, multifamily, and commercial), and participation | |
|
2004 Semiannual Report
American Strategic Income Portfolio II
8
| mortgages are generally not traded in any organized market and, therefore, market quotations are not readily available. These investments are valued at fair value according to procedures adopted by the fund's board of directors. Pursuant to these procedures, whole loan investments are initially valued at cost and their values are subsequently monitored and adjusted using a U.S. Bancorp Asset Management, Inc. (USBAM) pricing model designed to incorporate, among other things, the present value of the projected stream of cash flows on such investments. The pricing model takes into account a number of relevant factors including the projected rate of prepayments, the delinquency profile, the historical payment record, the expected yield at purchase, changes in prevailing interest rates, and changes in the real or perceived liquidity of whole loans or participation mortgages, as the case may be. The results of the pricing mod el may be further subject to price ceilings due to the illiquid nature of the loans. Changes in prevailing interest rates, real or perceived liquidity, yield spreads, and creditworthiness are factored into the pricing model each week. | |
|
| Certain mortgage loan information is received once a month. This information includes, but is not limited to, the projected rate of prepayments, projected rate and severity of defaults, the delinquency profile, and the historical payment record. Valuations of whole loans and participation mortgages are determined no less frequently than weekly. Although we believe the pricing model to be reasonable and appropriate, the actual values that may be realized upon the sale of whole loans and participation mortgages can only be determined in a negotiation between the fund and third parties. | |
|
2004 Semiannual Report
American Strategic Income Portfolio II
9
Notes to Financial STATEMENTS (Unaudited) continued
| Security Transactions and Investment Income | |
|
| The fund records security transactions on the trade date of the security purchase or sale. Dividend income is recorded on the ex-dividend date. Interest income, including accretion of bond discounts and amortization of premiums, is recorded on an accrual basis. Security gains and losses are determined on the basis of identified cost, which is the same basis used for federal income tax purposes. | |
|
| Whole Loans and Participation Mortgages | |
|
| Whole loans and participation mortgages may bear a greater risk of loss arising from a default on the part of the borrower of the underlying loans than do traditional mortgage-backed securities. This is because whole loans and participation mortgages, unlike most mortgage-backed securities, generally are not backed by any government guarantee or private credit enhancement. Such risk may be greater during a period of declining or stagnant real estate values. In addition, the individual loans underlying whole loans and participation mortgages may be larger than the loans underlying mortgage-backed securities. With respect to participation mortgages, the fund generally will not be able to unilaterally enforce its rights in the event of a default, but rather will be dependent on the cooperation of the other participation holders. | |
|
| At November 30, 2004, loans representing 0.2% of net assets were 120 days or more delinquent as to the timely monthly payment of principal. Such delinquencies relate to single family whole loans and a private mortgage-backed security, which represent 25.1% of the total single family loans and private mortgage-backed security's value outstanding at November 30, 2004. The | |
|
2004 Semiannual Report
American Strategic Income Portfolio II
10
| fund does not record past due interest as income until received. The fund may incur certain costs and delays in the event of a foreclosure. Also, there is no assurance that the subsequent sale of the property will produce an amount equal to the sum of the unpaid principal balance of the loan as of the date the borrower went into default, the accrued unpaid interest, and all of the foreclosure expenses. In this case, the fund may suffer a loss. At November 30, 2004, no multifamily or commercial loans were deliquent. | |
|
| Real estate acquired through foreclosure, if any, is recorded at estimated fair value. The fund may receive rental or other income as a result of holding real estate. In addition, the fund may incur expenses associated with maintaining any real estate owned. As of and for the six months ended November 30, 2004, the fund owned no real estate. | |
|
| Reverse Repurchase Agreements | |
|
| Reverse repurchase agreements involve the sale of a portfolio-eligible security by the fund, coupled with an agreement to repurchase the security at a specified date and price. Reverse repurchase agreements may increase volatility of the fund's net asset value and involve the risk that interest costs on money borrowed may exceed the return on securities purchased with that borrowed money. Reverse repurchase agreements are considered to be borrowings by the fund, and are subject to the fund's overall restriction on borrowing under which it must maintain asset coverage of at least 300%. For the six months ended November 30, 2004, the weighted average borrowings outstanding were $47,316,014 and the weighted average interest rate payable on such borrowings was 2.39%. | |
|
2004 Semiannual Report
American Strategic Income Portfolio II
11
Notes to Financial STATEMENTS (Unaudited) continued
| Securities Purchased on a When-Issued Basis | |
|
| Delivery and payment for securities that have been purchased by the fund on a when-issued or forward-commitment basis can take place a month or more after the transaction date. During this period, such securities do not earn interest, are subject to market fluctuation, and may increase or decrease in value prior to their delivery. The fund segregates, with its custodian, assets with a market value equal to the amount of its purchase commitments. The purchase of securities on a when-issued or forward-commitment basis may increase the volatility of the fund's net asset value if the fund makes such purchases while remaining substantially fully invested. As of November 30, 2004, the fund had $1,287,332 outstanding of when-issued or forward-commitment securities. | |
|
| Federal Taxes | |
|
| The fund intends to comply with the requirements of the Internal Revenue Code applicable to regulated investment companies and not be subject to federal income tax. Therefore, no income tax provision is required. The fund also intends to distribute its taxable net investment income and realized gains, if any, to avoid the payment of any federal excise taxes. | |
|
| Net investment income and net realized gains (losses) may differ for financial statement and tax purposes primarily because of the timing of recognition of income on certain collateralized mortgage-backed securities. The character of distributions made during the year from net investment income or net realized gains may differ from its ultimate characterization for federal income tax purposes. In addition, due to the timing of dividend distributions, the fiscal year in which amounts are | |
|
2004 Semiannual Report
American Strategic Income Portfolio II
12
| distributed may differ from the year that the income or realized gains or losses were recorded by the fund. | |
|
| The tax character of distributions paid during the six months ended November 30, 2004 and fiscal year ended May 31, 2004 was as follows: | |
|
| | | 11/30/04 | | 05/31/04 | |
| Distributions paid from ordinary income | | $ | 8,872,089 | | | $ | 18,204,555 | | |
| At May 31, 2004, the fund's most recently completed fiscal year-end, the components of accumulated deficit on a tax basis were as follows: | |
|
| Undistributed ordinary income | | $ | 1,272,973 | | |
| Accumulated capital and post-October losses | | | (2,338,312 | ) | |
| Unrealized depreciation | | | (124,938 | ) | |
| Accumulated deficit | | $ | (1,190,277 | ) | |
| The fund incurred a loss of $91,139 for tax purposes from November 1, 2003 to May 31, 2004. As permitted by the Internal Revenue Code, the fund intends to elect to defer and treat this loss as arising in the fiscal year ending May 31, 2005. | |
|
| The difference between book basis and tax basis unrealized appreciation and accumulated realized losses at May 31, 2004, is attributable to a one-time tax election whereby the fund marked appreciated securities to market creating capital gains that were used to reduce capital loss carryovers and increase tax cost basis. | |
|
| Distributions to Shareholders | |
|
| Distributions from net investment income are made monthly and realized capital gains, if any, will be distributed at least annually. These distributions are recorded as of the close of business on the ex-dividend date. Such distributions are payable in cash or, pursuant | |
|
2004 Semiannual Report
American Strategic Income Portfolio II
13
Notes to Financial STATEMENTS (Unaudited) continued
| to the fund's dividend reinvestment plan, reinvested in additional shares of the fund's capital stock. Under the plan, fund shares will be purchased in the open market unless the market price plus commissions exceeds the net asset value by 5% or more. If, at the close of business on the dividend payment date, the shares purchased in the open market are insufficient to satisfy the dividend reinvestment requirement, the fund will issue new shares at a discount of up to 5% from the current market price | |
|
| Repurchase Agreements | |
|
| For repurchase agreements entered into with certain broker-dealers, the fund, along with other affiliated registered investment companies, may transfer uninvested cash balances into a joint trading account, the daily aggregate of which is invested in repurchase agreements secured by U.S. government or agency obligations. Securities pledged as collateral for all individual and joint repurchase agreements are held by the fund's custodian bank until maturity of the repurchase agreement. Provisions for all agreements ensure that the daily market value of the collateral is in excess of the repurchase amount, including accrued interest, to protect the fund in the event of a default. | |
|
| Use of Estimates in the Preparation of Financial Statements | |
|
| The preparation of financial statements in conformity with U.S. generally accepted accounting principles requires management to make estimates and assumptions that affect the reported amounts in the financial statements. Actual results could differ from these estimates. | |
|
2004 Semiannual Report
American Strategic Income Portfolio II
14
| (3) Expenses | | Investment Management and Administrative Fees | |
|
| | | Pursuant to an investment advisory agreement (the Agreement), USBAM, a subsidiary of U.S. Bank National Association (U.S. Bank), manages the fund's assets and furnishes related office facilities, equipment, research, and personnel. The Agreement provides USBAM with a monthly investment management fee equal to an annualized rate of 0.20% of the fund's average weekly net assets and 4.50% of the daily gross income accrued by the fund during the month (i.e., investment income, including accretion of bond discounts and amortization of premiums, other than gains from the sale of securities or gains from options and futures contracts less interest on money borrowed by the fund). The monthly investment management fee shall not exceed in the aggregate 1/12 of 0.725% of the fund's average weekly net assets during the month (approximately 0.725% on an annual basis). For the six months ended November 30, 2004, the effective in vestment management fee incurred by the fund was 0.62%. For its fee, USBAM provides investment advice and, in general, conducts the management and investment activities of the fund. | |
|
| | | Pursuant to a co-administration agreement (the Co-Administration Agreement), USBAM serves as co-administrator for the fund (U.S. Bancorp Fund Services, LLC, a subsidiary of U.S. Bancorp, is also co-administrator but currently has no functional responsibilities related to the fund) and provides administrative services, including legal and shareholder services, to the fund. Under this agreement, USBAM receives a monthly administrative fee equal to an annualized rate of 0.25% of the fund's average weekly net assets. For its fee, USBAM provides numerous | |
|
2004 Semiannual Report
American Strategic Income Portfolio II
15
Notes to Financial STATEMENTS (Unaudited) continued
| services to the fund including, but not limited to, handling the general business affairs, financial and regulatory reporting, and various other services. Separate from the Co-Administration Agreement, USBAM (from its own resources) has retained SEI Investments Inc. as a sub-administrator to perform, among other services, net asset value calculations. | |
|
| The fund may invest in related money market funds that are series of First American Funds, Inc., subject to certain limitations. In order to avoid the payment of duplicative investment advisory fees to USBAM, which acts as the investment advisor to both the fund and the related money market funds, USBAM will reimburse the fund an amount equal to the investment advisory fee received from the related money market funds that is attributable to the assets of the fund. For financial statement purposes, this reimbursement is recorded as investment income. | |
|
| Custodian Fees | |
|
| U.S. Bank serves as the fund's custodian pursuant to a custodian agreement with the fund. The fee for the fund is equal to an annual rate of 0.02% of average weekly net assets. These fees are computed weekly and paid monthly. | |
|
| Mortgage Servicing Fees | |
|
| The fund enters into mortgage servicing agreements with mortgage servicers for whole loans and participation mortgages. For a fee, mortgage servicers maintain loan records, such as insurance and taxes and the proper allocation of payments between principal and interest. | |
|
2004 Semiannual Report
American Strategic Income Portfolio II
16
| Proposed Reorganization Expenses | |
|
| As discussed in Note 6, the fund has taken certain steps to reorganize along with certain other similar entities managed by USBAM. As set forth below, certain costs and expenses incurred in connection with the proposed reorganization of the fund (including, but not limited to, the preparation of all necessary registration statements, proxy materials and other documents, preparation for and attendance at board and committee, shareholder, planning, organizational and other meetings and costs and expenses of accountants, attorneys, financial advisors and other experts engaged in connection with the reorganization) shall be borne by the fund, American Strategic Income Portfolio Inc., American Strategic Income Portfolio Inc. III, and American Select Portfolio Inc. (collectively, the existing funds). The Existing funds as a group will bear the first $3,400,000 of such expenses and will, subject to certain exceptions, equally share all transaction expenses in excess of $3,400,000 with USBAM. Such costs and expenses will be allocated among the existing funds based on their relative net asset values whether or not an existing fund participates in the reorganization. Additionally, costs and expenses incurred in connection with the legal representation of USBAM's interests with respect to the reorganization and related matters will be borne by USBAM. The existing funds' portion of the costs and expenses related to the reorganization have totaled approximately $4,000,000 through November 30, 2004, $100,000 of which was incurred during the six months ended November 30, 2004. Of these amounts, $1,230,499 and $31,039, respectively, have been allocated to the fund. It is currently estimated that additional costs and expenses related to the reorganization to be borne by the existing funds will total $884,000. Based on the net asset va lues | |
|
2004 Semiannual Report
American Strategic Income Portfolio II
17
Notes to Financial STATEMENTS (Unaudited) continued
| | | of the existing funds as of November 30, 2004, it is projected that $271,940 of this amount will be incurred by the fund. | |
|
| | | Other Fees and Expenses | |
|
| | | In addition to the investment management, administrative, custodian, and mortgage servicing fees, the fund is responsible for paying other operating expenses, including: outside directors' fees and expenses, registration fees, printing and shareholder reports, transfer agent fees and expenses, legal, auditing and accounting services, insurance, interest, expenses related to real estate owned, fees to outside parties retained to assist in conducting due diligence, taxes, and other miscellaneous expenses. | |
|
| (4) Investment Security Transactions | | Cost of purchases and proceeds from paydowns and sales of securities and real estate, other than temporary investments in short-term securities, for the six months ended November 30, 2004, aggregated $33,810,692 and $64,259,483, respectively. Included in proceeds from sales are $195,633 from prepayment penalties. | |
|
| (5) Capital Loss Carryover | | For federal income tax purposes, the fund had capital loss carryovers at May 31, 2004, the fund's most recently completed fiscal year-end, which, if not offset by subsequent capital gains, will expire on the fund's fiscal year-ends as indicated below. | |
|
Capital Loss
Carryover | | Expiration | |
| $ | 922,669 | | | | 2005 | | |
| | 1,266,343 | | | | 2006 | | |
| $ | 2,189,012 | | | | |
| (6) Proposed Reorganization | | A combined proxy statement/registration statement, last amended on April 22, 2003, has been filed with the | |
|
2004 Semiannual Report
American Strategic Income Portfolio II
18
| | | Securities and Exchange Commission (SEC) in which it is proposed that the fund, along with American Strategic Income Portfolio Inc. (ASP), American Strategic Income Portfolio Inc. III (CSP), and American Select Portfolio Inc. (SLA), reorganize into First American Strategic Real Estate Portfolio, Inc., a specialty real estate finance company that would elect to be taxed as a real estate investment trust (REIT). Shareholders of the fund, ASP, CSP, and SLA who do not wish to receive shares of the REIT will have the option of electing to exchange their shares for shares in First American Strategic Income Portfolio Inc., a newly formed closed-end management investment company with investment policies, restrictions and strategies substantially similar to those of the fund, ASP, CSP, and SLA. This transaction is subject to review by the SEC, approval by the fund's shareholders, and certain other conditions. There is no assuran ce that the transaction will be completed. | |
|
| (7) Indemnifications | | The fund enters into contracts that contain a variety of indemnifications. The fund's maximum exposure under these arrangements is unknown. However, the fund has not had prior claims or losses pursuant to these contracts and expects the risk of loss to be remote. | |
|
2004 Semiannual Report
American Strategic Income Portfolio II
19
Notes to Financial STATEMENTS (Unaudited) continued
| (8) Financial Highlights | | Per-share data for a share of capital stock outstanding throughout each period and selected information for each period are as follows: | |
|
| | | Six Months
Ended
11/30/04 | | Year Ended May 31, | |
| | | (Unaudited) | | 2004 | | 2003 | | 2002 | | 2001 | | 2000 | |
| Per-Share Data | |
Net asset value,
beginning of period | | $ | 12.98 | | | $ | 13.12 | | | $ | 13.29 | | | $ | 13.06 | | | $ | 12.20 | | | $ | 12.92 | | |
| Operations: | |
| Net investment income | | | 0.53 | | | | 1.12 | | | | 1.12 | | | | 1.13 | | | | 1.06 | | | | 1.02 | | |
Net realized and unrealized
gains (losses) on investments | | | (0.34 | ) | | | (0.12 | ) | | | (0.15 | ) | | | 0.23 | | | | 0.83 | | | | (0.68 | ) | |
| Total from operations | | | 0.19 | | | | 1.00 | | | | 0.97 | | | | 1.36 | | | | 1.89 | | | | 0.34 | | |
| Distributions to shareholders: | |
| From net investment income | | | (0.56 | ) | | | (1.14 | ) | | | (1.14 | ) | | | (1.13 | ) | | | (1.03 | ) | | | (1.06 | ) | |
| Net asset value, end of period | | $ | 12.61 | | | $ | 12.98 | | | $ | 13.12 | | | $ | 13.29 | | | $ | 13.06 | | | $ | 12.20 | | |
| Market value, end of period | | $ | 12.20 | | | $ | 12.84 | | | $ | 13.70 | | | $ | 13.17 | | | $ | 12.30 | | | $ | 11.00 | | |
| Selected Information | |
| Total return, net asset value (a) | | | 1.54 | % | | | 7.95 | % | | | 7.59 | % | | | 10.66 | % | | | 15.97 | % | | | 2.77 | % | |
| Total return, market value (b) | | | (0.82 | )% | | | 2.16 | % | | | 13.51 | % | | | 16.94 | % | | | 21.98 | % | | | 1.09 | % | |
| Net assets at end of period (in millions) | | $ | 202 | | | $ | 207 | | | $ | 209 | | | $ | 212 | | | $ | 208 | | | $ | 195 | | |
Ratio of expenses to average weekly
net assets | | | 1.72 | %(d) | | | 1.77 | % | | | 2.99 | % | | | 2.30 | % | | | 3.37 | % | | | 3.62 | % | |
Ratio of expenses to average weekly
net assets excluding
interest expense | | | 1.17 | %(d) | | | 1.18 | % | | | 1.68 | % | | | 1.15 | % | | | 1.19 | % | | | 1.21 | % | |
Ratio of net investment income to
average weekly net assets | | | 8.24 | %(d) | | | 8.61 | % | | | 8.52 | % | | | 8.55 | % | | | 8.45 | % | | | 8.07 | % | |
| Portfolio turnover rate | | | 14 | % | | | 34 | % | | | 24 | % | | | 46 | % | | | 21 | % | | | 24 | % | |
Amount of borrowings outstanding
at end of period (in millions) | | $ | 33 | | | $ | 63 | | | $ | 73 | | | $ | 83 | | | $ | 70 | | | $ | 67 | | |
Per-share amount of borrowings
outstanding at end of period | | $ | 2.09 | | | $ | 3.94 | | | $ | 4.55 | | | $ | 5.18 | | | $ | 4.37 | | | $ | 4.18 | | |
Per-share amount of net assets,
excluding borrowings, at
end of period | | $ | 14.70 | | | $ | 16.92 | | | $ | 17.67 | | | $ | 18.47 | | | $ | 17.43 | | | $ | 16.38 | | |
| Asset coverage ratio (c) | | | 702 | % | | | 429 | % | | | 388 | % | | | 356 | % | | | 399 | % | | | 392 | % | |
(a) Assumes reinvestment of distributions at net asset value.
(b) Assumes reinvestment of distributions at actual prices pursuant to the fund's dividend reinvestment plan.
(c) Represents net assets, excluding borrowings, at end of period divided by borrowings outstanding at end of period.
(d) Annualized.
2004 Semiannual Report
American Strategic Income Portfolio II
20
Schedule of INVESTMENTS (Unaudited)
American Strategic Income Portfolio II November 30, 2004
| Description of Security | | Date
Acquired | | Par
Value | | Cost | | Value (a) | |
| (Percentages of each investment category relate to net assets) | |
| U.S. Government Agency Mortgage-Backed Securities - 7.7% | |
| Fixed Rate - 7.7% | |
| FHLMC, 5.50%, 1/1/18 | | | | $ | 6,923,229 | (b) | | $ | 7,147,153 | | | $ | 7,133,072 | | |
| FHLMC, 9.00%, 7/1/30 | | | | | 513,867 | (b) | | | 527,559 | | | | 559,472 | | |
| FNMA, 6.00%, 10/1/16 | | | | | 581,576 | (b) | | | 584,920 | | | | 610,655 | | |
| FNMA, 5.50%, 6/1/17 | | | | | 587,181 | (b) | | | 590,274 | | | | 607,551 | | |
| FNMA, 5.00%, 9/1/17 | | | | | 954,510 | (b) | | | 957,174 | | | | 967,033 | | |
| FNMA, 5.00%, 11/1/17 | | | | | 1,774,314 | (g) | | | 1,784,174 | | | | 1,797,593 | | |
| FNMA, 6.50%, 6/1/29 | | | | | 2,468,134 | (b) | | | 2,451,308 | | | | 2,595,391 | | |
| FNMA, 7.50%, 4/1/30 | | | | | 313,162 | (b) | | | 302,566 | | | | 335,180 | | |
| FNMA, 7.50%, 5/1/30 | | | | | 335,047 | (b) | | | 323,732 | | | | 358,815 | | |
| FNMA, 8.00%, 5/1/30 | | | | | 74,144 | (b) | | | 73,203 | | | | 80,192 | | |
| FNMA, 8.00%, 6/1/30 | | | | | 421,885 | (b) | | | 416,524 | | | | 456,294 | | |
Total U.S. Government Agency
Mortgage-Backed
Securities | | | | | | | | | 15,158,587 | | | | 15,501,248 | | |
| Corporate Note (e) - 2.5% | | | |
| Fixed Rate - 2.5% | |
Stratus Properties,
9.25%, 7/1/06 | | 06/14/01 | | | 5,000,000 | | | | 5,000,000 | | | | 5,000,000 | | |
| Private Mortgage-Backed Security (e) - 0.1% | | | |
| Fixed Rate - 0.1% | |
RFC 1997-NPC1,
8.31%, 8/27/23 | | 03/27/97 | | | 360,984 | | | | 362,207 | | | | 339,598 | | |
| Whole Loans and Participation Mortgages (c,d,e) - 102.4% | | | |
| Commercial Loans - 37.3% | |
1336 and 1360 Energy Park
Drive,
7.55%, 10/1/08 | | 09/29/98 | | | 2,690,910 | (b) | | | 2,690,910 | | | | 2,798,546 | | |
5555 East Van Buren,
5.68%, 7/1/11 | | 06/23/04 | | | 6,500,000 | (b) | | | 6,500,000 | | | | 6,680,453 | | |
Bigelow Office Building,
8.88%, 4/1/07 | | 03/31/97 | | | 1,237,865 | (b) | | | 1,237,865 | | | | 1,275,001 | | |
Cypress Point Office Park I,
5.30%, 6/1/09 | | 05/19/04 | | | 4,641,000 | (b) | | | 4,641,000 | | | | 4,709,492 | | |
| See accompanying Notes to Schedule of Investments. | |
2004 Semiannual Report
American Strategic Income Portfolio II
21
Schedule of INVESTMENTS (Unaudited) continued
American Strategic Income Portfolio II
(Continued)
| Description of Security | | Date
Acquired | | Par
Value | | Cost | | Value (a) | |
Cypress Point Office Park II,
5.30%, 7/1/09 | | 05/19/04 | | $ | 4,509,000 | (b) | | $ | 4,509,000 | | | $ | 4,575,544 | | |
Gardenswartz Plaza,
7.40%, 5/1/07 | | 04/02/02 | | | 2,544,492 | (b) | | | 2,544,492 | | | | 2,620,826 | | |
Glen Lakes Health Plaza,
5.40%, 2/1/07 | | 01/15/04 | | | 3,714,646 | (b) | | | 3,714,646 | | | | 3,822,371 | | |
Hadley Avenue Business Center,
8.38%, 1/1/11 | | 12/14/00 | | | 2,345,131 | (b) | | | 2,345,131 | | | | 2,462,388 | | |
Harbor Corporate Center,
7.43%, 4/1/05 | | 03/07/02 | | | 5,400,000 | (b) | | | 5,400,000 | | | | 5,400,000 | | |
Hillside Office Park,
7.63%, 8/1/08 | | 07/09/98 | | | 894,777 | | | | 894,777 | | | | 930,567 | | |
Ina Corporate Land,
7.88%, 11/1/05 | | 11/02/01 | | | 2,085,000 | | | | 2,085,000 | | | | 2,085,000 | | |
Katy Plaza II, 9.88%,
1/1/05 | | 01/01/04 | | | 1,785,892 | | | | 1,785,892 | | | | 1,609,762 | | |
La Posada & Casitas I,
7.93%, 11/1/05 | | 11/02/01 | | | 5,680,000 | | | | 5,680,000 | | | | 5,680,000 | | |
LaCosta Centre,
5.20%, 3/1/09 | | 02/27/04 | | | 4,642,190 | (b) | | | 4,642,190 | | | | 4,726,456 | | |
Lincoln Industrial,
7.40%, 12/1/05 | | 11/20/02 | | | 2,999,375 | (b) | | | 2,999,375 | | | | 3,059,363 | | |
Minikahda Mini Storage III,
8.62%, 8/1/09 | | 09/16/99 | | | 3,923,321 | (b) | | | 3,923,321 | | | | 4,119,487 | | |
Minikahda Mini Storage V,
8.75%, 9/1/09 | | 07/02/01 | | | 2,162,326 | (b) | | | 2,162,326 | | | | 2,270,443 | | |
Oak Knoll Village Shopping
Center, 6.73%, 10/1/13 | | 09/17/03 | | | 1,624,191 | (b) | | | 1,624,191 | | | | 1,705,401 | | |
PennMont Office Plaza,
6.88%, 5/1/06 | | 04/30/01 | | | 1,302,630 | (b) | | | 1,302,630 | | | | 1,328,683 | | |
Rapid Park Parking Lot,
5.15%, 11/1/07 | | 08/07/97 | | | 3,850,000 | (b) | | | 3,850,000 | | | | 3,938,165 | | |
Redwood Dental Building,
7.40%, 7/1/12 | | 06/28/02 | | | 2,648,472 | (b) | | | 2,648,472 | | | | 2,780,895 | | |
Rimrock Plaza,
7.65%, 12/1/08 | | 12/02/98 | | | 2,939,743 | (b) | | | 2,939,743 | | | | 3,057,333 | | |
Stevenson Office Building,
Port Orchard Cinema,
Jensen Industrial Building,
7.88%, 2/1/09 | | 01/21/99 | | | 2,829,535 | (b) | | | 2,829,535 | | | | 2,971,012 | | |
Sundance Plaza,
7.13%, 11/1/08 | | 10/29/98 | | | 585,483 | | | | 585,483 | | | | 614,757 | | |
| | | | 73,535,979 | | | | 75,221,945 | | |
| See accompanying Notes to Schedule of Investments. | |
2004 Semiannual Report
American Strategic Income Portfolio II
22
American Strategic Income Portfolio II
(Continued)
| Description of Security | | Date
Acquired | | Par
Value | | Cost | | Value (a) | |
| Multifamily Loans - 64.5% | | | |
Adelphi Springs Apartments,
9.93%, 3/1/09 | | 06/27/03 | | $ | 5,084,592 | | | $ | 5,084,592 | | | $ | 4,306,381 | | |
Autumnwood, Southern
Woods, Hinton Hollow,
7.68%, 6/1/09 | | 05/24/02 | | | 7,110,983 | (b) | | | 7,110,983 | | | | 7,466,532 | | |
Cameron Lakes Apartments I,
4.43%, 6/1/06 | | 12/18/01 | | | 10,125,000 | (b) | | | 10,125,000 | | | | 10,129,050 | | |
Cameron Lakes Apartments II,
14.88%, 3/1/05 | | 12/18/01 | | | 710,000 | | | | 710,000 | | | | 668,348 | | |
Chardonnay Apartments,
6.40%, 7/1/13 | | 06/05/03 | | | 4,094,462 | (b) | | | 4,094,462 | | | | 4,186,571 | | |
Deering Manor,
7.98%, 12/8/22 | | 12/08/92 | | | 1,038,108 | | | | 1,027,727 | | | | 1,038,108 | | |
Forest Estate Apartments,
9.88%, 3/15/05 | | 09/20/02 | | | 2,150,000 | | | | 2,150,000 | | | | 1,992,764 | | |
Forestree Apartments,
5.43%, 12/31/04 | | 06/01/01 | | | 7,725,000 | (b) | | | 7,725,000 | | | | 7,725,000 | | |
Forestree Apartments II,
5.38%, 12/31/04 | | 06/11/03 | | | 1,375,000 | | | | 1,375,000 | | | | 1,375,000 | | |
Fremont Plaza Apartments,
7.40%, 7/1/08 | | 07/01/98 | | | 2,379,520 | (b) | | | 2,379,520 | | | | 2,474,701 | | |
Hidden Woods Apartments I,
6.68%, 1/1/06 | | 12/18/02 | | | 12,000,000 | | | | 12,000,000 | | | | 11,662,999 | | |
Hidden Woods Apartments II,
11.88%, 1/1/06 | | 12/18/02 | | | 750,000 | | | | 750,000 | | | | 626,851 | | |
Highland Ridge & Highland
Glen Apartments,
14.90%, 10/1/08 | | 09/30/04 | | | 3,850,000 | | | | 3,850,000 | | | | 3,363,079 | | |
Home Park Village Apartments I,
5.43%, 10/1/06 | | 09/25/03 | | | 6,645,000 | (b) | | | 6,645,000 | | | | 6,777,900 | | |
Home Park Village Apartments II,
11.88%, 10/1/06 | | 09/25/03 | | | 592,000 | | | | 592,000 | | | | 529,515 | | |
Misty Woods/Riverfall Square I,
5.43%, 8/1/06 | | 07/23/03 | | | 7,966,000 | (b) | | | 7,966,000 | | | | 7,758,883 | | |
Misty Woods/Riverfall Square II,
9.88%, 8/1/06 | | 07/23/03 | | | 1,591,000 | | | | 1,591,000 | | | | 1,113,700 | | |
Oakton Terrace Apartments,
9.88%, 8/1/11 | | 06/27/03 | | | 670,141 | | | | 670,141 | | | | 670,141 | | |
Park Hampshire Apartments,
9.90%, 1/1/13 | | 06/27/03 | | | 3,111,280 | | | | 3,111,280 | | | | 2,304,712 | | |
| See accompanying Notes to Schedule of Investments. | |
2004 Semiannual Report
American Strategic Income Portfolio II
23
Schedule of INVESTMENTS (Unaudited) continued
American Strategic Income Portfolio II
(Continued)
| Description of Security | | Date
Acquired | | Par
Value | | Cost | | Value (a) | |
Primrose Apartments,
8.50%, 11/1/07 | | 10/19/95 | | $ | 1,008,090 | | | $ | 1,003,795 | | | $ | 1,048,413 | | |
Scottsdale Park Place,
5.68%, 11/1/07 | | 10/29/04 | | | 7,125,000 | | | | 7,125,000 | | | | 7,125,000 | | |
Seven Oaks Apartments,
12.93%, 8/1/09 | | 07/15/04 | | | 6,144,000 | | | | 6,144,000 | | | | 5,007,672 | | |
Southridge Apartments,
8.43%, 4/1/09 | | 03/22/02 | | | 7,569,212 | (b) | | | 7,569,212 | | | | 6,014,488 | | |
Stone Oak Place Apartments,
9.88%, 8/1/06 | | 07/22/03 | | | 1,000,000 | | | | 1,000,000 | | | | 971,455 | | |
Sussex Club Apartments I,
6.68%, 5/1/06 | | 04/08/03 | | | 9,798,000 | (b) | | | 9,798,000 | | | | 9,108,425 | | |
Sussex Club Apartments II,
11.88%, 5/1/06 | | 04/08/03 | | | 612,000 | | | | 612,000 | | | | 618,120 | | |
The Ridge Apartments,
9.88%, 3/1/08 | | 02/07/03 | | | 2,050,000 | | | | 2,050,000 | | | | 1,923,337 | | |
Timber Ridge Apartments,
9.88%, 5/1/05 | | 04/23/02 | | | 500,000 | | | | 500,000 | | | | 464,670 | | |
Walnut Factory / Z Lofts,
5.93%, 3/1/07 | | 02/06/04 | | | 7,548,163 | | | | 7,548,163 | | | | 7,383,362 | | |
Willowbook Apartments I,
5.93%, 4/1/06 | | 03/11/03 | | | 7,100,000 | | | | 7,100,000 | | | | 7,242,000 | | |
Willowbrook Apartments II,
11.88%, 4/1/06 | | 03/11/03 | | | 200,000 | | | | 200,000 | | | | 198,884 | | |
Winterland Apartments I,
9.23%, 7/1/12 | | 06/06/97 | | | 561,697 | | | | 561,697 | | | | 589,782 | | |
Winterland Apartments II,
9.23%, 7/1/12 | | 06/06/97 | | | 1,076,585 | | | | 1,076,585 | | | | 1,130,414 | | |
Woodside Village Apartments I,
5.40%, 10/1/06 | | 09/22/03 | | | 4,210,000 | (b) | | | 4,210,000 | | | | 4,294,200 | | |
Woodside Village Apartments II,
9.88%, 10/1/06 | | 09/22/03 | | | 947,000 | | | | 947,000 | | | | 801,189 | | |
| | | | 136,403,157 | | | | 130,091,646 | | |
| Single Family Loans - 0.6% | | | |
Merchants Bank,
10.48%, 12/1/20 | | 12/18/92 | | | 225,931 | | | | 227,789 | | | | 232,709 | | |
Neslund Properties,
9.88%, 2/1/23 | | 01/27/93 | | | 499,942 | | | | 497,460 | | | | 514,941 | | |
| See accompanying Notes to Schedule of Investments. | |
2004 Semiannual Report
American Strategic Income Portfolio II
24
American Strategic Income Portfolio II
(Continued)
| Description of Security | | Date
Acquired | | Par Value/
Shares | | Cost | | Value (a) | |
PHH U.S. Mortgage,
8.65%, 1/1/12 | | 12/30/92 | | $ | 482,889 | | | $ | 469,905 | | | $ | 427,689 | | |
| | | | 1,195,154 | | | | 1,175,339 | | |
Total Whole Loans and
Participation Mortgages | | | | | | | | | 211,134,290 | | | | 206,488,930 | | |
| Preferred Stocks - 2.0% | | | |
| Real Estate Investment Trusts - 2.0% | |
| AMB Property, Series L | | 09/07/04 | | | 219 | (f) | | | 5,442 | | | | 5,434 | | |
| AMB Property, Series M | | 09/08/04 | | | 3,659 | (f) | | | 93,619 | | | | 91,475 | | |
| Duke Realty Corp., Series J | | 09/08/04 | | | 27,139 | (f) | | | 690,855 | | | | 692,044 | | |
| Duke Realty Corp., Series K | | 09/08/04 | | | 8,000 | (f) | | | 198,800 | | | | 200,800 | | |
Equity Residential Properties,
Series N | | 09/14/04 | | | 6,244 | (f) | | | 156,352 | | | | 155,975 | | |
| Prologis Trust, Series F | | 09/08/04 | | | 35,120 | | | | 892,477 | | | | 892,750 | | |
| Prologis Trust, Series G | | 09/08/04 | | | 43,190 | | | | 1,098,075 | | | | 1,100,913 | | |
| Public Storage, Series A | | 09/08/04 | | | 24,331 | (f) | | | 594,039 | | | | 594,406 | | |
| Public Storage, Series X | | 09/07/04 | | | 5,599 | (f) | | | 140,769 | | | | 140,479 | | |
| Public Storage, Series Z | | 09/08/04 | | | 6,985 | (f) | | | 173,916 | | | | 173,577 | | |
| Total Preferred Stocks | | | | | | | | | 4,044,344 | | | | 4,047,853 | | |
Total Investments in
Unaffiliated Securities | | | | | | | | | 235,699,428 | | | | 231,377,629 | | |
| Affiliated Money Market Fund (h) - 1.8% | | | |
First American Prime
Obligations Fund, Class Z | | | | | 3,566,531 | | | | 3,566,531 | | | | 3,566,531 | | |
Total Investments in
Securities (i) - 116.5% | | | | | | | | $ | 239,265,959 | | | $ | 234,944,160 | | |
| See accompanying Notes to Schedule of Investments. | |
2004 Semiannual Report
American Strategic Income Portfolio II
25
Schedule of INVESTMENTS (Unaudited) continued
Notes to Schedule of Investments:
(a) Securities are valued in accordance with procedures described in note 2 in Notes to Financial Statements.
(b) On November 30, 2004, securities valued at $143,941,264 were pledged as collateral for the following outstanding reverse repurchase agreements:
| Amount | | Acquisition
Date | | Rate | | Due | | Accrued
Interest | | Name of
Broker
and Description
of Collateral | |
| $ | 13,969,673 | | | | 11/8/04 | | | | 2.07 | %* | | | 12/8/04 | | | $ | 18,475 | | | | (1 | ) | |
| | 19,500,000 | | | | 11/1/04 | | | | 2.89 | %* | | | 12/1/04 | | | | 46,983 | | | | (2 | ) | |
| $ | 33,469,673 | | | | | | | | | $ | 65,458 | | | | |
*Interest rate as of November 30, 2004. Rates are based on the London InterBank Offered Rate (LIBOR) plus a spread and reset monthly.
Name of broker and description of collateral:
(1) Morgan Stanley:
FHLMC, 5.5%, 1/1/18, $6,923,229 par
FHLMC, 9.00%, 7/1/30, $513,867 par
FNMA, 6.00%, 10/1/16, $581,576 par
FNMA, 5.50%, 6/1/17, $587,181 par
FNMA, 5.00%, 9/1/17, $954,510 par
FNMA, 6.50%, 6/1/29, $2,468,134 par
FNMA, 7.50%, 4/1/30, $313,162 par
FNMA, 7.50%, 5/1/30, $335,047 par
FNMA, 8.00%, 5/1/30, $74,144 par
FNMA, 8.00%, 6/1/30, $421,885 par
(2) Morgan Stanley:
1336 and 1360 Energy Park Drive, 7.55%, 10/1/08, $2,690,910 par
5555 East Van Buren, 5.68%, 7/1/11, $6,500,000 par
Autumnwood, Southern Woods, Hinton Hollow, 7.68%, 6/1/09,
$7,110,983 par
Bigelow Office Building, 8.88%, 4/1/07, $1,237,865 par
Cameron Lakes Apartments I, 4.43%, 6/1/06, $10,125,000 par
Chardonnay Apartments, 6.40%, 7/1/13, $4,094,462 par
Cypress Point Office Park I, 5.30%, 6/1/09, $4,641,000 par
Cypress Point Office Park II, 5.30%, 7/1/09, $4,509,000 par
Forestree Apartments, 5.43%, 12/31/04, $7,725,000 par
Fremont Plaza Apartments, 7.40%, 7/1/08, $2,379,520 par
Gardenswartz Plaza, 7.40%, 5/1/07, $2,544,492 par
Glen Lakes Health Plaza , 5.40%, 2/1/07, $3,714,646 par
Hadley Avenue Business Center, 8.38%, 1/1/11, $2,345,131 par
Harbor Corporate Center, 7.43%, 4/1/05, $5,400,000 par
Home Park Village Apartments I, 5.43%, 10/1/06, $6,645,000 par
Misty Woods/Riverfall Square I, 5.43%, 8/1/06, $7,966,000 par
LaCosta Centre, 5.20%, 3/1/09, $4,642,190 par
Lincoln Industrial, 7.40%, 12/1/05, $2,999,375 par
Minikahda Mini Storage III, 8.62%, 8/1/09, $3,923,321 par
Minikahda Mini Storage V, 8.75%, 9/1/09, $2,162,326 par
Oak Knoll Village Shopping Center, 6.73%, 10/1/13, $1,624,191 par
PennMont Office Plaza, 6.88%, 5/1/06, $1,302,630 par
2004 Semiannual Report
American Strategic Income Portfolio II
26
Rapid Park Parking Lot, 5.15%, 11/1/07, $3,850,000 par
Redwood Dental Building, 7.40%, 7/1/12, $2,648,472 par
Rimrock Plaza, 7.65%, 12/1/08, $2,939,743 par
Southridge Apartments, 8.43%, 4/1/09, $7,569,212 par
Stevenson Office Building, Port Orchard Cinema, Jensen Industrial
Building, 7.88%, 2/1/09, $2,829,535 par
Sussex Club Apartments I, 6.68%, 5/1/06, $9,798,000 par
Woodside Village Apartments I, 5.40%, 10/1/06, $4,210,000 par
The fund has entered into a lending commitment with Morgan Stanley. The agreement permits the fund to enter into reverse repurchase agreements up to $70,000,000 using whole loans as collateral. The fund pays a fee of 0.15% to Morgan Stanley on any unused portion of the $70,000,000 lending commitment.
(c) Interest rates on commercial and multifamily loans are the rates in effect on November 30, 2004. Interest rates and maturity dates disclosed on single family loans represent the weighted average coupon and weighted average maturity for the underlying mortgage loans as of November 30, 2004.
(d) Commercial and multifamily loans are described by the name of the mortgaged property. Pools of single family loans are described by the name of the institution from which the loans were purchased. The geographical location of the mortgaged properties and, in the case of single family, the number of loans, is presented below.
Commercial Loans:
1336 and 1360 Energy Park Drive – St. Paul, MN
5555 East Van Buren – Phoenix, AZ
Bigelow Office Building – Las Vegas, NV
Cypress Point Office Park I – Tampa, FL
Cypress Point Office Park II – Tampa, FL
Gardenswartz Plaza – Santa Fe, NM
Glen Lakes Health Plaza – Austin, TX
Hadley Avenue Business Center – Oakdale, MN
Harbor Corporate Center – Los Angeles, CA
Hillside Office Park – Elk River, MN
Ina Corporate Land – Tuscon, AZ
Katy Plaza II – Houston, TX
La Posada & Casitas I – Tuscon, AZ
LaCosta Centre – Austin, TX
Lincoln Industrial – Lauderhill, FL
;Minikahda Mini Storage III – St. Paul, MN
Minikahda Mini Storage V – St. Paul, MN
Oak Knoll Village Shopping Center – Austin, TX
PennMont Office Plaza – Albuquerque, NM
Rapid Park Parking Lot – Minneapolis, MN
Redwood Dental Building – Taylorsville, UT
Rimrock Plaza – Billings, MT
Stevenson Office Building, Port Orchard Cinema, Jensen Industrial Building –
Stevenson, Port Orchard, and Arlington, WA
Sundance Plaza – Colorado Springs, CO
Multifamily Loans:
Adelphi Springs Apartments – Adelphi, MD
Autumnwood, Southern Woods, Hinton Hollow – Knoxville, TN
Cameron Lakes Apartments I – Clearwater, FL
Cameron Lakes Apartments II – Clearwater, FL
Chardonnay Apartments – Tulsa, OK
Deering Manor – Nashwauk, MN
2004 Semiannual Report
American Strategic Income Portfolio II
27
Schedule of INVESTMENTS (Unaudited) continued
Forest Estate Apartments, Dallas, TX
Forestree Apartments – Houston, TX
Forestree Apartments II – Houston, TX
Fremont Plaza Apartments – Phoenix, AZ
Hidden Woods Apartments I – College Park, GA
Hidden Woods Apartments II – College Park, GA
Highland Ridge & Highland Glen Apartments – Oklahoma City, OK
Home Park Village Apartments I – San Diego, CA
Home Park Village Apartments II – San Diego, CA
Misty Woods/Riverfall Square I – Arlington and Dallas, TX
Misty Woods/Riverfall Square II – Arlington and Dallas, TX
Oakton Terrace Apartments – Adelphi, MD
Park Hampshire Apartments – Adelphi, MD
Primrose Apartments – Grand Falls , ND
Scottsdale Park Place – Scottsdale, AZ
Seven Oaks Apartments – Garland, TX
Southridge Apartments – Austin, TX
Stone Oak Place Apartments – San Antonio, TX
Sussex Club Apartments I – Athens, GA
Sussex Club Apartments II – Athens, GA
The Ridge Apartments – College Station, TX
Timber Ridge Apartments – Houston, TX
Walnut Factory / Z Lofts – Santa Clara, CA
Willowbrook Apartments I – Reno, NV
Willowbrook Apartments II – Reno, NV
Winterland Apartments I – Grand Forks, ND
Winterland Apartments II – Grand Forks, ND
Woodside Village Apartments I – Midwest City, OK
Woodside Village Apartments II – Midwest City, OK
Single Family Loans:
Merchants Bank – 10 loans, Vermont
Neslund Properties – 32 loans, Minnesota
PHH U.S. Mortgage – 5 loans, United States
(e) Securities purchased as part of a private placement which have not been registered with the Securities and Exchange Commission under the Securities Act of 1933 and are considered to be illiquid. These securities are fair valued in accordance with the board approved valuation procedures. On November 30, 2004, the total value of fair valued securities was $211,828,528 or 105.1% of net assets. See note 2 in Notes to Financial Statements.
(f) This security (or a portion of this security) has been purchased on a when-issued basis. On November 30, 2004, the total cost of these investments were $1,287,332.
(g) Security pledged as collateral for positions purchased on a when-issued basis.
(h) Investment in affiliated security. This money market fund is advised by U.S. Bancorp Asset Management, Inc., which also serves as advisor for the fund. See note 3 in Notes to Financial Statements.
(i) On November 30, 2004, the cost of investments in securities was $239,265,959. The aggregate gross unrealized appreciation and depreciation of investments in securities, based on this cost were as follows:
| Gross unrealized appreciation | | $ | 3,296,929 | | |
| Gross unrealized depreciation | | | (7,618,728 | ) | |
| Net unrealized depreciation | | $ | (4,321,799 | ) | |
Abbreviations:
FHLMC–Federal Home Loan Mortgage Corporation
FNMA–Federal National Mortgage Association
2004 Semiannual Report
American Strategic Income Portfolio II
28
NOTICE TO SHAREHOLDERS (Unaudited)
| How to Obtain a Copy of the Fund's Proxy Voting Policies and Proxy Voting Record | |
|
| A description of the policies and procedures that the fund uses to determine how to vote proxies relating to portfolio securities, as well as information regarding how the fund voted proxies relating to portfolio securities during the most recent 12 month period ended June 30, is available (1) without charge upon request by calling 800.677.FUND; (2) at firstamericanfunds.com; and (3) on the U.S. Securities and Exchange Commission's website at http://www.sec.gov. | |
|
| Quarterly Portfolio Holdings Information | |
|
| The fund files its complete schedule of portfolio holdings for the first and third quarters of each fiscal year with the Securities and Exchange Commission on Form N-Q. The fund's Forms N-Q are available (1) without charge upon request by calling 800.677.FUND; (2) at firstamericanfunds.com; and (3) on the U.S. Securities and Exchange Commission's website at http://www.sec.gov. In addition, you may review and copy the fund's Forms N-Q at the Commissions Public Reference Room in Washington D.C. You may obtain information on the operation of the Public Reference Room by calling 1-800-SEC-0330. | |
|
2004 Semiannual Report
American Strategic Income Portfolio II
29
(This page has been left blank intentionally.)
(This page has been left blank intentionally.)
(This page has been left blank intentionally.)
Board of DIRECTORS
VIRGINIA STRINGER
Chairperson of American Strategic Income Portfolio Inc. II
Owner and President of Strategic Management Resources, Inc.
BENJAMIN FIELD III
Director of American Strategic Income Portfolio Inc. II
Retired; former Senior Financial Advisor, Senior Vice President, Chief Financial Officer, and Treasurer of Bemis Company, Inc.
MICKEY FORET
Director of American Strategic Income Portfolio Inc. II
Consultant to, and formerly Executive Vice President and Chief Financial Officer of, Northwest Airlines, Inc.
ROGER GIBSON
Director of American Strategic Income Portfolio Inc. II
Retired; former Vice President of Cargo-United Airlines
VICTORIA HERGET
Director of American Strategic Income Portfolio Inc. II
Investment Consultant; former Managing Director of Zurich Scudder Investments
LEONARD KEDROWSKI
Director of American Strategic Income Portfolio Inc. II
Owner and President of Executive and Management Consulting, Inc.
RICHARD RIEDERER
Director of American Strategic Income Portfolio Inc. II
Retired; former President and Chief Executive Officer of Weirton Steel
JOSEPH STRAUSS
Director of American Strategic Income Portfolio Inc. II
Owner and President of Strauss Management Company
JAMES WADE
Director of American Strategic Income Portfolio Inc. II
Owner and President of Jim Wade Homes
American Strategic Income Portfolio Inc. II’s Board of Directors is comprised entirely of independent directors.

AMERICAN STRATEGIC INCOME PORTFOLIO INC. II
2004 Semiannual Report
U.S. Bancorp Asset Management, Inc., is a wholly owned subsidiary of U.S. Bank National Association, which is a wholly owned subsidiary of U.S. Bancorp.

| This document is printed on paper
containing 10% postconsumer waste. |
1/2005 0438-04 BSP-SAR
Item 2—Code of Ethics
Not applicable to semi-annual report.
Item 3—Audit Committee Financial Expert
Not applicable to semi-annual report.
Item 4—Principal Accountant Fees and Services
Not applicable to semi-annual report.
Item 5—Audit Committee of Listed Registrants
Not applicable to semi-annual report.
Item 6—Schedule of Investments
The schedule is included as part of the report to shareholders filed under Item 1 of this Form.
Item 7—Disclosure of Proxy Voting Policies and Procedures for Closed-End Management Investment Companies
Not applicable to semi-annual report.
Item 8—Portfolio Managers of Closed-End Management Investment Companies
Not applicable. Applicable for fiscal years ending on or after December 31, 2005.
Item 9—Purchases of Equity Securities by Closed-End Management Investment Company and Affiliated Purchasers
Neither the registrant nor any “affiliated purchaser,” as defined in Rule 10b-18(a)(3) under the Exchange Act (17 CFR 240.10b-18(a)(3)), purchased any shares or other units of any class of the registrant’s equity securities that is registered pursuant to Section 12 of the Exchange Act (15 U.S.C. 781).
Item 10—Submission of Matters to a Vote of Security Holders
There have been no material changes to the procedures by which shareholders may recommend nominees to the registrant’s board of directors, where those changes were implemented after the registrant last provided disclosure in response to the requirements of this Item.
Item 11—Controls and Procedures
(a) The registrant’s Principal Executive Officer and Principal Financial Officer have evaluated the registrant’s disclosure controls and procedures within 90 days of the date of this filing and have concluded that the registrant’s disclosure controls and procedures were effective, as of that date, in ensuring that information required to be disclosed by the registrant in this Form N-CSR was recorded, processed, summarized and reported timely.
(b) There were no changes in the registrant’s internal control over financial reporting that occurred during the second fiscal quarter of the period covered by this report that have materially affected, or are reasonably likely to materially affect, the registrant’s internal control over financial reporting.
Item 12 – Exhibits
(a)(1) Not applicable.
(a)(2) Certifications of the principal executive and principal financial officer of the registrant as required by Rule 30a-2(a) under the Investment Company Act are filed as exhibits hereto.
(a)(3) Not applicable.
(b) Certifications of the principal executive and principal financial officer of the registrant as required by Rule 30a-2(b) under the Investment Company Act are filed as exhibits hereto.
Signatures
Pursuant to the requirements of the Securities Exchange Act of 1934 and the Investment Company Act of 1940, the registrant has duly caused this report to be signed on its behalf by the undersigned, thereunto duly authorized.
American Strategic Income Portfolio, Inc. II
By: |
/s/ Thomas S. Schreier, Jr. | |
Thomas S. Schreier, Jr. |
President |
|
Date: February 7, 2005 |
Pursuant to the requirements of the Securities Exchange Act of 1934 and the Investment Company Act of 1940, this report has been signed below by the following persons on behalf of the registrant and in the capacities and on the dates indicated.
By: |
/s/ Thomas S. Schreier, Jr. | |
Thomas S. Schreier, Jr. |
President |
|
Date: February 7, 2005 |
|
By: |
/s/ Charles D. Gariboldi | |
Charles D. Gariboldi |
Treasurer |
|
Date: February 7, 2005 |