Exhibit 99.3
Management’s Discussion and Analysis
February 21, 2023
1
Teck 2022 Management’s Discussion and Analysis
Management’s Discussion and Analysis
Our business is exploring for, acquiring, developing and producing natural resources. We are organized into business units focused on copper, zinc and steelmaking coal, with increasing focus on the development of an industry-leading portfolio of copper and zinc development projects. These are supported by our corporate offices, which manage our corporate growth initiatives and provide marketing, administrative, technical, health, safety, environment, community, financial and other services.
Through our interests in mining and processing operations in Canada, the United States (U.S.), Chile and Peru, we are an important producer of copper, one of the world’s largest producers of mined zinc and the world’s second-largest seaborne exporter of steelmaking coal. We also produce lead, silver, molybdenum and various specialty and other metals, chemicals and fertilizers. We actively explore for copper, zinc, nickel and gold.
This Management’s Discussion and Analysis of our results of operations is prepared as at February 21, 2023 and should be read in conjunction with our audited annual consolidated financial statements for the year ended December 31, 2022. Unless the context otherwise dictates, a reference to Teck, Teck Resources, the Company, us, we or our refers to Teck Resources Limited and its subsidiaries, including Teck Metals Ltd. and Teck Coal Partnership. All dollar amounts are in Canadian dollars, unless otherwise stated, and are based on our 2022 audited annual consolidated financial statements that are prepared in accordance with International Financial Reporting Standards (IFRS) as issued by the International Accounting Standards Board (IASB). In addition, we use certain financial measures, which are identified throughout the Management’s Discussion and Analysis in this report, that are not measures recognized under IFRS and do not have a standardized meaning prescribed by IFRS. See “Use of Non-GAAP Financial Measures and Ratios” on page 64 for an explanation of these financial measures and reconciliation to the most directly comparable financial measures under IFRS.
This Management’s Discussion and Analysis contains certain forward-looking information and forward-looking statements. You should review the cautionary statement on forward-looking statements under the heading “Cautionary Statement on Forward-Looking Statements” on page 75, which forms part of this Management’s Discussion and Analysis, as well as the risk factors discussed in our most recent Annual Information Form.
Additional information about us, including our most recent Annual Information Form, is available on our website at www.teck.com, under Teck’s profile at www.sedar.com (SEDAR), and on the EDGAR section of the United States Securities and Exchange Commission (SEC) website at www.sec.gov.
2
Teck 2022 Management’s Discussion and Analysis
Business Unit Results
The following table shows a summary of our production of our major commodities for the last five years and estimated production for 2023.
Five-Year Production Record and Our Estimated Production in 2023
| | | | | | | | | | | | | | | | | | | | | | | |
| Principal Products | | 2018 | 2019 | 2020 | 2021 | 2022 | 2023 estimate2 |
| | | | | |
|
|
Copper1 | thousand tonnes | 294 | | 297 | | 276 | | 287 | | 270 | | 418 |
| | | | | |
|
|
| Zinc | | | | | |
|
|
Contained in concentrate1 | thousand tonnes | 705 | | 640 | | 587 | | 607 | | 650 | | 665 |
| Refined | thousand tonnes | 303 | | 287 | | 305 | | 279 | | 249 | | 280 |
| | | | | |
|
|
| Steelmaking coal | million tonnes | 26.2 | | 25.7 | | 21.1 | | 24.6 | | 21.5 | | 25.0 |
| | | | | |
| |
Notes:
1.We include 100% of production and sales from our Quebrada Blanca and Carmen de Andacollo mines in our production and sales volumes, even though we do not own 100% of these operations, because we fully consolidate their results in our financial statements. We include 22.5% of production and sales from Antamina, representing our proportionate ownership interest in this operation. Zinc contained in concentrate production includes co-product zinc production from our 22.5% interest in Antamina.
2.Production estimates for 2023 represent the midpoint of our production guidance range. The 2023 copper production guidance includes Quebrada Blanca concentrate production.
3
Teck 2022 Management’s Discussion and Analysis
Average commodity prices and exchange rates for the past three years, which are key drivers of our profit, are summarized in the following table.
| | | | | | | | | | | | | | | | | |
| US$ |
| 2022 | % chg | 2021 | % chg | 2020 |
| Copper (LME cash — $/pound) | $ | 3.99 | | -6% | $ | 4.23 | | +51% | $ | 2.80 | |
| Zinc (LME cash — $/pound) | 1.58 | +16% | 1.36 | | +32% | 1.03 | |
| Steelmaking coal (realized — $/tonne) | 355 | +70% | 209 | +85% | 113 |
| Exchange rate (Bank of Canada) | | | | | |
| US$1 = CAD$ | 1.30 | +4% | 1.25 | | -7% | 1.34 | |
| CAD$1 = US$ | 0.77 | -4% | 0.80 | | +7% | 0.75 | |
Our revenue, gross profit and gross profit before depreciation and amortization, by business unit, for the past three years are summarized in the following table.
| | | | | | | | | | | | | | | | | | | | | | | | | | | | | |
| Revenue | Gross Profit (Loss) | Gross Profit (Loss) Before Depreciation and Amortization1 |
| ($ in millions) | 2022 | 2021 | 2020 | 2022 | 2021 | 2020 | 2022 | 2021 | 2020 |
| Copper | $ | 3,381 | | $ | 3,452 | | $ | 2,419 | | $ | 1,399 | | $ | 1,741 | | $ | 859 | | $ | 1,837 | | $ | 2,126 | | $ | 1,242 | |
| Zinc | 3,526 | | 3,063 | | 2,700 | | 771 | | 688 | | 523 | | 1,044 | | 918 | | 815 | |
| Steelmaking coal | 10,409 | | 6,251 | | 3,375 | | 6,401 | | 2,785 | | 277 | | 7,364 | | 3,657 | | 1,009 | |
Energy2 | — | | — | | 454 | | — | | — | | (326) | | — | | — | | (223) | |
| Total | $ | 17,316 | | $ | 12,766 | | $ | 8,948 | | $ | 8,571 | | $ | 5,214 | | $ | 1,333 | | $ | 10,245 | | $ | 6,701 | | $ | 2,843 | |
Note:
1.This is a non-GAAP financial measure or ratio. See “Use of Non-GAAP Financial Measures and Ratios” section for further information.
2.Comparative figures for 2021 for the Energy Business Unit have been represented for the classification of Fort Hills as a discontinued operation. 2020 figures have not been represented.
4
Teck 2022 Management’s Discussion and Analysis
Copper
In 2022, we produced 270,500 tonnes of copper from our Highland Valley Copper Operations in B.C., our 22.5% interest in Antamina in Peru, and our Carmen de Andacollo and Quebrada Blanca operations in Chile.
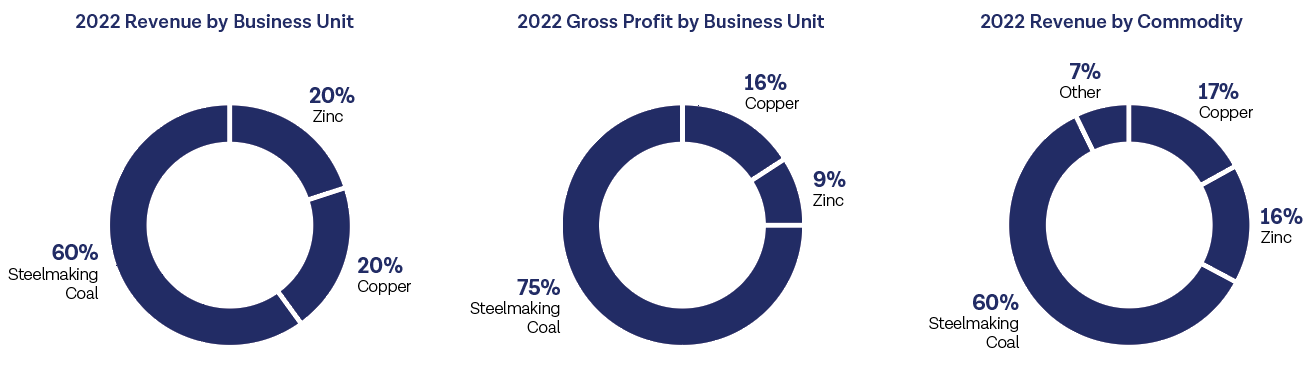
In 2022, our copper business unit accounted for 20% of our revenue and 16% of our gross profit.
| | | | | | | | | | | | | | | | | | | | | | | | | | | | | |
| Revenue | Gross Profit (Loss) | Gross Profit (Loss) Before Depreciation and Amortization1 |
| ($ in millions) | 2022 | 2021 | 2020 | 2022 | 2021 | 2020 | 2022 | 2021 | 2020 |
| Highland Valley Copper | $ | 1,454 | | $ | 1,440 | | $ | 993 | | $ | 580 | | $ | 721 | | $ | 331 | | $ | 738 | | $ | 883 | | $ | 476 | |
| Antamina | 1,423 | | 1,383 | | 868 | 818 | | 828 | 414 | | 1,021 | | 992 | 566 |
| Carmen de Andacollo | 399 | | 493 | 442 | 2 | | 153 | 95 | | 73 | | 209 | 170 |
| Quebrada Blanca | 105 | | 136 | 116 | 2 | | 39 | 19 | 8 | | 42 | | 30 |
| Other | — | | — | | — | | (3) | | — | | — | | (3) | | — | | — | |
| Total | $ | 3,381 | | $ | 3,452 | | $ | 2,419 | | $ | 1,399 | | $ | 1,741 | | $ | 859 | | $ | 1,837 | | $ | 2,126 | | $ | 1,242 | |
Note:
1.This is a non-GAAP financial measure or ratio. See “Use of Non-GAAP Financial Measures and Ratios” section for further information.
| | | | | | | | | | | | | | | | | | | | |
| Production1 | Sales1 |
| (thousand tonnes) | 2022 | 2021 | 2020 | 2022 | 2021 | 2020 |
| Highland Valley Copper | 119 | 131 | 119 | 127 | 124 | 119 |
| Antamina | 102 | 100 | 86 | 101 | 99 | 85 |
| Carmen de Andacollo | 39 | 45 | 58 | 39 | 45 | 59 |
| Quebrada Blanca | 10 | 11 | 13 | 9 | 12 | 14 |
| Total | 270 | 287 | 276 | 276 | 280 | 277 |
Note:
1.We include 100% of production and sales from our Quebrada Blanca and Carmen de Andacollo mines in our production and sales volumes, even though we do not own 100% of these operations, because we fully consolidate their results in our financial statements. We include 22.5% of production and sales from Antamina, representing our proportionate ownership interest in the operation.
Operations
Highland Valley Copper
Highland Valley Copper Operations is located in south-central B.C. Gross profit was $580 million in 2022, compared with $721 million in 2021 and $331 million in 2020. The decrease from 2021 was primarily the result of lower copper prices and production, and higher operating costs driven by inflationary pressures.
Highland Valley Copper’s 2022 copper production was 119,100 tonnes, compared to 130,800 tonnes in 2021. The decrease in 2022 production was primarily a result of lower copper grades, coupled with a decrease in mill throughput driven by processing harder ore, as expected in the mine plan. This was partially offset by an increase in mill recoveries. Production during the fourth quarter of 2022 was impacted by a temporary pit closure as a result of a localized geotechnical instability event that has since been stabilized. Molybdenum
5
Teck 2022 Management’s Discussion and Analysis
production was 10% lower in 2022 at 1.0 million pounds compared to 2021, primarily due to lower grades, as expected in the mine plan.
Copper production in 2023 is anticipated to be between 110,000 and 118,000 tonnes, with a relatively even distribution throughout the year. Copper production from 2024 to 2026 is expected to be between 120,000 and 165,000 tonnes per year. Molybdenum production in 2023 is expected to be between 0.8 million and 1.2 million pounds, with production expected to be between 2.0 million and 6.0 million pounds per year from 2024 to 2026.
Antamina
We have a 22.5% share interest in Antamina, a copper-zinc mine in Peru. The other shareholders are BHP (33.75%), Glencore (33.75%) and Mitsubishi Corporation (10%). Our share of gross profit in 2022 was $818 million, compared with $828 million in 2021 and $414 million in 2020. Gross profit in 2022 was similar to 2021, as higher zinc prices partly offset reduced zinc production, lower copper prices and higher operating costs due to significant inflationary increases on consumables such as diesel and explosives in 2022.
On a 100% basis, Antamina’s copper production in 2022 was 454,800 tonnes, compared to 445,300 tonnes in 2021. Zinc production was 433,000 tonnes in 2022, a decrease from 462,200 tonnes of production in 2021. Copper production rose and zinc production declined in 2022 primarily due to treating more copper-only ore, per the mine plan. In 2022, 100% molybdenum production was 6.9 million pounds, which was 40% higher than in 2021.
In 2022, Antamina submitted a MEIA (Modification of Environmental Impact Assessment) to Peruvian regulators to extend its mine life from 2028 to 2036. The regulatory review process is progressing as scheduled, with approval anticipated in the second half of 2023.
Pursuant to a long-term streaming agreement made in 2015, Teck delivers an equivalent to 22.5% of payable silver sold by Compañía Minera Antamina S.A. to a subsidiary of Franco-Nevada Corporation (FNC). FNC pays a cash price of 5% of the spot price at the time of each delivery, in addition to an upfront acquisition price previously paid. In 2022, approximately 3.1 million ounces of silver were delivered under the agreement. After 86 million ounces of silver have been delivered under the agreement, the stream will be reduced by one-third. A total of 24.9 million ounces of silver have been delivered under the agreement from the effective date in 2015 to December 31, 2022.
Our 22.5% share of 2023 production at Antamina is expected to be in the range of 90,000 to 97,000 tonnes of copper, 95,000 to 105,000 tonnes of zinc and 2.2 to 2.6 million pounds of molybdenum. Our share of annual copper production is expected to be between 90,000 and 100,000 tonnes from 2024 to 2026. Our share of zinc production is expected to average between 55,000 and 95,000 tonnes per year during 2024 to 2026, with annual production fluctuating due to feed grades and the amount of copper-zinc ore available to process. Our share of annual molybdenum production is expected to be between 2.0 and 4.0 million pounds between 2024 and 2026.
6
Teck 2022 Management’s Discussion and Analysis
Carmen de Andacollo
We have a 90% interest in the Carmen de Andacollo mine, which is located in the Coquimbo Region of central Chile. The remaining 10% is owned by Empresa Nacional de Minería (ENAMI), a state-owned Chilean mining company. Gross profit decreased to $2 million in 2022 from $153 million in 2021 and $95 million in 2020. Gross profit decreased in 2022 primarily due to lower copper prices, along with higher unit operating costs driven by high inflation in 2022 on consumables, and lower production and sales volumes as a result of processing lower copper grade material.
Carmen de Andacollo produced 38,600 tonnes of copper contained in concentrate in 2022, compared to 43,500 tonnes in 2021, driven by lower copper grades due to weather events that decreased access to fresh ore feed, resulting in the processing of stockpiled ore with a lower copper grade. Copper cathode production was 900 tonnes in 2022 compared with 1,300 tonnes in 2021. Gold production of 25,900 ounces in 2022 was lower than the 35,800 ounces produced in 2021, with 100% of the gold produced for the account of RGLD Gold AG, a wholly owned subsidiary of Royal Gold, Inc. In effect, 100% of gold production from the mine has been sold to Royal Gold, Inc., who pays a cash price of 15% of the monthly average gold price at the time of each delivery, in addition to an upfront acquisition price previously paid.
Carmen de Andacollo’s production in 2023 is expected to be in the range of 40,000 to 50,000 tonnes of copper. Annual copper in concentrate production is expected to be between 50,000 and 60,000 tonnes for 2024 to 2026.
Quebrada Blanca
Quebrada Blanca is located in the Tarapacá Region of northern Chile. We have a 60% indirect interest in Compañía Minera Quebrada Blanca S.A. (QBSA). A 30% interest is owned indirectly by Sumitomo Metal Mining Co., Ltd. and Sumitomo Corporation (together referred to as SMM/SC), and 10% is owned by ENAMI. ENAMI’s 10% preference share interest in QBSA does not require ENAMI to fund capital spending.
Quebrada Blanca Operations
Quebrada Blanca’s gross profit in 2022 was $2 million compared with $39 million in 2021 and $19 million in 2020. The decreased gross profit in 2022 compared with 2021 is primarily a result of lower copper prices, higher unit operating costs driven by inflationary pressures on consumables, and lower production and sales volumes, as expected.
Quebrada Blanca produced 9,600 tonnes of copper cathode in 2022, compared to 11,500 tonnes in 2021, with the decrease due to the continued decline of cathode production, as the operation ceased mining in 2018. Copper cathode production is now expected to continue through 2023 using existing leach piles, and we expect 2023 to be the final year of cathode production.
7
Teck 2022 Management’s Discussion and Analysis
Quebrada Blanca Phase 2
The Quebrada Blanca hypogene deposit is one of the world’s largest unexploited copper resources. The operation is expected to have low operating costs, an initial mine life of 27 years and significant potential for further growth. Teck approved the QB2 project for full construction in December 2018 and the project continued to advance construction, pre-operational testing and commissioning through 2022, with first production expected in the first quarter of 2023. The final construction completion and commissioning will support ramp-up to full capacity, which is expected before the end of 2023.
Construction of associated port facilities is ongoing, with the ship loader expected to be in service in the fourth quarter of 2023. Any timing gap between available concentrate and shiploading will be managed through a combination of deliveries to alternate ports and domestic sales.
Construction capital cost guidance remains unchanged from our prior disclosure of US$7.4 to US$7.75 billion. Project development expenditures in 2022 were approximately $3.1 billion. We expect to spend approximately US$900 million to US$1.3 billion of QB2 development capital in 2023. A portion of this capital is related to items outside of the critical path for first copper, including the ship loader and the molybdenum plant.
As noted above, the QB2 project is expected to ramp up to full production capacity before the end of 2023. We expect copper in concentrate production to be between 285,000 and 315,000 tonnes per year for 2024 to 2026, with molybdenum production between 10.0 and 14.0 million pounds per year.
Copper Growth Projects
We continue to actively advance our industry-leading Copper Growth portfolio. The approach is driven by balancing growth and return of capital, value-focused asset de-risking, optimization of funding sources, and prioritization and sequencing of capital investments. As part of our Copper Growth strategy, Teck, together with our partners, continues to advance eight significant copper-dominant base metals assets. We are meeting project, permitting and commercial milestones in order to position Teck with various high-quality development options to maximize value from copper demand well beyond the ramp-up of QB2 and the continued operation of our core copper-producing operations. The Copper Growth portfolio comprises eight assets, namely Highland Valley Copper 2040, Zafranal, San Nicolás, NewRange Copper Nickel (formerly Mesaba and NorthMet), the Quebrada Blanca Mill Expansion (QBME), Galore Creek, Schaft Creek and NuevaUnión. All assets are located in the Americas in jurisdictions that we are familiar with and where we have experience conducting detailed studies, advancing permitting activities, developing strong community and stakeholder relationships, and operating mines in a productive, sustainable and safe manner.
We continue to advance the Highland Valley Copper 2040 (HVC 2040) project to extend the life of the operation to at least 2040, through an extension of the existing site infrastructure to access and liberate substantial copper-molybdenum mineral resources. HVC 2040 is undergoing a feasibility study, which is
8
Teck 2022 Management’s Discussion and Analysis
targeted for completion in the second half of 2023, and a concurrent environmental assessment application is in progress under the B.C. Environmental Assessment Act, with submission planned in the second half of 2023.
Work in 2023 on the Zafranal copper-gold project located in the Arequipa Region of Peru will be focused on completing a regulator-led review of the project’s Social and Environmental Impact Assessment (SEIA) permit application, as well as on meeting the project’s community commitments and key stakeholder engagement activities in the areas of health, capacity building, cultural heritage resource management and water. We expect to potentially receive the SEIA permit for Zafranal in the first half of 2023 and will then focus our attention on updating feasibility study capital and operating cost estimates, as well as initiating detailed engineering study work in support of a potential project sanction decision in 2024, targeting potential first production in 2027.
The San Nicolás copper-zinc project located in Zacatecas State, Mexico, initiated a feasibility study in the first quarter of 2022, with completion targeted in early 2024. In addition, work in 2023 will include the submission of an Environmental Impact Assessment (MIA-R), continuing social and environmental baseline studies, and completing additional socio-economic studies in support of advancing through permitting and the next investment decision milestone. The proposed partnering transaction with Agnico Eagle in San Nicolás, announced in the third quarter of 2022, is expected to close in the second quarter of 2023, after which the partners will work together to complete ongoing study and permitting work, targeting potential first production for 2027.
In the third quarter of 2022, we announced an agreement with PolyMet Mining Corp. to form a 50:50 joint venture to advance the NorthMet project and our Mesaba mineral deposit. This transaction closed on February 15, 2023. The 50:50 joint venture is held and operated through a new entity called NewRange Copper Nickel LLC. Planned work activities in 2023 will be to update the NorthMet feasibility study, including capital and operating cost estimates, advance salvage and demolition work on this expansive brownfield site, and secure the development permits for NorthMet, which are currently being contested in the courts. Baseline social and environmental studies, along with select technical studies on Mesaba, will continue in 2023. To support the initiation of a prefeasibility study at Mesaba in 2024, we will focus on capturing necessary information, which will include input from communities of interest, local and regional Indigenous Peoples, and interest groups.
The QBME project progressed in 2022, with a focus on trade-off studies and the commencement of a feasibility study. Engineering studies commenced in the fourth quarter of 2021 to evaluate the addition of a third grinding line for a 50% capacity increase to the Quebrada Blanca concentrator currently under construction. This configuration is expected to make use of excess capacity in the supporting infrastructure, reducing capital costs and minimizing the project footprint. A permit application was submitted to the Chilean regulator in early 2023. QBME will be a significant contributor to our near-term Copper Growth portfolio, with potential first production as early as 2026. Resource and geotechnical drilling will continue in 2023 to support the evaluation of further opportunities to develop the vast Quebrada Blanca resource.
9
Teck 2022 Management’s Discussion and Analysis
At the Galore Creek copper-gold-silver project located in Tahltan Territory within the Golden Triangle of northwest B.C., we and our partner, Newmont Corporation, are targeting completion of a prefeasibility study in the second half of 2023, after which the partners plan to submit an Initial Project Description for Galore Creek, which is the first step in re-permitting this world-class copper-gold resource. Work in 2023 will finalize the prefeasibility field, continue baseline social and environmental field programs, and initiate permitting activities.
At Schaft Creek, located in northwest B.C., we are investing additional resources to progress environmental and social baseline field studies and focused design and engineering data collection fieldwork. This includes resource modelling, geometallurgical and geotechnical studies, mining and mineral processing studies, siting studies, and capital and operating cost estimations, in support of advancing Schaft Creek into prefeasibility studies.
Teck and Newmont each have a 50% interest in Compañía Minera NuevaUnión S.A., which owns the Relincho and La Fortuna deposits. Work in 2023 will be focused on establishing a cost-effective path forward for the development of this world-class copper-molybdenum and copper-gold resource in a manner acceptable to communities of interest, key stakeholders and the regulator.
Markets
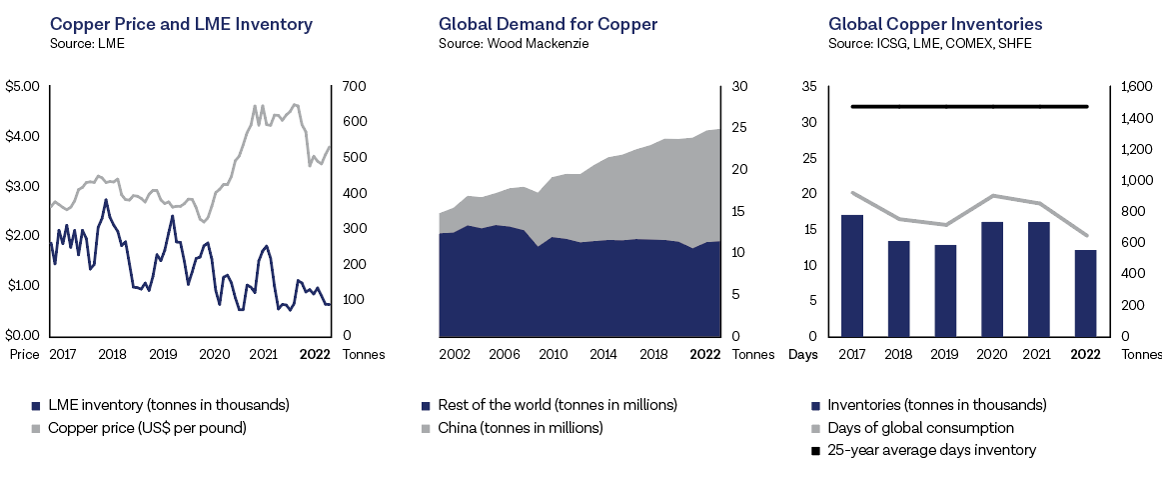
Copper prices on the London Metal Exchange (LME) averaged US$3.99 per pound in, 2022, down from an average of US$4.23 per pound in 2021.
Copper stocks on the LME were flat in the year falling only 25 tonnes to 88,925 tonnes in 2022. Copper stocks on the Shanghai Futures Exchange (SHFE) rose by 81.4% from an extremely low level to 54,569 tonnes, while COMEX warehouse stocks fell 40.1% to 30,855 tonnes. Commercial stocks in bonded warehouses in China fell the most in 2022, falling 73.5% to 49,600 tonnes. Combined stocks increased 5.8% or 10,392 tonnes during 2022 and ended the year at 238,468 tonnes. Exchange stocks ended the year at 13-year lows for the second straight year, ending at levels not seen since 2008. Total reported global stocks, including producer, consumer, merchant and terminal stocks, stood at an estimated 3.5 days of global consumption, versus the 25-year average of 15 days.
In 2022, global copper mine production increased 2.6%, according to Wood Mackenzie, a commodity research consultancy, with total production estimated at 22.0 million tonnes. Global mine production has increased at an average of 1.4% annually since 2016. Wood Mackenzie is forecasting a 4.6% increase in global mine production in 2023 to 23.0 million tonnes. This is 1.0 million tonnes lower than their forecast of 24.0 million tonnes at this time last year, due to higher-than-normal production disruptions at global copper mines. Chinese imports of copper concentrates increased by 9% in 2022 to reach over 6.1 million tonnes of contained copper.
Copper scrap availability increased in 2022 due to stronger prices in the first half of the year. Scrap and unrefined copper imports into China, including blister and anode, were up 13% year over year in 2022
10
Teck 2022 Management’s Discussion and Analysis
following a 30% increase in 2021. Refined cathode imports in 2022 increased by 8.4% to 3.4 million tonnes. Despite reports of weak copper demand in China, net contained copper unit imports were up 9.1% or 1.0 million tonnes from 2021 levels to 12.6 million tonnes, while reported cathode stocks in China fell by 0.1 million tonnes.
Wood Mackenzie estimates that global refined copper production grew 0.5% in 2022, below the 0.8% increase in global copper cathode demand. Wood Mackenzie are projecting that refined production will increase by 3.0% in 2023, reaching 25.7 million tonnes, with demand increasing only 2.1% to 25.5 million tonnes. The projected surplus in 2023 is 0.2 million tonnes, which is 0.3 million tonnes lower than Wood Mackenzie's forecast a year ago for the 2023 surplus, due mostly to weaker-than-forecast mine production. Demand continues to increase as governments and corporations expand decarbonization efforts, which require additional copper units for renewable energy generation and distribution. Consumer demand is forecast to come under pressure in 2023 in Europe and North America, while stimulus spending and consumer demand is now forecast to improve in China following a relaxation of COVID-related lockdowns in the country.
Outlook
Our 2023 annual guidance outlined below is unchanged from our previously disclosed guidance.
Copper production in 2023 is expected to be in the range of 390,000 to 445,000 tonnes. QB2 is expected to add substantially to overall copper production compared to 2022 as we ramp up to full capacity before the end of 2023. The increase is partially offset by lower expected production at Highland Valley Copper due to harder ore and lower copper grades as part of an update to the mine plan, and lower copper grades at Antamina as expected in the mine plan.
11
Teck 2022 Management’s Discussion and Analysis
Excluding QB2, we expect 2023 copper net cash unit costs in the range of US$1.60 to US$1.80 per pound after cash margins for by-products. Guidance reflects continued inflationary pressures on diesel, explosives, tires and reagents, as well as increased unit operating costs at Highland Valley Copper due to lower expected production, as outlined above.
We continue to expect QB2 to reach full capacity by end of 2023. As a result of recent changes to IFRS, we are required to recognize sales proceeds and related costs associated with products sold during the ramp-up and commissioning phase of QB2 through earnings, rather than capitalizing these amounts. We expect this to increase our unit operating costs for QB2 during ramp-up. Once QB2 is running at full production rates, we expect the average net cash unit costs will be between US$1.40 per pound and US$1.60 per pound.
Copper production from 2024 to 2026 is expected to be between 545,000 and 640,000 tonnes per year, including QB2.
12
Teck 2022 Management’s Discussion and Analysis
Zinc
We are one of the world’s largest producers of mined zinc, primarily from our Red Dog Operations in Alaska, and the Antamina copper mine in northern Peru, which has significant zinc co-product production. Our metallurgical complex in Trail, B.C. is one of the world’s largest integrated zinc and lead smelting and refining operations. In 2022, we produced 650,500 tonnes of zinc in concentrate, while our Trail Operations produced 248,900 tonnes of refined zinc.
In 2022, our zinc business unit accounted for 20% of revenue and 9% of our gross profit.
| | | | | | | | | | | | | | | | | | | | | | | | | | | | | |
| Revenue | Gross Profit (Loss) | Gross Profit (Loss) Before Depreciation and Amortization1 |
| ($ in millions) | 2022 | 2021 | 2020 | 2022 | 2021 | 2020 | 2022 | 2021 | 2020 |
| Red Dog | $ | 2,111 | | $ | 1,567 | | $ | 1,394 | | $ | 862 | | $ | 678 | | $ | 513 | | $ | 1,060 | | $ | 822 | | $ | 717 | |
| Trail Operations | 2,059 | | 1,997 | | 1,761 | | (93) | | (2) | | (23) | | (18) | | 84 | | 65 | |
| Other | 11 | | 10 | 9 | 2 | | 12 | | 33 | | 2 | | 12 | | 33 | |
| Intra-segment | (655) | | (511) | | (464) | | — | | — | | — | | — | | — | | — | |
| Total | $ | 3,526 | | $ 3,063 | $2,700 | $ | 771 | | $ | 688 | | $ | 523 | | $ | 1,044 | | $ | 918 | | $ | 815 | |
Note:
1.This is a non-GAAP financial measure or ratio. See “Use of Non-GAAP Financial Measures and Ratios” section for further information.
| | | | | | | | | | | | | | | | | | | | |
| Production | Sales |
| (thousand tonnes) | 2022 | 2021 | 2020 | 2022 | 2021 | 2020 |
| Refined zinc | | | | | | |
| Trail Operations | 249 | 279 | 305 | 257 | 281 | 307 |
| | | | | | |
| Contained in concentrate | | | | | | |
| Red Dog | 553 | 503 | 491 | 578 | 446 | 551 |
Antamina1 | 97 | 104 | 96 | 97 | 103 | 95 |
| Total | 650 | 607 | 587 | 675 | 549 | 646 |
Note:
1.Co-product zinc production from our 22.5% interest in Antamina.
Operations
Red Dog
Our Red Dog Operations, located in northwest Alaska, is one of the world’s largest zinc mines. Gross profit in 2022 was $862 million compared with $678 million in 2021 and $513 million in 2020. The increase in gross profit in 2022 compared with 2021 was primarily due to higher zinc prices and higher production volumes offset by increased operating costs and increased royalty costs, which are tied to increased profitability at Red Dog.
13
Teck 2022 Management’s Discussion and Analysis
In 2022, zinc production at Red Dog increased to 553,100 tonnes, compared to 503,400 tonnes produced in 2021, primarily due to higher ore grade, as expected in the mine plan, and slightly better recovery. Lead production in 2022 of 79,500 tonnes was lower than 2021 production of 97,400 tonnes as a result of lower grade ore, as expected in the mine plan.
Red Dog’s location exposes the operation to severe weather and winter ice conditions, which can significantly affect production, sales volumes and operating costs. In addition, the mine’s bulk supply deliveries and all concentrate shipments occur during a short ocean shipping season that normally runs from early July to late October. This short shipping season means that Red Dog’s sales volumes are usually higher in the last six months of the year, resulting in significant variability in its quarterly profit, depending on metal prices. As a result of the shipping season, inflationary impact on the cost of consumables only impacted Red Dog Operations in the fourth quarter. We expect to see the full impact of inflation in 2023.
The 2022 Red Dog concentrate shipping season commenced on schedule on July 4, 2022, and completed on October 26, 2022. A total of 1.31 million wet metric tonnes of zinc and lead concentrate, or 100% of planned volumes, was safely transloaded from our proprietary coastal barges onto 23 ships for delivery to our global customers.
In accordance with the operating agreement governing the Red Dog mine between Teck and NANA Regional Corporation, Inc. (NANA), we pay a royalty on net proceeds of production to NANA, which increased from 35% to 40% in October 2022. This royalty increases by 5% every fifth year to a maximum of 50%, with the next adjustment to 45% anticipated to occur in October 2027. The NANA royalty expense in 2022 was US$353 million, compared with US$255 million in 2021. NANA has advised us that it ultimately shares approximately 60% of the royalty, net of allowable costs, with other Regional Alaska Native Corporations pursuant to section 7(i) of the Alaska Native Claims Settlement Act.
Red Dog’s production of contained metal in 2023 is anticipated to be in the range of 550,000 to 580,000 tonnes of zinc and 110,000 to 125,000 tonnes of lead. From 2024 to 2026, zinc production is expected to be in the range of 500,000 to 550,000 tonnes of contained zinc per year, while lead production is expected to be between 85,000 and 95,000 tonnes of contained lead per year.
14
Teck 2022 Management’s Discussion and Analysis
Trail Operations
Our Trail Operations in southern B.C. produces refined zinc and lead, as well as a variety of precious and specialty metals, chemicals and fertilizer products.
Trail Operations incurred a gross loss of $93 million in 2022, in comparison to a gross loss of $2 million in 2021 and a gross loss of $23 million in 2020. The higher gross loss in 2022 is primarily due to an extended major maintenance shutdown and higher operating costs driven by inflation, offset slightly by higher zinc prices and premiums.
Refined zinc production in 2022 was 248,900 tonnes, lower than 279,000 tonnes in 2021. Refined zinc production in 2022 was impacted in the second half of the year by a planned major maintenance shutdown of the KIVCET furnace to have its hearth replaced, as well as the replacement of a dome on a zinc roaster. Production was also impacted by weather events resulting from extreme cold temperatures, as well as unplanned maintenance and operational challenges. Refined lead production in 2022 was 56,400 tonnes, compared with 81,400 tonnes in 2021. Silver production was 9.7 million ounces in 2022, compared to 11.7 million ounces in 2021. The decrease in both lead and silver production between 2022 and 2021 is also attributable to the KIVCET Furnace maintenance activities mentioned above.
Our recycling process treated 19,200 tonnes of material during the year, and we plan to treat about 28,200 tonnes in 2023. Our focus remains on treating lead acid batteries and cathode ray tube glass, plus small quantities of zinc alkaline batteries and other post-consumer waste.
In 2023, we expect Trail Operations to produce between 270,000 and 290,000 tonnes of refined zinc. Refined zinc production from 2024 to 2026 is expected to be between 280,000 and 310,000 tonnes per year. Refined lead and silver production at Trail is expected to be similar to prior years, excluding major maintenance years, but will fluctuate as a result of concentrate feed source optimization.
Zinc Growth
In the second quarter of 2022, we launched a zinc initiative focused on surfacing value from our high-quality portfolio of zinc projects. Similar to our approach on Copper Growth, we will methodically advance one significant growth project and several potential growth options with prudent investments to improve our understanding of each asset's potential, and define development options and paths to value for each of the assets.
Our principal zinc growth project is located in the Red Dog District in Alaska, where we have several high-quality opportunities located between 10 and 20 kilometres from the existing Red Dog Operations. Our primary focus is on Aktigiruq, a significant mineralized system with an exploration target of 80–150 million tonnes at grades of 16%–18% zinc plus lead. Scoping-level studies will continue in 2023 and 2024 on an underground mine, leveraging the existing mill and supporting facilities at Red Dog Operations.
15
Teck 2022 Management’s Discussion and Analysis
Within the zinc growth portfolio, there are two primary opportunities. Teena is a significant high-grade zinc-lead discovery made by Teck in 2013 that is located approximately 8 kilometres from Glencore’s McArthur River operation in Northern Territory, Australia. We are advancing early-stage conceptual studies at Teena to assess the stand-alone development opportunity represented by this high-quality discovery, which is located in a world-class zinc district with access to established infrastructure.
In central B.C., Teck has a 50% interest in the Cirque deposit, which is located in a long-established mineral district with recently improved road and rail infrastructure. This can provide ready access to market for the concentrate, including to our Trail smelting and refining operations. Our work at Cirque is focused on permitting and program definition, with potential drilling to start later in 2023.
Markets
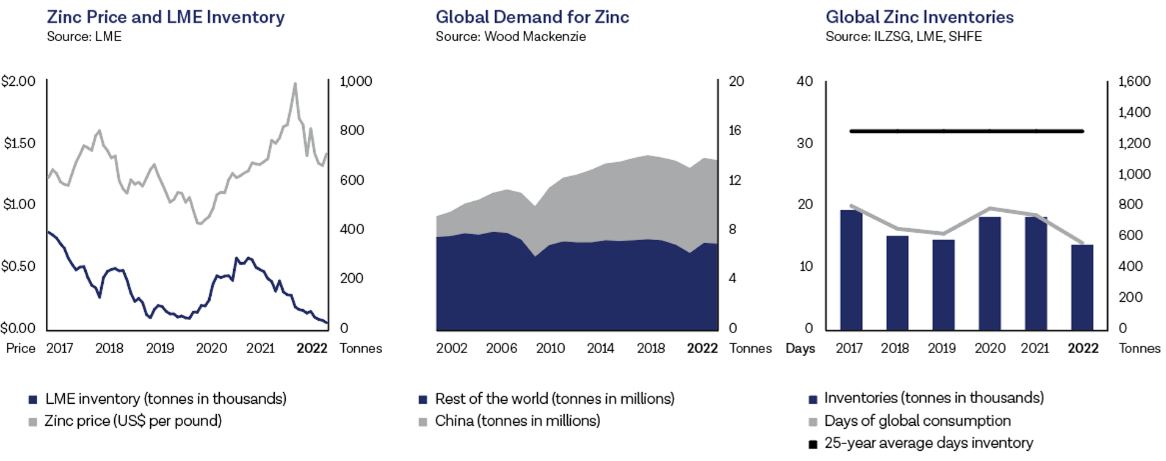
Zinc prices on the London Metal Exchange (LME) averaged US$1.58 per pound during 2022, higher than US$1.36 per pound in 2021, and the highest annual average ever recorded.
Zinc stocks on the LME fell by 167,550 tonnes in 2022, an 84.0% decrease from 2021 levels, finishing the year at 32,025 tonnes, the lowest level of LME stocks since 1989, which was just after the LME SHG zinc contract started trading. Stocks held on the Shanghai Futures Exchange (SHFE) fell 37,464 tonnes in 2022, a 64.7% decrease from 2021 levels, finishing the year at 20,453 tonnes, which was the lowest level since 2018. Total global exchange stocks remained well below historical levels, ending the year at 1.4 days of global consumption, compared to the 25-year average of 17.2 days. We estimate that total reported global stocks, which include producer, consumer, merchant and terminal stocks, fell by approximately 217,500 tonnes in 2022 to less than 60,000 tonnes at year-end, representing an estimated 1.4 days of global demand, compared to the 25-year average of 18.2 days.
In 2022, global zinc mine production increased 0.2% according to Wood Mackenzie, with total mine production reaching 12.9 million tonnes. This was significantly below Wood Mackenzie’s forecast a year ago for 2022 of 13.3 million tonnes. Global zinc mine production in 2022 continued to be impacted by COVID-related restrictions and labour shortages. According to Wood Mackenzie, global zinc mine production has not grown since 2013. Mine production in 2022 at 12.9 million tonnes was the same as it was in 2013. Wood Mackenzie expects global zinc mine production to only grow 2.5% in 2023 to reach 13.2 million tonnes, which is 0.6 million tonnes lower than its forecast a year ago for 2023 of 13.8 million tonnes.
Wood Mackenzie estimates that the global zinc metal market remained in deficit in 2022, recording a shortfall of 0.5 million tonnes of available material. Global refined zinc demand fell 1.4% in 2022 over 2021 to 13.8 million tonnes. Demand in China fell by 1.8%, and demand in Europe fell 3.1% on higher energy prices. North America was the only demand-growth region in 2022, according to Wood Mackenzie. In 2023, they expect demand for zinc to grow globally by 1.3% to 14.0 million tonnes, with growth coming primarily from Asia and South America, while demand in Europe and North America is expected to weaken.
16
Teck 2022 Management’s Discussion and Analysis
Wood Mackenzie estimates that global refined zinc production fell 4.0% in 2022 to 13.3 million tonnes, as European zinc smelters were forced to cut production due to higher energy costs, and North American and Asian smelters suffered from a variety of production problems throughout the year. Wood Mackenzie estimates that refined zinc production will see a 3.8% increase in 2023 over 2022 levels, back to 13.9 million tonnes as European power prices stabilize and North American and Asian smelters return to normal production levels. The estimate for the total increase in supply in 2023 will still be below the total global metal demand, suggesting that the refined metal market will be in a 0.2-million-tonne deficit in 2023.
Outlook
Our 2023 annual guidance outlined below is unchanged from our previously disclosed guidance.
We expect 2023 zinc in concentrate production, including co-product zinc production from Antamina (22.5%), to be in the range of 645,000 to 685,000 tonnes. This increase from 2022 production levels is driven by higher zinc grades at both Red Dog and Antamina, as expected in the mine plan.
In 2023, we expect our zinc net cash unit costs to be in the range of US$0.50 to US$0.60 per pound after cash margins for by-products. The increase over 2022 reflects a full year of inflation impact in 2023 on the cost of major consumables such as diesel. In 2022, the inflationary impacts were primarily in the fourth quarter of 2022.
Zinc in concentrate production from 2024 to 2026 is expected to be in the range of 555,000 to 645,000 tonnes per year. Guidance reflects Antamina's 2024 zinc production being at the lower end of the 2024-2026 guidance provided, and at the higher end for 2025-2026.
17
Teck 2022 Management’s Discussion and Analysis
In 2023, we expect refined zinc production to be between 270,000 and 290,000 tonnes, reflecting the residual impact of weather-related events on our Trail Operations at the end of 2022 that continued into January. Operations are expected to return to normal in the first quarter of 2023.
Refined zinc production from 2024 to 2026 is expected to be between 280,000 and 310,000 tonnes per year.
18
Teck 2022 Management’s Discussion and Analysis
Steelmaking Coal
In 2022, our steelmaking coal operations in Western Canada produced 21.5 million tonnes, with sales of 22.2 million tonnes. The majority of our steelmaking coal sales are to the Asia-Pacific region, with the remaining amounts sold primarily to Europe and the Americas. Our production capacity is 26 to 27 million tonnes, and we have total proven and probable reserves of 806 million tonnes of steelmaking coal.
In 2022, our steelmaking coal business unit accounted for 60% of revenue and 75% of gross profit.
| | | | | | | | | | | |
| ($ in millions) | 2022 | 2021 | 2020 |
| Revenue | $ | 10,409 | | $ | 6,251 | | $ | 3,375 | |
| Gross profit | $ | 6,401 | | $ | 2,785 | | $ | 277 | |
Gross profit before depreciation and amortization1 | $ | 7,364 | | $ | 3,657 | | $ | 1,009 | |
| Production (million tonnes) | 21.5 | | 24.6 | | 21.1 | |
| Sales (million tonnes) | 22.2 | | 23.4 | | 21.9 | |
Note:
1.This is a non-GAAP financial measure or ratio. See “Use of Non-GAAP Financial Measures and Ratios” section for further information.
Operations
During the year, we continued to advance our high-quality development projects, including development of the Elkview Administration and Maintenance Complex (AMC) Project (previously, the Harmer Project). Site preparation early works were completed in 2022, and detailed engineering and early procurement is over 50% complete. Construction will start in the first half of 2023. Once the Elkview workforce has relocated from the existing Harmer facilities to the new AMC complex, the area will be decommissioned and rehabilitated to prepare for mining operations in 2025. The AMC Project takes advantage of existing infrastructure and is expected to provide high-quality steelmaking coal that will support a long-term run rate of 9 million tonnes per year at Elkview.
We continue to advance the Fording River Extension Project to extend the lifespan of our existing Fording River Operations. A draft decision issued by the Province of British Columbia in December 2022 contemplates continued discussions with Indigenous communities and the development of a revised project description.
Gross profit for our steelmaking coal business unit was $6.4 billion in 2022, up from $2.8 billion in 2021 and $277 million in 2020. Substantially higher steelmaking coal prices contributed to exceptional financial performance in 2022 compared to 2021, despite lower production and sales volumes.
Our average realized steelmaking coal selling price in 2022 increased to US$355 per tonne, compared with US$209 per tonne in 2021 and US$113 per tonne in 2020.
19
Teck 2022 Management’s Discussion and Analysis
Sales volumes were 22.2 million tonnes in 2022, compared with 23.4 million tonnes sold in 2021. Strong logistics chain performance early in the year resulted in the drawdown of record-high opening inventories due to weather-related disruptions in late 2021 and into early 2022. Inventories were reduced to low levels by the end of the second quarter to capitalize on higher steelmaking coal prices. In the second half of the year, the Elkview plant was non-operational for two months, due to the failure of the plant feed conveyor, limiting sales volumes. Extreme cold during the final weeks of the year hampered our logistic chain while production rates recovered, resulting in increased inventories at year-end. These inventories will be drawn down in the first half of 2023.
Our 2022 production of 21.5 million tonnes was 3.1 million tonnes lower than 2021, primarily due to plant availability challenges throughout the year, particularly the two-month plant outage at Elkview to repair the raw coal conveyor. In addition, production was impacted by ongoing labour constraints and the extreme weather events at the end of both 2021 and 2022.
Adjusted site cash cost of sales1 in 2022 was $89 per tonne, significantly higher than $65 per tonne in 2021. The increase in the cost of sales was driven primarily by lower production and continued inflationary pressures, most notably diesel prices, as well as higher profit-based compensation.
Capital spending in 2022 included $520 million for sustaining capital, including water projects and Neptune Bulk Terminals (Neptune), and $30 million for RACE growth capital.
Elk Valley Water Quality Management Update
We continue to implement the water quality management measures required by the Elk Valley Water Quality Plan (the Plan). The Plan establishes short-, medium- and long-term water quality targets for selenium, nitrate, sulphate and cadmium to protect the environment and human health.
The majority of our 2022 capital spending for water projects was associated with building additional Saturated Rock Fill (SRF) treatment capacity across the Elk Valley. Capital spending in 2022 on water projects was $184 million. Our existing SRFs and Active Water Treatment Facilities (AWTFs) are operating as designed and, with the recent construction of the Fording River North SRF, there is currently 77.5 million litres per day of constructed water treatment capacity, which we expect to be operating as designed by the end of 2023. This is a fourfold increase in our treatment capacity from 2020.
With this additional capacity, we expect to achieve one of the primary objectives of the Plan: stabilizing and reducing the selenium trend in the Elk Valley.
In 2023, sustaining capital investment in water treatment facilities, water management (source control, calcite management and tributary management) and the incremental measures required under the October 2020 Direction issued by Environment and Climate Change Canada (the Direction) is expected to be
1 This is a non-GAAP financial measure or ratio. See “Use of Non-GAAP Financial Measures and Ratios” section for further information.
20
Teck 2022 Management’s Discussion and Analysis
approximately $220 million. Key projects include the North Line Creek Phase 1 and the Fording River North 1 Phase 3 SRFs.
Unchanged from our previously issued guidance, we plan to invest between $450 and $550 million of capital in 2023 and 2024 on water management and water treatment, including the capital attributable to incremental measures required under the Direction. This also includes the advancement of the Fording River North 2 Phase 1 SRF, which will increase treatment capacity in the north Elk Valley earlier than previously planned. The continued investment in water treatment during this time frame will further increase our constructed water treatment capacity to 120 million litres per day by the end of 2026.
Operating costs associated with water treatment were approximately $1.50 per tonne in 2022 and are projected to increase gradually over the long term to approximately $3 to $5 per tonne as additional water treatment becomes operational. Long-term capital costs for construction of additional treatment facilities are expected to average approximately $2 per tonne annually.
Final costs of implementing the Plan and other water quality initiatives will depend in part on the technologies applied, on regulatory developments, and on the results of ongoing environmental monitoring and modelling. The timing of expenditures will depend on resolution of technical issues, permitting timelines and other factors. Certain cost estimates to date are based on limited engineering. Implementation of the Plan also requires additional operating permits. We expect that, in order to maintain water quality, some form of water treatment will continue for an indefinite period after mining operations end. The Plan contemplates ongoing monitoring to ensure that the water quality targets set out in the Plan are protective of the environment and human health, and provides for adjustments if warranted by monitoring results. Proposed amendments to the Plan are under discussion with provincial regulators and Indigenous communities. The state of Montana's water quality standard for the Koocanusa Reservoir downstream of our mining operations has been set aside on procedural grounds. We continue to engage with U.S. regulators to work towards the establishment of appropriate science-based standards for the reservoir. Ongoing monitoring, as well as our continued research into treatment technologies, could reveal unexpected environmental impacts, technical issues or advances associated with potential treatment technologies. This could substantially increase or decrease both capital and operating costs associated with water quality management, or could materially affect our ability to permit mine life extensions in new mining areas.
Rail
Rail transportation of product westbound from our four steelmaking coal mines in southeast B.C. to Vancouver terminals is currently provided by Canadian Pacific Railway Company (CPR) and by Canadian National Railway Company (CN Rail). CPR transports a portion of these westbound shipments to Kamloops, B.C., and interchanges the trains with CN Rail for further transportation to the west coast. The remaining westbound shipments are transported by CPR from the mines to the terminals in Vancouver. Our current westbound shipments with CPR are under a tariff that expires in April 2023. Negotiations with CPR for a new westbound contract are underway.
21
Teck 2022 Management’s Discussion and Analysis
We have a long-term agreement with CN Rail until December 2026 for shipping steelmaking coal from our four B.C. operations via Kamloops to Neptune and other west coast ports, including Trigon Pacific Terminals (formerly Ridley Terminals).
Ports
We export our seaborne steelmaking coal primarily through three west coast terminals: Neptune, Westshore Terminals (Westshore) and Trigon. We have a 46% ownership interest in Neptune, which provides shiploading services on a cost-of-service basis at North Vancouver, B.C. Neptune, which became our primary terminal in 2021, continues to handle most of our production volumes (72% in 2022). Coal capacity at Neptune is exclusive to Teck. Neptune is well positioned to deliver strong throughput in 2023 and beyond, with significantly increased terminal-loading capacity to meet delivery commitments to our customers while further lowering our port costs.
In 2021, we entered into an agreement with Westshore for the shipment of between 5 and 7 million tonnes of steelmaking coal per year at fixed loading charges, for a total of 33 million tonnes over a period of approximately five years.
We also have a long-term agreement with Trigon, located in Prince Rupert, for shipments of up to 6 million tonnes of steelmaking coal per year through to December 2027.
Through our capacity at Neptune and complementary commercial agreements with Westshore and Trigon Terminals, our annual port capacity exceeds production. This incremental capacity provides flexibility and improved reliability in the case of weather and corridor disruptions or terminal outages.
Sales
Our steelmaking coal marketing strategy is focused on maintaining and building relationships with our traditional customers while establishing new customers in markets where we anticipate long-term growth in steel production and demand for seaborne steelmaking coal. In 2022, our sales strategy focused on capitalizing on the record pricing environment by optimizing sales to the seaborne market.
Markets
Global steel production diminished through the year as global inflationary pressures, monetary tightening and high energy prices weighed on manufacturing activity.
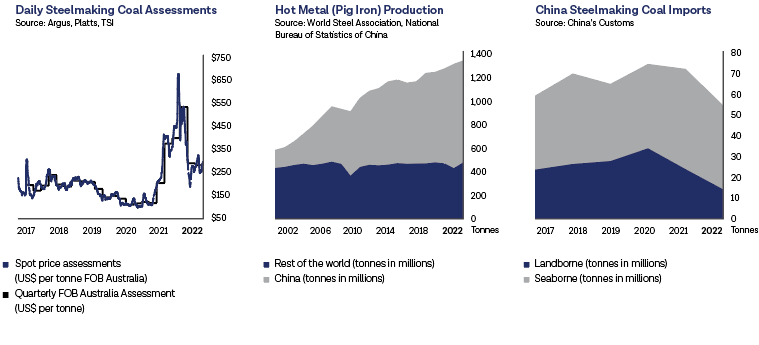
Premium hard coking coal prices FOB Australia reached an all-time high of US$670 per tonne in March 2022, triggered by the Russian invasion of Ukraine and supported by concerns over weather disruptions in Australia. In the second half of 2022, the global economic environment weakened as the war in Ukraine continued and the Chinese government extended COVID restrictions. Inflationary pressures, including high
22
Teck 2022 Management’s Discussion and Analysis
energy prices, lower consumer demand and falling steel prices, forced several European steel mills to reduce production in the second half. As a result, premium hard coking coal prices FOB Australia averaged US$365 per tonne in 2022, a historic high.
Coal shipments from Australia to China remained restricted through 2022. The average CFR China steelmaking coal price was US$371 per tonne in 2022, also a record high. Trade relations between China and Australia are improving, which is likely to result in the restart of Australian coal exports to China in 2023. We do not expect increased coal trade between China and Australia to have a material impact on the price of steelmaking coal, as the global demand and supply balance will remain unchanged.
The following graphs show key metrics affecting steelmaking coal sales: spot price assessments and quarterly pricing, hot metal production (each tonne of hot metal, or pig iron, produced requires approximately 650–700 kilograms of steelmaking coal), and China’s steelmaking coal imports by source.
Outlook
In December 2022, we announced the sale of our Quintette steelmaking coal mine to Conuma Resources Limited (Conuma) for $120 million in cash in staged payments over 36 months and an ongoing 25% net profits interest royalty, first payable after Conuma recovers its investment in Quintette. The transaction closed on February 16, 2023.
Our 2023 annual guidance outlined below is unchanged from our previously disclosed guidance.
Driven by all-time high steelmaking coal prices, the coal business unit delivered record financial results in 2022, and is in a solid position to deliver strong financial performance again in 2023. As noted above, we entered 2023 with higher-than-normal steelmaking coal inventories. We expect the 2022 fourth quarter
23
Teck 2022 Management’s Discussion and Analysis
deferred sales will be largely recovered in the first half of 2023, and inventories will return to low levels. We expect sales to be between 6.0 and 6.4 million tonnes for the first quarter of 2023 as we ramp back up to planned logistics operating rates.
We expect 2023 annual steelmaking coal production in the range of 24 to 26 million tonnes. Labour constraints are expected to continue to negatively impact equipment operating hours despite improved workforce attraction and retention as a result of initiatives implemented in 2022. We updated 2024 to 2026 steelmaking coal guidance to 24 to 26 million tonnes per year to reflect uncertainties related to ongoing labour impacts and the increasing frequency of adverse weather events.
We expect 2023 adjusted site cash cost of sales in the range of $88 to $96 per tonne. Relative to 2022, we anticipate favourable mining drivers, lower profit-based costs and an increased rate of capitalization of stripping in 2023 that will be offset by continued inflationary pressures. Major plant maintenance is scheduled to take place in the second and third quarters, resulting in expected adjusted site cash cost of sales2 to be at or above the upper end of the guidance range in those quarters, offset with lower costs in the first and fourth quarters. Inflationary pressures remain the primary driver of unit cost increases over historical periods, which are expected to be more than offset by the strong steelmaking coal prices supported by global supply constraints.
Transportation unit costs2 for 2023 are expected to be between $45 and $48 per tonne, including costs at or above the high end of our annual guidance range in the first quarter of 2023 due to the impact of logistics disruptions late in 2022. Savings associated with higher sales volumes through our expanded Neptune terminal are expected to be partially offset by inflationary pressures that are expected to continue through 2023.
Capital expenditures for 2023 are expected to be approximately $790 million, including $220 million related to water treatment. Total capital also includes $30 million of growth investment focused on improvement initiatives and supply chain optimization, and $540 million of sustaining capital supporting operations and the development of mining areas such as the Elkview AMC project. Capital is expected to remain in this range for the next couple of years as we develop further water treatment facilities, bring the Elkview AMC project online and continue to invest in future mine development.
Capitalized stripping costs are expected to be approximately $750 million in 2023. This is an increase from 2022 due to continued inflationary pressures, largely in mine and maintenance costs, and a notable peak period of capitalized stripping to advance the development of mine pits to support future production, partly as a result of the additional Indigenous engagement required in connection with the Fording River Extension permitting process.
2 This is a non-GAAP financial measure or ratio. See “Non-GAAP Financial Measures and Ratios” for further information.
24
Teck 2022 Management’s Discussion and Analysis
Exploration & Geoscience
Throughout 2022, we conducted exploration around our existing operations and globally in seven countries through our six regional offices, as our exploration activities returned to pre-pandemic levels. Expenditures for the year of $90 million, which were focused on copper, zinc, nickel and gold, were higher than expenditures in 2021 of $65 million, primarily due to the recommencement of drilling programs across our portfolio.
Exploration & Geoscience plays three critical roles at Teck: discovery of new orebodies through early-stage exploration and acquisition; pursuit, evaluation and acquisition of development opportunities; and delivery of geoscience solutions and services to create value at our existing mines and development projects.
Work continues on resource expansion at Quebrada Blanca, where we commenced a large-scale drill program in 2022 to continue to investigate and confirm the extensions of the orebody, which remains open in multiple directions.
Early-stage copper exploration in 2022 focused primarily on advancing projects targeting porphyry-style mineralization in Canada, Chile, Peru and the United States. In 2023, we plan to drill a number of early-stage copper projects in Chile, Peru and the United States.
Zinc exploration in 2022 was concentrated on early-stage programs in Australia, Canada, Ireland and Turkey, and on an advanced-stage project in the Red Dog district in Alaska. In Alaska, Australia and Canada, the targets are large sediment-hosted deposits; in Ireland, we are targeting large carbonate-hosted deposits. In 2023, we plan to drill test early-stage targets on our properties in Australia, Ireland and Turkey, and to continue drilling advanced-stage projects in the Red Dog mine district in Alaska.
In 2022, we initiated early-stage exploration for nickel, with an initial focus on Canada and the United States. A key element of this program is the complete digitalization of Teck’s historical exploration records – this digitization program will use advanced machine learning tools to drive and inform our evaluation of high-quality nickel prospects, plus copper and zinc prospects, globally.
We have ongoing exploration for gold, both on 100% Teck-owned properties and through partnerships. Our current exploration efforts and drill testing for gold are focused in Peru and Turkey.
In 2022, we also drilled 68 kilometres across four steelmaking coal operations in the Elk Valley to support our existing operations and extension projects.
Teck’s exploration strategy is underpinned by an agile commercial mindset whereby we manage and refresh a portfolio of commercial opportunities, such as retained project royalties and equity in junior exploration companies, to create value for Teck. In 2022, investments were made in exploration companies with copper portfolios in Canada, Kazakhstan and Peru and zinc portfolios in Canada and the United States.
25
Teck 2022 Management’s Discussion and Analysis
Financial Overview
Financial Summary
| | | | | | | | | | | |
| ($ in millions, except per share data) | 2022 | 20212 | 20202 |
| Revenue and profit | | | |
| Revenue | $ | 17,316 | | $ | 12,766 | | $ | 8,948 | |
| Gross profit | $ | 8,571 | | $ | 5,214 | | $ | 1,333 | |
Gross profit before depreciation and amortization1 | $ | 10,245 | | $ | 6,701 | | $ | 2,843 | |
| Profit (loss) from continuing operations before taxes | $ | 6,565 | | $ | 4,688 | | $ | (1,136) | |
Adjusted EBITDA1 | $ | 9,568 | | $ | 6,573 | | $ | 2,570 | |
| Profit (loss) attributable to shareholders | $ | 3,317 | | $ | 2,868 | | $ | (864) | |
Profit (loss) from continuing operations attributable to
shareholders | $ | 4,089 | | $ | 3,123 | | $ | (864) | |
| | | |
| Cash flow | | | |
| Cash flow from operations | $ | 7,983 | | $ | 4,738 | | $ | 1,563 | |
| Property, plant and equipment expenditures | $ | 4,423 | | $ | 3,966 | | $ | 3,129 | |
| Capitalized stripping costs | $ | 1,042 | | $ | 667 | | $ | 499 | |
| Investments | $ | 199 | | $ | 160 | | $ | 190 | |
| | | |
| Balance sheet | | | |
| Cash balances | $ | 1,883 | | $ | 1,427 | | $ | 450 | |
| Total assets | $ | 52,359 | | $ | 47,368 | | $ | 41,278 | |
| Debt and lease liabilities, including current portion | $ | 7,738 | | $ | 8,068 | | $ | 6,947 | |
| | | |
| Per share amounts | | | |
| Basic earnings (loss) per share | $ | 6.30 | | $ | 5.39 | | $ | (1.62) | |
| Diluted earnings (loss) per share | $ | 6.19 | | $ | 5.31 | | $ | (1.62) | |
| Basic earnings (loss) per share from continuing operations | $ | 7.77 | | $ | 5.87 | | $ | (1.62) | |
| Diluted earnings (loss) per share from continuing operations | $ | 7.63 | | $ | 5.78 | | $ | (1.62) | |
| Dividends declared per share | $ | 1.00 | | $ | 0.20 | | $ | 0.20 | |
Note:
1.This is a non-GAAP financial measure or ratio. See “Use of Non-GAAP Financial Measures and Ratios” section for further information.
2.Comparative figures for 2021 for the Energy Business Unit have been represented for the classification of Fort Hills as a discontinued operation. 2020 figures have not been represented.
Our revenue and profit depend on the prices for the commodities we produce, sell and use in our production processes. Commodity prices are determined by the supply of and demand for those commodities, which are influenced by global economic conditions. We normally sell the products that we produce at prevailing market prices or, in the case of steelmaking coal, through an index-linked pricing mechanism or on a spot basis. Prices for our products can fluctuate significantly, and that volatility can have a material effect on our financial results.
Foreign exchange rate movements can also have a significant effect on our results and cash flows, as substantial portions of our operating costs are incurred in Canadian dollars and other currencies, and most of our revenue and debt is denominated in U.S. dollars. We determine our financial results in local currency and report those results in Canadian dollars; accordingly, our reported operating results and cash flows are
26
Teck 2022 Management’s Discussion and Analysis
affected by changes in the Canadian dollar exchange rate relative to the U.S. dollar, as well as the Peruvian sol and Chilean peso.
In 2022, our profit attributable to shareholders was a record $3.3 billion, or $6.30 per share. This compares with a profit attributable to shareholders of $2.9 billion or $5.39 per share in 2021, and a loss attributable to shareholders of $864 million or $1.62 per share in 2020. The significant increase in profit in 2022 was due to substantially higher steelmaking coal prices, partly offset by slightly lower steelmaking coal sales volumes and increased operating costs across our operations reflecting inflationary pressures, particularly for diesel. Profit attributable to shareholders in 2021 improved from 2020 due to higher prices for all of our principal products, as well as an increase in sales volumes of steelmaking coal. In 2020, COVID-19 had a significant negative effect on the price and demand for our products, reducing our profit attributable to shareholders.
Our profit and loss over the past three years has included items that we segregate for additional disclosure to investors so that the underlying profit of the Company may be more clearly understood. Our adjusted EBITDA3, which takes these items into account, was $9.6 billion in 2022, $6.6 billion in 2021 and $2.6 billion in 2020. Our adjusted profit attributable to shareholders3, which takes these items into account, was a record $4.9 billion in 2022, $3.1 billion in 2021 and $561 million in 2020, or $9.25, $5.74 and $1.05 per share, respectively. These items are described below and summarized in the table that follows.
In October 2022, we announced an agreement to sell our 21.3% interest in Fort Hills Energy Limited Partnership (Fort Hills) and certain associated downstream assets to Suncor Energy Inc. Subsequently, TotalEnergies EP Canada Ltd. exercised its right of first refusal to purchase a proportional share of our interest in Fort Hills. On February 2, 2023, we completed the sale to Suncor and TotalEnergies for aggregate gross proceeds of approximately $1 billion in cash and we do not anticipate any tax payable on the disposal. Based on the consideration of $1 billion in cash and other contractual adjustments, we recorded a non-cash, pre-tax impairment of $1.2 billion in 2022 as a result of the sale of our interest in Fort Hills.
In 2021, we recorded a non-cash pre-tax asset impairment reversal on our Carmen de Andacollo Operations of $215 million as a result of an increase in market expectations for long-term copper prices. This was partially offset by a $141 million charge associated with the QB2 variable consideration.
In 2020, as outlined below, COVID-19 had a significant effect on our financial results, with decreases in commodity prices, most significantly for steelmaking coal, the temporary suspension of construction on our QB2 project and temporary reductions in production at our operations in the second quarter. As a result, we expensed $434 million of costs associated with COVID-19, primarily relating to the suspension of our QB2 project, including $103 million of interest that would otherwise have been capitalized if construction on QB2 had not been suspended. We also recorded inventory write-downs of $134 million as a result of lower commodity prices. During 2020, we recorded non-cash pre-tax asset impairments on our interest in Fort Hills of $1.2 billion. We also recorded environmental costs of $270 million, primarily relating to a decrease in the rates used to discount our decommissioning and restoration provisions, and increased expected remediation costs.
3 This is a non-GAAP financial measure or ratio. See “Use of Non-GAAP Financial Measures and Ratios” section for further information.
27
Teck 2022 Management’s Discussion and Analysis
The following table shows the effect of these items on our profit and loss.
| | | | | | | | | | | |
| ($ in millions, except per share data) | 20221 | 20212 | 2020 |
Profit (loss) attributable to shareholders3 | $ | 4,089 | | $ | 2,868 | | $ | (864) | |
| | | |
| Add (deduct) on an after-tax basis: | | | |
| Asset impairments (impairment reversal) | 952 | | (150) | | 912 | |
| COVID-19 costs | — | | — | | 233 | |
| Loss on debt purchase | 42 | | — | | 8 | |
| QB2 variable consideration to IMSA and ENAMI | 115 | | 124 | | (34) | |
| Environmental costs | 99 | | 79 | | 210 | |
| Inventory write-downs (reversals) | 36 | | 2 | | 91 | |
| Share-based compensation | 181 | | 94 | | 34 | |
| Commodity derivatives | (25) | | 15 | | (46) | |
Loss from discontinued operations for the nine months ended September 30, 20224 | (791) | | — | | — | |
| Other | 175 | | 25 | | 17 | |
Adjusted profit attributable to shareholders5 | $ | 4,873 | | $ | 3,057 | | $ | 561 | |
Basic earnings (loss) per share3 | $ | 7.77 | | $ | 5.39 | | $ | (1.62) | |
Diluted earnings (loss) per share3 | $ | 7.63 | | $ | 5.31 | | $ | (1.62) | |
Adjusted basic earnings per share5 | $ | 9.25 | | $ | 5.74 | | $ | 1.05 | |
Adjusted diluted earnings per share5 | $ | 9.09 | | $ | 5.66 | | $ | 1.04 | |
Note:
1.Adjustments for the year ended December 31, 2022 are the nine months ended September 30, 2022 as previously reported plus the three months ended December 31, 2022 for continuing operations.
2.Amounts for the year ended December 31, 2021 are as previously reported.
3.Amount for the year ended December 31, 2022 is for continuing operations only.
4.Adjustment required to remove the effect of discontinued operations for the nine months ended September 30, 2022.
5.This is a non-GAAP financial measure or ratio. See “Use of Non-GAAP Financial Measures and Ratios” section for further information.
Cash flow from operations in 2022 was $8.0 billion, compared with $4.7 billion in 2021 and $1.6 billion in 2020. The changes in cash flow from operations are mainly due to varying commodity prices, especially for steelmaking coal, and sales volumes of our principal products, offset to some extent by changes in foreign exchange rates.
At December 31, 2022, our cash balance was $1.9 billion. Total debt was $7.7 billion and our net-debt to net-debt-plus-equity ratio4 was 19% at December 31, 2022, compared with 22% at December 31, 2021 and 24% at the end of 2020.
COVID-19 Financial Impact
COVID-19 operating protocols remain in place across our business, with a continued focus on preventive measures, controls and compliance processes, and the integration of these actions into our operations and business planning. Operating our mines at full production in a COVID-19 environment increases certain costs, such as medical testing, safety equipment, safety supplies, additional transportation costs, accommodation costs for social distancing, and increased absenteeism, among other things. These costs and certain costs related to inefficiencies would not have occurred absent COVID-19 and are incremental
4 This is a non-GAAP financial measure or ratio. See “Use of Non-GAAP Financial Measures and Ratios” section for further information.
28
Teck 2022 Management’s Discussion and Analysis
costs. However, they are considered a cost of operating in this environment and are not adjusted for in our adjusted profit calculation.
During 2020, the COVID-19 pandemic had a significant negative effect on prices and demand for our products and on our financial results. As a result of the pandemic, during the second quarter of 2020, we had to temporarily reduce production at a number of our operations, and we suspended active construction on our QB2 project. We incurred idle labour and other non-productive costs while production was temporarily reduced and these costs were adjusted for in our adjusted profit calculation, noted above.
During 2020, we expensed $272 million in costs associated with the temporary suspension of our QB2 project and the remobilization of the project. We also expensed $103 million of interest that would otherwise have been capitalized if construction on our QB2 project had not been suspended. Consistent with the return to active construction on the QB2 project in the third quarter of 2020, we recommenced capitalization of borrowing costs and we did not expense further costs associated with the remobilization of the project in the fourth quarter of 2020. For the year ended December 31, 2020, we expensed pre-tax COVID-19 costs of $434 million (after-tax $233 million).
Gross Profit
Our gross profit is made up of our revenue less the operating expenses at our producing operations, including depreciation and amortization. Income and expenses from our business activities that do not produce commodities for sale are included in our other operating income and expenses or in our non-operating income and expenses.
Our principal commodities are copper, zinc and steelmaking coal, which accounted for 17%, 16% and 60% of revenue, respectively, in 2022. Silver and lead are significant by-products of our zinc operations, accounting for 4% of our 2022 revenue. We also produce a number of other by-products, including molybdenum, various specialty metals, and chemicals and fertilizers, which in total accounted for 3% of our revenue in 2022.
Our revenue is affected by sales volumes, which are determined by our production levels and by demand for the commodities we produce, commodity prices and currency exchange rates.
Our revenue was a record $17.3 billion in 2022, compared with $12.8 billion in 2021 and $8.9 billion in 2020. The increase in 2022 was primarily due to substantially higher steelmaking coal prices. The increase in 2021 revenue from 2020 was primarily due to substantially higher prices for our principal products and increased sales volumes of steelmaking coal, partly offset by Fort Hills revenue represented as discontinued operations.
Average prices for zinc (LME) and steelmaking coal were 16% and 70% higher in 2022 than in 2021, while average copper prices (LME) declined by 6% in 2022 compared with 2021.
29
Teck 2022 Management’s Discussion and Analysis
Our cost of sales includes all of the expenses required to produce our products, such as labour, energy, operating supplies, concentrates purchased for our Trail Operations’ refining and smelting activities, royalties, and marketing and distribution costs required to sell and transport our products to various delivery points. Our cost of sales also includes depreciation and amortization expense. Due to the geographic locations of many of our operations, we are highly dependent on third parties for the provision of rail, port, and other distribution services. In certain circumstances, we negotiate prices and other terms for the provision of these services where we may not have viable alternatives to using specific providers or may not have access to regulated rate-setting mechanisms or appropriate remedies for service failures. Contractual disputes, demurrage charges, availability of vessels and railcars, weather problems and other factors, as well as rail and port capacity issues can have a material effect on our ability to transport materials from our suppliers and to our customers in accordance with schedules and contractual commitments.
Our costs are dictated mainly by our production volumes; by the costs for labour, operating supplies and concentrate purchases; by strip ratios, haul distances and ore grades; by distribution costs, commodity prices, foreign exchange rates and costs related to non-routine maintenance projects; and by our ability to manage these costs. Production volumes mainly affect our variable operating and distribution costs. In addition, production affects our sales volumes; when combined with commodity prices, this affects profitability and our royalty expenses.
Our cost of sales was $8.7 billion in 2022, compared with $7.6 billion in 2021 and $7.6 billion in 2020. The increase in cost of sales in 2022 compared to 2021 was primarily due to inflationary pressures we experienced across our business units, and to higher profit-based compensation and royalties. The increases in the cost of certain key supplies, including diesel, mining equipment, tires and explosives, are largely being driven by price increases for underlying commodities such as steel, crude oil and natural gas. This contrasts with our underlying key mining drivers such as strip ratios and haul distances, which remained relatively stable in 2022 as compared to 2021.
30
Teck 2022 Management’s Discussion and Analysis
Other Expenses
| | | | | | | | | | | |
| ($ in millions) | 2022 | 2021 | 2020 |
| General and administration | $ | 236 | | $ | 172 | | $ | 132 | |
| Exploration | 90 | | 65 | | 45 | |
| Research and innovation | 157 | | 129 | | 97 | |
| Asset impairment (impairment reversal) | — | | (215) | | 1,244 | |
| Other operating (income) expense | 1,102 | | 80 | | 725 | |
| Finance income | (53) | | (5) | | (10) | |
| Finance expense | 203 | | 190 | | 278 | |
| Non-operating (income) expense | 275 | | 107 | | (43) | |
| Share of losses of associates and joint ventures | (4) | | 3 | | 1 | |
| $ | 2,006 | | $ | 526 | | $ | 2,469 | |
In 2022, general and administration expenses of $236 million increased by $64 million compared to 2021 due to inflationary pressures on employee related expenses and profit-sharing, and increased travel and project activity as various corporate activity levels returned to pre-COVID-19 levels.
Our exploration expenses in 2022 of $90 million, which were focused on copper, zinc and gold, were higher than expenditures in 2021 of $65 million, primarily due to the recommencement of drilling programs across our portfolio.
We must continually replace our reserves as they are depleted in order to maintain production levels over the long term. We try to do this through our exploration and development programs and through acquisition of interests in new properties or in companies that own them. Exploration for minerals and steelmaking coal is highly speculative, and the projects involve many risks. The vast majority of exploration projects are unsuccessful and there are no assurances that current or future exploration programs will find deposits that are ultimately brought into production.
Our research and innovation expenditures of $157 million in 2022 were primarily focused on the development of internal and external growth opportunities, RACE, and the development and implementation of process and environmental technology improvements at operations.
Other operating income and expenses include items we consider to be related to the operation of our business, such as final pricing adjustments (which are further described below), share-based compensation, gains or losses on commodity derivatives, gains or losses on the sale of operating or exploration assets, and provisions for various costs at our closed properties. Significant items in 2022 included $371 million of negative pricing adjustments, $236 million of share-based compensation relating to improved share prices, and $128 million of environmental costs primarily relating to the decommissioning and restoration provision of our closed operations. Significant items in 2021 included $442 million of positive pricing adjustments, partially offset by $125 million of share-based compensation. We also recorded $108 million of environmental costs, primarily relating to a decrease in the rates used to discount our decommissioning and restoration provisions for closed operations, and $97 million of take-or-pay contract costs. Significant items in 2020 included $282
31
Teck 2022 Management’s Discussion and Analysis
million of costs associated with COVID-19, primarily relating to the suspension of our QB2 project, and $270 million of environmental costs, primarily relating to a decrease in the rates used to discount our decommissioning and restoration provisions for closed operations, and increased expected reclamation costs. In addition, we recorded commodity derivative gains of $62 million and $104 million of take-or-pay contract costs.
Sales of our products, including by-products, are recognized in revenue at the point in time when the customer obtains control of the product. Control is achieved when a product is delivered to the customer, we have the present right to payment for the product, significant risks and rewards of ownership have transferred to the customer according to contract terms, and there is no unfulfilled obligation that could affect the customer’s acceptance of the product. For sales of steelmaking coal and copper, zinc and lead concentrates, control of the product generally transfers to the customer when an individual shipment parcel is loaded onto a carrier accepted by or directly contracted by the customer. For sales of refined metals, control of the product transfers to the customer when the product is loaded onto a carrier specified by the customer.
The majority of our base metal concentrates and refined metals are sold under pricing arrangements where final prices are determined by quoted market prices in a period subsequent to sale. For these sales, revenue is recognized based on the estimated consideration to be received at the date of sale with reference to relevant commodity market prices. Our refined metals are sold under spot or average pricing contracts. For all steelmaking coal sales under average pricing contracts where pricing is not finalized when revenue is recognized, revenue is recorded based on the estimated consideration to be received at the date of sale with reference to steelmaking coal price assessments.
Adjustments are made to settlement receivables in subsequent periods based on movements in quoted market prices or published price assessments (for steelmaking coal) up to the date of final pricing. These pricing adjustments result in gains in a rising price environment and losses in a declining price environment and are recorded as other operating income or expense. It should be noted that these effects arise on the sale of concentrates, as well as on the purchase of concentrates at our Trail Operations.
The following table outlines our outstanding receivable positions, which were subject to provisional pricing terms at December 31, 2022 and 2021, respectively.
| | | | | | | | | | | | | | |
| Outstanding at | Outstanding at |
| December 31, 2022 | December 31, 2021 |
| Volume | Price | Volume | Price |
| Copper (pounds in millions) | 168 | US$3.80/lb. | 156 | US$4.42/lb. |
| Zinc (pounds in millions) | 218 | US$1.35/lb. | 175 | US$1.62/lb. |
| Steelmaking coal (tonnes in thousands) | 385 | US$257/tonne | — | — |
Our finance expense includes the interest expense on our debt, on advances to QBSA from SMM/SC and on lease liabilities, letters of credit and standby fees, interest on our pension obligations, and accretion on our decommissioning and restoration provisions, less any interest that we capitalize against the cost of our
32
Teck 2022 Management’s Discussion and Analysis
development projects. Our finance expense of $203 million in 2022 increased slightly compared to 2021. In 2020, we ceased capitalization of borrowing costs on QB2 while the project was temporarily suspended and began capitalizing borrowing costs when the project remobilized. In 2021 and 2022, we capitalized borrowing costs on QB2 for the full year.
In 2023, we expect our finance expense to increase compared to 2022 as we capitalize less borrowing costs relating to the development of QB2 once we achieve commercial production.
Non-operating income (expense) includes items that arise from financial and other matters, and includes such items as foreign exchange gains or losses, debt refinancing costs, gains or losses on the revaluation of debt prepayment options, and gains or losses on the sale of investments.
In 2022, non-operating expenses included a $58 million loss on the purchase of US$743 million aggregate principal amount of our outstanding notes during 2022 and $188 million of expenses associated with QB2 variable consideration to IMSA and ENAMI. Of the $188 million, $183 million was due to the revaluation of the financial liability for the preferential dividend stream related to ENAMI's interest in QBSA, which is most significantly affected by copper prices and the interest rate on the subordinated loans provided by us and SMM/SC to QBSA, which affects the timing of when QBSA repays the loans. The remaining $5 million of expense relates to a derivative financial liability that arose from our 2018 acquisition of an additional 13.5% interest in QBSA through the purchase of IMSA, a private Chilean company and former QBSA shareholder. The purchase price at the date of acquisition included additional amounts that may become payable to the extent that average copper prices exceed US$3.15 per pound in each of the first three years following commencement of commercial production, as defined in the acquisition agreement, up to a cumulative maximum of US$100 million if commencement of commercial production occurs prior to January 21, 2024, or up to a lesser maximum in certain circumstances thereafter.
In 2021, non-operating expenses included $141 million of expenses associated with QB2 variable consideration owing to a former owner and to a holder of a carried interest. Of the $141 million, $44 million was due to the revaluation of the financial liability for the preferential dividend stream related to ENAMI's interest in QBSA. The remaining $97 million of expense relates to a derivative financial liability that arose from our 2018 acquisition of an additional 13.5% interest in QBSA.
In 2020, non-operating income (expense) included a gain of $56 million on the revaluation of the financial liability for the preferential dividend stream relating to ENAMI’s interest in QBSA. This was partially offset by an $11 million loss on the purchase of US$268 million aggregate principal amount of our outstanding notes.
Profit (loss) attributable to non-controlling interests relates to the ownership interests that are held by third parties in our Quebrada Blanca, Carmen de Andacollo and Elkview operations, and Compañía Minera Zafranal S.A.C.
33
Teck 2022 Management’s Discussion and Analysis
Income Taxes
Provision for income and resource taxes was $2.5 billion, or 38% of pre-tax profit. This rate is higher than the Canadian statutory income tax rate of 27% due generally as a result of resource taxes and higher taxes in some foreign jurisdictions.
The Peruvian tax authority, La Superintendencia Nacional de Aduanas y de Administración Tributaria (SUNAT), issued income tax assessments for the 2013 to 2016 taxation years to Antamina (our joint operation in which we own a 22.5% share), denying accelerated depreciation claimed by Antamina in respect of a mill expansion and other assets, on the basis that the expansion was not covered by Antamina’s tax stability agreement. In 2022, the Peruvian Tax Court issued its ruling in favour of SUNAT on this matter for the 2013 taxation year.
Antamina is continuing to pursue the matter in the Peruvian Judiciary Courts. The denial of accelerated depreciation claimed is a timing issue in our tax provision, which we have already recorded. In light of the recent Peruvian Tax Court ruling, we have expensed our share of interest and penalties for the 2013 to 2016 years as reflected in finance expense and other non-operating expense.
Discontinued Operation
On October 26, 2022, we announced an agreement to sell our 21.3% interest in the Fort Hills Energy Limited Partnership (Fort Hills) and associated downstream assets to Suncor. Subsequently, TotalEnergies exercised its right of first refusal to purchase a proportional share of our interest in Fort Hills. On February 2, 2023, this transaction closed and we received aggregate gross proceeds of approximately $1 billion in cash. We do not anticipate any tax payable on the disposal.
Based on the consideration of $1 billion in cash and other contractual adjustments, we recorded a non-cash, pre-tax impairment of $1.2 billion (after-tax $961 million) as a result of the sale of our interest in Fort Hills. As part of the sale, we agreed to make scheduled payments to Suncor over the remaining term of the downstream contract in order to reduce the impact of certain pipeline tolls payable under that downstream contract indirectly assumed by Suncor.
Results from our interest in Fort Hills have been classified as discontinued operations and assets held for sale beginning in the fourth quarter of 2022.
In 2022, we incurred a $772 million loss from the discontinued operation compared with a $255
million loss in 2021. Our loss in 2022 included an after-tax, non-cash asset impairment charge of $952 million on our investment in Fort Hills. Western Canadian Select (WCS) prices at Hardisty, Alberta averaged US$76.02 per barrel in 2022 compared with US$54.87 per barrel in 2021. Our 21.3% share of bitumen production from Fort Hills in 2022 was 33,491 barrels per day, compared with 19,935 barrels per day in 2021. The bitumen production in 2022 was higher than the previous year due to two-train production ramp-up in December 2021.
34
Teck 2022 Management’s Discussion and Analysis
Subsequent Events
On July 20, 2022 we announced an agreement with PolyMet Mining Corp. to form a 50:50 joint arrangement to advance PolyMet Mining Inc.'s NorthMet Project and Teck's Mesaba mineral deposit. The new joint arrangement will be named NewRange Copper Nickel LLC. As at December 31, 2022, we have reclassified property, plant and equipment and other assets of $14 million related to Mesaba to non-current assets held for sale. We have assessed the fair value of the Mesaba assets and determined that the fair value exceeded the carrying value of the assets and accordingly, no impairment was recorded. The transaction subsequently closed on February 15, 2023.
On December 19, 2022, we announced an agreement with Conuma Resources Limited to sell all the assets and liabilities of the Quintette steelmaking coal mine in northeastern British Columbia. The disposal group did not meet the definition of discontinued operations. As at December 31, 2022, we have reclassified the assets and liabilities of Quintette as held for sale on the balance sheet. We have assessed the fair value of the Quintette assets and determined that the fair value exceeded the carrying value of the assets and accordingly, no impairment was recorded. The transaction subsequently closed on February 16, 2023.
On February 18, 2023, Teck’s Board of Directors approved the reorganization of Teck’s business (the Separation) to separate Teck into two independent, publicly-listed companies: Teck Metals Corp. and Elk Valley Resources Ltd. (EVR). The Separation is structured as a spin-off of Teck’s steelmaking coal business by way of a distribution of EVR common shares to Teck shareholders. In consideration for the transfer of the specified assets and liabilities of the steelmaking coal business to EVR, EVR will issue preferred shares and grant a royalty (collectively, the “Transition Capital Structure”), as well as issue EVR common shares. Teck Metals will hold 87.5% of the Transition Capital Structure and will distribute all of the EVR common shares held by Teck to its shareholders. Teck has also reached agreements with Nippon Steel Corporation (NSC) and POSCO to exchange their non-controlling interests in the Elkview operations, and specifically with POSCO to exchange their direct interest in the Greenhills operations, for EVR’s common shares and a percentage of the Transition Capital Structure. In addition, NSC will invest approximately $1.0 billion to increase its interest in the Transition Capital Structure. As part of the analysis of the Separation, we estimated the fair value of the steelmaking coal group of CGUs expected to result from the transaction. We determined that the estimated fair value of the steelmaking coal group of CGUs exceeded the carrying value at December 31, 2022 and no impairment was identified. Completion of the transaction is subject to a number of customary conditions and if applicable court and shareholder approvals are received, completion of the transaction could occur in the second quarter of 2023.
35
Teck 2022 Management’s Discussion and Analysis
Financial Position and Liquidity
Our liquidity remained strong at $7.3 billion as at December 31, 2022, including $1.9 billion of cash. At December 31, 2022, the principal balance of our term notes was US$2.6 billion and we maintained a US$4.0 billion undrawn revolving credit facility. As at December 31, 2022, our US$2.5 billion QB2 project financing facility was fully drawn. As at December 31, 2022, Antamina's US$1.0 billion loan facility agreement, of which our 22.5% share is US$225 million, was fully drawn.
Our US$4.0 billion sustainability-linked revolving credit facility involves pricing adjustments that are aligned with our sustainability performance and strategy, and has a maturity to October 2026. Our sustainability performance over the term of the facility is measured by greenhouse gas intensity, the percentage of women in Teck’s workforce, and safety. At December 31, 2022, our US$4 billion facility was undrawn.
Our outstanding debt was $7.7 billion at December 31, 2022, compared with $8.1 billion at the end of 2021 and $6.9 billion at the end of 2020. The decrease in 2022 is due to debt repurchases through a tender offer and an open market repurchase order, partially offset by draws on our QB2 project finance facility, debt at Antamina and loans entered into at Carmen de Andacollo.
We maintain investment grade ratings of Baa3, BBB-, BBB- and BBB from Moody’s, S&P, Fitch and DBRS, respectively, with stable outlooks with the exception of Moody's, which has a positive outlook.
Our debt positions and credit ratios are summarized in the following table:
| | | | | | | | | | | |
| December 31, | December 31, | December 31, |
| 2022 | 2021 | 2020 |
| Term notes | $ | 2,585 | | $ | 3,478 | | $ | 3,478 | |
| US$4 billion of revolving credit facilities | — | | — | | 262 | |
| QB2 US$2.5 billion limited recourse project finance facility | 2,500 | | 2,252 | | 1,147 | |
| Lease liabilities | 422 | | 547 | | 544 | |
| Carmen de Andacollo short-term loans | 52 | | — | | — | |
| Antamina credit facilities | 225 | | 176 | | 90 | |
| Other | — | | — | | 1 | |
| Less unamortized fees and discounts | (71) | | (89) | | (66) | |
| Debt (US$ in millions) | $ | 5,713 | | $ | 6,364 | | $ | 5,456 | |
| |
|
|
Debt (Canadian $ equivalent)1 (A) | 7,738 | | 8,068 | | 6,947 | |
| Less cash balances | (1,883) | | (1,427) | | (450) | |
Net debt2 (B) | $ | 5,855 | | $ | 6,641 | | $ | 6,497 | |
| Equity (C) | $ | 26,511 | | $ | 23,773 | | $ | 20,708 | |
Net-debt to net-debt-plus-equity ratio2 (B/(B+C)) | 18 | % | 22% | 24% |
Net-debt to adjusted EBITDA ratio2 | 0.6x | 1.0x | 2.5x |
| Weighted average coupon rate on the term notes | 5.3% | 5.5% | 5.5% |
Notes:
1.Translated at period end exchange rates.
2.This is a non-GAAP financial measure or ratio. See “Use of Non-GAAP Financial Measures and Ratios” section for further information.
36
Teck 2022 Management’s Discussion and Analysis
At December 31, 2022, the weighted average maturity of our term notes is approximately 15 years and the weighted average coupon rate is approximately 5.3%.
Cash flow from operations was $8.0 billion in 2022. Our cash position increased from $1.4 billion at the end of 2021 to $1.9 billion at December 31, 2022. Significant outflows included $4.4 billion of capital expenditures, $1.0 billion of capitalized stripping costs, $199 million on investments and other asset expenditures, $532 million on returns to shareholders through dividends and $459 million of interest and finance charges, primarily on our outstanding debt. Significant inflows during 2022 included $315 million of net proceeds from debt drawn on the QB2 project financing facility and $899 million of QB2 advances from SMM/SC.
We maintain various committed and uncommitted credit facilities for liquidity and for the issuance of letters of credit, including a US$4.0 billion sustainability-linked facility, which was undrawn as at December 31, 2022.
Borrowing under our primary committed revolving credit facility is subject to our compliance with the covenants in the agreement and our ability to make certain representations and warranties at the time of the borrowing request. Our US$4.0 billion sustainability-linked facility does not contain an earnings or cash flow-based financial covenant, a credit rating trigger or a general material adverse borrowing condition. The only financial covenant under our credit agreements is a requirement for our net debt to capitalization ratio not to exceed 60%. That ratio was 19% at December 31, 2022.
In addition to our US$4.0 billion sustainability-linked facility, we maintain uncommitted bilateral credit facilities primarily for the issuance of letters of credit to support our future reclamation obligations. At December 31, 2022, we had $2.7 billion of letters of credit outstanding. We also had $849 million in surety bonds outstanding at December 31, 2022 mostly to support current and future reclamation obligations.
Under the terms of the silver streaming agreement relating to Antamina, if there is an event of default under the agreement or Teck insolvency, Teck Base Metals Ltd., our subsidiary that holds our interest in Antamina, is restricted from paying dividends or making other distributions to Teck to the extent that there are unpaid amounts under the agreement. In addition, the QB2 project finance arrangements include customary restrictions on the payment of dividends and other distributions from the project company until project completion has been achieved; such distributions are also subject to compliance with certain other conditions.
Early repayment of borrowings under our US$4.0 billion credit facility, outstanding public debt and the QB2 project finance arrangements may be required if an event of default under the relevant agreement occurs. In addition, we are required to offer to repay indebtedness outstanding under our revolving credit facility and certain of our public debt in the event of a change of control, as determined under the relevant agreements.
37
Teck 2022 Management’s Discussion and Analysis
Capital Allocation Framework
Our capital allocation framework describes how we allocate funds to sustaining and growth capital, maintaining solid investment grade credit metrics and returning excess cash to shareholders. This framework reflects our intention to make additional returns to shareholders by supplementing our base dividend with at least an additional 30% of available cash flow after certain other repayments and expenditures have been made. For this purpose, we define available cash flow (ACF) as cash flow from operating activities after interest and finance charges, lease payments and distributions to non-controlling interests less: (i) sustaining capital and capitalized stripping; (ii) committed growth capital; (iii) any cash required to adjust the capital structure to maintain solid investment grade credit metrics; (iv) our base $0.50 per share annual dividend; and (v) any share repurchases executed under our annual buyback authorization. Proceeds from any asset sales may also be used to supplement available cash flow. Any additional cash returns will be made through share repurchases and/or supplemental dividends depending on market conditions at the relevant time.
Our results can be highly variable, as they are dependent on commodity prices and various other factors. Investors should not assume that there will be available cash or any supplemental returns in any given year.
In 2022, as cash flows were generated from operations, we returned capital to shareholders through dividends and share buybacks. We paid dividends of $532 million in 2022. We also returned $1.4 billion during 2022 through share buybacks. On February 18, 2023, Teck’s Board of Directors approved a dividend of $0.625 per share. The $0.625 per share dividend consists of the $0.125 per share quarterly base dividend and a supplemental dividend of $0.50 per share on our Class A common shares and Class B subordinate voting shares, to be paid on March 31, 2023 to shareholders of record at the close of business on March 15, 2023. In addition to the dividend, the Board has authorized management to purchase up to $250 million of Class B subordinate voting shares. Additional buybacks will be considered regularly in the context of market conditions.
Operating Cash Flow
Cash flow from operations was $8.0 billion in 2022, compared with $4.7 billion in 2021 and $1.6 billion in 2020. The increase in 2022 was primarily reflected in the substantial increase in steelmaking coal prices compared with 2021. The increase in 2021 as compared to 2020 was primarily due to higher prices for our principal products, especially steelmaking coal.
Investing Activities
Expenditures on property, plant and equipment were $4.4 billion in 2022, including $3.1 billion on the QB2 project, $239 million on growth capital and $1.1 billion on sustaining capital. The largest components of sustaining capital expenditures were $520 million at our steelmaking coal operations.
Capitalized production stripping costs were $1.0 billion in 2022 compared with $667 million in 2021. The majority of these costs are associated with the advancement of pits for future production at our steelmaking coal operations. Stripping costs were higher in 2022 primarily due to Elkview operations focusing on pre-
38
Teck 2022 Management’s Discussion and Analysis
stripping activities during the two-month plant outage while repairs to the plant feed conveyor took place. In addition, the higher stripping costs reflect the impact of inflationary pressures across our operations.
Capital expenditures for 2022 are summarized in the table on pages 47 to 48.
Expenditures on investments in 2022 were $199 million and included $128 million for intangible and other assets, and $71 million for marketable securities.
Cash proceeds from the sale of assets and investments were $113 million in 2022, $54 million in 2021 and $146 million in 2020.
Financing Activities
In 2022, debt proceeds totalled $569 million, while debt repayments totalled $1.3 billion. Debt proceeds in 2022 included $315 million drawdown on the US$2.5 billion limited recourse project financing facility to fund the development of the QB2 project. The facility was fully drawn in April 2022. Debt proceeds also included $63 million final drawdown on Antamina's loan agreement. The loan agreement was fully drawn during the first quarter of 2022, with our share being US$225 million. Debt repayments in 2022 included the redemption of our US$150 million 4.75% note for $187 million and the purchase of US$650 million of our public notes in a waterfall tender for $892 million.
In 2021, debt proceeds totalled $1.6 billion, while debt repayments totalled $155 million. We also repaid $335 million, net, on our revolving credit facility during the year. Debt proceeds included a drawdown of $1.4 billion on the US$2.5 billion limited recourse project financing facility to fund the development of the QB2 project. Antamina entered into a US$1.0 billion loan agreement during 2021. As at December 31, 2021, our share of the amount drawn was US$158 million, which is included in our debt proceeds for the year.
In 2020, debt proceeds totalled $2.4 billion, while debt repayments totalled $457 million. Debt proceeds included a drawdown of $1.5 billion on the US$2.5 billion limited recourse project financing facility to fund the development of the QB2 project. During the year, we drew $363 million, net, on our US$4.0 billion revolving credit facility.
In 2020, we issued US$550 million of notes due July 2030. These notes bear interest at 3.90% per year. We used the US$542 million of net proceeds to purchase the US$268 million aggregate principal amount of our outstanding notes pursuant to cash tender offers and a private purchase, the latter of which had a US$13 million principal amount. The purchased notes comprised US$104 million of 4.5% notes due 2021, US$52 million of 4.75% notes due 2022 and US$112 million of 3.75% notes due 2023. The remainder of the proceeds were used to repay amounts drawn on our US$4.0 billion revolving credit facility. We recorded a pre-tax loss through non-operating income (expense) of $11 million in connection with these purchases.
39
Teck 2022 Management’s Discussion and Analysis
Debt interest and finance charges paid during 2022 were $459 million, compared with $380 million in 2021, due to higher debt balances and higher interest rates on the QB2 project financing facility, QB2 advances from SMM/SC and Antamina credit facilities..
During 2022, we paid $532 million in respect of our regular annual base dividend of $0.50 per share and an additional one-time supplemental dividend of $0.50 per share.
In 2022, we purchased and cancelled approximately 30.7 million Class B shares at a cost of $1.4 billion under our normal course issuer bid.
40
Teck 2022 Management’s Discussion and Analysis
Quarterly Profit and Cash Flow
| | | | | | | | | | | | | | | | | | | | | | | | | | |
| ($ in millions except per share data) | 2022 | 2021 |
| Q4 | Q3 | Q2 | Q1 | Q4 | Q3 | Q2 | Q1 |
| Revenue | $ | 3,140 | | $ | 4,260 | | $ | 5,300 | | $ | 4,616 | | $ | 4,196 | | $ | 3,792 | | $ | 2,394 | | $ | 2,384 | |
| Gross profit | $ | 1,154 | | $ | 1,797 | | $ | 3,142 | | $ | 2,478 | | $ | 2,114 | | $ | 1,690 | | $ | 723 | | $ | 687 | |
| Profit (loss) attributable to shareholders | $ | 266 | | $ | (195) | | $ | 1,675 | | $ | 1,571 | | $ | 1,487 | | $ | 816 | | $ | 260 | | $ | 305 | |
| Basic earnings (loss) per share | $ | 0.52 | | $ | (0.37) | | $ | 3.12 | | $ | 2.93 | | $ | 2.79 | | $ | 1.53 | | $ | 0.49 | $ | 0.57 |
| Diluted earnings (loss) per share | $ | 0.51 | | $ | (0.37) | | $ | 3.07 | | $ | 2.87 | | $ | 2.74 | | $ | 1.51 | | $ | 0.48 | $ | 0.57 |
| Cash flow from operations | $ | 930 | | $ | 1,809 | | $ | 2,921 | | $ | 2,323 | | $ | 2,098 | | $ | 1,480 | | $ | 575 | $ | 585 |
Gross profit from our copper business unit was $248 million in the fourth quarter compared with $442 million a year ago. Gross profit decreased from a year ago primarily due to a decline in realized copper prices, lower production and sales volumes, and higher unit operating costs.
Copper production of 65,400 tonnes in the fourth quarter was 10% lower than a year ago, primarily due to processing of lower grade ore during a temporary pit closure at Highland Valley Copper as a result of a localized geotechnical event that has since been stabilized.
Gross profit from our zinc business unit was $57 million in the fourth quarter compared with $217 million a year ago. Gross profit decreased compared with a year ago primarily due to a 9% decrease in realized zinc prices, lower refined zinc sales volumes, higher operating costs, and a decrease in lead and silver by-product sales volumes from our Red Dog and Trail Operations.
At our Red Dog Operations, zinc production in the fourth quarter decreased by 4%, or 5,500 tonnes, while lead production was consistent with the same period last year at 18,000 tonnes. At our Trail Operations, refined zinc production was 32% lower than a year ago, due to major planned maintenance on the KIVCET boiler and unplanned downtime due to extreme cold weather in late December.
Gross profit in the fourth quarter from our steelmaking coal business unit decreased by $606 million to $849 million compared to the same period last year primarily as a result of lower steelmaking coal prices and lower production and sales volumes. Although realized steelmaking coal prices in the fourth quarter declined by 21% from a year ago, they remain at historically high levels. Production volumes were lower as a result of the two-month plant outage at our Elkview Operations for the repair of the plant feed conveyor, plant availability challenges, ongoing labour constraints and extreme weather events in December.
41
Teck 2022 Management’s Discussion and Analysis
Sales volumes for the fourth quarter were 4.3 million tonnes, 16% lower than the same period last year, primarily due to lower production and the impact of the extreme weather conditions on our logistics chain that also resulted in higher steelmaking coal inventories to close out the year. We expect to recover the delayed fourth quarter sales in the first half of 2023 as we ramp back up to planned operating levels.
In the fourth quarter, profit attributable to shareholders was $266 million, or $0.52 per share, compared with a profit attributable to shareholders of $1.5 billion, or $2.79 per share, in the same period a year ago.
Cash flow from operations in the fourth quarter was $930 million compared with $2.1 billion a year ago, reflecting the impact of lower commodity prices and reduced steelmaking coal sales volumes. During the fourth quarter, changes in working capital items resulted in a use of cash of $154 million primarily due to a build-up of steelmaking coal production inventories and an increase in supply inventories at Quebrada Blanca as the operation prepares for start-up. This compares with a use of cash of $70 million a year ago.
Outlook
The sales of our products are denominated in U.S. dollars, while a significant portion of our expenses is incurred in local currencies, particularly the Canadian dollar and the Chilean peso. Foreign exchange fluctuations can have a significant effect on our capital costs and operating margins, unless such fluctuations are offset by related changes to commodity prices.
Our U.S. dollar denominated debt is subject to revaluation based on changes in the Canadian/U.S. dollar exchange rate. As at December 31, 2022, US$1.7 billion of our U.S. dollar denominated debt is designated as a hedge against our foreign operations that have a U.S. dollar functional currency. As a result, any foreign exchange gains or losses arising on that amount of our U.S. dollar debt are recorded in other comprehensive income, with the remainder being charged to profit.
Commodity markets are volatile. Prices can change rapidly and customers can alter shipment plans. This can have a substantial effect on our business and financial results. Continued uncertainty in global markets arising from the macroeconomic outlook and government policy changes, including tariffs and the potential for trade disputes, may have a significant positive or negative effect on the prices of the various products we produce.
We remain confident in the longer-term outlook for our major commodities; however, the extent, duration and impacts that COVID-19 may have on demand and prices for our commodities, on our suppliers and employees and on global financial markets in the future are uncertain and could be material. As well, the predicted impact of monetary policy aimed at curtailing inflation in various jurisdictions on economic growth and demand for our products is uncertain and could be material.
42
Teck 2022 Management’s Discussion and Analysis
Commodity Prices and Sensitivities
Commodity prices are a key driver of our profit and cash flows. On the supply side, the depleting nature of ore reserves, difficulties in finding new orebodies, the permitting processes and the availability of skilled resources to develop projects, as well as infrastructure constraints, political risk and significant cost inflation, may continue to have a moderating effect on the growth in future production for the industry as a whole.
The sensitivity of our annual profit attributable to shareholders and EBITDA to changes in the Canadian/U.S. dollar exchange rates and commodity prices, before pricing adjustments, based on our current balance sheet, our expected 2023 mid-range production estimates, current commodity prices and a Canadian/U.S. dollar exchange rate of $1.30, is as follows:
| | | | | | | | | | | | | | |
| 2023 Mid-Range Production Estimates1 | Change | Estimated Effect of Change On Profit (Loss) Attributable to Shareholders2
($ in millions) | Estimated Effect on EBITDA2,5
($ in millions) |
| US$ exchange | | CAD$0.01 | $ | 60 | | $ | 98 | |
| Copper (000’s tonnes) | $ | 417.5 | US$0.01/lb. | $ | 6 | | $ | 11 | |
Zinc (000’s tonnes)3 | $ | 945.0 | US$0.01/lb. | $ | 9 | | $ | 12 | |
| Steelmaking coal (million tonnes) | $ | 25.0 | US$1/tonne | $ | 19 | | $ | 29 | |
WTI4 | | US$1/bbl | $ | 3 | | $ | 5 | |
| | | | |
Notes:
1.All production estimates are subject to change based on market and operating conditions.
2.The effect on our profit (loss) attributable to shareholders and on EBITDA of commodity price and exchange rate movements will vary from quarter to quarter depending on sales volumes. Our estimate of the sensitivity of profit and EBITDA to changes in the U.S. dollar exchange rate is sensitive to commodity price assumptions.
3.Zinc includes 280,000 tonnes of refined zinc and 665,000 tonnes of zinc contained in concentrate.
4.Our WTI oil price sensitivity takes into account the change in operating costs across our business units, as our operations use a significant amount of diesel fuel.
5.This is a non-GAAP financial measure or ratio. See “Use of Non-GAAP Financial Measures and Ratios” section for further information.
43
Teck 2022 Management’s Discussion and Analysis
Guidance
Our 2023 annual guidance is outlined in detail below and is unchanged from previous disclosures.
Like others in the industry, we continue to face inflationary cost pressures, which have increased our operating costs compared to prior years. The increase in the cost of certain key supplies, including mining equipment, fuel, tires and explosives, are being driven largely by price increases for underlying commodities such as steel, crude oil and natural gas. While our underlying key mining drivers such as strip ratios and haul distances remain relatively stable, inflationary pressures on diesel and other key input costs, as well as profit-based compensation put upward pressure on our unit costs in 2022 and are expected to persist through 2023.
Production Guidance
Copper production in 2023 is expected to be in the range of 390,000 to 445,000 tonnes. QB2 is expected to add substantially to overall copper production compared to 2022 as we ramp-up to full capacity before the end of 2023. The increase is partially offset by lower expected production at Highland Valley Copper due to harder ore and lower copper grades as part of an update to the mine plan and lower copper grade at Antamina as expected in the mine plan.
We expect 2023 zinc in concentrate production, including co-product zinc production from Antamina (22.5%), to be in the range of 645,000 to 685,000 tonnes. This increase from 2022 production levels is driven by higher zinc grades at both Red Dog and Antamina as expected in the mine plan. We expect lead production from Red Dog to be in the range of 110,000 to 125,000 tonnes in 2023. In 2023, we expect Trail Operations to produce between 270,000 and 290,000 tonnes of refined zinc. Refined lead and silver production at Trail are expected to be similar to prior years, but will fluctuate as a result of concentrate feed source optimization.
We expect 2023 annual steelmaking coal production in the range of 24 to 26 million tonnes. Labour constraints are expected to continue to negatively impact equipment operating hours despite improved workforce attraction and retention as a result of initiatives implemented in 2022. We updated 2024 to 2026 steelmaking coal guidance to 24 to 26 million tonnes per year to reflect uncertainties related to ongoing labour impacts and the increasing frequency of adverse weather events.
44
Teck 2022 Management’s Discussion and Analysis
Production Guidance
The table below shows our share of production of our principal products for 2022, our guidance for production in 2023 and our guidance for production for the following three years.
| | | | | | | | | | | |
| Units in thousand tonnes (excluding steelmaking coal and molybdenum) | 2022 | 2023 Guidance | Three-Year Guidance 2024–2026 |
| Principal Products |
|
|
|
|
|
|
|
Copper1,2,3 |
|
|
|
| Highland Valley Copper | 119.1 | 110 - 118 | 120 - 165 |
| Antamina | 102.3 | 90 - 97 | 90 - 100 |
| Carmen de Andacollo | 39.5 | 40 - 50 | 50 - 60 |
| Quebrada Blanca | 9.6 | 150 - 180 | 285 - 315 |
| 270.5 | 390 - 445 | 545 - 640 |
Zinc1,2,4 |
|
|
|
| Red Dog | 553.1 | 550 - 580 | 500 - 550 |
| Antamina | 97.4 | 95 - 105 | 55 - 95 |
| 650.5 | 645 - 685 | 555 - 645 |
| Refined zinc |
|
|
|
| Trail Operations | 248.9 | 270 - 290 | 280 - 310 |
|
|
|
|
| Steelmaking coal (million tonnes) | 21.5 | 24.0 - 26.0 | 24.0 - 26.0 |
|
|
|
|
| Other Products |
|
|
|
Lead1 |
|
|
|
| Red Dog | 79.5 | 110 - 125 | 85 - 95 |
|
|
|
|
Molybdenum (million pounds)1,2 |
|
|
|
| Highland Valley Copper | 1.0 | 0.8 - 1.2 | 2.0 - 6.0 |
| Antamina | 1.5 | 2.2 - 2.6 | 2.0 - 4.0 |
| Quebrada Blanca | — | | 1.5 - 3.0 | 10.0 - 14.0 |
| 2.5 | 4.5 - 6.8 | 14.0 - 24.0 |
Notes:
1.Metal contained in concentrate.
2.We include 100% of production and sales from our Quebrada Blanca and Carmen de Andacollo mines in our production and sales volumes, even though we do not own 100% of these operations, because we fully consolidate their results in our financial statements. We include 22.5% of production and sales from Antamina, representing our proportionate ownership interest in this operation.
3.Copper production includes cathode production at Quebrada Blanca and Carmen de Andacollo.
4.Total zinc includes co-product zinc production from our 22.5% proportionate interest in Antamina.
45
Teck 2022 Management’s Discussion and Analysis
Sales Guidance
The table below shows our sales of selected products for the last quarter of 2022 and our sales guidance for the first quarter of 2023 for selected principal products.
| | | | | | | | |
| Q4 2022 | Q1 2023 Guidance |
Zinc (thousand tonnes)1 |
|
|
| Red Dog | 142 | 165 - 185 |
| Steelmaking coal (million tonnes) | 4.3 | 6.0 - 6.4 |
Note:
1.Metal contained in concentrate.
Unit Cost Guidance
The table below reports our unit costs for 2022 and our guidance for unit costs for selected products in 2023.
| | | | | | | | |
| (Per unit costs) | 2022 | 2023
Guidance |
Copper1 |
|
|
Total cash unit costs4 (US$/lb.) | 2.02 | 2.05 - 2.25 |
Net cash unit costs3,4 (US$/lb.) | 1.56 | 1.60 - 1.80 |
Zinc2 |
| |
Total cash unit costs4 (US$/lb.) | 0.58 | 0.68 - 0.78 |
Net cash unit costs3,4 (US$/lb.) | 0.44 | 0.50 - 0.60 |
| Steelmaking coal |
|
|
Adjusted site cost of sales4 | 89 | 88 - 96 |
| Transportation costs | 47 | 45 - 48 |
Notes:
1.Copper unit costs are reported in U.S. dollars per payable pound of metal contained in concentrate. Copper net cash unit costs include adjusted cash cost of sales and smelter processing charges, less cash margins for by-products including co-products. Guidance for 2023 assumes a zinc price of US$1.45 per pound, a molybdenum price of US$17.00 per pound, a silver price of US$20 per ounce, a gold price of US$1,755 per ounce and a Canadian/U.S. dollar exchange rate of $1.33. Excludes Quebrada Blanca.
2.Zinc unit costs are reported in U.S. dollars per payable pound of metal contained in concentrate. Zinc net cash unit costs are mine costs including adjusted cash cost of sales and smelter processing charges, less cash margins for by-products. Guidance for 2023 assumes a lead price of US$0.90 per pound, a silver price of US$20 per ounce and a Canadian/U.S. dollar exchange rate of $1.33. By-products include both by-products and co-products.
3.After co-product and by-product margins and excluding Quebrada Blanca.
4.This is a non-GAAP financial measure or ratio. See “Use of Non-GAAP Financial Measures and Ratios” for further information.
46
Teck 2022 Management’s Discussion and Analysis
Capital Expenditure Guidance
The table below reports our capital expenditures for 2022 and our guidance for capital expenditure in 2023.
| | | | | | | | |
| (Teck’s share in $ millions) | 2022 | 2023 Guidance |
| Sustaining |
|
|
Copper1 | $ | 297 | | $ | 510 | |
| Zinc | 244 | | 150 | |
Steelmaking coal2 | 520 | | 760 | |
| Corporate | 17 | | 10 | |
| $ | 1,078 | | $ | 1,430 | |
Growth3 |
| |
Copper4 | $ | 217 | | $ | 250 | |
| Zinc | 37 | | 80 | |
| Steelmaking coal | 30 | | 30 | |
| Corporate | 1 | | — | |
| $ | 285 | | $ | 360 | |
| Total | | |
| Copper | $ | 514 | | $ | 760 | |
| Zinc | 281 | | 230 | |
| Steelmaking coal | 550 | | 790 | |
| Corporate | 18 | | 10 | |
| $ | 1,363 | | $ | 1,790 | |
| QB2 capital expenditures | $ | 3,060 | | $ 1,200 - 1,750 |
| Total before SMM and SC contributions | 4,423 | | 2,990 - 3540 |
| Estimated SMM and SC contributions to capital expenditures | (1,090) | | (520) - (700) |
| Estimated QB2 project financing draw to capital expenditures | (315) | | — | |
| Total, net of partner contributions and project financing | $ | 3,018 | | $ 2,470 - 2,840 |
Notes:
1Copper sustaining capital guidance for 2023 includes Quebrada Blanca concentrate operations.
2Steelmaking coal sustaining capital 2023 guidance includes $220 million of water treatment capital. 2022 guidance includes $200 million of water treatment capital.
3Growth expenditures include RACE capital expenditures for 2023 of $35 million, of which $5 million relates to copper and $30 million relates to steelmaking coal.
4Copper Growth capital guidance for 2023 includes studies for HVC 2040, Zafranal, San Nicolás, NewRange Copper Nickel (formerly Mesaba and NorthMet), Quebrada Blanca Mill Expansion (QBME), Galore Creek, Schaft Creek and NuevaUnión.
47
Teck 2022 Management’s Discussion and Analysis
Capital Expenditure Guidance — Capitalized Stripping
| | | | | | | | |
| (Teck’s share in CAD$ millions) | 2022 | 2023 Guidance |
| Capitalized Stripping |
|
|
| Copper | $ | 336 | | $ | 295 | |
| Zinc | 89 | | 55 | |
| Steelmaking coal | 617 | | 750 | |
| $ | 1,042 | | $ | 1,100 | |
48
Teck 2022 Management’s Discussion and Analysis
Other Information
Climate Change and Carbon Pricing
As part of the ongoing efforts to address climate change, regulations to control greenhouse gas emissions continue to be developed and enhanced in many jurisdictions. Regulatory uncertainty and resulting uncertainty regarding the costs of technology required to comply with current or anticipated regulations make it difficult to predict the ultimate costs of compliance. Societal focus on controlling carbon emissions, minimizing climate change and preparing for climate change adaptation continues to mount.
The Government of Canada continues to advance climate action initiatives such as the Canadian Net-Zero Emissions Accountability Act, which formalizes Canada’s target to achieve net-zero greenhouse gas emissions by 2050 and its A Healthy Environment and a Healthy Economy climate plan to advance actions to achieve Canada’s climate goals, which includes a proposal to increase the federal price of carbon to $170 per tonne of carbon dioxide-equivalent (CO2e) by 2030. The Government of Canada also formally submitted Canada’s enhanced Nationally Determined Contribution to the United Nations, committing Canada to cut its greenhouse gas emissions by 40%–45% below 2005 levels by 2030.
While climate change regulations continue to evolve in most jurisdictions in which we operate, we expect that regional, national or international regulations that seek to reduce greenhouse gas emissions will continue to be established or revised. The cost of reducing our emissions or of obtaining the equivalent amount of credits or offsets in the future, if regulations permit this, remains uncertain. The cost of compliance with various climate change regulations will ultimately be determined by the regulations themselves and by the markets that evolve for carbon credits and offsets. Our Scope 1 and 2 greenhouse gas emissions attributable to our operations for 2022 are estimated to be approximately 2.8 million tonnes of CO2e. The most material indirect emissions associated with our activities are those from the use of our steelmaking coal by our customers. Based on our 2022 sales volumes, emissions from the use of our steelmaking coal would have been approximately 65 million tonnes of CO2e.
We may in the future face similar taxation for our activities in other jurisdictions. Similarly, customers of some of our products may also be subject to new carbon costs or taxation in the future in the jurisdictions where the products are ultimately used.
For 2022, our B.C.-based operations incurred $88.4 million in British Columbia provincial carbon tax. As a result of the CleanBC Program for Industry, we received back $18.8 million of the $81.7 million we paid under the British Columbia provincial carbon tax in 2021, and we expect to receive a similar portion of our 2022 carbon tax payments back in 2023.
We continue to take action to reduce greenhouse gas emissions by improving our energy efficiency and implementing low-carbon technologies at our operations. In 2020, we announced our objective to achieve net-zero greenhouse gas emissions across our operations and in 2022 we expanded our existing climate action strategy to include a new short-term goal to achieve net-zero Scope 2 greenhouse gas emissions by
49
Teck 2022 Management’s Discussion and Analysis
2025 and a new ambition to achieve net-zero Scope 3 greenhouse gas emissions by 2050. We also have a focus on growing our copper business to further rebalance our portfolio to metals and minerals essential for low-carbon technologies, while continuing to produce the high-quality steelmaking coal required for the low-carbon transition.
We have established a set of actions that facilitate progress towards our decarbonization goals and ambitions. Our objective is to deliver significant and cost-competitive emissions reductions. We routinely evaluate existing and emerging abatement opportunities as the pace of low-carbon technology maturation continues to accelerate, and as options that were not feasible a few years ago appear on the horizon.
Financial Instruments and Derivatives
We hold a number of financial instruments, derivatives and contracts containing embedded derivatives, which are recorded on our consolidated balance sheet at fair value with gains and losses in each period included in other comprehensive income (loss) in the year and profit for the period on our consolidated statements of income and consolidated statements of other comprehensive income, as appropriate. The most significant of these instruments are investments in marketable securities and metal-related forward contracts, including those embedded in our silver and gold streaming arrangements, QB2 variable consideration to IMSA and settlement receivables. All are subject to varying rates of taxation, depending on their nature and jurisdiction. Further information about our financial instruments, derivatives and contracts containing embedded derivatives and associated risks is outlined in Note 30 to our 2022 audited annual consolidated financial statements.
Areas of Judgment and Critical Accounting Estimates
In preparing our consolidated financial statements, we make judgments in applying our accounting policies. The judgments that have the most significant effect on the amounts recognized in our financial statements are outlined below. In addition, we make assumptions about the future in deriving estimates used in preparing our consolidated financial statements. We have outlined information below about assumptions and other sources of estimation uncertainty as at December 31, 2022 that have a risk of resulting in a material adjustment to the carrying amounts of assets and liabilities within the next year.
a) Areas of Judgment
Assessment of Impairment and Impairment Reversal Indicators
Judgment is required in assessing whether certain factors would be considered an indicator of impairment or impairment reversal. We consider both internal and external information to determine whether there is an indicator of impairment or impairment reversal present and, accordingly, whether impairment testing is required. The information we consider in assessing whether there is an indicator of impairment or impairment reversal includes, but is not limited to, market transactions for similar assets, commodity prices, treatment
50
Teck 2022 Management’s Discussion and Analysis
charges, zinc premiums, discount rates, foreign exchange rates, our market capitalization, reserves and resources, mine plans, operating plans and operating results.
In the fourth quarter of 2022, as a result of increased costs and operating challenges at our Trail CGU, we performed an impairment test for our Trail CGU.
In the fourth quarter of 2021 as a result of higher market expectations for long-term copper prices, we performed an impairment reversal test for our Carmen de Andacollo CGU. In addition, mine plans with updated information for Fort Hills became available in the fourth quarter of 2021, which required us to perform an impairment test on our Fort Hills CGU.
Property, Plant and Equipment – Determination of Available for Use Date
Judgment is required in determining the date that property, plant and equipment is available for use. An asset is available for use when it is in the location and condition necessary to operate in the manner intended by management. We considered several factors in making the determination of when the Neptune port upgrade project was available for use including, but not limited to, design capacity of the asset, throughput levels achieved, capital spending remaining and commissioning status. As at September 30, 2021, based on assessment of relevant factors, the Neptune port upgrade project was considered available for use. We commenced depreciation of the asset and ceased capitalization of borrowing costs as of the date the asset was available for use.
Joint Arrangements
We are a party to a number of arrangements over which we do not have control. Judgment is required in determining whether joint control over these arrangements exists and, if so, which parties have joint control and whether each arrangement is a joint venture or a joint operation. In assessing whether we have joint control, we analyze the activities of each arrangement and determine which activities most significantly affect the returns of the arrangement over its life. These activities are determined to be the relevant activities of the arrangement. If unanimous consent is required over the decisions about the relevant activities, the parties whose consent is required would have joint control over the arrangement. The judgments around which activities are considered the relevant activities of the arrangement are subject to analysis by each of the parties to the arrangement and may be interpreted differently. When performing this assessment, we generally consider decisions about activities such as managing the asset while it is being designed, developed and constructed, during its operating life and during the closure period. We may also consider other activities, including the approval of budgets, expansion and disposition of assets, financing, significant operating and capital expenditures, appointment of key management personnel, representation on the board of directors and other items. When circumstances or contractual terms change, we reassess the control group and the relevant activities of the arrangement.
If we have joint control over the arrangement, an assessment of whether the arrangement is a joint venture or a joint operation is required. This assessment is based on whether we have rights to the assets, and
51
Teck 2022 Management’s Discussion and Analysis
obligations for the liabilities, relating to the arrangement or whether we have rights to the net assets of the arrangement. In making this determination, we review the legal form of the arrangement, the terms of the contractual arrangement and other facts and circumstances. In a situation where the legal form and the terms of the contractual arrangement do not give us rights to the assets and obligations for the liabilities, an assessment of other facts and circumstances is required, including whether the activities of the arrangement are primarily designed for the provision of output to the parties and whether the parties are substantially the only source of cash flows contributing to the arrangement. The consideration of other facts and circumstances may result in the conclusion that a joint arrangement is a joint operation. This conclusion requires judgment and is specific to each arrangement. Other facts and circumstances have led us to conclude that Antamina and Fort Hills are joint operations for the purposes of our consolidated financial statements. The other facts and circumstances considered for both of these arrangements include the provision of output to the parties of the joint arrangements and the funding obligations. For both Antamina and Fort Hills, we take our share of the output from the assets directly over the life of the arrangement. We have concluded that this gives us direct rights to the assets and obligations for the liabilities of these arrangements proportionate to our ownership interests.
Streaming Transactions
When we enter into a long-term streaming arrangement linked to production at specific operations, judgment is required in assessing the appropriate accounting treatment for the transaction on the closing date and in future periods. We consider the specific terms of each arrangement to determine whether we have disposed of an interest in the reserves and resources of the respective operation or executed some other form of arrangement. This assessment considers what the counterparty is entitled to and the associated risks and rewards attributable to them over the life of the operation. These include the contractual terms related to the total production over the life of the arrangement as compared to the expected production over the life of the mine, the percentage being sold, the percentage of payable metals produced, the commodity price referred to in the ongoing payment and any guarantee relating to the upfront payment if production ceases.
For our silver and gold streaming arrangements at Antamina and Carmen de Andacollo, respectively, there is no guarantee associated with the upfront payment. We have concluded that control of the rights to the silver and gold mineral interests were transferred to the buyers when the contracts came into effect. Therefore, we consider these arrangements a disposition of a mineral interest.
Based on our judgment, control of the interest in the reserves and resources transferred to the buyer when the contracts were executed. At that time, we recognized the amount of the gain related to the disposition of the reserves and resources, as we had the right to payment, the customer was entitled to the commodities, the buyer had no recourse in requiring Teck to mine the product and the buyer had significant risks and rewards of ownership of the reserves and resources.
We recognize the amount of consideration related to refining, mining and delivery services as the work is performed.
52
Teck 2022 Management’s Discussion and Analysis
Deferred Tax Assets and Liabilities
Judgment is required in assessing whether deferred tax assets and certain deferred tax liabilities are recognized on the balance sheet and what tax rate is expected to be applied in the year when the related temporary differences reverse. We also evaluate the recoverability of deferred tax assets based on an assessment of our ability to use the underlying future tax deductions before they expire against future taxable profits or capital gains. Deferred tax liabilities arising from temporary differences on investments in subsidiaries, joint ventures and associates are recognized unless the reversal of the temporary differences is not expected to occur in the foreseeable future and can be controlled. Judgment is also required on the application of income tax legislation. These judgments are subject to risk and uncertainty and could result in an adjustment to the deferred tax provision and a corresponding credit or charge to profit (loss).
Assets Held for Sale
Judgment is required in assessing whether certain of our assets are considered as held for sale as at December 31, 2022. For non-current assets and disposal groups to be considered as held for sale, the asset or disposal group must be available for immediate disposal, by sale or otherwise, in its present condition subject only to terms that are usual and customary for sales of such assets or disposal groups and its sale must be highly probable.
As at December 31, 2022, we have determined that the Fort Hills disposal group, the Quintette disposal group, the Mesaba property, plant and equipment assets, and the San Nicolás property, plant and equipment assets are considered as held for sale.
b) Sources of Estimation Uncertainty
Impairment Testing
When impairment testing is required, discounted cash flow models are used to determine the recoverable amount of respective assets. These models are prepared internally or with assistance from third-party advisors when required. When relevant market transactions for comparable assets are available, these are considered in determining the recoverable amount of assets. Significant assumptions used in preparing discounted cash flow models for our goodwill impairment tests include commodity prices, reserves and resources, mine production, operating costs, capital expenditures, discount rates and foreign exchange rates. Significant assumptions used in preparing the discounted cash flow model for our Trail CGU impairment test include zinc prices, smelter production, operating costs, capital expenditures, treatment charges, zinc premiums, discount rate and foreign exchange rates. These inputs are based on management’s best estimates of what an independent market participant would consider appropriate. Changes in these inputs may alter the results of impairment testing, the amount of the impairment charges or reversals recorded in the statement of income (loss) and the resulting carrying values of assets.
53
Teck 2022 Management’s Discussion and Analysis
a) Impairment Reversal and Asset Impairment
As at December 31, 2022, we did not record impairment or impairment reversals relating to continuing operations. The following pre-tax impairment reversal was recorded in profit in 2021:
Impairment Reversal
| | | | | | | | | | | | | | |
| (CAD$ in millions) | | 2022 | | 2021 |
| Carmen de Andacollo CGU | | $ | — | | | $ | 215 | |
| Total | | $ | — | | | $ | 215 | |
Impairment Testing – 2022
During 2022, we assessed whether there were any indicators of impairment or impairment reversal for our assets and did not identify any matters requiring us to perform an impairment or impairment reversal test, with the exception of the Trail CGU, as outlined below. The results of our assessment of indicators of impairment related to assets held for sale are disclosed in the annual financial statements.
Trail CGU
In the fourth quarter of 2022, as a result of increased costs and operating challenges at the Trail CGU, we performed an impairment test for our Trail CGU. Cash flow projections used in the analysis as at December 31, 2022 were based on an operating plan with cash flows covering a period of 80 years. The recoverable amount of our Trail CGU was approximately equal to the carrying amount of $1.2 billion at the date of testing. As a result, any changes in the key assumptions below could result in the carrying amount exceeding the recoverable amount.
Impairment Reversal – 2021
Carmen de Andacollo CGU
In the fourth quarter of 2021, as a result of higher market expectations for long-term copper prices, we recorded a pre-tax impairment reversal of $215 million (after-tax $150 million) related to our Carmen de Andacollo CGU. The estimated post-tax recoverable amount was significantly higher than the carrying value. The impairment reversal affects the profit of our copper operating segment.
b) Annual Goodwill Impairment Testing
The allocation of goodwill to CGUs or groups of CGUs reflects how goodwill is monitored for internal management purposes. Our Quebrada Blanca CGU and steelmaking coal group of CGUs have goodwill allocated to them.
54
Teck 2022 Management’s Discussion and Analysis
We did not identify any goodwill impairment indicators during 2022. We performed our annual goodwill impairment testing at October 31, 2022, calculating the recoverable amount on a FVLCD basis and did not identify any goodwill impairment losses.
Cash flow projections are based on expected mine life. For our steelmaking coal group of CGUs, the cash flows cover periods of 13 to 42 years, with an estimate of in situ value applied to the remaining resources. For Quebrada Blanca CGU, the cash flow covers the current 27-year expected mine life of the QB2 project and a projected expansion, totalling 40 years, with an estimate of in situ value applied to the remaining resources.
Given the nature of expected future cash flows used to determine the recoverable amount, a material change could occur over time as the cash flows are significantly affected by the key assumptions described below.
Sensitivity Analysis for Annual Goodwill Impairment Testing
The recoverable amount of our steelmaking coal group of CGUs was approximately equal to the carrying amount at the date of the annual goodwill impairment testing. As a result, any changes in the key assumptions below could result in the carrying amount exceeding the recoverable amount.
The recoverable amount of our Quebrada Blanca CGU exceeded the carrying amount at the date of our annual goodwill impairment testing. There are no reasonably possible changes to any of the key assumptions below that would lead to the carrying amount exceeding the recoverable amount.
c) Key Assumptions
The following are the key assumptions used in our impairment testing calculations for the years ended December 31, 2022 and 2021:
| | | | | | | | |
| 2022 | 2021 |
| | |
| Steelmaking coal prices per tonne | Long-term real price in 2027 of US$185 | Long-term real price in 2026 of US$150 |
| Copper prices per pound | Long-term real price in 2027 of US$3.60 | Long-term real price in 2026 of US$3.30 |
Post-tax real discount rates - Steelmaking Coal group of CGUs | 10.0% | 6.0% |
| Post-tax real discount rate - QB CGU | 6.5% | 6.0% |
| Long-term foreign exchange rates | 1 U.S. to 1.30 Canadian dollars | 1 U.S. to 1.28 Canadian dollars |
In our impairment assessment of the Trail CGU, we used long-term assumptions of US$1.25 per pound for zinc, US$277 per pound for treatment charges, US$0.11 per pound for zinc premiums and a post-tax real discount rate of 5.5%.
55
Teck 2022 Management’s Discussion and Analysis
Interrelation of Key Assumptions
The key assumptions used in our determination of recoverable amounts interrelate significantly with each other and with our operating plans. For example, a decrease in long-term commodity prices could result in amendments to the mine plans that would partially offset the effect of lower prices through lower operating and capital costs. It is difficult to determine how all of these factors would interrelate, but in estimating the effect of changes in these assumptions on fair values, we believe that all of these factors need to be considered together. A linear extrapolation of these effects becomes less meaningful as the change in assumption increases.
Price Assumptions
Price assumptions use current prices in the initial year and trend to the long-term prices in the information referenced above. Prices are based on a number of factors, including historical data, analyst estimates and forward curves in the near term and are benchmarked with external sources of information, including information published by our peers and market transactions, where possible, to ensure they are within the range of values used by market participants.
Discount Rates
Discount rates are based on market participant mining and smelting weighted average costs of capital adjusted for risks specific to the operation or asset where appropriate.
Foreign Exchange Rates
Foreign exchange rates are benchmarked with external sources of information based on a range used by market participants.
Reserves and Resources, Mine Production and Smelter Production
Future mineral production is included in projected cash flows based on plant capacities and mineral reserve and resource estimates and related exploration and evaluation work undertaken by appropriately qualified persons.
Future smelter production is included in projected cash flows based on plant capacities.
Operating Costs and Capital Expenditures
Operating costs and capital expenditures are based on life of mine plans, operating plans and internal management forecasts, as applicable. Cost estimates incorporate management experience and expertise, current operating costs, the nature and location of each operation, and the risks associated with each operation. Future capital expenditures are based on management’s best estimate of expected future capital
56
Teck 2022 Management’s Discussion and Analysis
requirements, with input from management’s experts where appropriate. All committed and anticipated capital expenditures based on future cost estimates have been included in the projected cash flows. Operating cost and capital expenditure assumptions are subject to ongoing optimization and review by management.
Recoverable Amount Basis
In the absence of a relevant market transaction, we estimate the recoverable amount of our CGU or group of CGUs on a FVLCD basis using a discounted cash flow methodology, taking into account assumptions likely to be made by market participants unless it is expected that the value in use methodology would result in a higher recoverable amount. For the asset impairment, impairment reversal and goodwill impairment analyses performed in 2022 and 2021, we have applied the FVLCD basis. These estimates are classified as a Level 3 measurement within the fair value measurement hierarchy.
Estimated Recoverable Reserves and Resources
Mineral and oil reserve and resource estimates are based on various assumptions relating to operating matters as set forth in National Instrument 43-101, Standards of Disclosure for Mineral Projects and National Instrument 51-101, Standards of Disclosure for Oil and Gas Activities. Assumptions used include production costs, mining and processing recoveries, cut-off grades, sales volumes, long-term commodity prices, exchange rates, inflation rates, tax and royalty rates and capital costs. Cost estimates are based on prefeasibility or feasibility study estimates or operating history. Estimates are prepared by or under the supervision of appropriately qualified persons, or qualified reserves evaluators, but will be affected by forecasted commodity prices, inflation rates, exchange rates, capital and production costs and recoveries, among other factors. Estimated recoverable reserves and resources are used in performing impairment testing, to determine the depreciation of property, plant and equipment at operating mine sites, in accounting for capitalized production stripping costs and also in forecasting the timing of settlement of decommissioning and restoration costs. Changes in reserve and resource estimates are most significant to estimating the recoverable amount in impairment tests.
Decommissioning and Restoration Provisions
Decommissioning and restoration provisions (DRPs) are based on future cost estimates using information available at the balance sheet date that are developed by management’s experts. DRPs represent the present value of estimated costs of future decommissioning and other site restoration activities, including costs associated with the management of water and water quality in and around each closed site. DRPs are adjusted at each reporting period for changes to factors such as the expected amount of cash flows required to discharge the liability, the timing of such cash flows and the credit-adjusted discount rate. DRPs require significant estimates and assumptions, including the requirements of the relevant legal and regulatory framework and the timing, extent and costs of required decommissioning and restoration activities. Our estimates of the costs associated with the management of water and water quality in and around each closed site include assumptions with respect to the volume and location of water to be treated, the methods used to
57
Teck 2022 Management’s Discussion and Analysis
treat the water and the related water treatment costs. To the extent the actual costs differ from these estimates, adjustments will be recorded and the statement of income (loss) may be affected.
Provision for Income Taxes
We calculate current and deferred tax provisions for each of the jurisdictions in which we operate. Actual amounts of income tax expense are not final until tax returns are filed and accepted by the relevant authorities. This occurs subsequent to the issuance of our financial statements and the final determination of actual amounts may not be completed for a number of years. Therefore, profit (loss) in subsequent periods will be affected by the amount that estimates differ from the final tax assessment.
Deferred Tax Assets and Liabilities
Assumptions about the generation of future taxable profits and repatriation of retained earnings depend on management’s estimates of future production and sales volumes, commodity prices, reserves and resources, operating costs, decommissioning and restoration costs, capital expenditures, dividends and other capital management transactions. These estimates could result in an adjustment to the deferred tax provision and a corresponding adjustment to profit (loss).
58
Teck 2022 Management’s Discussion and Analysis
Adoption of New Accounting Standards and Accounting Developments
New IFRS Pronouncements
Amendments to IFRS 9, IAS 39, IFRS 7, IFRS 4 and IFRS 16 – Interest Rate Benchmark Reform – Phase 2
In August 2020, the IASB issued amendments to IFRS 9, Financial Instruments (IFRS 9), IAS 39, Financial Instruments: Recognition and Measurement (IAS 39), IFRS 7, Financial Instruments: Disclosures (IFRS 7), IFRS 4, Insurance Contracts (IFRS 4) and IFRS 16, Leases (IFRS 16) as a result of Phase 2 of the IASB’s Interest Rate Benchmark Reform project. The amendments address issues arising in connection with reform of benchmark interest rates, including the replacement of one benchmark rate with an alternative one. The amendments were effective January 1, 2021.
Term Secured Overnight Financing Rate (Term SOFR) was formally recommended by the Alternative Reference Rates Committee (a committee convened by the U.S. Federal Reserve Board) as the recommended fallback for USD London Interbank Offered Rate (LIBOR) based loans. Term SOFR is expected to be economically equivalent to LIBOR, allowing for use of the practical expedient under IFRS 9. Our QB2 project financing facility, Compañía Minera Antamina S.A. (Antamina) loan agreement and QB2 advances from Sumitomo Metal Mining Co., Ltd. and Sumitomo Corporation (together referred to as SMM/SC) are our most significant financial instruments that are exposed to LIBOR.
For the year ended December 31, 2022, we transitioned our sustainability-linked revolving credit facility to Term SOFR. This did not affect our financial statements as this credit facility remains undrawn. We have not yet transitioned the remaining financial instruments that use the LIBOR settings that are currently scheduled to cease publication after June 30, 2023. We continue to work with our lenders on the replacement of the affected rates for our other significant financial instruments, which is not expected to result in a significant change to our financial statements, our interest rate risk management strategy or our interest rate risk.
Amendments to IAS 16 – Property, Plant and Equipment: Proceeds before Intended Use
We adopted the amendments to IAS 16, Property, Plant and Equipment on January 1, 2022 with retrospective application. The amendments prohibit a company from deducting from the cost of property, plant and equipment amounts received from selling items produced while the company is preparing the asset for its intended use. Instead, a company will recognize such sales proceeds and related costs in profit (loss). On adoption, these amendments did not affect our financial results. These amendments will have an effect on the accounting related to the sale of products during the commissioning phase of QB2 in 2023.
59
Teck 2022 Management’s Discussion and Analysis
Amendments to IAS 1 – Presentation of Financial Statements
In October 2022, the IASB issued amendments to IAS 1, Presentation of Financial Statements titled Non-current liabilities with covenants. These amendments sought to improve the information that an entity provides when its right to defer settlement of a liability is subject to compliance with covenants within 12 months after the reporting period. These amendments to IAS 1 override but incorporate the previous amendments, Classification of liabilities as current or non-current, issued in January 2020, which clarified that liabilities are classified as either current or non-current, depending on the rights that exist at the end of the reporting period. Liabilities should be classified as non-current if a company has a substantive right to defer settlement for at least 12 months at the end of the reporting period. The amendments are effective January 1, 2024, with early adoption permitted. Retrospective application is required on adoption. We do not expect these amendments to have a material effect on our financial statements.
Amendment to IAS 1 and IFRS Practice Statement 2 – Disclosure of Accounting Policies
In February 2021, the IASB issued amendments to IAS 1, Presentation of Financial Statements and the IFRS Practice Statement 2 Making Materiality Judgements to provide guidance on the application of materiality judgments to accounting policy disclosures. The amendments to IAS 1 replace the requirement to disclose ‘significant’ accounting policies with a requirement to disclose ‘material’ accounting policies. Guidance and illustrative examples are added in the Practice Statement to assist in the application of materiality concept when making judgments about accounting policy disclosures. The amendments are effective January 1, 2023, with early adoption permitted. Prospective application is required on adoption. We do not expect these amendments to have a material effect on our financial statements.
Outstanding Share Data
As at February 17, 2023, there were approximately 506.3 million Class B subordinate voting shares and 7.8 million Class A common shares outstanding. In addition, there were approximately 14.7 million share options outstanding with exercise prices ranging between $5.34 and $50.68 per share. More information on these instruments, and the terms of their conversion, is set out in Note 25 to our 2022 audited annual consolidated financial statements.
The Toronto Stock Exchange (TSX) accepted our notice of intention to make a normal course issuer bid (NCIB) to purchase up to 40 million Class B shares during the period starting November 2, 2022 and ending November 1, 2023, representing approximately 7.9% of the outstanding Class B shares, or 8.9% of the public float, as at October 21, 2022.
Teck is making the normal course issuer bid because it believes that the market price of its Class B subordinate voting shares may, from time to time, not reflect their underlying value and that the share buyback program may provide value by reducing the number of shares outstanding at attractive prices. Any purchases made under the NCIB will be through the facilities of the TSX, the New York Stock Exchange or
60
Teck 2022 Management’s Discussion and Analysis
other alternative trading systems in Canada and the United States, if eligible, or by such other means as may be permitted under applicable securities laws, including private agreements under an issuer bid exemption order or block purchases in accordance with applicable regulations. Any purchases made by way of private agreement under an applicable exemption order issued by a securities regulatory authority may be at a discount to the prevailing market price, as provided for in such exemption order.
Under the TSX rules, except pursuant to permitted exceptions, the number of Class B shares purchased on the TSX on any given day will not exceed 478,948 Class B shares, which is 25% of the average daily trading volume for the Class B shares on the TSX during the six-month period ended September 30, 2022 of 1,915,793, calculated in accordance with the TSX rules. The actual number of Class B shares to be purchased and the timing of any such purchases will generally be determined by us from time to time as market conditions warrant. In addition, we may from time to time repurchase Class B shares under an automatic securities repurchase plan, which will enable purchases during times when we would typically not be permitted to purchase our shares due to regulatory or other reasons. All repurchased shares will be cancelled. During Teck’s previous normal course issuer bid, which commenced on November 2, 2021, and ended on November 1, 2022, Teck purchased 30,703,473 Class B subordinate voting shares at an average purchase price of $45.3623 per share. Teck sought and received approval to purchase up to 40 million Class B subordinate voting shares under the previous normal course issuer bid. Security holders may obtain a copy of the notice of intention, without charge, by request directed to the attention of our Corporate Secretary, at our offices located at Suite 3300–550 Burrard Street, Vancouver, British Columbia, V6C 0B3.
61
Teck 2022 Management’s Discussion and Analysis
Contractual and Other Obligations
| | | | | | | | | | | | | | | | | |
| ($ in millions) | Less than 1 Year | 2–3
Years | 4–5
Years | More than 5 Years | Total |
| Debt – Principal and interest payments | $ | 1,033 | | $ | 1,525 | | $ | 1,691 | | $ | 6,894 | | $ | 11,143 | |
Leases – Principal and interest payments1 | 142 | | 168 | | 117 | | 338 | | 765 | |
Minimum purchase obligations2 | | | | | |
| Concentrate, equipment, supply and other purchases | 985 | | 832 | | 135 | | 14 | | 1,966 | |
| Shipping and distribution | 362 | | 575 | | 494 | | 624 | | 2,055 | |
| Energy contracts | 546 | | 1,223 | | 1,100 | | 5,805 | | 8,674 | |
NAB PILT and VIF payments7 | 51 | | 100 | | 102 | | 62 | | 315 | |
Pension funding3 | 24 | | | | | 24 | |
Other non-pension post-retirement benefits4 | 14 | | 30 | | 32 | | 267 | | 343 | |
Decommissioning and restoration provision5 | 258 | | 348 | | 265 | | 1,949 | | 2,820 | |
Other long-term liabilities6 | 113 | | 132 | | 106 | | 257 | | 608 | |
| Total | $ | 3,528 | | $ | 4,933 | | $ | 4,042 | | $ | 16,210 | | $ | 28,713 | |
Notes:
1.We lease road and port facilities from the Alaska Industrial Development and Export Authority, through which it ships metal concentrates produced at the Red Dog mine. Minimum lease payments are US$6 million for the following 17 years and are subject to deferral and abatement for force majeure events.
2.The majority of our minimum purchase obligations are subject to continuing operations and force majeure provisions.
3.As at December 31, 2022, the company had a net pension asset of $147 million, based on actuarial estimates prepared on a going concern basis. The amount of minimum funding for 2023 in respect of defined benefit pension plans is $24 million. The timing and amount of additional funding after 2023 is dependent upon future returns on plan assets, discount rates and other actuarial assumptions.
4.We had a discounted, actuarially determined liability of $343 million in respect of other non-pension post-retirement benefits as at December 31, 2022. Amounts shown are estimated expenditures in the indicated years.
5.We accrue environmental and reclamation obligations over the life of our mining operations, and amounts shown are estimated expenditures in the indicated years at fair value, assuming credit-adjusted risk-free discount rates between 6.13% and 8.07% and an inflation factor of 2.00%.
6.Other long-term liabilities include amounts for post-closure, environmental costs and other items.
7.On April 25, 2017, Teck Alaska entered into a 10-year agreement with the Northwest Arctic Borough (NAB) for payments in lieu of taxes (PILT). Payments under the agreement are based on a percentage of land, buildings and equipment at cost less accumulated depreciation. The effective date of this agreement was January 1, 2016 and this agreement expires on December 31, 2025. On April 25, 2017, Teck Alaska entered into a 10-year agreement with the NAB for payments to a village improvement fund (VIF). Payments under the agreement are based on a percentage of earnings before income taxes, with 2017–2025 having minimum payments of $4 million and maximum payments of $8 million. The effective date of this agreement was January 1, 2016 and this agreement expires on December 31, 2025.
62
Teck 2022 Management’s Discussion and Analysis
Disclosure Controls and Internal Control Over Financial Reporting
Disclosure Controls and Procedures
Disclosure controls and procedures are designed to provide reasonable assurance that information required to be disclosed in reports filed or submitted by us under U.S. and Canadian securities legislation is recorded, processed, summarized and reported within the time periods specified in those rules, and include controls and procedures designed to ensure that information required to be disclosed in reports filed or submitted by us under U.S. and Canadian securities legislation is accumulated and communicated to management, including the Chief Executive Officer and Chief Financial Officer, as appropriate, to permit timely decisions regarding required disclosure. Management, including the Chief Executive Officer and Chief Financial Officer, has evaluated the effectiveness of the design and operation of our disclosure controls and procedures, as defined in the rules of the U.S. Securities and Exchange Commission and the Canadian Securities Administrators, as at December 31, 2022. Based on this evaluation, the Chief Executive Officer and Chief Financial Officer have concluded that our disclosure controls and procedures were effective as at December 31, 2022.
Management’s Report on Internal Control Over Financial Reporting
Our management is responsible for establishing and maintaining adequate internal control over financial reporting. Any system of internal control over financial reporting, no matter how well-designed, has inherent limitations. Therefore, even those systems determined to be effective can provide only reasonable assurance with respect to financial statement preparation and presentation. Most of our corporate office staff and many site administrative staff worked remotely through 2022. We have retained documentation in electronic form as a result of remote work through this period. There have been no significant changes in our internal controls during the year ended December 31, 2022 that have materially affected, or are reasonably likely to materially affect, internal control over financial reporting.
Management has used the Committee of Sponsoring Organizations of the Treadway Commission (COSO) 2013 framework to evaluate the effectiveness of our internal control over financial reporting. Based on this assessment, management has concluded that as at December 31, 2022, our internal control over financial reporting was effective.
The effectiveness of our internal controls over financial reporting has been audited by PricewaterhouseCoopers LLP, an independent registered public accounting firm, who have expressed their opinion in their report included with our annual consolidated financial statements.
63
Teck 2022 Management’s Discussion and Analysis
Use of Non-GAAP Financial Measures and Ratios
Our financial results are prepared in accordance with International Financial Reporting Standards (IFRS) as issued by the International Accounting Standards Board. This document refers to a number of non-GAAP financial measures and non-GAAP ratios which are not measures recognized under IFRS in Canada and that do not have a standardized meaning prescribed by IFRS or by Generally Accepted Accounting Principles (GAAP) in the United States.
The non-GAAP financial measures and non-GAAP ratios described below do not have standardized meanings under IFRS, may differ from those used by other issuers, and may not be comparable to similar financial measures and ratios reported by other issuers. These financial measures and ratios have been derived from our financial statements and applied on a consistent basis as appropriate. We disclose these financial measures and ratios because we believe they assist readers in understanding the results of our operations and financial position and provide further information about our financial results to investors. These measures should not be considered in isolation or used in substitute for other measures of performance prepared in accordance with IFRS.
Adjusted profit attributable to shareholders: For adjusted profit attributable to shareholders, we adjust profit attributable to shareholders as reported to remove the after-tax effect of certain types of transactions that reflect measurement changes on our balance sheet or are not indicative of our normal operating activities.
EBITDA: EBITDA is profit before net finance expense, provision for income taxes, and depreciation and amortization.
Adjusted EBITDA: Adjusted EBITDA is EBITDA before the pre-tax effect of the adjustments that we make to adjusted profit attributable to shareholders as described above.
Adjusted profit attributable to shareholders, EBITDA and Adjusted EBITDA highlight items and allow us and readers to analyze the rest of our results more clearly. We believe that disclosing these measures assists readers in understanding the ongoing cash-generating potential of our business in order to provide liquidity to fund working capital needs, service outstanding debt, fund future capital expenditures and investment opportunities, and pay dividends.
Gross profit before depreciation and amortization: Gross profit before depreciation and amortization is gross profit with depreciation and amortization expense added back. We believe this measure assists us and readers to assess our ability to generate cash flow from our business units or operations.
Unit costs: Unit costs for our steelmaking coal operations are total cost of goods sold, divided by tonnes sold in the period, excluding depreciation and amortization charges. We include this information as it is frequently
64
Teck 2022 Management’s Discussion and Analysis
requested by investors and investment analysts who use it to assess our cost structure and margins and compare it to similar information provided by many companies in the industry.
Adjusted site cash cost of sales: Adjusted site cash cost of sales for our steelmaking coal operations is defined as the cost of the product as it leaves the mine excluding depreciation and amortization charges, outbound transportation costs and any one-time collective agreement charges and inventory write-down provisions.
Total cash unit costs: Total cash unit costs for our copper and zinc operations includes adjusted cash costs of sales, as described below, plus the smelter and refining charges added back in determining adjusted revenue. This presentation allows a comparison of total cash unit costs, including smelter charges, to the underlying price of copper or zinc in order to assess the margin for the mine on a per unit basis.
Net cash unit costs: Net cash unit costs of principal product, after deducting co-product and by-product margins, are also a common industry measure. By deducting the co- and by-product margin per unit of the principal product, the margin for the mine on a per unit basis may be presented in a single metric for comparison to other operations.
Adjusted cash cost of sales: Adjusted cash cost of sales for our copper and zinc operations is defined as the cost of the product delivered to the port of shipment, excluding depreciation and amortization charges, any one-time collective agreement charges or inventory write-down provisions and by-product cost of sales. It is common practice in the industry to exclude depreciation and amortization as these costs are non-cash and discounted cash flow valuation models used in the industry substitute expectations of future capital spending for these amounts.
Adjusted operating costs: Adjusted operating costs for our energy business unit are defined as the costs of product as it leaves the mine, excluding depreciation and amortization charges, cost of diluent for blending to transport our bitumen by pipeline, cost of non-proprietary product purchased and transportation costs of our product and non-proprietary product and any one-time collective agreement charges or inventory write-down provisions.
Cash margins for by-products: Cash margins for by-products is revenue from by- and co-products, less any associated cost of sales of the by-product and co-product. In addition, for our copper operations, by-product cost of sales also includes cost recoveries associated with our streaming transactions.
Adjusted revenue: Adjusted revenue for our copper and zinc operations excludes the revenue from co-products and by-products, but adds back the processing and refining charges to arrive at the value of the underlying payable pounds of copper and zinc. Readers may compare this on a per unit basis with the price of copper and zinc on the LME.
65
Teck 2022 Management’s Discussion and Analysis
Adjusted revenue for our energy business unit excludes the cost of diluent for blending and non-proprietary product revenue, but adds back Crown royalties to arrive at the value of the underlying bitumen.
Net debt: Net debt is total debt, less cash and cash equivalents.
Net debt to net debt-plus-equity ratio: Net debt to net debt-plus-equity ratio is net debt divided by the sum of net debt plus total equity, expressed as a percentage.
Net debt to adjusted EBITDA ratio: Net debt to adjusted EBITDA ratio is the same calculation as the debt to adjusted EBITDA ratio, but using net debt as the numerator.
Adjusted basic earnings per share: Adjusted basic earnings per share is adjusted profit attributable to shareholders divided by average number of shares outstanding in the period.
Adjusted diluted earnings per share: Adjusted diluted earnings per share is adjusted profit attributable to shareholders divided by average number of fully diluted shares in a period.
Adjusted site cash cost of sales per tonne: Adjusted site cash cost of sales per tonne is a non-GAAP ratio comprised of adjusted site cash cost of sales divided by tonnes sold. There is no similar financial measure in our consolidated financial statements with which to compare. Adjusted site cash cost of sales is a non-GAAP financial measure.
Total cash unit costs per pound: Total cash unit costs per pound is a non-GAAP ratio comprised of adjusted cash cost of sales divided by payable pounds sold plus smelter processing charges divided by payable pounds sold.
Net cash unit costs per pound: Net cash unit costs per pound is a non-GAAP ratio comprised of (adjusted cash cost of sales plus smelter processing charges less cash margin for by-products) divided by payable pounds sold. There is no similar financial measure in our consolidated financial statements with which to compare. Adjusted cash cost of sales is a non-GAAP financial measure.
Cash margins for by-products per pound: Cash margins for by-products per pound is a non-GAAP ratio comprised of cash margins for by-products divided by payable pounds sold.
66
Teck 2022 Management’s Discussion and Analysis
Profit (Loss) Attributable to Shareholders and Adjusted Profit Attributable to Shareholders
| | | | | | | | | | | |
| ($ in millions, except per share data) | 20221 | 20212 | 2020 |
Profit (loss) attributable to shareholders3 | $ | 4,089 | | $ | 2,868 | | $ | (864) | |
| | | |
| Add (deduct) on an after-tax basis: | | | |
| Asset impairments | 952 | | (150) | | 912 | |
| COVID-19 costs | — | | — | | 233 | |
| Loss on debt purchase | 42 | | — | | 8 | |
| QB2 variable consideration to IMSA and ENAMI | 115 | | 124 | | (34) | |
| Environmental costs | 99 | | 79 | | 210 | |
| Inventory write-downs (reversals) | 36 | | 2 | | 91 | |
| Share-based compensation | 181 | | 94 | | 34 | |
| Commodity derivatives | (25) | | 15 | | (46) | |
Loss from discontinued operations for the nine months ended September 30, 20224 | (791) | | — | | — | |
| Other | 175 | | 25 | | 17 | |
| Adjusted profit attributable to shareholders | $ | 4,873 | | $ | 3,057 | | $ | 561 | |
Basic earnings (loss) per share3 | $ | 7.77 | | $ | 5.39 | | $ | (1.62) | |
Diluted earnings (loss) per share3 | $ | 7.63 | | $ | 5.31 | | $ | (1.62) | |
| Adjusted basic earnings per share | $ | 9.25 | | $ | 5.74 | | $ | 1.05 | |
| Adjusted diluted earnings per share | $ | 9.09 | | $ | 5.66 | | $ | 1.04 | |
Notes:
1.Adjustments for the year ended December 31, 2022 are the nine months ended September 30, 2022 as previously reported plus the three months ended December 31, 2022 for continuing operations.
2.Amounts for the year ended December 31, 2021 are as previously reported.
3.Amount for the year ended December 31, 2022 is for continuing operations only.
4.Adjustment required to remove the effect of discontinued operations for the nine months ended September 30, 2022.
67
Teck 2022 Management’s Discussion and Analysis
Reconciliation of Basic Earnings (Loss) per share to Adjusted Basic Earnings per share
| | | | | | | | | | | |
| (Per share amounts) | 20221 | 20212 | 2020 |
Basic earnings (loss) per share3 | $ | 7.77 | | $ | 5.39 | | $ | (1.62) | |
| Add (deduct): | | | |
| Asset impairments | 1.81 | | (0.28) | | 1.71 | |
| COVID-19 costs | — | | — | | 0.44 | |
| Loss on debt purchase | 0.08 | | — | | 0.01 | |
| QB2 variable consideration to IMSA and ENAMI | 0.22 | | 0.23 | | (0.06) | |
| Environmental costs | 0.19 | | 0.15 | | 0.39 | |
| Inventory write-downs (reversals) | 0.07 | | — | | 0.17 | |
| Share-based compensation | 0.34 | | 0.18 | | 0.06 | |
| Commodity derivative | (0.05) | | 0.03 | | (0.09) | |
Loss from discontinued operations for the nine months ended September 30, 20224 | (1.51) | | — | | — | |
| Other | 0.33 | | 0.04 | | 0.04 | |
| Adjusted basic earnings per share | $ | 9.25 | | $ | 5.74 | | $ | 1.05 | |
Notes:
1.Adjustments for the year ended December 31, 2022 are the nine months ended September 30, 2022 as previously reported plus the three months ended December 31, 2022 for continuing operations.
2.Amounts for the year ended December 31, 2021 are as previously reported.
3.Amount for the year ended December 31, 2022 is for continuing operations only.
4.Adjustment required to remove the effect of discontinued operations for the nine months ended September 30, 2022.
68
Teck 2022 Management’s Discussion and Analysis
Reconciliation of Diluted Earnings (Loss) per share to Adjusted Diluted Earnings per share
| | | | | | | | | | | |
| (Per share amounts) | 20221 | 20212 | 2020 |
Diluted earnings (loss) per share3 | $ | 7.63 | | $ | 5.31 | | $ | (1.62) | |
| Add (deduct): | | | |
| Asset impairments | 1.78 | | (0.28) | | 1.70 | |
| COVID-19 costs | — | | — | | 0.43 | |
| Loss on debt purchase | 0.08 | | — | | 0.01 | |
| QB2 variable consideration to IMSA and ENAMI | 0.21 | | 0.23 | | (0.06) | |
| Environmental costs | 0.18 | | 0.15 | | 0.39 | |
| Inventory write-downs (reversals) | 0.07 | | — | | 0.17 | |
| Share-based compensation | 0.34 | | 0.18 | | 0.07 | |
| Commodity derivative | (0.05) | | 0.03 | | (0.09) | |
Loss from discontinued operations for the nine months ended September 30, 20224 | (1.48) | | — | | — | |
| Other | 0.33 | | 0.04 | | 0.04 | |
| Adjusted diluted earnings per share | $ | 9.09 | | $ | 5.66 | | $ | 1.04 | |
Notes:
1.Adjustments for the year ended December 31, 2022 are the nine months ended September 30, 2022 as previously reported plus the three months ended December 31, 2022 for continuing operations.
2.Amounts for the year ended December 31, 2021 are as previously reported.
3.Amount for the year ended December 31, 2022 is for continuing operations only.
4.Adjustment required to remove the effect of discontinued operations for the nine months ended September 30, 2022.
69
Teck 2022 Management’s Discussion and Analysis
Reconciliation of EBITDA, Adjusted EBITDA, Net Debt to Adjusted EBITDA and Net Debt to Capitalization Ratio
| | | | | | | | | | | |
| ($ in millions) | 20221 | 20212 | 2020 |
Profit before taxes3 | $ | 6,565 | | $ 4,532 | $ (1,136) |
Finance expense net of finance income3 | 150 | | 210 | 268 |
Depreciation and amortization3 | 1,674 | | 1,583 | 1,510 |
| EBITDA | 8,389 | | $ 6,325 | $ 642 |
| Add (deduct): | | | |
| Asset impairments (impairment reversal) | 1,234 | | (215) | | 1,244 |
| COVID-19 costs | — | | — | | 336 |
| Loss on debt purchase | 58 | | — | | 11 |
QB2 variable consideration to IMSA and
ENAMI | 188 | | 141 | | (56) |
| Environmental costs | 128 | | 108 | | 270 |
| Inventory write-downs (reversals) | 50 | | 1 | | 134 |
| Share-based compensation | 236 | | 125 | | 47 |
| Commodity derivative gains | (35) | | 22 | | (62) |
Loss from discontinued operations for the nine months ended September 30, 20224 | (811) | | — | | — |
| Other | 131 | | 66 | | 4 |
| Adjusted EBITDA | $ | 9,568 | | 6,573 | 2,570 |
| | | |
| Total debt at year end | 7,738 | | $ 8,068 | $ 6,947 |
| Less: cash and cash equivalents at year end | (1,883) | | (1,427) | $ (450) |
| Net debt | 5,855 | | $ 6,641 | $ 6,497 |
| Debt to adjusted EBITDA ratio | 0.8 | 1.2 | 2.7 |
| Net debt to adjusted EBITDA ratio | 0.6 | 1.0 | 2.5 |
| Equity attributable to shareholders of the company | 25,473 | | 23,005 | 20,039 |
| Other financial obligations | 441 | 257 | 138 |
| Adjusted net debt to capitalization ratio | 0.19 | | 0.22 | 0.24 |
Notes:
1.Adjustments for the year ended December 31, 2022 are the nine months ended September 30, 2022 as previously reported plus the three months ended December 31, 2022 for continuing operations.
2.Amounts for the year ended December 31, 2021 are as previously reported.
3.Amount for the year ended December 31, 2022 is for continuing operations only.
4.Adjustment required to remove the effect of discontinued operations for the nine months ended September 30, 2022.
70
Teck 2022 Management’s Discussion and Analysis
Reconciliation of Gross Profit Before Depreciation and Amortization
| | | | | | | | | | | |
| ($ in millions) | 2022 | 2021 | 2020 |
| Gross profit | $ | 8,571 | | $ | 5,214 | | $ | 1,333 | |
| Depreciation and amortization | 1,674 | | 1,487 | | 1,510 | |
| Gross profit before depreciation and amortization | $ | 10,245 | | $ | 6,701 | | $ | 2,843 | |
| | | |
| Reported as: | | | |
| Copper | | | |
| Highland Valley Copper | $ | 738 | | $ | 883 | | $ | 476 | |
| Antamina | 1,021 | | 992 | | 566 | |
| Carmen de Andacollo | 73 | | 209 | | 170 | |
| Quebrada Blanca | 8 | | 42 | | 30 | |
| Other | (3) | | — | | — | |
| 1,837 | | $ | 2,126 | | $ | 1,242 | |
| | | |
| Zinc | | | |
| Trail Operations | (18) | | 84 | | 65 | |
| Red Dog | 1,060 | | 822 | | 717 | |
| Other | 2 | | 12 | | 33 | |
| 1,044 | | 918 | | 815 | |
| | | |
| Steelmaking coal | 7,364 | | 3,657 | | 1,009 | |
| | | |
Energy1 | — | | — | | (223) | |
| Gross profit before depreciation and amortization | $ | 10,245 | | $ | 6,701 | | $ | 2,843 | |
Note:
1.Comparative figures for 2021 for the Energy Business Unit have been represented for the classification of Fort Hills as a discontinued operation. 2020 figures have not been represented.
71
Teck 2022 Management’s Discussion and Analysis
Copper Unit Cost Reconciliation
| | | | | | | | |
| (CAD$ in millions, except where noted) | 2022 | 2021 |
| Revenue as reported | $ | 3,381 | | $ | 3,452 | |
| By-product revenue (A) | (456) | | (386) | |
| Smelter processing charges (B) | 140 | | 124 | |
| Adjusted revenue | $ | 3,065 | | $ | 3,190 | |
| | |
| Cost of sales as reported | $ | 1,982 | | $ | 1,711 | |
| Less: | | |
| Depreciation and amortization | (438) | | (385) | |
| Labour settlement and strike costs | (33) | | (26) | |
| By-product cost of sales (C) | (101) | | (84) | |
| Adjusted cash cost of sales (D) | $ | 1,410 | | $ | 1,216 | |
| | |
| Payable pounds sold (millions) (E) | 588.3 | 596.1 | |
| Per unit amounts — CAD$/pound | | |
| Adjusted cash cost of sales (D/E) | $ | 2.40 | | $ | 2.04 | |
| Smelter processing charges (B/E) | 0.24 | | 0.21 | |
| Total cash unit costs — CAD$/pound | $ | 2.64 | | $ | 2.25 | |
| Cash margins for by-products — ((A−C)/E) | (0.60) | | (0.51) | |
| Net cash unit costs — CAD$/pound | $ | 2.04 | | $ | 1.74 | |
| | |
US$ amounts1 | | |
| Average exchange rate (CAD$ per US$1.00) | $ | 1.30 | | $ | 1.25 | |
| Per unit amounts — US$/pound | | |
| Adjusted cash cost of sales | $ | 1.84 | | $ | 1.63 | |
| Smelter processing charges | 0.18 | | 0.17 | |
| Total cash unit costs — US$/pound | $ | 2.02 | | $ | 1.80 | |
| Cash margins for by-products | (0.46) | | (0.41) | |
| Net cash unit costs — US$/pound | $ | 1.56 | | $ | 1.39 | |
Note:
1.Average period exchange rates are used to convert to US$ per pound equivalent.
72
Teck 2022 Management’s Discussion and Analysis
Zinc Unit Cost Reconciliation (Mining Operations1)
| | | | | | | | |
| (CAD$ in millions, except where noted) | 2022 | 2021 |
| Revenue as reported | $ | 3,526 | | $ | 3,063 | |
| Less: | | |
| Trail Operations revenues as reported | (2,059) | | (1,997) | |
| Other revenues as reported | (11) | | (10) | |
| Add back: Intra-segment revenues as reported | 655 | | 511 | |
| $ | 2,111 | | $ | 1,567 | |
| By-product revenues (A) | (260) | | (336) | |
| Smelter processing charges (B) | 297 | | 240 | |
| Adjusted revenue | $ | 2,148 | | $ | 1,471 | |
| | |
| Cost of sales as reported | $ | 2,755 | | $ | 2,375 | |
| Less: | | |
| Trail Operations cost of sales as reported | (2,152) | | (1,999) | |
| Other costs of sales as reported | (9) | | 2 | |
| Add back: Intra-segment purchases as reported | 655 | | 511 | |
| $ | 1,249 | | $ | 889 | |
| Less: | | |
| Depreciation and amortization | (198) | | (144) | |
| Royalty costs | (461) | | (323) | |
| By-product cost of sales (C) | (65) | | (68) | |
| Adjusted cash cost of sales (D) | $ | 525 | | $ | 354 | |
| Payable pounds sold (millions) (E) | 1,088.9 | | 842.4 | |
| Per unit amounts — CAD$/pound | | |
| Adjusted cash cost of sales (D/E) | $ | 0.48 | | $ | 0.42 | |
| Smelter processing charges (B/E) | 0.27 | | 0.28 | |
| Total cash unit costs — CAD$/pound | $ | 0.75 | | $ | 0.70 | |
| Cash margins for by-products — ((A−C)/E) | (0.18) | | (0.32) | |
| Net cash unit costs — CAD$/pound | $ | 0.57 | | $ | 0.38 | |
| | |
US$ amounts2 | | |
| Average exchange rate (CAD$ per US$1.00) | $ | 1.30 | | $ | 1.25 | |
| Per unit amounts — US$/pound | | |
| Adjusted cash cost of sales | $ | 0.37 | | $ | 0.34 | |
| Smelter processing charges | 0.21 | | 0.22 | |
| Total cash unit costs — US$/pound | $ | 0.58 | | $ | 0.56 | |
| Cash margins for by-products | (0.14) | | (0.26) | |
Net cash unit costs — US$/pound | $ | 0.44 | | $ | 0.30 | |
Notes:
1.Red Dog Mining Operations.
2.Average period exchange rates are used to convert to US$ per pound equivalent.
73
Teck 2022 Management’s Discussion and Analysis
Steelmaking Coal Unit Cost Reconciliation
| | | | | | | | |
| (CAD$ in millions, except where noted) | 2022 | 2021 |
| Cost of sales as reported | $ | 4,008 | | $ | 3,466 | |
| Less: | | |
| Transportation (A) | (1,053) | | (1,037) | |
| Depreciation and amortization | (963) | | (872) | |
| Inventory write-down reversal (B) | — | | (10) | |
| Labour settlement (C) | — | | (39) | |
| Elkview shutdown (D) | (14) | | — | |
| Adjusted site cost of sales | $ | 1,978 | | $ | 1,528 | |
| Tonnes sold (millions) (F) | 22.2 | | 23.4 |
| Per unit amounts — CAD$/tonne | | |
| Adjusted site cost of sales (E/F) | 89 | | $ | 65 | |
| Transportation costs (A/F) | 47 | | 44 | |
| Inventory write-downs (B/F) | — | | — | |
| Labour settlement (C/F) | — | | 2 |
| Elkview shutdown (D/F) | 1 | | — | |
| Unit costs — CAD$/tonne | $ | 137 | | $ | 111 | |
| | |
US$ amounts1 | | |
| Average exchange rate (CAD$ per US$1.00) | $ | 1.30 | | $ | 1.25 |
| Per unit amounts — US$/tonne | | |
| Adjusted site cost of sales | $ | 68 | | $ | 52 | |
| Transportation | 36 | | 35 | |
| Inventory write-down reversal | — | | — | |
| Labour settlement | — | | 2 |
| Elkview shutdown | — | | — | |
| Unit costs — US$/tonne | $ | 104 | | $ | 89 | |
Note:
1.Average period exchange rates are used to convert to US$/tonne equivalent.
74
Teck 2022 Management’s Discussion and Analysis
Cautionary Statement on Forward-Looking Statements
This document contains certain forward-looking information and forward-looking statements as defined in applicable securities laws (collectively referred to as forward-looking statements). These statements relate to future events or our future performance. All statements other than statements of historical fact are forward-looking statements. The use of any of the words “anticipate”, “plan”, “continue”, “estimate”, “expect”, “may”, “will”, “project”, “predict”, “potential”, “should”, “believe”, “forecast” and similar expressions is intended to identify forward-looking statements. These statements involve known and unknown risks, uncertainties and other factors that may cause actual results or events to differ materially from those anticipated in such forward-looking statements. These statements speak only as of the date of this document.
These forward-looking statements include, but are not limited to, statements concerning: our focus and strategy; anticipated global and regional supply, demand and market outlook for our commodities; the proposed separation of our business into two independent, publicly-listed companies; terms and conditions of the Separation, including the expected distribution of EVR shares and cash, available consideration election for shareholders and the Transition Capital Structure to be retained by Teck; the timing for completion of the Separation; the tax and accounting treatment for the Separation; the proposed transaction to eliminate the multiple voting rights attached to the Class A common shares; expectation that QB2 will be a long-life, low-cost operation with major expansion potential; QB2 capital cost guidance and development capital spending in 2023; expectations that QB2 will be commissioned in 2023 and production will ramp up during the year; timing of progress and milestones at our QB2 project, including system completion and handover; expectation that QB2 will have 100% renewable power beginning in 2025; estimated timing of first production from QB2; our expectations regarding our QBME project, including those related to timeline and permitting; our drilling and exploration plans; our plans for advancing our Copper Growth assets, including timing for completion of studies, permitting, development, construction and first production at various projects; the closing of the transaction with Agnico Eagle Mines Limited; timing of the Zafranal project SEIA, the San Nicolás project feasibility study, the Highland Valley Copper feasibility study and environmental permitting for HVC 2040, the Galore Creek project prefeasibility study; timing for recovery of delayed fourth quarter sales of steelmaking coal; timing for construction of the Elkview AMC project and commencement of mining operations in the Harmer area; the expectation that the Elkview AMC project and the benefits thereof, including the provision of high-quality steelmaking coal supporting a 9-million-tonne-per-annum rate with top quartile operating margins; timing and ability to advance the Fording River Extension; expectations related to our Elk Valley water treatment capacity, the regulatory process related to water treatment, and the timing of construction and completion of our various proposed water treatment facilities; expectations for stabilization and reduction of the selenium trend in the Elk Valley; expectations for total water treatment capacity; projected spending, including capital and operating costs, from 2023 to 2024 on water treatment, water management and incremental measures associated with the Direction; expectations regarding performance at Neptune Bulk Terminals; liquidity and availability of borrowings under our credit facilities and project finance facility; our ability to obtain additional credit for posting security for reclamation at our sites; the expected receipt or completion of prefeasibility studies, feasibility studies and other studies and the expected timing thereof; all guidance appearing in this document including, but not limited to, the production, sales, cost, unit cost, capital expenditure, transportation cost, cost reduction and other guidance under the heading
75
Teck 2022 Management’s Discussion and Analysis
“Guidance” and discussed in the various business unit sections; the potential impact of COVID-19 on our business and operations, including our ability to continue operations at our sites and progress our development projects and business strategy, and our plans and strategies to mitigate the impact thereof; our ability to manage challenges presented by COVID-19, including the effectiveness of our management protocols implemented to protect the health and safety of our employees; expectations regarding planned maintenance at our operations; the effectiveness of our water management at Red Dog; expected sales from Red Dog in the first quarter of 2023; expected benefits of our RACE program and our plans for the future; the amount of potential taxes, interest and penalties relating to the Antamina tax dispute and our share thereof; our tax position and the tax rates applicable to us; our expectations regarding inflationary pressures and increased key input costs, including profit-based compensation and royalties; our expectations regarding the amount of Class B subordinate voting shares that might be purchased under the normal course issuer bid and the mechanics thereof; expectations regarding our dividend policy and our capital allocation framework; our expectations, projections and sensitivities under the heading “Commodity Prices and Sensitivities”; expectations regarding carbon legislation and climate change regulations, including our expectation that we will receive a portion of our carbon tax expenditures back under the CleanBC program; and the impact of certain accounting initiatives and estimates.
These statements are based on a number of assumptions, including, but not limited to, assumptions disclosed elsewhere in this document and regarding general business and economic conditions, interest rates, commodity and power prices, acts of foreign or domestic governments and the outcome of legal proceedings, the supply and demand for, deliveries of, and the level and volatility of prices of copper, zinc, and steelmaking coal and our other metals and minerals, as well as oil, natural gas and other petroleum products, the timing of the receipt of permits and other regulatory and governmental approvals for our development projects and other operations, including mine extensions; our ability to complete the Separation, including obtaining receipt of required approvals from the court, shareholders and the Toronto Stock Exchange: the possibility that the Separation and the transactions with NSC and POSCO will not be completed on the terms and conditions, or on the timing, currently contemplated, and that the transactions may not be completed at all, due to a failure to obtain or satisfy, in a timely manner or otherwise, required shareholder, regulatory and court approvals and other conditions of closing necessary to complete the transactions or for other reasons; the possibility of adverse reactions or changes in business relationships resulting from the announcement or completion of the Separation; risk that market or other conditions are no longer favourable to completing the Separation; risks relating to business disruption during the pendency of or following the Separation and diversion of management time; risks relating to tax, legal and regulatory matters; credit, market, currency, operational, commodity, liquidity and funding risks generally and relating specifically to the Separation, including changes in economic conditions, interest rates or tax rates; and other risks inherent to our business and/or factors beyond Teck’s control which could have a material adverse effect on Teck or the ability to consummate the Separation and transactions with NSC and POSCO; our ability to obtain the required approvals for the proposed transaction to eliminate the multiple votes rights attached to the Class A common shares; our ability to satisfy the closing conditions for our transaction with Agnico Eagle; positive results from the studies on our expansion and development projects; our ability to secure adequate transportation, including rail and port services, for our products; our costs of production and our production and productivity levels, as well as those of our competitors; continuing availability of water and
76
Teck 2022 Management’s Discussion and Analysis
power resources for our operations; changes in credit market conditions and conditions in financial markets generally; the availability of funding to refinance our borrowings as they become due or to finance our development projects on reasonable terms; availability of letters of credit and other forms of financial assurance acceptable to regulators for reclamation and other bonding requirements; our ability to procure equipment and operating supplies and services in sufficient quantities and on a timely basis; the availability of qualified employees and contractors for our operations, including our new developments; our ability to attract and retain skilled employees; the satisfactory negotiation of collective agreements with unionized employees; the impact of changes in Canadian-U.S. dollar, Canadian dollar-Chilean peso, and other foreign exchange rates on our costs and results; engineering and construction timetables and capital costs for our development and expansion projects; the benefits of technology for our operations and development projects; closure costs and environmental compliance costs generally; market competition; the accuracy of our mineral reserve and resource estimates (including with respect to size, grade and recoverability) and the geological, operational and price assumptions on which these are based; tax benefits and tax rates; the outcome of our steelmaking coal price and volume negotiations with customers; the outcome of our copper, zinc and lead concentrate treatment and refining charge negotiations with customers; the resolution of environmental and other proceedings or disputes; the future supply of low-cost power to the Trail smelting and refining complex; our ability to obtain, comply with and renew permits, licences, and leases in a timely manner; our ongoing relations with our employees and with our business and joint venture partners; and the impacts of the COVID-19 pandemic on our operations and projects and on global markets.
In addition, assumptions regarding the Elk Valley Water Quality Plan include assumptions that additional treatment will be effective at scale, and that the technology and facilities operate as expected, as well as additional assumptions discussed under the heading “Elk Valley Water Quality Management Update”. Assumptions regarding QB2 include current project assumptions and assumptions regarding the final feasibility study. Estimates of future construction capital at QB2 are based on a CLP/USD rate range of 900 to 975 and a CAD/USD exchange rate of $1.30, as well as there being no further unexpected material and negative impact to the various contractors, suppliers and subcontractors for the QB2 project that would impair their ability to provide goods and services as anticipated during construction, commissioning and ramp-up activities. Statements regarding the availability of our credit facilities and project finance facility are based on assumptions that we will be able to satisfy the conditions for borrowing at the time of a borrowing request and that the facilities are not otherwise terminated or accelerated due to an event of default. Assumptions regarding the costs and benefits of our projects include assumptions that the relevant project is constructed, commissioned and operated in accordance with current expectations. Expectations regarding our operations are based on numerous assumptions regarding the operations. Our Guidance tables and business unit sections include disclosure and footnotes with further assumptions relating to our guidance, and assumptions for certain other forward-looking statements accompany those statements within the document. Expectations regarding the impact of foreign exchange rates are based on the assumptions set out in this document. Statements regarding the availability of our credit facilities and project financing facility are based on assumptions that we will be able to satisfy the conditions for borrowing at the time of a borrowing request and that the credit facilities are not otherwise terminated or accelerated due to an event of default. Statements concerning future production costs or volumes are based on numerous assumptions regarding operating matters and on assumptions that demand for products develops as anticipated, that customers and other
77
Teck 2022 Management’s Discussion and Analysis
counterparties perform their contractual obligations, that operating and capital plans will not be disrupted by issues such as mechanical failure, unavailability of parts and supplies, labour disturbances, interruption in transportation or utilities, adverse weather conditions, COVID-19, and that there are no material unanticipated variations in the cost of energy or supplies. Statements regarding anticipated steelmaking coal sales volumes and average steelmaking coal prices depend on timely arrival of vessels and performance of our steelmaking coal-loading facilities, as well as the level of spot pricing sales. Expected timing of first production related to our Copper Growth assets and other projects assumes positive outcomes of the related prefeasibility and feasibility studies, timely receipt of all permits, and development approvals. The foregoing list of assumptions is not exhaustive. Events or circumstances could cause actual results to vary materially.
Factors that may cause actual results to vary materially include, but are not limited to, the failure to obtain required approvals in connection with the Separation; adverse reactions or changes in business relationships resulting from the announcement or completion of the Separation; changes in tax, legal or regulatory matters or market or other condition such that it conditions are no longer favourable to completing the Separation; business disruptions prior to or following the Separation; changes to our business and/or factors beyond Teck’s control that could have a material adverse effect on Teck or the ability or desire to consummate the Separation and transactions with NSC and POSCO; the possibility that the proposed transaction to eliminate the multiple voting rights attached to the Class A common shares may not be completed on the terms and conditions, or on the timing, currently contemplated, or at all, including due to the failure to obtain or satisfy, in a timely manner or otherwise, required shareholder and other approvals and other conditions of closing necessary; changes in commodity and power prices, changes in market demand for our products, changes in interest and currency exchange rates, acts of governments and the outcome of legal proceedings; inaccurate geological and metallurgical assumptions (including with respect to the size, grade and recoverability of mineral reserves and resources); unanticipated operational difficulties (including failure of plant, equipment or processes to operate in accordance with specifications or expectations, cost escalation, unavailability of labour, materials and equipment, government action or delays in the receipt of government approvals, changes in tax or royalty rates, industrial disturbances or other job action, adverse weather conditions and unanticipated events related to health, safety and environmental matters); union labour disputes; impact of COVID-19 and related mitigation protocols; political risk; social unrest; failure of customers or counterparties (including logistics suppliers) to perform their contractual obligations; changes in our credit ratings; unanticipated increases in costs to construct our development projects; difficulty in obtaining permits; inability to address concerns regarding permits or environmental impact assessments; difficulty satisfying the closing conditions for our transaction with Agnico Eagle; and changes in or deterioration of general economic conditions. The amount and timing of capital expenditures is depending upon, among other matters, being able to secure permits, equipment, supplies, materials and labour on a timely basis and at expected costs. Certain operations and projects are not controlled by us; schedules and costs may be adjusted by our partners, and timing of spending and operation of the operation or project is not in our control. Certain of our other operations and projects are operated through joint arrangements where we may not have control over all decisions, which may cause outcomes to differ from current expectations. Current and new technologies relating to our Elk Valley water treatment efforts may not perform as anticipated, and ongoing monitoring may reveal unexpected environmental conditions requiring additional remedial measures. QB2 costs, construction progress and timing of first production, commissioning and commercial production is dependent on, among
78
Teck 2022 Management’s Discussion and Analysis
other matters, our continued ability to advance progress on construction, commissioning and ramp-up as currently anticipated and successfully manage through the impacts of the COVID-19 pandemic, including but not limited to absenteeism and lowered productivity. QB2 costs may also be affected by claims and other proceedings that might be brought against us relating to costs and impacts of the COVID-19 pandemic. Further factors associated with our Elk Valley Water Quality Plan are discussed under the heading “Elk Valley Water Quality Management Update”. Declaration and payment of dividends is in the discretion of the Board, and our dividend policy will be reviewed regularly and may change. Dividends and share repurchases can be impacted by share price volatility, negative changes to commodity prices, availability of funds to purchase shares, alternative uses for funds, compliance with regulatory requirements and other risk factors impacting our business as detailed in our Annual Information Form. Production at our Red Dog Operations may also be impacted by water levels at site. Unit costs in our copper business unit are impacted by higher profitability at Antamina, which can cause higher workers’ participation and royalty expenses. Sales to China may be impacted by general and specific port restrictions, Chinese regulation and policies and normal production and operating risks. Purchases of Class B subordinate voting shares under our normal course issuer bid may be affected by, among other things, availability of Class B subordinate voting shares, share price volatility, our ability to obtain the renewal of our normal course issuer bid and in compliance with regulatory requirements, availability of funds to purchase shares, and alternative uses for funds. Share repurchases are also subject to conditions under corporate law.
The forward-looking statements and actual results will also be impacted by the effects of COVID-19 and related matters, particularly if there is a further resurgence of the virus. The overall effects of COVID-19-related matters on our business, operations and projects will depend on the ability of our sites to maintain normal operations, including due to elevated rates of absenteeism in our workforce, and on the duration of impacts on our suppliers, customers and markets for our products, all of which are unknown at this time.
We assume no obligation to update forward-looking statements except as required under securities laws. Further information concerning risks, assumptions and uncertainties associated with these forward-looking statements and our business can be found in our Annual Information Form for the year ended December 31, 2022, filed under our profile on SEDAR (www.sedar.com) and on EDGAR (www.sec.gov) under cover of Form 40-F, as well as subsequent filings that can also be found under our profile.
Scientific and technical information in this document regarding our coal properties, which for this purpose does not include the discussion under “Elk Valley Water Quality Management Update”, was reviewed, approved and verified by Jo-Anna Singleton P.Geo. and Cameron Feltin, P.Eng., each an employee of Teck Coal Limited and a Qualified Person as defined under National Instrument 43-101. Scientific and technical information in this document regarding our base metal properties was reviewed, approved and verified by Rodrigo Alves Marinho, P.Geo., an employee of Teck and a Qualified Person as defined under National Instrument 43-101.
79
Teck 2022 Management’s Discussion and Analysis