EXHIBIT 99.3
Management’s Discussion and Analysis
The management’s discussion and analysis of our results of operations is prepared as at March 5, 2010 and should be read in conjunction with our audited consolidated financial statements and the notes thereto as at and for the year ended December 31, 2009. Unless the context otherwise dictates, a reference to Teck, Teck Resources, the Company, us, we or our, refers to Teck Resources Limited and its subsidiaries including Teck Metals Ltd.; a reference to TML refers to Teck Metals Ltd. and its subsidiaries; and a reference to Aur or Aur Resources refers to Aur Resources Inc. and its subsidiaries. All dollar amounts are in Canadian dollars, unless otherwise specified, and are based on our consolidated financial statements that are prepared in accordance with Canadian generally accepted accounting principles (GAAP). The effect of significant diff erences between Canadian and US GAAP are disclosed in note 25 to our consolidated financial statements. Certain comparative amounts have been reclassified to conform to the presentation adopted for 2009. In addition, in May 2007 our Class A common and Class B subordinate voting shares were split on a two-for-one basis. All comparative figures related to outstanding shares and per share amounts have been adjusted to reflect the share split.
This management’s discussion and analysis contains certain forward-looking information and forward-looking statements. You should review the cautionary statement on forward-looking information under the caption “Caution on Forward-Looking Information”, which forms part of this management’s discussion and analysis.
Business Unit Results
The table below shows our share of production of our major commodities for the last five years and expected production for 2010.
Five-year production record and 2010 plan (our proportionate share)
| | Units (000’s) | 2005 | 2006 | 2007 | 2008 | 2009 | 2010 Plan |
| |
| | | | | | | | |
| Principal Products | | | | | | | |
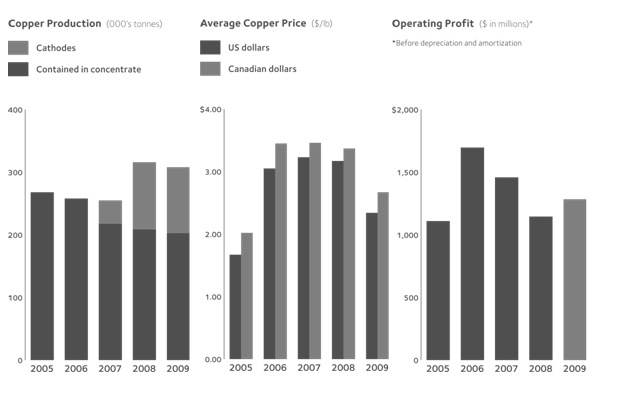
| Copper contained in concentrate | tonnes | 268 | 258 | 218 | 209 | 203 | 245 |
| Copper cathodes | tonnes | – | – | 37 | 107 | 105 | 95 |
| | | 268 | 258 | 255 | 316 | 308 | 340 |
| Metallurgical coal | | | | | | | |
| Direct share | tonnes | 9,948 | 8,657 | 9,024 | 11,282 | 18,930 | 24,000 |
| Indirect share | tonnes | 1,376 | 1,147 | 1,552 | 2,345 | – | – |
| | | 11,324 | 9,804 | 10,576 | 13,627 | 18,930 | 24,000 |
| | | | | | | | |
| Refined zinc | tonnes | 223 | 296 | 292 | 270 | 240 | 290 |
| Zinc contained in concentrate | tonnes | 657 | 627 | 699 | 663 | 711 | 650 |
| | | | | | | | |
| Other Products | | | | | | | |
| Molybdenum contained in concentrate | pounds | 9,640 | 8,032 | 7,235 | 7,224 | 7,798 | 7,500 |
| Refined lead | tonnes | 69 | 90 | 76 | 85 | 73 | 80 |
| Lead contained in concentrate | tonnes | 110 | 129 | 146 | 133 | 132 | 95 |
Notes to five-year production record and 2010 plan:
(1) In August 2007, we acquired the Quebrada Blanca, Andacollo and Duck Pond mines as a result of our acquisition of Aur Resources Inc. Quebrada Blanca and Andacollo produce cathode copper. Duck Pond produces copper and zinc concentrates. We report 100% of the production of Quebrada Blanca and Andacollo, even though we own 76.5% and 90%, respectively of these operations because we fully consolidate their results in our financial statements.
(2) The direct share of coal production includes our proportionate share of production from the Teck Coal Partnership (formerly Elk Valley Coal Partnership), which was 35% on February 28, 2003 and increased in various increments to 40% on April 1, 2006. Fording Canadian Coal Trust (Fording) owned the remaining interest in the Teck Coal Partnership. The indirect share of coal production was from our investment in units of Fording. We owned approximately 9% of Fording from February 28, 2003 to September 27, 2007 and on September 27, 2007 increased our interest in Fording to 19.95%. In October 2008, we acquired all of the assets of Fording, which consisted primarily of its 60% interest in the Teck Coal Partnership.
(3) Our Lennard Shelf zinc mine produced from April 2007 to August 2008 when it was permanently closed. Our Pend Oreille zinc mine has been on a temporary shutdown since February 2009.
(4) In 2005, refined zinc and lead production was affected by a three-month strike at our Trail metallurgical operation.
Our business is the exploration for and development and production of natural resources. Through our interests in mining and processing operations in Canada, the United States and South America we are an important producer of copper and one of the world’s largest zinc miners. We hold a 100% direct ownership in Teck Coal, the world’s second largest exporter of seaborne high quality coking coal. Our principal products are copper, metallurgical coal, and zinc. Lead, molybdenum, various specialty and other metals, chemicals and fertilizers are by-products produced at our operations. We also own a 20% interest in the Fort Hills oil sands project and a 50% interest in other oil sands leases in the Athabasca region of Alberta, Canada. In 2009 we sold our gold mines and results from those operations have been classified as discontinued operatio ns.
We manage our activities along commodity lines and are organized into business units as follows:
• Copper • Coal • Zinc • Energy • Corporate
Our energy business unit consists of our investments in our oil sands projects, which are in various stages of exploration and development. Our corporate business unit includes all of our activities in other commodities, our corporate growth initiatives and groups that provide administrative, technical, financial and other support to all of our business units.
Teck 2009 Management’s Discussion and Analysis 1
The comparability of business unit results between 2009 and 2008 was affected by two significant events. The first was the rapid deterioration in global economic conditions in the latter part of 2008 followed by a subsequent improvement throughout 2009. The deterioration that occurred in late 2008 contributed to a steep decline in the demand and selling prices for the commodities we produce. As a result, significant negative pricing adjustments reduced our revenues from base metals in the fourth quarter of 2008. With the improvement in the global economy in 2009, commodity prices improved significantly and this resulted in substantial positive pricing adjustments on our base metal revenues in 2009. The second event was our acquisition of Fording’s 60% interest in the coal assets in October, 2008. Our operating profit for the coal business uni t included 40% of Teck Coal’s operating profit for 10 months and 100% for two months in 2008 and 100% for the entire year in 2009. In addition, the acquisition of the coal assets resulted in a significant increase in the depreciation charge against the coal assets as the historical cost bases of the acquired assets were adjusted to reflect the acquisition cost. As a result of the US dollar denominated debt incurred to finance the Fording acquisition, and the favourable movement in the Canadian/US dollar exchange rate, our 2009 earnings included a significant non-cash foreign exchange translation gain.
Average commodity prices and exchange rates for the past three years, which are a key driver of our earnings, are summarized in the following table.
| | | | US$ | | | | | CDN$ | | |
| | 2009 | % chg | 2008 | % chg | 2007 | 2009 | % chg | 2008 | % chg | 2007 |
| | | | | | | | | | | |
| Copper (LME Cash – $/pound) | 2.34 | -26% | 3.17 | -2% | 3.23 | 2.67 | -21% | 3.37 | -3% | 3.46 |
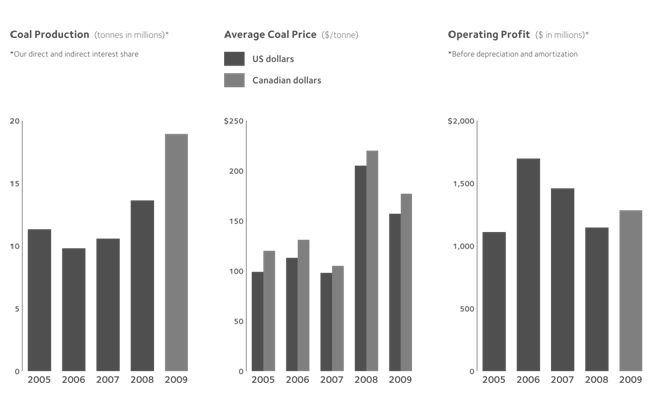
| Coal (realized – $/tonne) | 157 | -23% | 205 | +109% | 98 | 177 | -20% | 220 | +110% | 105 |
| Zinc (LME Cash – $/pound) | 0.75 | -12% | 0.85 | -42% | 1.47 | 0.86 | -6% | 0.91 | -42% | 1.57 |
| Molybdenum (Platts* – $/pound) | 11 | -62% | 29 | -3% | 30 | 13 | -58% | 31 | -3% | 32 |
| Lead (LME Cash – $/pound) | 0.78 | -18% | 0.95 | -19% | 1.17 | 0.89 | -12% | 1.01 | -19% | 1.25 |
| Exchange rate (Bank of Canada) | | | | | | | | | | |
| US$1 = CDN$ | 1.14 | +7% | 1.07 | –% | 1.07 | | | | | |
| CDN$1 = US$ | 0.88 | -7% | 0.93 | –% | 0.93 | | | | | |
*Published major supplier selling price in Platts Metals Week.
Our revenue and operating profit before depreciation and amortization by business unit is summarized in the following table.
| | | Revenues | | | | | | Operating Profit Before Depreciation and Amortization* | |
| ($ in millions) | | 2009 | | | 2008 | | | 2007 | | | 2009 | | | 2008 | | | 2007 | |
| | | | | | | | | | | | | | | | | | | |
| Copper | | $ | 2,161 | | | $ | 2,156 | | | $ | 2,186 | | | $ | 1,284 | | | $ | 1,146 | | | $ | 1,459 | |
| Coal | | | 3,507 | | | | 2,428 | | | | 951 | | | | 1,795 | | | | 1,226 | | | | 249 | |
| Zinc | | | 2,006 | | | | 2,071 | | | | 3,052 | | | | 583 | | | | 439 | | | | 1,328 | |
| Total | | $ | 7,674 | | | $ | 6,655 | | | $ | 6,189 | | | $ | 3,662 | | | $ | 2,811 | | | $ | 3,036 | |
*Operating profit before depreciation and amortization is a non-GAAP financial measure. See use of non-GAAP Financial Measures section for further information.
Teck 2009 Management’s Discussion and Analysis 2
Copper
2009 Production: 308,000 tonnes
In 2009, we produced copper concentrates at Highland Valley Copper, Duck Pond and Antamina, in which we have a joint venture interest. Our Quebrada Blanca and Carmen de Andacollo mines in Chile produce cathode copper, with Andacollo transitioning to a concentrate producer in 2010. Significant amounts of zinc were produced in concentrates at both Antamina and Duck Pond, and Highland Valley Copper and Antamina produced significant amounts of molybdenum in concentrate.
In 2009, our copper operations accounted for 28% of our revenue and 35% of our operating profit before depreciation and amortization.
| | | | | | Revenues | | | | | | Operating Profit Before Depreciation and Amortization |
| ($ in millions) | | 2009 | | | 2008 | | | 2007 | | | 2009 | | | 2008 | | | 2007 | |
| | | | | | | | | | | | | | | | | | | |
| Highland Valley Copper | | $ | 838 | | | $ | 789 | | | $ | 1,115 | | | $ | 473 | | | $ | 426 | | | $ | 776 | |
| Antamina | | | 634 | | | | 569 | | | | 775 | | | | 450 | | | | 368 | | | | 597 | |
| Quebrada Blanca | | | 484 | | | | 574 | | | | 215 | | | | 265 | | | | 267 | | | | 71 | |
| Andacollo | | | 101 | | | | 142 | | | | 46 | | | | 47 | | | | 72 | | | | 9 | |
| Duck Pond | | | 104 | | | | 82 | | | | 35 | | | | 49 | | | | 13 | | | | 6 | |
| Total | | $ | 2,161 | | | $ | 2,156 | | | $ | 2,186 | | | $ | 1,284 | | | $ | 1,146 | | | $ | 1,459 | |
| | | Production | | | Sales | |
| (000’s tonnes) | 2009 | 2008 | 2007 | 2009 | 2008 | 2007 |
| | | | | | | |
| Highland Valley Copper | 118 | 119 | 139 | 118 | 122 | 140 |
| Antamina | 71 | 77 | 74 | 73 | 76 | 74 |
| Quebrada Blanca | 87 | 86 | 30 | 83 | 85 | 32 |
| Andacollo | 18 | 21 | 7 | 17 | 21 | 7 |
| Duck Pond | 14 | 13 | 5 | 14 | 13 | 5 |
| Total | 308 | 316 | 255 | 305 | 317 | 258 |
Teck 2009 Management’s Discussion and Analysis 3
Markets
Copper
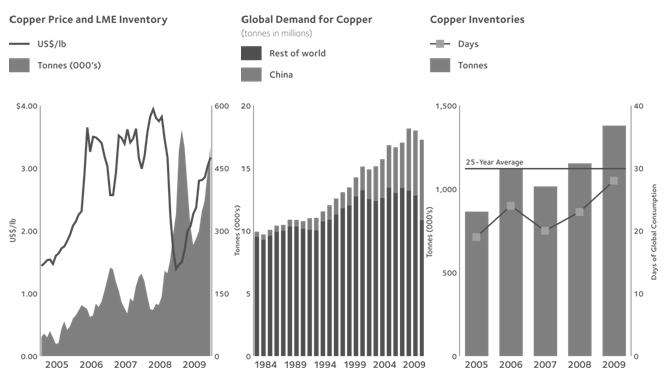
Copper prices recorded their largest yearly increase on record in 2009. London Metal Exchange (LME) copper prices ended 2008 at US$1.32 per pound, a level not seen since 2004, but by December 2009 LME copper prices had increased 153% to end the year at US$3.33 per pound. Copper prices per pound averaged US$2.34 in 2009, down US$0.83 from the 2008 average of US$3.17. Global refined copper consumption fell by 1.3% in 2009. Most of the decline took place in the developed world. In North America, demand was down 9%. In Europe, demand was down 12% in Germany and 9% in France. In China, apparent consumption as reported by the International Copper Study Group (ICSG) was up 42% in 2009. This increase was due in large part to the rapid deployment of stimulus spending and infrastructure spending by the Chinese government as well as the restocking of strategic stockpiles and a certain amount of speculative buying. Chinese imports of copper concentrates rose 18% to 1.8 million tonnes of contained copper in 2009. Chinese imports of scrap copper fell 28% to 1.2 million tonnes of contained copper in 2009 and imports of refined copper increased 129% to 3.1 million tonnes. In 2009, China’s copper smelting capacity increased by 290,000 tonnes, while global capacity outside of China increased by 340,000 tonnes, keeping the global copper concentrate market in a structural deficit. Although a surplus of copper metal occurred in the global marketplace in 2009, a continuation of the mine production disruptions could again push the metal market into deficit in 2010. | | Total mine production including solvent extraction and electrowinning (SX-EW) was little changed over 2008, but was down over 600,000 tonnes from what had been projected at the beginning of the year. Several of the economic production cutbacks made at the beginning of the year were rescinded by the end of the year as prices improved. When combined with an increase in production from Chile, this resulted in flat production globally. Despite record high copper prices over the past four years, copper concentrate production globally has shown little change from where it was in 2005. This lack of growth has been due to pit stability issues, mill failures, weather, labour unrest and lower overall grades at many of the largest copper mines in the world. The copper industry is projecting a 7% increase in global concentrate production in 2010, barring any u nforeseen events. However, even this increase is expected to be insufficient to meet demand from the smelting industry. Copper stocks on the LME rose in the first quarter of 2009 by 60% as producers and consumers tried to monetize surplus inventories. By the end of the first half, those stocks had been removed and shipped to Asia, hence LME stocks in June 2009 were down by 20%. As the differential between the domestic Chinese copper price and the LME price began to decline, stocks started reappearing on the LME so that by the end of December 2009, LME stocks were up 163,000 tonnes to 502,000 tonnes. Copper stocks on the Shanghai Futures Exchange (“SHFE”) were up 77,000 tonnes or over 400% from the beginning of the year, albeit from a very low base of only 18,000 tonnes. At the end of 2009 total global stocks were up 233,000 tonnes compared with the end of 2008. Total global stocks (producer, consumer, merchant and terminal stocks) stood at 28 days of global consumption while 25-year average levels are estimated at 30 days of global consumption. |
Teck 2009 Management’s Discussion and Analysis 4
Molybdenum Molybdenum oxide prices averaged US$11 per pound in 2009, 62% lower than the 2008 price of US$30 per pound. Prices started the year at US$9.60 per pound, and fell to their lowest level since 2004 in April to US$7.90 per pound. Prices made a short recovery in September to just over US$18 per pound on speculation of improving demand and tight supply, however this was short-lived and prices retreated to US$11 per pound where they have remained since October 2009. China’s net imports of molybdenum containing materials, increased to 26,000 tonnes of contained molybdenum in 2009. By comparison, net exports in 2008 were 230,000 tonnes, a net change of over 49,000 tonnes or 108 million pounds of molybdenum that were unavailable to the western world. Due to these price considerations, global mine production in 2009 was cut significantly with several primary and by-product mines curtailing production in the first half of the year. Several of these cutbacks remain in place and will continue into 2010. We are projecting mine production in 2010 will increase between 7% and 9% due to the restart and resumption of full production at a number of by-product mines and primary western mines. However, this will still not bring us back to 2007 production levels. Going forward, major primary projects that had been slated for production in 2011/12 have likely been delayed due to the lower prices and could impact the global balance when market demand returns. Global steel production has improved from the low levels of the first quarter of 2009, when many US mills were running below 40% of capacity. While capacity utilization outside China did improve in 2009, the industry as a whole is still running below levels seen in 2008. Demand for molybdenum from the steel mills should be better in 2010 than in 2009, but may not reach 2007 levels for several years. Operations Highland Valley Copper Mine We have a 97.5% interest in Highland Valley Copper, located in south central British Columbia. Operating profit before depreciation and amortization was $473 million in 2009 compared with $426 million in 2008 and $776 million in 2007. Highland Valley’s 2009 copper production was 118,200 tonnes, which was within 1% of production for 2008. Molybdenum production was higher than 2008 levels at 6.6 million pounds due to higher ore grades. Highland Valley Copper is executing a two-phase mine life extension that requires push backs of the east and west walls of the Valley pit to facilitate mining until 2020. Stripping of the west wall began in mid-2009 after we successfully obtained the required permits. The work will continue through to 2013. Redesign of the east and southeast Valley pit walls was required to address slope stability concerns. This included additional waste stripping in the upper soil layers, further dewatering efforts and the placement of stabilization buttresses to ensure long-term stability. These efforts will be ongoing in 2010 and 2011. To handle this activity more mining equipment has been added to the mine’s fleet. Costs for both the additional east wall stripping and the west wall push back are being capitalized. The redesign of the Valley pit will result in continued low-grade feed to the ore processing circuit in 2010 and 2011. Highland Valley’s production in 2010 is estimated at 105,000 tonnes of copper and 5.8 million pounds of molybdenum. | | Antamina Mine We have a 22.5% interest in the Antamina mine, a large copper and zinc mine at high elevation in Peru. Our partners are BHP Billiton (33.75%), Xstrata plc (33.75%) and Mitsubishi Corporation (10%). In 2009, our share of operating profit before depreciation and amortization was $450 million compared with $368 million in 2008 and $597 million in 2007. Production figures at Antamina reflected a different distribution between available copper ores and copper-zinc ore than in previous years. Consequently, copper production was 316,100 tonnes in 2009, 8% lower than in 2008. This was due to the lower ore tonnage and copper grades available from the pit. By contrast, zinc production increased by 31% to 456,300 tonnes in 2009 as a result of higher ore grades and the processing of greater proportions of copper-zinc ores in the year. Molybdenum production totalled 5.5 million pounds, lower than in 2008, due to lower head grades. Antamina engaged in several major projects during 2009, including further raising of the tailings dam and ore-feed systems allowing direct feed to the ball mills. Antamina completed the study and design of a significant expansion of milling and flotation capacity that was approved in early January 2010. The expansion, with an estimated cost of US$1.3 billion, is expected to increase ore throughput by approximately 38% to 130,000 tonnes per day, and annual production of copper and zinc by approximately 30% on completion in late 2011. Antamina’s production in 2010 is expected to be 305,000 tonnes of copper, 344,000 tonnes of zinc and 7.7 million pounds of molybdenum. Quebrada Blanca Mine Quebrada Blanca is located in northern Chile, 240 kilometres southeast of the city of Iquique, at 4,400 metres elevation. We own 76.5% of Quebrada Blanca. Our partners are Inversiones Mineras S.A. (“IMSA”) 13.5% and Empresa Nacional de Minera (“ENAMI”) 10%. The operation mines ore from an open pit and leaches the ore to produce copper cathodes via a conventional SX-EW process. Operating profit before depreciation and amortization was $265 million in 2009 compared with $267 million in 2008 and $71 million in 2007. Operating results for 2007 reflect that we took ownership in late August that year. Quebrada Blanca’s supergene ore body is expected to be mined out by 2014, but copper cathode production is expected to continue until about 2016. Production from Quebrada Blanca in 2009 was 87,400 tonnes, representing a new production record. Production of 85,000 tonnes of copper cathode is anticipated in 2010. At the start of the third quarter of 2009, scoping study work on the Quebrada Blanca hypogene project was initiated. This phase of the hypogene project encompasses infill drilling to improve the confidence level associated with the resource, enabling us to update our resource model accordingly. Metallurgical test work was also undertaken to confirm the process flow sheet (the process design needed to extract the resource) in a series of trade-off studies to confirm plant location and the estimation of projected capital and operating costs. By the end of 2009 approximately 19,000 metres of infill drilling had been completed. At present, there are five drill rigs on-site continuing with the infill drilling. |
Teck 2009 Management’s Discussion and Analysis 5
Carmen de Andacollo Mine We have a 90% interest in the Carmen de Andacollo mine in Chile, which is located 350 kilometres north of Santiago. The remaining 10% is owned by ENAMI. Operating profit before depreciation and amortization was $47 million in 2009 compared with $72 million in 2008 and $9 million in 2007. Operating results for 2007 reflect that we took ownership in late August that year. Carmen de Andacollo produced 17,900 tonnes of copper cathode in 2009, lower than in 2008 due to the lower ore grades available in the remaining supergene resource. Carmen de Andacollo’s copper cathode production for 2010 is estimated at only 10,000 tonnes as the supergene resource is nearing depletion and is expected to be exhausted in 2011. Development of the mine’s 55,000 tonnes per day copper concentrator project continued throughout 2009, with issues associated with process water supply being resolved in December. Mechanical completion occurred at the end of 2009 with the first ore sent to the crusher on December 6, 2009 and fed to the concentrator grinding circuit on January 19, 2010. Design capacity is expected to be reached during the first half of 2010 and if successful, we expect to produce 55,000 tonnes of copper contained in concentrate in the year. The new plant is expected to produce 80,000 tonnes of copper and 55,000 ounces of gold in concentrate annually over the first 10 years of the operation. The initial project is on track to be completed for the forecasted cost of US$435 million, of which US$423 million had been spent by December 31, 2009. Two additional projects associated with the hypogene project have been approved. The Elqui River water supply project has an estimated cost of US$40 million and will provide a long-term supply of process water for the concentrator. In addition, a cover to minimize the generation of dust will be constructed for the coarse ore stockpile at a cost of US$8 million. In January 2010, Andacollo completed the previously announced sale of an interest in future gold production to Royal Gold, Inc. (“Royal Gold”). Proceeds to Andacollo, on a 100% basis, were US$218 million and 1.2 million common shares of Royal Gold, valued at US$56 million. Royal Gold’s production entitlement is equivalent to 75% of the payable gold produced until total cumulative production reaches 910,000 ounces of gold, and 50% thereafter. | | Duck Pond Mine The Duck Pond copper-zinc mine is located in central Newfoundland and achieved commercial production in April 2007. Duck Pond’s operating profit before depreciation and amortization was $49 million in 2009, compared with $13 million in 2008 and $6 million in 2007. Operating results for 2007 reflect that we took ownership in late August that year. Copper production was 13,900 tonnes while zinc production was 21,000 tonnes. Development of the lower ore zones was completed in 2009, allowing access to new production areas. Duck Pond’s production in 2010 is projected to be 15,000 tonnes of copper and 25,000 tonnes of zinc in concentrate. |
Teck 2009 Management’s Discussion and Analysis 6
Coal
2009 Production: 19 million tonnes
Through October 29, 2008, our coal business included a 52% direct and indirect interest in Teck Coal Partnership (formerly Elk Valley Coal Partnership). We increased our ownership to 100%, effective October 30, 2008, with the purchase of the assets of Fording Canadian Coal Trust.
Teck Coal operates five metallurgical coal mines in British Columbia and one in Alberta. Together, these mines represent the world’s second largest exporter of seaborne hard coking coal, substantially all of which is used in the production of steel.
In 2009, our coal operations accounted for 46% of revenue and 49% of operating profit before depreciation and amortization.
| ($ in millions) | | 2009 | | | 2008 | | | 2007 | |
| | | | | | | | | | |
| Revenues | | $ | 3,507 | | | $ | 2,428 | | | $ | 951 | |
| Operating profit before depreciation and amortization | | $ | 1,795 | | | $ | 1,226 | | | $ | 249 | |
| | | | | | | | | | | | | |
| Production volumes – 100% basis (000’s tonnes) | | | 18,930 | | | | 23,009 | | | | 22,561 | |
| Sales volumes – 100% basis (000’s tonnes) | | | 19,767 | | | | 22,978 | | | | 22,677 | |
Markets
Coal
The extraordinary volatility in the global steel and metallurgical coal industries continued in 2009, with the first half of the year marked by sudden and severe reductions in steel production and commensurate falls in the demand for metallurgical coal. This period of decline was followed by a recovery in the second half of the year. Prior to 2009, China had not been a major importer of seaborne coking coal, but the country began to import significant quantities in 2009. Market expectations are that China will import even greater quantities in 2010. These sales to China represent a significant and increasing share of the total seaborne coking coal market. In addition, most steel producers outside China moderately increased their production levels from the early 2009 lows in response to higher steel prices and the global economic recovery. We have t aken steps to increase our production levels to meet the additional demand created by this market upturn. We now project our coal production in 2010 to be 23.5 to 25 million tonnes and are actively planning for further production increases in 2011 and 2012.
Teck 2009 Management’s Discussion and Analysis 7
Mine and infrastructure capacity constraints continue to limit the global supply of seaborne coking coal. Relatively few new resources of high quality hard coking coal have been developed in recent years. Increasing demand and constrained supply have resulted in a tight market and upward pressure on prices ahead of the next round of negotiations for the 2010 coal year. Current market sentiment suggests that coal prices will increase when compared to the 2009 coal year. We also expect that a portion of our sales volumes in 2010 will be priced on a shorter pricing cycle as opposed to the traditional coal year. A shorter pricing cycle would create more frequent adjustments to coal prices during the year. The near-term outlook for seaborne coking coal is positive and has largely been driven by developments in China. Any substantial disruption in China’s economic growth or an increased supply of hard coking coal from domestic Chinese suppliers could alter the demand and supply dynamics. On the supply side, developments of new resources of high quality hard coking coal and infrastructure improvements in Australia and Mozambique appear to have accelerated in response to the current market. Operations Coal sales volumes of 19.8 million tonnes were down 14% from 2008 due to very weak demand and production cutbacks in early 2009. The markets recovered later in the year, but our sales were then constrained by our clean coal production levels and severe weather. Significant reductions in deliveries to our traditional contract customers were partially mitigated by increased sales to new markets, primarily in China. During the 2009 calendar year, we sold approximately 4 million tonnes of coal to new markets. Customers in Asia accounted for over two-thirds of our 2009 sales volume. Historically, Asia represented about half of our sales volume. Our realized coal price was C$177 (US$157) per tonne in 2009 compared with C$220 (US$205) per tonne in 2008. The lower average US dollar selling price in 2009 primarily reflects the lower contract price settlements for the 2009 coal year that commenced April 1. During 2009, approximately 5 million tonnes were delivered at higher 2008 contract prices. In addition, we agreed to settle the unfulfilled 2008 carryover obligations of several customers in exchange for lump sum cash payments totalling $55 million, recording this as other non-operating income. At year’s end, we had approximately 0.8 million tonnes of carryover remaining from the 2008 coal year. For the 2009 coal year, we reduced annual contract tonnages in response to lower intake by our traditional customers. This allowed us to develop new markets and should result in lower levels of carryover tonnage from the 2009 coal year into the next contract period. | | Operating profit before depreciation and amortization reflects our 100% interest in Teck Coal for all of 2009 compared with only two months at the 100% level in 2008. Operating profit before depreciation and amortization was $1.8 billion in 2009 compared with $1.2 billion in 2008, as our increased ownership interest was partially offset by the lower coal price and reduced sales volumes in 2009. Operating profit also reflects higher unit production costs and lower unit transportation costs. Strip ratios were higher in 2009 and the lower production levels increased our fixed costs per tonne of coal produced. These cost increases were partially mitigated by lower diesel fuel prices. Unit transportation costs decreased due primarily to lower rail rates with Canadian Pacific Railway for the westbound transportation of coal from our five British Columbia minesites as well as lower port loading costs at Westshore Terminals, which were variable in part with average Canadian dollar selling prices. The current westbound arrangements with Canadian Pacific Railway expire in April. Negotiations regarding a replacement contract are underway. In February 2010, we agreed with Westshore Terminals on terms for the shipment of 3 million tonnes of coal per year from our Elkview, Cardinal River and Line Creek mines over the next two years at fixed rates. Under the prior Elkview agreement, which expires on March 31, 2010, port rates varied with the price of coal. The agreement under which Westshore Terminals handles coal for our Fording River, Greenhills and Coal Mountain mines was also amended. Commencing April 1, 2011 to the end of the term of the new contract on February 29, 2012, none of our port charges will be linked to the price of coal. In addition to our ongoing use of the Westshore Terminals facility, we expect to ship additional coal through Neptune Terminals, in which we hold a 46% interest. |
Teck 2009 Management’s Discussion and Analysis 8
Zinc
| 2009 Production: | 711,000 tonnes of zinc in concentrate 240,000 tonnes of refined zinc |
Our zinc business unit includes our Trail refining and smelting complex and the Red Dog mine. Our Lennard Shelf mine in Western Australia was permanently closed in August 2008, and Pend Oreille was placed on care and maintenance in February 2009.
In 2009, our zinc operations accounted for 26% of revenue and 16% of operating profit before depreciation and amortization.
| | | Revenues | Operating Profit (Loss) Before
Depreciation and Amortization |
| ($ in millions) | | 2009 | | | 2008 | | | 2007 | | | 2009 | | | 2008 | | | 2007 | |
| | | | | | | | | | | | | | | | | | | |
| Trail | | $ | 1,190 | | | $ | 1,442 | | | $ | 1,839 | | | $ | 122 | | | $ | 208 | | | $ | 396 | |
| Red Dog | | | 986 | | | | 703 | | | | 1,434 | | | | 473 | | | | 240 | | | | 885 | |
| Other | | | 50 | | | | 117 | | | | 166 | | | | 7 | | | | (26 | ) | | | 31 | |
| Inter-Division Sales | | | (220 | ) | | | (191 | ) | | | (387 | ) | | | (19 | ) | | | 17 | | | | 16 | |
| Total | | $ | 2,006 | | | $ | 2,071 | | | $ | 3,052 | | | $ | 583 | | | $ | 439 | | | $ | 1,328 | |
| | Production | Sales |
| (000’s tonnes) | 2009 | 2008 | 2007 | 2009 | 2008 | 2007 |
| | | | | | | |
| Refined zinc | | | | | | |
| Trail | 240 | 270 | 292 | 243 | 266 | 292 |
| | | | | | | |
| Contained in concentrate | | | | | | |
| Red Dog | 583 | 515 | 575 | 556 | 529 | 576 |
| Pend Oreille and | | | | | | |
| Lennard Shelf | 5 | 51 | 50 | 5 | 53 | 47 |
| Other business units | 123 | 97 | 74 | 120 | 96 | 73 |
| Total | 711 | 663 | 699 | 681 | 678 | 696 |
Teck 2009 Management’s Discussion and Analysis 9
Markets Zinc Global zinc consumption is estimated to have declined by more than 5% in 2009. In late 2008 as the economic crisis took hold, most consumers stopped purchasing metal and instead started to destock their own inventories. Faced with reduced demand, refined metal producers curtailed production and closed their operations rather than build up inventories. By the end of 2009 global demand started to pick up as the global economic crisis faded, destocking came to an end and in some countries government stimulus packages started to buoy demand from low levels. Refined production cutbacks already in place came to an end and producers started producing at normal levels again. In 2009, London Metal Exchange stocks rose by 235,000 tonnes or 92% to 488,000 tonnes. We estimate that total reported refined inventories (LME, SHFE, Producer, Consumer and Merchant) at the end of 2009 were 1,115,000 tonnes or 38 days of global consumption, just below the 25-year average of 39 days of global consumption. Prices started the year at US$0.55 per pound and rose throughout the year to finish the year at US$1.17 per pound. In 2009, the average price was US$0.75 per pound, down from the 2008 average of US$0.85 per pound. In 2009 China imported 61% more zinc concentrates than in 2008. This was a result of continuing growth in refined production and capacity, while domestic mine production was reported to have declined from 2008 levels. China was a net importer of 640,000 tonnes of refined zinc in 2009, compared to 112,000 tonnes in 2008. | | The zinc concentrate market in 2009 was a balanced market. As the price of zinc rose steadily throughout 2009, some mines restarted production. According to the International Lead and Zinc Study Group (ILZSG), global mine production fell over 300,000 tonnes of contained zinc in 2009 versus 2008. In 2010, we believe that global zinc metal demand will grow at above trend growth as a restocking of inventories will occur. This restocking will add to growth from positive industrial production forecasts. We also believe the global zinc concentrate market will move into a structural deficit as smelters return to full production rates and smelting capacity grows at a greater rate than mine production. In spite of the cuts in metal production from planned levels, mine production and ultimately refined production should increase at a greater rate than refined demand so we believe the global refined market will be well supplied in 2010. Historically, surpluses in metal have resulted in high exchange stocks and have put downward pressure on prices. However, since March 2009 the price of zinc more than doubled by the end of the year at a time when LME stocks increased by 42%. Prices have been moving up buoyed by the renewed interest of investment funds in commodities as an asset class and weakness in the US dollar. |

Teck 2009 Management’s Discussion and Analysis 10
Lead The global market for refined lead was in surplus in 2009 after four consecutive years of deficit and one balanced year. The LME cash price started 2009 at US$0.47 per pound and finished the year at US$1.09 per pound. The price averaged US$0.78 per pound in 2009, down from the 2008 average of US$0.95 per pound. LME stocks rose 101,000 tonnes in 2009 and finished the year at 146,500 tonnes. As a result of the global economic crisis, global refined lead consumption fell for the first year since 2001, down by 1% from the 2008 level. The recession prompted the largest contraction in lead demand since a 5.4% year-on-year fall in 1980 as a result of the US-led recession that started that year. In 2009, lead demand contracted in all the major regions and economies, with the notable exception being China. We believe growth in refined lead consumption will rebound in 2010. Supply will grow at a greater rate due to increased secondary production of batteries, which is lead’s number one end use. We expect a modest surplus of refined lead in 2010. Reported refined lead stocks (LME, Producer, Consumer & Merchant) at the end of 2009 stood at 375,000 tonnes which represented 16 days of global consumption, well below the 25-year average of 26 days. These low stocks do not provide a significant cushion for higher than expected demand growth. | | |

Teck 2009 Management’s Discussion and Analysis 11
Operations Trail Metallurgical Operations Our Trail Operations, located in British Columbia, include one of the world’s largest fully integrated zinc and lead smelting and refining complexes and the Waneta hydroelectric dam and transmission system. The metallurgical operations produce refined zinc and lead and a variety of precious and specialty metals, chemicals and fertilizer products. The Waneta Dam provides power to the metallurgical operations. Historically, power that was surplus to our requirements has been sold through the transmission system to customers in British Columbia and the United States. In 2009 we entered into an agreement to sell a one-third interest in the Waneta Dam, representing substantially all of our previous surplus power generation, to BC Hydro for $825 million. Trail metal operations contributed $82 million to operating profits before depreciation and amortization in 2009 compared with $146 million in 2008, with the reduction due primarily to lower prices for zinc, lead, specialty metals and sulphur products and lower sales volumes that reflected the downturn in the economy. Refined zinc production totalled 240,000 tonnes in 2009 compared with 270,000 tonnes the previous year. Trail Operations curtailed zinc production from a monthly capacity of 25,000 tonnes to approximately 20,000 tonnes during the first eight months of the year in response to decreased customer demand. As demand for product increased in the third and fourth quarters, we returned to full zinc production capacity, but were constrained by some operational issues in the zinc electrolytic plant. These issues are being resolved at the time of writing. Refined lead production of 72,600 tonnes was 12,400 tonnes less than that of 2008. Operational issues in the drossing plant, where the lead is purified, continued into 2009 and culminated in maintenance work being moved into the fourth quarter of 2009. This necessitated a 20-day shutdown of the lead smelter to complete repairs. By the end of 2009, the lead smelter had returned to full production. In 2010, we expect to produce 290,000 tonnes of zinc, 80,000 tonnes of lead and 21 million ounces of silver. The Waneta Dam is one of several hydroelectric generating plants in the region operated through contractual arrangements under which we currently receive approximately 2,800 gigawatt hours of energy entitlement per year, regardless of the water flow available for power generation. Lower average power sales prices and an increasing Canadian/US dollar exchange rate reduced operating profit from surplus power sales before depreciation and amortization to $40 million in 2009, down $22 million from the previous year. Surplus power sales volumes were slightly higher than the previous year as a result of the zinc production curtailment. In June 2009, we agreed to sell a one-third interest in the Waneta Dam to BC Hydro for $825 million, with provision for firm supply of power until January 1, 2036. This transaction closed on March 5, 2010. Capital expenditures for the year totalled $25 million, related to projects required to sustain operations, with each totalling less than $3 million. | | Our electronic waste recycling program reached a milestone in October, having processed 25,000 tonnes of material since the program began in 2006. Our goal is to treat 11,500 tonnes in 2010 as a result of an expansion in the types of electronic waste that will be accepted at collection sites effective this July. In conjunction with the British Columbia Ministry of Environment, we are also conducting tests related to the recycling of zinc alkaline batteries and fluorescent bulbs. Red Dog Mine Red Dog’s location in northwest Alaska exposes the operation to severe weather and winter ice conditions, which can significantly impact production, sales volumes and operating costs. In addition, the mine’s bulk supply deliveries and all concentrate shipments occur during a short ocean shipping window that normally runs from early July to late October. This short ocean shipping window means that Red Dog’s sales volumes are normally higher in the last six months of the year, resulting in significant volatility in its quarterly earnings, depending on metal prices. In 2009, both zinc and lead production were higher than in 2008 due to increased mill operating rates and online time resulting from a number of site-driven performance improvement initiatives. A new annual production record was set for metal in concentrate in 2009, breaking the prior record set in 2007. Red Dog’s 2009 shipping season began on June 30 and was completed on October 18. Final tonnages shipped for 2009 were 1,020,000 tonnes of zinc concentrate and 220,000 tonnes of lead concentrate. Metal available for sale from January 1, 2010 to the beginning of next year’s shipping season is 227,000 tonnes of contained zinc in concentrate and 3,000 tonnes of contained lead in concentrate. In accordance with the operating agreement governing the Red Dog mine, the royalty to NANA Regional Corporation Inc. (“NANA”), our Regional Alaskan Native Corporation partner, is at 25% of net proceeds of production. The NANA royalty charge in 2009 was US$128 million compared with US$92 million in 2008. The net proceeds royalty will increase by 5% every fifth year to a maximum of 50%. The increase to 30% of net proceeds of production will occur in 2012. NANA has advised us that it ultimately shares approximately 62% of the royalty with other Regional Alaskan Native Corporations pursuant to section 7(i) of the Alaskan Native Claims Settlement Act. Red Dog’s operating profit before depreciation and amortization was $473 million compared with $240 million in 2008. The higher 2009 operating profit was mainly due to higher metal prices, lower fuel costs and higher production levels achieved as a result of a number of site-wide performance improvement initiatives. Major capital projects in 2009 included US$15 million for tailings dams and US$14 million on other sustaining capital projects. The dewatering of our five-hole shallow shale-gas exploration wells was completed at year end. Additional drilling and capital expenditure decisions are pending completion of the reservoir calculations by a third-party engineering firm. The results of this analysis are anticipated in the second quarter of 2010. We expect 2010 production to be approximately 550,000 tonnes of zinc in concentrate and 95,000 tonnes of lead contained in concentrate. 2010 production is forecast to be lower than 2009 due to the lower ore grades expected in the bottom of the main pit. |
Teck 2009 Management’s Discussion and Analysis 12
Aqqaluk Permitting On receipt of Supplemental Environmental Impact Statement (“SEIS”) and new National Pollutant Discharge Elimination System (NPDES) and other required permits, we expect to start pre-stripping of the Aqqaluk deposit in 2010. It is anticipated that the Aqqaluk deposit will be the main ore supply for the next 20 years, from 2011 onwards. On December 15, 2009, the State of Alaska issued a certification of the NPDES Permit to be issued by the US Environmental Protection Agency (“EPA”) under Section 401 of the US Clean Water Act. On January 15, 2010, local tribal and environmental groups filed an appeal of the certification asserting that certain provisions do not comply with the Clean Water Act. If successful, the appeal could result in revisions to the NPDES Permit. The certification will remain in effect pending resolution of the appeal and will not affect the development of the Aqqaluk deposit. On January 8, 2010, the EPA approved the Aqqaluk SEIS and, simultaneously, issued the new NPDES Permit. On February 16, 2010, the same groups that appealed the 401 Certification filed a petition for review of the NPDES Permit. On February 26, 2010, the EPA notified us that, as a result of the appeal, the conditions of the new permit governing effluent limitations for lead, selenium, zinc, cyanide and total dissolved solids (TDS) are stayed pending a resolution of the appeal by the Environmental Appeal Board. Until then, the corresponding provisions of our existing permit will remain in effect. The existing permit contains an effluent limitation for TDS that the mine cannot meet. We will be discussing that issue with EPA and awaiting the issuance of a wetlands permit before proceeding with a decision on the development of Aqqaluk. Other State and local permits required for the development of Aqqaluk were received in December. The appeal period for those permits has expired. The wetlands permit from the Army Corps of Engineers is the only outstanding agency authorization and is undergoing final agency review. There is no specific period established for an appeal of this permit. An appeal of the SEIS or wetlands permit could also delay access to the Aqqaluk deposit. Our current operating plan is to continue to mine the main pit until mid-2011, but to maintain efficient production rates, this ore will eventually need to be supplemented with ore from Aqqaluk. Permit appeals that delay access to Aqqaluk could affect our transition plan and production at Red Dog could be curtailed in October, 2010. We and our partner, NANA, have been working with the public agencies involved and have held discussions with some of the appellants. While we believe that the regulatory process has been appropriate and robust and will be sustained on appeal, there can be no assurance that appeals will not delay the development of Aqqaluk. We are developing contingency plans to minimize the potential disruption to the operation from an appeal. | | Other Zinc Operations Our Pend Oreille mine, located in northeastern Washington State, produced zinc and lead concentrates that were delivered to our Trail smelter 80 kilometres to the northwest, in British Columbia. The mine was shut down and placed on care and maintenance in February 2009 due to reduced metal demand and weak zinc prices. A core group of employees are working to keep the site ready in anticipation of a restart in the future. All regulatory and environmental requirements are being met. The mine produced 4,800 tonnes of zinc and 900 tonnes of lead in 2009 before it was placed on care and maintenance compared with 35,000 tonnes of zinc and 5,700 tonnes of lead in 2008. |
Teck 2009 Management’s Discussion and Analysis 13
Energy Our energy business unit has recoverable contingent bitumen resources of approximately 1.6 billion barrels, which includes our 20% interest in the Fort Hills oil sands project and our 50% interest in the Frontier and Equinox oil sands projects that we jointly own with UTS Energy Corporation (“UTS”). We also have a 50% interest in various other oil sands leases, including the Lease 421 Area, which are in the exploration phase. All of these properties are located in the Athabasca region of northeastern Alberta, Canada. The disclosure below includes references to contingent bitumen resource estimates. Further information on these estimates, and the risks and uncertainties relating thereto, is set out in our most recent Annual Information Form filed on SEDAR and under cover of Form 40F on EDGAR. There is no certainty that it will be commerc ially viable to produce any portion of the contingent resources. Our oil sands projects are expected to be long-life assets, located in a politically stable jurisdiction with limited exploration risk, employing conventional technologies that build upon our core skills of developing large-scale truck and shovel mining operations. Fort Hills Oil Sands Project The Fort Hills oil sands project is located approximately 90 kilometres north of Fort McMurray in Northern Alberta. We hold a 20% interest in the Fort Hills Energy Limited Partnership (the “Fort Hills Partnership”), which owns the Fort Hills oil sands project with 20% being held by UTS and the remaining 60% held by the operator of the project, Suncor Energy Inc. (“Suncor”), which became operator and a partner by way of a merger with Petro-Canada in August 2009. At December 31, 2009, our best estimate of our 20% share of the recoverable bitumen at Fort Hills is 678 million barrels. To the end of 2009, approximately $2.9 billion has been spent on the Fort Hills project. Our share was $901 million, of which $271 million was spent in 2009. In connection with our ownership interest, our future commitment is to fund 27.5% of the next $4.6 billion of project spending and our 20% pro rata share thereafter. During 2009 the Fort Hills project: •reached an agreement with the Government of Alberta to extend the term of its oil sand leases until July 31, 2019, in exchange for a commitment to upgrade the bitumen produced from the second phase of the Fort Hills oil sands project in Alberta. If the project is not producing bitumen by 2019, it is possible that the Fort Hills leases could be forfeited to the government, and •received conditional approval from the Energy Resources Conservation Board (“ERCB”) for most aspects of proposed amendments to the mine, which include revisions to its footprint to enable construction to proceed for the first phase of the mine and extraction portion of the project. The ERCB requested a revised assessment of the cumulative effects and mine plan by December 31, 2010 to facilitate the request to increase the total recoverable resource. The timing of a final investment decision on the Fort Hills oil sands project depends both on improvements in commodity prices and financial markets and on the results of a project review currently being undertaken by Suncor. Spending on the project has been significantly reduced and the workforce downsized to allow the project review to be completed. Suncor has provided a forecast project spending estimate of $33 million for 2010, of which our share would be $9 million, including our earn-in commitments, compared with our $271 million share in 2009, assuming the planned regulatory work is completed during 2010. | | Recent economic conditions and the project review being undertaken by Suncor have increased the uncertainty around the probability of realizing future benefits from certain costs incurred to advance the mine and bitumen production facilities and the engineering of the upgrading portions of the project. Accordingly, asset impairment charges have been recorded against various project related costs, materials and contracts, including related contract cancellation charges. In 2009, we recorded an equity loss of $119 million from our Fort Hills oil sands investment as a result of the deferral of the upgrader portion and the delay of the mine and bitumen production portion of the project. Teck/UTS Joint Venture We have jointly acquired, with UTS, oil sands leases located near the Fort Hills project totalling approximately 124,000 hectares. To date, we have spent $348 million for our 50% share of the acquisition, exploration and engineering costs of these leases of which $59 million was spent in 2009. We expect to spend approximately $25 million for our share of studies and exploration drilling planned for 2010. Frontier and Equinox Projects The Equinox oil sands project is located immediately west of the Fort Hills project and the Frontier oil sands project, which includes Lease 311, is approximately 10 kilometres north of the Equinox project. The Equinox oil sands project consists of approximately 2,890 hectares of oil sands lease and our best estimate is that our 50% interest represents 166 million barrels of recoverable bitumen. The Frontier oil sands project consists of approximately 26,112 hectares of oil sands leases and our best estimate is that our 50% interest in the Frontier project represents approximately 725 million barrels of recoverable bitumen. In February 2009, we received the final terms of reference for the Environmental Impact Assessment for both the Frontier and Equinox projects. This establishes the terms to complete the Environmental Impact Assessment for submission to Alberta Environment. Pilot plant testing on ore recovered from Frontier and Equinox leases was conducted during 2009. The operational phase of the pilot plant test work, to support the design assumptions used for both projects, was completed during the third quarter and data analysis is expected to be finalized in 2010. Engineering studies have started on the Frontier Project, which will include an option of developing Equinox as a satellite operation. Various development options for a stand-alone mine/extraction operation of up to 240,000 barrels of bitumen per day from Frontier and either an additional 30,000 to 50,000 barrels of bitumen per day from Equinox or using Equinox bitumen to extend the life of the Frontier project will be considered. The results of this work are expected in by early 2011 and will be compared to the draft Design Basis Memorandum study for Equinox as a stand-alone project. The joint venture continues to advance the projects through the regulatory permitting process and has ongoing consultations with stakeholders including project update meetings with key stakeholder groups. A field exploration program on the Frontier project consisting of approximately 80 core holes is planned for the winter of 2010. We expect to spend approximately $22 million for our share of the exploration, engineering, regulatory and stakeholder activities for Frontier and Equinox projects during 2010. |
Teck 2009 Management’s Discussion and Analysis 14
Exploration – Lease 421 Area During the 2009 winter exploration season we drilled 54 core holes in the Lease 421 Area (oil sands leases 421, 022 and 023, in which we have a 50% interest), bringing the total core holes completed to 59. Analytical testing was completed during the fourth quarter. The results indicate 49 of the core holes contain prospective oil sands that range in thickness from 10 to 40 metres (averaging 19 metres) with oil sands grades ranging from 9 to 18% by weight and overburden thicknesses ranging from 10 to 68 metres (averaging 39 metres). These results indicate the potential for a mineable resource, however further core hole drilling will be required to establish the quantity and quality of any potential resources. We currently have no exploration work planned during 2010 on these leases. Regulatory Developments In January of 2008, the Government of Alberta announced a plan to reduce carbon emissions intensity to 50% below 1990 levels by 2020. Major emitters (those over 100,000 tonnes per year) are required to reduce their emissions intensity by 12% as compared to their established baseline. For new construction projects, the plan is applicable three years after start-up. In early 2010, the Canadian Federal Government announced new national targets for greenhouse gas emission reductions as part of the Copenhagen Accord. However, details of how these new targets would be achieved and how they might apply to individual facilities, companies, and industries has not yet been announced. Previously, in June 2009, details of the proposed federal offset system for greenhouse gas emissions were published. We will continue to review the effect of these regulatory developments on our oil sands projects. Gold During 2009, we sold our 50% interest in the Hemlo mines, our 40% interest in the Pogo mine, our 60% interest in the Lobo-Marte project in Chile, and our 78.8% interest in the Morelos project in Mexico. In January 2010 we closed the sale of the Agi Dagi and Kirazli projects in Turkey and a royalty on the future gold production from our Andacollo copper mine in Chile. We received consideration totalling $940 million in cash and equity securities in the various purchasers valued at $103 million on closing of the transactions. These sales resulted in gains totalling $479 million ($382 million after-tax) of which $429 million (pre-tax) was recorded in 2009. The cash proceeds, net of taxes and costs were used to repay the debt we incurred to finance our acquisition of the coal assets from Fording in late 2008. The gains on these sales and the results of operations from the Hemlo and Pogo mines prior to the closings of the sales are included in our earnings from discontinued operations. We remain committed to the gold business, but are not necessarily committed to being a producer. Our strategy will be to find and identify gold resources and then add value through further definition drilling and engineering studies. We will then sell those resources at a point in the development cycle where we believe we can maximize the return on our investment, which may be well before a production decision. | | |
Teck 2009 Management’s Discussion and Analysis 15
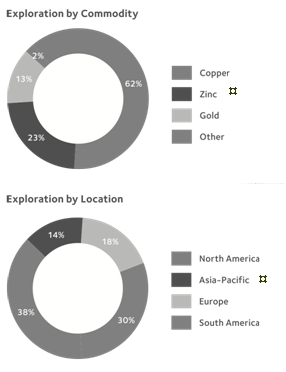
Corporate Our corporate business unit includes all of our activities in other commodities, our corporate development and growth initiatives, and groups that provide administrative, technical, financial and other support to all of our business units. Development Projects Galore Creek In August 2007, we formed a 50/50 partnership with NovaGold Resources Inc. to develop the Galore Creek copper-gold deposit in northwest British Columbia. After suspending construction activities in November 2007 due to escalating cost estimates and reduced operating margins, studies were initiated in 2008 aimed at re-evaluating and optimizing the project by defining a more realistic and lower risk development alternative, including alternative plant site and tailings locations. Further engineering and evaluation work is expected in 2010. In February 2009, we amended certain provisions of the partnership agreement relating to the Galore Creek project. Under the amended agreement, our remaining committed funding on Galore Creek has been reduced to approximately $36 million, which must be contributed by December 31, 2012. To December 31, 2009, we have spent $11 million of the $36 million commitment. While we are making these committed contributions, which will represent 100% of project funding, we will have a casting vote on the Galore Creek management committee with respect to the timing and nature of expenses to be funded. The Galore Creek project remained on care and maintenance during 2009. While the project site will remain on care and maintenance for 2010, we plan to begin the preparation of a pre-feasibility study so that updated capital and operating cost estimates can be prepared for the project. Relincho Project The Relincho copper project, located in central Chile, was acquired from Global Copper Corp. in August 2008. A total of 49,000 metres of infill drilling was completed on the property in 2008. There was no drilling and only minimal site activity on the Relincho project in 2009. Further mine engineering optimization studies were started in late 2009 based on a revised block model that included 2008 drilling. This work is being done to analyze various cut-off grades, throughput rates and stockpiling strategies. The next phase of work will be a pre-feasibility study that is currently planned to commence in the second quarter of 2010. Mesaba Project A variety of work was carried out on the Mesaba copper-nickel project in northern Minnesota in 2008. A total of 13,900 metres of resource definition drilling was completed in 2008. Drilling was also carried out to provide material for a bulk sample. In 2009, this sample was treated at a research facility in Minnesota to produce nine tonnes of copper-nickel concentrate, which was delivered to our CESL test facility in Richmond, British Columbia. This sample is being processed through the hydrometallurgical pilot plant at CESL to assess the feasibility of treatment for the production of copper and nickel. Carrapateena Project A preliminary scoping study was carried out to assess the potential development of an underground copper-gold mine at the Carrapateena property in South Australia in 2008. No exploration work was undertaken on the project in 2009. We have the right to acquire 100% of the project by making a payment to the vendor equal to 66% of its fair market value with credit for our expenditures on the project to date. We are reviewing with the vendor strategic alternatives in connection with the project. | | Exploration Exploration expenditures were $33 million in 2009 compared with $133 million in 2008. We closed seven exploration offices in early 2009 and reduced our exploration staff by approximately 250 positions. Copper, zinc and gold were our main commodities of interest. We decided not to continue with exploration for diamonds, nickel, and seafloor massive sulphides in 2009. Copper Copper exploration was focused in Chile, Peru, Mexico, Turkey and Canada. Several new porphyry copper targets were defined in the Pelambres North project in central Chile. Outcropping copper mineralization and extensive geophysical and geochemical targets will be drilled in 2010. Encouraging drill results were returned from the 60% owned Halilaga copper/gold project in Turkey. Drilling programs are planned for 2010 on copper projects in Chile, Mexico, Turkey, and Namibia. During the year we optioned out several 100% owned copper projects located in Chile, Peru, Brazil, Namibia, and Mexico. All are expected to be drilled by other parties in 2010 and we retain back-in rights to majority interests in all of the projects. Zinc Zinc exploration was primarily focused in Alaska, Ireland, and Australia. Additional surface surveys were undertaken on the 100% owned Noatak project in the Red Dog district in Alaska where drilling is planned for 2010. Drilling was undertaken on zinc projects in Ireland and Australia, both of which returned multiple drill holes with sulphide mineralization warranting additional drilling in 2010. We entered into an agreement with Nonfemet, a Chinese mining and smelting entity, which will solely fund the next phases of drilling to earn a 40% interest in our 100% owned Ballinalack project in Ireland. The partners are planning a 30,000 metre drill program in 2010. Gold Gold exploration was primarily focused in western Turkey. We undertook drilling on our 100% owned Demir property in the fourth quarter and test results from this work are currently pending. We elected to farm out several of our gold projects in Australia, Mexico, Canada and South America. We expect to be significantly more active in the gold sector in 2010. |
Teck 2009 Management’s Discussion and Analysis 16
Technology Our Technology Group works closely with our business units to create value through the development and application of innovative technologies. Three separate centres provide expertise in process development for internal and external growth opportunities, technical improvement and environmental treatment for operations, and product development to support metal sales. CESL Limited (“CESL”) oversees the development of our proprietary hydrometallurgical technology, which offers an environmentally superior method for treating copper, copper-gold, nickel-copper, and nickel concentrates, especially those with complex challenges related to mineralogy and deleterious elements that inhibit conventional production and sale of concentrates. Our Applied Research and Technology (“ART”) group works with our business units to characterize ore bodies, develop and test processing options, evaluate and implement technologies to improve performance and decrease unit costs, and to design and test innovative solutions to potential environmental impacts. Our Product Technology Centre (“PTC”) supports metal sales for the Zinc Business Unit by working with zinc customers to develop new alloys and bath management technologies for continuous and general galvanizing. PTC’s battery technology group develops and sells new technologies to improve the use and efficiency of lead acid batteries. PTC also works with the Trail operation to understand emerging technical uses and markets for specialty metals produced at Trail. The Technology Group also works with all of our business units to evaluate and implement technologies, and with external companies, contractors and researchers to develop and assess new technologies. We support external research and development through industry associations, companies and universities. In many cases, our funds are levered through collaboration with other companies and government programs. We are active participants in university-based educational programs, research groups, industry-government initiatives, and industry-university advisory committees. We use contacts with these groups to identify prospective employees and to develop training programs for our technical employees. In addition to seeking growth and continuous improvement, we work to foster sustainability through more efficient processes, better control of waste products , and the long-term stewardship of metals. | | | |
Teck 2009 Management’s Discussion and Analysis 17
Financial Overview
Financial Summary
| | | 2009 | | | 2008 | | | 2007 | |
| | | | | | | | | | |
| Revenue and earnings | | | | | | | | | |
| Revenues | | $ | 7,674 | | | $ | 6,655 | | | $ | 6,189 | |
| Operating profit before depreciation and amortization | | $ | 3,662 | | | $ | 2,811 | | | $ | 3,036 | |
| EBITDA | | $ | 4,109 | | | $ | 1,961 | | | $ | 2,799 | |
| Net earnings from continuing operations | | $ | 1,750 | | | $ | 668 | | | $ | 1,681 | |
| Net earnings | | $ | 1,831 | | | $ | 659 | | | $ | 1,615 | |
| Cash flow | | | | | | | | | | | | |
| Cash flow from operations | | $ | 2,983 | | | $ | 2,109 | | | $ | 1,742 | |
| Capital expenditures | | $ | 590 | | | $ | 928 | | | $ | 555 | |
| Investments | | $ | 372 | | | $ | 12,298 | | | $ | 3,911 | |
| Balance sheet | | | | | | | | | | | | |
| Cash balances, including restricted cash | | $ | 1,420 | | | $ | 850 | | | $ | 1,408 | |
| Total assets | | $ | 29,873 | | | $ | 31,533 | | | $ | 13,573 | |
| Debt, including current portion | | $ | 8,004 | | | $ | 12,874 | | | $ | 1,523 | |
| Per share amounts | | | | | | | | | | | | |
| Net earnings from continuing operations | | | | | | | | | | | | |
| Basic | | $ | 3.28 | | | $ | 1.48 | | | $ | 3.89 | |
| Diluted | | $ | 3.27 | | | $ | 1.47 | | | $ | 3.87 | |
| Net earnings | | | | | | | | | | | | |
| Basic | | $ | 3.43 | | | $ | 1.46 | | | $ | 3.74 | |
| Diluted | | $ | 3.42 | | | $ | 1.45 | | | $ | 3.72 | |
| Dividends declared per share | | $ | – | | | $ | 0.50 | | | $ | 1.00 | |
Our revenues and earnings depend on prices for the commodities we produce, sell and use in our production processes. Commodity prices are determined by the supply of and demand for raw materials, which are influenced by global economic growth. We normally sell the products that we produce at prevailing market prices or at prices negotiated on annual contracts, particularly metallurgical coal. Prices for these products, particularly for exchange-traded commodities, can fluctuate widely and that volatility can have a material effect on our financial results. We record our financial results using the Canadian dollar and accordingly, our operating results and cash flows are affected by changes in the Canadian dollar exchange rate relative to the currencies of other countries. Exchange rate movements, particularly as they affect the US dollar, can have a significant impact on our results as a significant portion of our operating costs are incurred in Canadian and other currencies and most of our debt and revenues are denominated in US dollars. Our net earnings for 2009 were $1.831 billion, which included $881 million of after-tax foreign exchange gains and gains on the sale of assets, or $3.43 per share compared with $659 million or $1.46 per share in 2008, which included $856 million of after-tax asset impairment losses. Net earnings were $1.6 billion or $3.74 per share in 2007. Our earnings were higher in 2009 due to increased operating profits from each of our business units, significant foreign exchange gains on our debt and asset sale gains. Our coal business unit benefitted from our acquisition of Fording’s 60% interest in Teck Coal in October, 2008. This was partially offset by significantly lower coal prices in 2009 and significantly higher interest expense on the debt incurred to acquire Fording’s coal assets. Our copper and zinc business units contributed higher earnings in the year due mainly to significant positive pricing adjustments, which offset the lower average base metal prices. In 2009, we had positive after-tax final price adjustments of $207 million as a result of the improved global economy and rising metal prices. In 2008, we incurred negative after-tax final price adjustments of $329 mill ion as a result of the rapid deterioration of the global markets and subsequent sharp decline in metal prices that occurred in the latter part of the year. | | Our earnings in 2009 included $561 million of after-tax non-cash foreign exchange gains on our net debt and $320 million of after-tax gains on the sale of various assets that were undertaken as part of our debt reduction plan. Partially offsetting these favourable items were $117 million of unamortized discounts and issues costs related to our Fording acquisition debt that we wrote off as we repaid and refinanced that debt and $139 million of impairment losses related to our oil sands assets, the majority of which relates to the delay of the mine and bitumen production portion of the Fort Hills project. Our earnings in 2008 were negatively affected by non-cash after-tax asset and goodwill impairment charges totalling $856 million taken against (i) the goodwill related to the three copper mines we acquired from Aur in 2007 ($345 million), (ii) the deferral of the upgrader portion of our Fort Hills oil sands project ($90 million) (iii) our Lennard Shelf, Pend Oreille and Duck Pond mines ($116 million), (iv) our Petaquilla copper project in Panama, Santa Fe nickel project in Brazil and other exploration properties ($60 million) and (v) $245 million in respect of marketable securities that we own in various development stage companies, whose decline in value was considered other-than-temporary. |
Teck 2009 Management’s Discussion and Analysis 18
Our earnings in 2007 were affected by a $33 million equity loss ($50 million pre-tax) related to our investment in the Galore Creek project where mine construction was suspended due to escalating capital costs and by a number of asset write-downs totalling $51 million after taxes. The equity loss represented our after-tax share of the Galore Creek partnership’s estimated demobilization costs. The asset write-downs related to our investment in Tahera Diamond Corporation, which was due to the severe financial difficulties it faced. Due to difficult mining conditions and low ore grades that impacted their ongoing profitability, we also wrote down the property, plant and equipment at our Pend Oreille and Lennard Shelf zinc mines. We also had a $59 million cumulative foreign exchange loss related to the repatriation of US dollars to Canada to provide funds for our acquisition of Aur. We also had a $46 million loss on our contingent receivable related to the sale of our Cajamarquilla refinery compared with a $36 million gain in 2006.
The table below shows the impact of these items on our earnings.
| | | 2009 | | | 2008 | | | 2007 | |
| | | | | | | | | | |
| Net earnings as reported | | $ | 1,831 | | | $ | 659 | | | $ | 1,615 | |
| Add (deduct) the after-tax effect of: | | | | | | | | | | | | |
| (Earnings) loss from discontinued operations | | | (81 | ) | | | 9 | | | | 66 | |
| Derivative (gains) losses | | | 36 | | | | (202 | ) | | | 32 | |
| Asset impairment and equity losses | | | 119 | | | | 266 | | | | 84 | |
| Impairment of goodwill and marketable securities | | | 20 | | | | 590 | | | | – | |
| Asset sales and other | | | (320 | ) | | | 73 | | | | (36 | ) |
| Foreign exchange gains on net debt | | | (561 | ) | | | – | | | | – | |
| Realization of cumulative translation adjustment loss | | | – | | | | – | | | | 59 | |
| Financing items | | | 117 | | | | – | | | | – | |
| Tax items | | | (30 | ) | | | (50 | ) | | | (80 | ) |
| | | | (700 | ) | | | 686 | | | | 125 | |
| Adjusted net earnings* | | | 1,131 | | | | 1,345 | | | | 1,740 | |
| Negative (positive) pricing adjustments | | | (207 | ) | | | 329 | | | | 66 | |
Comparative net earnings* | | $ | 924 | | | $ | 1,674 | | | $ | 1,806 | |
*Adjusted net earnings and comparative net earnings are non-GAAP financial measures. See Use of Non-GAAP Financial Measures section for further information.
Pricing adjustments generally increase earnings in a rising commodity price environment and decrease earnings in a declining price environment. They are a normal part of our business but we exclude them from comparative earnings in the table above to provide a better understanding of how our company performed. In the latter part of 2008 general conditions in credit markets deteriorated substantially, which had a serious impact on the global economy and contributed to a significant and rapid decline in the demand for and selling price of our products. Average base metal prices were down significantly in the fourth quarter of 2008, with two of our major products, copper and zinc, dropping significantly from prices at the end of September 2008, resulting in negative pricing adjustments of $474 million ($270 million after tax) in the fourth quarter alone. Economic conditions improved in 2009 contributing to a significant improvement in base metal prices, which resulted in positive pricing adjustments of $325 million ($207 million after tax) in 2009. | | Cash flow from operations in 2009, before changes in non-cash working capital items, was $2.3 billion compared with $3.6 billion in 2008 and $2.0 billion in 2007. The changes in cash flow from operations are due mainly to the volatility in commodity prices and changes in the Canadian/US dollar exchange rate. In 2008, our earnings included a $1.5 billion non-cash future tax provision, $856 million of non-cash asset impairment charges and a provision against our marketable securities. Cash flow from operations, after changes in non-cash working capital items, less scheduled debt repayments, dividends and sustaining capital expenditures, was $2.6 billion in 2009 compared with $1.3 billion in 2008 and $1.1 billion in 2007. At December 31, 2009, our cash balance, including restricted cash, was $1.4 billion. Total debt was $8.0 billion and our net debt to net debt-plus-equity ratio was 31% compared with 52% at December 31, 2008. |
Teck 2009 Management’s Discussion and Analysis 19
Operating Profit
Our operating profit is made up of our revenues less the operating, depreciation and amortization expenses at our producing operations. Income and expenses from our business activities that do not produce commodities for sale are included in our other income and expenses.
Our principal commodities are copper, metallurgical coal and zinc, which accounted for 24%, 46% and 14% of revenues respectively in 2009. Molybdenum is a significant product of our copper operations, and lead is a significant product of our zinc operations, respectively accounting for 1% and 5% of our 2009 revenues. In addition, our Antamina copper mine produces a significant volume of zinc concentrate. Other products produced at various operations include silver, various specialty metals, chemicals and fertilizers, and electricity, and in total accounted for 10% of our revenue in 2009.
Our acquisitions of the Fording coal assets in October 2008 and Aur in August 2007 has had a significant impact on our revenues, operating expenses and operating profits. Our results for 2008 included a full year of results from the three mines we acquired from Aur compared with just over four months in 2007. In addition, our 2008 operating profit includes our 40% share of the results of Teck Coal until the end of October 2008 and 100% thereafter compared with only our 40% direct interest for all of 2007. Accordingly, these two acquisitions accounted for a portion of the increase in revenues, operating expenses, and depreciation and amortization in 2008 and the acquisition of the Teck Coal assets accounted for a significant portion of the increase in revenues, operating expenses, and depreciation and amortization when comparing 2009 with 2008.
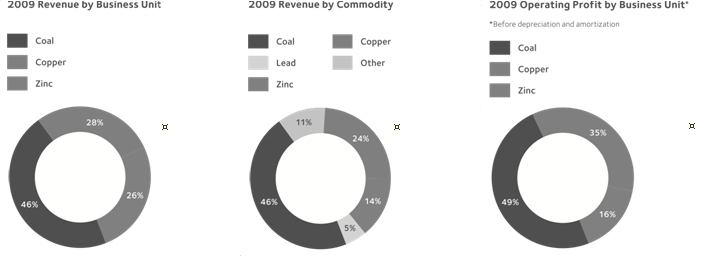
Our revenues are affected by sales volumes, which are determined by our production levels and demand for the commodities we produce, commodity prices and currency exchange rates. Our consolidated revenues were a record $7.7 billion in 2009 compared with $6.7 billion in 2008 and $6.2 billion in 2007. The increase in 2009 over 2008 was mainly due to our acquisition of Teck Coal in October 2008. Our 2009 revenue from coal was $3.5 billion compared with $2.4 billion in 2008 when we recorded our 40% share of Teck Coal’s revenue until October 2008 and 100% thereafter. Average prices for all of our main commodities were lower in 2009 than 2008. However, the significant volatility in base metal prices had a significant impact on our revenues in 2009 and 2008. As a result of the sharp decline in prices late in 2008, our revenue for 2008 included $577 million (before $45 million of royalty expense recovery) of negative pricing adjustments compared with $354 million (before $29 million of royalty expenses) of positive adjus tments in 2009 as base metal prices recovered. In 2008 our revenues increased over 2007 levels by $466 million as a result of having a full year of revenue from the three mines acquired through our acquisition of Aur, the effect of significantly higher coal prices and the acquisition of Teck Coal referred to above. This was partially offset by lower zinc sales volumes and the decline in average base metal prices in the fourth quarter of 2008 resulting in the significant negative pricing adjustments. At December 31, 2008, outstanding receivables included 164 million pounds of copper provisionally valued at an average of US$1.40 per pound, 195 million pounds of zinc valued at an average of US$0.54 per pound and 45 million pounds of lead | | provisionally valued at an average of US$0.42 per pound. During 2009, the copper receivables were settled at an average final price of US$1.53 per pound, zinc receivables were settled at an average final price of US$0.53 per pound and lead at US$0.51 per pound, resulting in positive after-tax final pricing adjustments of $14 million in the year. We also recorded positive after-tax pricing adjustments of $193 million for sales recorded during 2009. At December 31, 2009, outstanding receivables included 107 million pounds of copper provisionally valued at an average of US$3.34 per pound, 221 million pounds of zinc valued at an average of US$1.17 per pound and 31 million pounds of lead valued at an average of US$1.09 per pound. Our operating costs include all of the expenses required to produce our products, such as labour, energy, operating supplies, concentrates purchased at our Trail refining and smelting operation, royalties, and marketing and distribution costs required to sell and transport our products to various delivery points. Due to the geographic locations of many of our operations, we are highly dependent on third parties for the provision of rail, port and other distribution services. In certain circumstances, we negotiate prices for the provision of these services where we may not have viable alternatives to using specific providers, or may not have access to regulated rate-setting mechanisms. Contractual disputes, demurrage charges, rail and port capacity issues, availability of vessels and railcars, weather problems and other factors can have a material e ffect on our ability to transport materials from our suppliers and to our customers in accordance with schedules and contractual commitments. |
Teck 2009 Management’s Discussion and Analysis 20
The magnitude of our operating costs is dictated mainly by our production volumes, the costs of labour, operating supplies and concentrate purchases, by strip ratios, haul distances and ore grades, and by distribution costs, commodity prices, foreign exchange rates and costs related to non-routine maintenance projects. Production volumes mainly affect our variable operating and our distribution costs. In addition, production may also affect our sales volumes and, when combined with commodity prices, affects profitability and ultimately our royalty expenses. Our operating expenses were $4.0 billion in 2009, compared with $3.8 billion in 2008 and $3.2 billion in 2007. In addition to general cost increases, significant increases in our 2009 operating expense include $510 million from having a full year of expenses from the coal mines acquired from Fording compared with 40% for ten months and 100% for two months in 2008. | | We determine our depreciation and amortization expense using various methods. Plant and equipment are depreciated and amortized on a straight-line basis over their estimated useful lives at our refining and smelting operations in Trail. Plant and processing facilities at our mines are amortized on a units-of-production basis over the lesser of their useful lives or the estimated proven and probable ore reserves. Mobile equipment is depreciated and amortized using operating hours and buildings, and other site infrastructure over their estimated useful lives. Accordingly, our depreciation and amortization expense varies to some degree with our production volumes. In 2009 our depreciation expense was $928 million compared with $468 million in 2008 and $293 million in 2007. The main reasons for the increase were our acquisitions of Aur in August 2007 a nd the Fording assets in October 2008. The acquisition of the Fording assets resulted in an additional $450 million of depreciation and amortization compared with 2008. |
Other Expenses
| ($ in millions) | | 2009 | | | 2008 | | | 2007 | |
| | | | | | | | | | |
| General and administrative | | $ | 188 | | | $ | 91 | | | $ | 110 | |
| Interest and financing | | | 655 | | | | 182 | | | | 85 | |
| Exploration | | | 33 | | | | 133 | | | | 104 | |
| Research and development | | | 15 | | | | 23 | | | | 32 | |
| Asset impairment | | | 27 | | | | 589 | | | | 69 | |
| Other expense (income) | | | (824 | ) | | | (55 | ) | | | (196 | ) |
| Provision for income and resource taxes | | | 695 | | | | 652 | | | | 806 | |
| Non-controlling interests, net of tax | | | 69 | | | | 82 | | | | 47 | |
| Equity loss (earnings), net of tax | | | 126 | | | | (22 | ) | | | 5 | |
| Loss (earnings) from discontinued operations, net of tax | | | (81 | ) | | | 9 | | | | 66 | |
| | | $ | 903 | | | $ | 1,684 | | | $ | 1,128 | |
General and administrative expenses were $188 million in 2009 compared with $91 million in 2008 and $110 million in 2007. The increase is mainly due to the improvement in our share price, which resulted in an $86 million charge to our stock-based compensation expense. The decrease in 2008 from 2007 was mainly due to a decline in our share price, which resulted in a $6 million recovery related to our stock-based compensation program. Our interest and financing expense increased significantly to $655 million in 2009 compared with $182 million a year ago. This increase was a result of the debt incurred to finance the acquisition of the Fording coal assets in October, 2008. This debt was initially short-term and bore relatively low rates of interest. However, our higher credit spread and the longer maturities of the US$4.225 billion of senior secured notes that we issued in May of 2009 have resulted in higher interest rates. We must continually replace our reserves as they are depleted in order to maintain production levels over the long term. We endeavour to do this through our exploration and development program and through acquisition of interests in new properties or in companies that own such properties. Exploration for minerals and oil and gas is highly speculative and the projects involve many risks. The vast majority of exploration projects are unsuccessful and there are no assurances that current or future exploration programs will find deposits that are ultimately brought into production. Exploration expense was $33 million in 2009 compared with $133 million in 2008 and $104 million in 2007. The main reason for the decrease in our exploration expense was due to a reduction in spending as part of the debt reduction plan announced in the fourth quarter of 2008. The 2008 expenditures included approximately $44 million on development projects such as Quebrada Blanca, Relincho, Mesaba and Carrapateena and $16 million on seafloor exploration. | | Our research and development expenditures are focused on advancing our proprietary CESL hydrometallurgical technology, the development of internal and external growth opportunities, and the development and implementation of process and environmental technology improvements at operations. In 2009, our research and development expenditures were $15 million compared with $23 million in 2008 and $32 million in 2007 with the reductions due mainly to reduced work in light of difficult economic conditions. Asset impairment charges were $27 million in 2009 and were mainly related to certain oil sands assets we hold. Asset impairment charges in 2008 totalling $589 million before taxes included the following: • $345 million of goodwill arising out of the acquisition of Aur Resources, • $179 million in respect of our Duck Pond, Lennard Shelf and Pend Oreille mines. The Lennard Shelf mine ceased operations in August 2008 and Pend Oreille was put on care and maintenance in February 2009, and • $22 million to write off our investment in the Petaquilla copper project in Panama, $35 million on the Santa Fe nickel project in Brazil, and $8 million for other exploration properties. |
Teck 2009 Management’s Discussion and Analysis 21
Other income, net of other expenses was $824 million in 2009 compared with $55 million in 2008 and $196 million in 2007. Other income and expense included $640 million of non-cash foreign exchange translation gains (2008 - $69 million) primarily related to our US dollar debt, $383 million of gains on the sale of investments and other assets (2008 - $14 million), $168 million of debt financing costs related to the repayment and refinancing of the Fording acquisition debt (2008 - nil), $50 million of losses on our derivative contracts (2008 - $311 million of gains). 2008 also included a $292 million write-down of marketable securities that we own in various development stage companies, whose decline in value was considered other-than-temporary. Income and resource taxes were $695 million in 2009, or 26% of pre-tax earnings. This is substantially lower than the Canadian statutory tax rate of 31%. This is the result of the significant foreign exchange gains and gains on the sale of assets, which are subject to the lower capital gains tax rate. This was partially offset by the effect of resource taxes in Canada. Income tax pools arising out of the Fording transaction shield us from cash income taxes, but not resource taxes, in Canada. We remain subject to cash taxes in foreign jurisdictions. Our non-controlling interest expense relates to the ownership interests in our Highland Valley Copper, Quebrada Blanca, Carmen de Andacollo and Elkview mines that are held by third parties. The decrease in 2009 compared with 2008 was due mainly to the lower earnings from the copper mines. | | We account for our investments in the Fort Hills Energy Limited Partnership, the Galore Creek Partnership and Fording (until October 30, 2008) using the equity method. 2008 included our share of Fording’s earnings until we acquired their coal assets on October 30, 2008. The $126 million equity loss in 2009 was due mainly to our share of asset impairment charges at the Fort Hills project due to the deferral of the upgrader portion of the project. Our 2008 equity earnings from the Galore Creek Partnership was $18 million compared with a $33 million equity loss in 2007 related to our share of demobilization costs resulting from the decision to suspend construction of the Galore Creek project. Demobilization activities went better than expected in 2008 resulting in a reduction of the provision for these costs and was the main component of the equ ity earnings in 2008. The equity earnings from Fording and Galore were offset by an $85 million equity loss from our investment in Fort Hills. The equity loss from Fort Hills related to asset impairment charges as a result of the deferral of the upgrader portion of the project and contract termination charges. Our earnings from discontinued operations relate mainly to the results from our Pogo and Hemlo gold mines until they were sold in 2009 ($19 million; 2008 - $9 million; 2007 - $20 million loss), the $55 million of gains on those sales and to the price participation provision in a 2004 agreement to sell our Cajamarquilla zinc refinery, which expired at the end of 2009 ($7 million; 2008 - $18 million loss; 2007 - $46 million loss). |
Financial Position and Liquidity
Our financial position and liquidity improved significantly in 2009. Our cash position, including $91 million of restricted cash that can only be used for principal and interest payments on our term loan, increased during the year by $570 million to $1.4 billion at December 31, 2009.
Our debt totalled $8.0 billion at December 31, 2009. We retired the bridge loan during 2009 and repayments of US$1.7 billion on our term loan reduced its balance to US$2.3 billion at the end of the year. As a result of US$442 million of payments made subsequent to year end, the term loan balance has been reduced to US$1.9 billion at February 23, 2010 and a further payment of approximately US$1.1 billion will be made on March 10, 2010, with the proceeds from the sale of the Waneta Dam and cash on hand. As a result of these payments, our total debt will be reduced by C$7.1 billion since we acquired the Fording assets in October 2008. A summary of our debt positions and credit ratios are summarized in the following table.
| | | December 31, 2008 | | | December 31, 2009 | | | March 10, 2010 Pro Forma After Sale of Waneta Dam | |
| | | | | | | | | | |
| Term loan | | $ | 3,937 | | | $ | 2,325 | | | $ | 810 | |
| Bridge loan | | | 5,284 | | | | – | | | | – | |
| Fixed rate term notes | | | 1,181 | | | | 5,086 | | | | 5,086 | |
| Other | | | 167 | | | | 205 | | | | 205 | |
| Total debt (US$ in millions) | | $ | 10,569 | | | $ | 7,616 | | | $ | 6,101 | |
| Total debt (C$ in millions) | | $ | 12,874 | | | $ | 8,004 | | | $ | 6,299 | |
| Cash balances (C$ in millions) | | $ | 850 | | | $ | 1,420 | | | $ | 900 | |
| Net debt (C$ in millions) | | $ | 12,024 | | | $ | 6,584 | | | $ | 5,399 | |
| Debt to debt-plus-equity | | | 54 | % | | | 36 | % | | | 29 | % |
| Net debt to net-debt-plus-equity | | | 52 | % | | | 31 | % | | | 26 | % |
In addition, various provisions of the bridge and term loans were amended during the year, with the most significant amendments extending the maturity dates and allowing us to apply the non-scheduled payments against the existing payment schedule on a modified pro rata basis, rather than against the latest scheduled payments first.
Our primary sources of liquidity and capital resources are our cash and temporary investments, cash flow provided from operations and the proceeds of potential asset sales, a portion of which must be used to pay down our term facility.
We also have committed bank credit facilities aggregating $1.1 billion, the majority of which mature in 2012 and beyond. Our current unused credit lines under these facilities after drawn letters of credit amount to $1.0 billion. Our senior debt is currently rated Ba1 and is under review for possible further upgrade by Moody’s Investor Services, BB+ on credit watch with positive implications by Standard & Poor’s, and BB (high) with a stable outlook by Dominion Bond Rating Service.
Teck 2009 Management’s Discussion and Analysis 22
Operating Cash Flow Cash flow from operations was $3.0 billion in 2009 compared with $2.1 billion in 2008 and $1.7 billion in 2007. The increase is due to higher operating profits before depreciation, partially offset by higher interest charges. We also received approximately $940 million of tax refunds in 2009 related to our acquisition of Fording’s coal assets in 2008. The acquisition of Fording’s assets added directly to our cash flows in 2009. Our 2008 cash flows reflected our 40% share of cash flows from Teck Coal and our share of distributions from Fording until the end of October 2008. Since that time, we receive 100% of the cash flow generated by Teck Coal. Investing Activities Capital expenditures were $590 million in 2009 and included $191 million on sustaining capital, $333 million on development projects and $59 million on our non-Fort Hills oil sands properties and $7 million on our mineral exploration properties. The largest components of sustaining expenditures were $69 million at Teck Coal, $28 million at Antamina, and $32 million at Red Dog. Development expenditures included $122 million for preparatory stripping and capital equipment for Highland Valley Copper’s mine life extension project and $197 million on the development of the hypogene deposit at Carmen de Andacollo. Investments in 2009 totalled $372 million, of which $303 million was our share of costs for our equity accounted investment in the Fort Hills project, the majority of which was spent in the first half of the year before spending on the project was substantially reduced by Suncor, the new operator, pending a project review. Financing Activities Significant financing activities during the year included various amendments to the bridge and term loans related to the Fording acquisition, the issuance of US$4.225 billion of senior secured notes and a US$1.5 billion private placement of Class B subordinate voting shares to a wholly owned subsidiary of China Investment Corporation (“CIC”), each of which are described below and contributed to the retirement of the bridge loan and a substantial reduction in the outstanding balance of the term loan. At December 31, 2009, the term loan balance was US$2.365 billion, but subsequent to year end had been reduced to US$1.923 billion, with US$721 million due in 2010, US$696 million in 2011 and US$506 million in 2012. The balance is expected to be further reduced by US$1.1 billion with cash on hand and the proceeds from the sale of a one-third interest in the Waneta Dam, which closed on March 5, 2010. The significant amendments to the provisions of the term and bridge loans were to: • defer US$4.4 billion of payments previously scheduled for the balance of 2009, • extend the maturity date of US$3.5 billion of the bridge loan from October 29, 2009 to October 30, 2011, • reschedule approximately US$3.3 billion of amortization payments under the term loan, and • allow us to apply the non-scheduled payments against the existing payment schedule on a modified pro rata basis, rather than against the latest scheduled payments first. | | We repaid the bridge loan in full with proceeds from asset sales, tax refunds related to the Fording acquisition, the issuance of the senior secured notes and a portion of the US$1.5 billion in proceeds received from the sale of Class B subordinate voting shares to CIC. The remaining proceeds from the private placement to CIC were used to repay approximately US$1.2 billion of the term loan. The amended term loan contains covenants including restrictions on new indebtedness, new liens, acquisitions and dispositions, capital expenditures and distributions. In addition, there are two financial covenants, a maximum leverage ratio and a minimum interest coverage ratio. Both tests are calculated on a rolling basis at the end of each calendar quarter based on EBITDA and interest expense for the previous twelve months. At December 31, 2009 the minimum interest coverage ratio covenant was 2.0 to 1.0 and the maximum leverage ratio covenant was 5.25 to 1.0 and we were in compliance with both. The term loan requires certain mandatory prepayments from net proceeds of asset sales and new debt or equity issuances and a quarterly cash sweep. In May 2009, we issued US$4.225 billion in aggregate principal amounts of senior secured notes, consisting of US$1.315 billion of 5-year notes due in May 2014, US$1.06 billion of 7-year notes due in May 2016 and US$1.85 billion of 10-year notes due in May 2019. The five-year notes bear interest at 9.75% per annum, were issued at 95.27% of face value and are non-callable. The seven-year notes bear interest at 10.25% per annum, were issued at 94.654% of face value and are callable on or after May 15, 2013. The 10-year notes bear interest at 10.75% per annum, were issued at 94.893% of face value and are callable on or after May 15, 2014. The net proceeds from these notes of US$3.875 billion were used to repay a portion of the bridge loan. In July 2009, we issued approximately 101.3 million Class B subordinate voting shares to CIC for proceeds of US$1.5 billion and used the net proceeds to retire the outstanding balance of the bridge loan and reduce the balance of the term loan. CIC indirectly holds approximately 17.5% of our outstanding Class B subordinate voting shares, representing approximately 17.2% equity and 6.7% voting interests in Teck. Our obligations under our amended lending agreements and the senior secured notes are guaranteed by Teck Metals Ltd., Teck Coal Partnership, and all other material subsidiaries of Teck, subject to certain exceptions, and are secured by a first priority security interest in all of the material properties of Teck and each guarantor, with provision for the release of the security interest in connection with permitted asset sales. The security interest in favour of the banks and noteholders will fall away upon Teck receiving an investment grade credit rating with a stable outlook from each of Moody’s and S&P. Teck’s US$1.2 billion of senior notes due in 2012, 2015 and 2035 have the benefit of the same security interest. |
Teck 2009 Management’s Discussion and Analysis 23
Quarterly Earnings and Cash Flow
| (in millions except for per share data) | | 2009 | | | 2008 | |
| | | | Q4 | Q3 | Q2 | Q1 | | | | Q4 | | | | Q3 | | | | Q2 | | | | Q1 | |
| | | | | | | | | | | | | | | | | | | | | |
| Revenues | | $ | 2,167 | | | $ | 2,131 | | | $ | 1,707 | | | $ | 1,669 | | | $ | 1,600 | | | $ | 1,740 | | | $ | 1,805 | | | $ | 1,510 | |
| Operating profit | | | 777 | | | | 694 | | | | 636 | | | | 627 | | | | 190 | | | | 679 | | | | 869 | | | | 605 | |
| EBITDA | | | 1,042 | | | | 1,236 | | | | 1,122 | | | | 709 | | | | (402 | ) | | | 791 | | | | 934 | | | | 638 | |
| Net earnings (loss) | | | 411 | | | | 609 | | | | 570 | | | | 241 | | | | (607 | ) | | | 424 | | | | 497 | | | | 345 | |
| Earnings (loss) per share | | $ | 0.70 | | | $ | 1.07 | | | $ | 1.17 | | | $ | 0.50 | | | $ | (1.28 | ) | | $ | 0.95 | | | $ | 1.12 | | | $ | 0.78 | |
| Cash flow from operations | | | 697 | | | | 772 | | | | 386 | | | | 1,128 | | | | 589 | | | | 858 | | | | 507 | | | | 155 | |
Revenues from operations were $2.2 billion in the fourth quarter compared with $1.6 billion in 2008. Revenues from our copper and zinc business units increased by a total of $820 million, primarily due to significantly higher prices and positive pricing adjustments of $101 million (before $11 million of royalty expenses) in the fourth quarter compared with significant negative price adjustments of $474 million (before $38 million of royalty expense recoveries) in the fourth quarter last year. The higher revenues were partly offset by the effect of the weaker US dollar. Coal revenues declined by $253 million compared with a year ago due to significantly lower realized coal prices partially offset by higher coal sales volumes and our increased ownership in Teck Coal. Fourth quarter operating profit from our copper business unit, before depreciation and pricing adjustments, was $368 million in 2009 compared with $205 million last year as a result of significantly higher copper prices. After depreciation and pricing adjustments, the operating profit from our copper business unit was $363 million compared with an operating loss of $214 million last year. Copper prices had declined sharply in the fourth quarter of 2008 resulting in negative pricing adjustments of $335 million compared with positive pricing adjustments of $62 million in the fourth quarter this year. Operating profit from our coal business unit, before depreciation and pricing adjustments, was $372 million in the fourth quarter of 2009 compared with $516 million last year. The reduction in operating profit was primarily due to significantly lower realized coal prices, which averaged C$151 (US$139) per tonne in the quarter compared with C$285 (US$247) per tonne in the same period a year ago. The lower realized coal price reflects the lower contracted US dollar price settlements for the 2009 coal year that commenced April 1, 2009 and the effect of a stronger Canadian dollar. Coal sales of 5.4 million tonnes in the fourth quarter, which were constrained by clean coal production levels and delayed ship loading due to severe weather, reflect strong demand in China for seaborne coking coal and increased deliveries to our traditional contract customer s. This compares with sales of 4.7 million tonnes (on a 100% basis) in the fourth quarter of 2008 when our customers deferred coal deliveries in response to lower steel demand. | | Operating profit from our zinc business unit, before depreciation and pricing adjustments, was $205 million in the fourth quarter compared with $62 million in 2008 due to significantly higher zinc and lead prices and higher concentrate sales volumes. After depreciation and pricing adjustments, the operating profit from our zinc business unit was $195 million compared with an operating loss of $82 million last year. Zinc prices had declined sharply in the fourth quarter of 2008 resulting in negative pricing adjustments of $101 million compared with positive pricing adjustments of $28 million in the fourth quarter this year. Cash flow from operations was $697 million in the fourth quarter of 2009 compared with $589 million in 2008, with the increase due mainly to higher contributions from our copper and zinc operations as a result of higher base metal prices and increased sales volumes of zinc and coal. This was partly offset by a decline in coal revenues due to lower coal prices and by interest payments of approximately $260 million in the quarter. Cash flow from operations in the fourth quarter of 2008 included strong cash flows from our coal operations, but also included negative copper and zinc pricing adjustments of $255 million in the quarter. |
Teck 2009 Management’s Discussion and Analysis 24
Outlook The information below is in addition to the disclosure concerning specific operations included above in the Operations and Corporate Development sections of this document. General Economic Conditions General economic conditions have improved from a year ago. Our earnings are heavily dependent on exchange traded commodity prices, including base metal prices, and volatility in these markets has also been unusually high over the past year. Accordingly, it is difficult in these conditions to forecast commodity prices or customer demand for our products. Assuming no significant changes to the current global economic conditions, we expect the second half of 2010 to be stronger for us than the first half of the year for a number of reasons as follows: •Due to sea ice conditions, the Red Dog mine has a shipping window that normally starts in early July and ends in late October. If ice or other weather conditions are such that the shipping season is delayed, our quarterly sales patterns can vary substantially. Sales and profits of the Red Dog mine follow a seasonal pattern, with higher sales volumes of zinc and most of the lead sales occurring in the last five months of the year following the commencement of the shipping season in July, •The winter months typically present challenging production and shipping conditions for Teck Coal as either the impacts of snow in January and February or rain in February and March can disrupt production and rail haulage on a temporary basis, which can affect our sales volumes. In addition, even though current spot pricing is very strong and market sentiment is indicating that 2010 contract year coal prices may rise, most of our coal sales in the first quarter will be at lower 2009 contract year prices as the price increases are not expected to begin until April of 2010. Our coal sales volumes are currently estimated at 24 million tonnes in 2010, but final volumes and price guidance for 2010 will be confirmed after contracts for the 2010 coal year have been settled. Coal prices in the first quarter of 2010 are expected to be lower than the f ourth quarter of 2009 due to a lower percentage of the sales being priced at the higher 2008 contract year pricing. | | • Copper concentrate production will be lower at Highland Valley in the first quarter of 2010 compared with the first quarter of 2009 as we continue to deal with the additional stripping requirements arising from geotechnical issues. Copper cathode production is expected to be lower at Andacollo in the first half of 2010 as the mine transitions from cathode production to concentrate production. This transition is also expected to increase unit production costs. In the second half of 2010, the concentrate project at Andacollo is expected to be producing at design capacity, making a significant contribution to copper concentrate production and operating profit. • At December 31, 2009, outstanding receivables included 107 million pounds of copper provisionally valued at an average of US$3.34 per pound, 221 million pounds of zinc valued at an average of US$1.17 per pound and 31 million pounds of lead valued at an average of US$1.09 per pound. At the date of this report, base metal prices are lower than the prices on which the receivables are based. If current prices stay at similar levels, we would expect to incur negative pricing adjustments on these receivables, which will be recorded in the first quarter of 2010. Commodity Prices and 2010 Production Commodity prices are a key driver of our earnings and despite the sharp decline in metal and commodity prices that occurred in the second half of 2008, current prices are still above historic averages. On the supply side, the depleting nature of ore reserves, difficulties in finding new ore bodies, progressing through the permitting process, finding skilled resources to develop projects, infrastructure constraints and significant cost inflation may continue to have a moderating impact on the growth in future production. Although we are concerned about current global economic conditions, particularly in the United States and Europe, we believe that, over the longer term, as China and India continue to industrialize, those two economies will continue to be major positive factors in the future demand for commodities. We believe that the long-term pric e environment for the products that we produce and sell remains favourable. |
Based on our expected 2010 production and prices prevailing at December 31, 2009, the sensitivity of our annual earnings to the indicated changes in commodity prices before pricing adjustments and the US dollar exchange rate is as follows:
| | 2010 | | Effect of | |
| | Production | | Change on Annual | Effect on |
| | Plan | Change | After-Tax Earnings | EBITDA |
| | | | | |
| Coal (000’s tonnes) | 24,000 | US$5/tonne | $ 75 million | $ 120 million |
| Copper (tonnes) | 340,000 | US$0.10/lb | $ 40 million | $ 65 million |
| Zinc (tonnes) | 940,000 | US$0.05/lb | $ 35 million | $ 50 million |
| US$ exchange | | Cdn$0.01 | $ 40 million | $ 70 million |
Notes:
(1) The effect on our earnings of commodity price and exchange rate movements will vary from quarter to quarter depending on sales volumes.
(2) Zinc includes 290,000 tonnes of refined zinc and 650,000 tonnes of zinc contained in concentrates.
(3) Asset sales and financing transactions may affect our 2010 production plans and earnings.
(4) All production estimates are subject to change based on market conditions.
Foreign exchange translation gains and losses on our US dollar denominated debt arising from exchange rate fluctuations are not expected to have a significant effect on our 2010 earnings after the first quarter, as our reduced debt levels are expected to be almost fully hedged by our investments in US dollar denominated foreign operations and working capital items.
Teck 2009 Management’s Discussion and Analysis 25
Copper and zinc prices are currently trading approximately 42% and 18% higher than 2009 average prices, respectively. Partly offsetting the higher commodity prices is a stronger Canadian dollar, which to date in 2010 is averaging approximately $1.05 against the US dollar compared with US$1 averaging C$1.14 in 2009.
Our copper production for 2010 is expected to increase by 10% from 2009 levels to 340,000 tonnes. Copper concentrate production is expected to increase by approximately 40,000 tonnes from 2009, due mainly to the start-up of the Andacollo concentrator project, which is expected to achieve design capacity in the first half of 2010.
We expect coal production in 2010 to increase by approximately 25% to 23.5 to 25 million tonnes and we are actively planning for further production increases in 2011 and 2012. We are focused on near-term expansion opportunities in light of the tight market that we expect for high quality hard coking coal.
Our zinc in concentrate production in 2010 is expected to be approximately 650,000 tonnes. Assuming no interruption of production relating to permitting issues, Red Dog’s production is expected to decrease by 30,000 tonnes as it transitions to the Aqqaluk deposit and our share of zinc production from Antamina will decrease by 25,000 tonnes due to ore body sequencing. Assuming no interruption of production at Red Dog, refined zinc production from our Trail metallurgical complex is expected to increase in 2010 to approximately 290,000 tonnes, as we curtailed production in 2009 in response to reduced demand from our customers.
Capital Expenditures
Our planned capital expenditures for 2010 are summarized in the following table.
| ($ in millions) | Development | Sustaining | Total |
| | | | |
| Copper | $ 395 | $ 130 | $ 525 |
| Coal | 230 | 125 | 355 |
| Zinc | – | 105 | 105 |
| Other | 50 | 15 | 65 |
| | $ 675 | $ 375 | $ 1,050 |
Our planned capital expenditures for 2010 are initially set at approximately $1.05 billion. This amount has been revised upwards from our previous estimates as we now expect to capitalize rather than expense stripping costs related to the geotechnical issues at Highland Valley Copper and development costs for the Quebrada Blanca concentrate project. We may authorize further capital expenditures during the year depending on commodity markets, our financial position and other factors. We also expect to spend approximately $9 million on our share of costs for the Fort Hills oil sands project. Asset Sales The sale of the Waneta Dam closed on March 5, 2010 resulting in a pre-tax gain of approximately $645 million that will be recorded in the first quarter of 2010. The $825 million of proceeds will be used to repay a portion of the term loan that will reduce our interest expense for the year by approximately $25 million. Exchange Rates Our US dollar denominated debt will be subject to revaluation based on changes in the Canadian/US dollar exchange rate. Exchange rate fluctuations will also affect our debt to equity ratio and our interest expense. | | Other Information The government of British Columbia introduced a carbon tax on virtually all fossil fuels in 2008. The tax is imposed on fossil fuels used in BC and, as of July 1, 2009, is based on $15 per tonne of CO2-emission equivalent, increasing by $5 per tonne each year until it reaches $30 per tonne in 2012. For 2009, our seven BC-based operations paid $16 million in provincial carbon tax, primarily from our use of coal, diesel fuel, and natural gas. We anticipate that this will increase to approximately $35-40 million per year in carbon tax by 2012 as the tax rate increases to $30/tonne of CO2-emission. The BC government has initiated the creation of a cap and trade mechanism to further reduce greenhouse gas emissions. However, it has indicated that the carbon tax and the cap and trade system will be integrated to avoid double taxation. We will monitor this issue as legislation is developed. |
Teck 2009 Management’s Discussion and Analysis 26
Financial Instruments and Derivatives
We hold a number of financial instruments and derivatives, the most significant of which are marketable equity securities, foreign exchange forward sales contracts, fixed price forward metal sales contracts, settlements receivable, settlements payable, prepayment rights on our 2016 and 2019 senior secured notes and price participation payments on the sale of the Cajamarquilla zinc refinery. The Cajamarquilla price participation payments, which expired at the end of 2009, are economically similar to a fixed price forward purchase of zinc. The financial instruments and derivatives are all recorded at fair values on our balance sheet with gains and losses in each period included in other comprehensive income, net earnings from continuing operations and net earnings from discontinued operations as appropriate. Some of our gains and losses on metal-rela ted financial instruments are affected by smelter price participation and are taken into account in determining royalties and other expenses. All are subject to varying rates of taxation depending on their nature and jurisdiction.
The after-tax effect of financial instruments on our net earnings for the following periods is set out in the table below:
| ($ in millions) | | 2009 | | | 2008 | | | 2007 | |
| | | | | | | | | | |
| Price adjustments | | | | | | | | | |
| On prior year’s sales | | $ | 14 | | | $ | 57 | | | $ | (56 | ) |
| On current year’s sales | | | 193 | | | | (386 | ) | | | (10 | ) |
| | | | 207 | | | | (329 | ) | | | (66 | ) |
| | | | | | | | | | | | | |
| Derivatives gains (losses) | | | (36 | ) | | | 202 | | | | 32 | |
| | | | 171 | | | | (127 | ) | | | (34 | ) |
| | | | | | | | | | | | | |
| Amounts included in discontinued operations | | | | | | | | | | | | |
| Derivative losses | | | (13 | ) | | | (16 | ) | | | (18 | ) |
| Cajamarquilla sale price participation | | | 7 | | | | (18 | ) | | | (46 | ) |
| | | | (6 | ) | | | (34 | ) | | | (64 | ) |
| Total | | $ | 165 | | | $ | (161 | ) | | $ | (98 | ) |
Critical Accounting Estimates In preparing financial statements, management has to make estimates and assumptions that affect the reported amounts of assets, liabilities, revenues and expenses. Based on historical experience, current conditions and expert advice, management makes assumptions that are believed to be reasonable under the circumstances. These estimates and assumptions form the basis for judgments about the carrying value of assets and liabilities and reported amounts for revenues and expenses. Different assumptions would result in different estimates, and actual results may differ from results based on these estimates. These estimates and assumptions are also affected by management’s application of accounting policies. Critical accounting estimates are those that affect the consolidated financial statements materially and involve a significant level of judgm ent by management. Management’s critical accounting estimates apply to the assessment for the impairment of property, plant and equipment and the valuation of other assets and liabilities such as inventory, plant and equipment, goodwill, investments, restoration and post-closure costs, accounting for income and resource taxes, mineral reserves, contingencies and pension and other post-retirement benefits. Property, Plant and Equipment We capitalize exploration and evaluation costs of mining projects when resources, as defined under National Instrument 43-101, exist and it is expected that the expenditure can be recovered by future exploitation or sale. Once available for use, these costs are amortized over the proven and probable reserves to which they relate, calculated on a unit of production basis. The estimation of the extent of reserves is a complex task in which a number of estimates and assumptions are made. These involve the use of geological sampling and models as well as estimates of future costs. New knowledge derived from further exploration and development of the ore body may affect reserve estimates. In addition, the estimation of economic reserves depends on assumptions regarding long-term commodity prices and in some cases exchange rates, as well as various techn ical assumptions, which may prove to be incorrect. | | Where impairment conditions may exist, the expected undiscounted future cash flows from an asset are compared with its carrying value. These future cash flows are developed using assumptions that reflect the long-term operating plans for an asset, given management’s best estimate of the most probable set of economic conditions. Commodity prices used reflect market conditions and expectations with respect to future prices at the time the model is developed. These models are updated from time to time, and lower prices are used should market conditions deteriorate. Inherent in these assumptions are significant risks and uncertainties. Changes in market conditions, reserve estimates and other assumptions used in these estimates may result in future write-downs. In management’s view, based on assumptions that management believes to be reason able, we recorded an impairment charge for the year ended December 31, 2009 of $25 million for capitalized acquisition and exploration costs relating to our oil sands leases as these costs were no longer expected to be recoverable. Goodwill We allocate goodwill arising from business combinations to the reporting units acquired based on estimates of the fair value of the reporting unit. When performing annual goodwill impairment tests, we are also required to estimate the fair value of each reporting unit and, in some circumstances, the fair value of all identifiable assets and liabilities in a reporting unit. The fair values are estimated using a model of discounted cash flows based on proven and probable reserves and value beyond proven and probable reserves. Other major assumptions used include commodity prices, operating costs, foreign exchange rates and discount rates. We did not record any impairment of our goodwill balances in 2009. Significant changes to the long-term commodity prices and discount rates would be required before an impairment would be indicated. |
Teck 2009 Management’s Discussion and Analysis 27
Fair value estimation and impairment charges are based on management estimates and assumptions. The fair value of our reporting units will continue to be affected by changes in the long-term commodity prices, discount rates, operating and capital costs, changes in mineral reserves and the advancement of projects to the operating stage. Significant judgment is applied and actual results could differ from our estimates. Income and Resource Taxes The determination of our tax expense for the year and its future tax liabilities and assets involves significant management estimation and judgment involving a number of assumptions. In determining these amounts, management interprets tax legislation in a variety of jurisdictions and makes estimates of the expected timing of the reversal of future tax assets and liabilities. Management also makes estimates of the future earnings, which affects the extent to which potential future tax benefits may be used. We are subject to assessments by various taxation authorities who may interpret tax legislation differently. These differences may affect the final amount or the timing of the payment of taxes. We provide for these differences, where known, based on management’s best estimate of the probable outcome of these matters. Pension and Other Post-Retirement Benefits The cost of providing benefits through defined benefit pension plans and post-retirement benefit plans is actuarially determined. Cost and obligation estimates depend on management’s assumptions about future events, which are used by the actuaries in calculating such amounts. These include assumptions with respect to discount rates, the expected plan investment performance, future compensation increases, health care cost trends and retirement dates of employees. In addition, actuarial consultants utilize subjective assumptions regarding matters such as withdrawal and mortality rates. Actual results may differ materially from those estimates based on these assumptions. Asset Retirement Obligations The amounts recorded for asset retirement costs are based on estimates included in closure and remediation plans. These estimates are based on engineering studies of the work that is required by environmental laws or public statements by management that results in an obligation. These estimates are based on assumptions as to the timing of remediation work and the rate at which costs may inflate in future periods. Actual costs and the timing of expenditures could differ from these estimates. Recognition of Contingencies We are subject to a number of lawsuits and threatened lawsuits. A provision is made for amounts claimed through these lawsuits when management believes that it is more likely than not that the plaintiffs will be awarded damages or a monetary settlement will be made. Management seeks the advice of outside counsel in making such judgments when the amounts involved are material. Adoption of New Accounting Standards and Accounting Developments Goodwill and Intangible Assets In February 2008, the Canadian Institute of Chartered Accountants (“CICA”) issued Section 3064, “Goodwill and Intangible Assets,” which replaces Section 3062, “Goodwill and Other Intangible Assets.” This new standard provides guidance on the recognition, measurement, presentation and disclosure of goodwill and intangible assets. Concurrent with the adoption of this standard,CICA Emerging Issues Committee (“EIC”) Abstract 27, “Revenues and Expenditures in the Pre-operating Period,” was withdrawn. | | This standard is effective for our fiscal year beginning January 1, 2009. Adoption of this standard did not have a significant effect on our financial statements. Credit Risk and Fair Value of Financial Assets and Liabilities In January 2009, the CICA issued EIC 173, “Credit Risk and the Fair Value of Financial Assets and Financial Liabilities.” This EIC provides guidance on how to take into account credit risk of an entity and counterparty when determining the fair value of financial assets and financial liabilities, including derivative instruments. This standard is effective for our fiscal year beginning January 1, 2009. Adoption of this EIC did not have a significant effect on our financial statements. Mining Exploration Costs In March 2009, the CICA issued EIC 174, “Mining Exploration Costs.” This EIC provides guidance on the accounting for and the impairment review of capitalized exploration costs. This standard is effective for our fiscal year beginning January 1, 2009. The application of this EIC did not have a significant effect on our financial statements. Financial Instruments – Disclosures In 2009, the CICA amended Section 3862, “Financial Instruments – Disclosures,” to include additional disclosure requirements about fair value measurements of financial instruments and to enhance liquidity risk disclosure requirements. These amendments are effective for our annual financial statements for the year ended December 31, 2009. Additional disclosures have been included in our 2009 consolidated financial statements to incorporate these new requirements. Business Combinations and Related Sections In January 2009, the CICA issued Section 1582 “Business Combinations” to replace Section 1581. Prospective application of the standard is effective January 1, 2011, with early adoption permitted. This new standard effectively harmonizes the business combinations standard under Canadian GAAP with International Financial Reporting Standards (“IFRS”). The new standard revises guidance on the determination of the carrying amount of the assets acquired and liabilities assumed, goodwill and accounting for non-controlling interests at the time of a business combination. The CICA concurrently issued Section 1601 “Consolidated Financial Statements” and Section 1602 “Non-Controlling Interests,” which replace Section 1600 “Consolidated Financial Statements.” Section 1601 provides revised guidance on the preparation of consolidated financial statements and Section 1602 addresses accounting for non-controlling interests in consolidated financial statements subsequent to a business combination. These standards are effective January 1, 2011, unless they are early adopted at the same time as Section 1582 “Business Combinations.” We have chosen to early adopt Sections 1582, 1601 and 1602 effective January 1, 2010. On adoption of these Sections, non-controlling interests will be presented within shareholders’ equity on the balance sheet. The non-controlling interests in income will no longer be deducted in arriving at consolidated net earnings. There is no effect from adoption on previous business combinations. |
Teck 2009 Management’s Discussion and Analysis 28
International Financial Reporting Standards (IFRS) Changeover Plan Effective January 1, 2011 Canadian publicly listed entities will be required to prepare their financial statements in accordance with IFRS, instead of current Canadian GAAP. Due to the requirement to present comparative financial information, the effective transition date is January 1, 2010. In 2008, we established an IFRS conversion team to lead the significant undertaking of transition from Canadian GAAP to IFRS. We have prepared a detailed IFRS conversion plan, which will continue to evolve to accommodate the expected changes in IFRS accounting standards past 2011. We developed a conversion plan to ensure timely and accurate reporting, and a smooth transition to adopting IFRS including any required changes to accounting processes and controls. We are developing and maintaining our IFRS competencies by addressing ongoing training requirements at various levels of the organization. We have identified four phases to our conversion: scoping and planning, detailed assessment, implementation and post-implementation. The scoping and planning phase and detailed assessment phase are substantially complete and we are now in the implementation phase. Implementation During the implementation phase thus far, we have identified implementation requirements to effect management’s preliminary accounting choices, developed sample financial statements including note disclosures and assessed key accounting policy decisions. We are now in the process of finalizing key accounting policy decisions, calculating the opening balance sheet as at January 1, 2010, implementing business and internal control requirements and preparing other transitional reconciliations and disclosure requirements. The effects of the IFRS transition are being quantified as each work stream is completed. Through our detailed assessment and implementation work performed to date we have identified below the areas that are expected to have an impact on our financial statements on transition to IFRS and in future periods. We have not yet determined the full impact of IFRS adoption as transition adjustments are still being quantified and accounting policy recommendations still require review and approval in certain areas. The majority of key accounting policy decisions and IFRS 1, “First-Time Adoption of International Financial Reporting Standards,” optional exemptions are currently under review by senior management and the Audit Committee of the Board of Directors. The policy decisions are expected to be approved in the first six months of 2010. We plan to disclose our significant accounting policy choices once all policies and IFRS 1 optio n exemptions are approved. The identified IFRS accounting impacts below should not be regarded as complete or final as we have not completed our process of quantifying changes and finalizing the policy choices. Significant ongoing projects could impact the differences. Impairment of Long-Lived Assets Canadian GAAP uses a two-step approach to impairment testing for long-lived assets. Step one of the current Canadian GAAP impairment test, which uses undiscounted cash flows to identify possible impairments does not exist under IFRS. Instead, IAS 36 uses a one-step approach for both identifying and measuring impairments, which is based on comparing the carrying value to the recoverable amount. The recoverable amount is the higher of fair value less selling costs and value in use, which is based on discounted cash flows. This may result in impairments under IFRS where they do not exist under Canadian GAAP. | | In addition, under IAS 36 impairment losses recognized must be reversed if the circumstances leading to the impairment change and cause the impairment to be reduced. This is not permitted under Canadian GAAP. Employee Future Benefits IFRS 1 allows for an optional exemption on first-time adoption of IFRS to recognize all unamortized actuarial gains and losses immediately to retained earnings on transition date. Under IAS 19, the full amount of actuarial gains and losses are permitted to be adjusted directly to Other Comprehensive Income, as part of the shareholders’ equity, rather than recognized through the income statement over time. IAS 19 also requires vested past service costs associated with defined benefit plans to be expensed immediately. Canadian GAAP requires the amortization of past service costs on a straight-line basis over the average remaining service life of employees. International Financial Reporting Interpretations Committee (“IFRIC”) 14 limits the pension asset that may be recorded by an entity through an asset ceiling test and also requires adjustments to be made to the pension liability for minimum funding requirements. Accounting for Joint Arrangements Currently under Canadian GAAP, joint ventures are accounted for using the proportionate consolidation method. Although proportionate consolidation is currently permitted under IFRS, there is an expected change to IFRS that would only allow the equity method of accounting for jointly controlled entities. As a result, this would impact our current accounting treatment of proportionately consolidating Antamina. Foreign Exchange Under IFRS 1, a first-time adopter can elect to reset its cumulative translation account to zero on the transition date with the amount being adjusted to opening retained earnings. We plan to take this IFRS 1 election. Asset Retirement Obligations IFRS differs from Canadian GAAP both in the recognition and measurement of asset retirement obligations. The recognition criteria under IFRS are more encompassing through the inclusion of constructive obligations. Measurement differences relate to the nature of costs included in estimates of future cash flows to settle the obligation and the discount rate applied to future cash flows. Post-Implementation The post-implementation phase will involve continuous monitoring of changes in IFRS throughout the implementation process (through to 2011) and later as the Roadmap for US consideration for adopting IFRS is established. We note that the standard-setting bodies that determine Canadian GAAP and IFRS have significant ongoing projects that could impact the differences between Canadian GAAP and IFRS and their impact on our financial statements. In particular, we expect that there may be additional new or revised IFRS in relation to consolidation, joint ventures, financial instruments, hedge accounting, discontinued operations, leases and employee benefits. We also note that the International Accounting Standards Board is currently working on an extractive industries project, which could significantly impact our financial statements primarily in the area s of capitalization of exploration costs and disclosures. The IFRIC has added the topic of accounting for production stripping costs to its agenda for review, which may lead to the development of an IFRIC Interpretation that could impact our financial statements. We have processes in place to ensure that potential changes are monitored and evaluated. The impact of any new IFRS and IFRIC Interpretations will be evaluated as they are drafted and published. |
Teck 2009 Management’s Discussion and Analysis 29
Other Information
Outstanding Share Data
As at March 5, 2010, there were 579,936,150 Class B subordinate voting shares and 9,353,470 Class A common shares outstanding. In addition, there were 6,663,640 director and employee stock options outstanding with exercise prices ranging between $4.15 and $49.17 per share. More information on these instruments and the terms of their conversion are set out in the Shareholders’ Equity note to our 2009 consolidated financial statements.
Contractual and Other Obligations
| ($ in millions) | | Less Than 1 Year | | | 2-3 Years | | | 4-5 Years | | | More Than 5 Years | | | Total | |
| | | | | | | | | | | | | | | | |
| Debt (Note 1) | | $ | 1,694 | | | $ | 2,814 | | | $ | 2,342 | | | $ | 6,095 | | | $ | 12,945 | |
| Operating leases | | | 48 | | | | 42 | | | | 16 | | | | 29 | | | | 135 | |
| Capital leases | | | 46 | | | | 66 | | | | 11 | | | | – | | | | 123 | |
| Road and port lease at Red Dog (Note 2) | | | 19 | | | | 38 | | | | 38 | | | | 387 | | | | 482 | |
| Minimum purchase obligations (Note 3) | | | | | | | | | | | | | | | | | | | | |
| Concentrate, supply and other purchases | | | 187 | | | | 188 | | | | 102 | | | | 44 | | | | 521 | |
| Shipping and distribution | | | 24 | | | | 16 | | | | 8 | | | | 2 | | | | 50 | |
| Pension funding (Note 4) | | | 54 | | | | – | | | | – | | | | – | | | | 54 | |
| Other non-pension post-retirement benefits (Note 5) | | | 11 | | | | 23 | | | | 26 | | | | 251 | | | | 311 | |
| Asset retirement obligations (Note 6) | | | 23 | | | | 30 | | | | 8 | | | | 494 | | | | 555 | |
| Other long-term liabilities (Note 7) | | | 28 | | | | 30 | | | | 12 | | | | 54 | | | | 124 | |
| Contributions to the Fort Hills oil sands | | | | | | | | | | | | | | | | | | | | |
| project (Note 8) | | | 9 | | | | 1,317 | | | | – | | | | – | | | | 1,326 | |
| Contributions to Galore Creek (Note 9) | | | 14 | | | | 11 | | | | – | | | | – | | | | 25 | |
| | | $ | 2,157 | | | $ | 4,575 | | | $ | 2,563 | | | $ | 7,356 | | | $ | 16,651 | |
Notes:
(1) Subsequent to December 31, 2009, our estimated debt and interest repayments have been reduced by payments made with proceeds received from the sale of Waneta Dam, the Andacollo gold stream and other dispositions in early 2010 and other debt payments. As a result, revised debt and interest payments now total $11,062 million, comprised of $836 million for less than 1 year; $1,937 million for 2-3 years; $2,301 million for 4-5 years; and $5,988 million for more than 5 years.
(2) We lease road and port facilities from the Alaska Industrial Development and Export Authority through which we ship metal concentrates produced at the Red Dog mine. Minimum lease payments are US$18 million per annum and are subject to deferral and abatement for force majeure events.
(3) The majority of our minimum purchase obligations are subject to continuing operations and force majeure provisions.
(4) As at December 31, 2009, the company had a net pension deficit of $125 million based on actuarial estimates prepared on a going concern basis. The amount of minimum funding for 2010 in respect of defined benefit pension plans is $54 million. The timing and amount of additional funding after 2010 is dependent upon future returns on plan assets, discount rates, and other actuarial assumptions.
(5) We had a discounted, actuarially determined liability of $311 million in respect of other non-pension post-retirement benefits as at December 31, 2009. Amounts shown are estimated expenditures in the indicated years.
(6) We accrue environmental and reclamation obligations over the life of our mining operations and amounts shown are estimated expenditures in the indicated years at fair value, assuming a weighted average credit-adjusted risk-free discount rate of 6.33% and an inflation factor of 2.00%. The liability for retirement and remediation on an undiscounted basis before inflation is estimated to be approximately $872 million. In addition, for ongoing treatment and monitoring of sites, the estimated undiscounted payments before inflation are $2.1 million per annum for 2018 to 2029 and $13.9 million per annum for 2030 to 2109.
(7) Other long-term liabilities include amounts for post-closure, environmental costs and other items.
(8) In November 2005, we acquired a 15% interest in the Fort Hills Energy Limited Partnership (FHELP), which is developing the Fort Hills oil sands project in Alberta, Canada. In September 2007, we acquired an additional 5% interest, bringing our total interest to 20%. To earn our additional 5% interest, we are required to contribute 27.5% of $5 billion of project expenditures after project spending reaches $2.5 billion. We are presently funding at this level. Thereafter we are responsible for our 20% share of development costs. As the project is currently on hold pending cost re-evaluation, no additional commitments beyond our earn-in commitment are presently shown. In the event of project abandonment, as agreed to by the partners, monies held by the FHELP would be returned to the partners in their respective equity ra tios after having fulfilled all funding obligations to an aggregate of $7.5 billion.
(9) In February 2009, we amended certain provisions of the partnership agreement relating to the Galore Creek project. Under the amended agreement, our committed funding on Galore Creek has been reduced to $36 million at December 31, 2008. Our net remaining committed funding is $25 million, which we expect to pay in 2010 and 2011.
Teck 2009 Management’s Discussion and Analysis 30
Disclosure Controls and Internal Control over Financial Reporting Disclosure Controls and Procedures Disclosure controls and procedures are designed to provide reasonable assurance that material information is gathered and reported to senior management, including the Chief Executive Officer and Chief Financial Officer, as appropriate to permit timely decisions regarding public disclosure. Management, including the Chief Executive Officer and Chief Financial Officer, has evaluated the effectiveness of the design and operation of our disclosure controls and procedures, as defined in the rules of the US Securities and Exchange Commission and Canadian Securities Administration, as at December 31, 2009. Based on this evaluation, the Chief Executive Officer and Chief Financial Officer have concluded that our disclosure controls and procedures were effective to ensure that information required to be disclosed in reports filed or submitted by us under Uni ted States and Canadian securities legislation is recorded, processed, summarized and reported within the time periods specified in those rules. Management’s Report on Internal Control Over Financial Reporting Our management is responsible for establishing and maintaining adequate internal control over financial reporting. Any system of internal control over financial reporting, no matter how well designed, has inherent limitations. Therefore, even those systems determined to be effective can provide only reasonable assurance with respect to financial statement preparation and presentation. Management has used the Committee of Sponsoring Organizations of the Treadway Commission (COSO) framework to evaluate the effectiveness of our internal control over financial reporting. Based on this assessment, management has concluded that as at December 31, 2009, our internal control over financial reporting was effective. The effectiveness of our internal controls over financial reporting has been audited by PricewaterhouseCoopers LLP, an independent registered public accounting firm, who have expressed their opinion in their report included with our annual consolidated financial statements. Changes in Internal Control Over Financial Reporting There have been no significant changes in our internal control over financial reporting during the year ended December 31, 2009 that have materially affected, or are reasonably likely to materially affect, our internal control over financial reporting. | | Use of Non-GAAP Financial Measures Our financial statements are prepared in accordance with accounting principles generally accepted (GAAP) in Canada. This document refers to adjusted net earnings, comparative net earnings, EBITDA, operating profit and operating profit before depreciation and pricing adjustments, which are not measures recognized under GAAP in Canada or the United States and do not have a standardized meaning prescribed by GAAP. For adjusted net earnings and comparative net earnings, we adjust net earnings as reported to remove the effect of certain kinds of transactions included in these measures. EBITDA is net income before interest and financing expenses, income taxes, depreciation and amortization. Operating profit is revenues less operating expenses and depreciation and amortization. Operating profit before depreciation and pricing adjustments is operating prof it with depreciation, amortization and pricing adjustments added or deducted as appropriate. Pricing adjustments are described under the heading “Average Commodity Prices and Exchange Rates”. These measures may differ from those used by, and may not be comparable to such measures as reported by, other issuers. We disclose these measures, which have been derived from our financial statements and applied on a consistent basis, because we believe they are of assistance in understanding the results of our operations and financial position and are meant to provide further information about our financial results to shareholders. |
Teck 2009 Management’s Discussion and Analysis 31
Caution on Forward-Looking Information
This document contains certain forward-looking information and forward-looking statements as defined in applicable securities laws. These forward-looking statements, principally under the heading “Outlook,” but also elsewhere in this document, include estimates, forecasts, and statements as to management’s expectations with respect to, among other things, our future earnings and cash flow, our plans for our oil sands investments and our copper and other development projects, forecast production, costs and the resolution of geotechnical issues at Highland Valley Copper, expected progress and costs of our Antamina expansion project, our expectations for commissioning and ramp-up of our Carmen de Andacollo concentrate project, the sensitivity of our earnings to changes in commodity prices and exchange rates, the potential impact o f transportation and other potential production disruptions, the impact of currency exchange rates, future trends for the company, progress in development of mineral properties, future production and sales volumes, capital expenditures and mine production costs, demand and market outlook for commodities, future commodity prices and treatment and refining charges, the settlement of coal contracts with customers, access to and treatment and disposal of process water at our operations, the outcome of mine permitting currently underway, particularly our ability to obtain the permits necessary for the development at the Aqqaluk deposit at our Red Dog mine and the risk of the stay of a critical permit as a result of an appeal, and the outcome of legal proceedings involving the company. Reserve and resource estimates and mine life estimates are forward-looking statements. These forward-looking statements involve numerous assumptions, risks and uncertainties and actual results may vary materially.
These statements are based on a number of assumptions, including, but not limited to, assumptions regarding general business and economic conditions, interest rates, the supply and demand for, deliveries of, and the level and volatility of prices of, zinc, copper and coal and other primary metals and minerals as well as oil, and related products, the timing of the receipt of regulatory and governmental approvals for our development projects and other operations, our costs of production and production and productivity levels, as well as those of our competitors, power prices, market competition, the accuracy of our reserve estimates (including with respect to size, grade and recoverability) and the geological, operational and price assumptions on which these are based, conditions in financial markets and the future financial performance of the co mpany. The foregoing list of assumptions is not exhaustive. Events or circumstances could cause actual results to vary materially.
Statements concerning future production costs or volumes, and the sensitivity of the company’s earnings to changes in commodity prices and exchange rates are based on numerous assumptions of management regarding operating matters and on assumptions that demand for products develops as anticipated, that customers and other counterparties perform their contractual obligations, that operating and capital plans will not be disrupted by issues such as mechanical failure, unavailability of parts and supplies, labour disturbances, interruption in transportation or utilities, adverse weather conditions, and that there are no material unanticipated variations in the cost of energy or supplies.
Factors that may cause actual results to vary materially include, but are not limited to, changes in commodity and power prices, changes in interest and currency exchange rates, acts of foreign governments and the outcome of legal proceedings, inaccurate geological and metallurgical assumptions (including with respect to the size, grade and recoverability of mineral reserves and resources), unanticipated operational difficulties (including failure of plant, equipment or processes to operate in accordance with specifications or expectations, cost escalation, unavailability of materials and equipment, government action or delays in the receipt of government approvals, industrial disturbances or other job action, adverse weather conditions and unanticipated events related to health, safety and environmental matters), political risk, social unrest, failure of customers or counterparties to perform their contractual obligations, changes in our credit ratings, and changes or further deterioration in general economic conditions.
We assume no obligation to update forward-looking statements except as required under securities laws. Further information concerning risks and uncertainties associated with these forward looking statements and our business can be found in our most recent Annual Information Form, filed on SEDAR and on EDGAR under cover of Form 40F.
Teck 2009 Management’s Discussion and Analysis 32