Management’s Discussion and Analysis
Our business is exploring for, acquiring, developing and producing natural resources. We are organized into business units focused on copper, steelmaking coal, zinc and energy. These are supported by our corporate business unit, which manages our corporate growth initiatives and provides administrative, technical, financial and other functions.
Through our interests in mining and processing operations in Canada, the United States, Chile and Peru, we are the world’s second-largest exporter of seaborne high-quality steelmaking coal, an important producer of copper and one of the world’s largest zinc producers. We also produce lead, molybdenum, silver, and various specialty and other metals, chemicals and fertilizers. In addition, we own a 20% interest in the Fort Hills oil sands project, a 100% interest in the Frontier oil sands project and a 50% interest in Lease 421 in the Athabasca region of Alberta. We also actively explore for copper, zinc and gold.
This Management’s Discussion and Analysis of our results of operations is prepared as at February 20, 2013 and should be read in conjunction with our audited consolidated financial statements as at and for the year ended December 31, 2012. Unless the context otherwise dictates, a reference to Teck, Teck Resources, the Company, us, we, or our refers to Teck Resources Limited and its subsidiaries including Teck Metals Limited and Teck Coal Partnership. All dollar amounts are in Canadian dollars, unless otherwise specified, and are based on our consolidated financial statements that are prepared in accordance with International Financial Reporting Standards (IFRS). In addition, we use certain non-GAAP financial measures, which are explained and reconciled throughout the Management’s Discussion and Analysis in this report. Certain comparative amounts have been reclassified to conform to the presentation adopted for 2012.
This Management’s Discussion and Analysis contains certain forward-looking information and forward-looking statements. You should review the cautionary statement on forward-looking information under the caption “Caution on Forward-Looking Information” on page 42, which forms part of this Management’s Discussion and Analysis.
Additional information about us, including our most recent Annual Information Form, is available on the Canadian Securities Administrators website at www.sedar.com (SEDAR) and on the EDGAR section of the United States Securities and Exchange Commission (SEC) website at www.sec.gov.
| Teck 2012 Management’s Discussion and Analysis | 2 |
Business Unit Results
The table below shows our share of production of our major commodities for the last five years and expected production for 2013.
Five-Year Production Record and Our Expected Share of Production in 2013
| | | Units | | | | | | | | | | | | | | | | | | (Note 4) | |
| | | | (000’s) | | | | 2008 | | | | 2009 | | | | 2010 | | | | 2011 | | | | 2012 | | | 2013 estimate | |
| | | | | | | | | | | | | | | | | | | | | | | | | | | | |
| Principal Products | | | | | | | | | | | | | | | | | | | | | | | | | | | |
| Copper (Notes 1 and 3) | | | | | | | | | | | | | | | | | | | | | | | | | | | |
| Contained in concentrate | | tonnes | | | | 209 | | | | 203 | | | | 216 | | | | 251 | | | | 307 | | | | 290 | |
| Cathodes | | tonnes | | | | 107 | | | | 105 | | | | 97 | | | | 70 | | | | 66 | | | | 60 | |
| | | | | | | | 316 | | | | 308 | | | | 313 | | | | 321 | | | | 373 | | | | 350 | |
| | | | | | | | | | | | | | | | | | | | | | | | | | | | | |
| Steelmaking coal (Note 2) | | tonnes | | | | 13,627 | | | | 18,930 | | | | 23,109 | | | | 22,785 | | | | 24,652 | | | | 24,500 | |
| | | | | | | | | | | | | | | | | | | | | | | | | | | | | |
Zinc | | | | | | | | | | | | | | | | | | | | | | | | | | | | |
Contained in concentrate | | tonnes | | | | 663 | | | | 711 | | | | 645 | | | | 646 | | | | 598 | | | | 575 | |
| Refined | | tonnes | | | | 270 | | | | 240 | | | | 278 | | | | 291 | | | | 284 | | | | 285 | |
| | | | | | | | | | | | | | | | | | | | | | | | | | | | | |
| Other Products | | | | | | | | | | | | | | | | | | | | | | | | | | | | |
Lead | | | | | | | | | | | | | | | | | | | | | | | | | | | | |
Contained in concentrate | | tonnes | | | | 133 | | | | 132 | | | | 110 | | | | 84 | | | | 95 | | | | 85 | |
| Refined | | tonnes | | | | 85 | | | | 73 | | | | 72 | | | | 86 | | | | 88 | | | | 85 | |
| | | | | | | | | | | | | | | | | | | | | | | | | | | | | |
Molybdenum contained in concentrate | | pounds | | | | 7,224 | | | | 7,798 | | | | 8,557 | | | | 10,983 | | | | 12,692 | | | | 8,000 | |
Notes to five-year production record and 2013 estimate:
| (1) | We include 100% of the production and sales from our Highland Valley Copper, Quebrada Blanca and Carmen de Andacollo mines in our production and sales volumes, even though we own 97.5%, 76.5% and 90%, respectively, of these operations, because we fully consolidate their results in our financial statements. We include 22.5% of production and sales from Antamina, representing our proportionate equity interest in Antamina. |
| (2) | Coal production in 2008 includes our 40% share of production from the Teck Coal Partnership and 2.345 million tonnes being our indirect share of production from our 19.95% investment in units of Fording. |
| (3) | Includes pre-commercial production from Carmen de Andacollo prior to September 30, 2010. Production of copper contained in concentrate during the pre-commercial start-up period in the nine months ended September 30, 2010 was 20,700 tonnes. |
| (4) | Production estimate for 2013 represents the mid-range of our production plan. |
Average commodity prices and exchange rates for the past three years, which are key drivers of our profit, are summarized in the following table.
| | | US$ | | | Cdn$ | |
| | | 2012 | | | % chg | | | 2011 | | | % chg | | | 2010 | | | 2012 | | | % chg | | | 2011 | | | % chg | | | 2010 | |
| | | | | | | | | | | | | | | | | | | | | | | | | | | | | | | |
| Copper (LME cash – $/pound) | | | 3.61 | | | | -10 | % | | | 4.00 | | | | +17 | % | | | 3.42 | | | | 3.61 | | | | -9 | % | | | 3.96 | | | | +13 | % | | | 3.52 | |
| Coal (realized – $/tonne) | | | 193 | | | | -25 | % | | | 257 | | | | +42 | % | | | 181 | | | | 194 | | | | -24 | % | | | 254 | | | | +35 | % | | | 188 | |
| Zinc (LME cash – $/pound) | | | 0.88 | | | | -11 | % | | | 0.99 | | | | +1 | % | | | 0.98 | | | | 0.88 | | | | -10 | % | | | 0.98 | | | | -3 | % | | | 1.01 | |
| Molybdenum (Platts* – $/pound) | | | 13 | | | | -13 | % | | | 15 | | | | -6 | % | | | 16 | | | | 13 | | | | -13 | % | | | 15 | | | | -6 | % | | | 16 | |
| Lead (LME cash – $/pound) | | | 0.94 | | | | -14 | % | | | 1.09 | | | | +12 | % | | | 0.97 | | | | 0.94 | | | | -13 | % | | | 1.08 | | | | +8 | % | | | 1.00 | |
| Exchange rate (Bank of Canada) | | | | | | | | | | | | | | | | | | | | | | | | | | | | | | | | | | | | | | | | |
US$1 = Cdn$ | | | 1.00 | | | | +1 | % | | | 0.99 | | | | -4 | % | | | 1.03 | | | | | | | | | | | | | | | | | | | | | |
Cdn$1 = US$ | | | 1.00 | | | | -1 | % | | | 1.01 | | | | +4 | % | | | 0.97 | | | | | | | | | | | | | | | | | | | | | |
*Published major supplier selling price in Platts Metals Week.
| Teck 2012 Management’s Discussion and Analysis | 3 |
Our revenue and gross profit before depreciation and amortization by business unit are summarized in the following table.
| | | Revenues | | | Gross Profit Before Depreciation and Amortization* | |
| ($ in millions) | | 2012 | | | 2011 | | | 2010 | | | 2012 | | | 2011 | | | 2010 | |
| | | | | | | | | | | | | | | | | | | |
| Copper | | $ | 3,142 | | | $ | 3,108 | | | $ | 2,509 | | | $ | 1,500 | | | $ | 1,674 | | | $ | 1,462 | |
| Coal | | | 4,647 | | | | 5,641 | | | | 4,351 | | | | 2,033 | | | | 3,306 | | | | 2,261 | |
| Zinc | | | 2,550 | | | | 2,765 | | | | 2,363 | | | | 480 | | | | 808 | | | | 715 | |
| Energy | | | 4 | | | | – | | | | – | | | | 4 | | | | – | | | | – | |
| Total | | $ | 10,343 | | | $ | 11,514 | | | $ | 9,223 | | | $ | 4,017 | | | $ | 5,788 | | | $ | 4,438 | |
*Gross profit before depreciation and amortization is a non-GAAP financial measure. See “Use of Non-GAAP Financial Measures” section for further information.
| Teck 2012 Management’s Discussion and Analysis | 4 |
Copper
In 2012, we produced a record 373,100 tonnes of copper from Antamina in Peru, Quebrada Blanca and Carmen de Andacollo in Chile, Highland Valley Copper in British Columbia (B.C.) and Duck Pond in Newfoundland. We achieved a key milestone in 2012 with the completion of the Antamina mine expansion. The mill modernization project at Highland Valley Copper also progressed, with concrete work well advanced, and steel erection and major equipment installation started. New collective labour agreements were achieved at Carmen de Andacollo, Quebrada Blanca and Antamina. We also completed a feasibility study on our Quebrada Blanca Phase 2 hypogene project and are actively working towards re-filing the Social Environmental Impact Assessment (SEIA). We estimate copper production will be in the range of 340,000 to 360,000 tonnes in 2013. Production is expected to be lower than 2012 due mainly to declining production from Quebrada Blanca’s leach operations as it nears the end of its productive life and lower head grades at Highland Valley Copper.
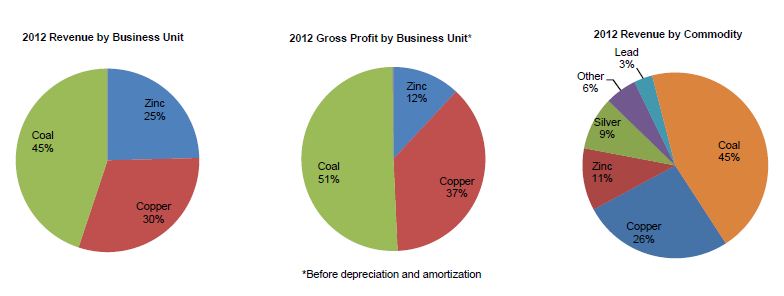
In 2012, our copper operations accounted for 30% of our revenue and 37% of our gross profit before depreciation and amortization.
| | | Revenues | | | Gross Profit Before Depreciation and Amortization | |
| ($ in millions) | | 2012 | | | 2011 | | | 2010 | | | 2012 | | | 2011 | | | 2010 | |
| | | | | | | | | | | | | | | | | | | |
| Highland Valley Copper | | $ | 1,012 | | | $ | 997 | | | $ | 828 | | | $ | 513 | | | $ | 486 | | | $ | 487 | |
| Antamina | | | 897 | | | | 799 | | | | 641 | | | | 633 | | | | 588 | | | | 420 | |
| Quebrada Blanca | | | 499 | | | | 562 | | | | 697 | | | | 82 | | | | 255 | | | | 406 | |
| Carmen de Andacollo | | | 597 | | | | 608 | | | | 208 | | | | 225 | | | | 288 | | | | 91 | |
| Duck Pond | | | 130 | | | | 142 | | | | 135 | | | | 42 | | | | 57 | | | | 58 | |
| Other | | | 7 | | | | – | | | | – | | | | 5 | | | | – | | | | – | |
| Total | | $ | 3,142 | | | $ | 3,108 | | | $ | 2,509 | | | $ | 1,500 | | | $ | 1,674 | | | $ | 1,462 | |
| | | Production | | | Sales | |
| (000’s tonnes) | | 2012 | | | 2011 | | | 2010 | | | 2012 | | | 2011 | | | 2010 | |
| | | | | | | | | | | | | | | | | | | |
| Highland Valley Copper | | | 116 | | | | 97 | | | | 99 | | | | 117 | | | | 104 | | | | 98 | |
| Antamina | | | 101 | | | | 75 | | | | 68 | | | | 101 | | | | 76 | | | | 65 | |
| Quebrada Blanca | | | 62 | | | | 64 | | | | 86 | | | | 62 | | | | 64 | | | | 90 | |
| Carmen de Andacollo | | | 80 | | | | 72 | | | | 45 | | | | 74 | | | | 69 | | | | 42 | |
| Duck Pond | | | 14 | | | | 13 | | | | 15 | | | | 15 | | | | 13 | | | | 15 | |
| Total | | | 373 | | | | 321 | | | | 313 | | | | 369 | | | | 326 | | | | 310 | |
Operations
Highland Valley Copper
We have a 97.5% interest in Highland Valley Copper, located in south-central B.C. Gross profit before depreciation and amortization was $513 million in 2012, compared to $486 million in 2011 and $487 million in 2010. Gross profit increased in 2012 due to a 20% increase in production and the resulting 13% increase in sales volumes, partially offset by lower copper prices. Highland Valley Copper’s 2012 copper production was 116,300 tonnes of copper in concentrate, significantly higher than last year, primarily due to higher mill throughput and higher grades. Molybdenum production was 27% higher than 2011 levels at 10.0 million pounds, due to improved throughput and higher feed grades.
| Teck 2012 Management’s Discussion and Analysis | 5 |
Ore is mined from the Valley, Lornex and Highmont pits. The waste stripping and buttress placement project completed in 2011 on the east wall of the Valley pit enabled higher grade ore to be mined. Mine activities in 2013 are focused on production from the Valley pit and continuing the pre-stripping program for the Lornex pit extension.
The mill modernization project progressed in 2012. The project includes the construction of new flotation and pebble-crushing capacity adjacent to the existing circuits, which should increase plant availability and increase copper recovery by 2%, molybdenum recovery by 3% and annual mill throughput by 10% over the remaining life of the mine. The project is scheduled for completion in the fourth quarter of 2013. The mill modernization project is not based on a technical report filed under National Instrument 43-101.
The continued growth of the mineral resource base at Highland Valley reflects the longer term development potential of the deposits. During the last year, measured and indicated resources increased by 48% to 907 million tonnes and inferred resources increased 63% to 519 million tonnes as of December 31, 2012. Additional drilling and engineering studies are planned in 2013, including a major 90,000-metre drill program focused on the Valley and previously active Bethlehem pits.
Highland Valley Copper’s production in 2013 is expected to be in the range of 100,000 to 110,000 tonnes of copper. Molybdenum production in 2013 is expected to be 5.0 million pounds contained in concentrate.
After completion of the mill modernization project, Highland Valley Copper is expected to produce between 100,000 and 150,000 tonnes of copper per year, depending on ore grades and hardness, for an average of 125,000 tonnes per year, over the current mine life through 2027.
Antamina
We have a 22.5% share interest in Antamina, a copper and zinc mine in Peru. The other shareholders are BHP Billiton (33.75%), Xstrata plc (33.75%) and Mitsubishi Corporation (10%). In 2012, our share of gross profit before depreciation and amortization was $633 million, compared with $588 million in 2011 and $420 million in 2010. A mill expansion project completed in 2012 increased ore throughput to 130,000 tonnes per day. Further optimization efforts are underway to fully utilize the installed SAG mill capacity. Increased gross profit in 2012 was due to significantly higher copper production and sales volumes, as the benefits of the expansion project were realized, partially offset by lower copper and zinc prices.
Copper production in 2012 was 446,800 tonnes, 34% higher than in 2011. This was primarily due to the benefits of the expansion project and record mill throughput of 46.5 million tonnes in 2012, a 24% increase from the previous year. Zinc production decreased by 7% to 219,000 tonnes in 2012, primarily due to lower zinc grades. Molybdenum production totalled 12.1 million pounds, which was lower than in 2011, due to lower molybdenum grades and recoveries.
Our 22.5% share of Antamina’s 2013 production is expected to be in the range of 90,000 to 100,000 tonnes of copper, 45,000 to 50,000 tonnes of zinc and 2.8 million pounds of molybdenum in concentrate.
Quebrada Blanca
Quebrada Blanca is located in northern Chile, 240 kilometres southeast of the city of Iquique. We own a 76.5% share interest of Quebrada Blanca; the other shareholders are Inversiones Mineras S.A. (13.5%) and Empresa Nacional de Minería (ENAMI) (10%). The operation mines ore from an open pit and leaches the ore to produce copper cathodes via a conventional solvent extraction and electrowinning (SX-EW) process. Gross profit before depreciation and amortization was $82 million in 2012, compared with $255 million in
| Teck 2012 Management’s Discussion and Analysis | 6 |
2011 and $406 million in 2010. Gross profit was lower in 2012, due to substantially higher operating costs and lower copper prices.
In 2012, Quebrada Blanca produced 62,400 tonnes of copper cathode, compared to 63,400 tonnes in 2011. The operation continued to experience operating difficulties due to severe weather conditions, maintenance requirements for aging plant equipment and the transition towards more dump leach production.
A restructuring plan was announced in the fourth quarter of 2012 in response to increasing operating costs — the result of lower copper grades and reduced reserves of the supergene, as well as other operational-related challenges. The restructuring plan is expected to reduce operating costs in an effort to sustain the operation while the Quebrada Blanca Phase 2 project is developed.
Production of approximately 50,000 to 60,000 tonnes of copper cathode is expected in 2013.
Quebrada Blanca’s supergene orebody is expected to be mined out by 2017, but residual copper cathode production is expected to continue, at declining production rates, through 2018.
In 2012, we completed the feasibility study for the Quebrada Blanca Phase 2 project. The study estimates a capital cost for the development of the project of US$5.6 billion on a 100% basis (in January 2012 dollars, not including working capital or interest during construction), of which our funding share would be $4.8 billion. The study contemplates the construction of a 135,000-tonne-per-day concentrator and related facilities connected to a new port facility by 165-kilometre concentrate and desalinated water pipelines.
As part of the project work plan for 2012, the Social Environmental Impact Assessment (SEIA) for the project was submitted to the Chilean regulatory authorities during the second quarter. This was subsequently voluntarily withdrawn in order to prepare responses to the comments and questions from the Chilean authorities, and to collect and analyze some additional baseline environmental data. It is anticipated that the SEIA will be re-filed by the end of the second quarter of 2013.
Discussions are ongoing with the other shareholders of Quebrada Blanca concerning financing options for the project, which may include limited recourse project financing and, possibly, bringing in a new funding partner.
Carmen de Andacollo
We have a 90% share interest in the Carmen de Andacollo mine in Chile, which is located 350 kilometres north of Santiago. The remaining 10% is owned by ENAMI. Copper and gold in concentrate and copper cathode are produced from the mine. Gross profit before depreciation and amortization was $225 million in 2012, compared with $288 million in 2011, and $91 million in 2010. Gross profit was lower in 2012, due to lower copper prices and higher operating costs, partially offset by higher copper production.
Carmen de Andacollo produced 75,800 tonnes of copper contained in concentrate in 2012, compared with 66,100 tonnes in 2011. Copper cathode production was 4,000 tonnes in 2012, compared with 6,300 tonnes in 2011.
A 20,000 tonnes per day pre-crushing plant that was commissioned during the third quarter of 2012 was primarily responsible for the increase in concentrator throughput.
We expect 2013 production to be 70,000 to 80,000 tonnes of copper in concentrate as well as 5,000 tonnes
| Teck 2012 Management’s Discussion and Analysis | 7 |
of copper cathode.
Duck Pond
We own 100% of the Duck Pond underground copper-zinc mine located in central Newfoundland. Duck Pond’s gross profit before depreciation and amortization was $42 million in 2012, compared to $57 million in 2011 and $58 million in 2010. Gross profit declined in 2012, primarily due to lower metal prices.
Copper production in 2012 was 14,100 tonnes and zinc production was 19,500 tonnes. This compares with copper production of 13,200 tonnes and 21,300 tonnes of zinc production in 2011.
The Boundary open pit is currently in development and will provide a supplemental feed source starting in the second half of 2013 as underground reserves become depleted. The current mine life extends to early 2015 and we are working to extend the life of the mine. Duck Pond’s production in 2013 is expected to be approximately 14,000 to 16,000 tonnes of copper and between 12,000 and 16,000 tonnes of zinc.
Relincho (100% owned)
Relincho, a major greenfields copper project, is located in central Chile, approximately 110 kilometres east of the port city of Huasco at an altitude of 2,200 metres above sea level. Permitting delays have affected the progress of third-party port and power supply facilities that we had expected to use for Relincho and will delay the completion of the feasibility study, which is now expected to be complete at the end of the fourth quarter of 2013. Exploration and geotechnical drilling are ongoing, and a new resource and reserve estimate is expected at the completion of the feasibility study. Based on the prefeasibility study, copper production would average 195,000 tonnes per year in the first five years of full production and 180,000 tonnes per year over the initial 22-year mine life. In addition, 6,000 tonnes per year of molybdenum could be produced as a byproduct over the life of the mine.
Galore Creek (50% owned)
The Galore Creek project is located in northwest B.C. In 2012, a work program including approximately 25,000 metres of infill and geotechnical drilling was completed. An additional 10,000- to 12,000-metre exploration drill program is planned in 2013.
Mesaba (100% owned)
Work on an advanced scoping study at the Mesaba copper-nickel project in northern Minnesota was completed in 2012. Further optimization studies will be conducted in 2013, including some metallurgical and infill drilling.
CESL Limited (CESL)
Located in Richmond, B.C., CESL focuses on advancing and commercializing our proprietary hydrometallurgical technology. We have a well-tested suite of technologies suitable for treating complex copper, copper-gold, copper-nickel and nickel concentrates, particularly those with deleterious elements such as arsenic or magnesium, which inhibit the sale of concentrates to conventional smelters. In 2013, the CESL team will continue to pursue opportunities to unlock metallurgically challenged resources to create additional value by employing the CESL process.
Markets
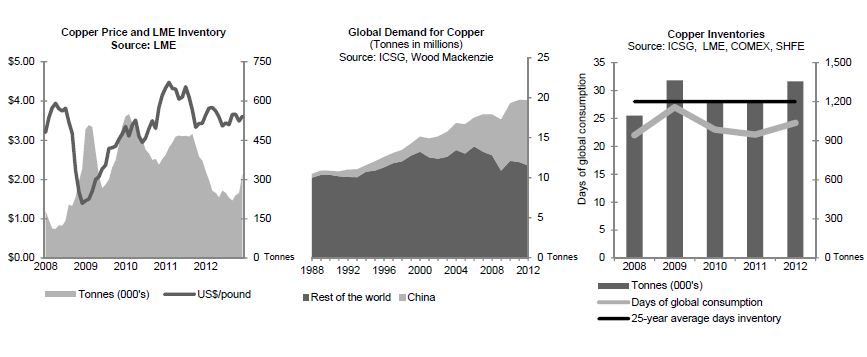
Copper prices on the London Metal Exchange (LME) averaged US$3.61 per pound in 2012, down US$0.39 per pound from the 2011 average.
| Teck 2012 Management’s Discussion and Analysis | 8 |
Demand for copper metal grew by 2.1% in 2012 to reach an estimated 19.7 million tonnes globally. Growth outside of China remained relatively subdued, with improved growth in North America offset by continued weakness in Europe. Growth in real demand in China, estimated at between 5% and 6%, was also weaker than in prior years, despite an increase in refined copper imports into China.
In 2012, global copper production increased 2.2% to reach just over 20 million tonnes for the year. Copper scrap availability remained tight for most of 2012, with Chinese imports up 3.8% over the previous year. We expect that scrap will again play an important part of the supply picture in 2013.
Copper stocks in the LME, Shanghai and COMEX warehouses increased 8% or 45,000 tonnes during the year. Total reported global stocks (which include producer, consumer, merchant and terminal stocks) stood at an estimated 24 days of global consumption versus the 25-year average of 28 days of global consumption.
Production disruptions continued to affect the market in 2012, with estimates of close to 0.9 million tonnes of planned production lost during the year. Total copper mine production increased by only 3.8% in 2012, which was well below the estimated 10.1% increase projected at the beginning of the year. Wood Mackenzie, a commodity research consultancy, is expecting a 12% increase in global mine production in 2013 as new mining projects begin to ramp up; at the same time, Wood Mackenzie is also expecting an 11% increase in smelter production. Based on a history of industry production shortfalls over the past eight years combined with the continuing difficulties in bringing new production to market on time, we continue to expect unplanned production disruptions through 2013. We therefore expect smelter capacity utilization to remain under pressure in 2013, with the concentrate market remaining in deficit.
With global copper metal demand projected by Wood Mackenzie to increase by 5.0% in 2013, projected supply is expected to exceed demand slightly, moving the refined market into balance. If mine production continues to disappoint in 2013 from current projections, the refined market could again slip into deficit in 2013.
| Teck 2012 Management’s Discussion and Analysis | 9 |
Coal
In 2012, we produced 24.7 million tonnes of steelmaking coal, the majority of which was shipped to the Asia-Pacific region. Our proven and probable reserves of more than 1 billion tonnes of coal position us to continue to meet global demand. In addition, our measured and indicated resources now total over 3.6 billion tonnes and our inferred resources over 2 billion tonnes of raw coal.
Our current production capacity is approximately 27 million tonnes and is expected to grow to 28 million tonnes by the end of 2013. However, to align production rates with anticipated demand and to effectively manage inventories, we plan to produce 24.0 to 25.0 million tonnes of coal in 2013.
With current expansion plans underway at our six producing mines and the potential restart of our Quintette mine, we expect to reach an annualized production rate above 30 million tonnes of coal per year by the end of 2014, subject to permitting and customer demand.
In 2012, our coal business unit accounted for 45% of revenue and 51% of gross profit before depreciation and amortization.
| ($ in millions) | | 2012 | | | 2011 | | | 2010 | |
| | | | | | | | | | |
| Revenues | | $ | 4,647 | | | $ | 5,641 | | | $ | 4,351 | |
| Gross profit before depreciation and amortization | | $ | 2,033 | | | $ | 3,306 | | | $ | 2,261 | |
| | | | | | | | | | | | | |
| Production (000’s tonnes) | | | 24,652 | | | | 22,785 | | | | 23,109 | |
| Sales (000’s tonnes) | | | 23,989 | | | | 22,207 | | | | 23,167 | |
Operations
Decreased gross profit before depreciation and amortization primarily reflects significantly lower coal prices, partially offset by higher production and sales volumes. The average realized selling price in 2012 decreased to US$193 per tonne, compared with US$257 per tonne in 2011 and US$181 per tonne in 2010.
Gross profit declined in 2012, due primarily to lower coal prices and higher transportation costs. Transportation unit cost increases resulted from lower than planned shipping volumes, the use of additional terminals to supplement capacity during outages resulting from expansion programs or incidents at our traditional terminals, as well as from inflation and annual contractual rate adjustments with our rail and port service providers and higher than normal proportion of coal sold inclusive of ocean freight. These costs were partially offset by higher sales volumes and lower mine operating unit costs, which resulted from a successful cost reduction program initiated at all coal mines in August 2012.
Coal sales volumes of 24.0 million tonnes increased 8% from 2011.
Our 2012 production of 24.7 million tonnes increased from 2011 and was at the low end of our 2012 guidance. This was due largely to weak market conditions during the year, which led to our decision in mid-August to reduce production in response to declining demand. The labour disruption at Canadian Pacific Railway (CP Rail) in 2012 also affected production.
| Teck 2012 Management’s Discussion and Analysis | 10 |
Our investments in mobile equipment, plant capacity and staffing have significantly increased our capacity to move waste, and to mine and process raw coal. During 2012, we increased our haul truck fleet size by nine units and our shovel fleet by one unit. In addition, we replaced 30 existing haul trucks and one existing shovel. All of this new equipment is state-of-the-art and large capacity, which increases the overall productivity and efficiency of our mobile equipment fleets. The expansion of the processing plant at Elkview was completed, and the Greenhills plant reached its full upgrade capacity after the 2011 expansion.
Capital spending in 2012 of $641 million included additional equipment, processing plant upgrades and new pit developments, as well as approximately $120 million for the Quintette project.
Selenium Management
Work is ongoing to develop and implement a plan for the management of selenium at all of our operating coal mines in the Elk Valley. In the course of mining, we deposit large quantities of waste rock in the valley. Water flows through that waste rock and over rock exposed during the mining process, releasing small quantities of selenium, a naturally occurring element found in the native rocks in the Elk Valley. While it is necessary for good health in humans, selenium is detrimental to fish populations at relatively low concentrations. We have commissioned extensive studies into the environmental effects of selenium. These studies have not identified population level effects on fish in the Elk Valley, but they have identified a trend of increasing selenium concentrations in the valley which is expected, in the absence of mitigation measures, to increase further as future mine expansions increase the footprint of our operations. As a result, we have devoted substantial resources to developing and implementing mitigation measures, which include water diversion works to keep clean water clean, as well as treatment facilities to remove selenium from waters affected by contact with waste rock.
Because of the scale of our operations, the substantial quantities of water involved, and the very low concentrations of selenium, identifying and implementing appropriate treatment technology is a challenge. We filed with regulatory authorities a draft valley-wide selenium management plan in the first quarter of 2013. This plan sets out an integrated approach to the construction of water diversion and treatment facilities intended to achieve acceptable selenium concentrations downstream from our mining operations. Although the plan is not yet finalized, we believe that the costs associated with installing these facilities will be substantial. Our draft plan contemplates total capital spending over the next five years of up to $600 million on the installation of water diversion and treatment facilities, much of which would be covered within our long-term average sustaining capital budget. Annual operating costs by the end of the five years are expected to be approximately $40 million per year, or less than $1.50 per tonne of coal produced. Water treatment costs are expected to increase further in future periods, as additional treatment facilities are required to manage runoff from new mining areas. While the amount of those costs will depend on the technology applied to control selenium, our current estimate, assuming no substantive changes in technology, is that by 2025 treatment costs could ultimately reach $140 million per year, or approximately $6 per tonne of coal produced. We expect that water treatment will need to continue for an indefinite period after mining operations end in order to maintain water quality.
These cost estimates assume the application of biological treatment technology, which is currently being installed in the water treatment plant under construction at our Line Creek mine. We are actively investigating alternative treatment technologies with the potential to substantially reduce treatment costs. Our draft valley-wide selenium management plan also assumes that relevant regulators will agree to site-specific downstream selenium concentrations in certain aquatic environments already affected by selenium discharges from our coal mining operations in excess of those in provincial water quality guidelines. The modelling on which our valley-wide selenium management plan is based indicates that the selenium levels
| Teck 2012 Management’s Discussion and Analysis | 11 |
we are proposing for the upper Elk and Fording rivers will result in selenium levels further downstream, including at Lake Koocanusa at the U.S. border, that comply with provincial water quality guidelines and applicable limits on selenium concentrations prescribed by the U.S. Environmental Protection Agency (EPA).
While we believe that there is good scientific evidence that the measures that we will propose are protective of the environment and of fish populations in the affected water bodies, and that these measures will meet our previously stated objective of reversing the trend of increasing selenium concentrations in the Elk Valley, there can be no assurance that regulatory authorities will not ultimately impose more stringent limits on selenium discharges, which could substantially increase both capital and operating costs associated with selenium management.
We expect that permitting for current and future projects may be delayed until regulatory authorities have accepted the valley-wide selenium management plan and are able to assess the cumulative effects of new projects in the context of the selenium management plan for the valley as a whole. There can be no assurance that delays in obtaining approval of our valley-wide selenium management plan will not result in consequential delays in permitting new mining areas, which would limit our ability to maintain or increase coal production in accordance with our long-term plans. The potential shortfall in production may be material.
We are continuing with research and development aimed at identifying new and more cost-effective treatment technologies and are reviewing mining plans with a view to reducing the water treatment capacity required to manage selenium and the associated costs.
Quintette Project
Our Quintette mine in northeast B.C. is progressing towards a potential start-up in 2014. In the third quarter of 2012 we completed the feasibility study for reopening the Quintette mine, which has been closed since 2000. The feasibility study estimates the capital cost to reopen Quintette at $858 million, not including escalation or interest during construction. The study contemplates an average clean coal production rate of 3.5 million tonnes per year over the estimated 12-year life of Quintette. A Mines Act Permit Amendment application was submitted in 2012 and we expect to receive the permit approval in the first half of 2013. First coal production is now expected in the first half of 2014 and by the end of 2014 Quintette is expected to be producing at an annualized rate of 3 million tonnes.
Rail
Rail transportation from our five mines in southeast B.C. for seaborne export is now provided under a 10-year agreement with CP Rail that commenced in April 2011. This agreement provides us with access to increased rail capacity to support our ongoing coal expansion and includes a commitment by CP Rail to invest capital to increase its capacity to transport coal. CP Rail’s investment in its network resulted in added capacity throughout 2012, with siding and loadout extensions carried out so that all Teck trains are now running at 152 cars in length, compared with an average of 126 cars in length prior to the investment, allowing more coal to be transported with fewer trains.
Port
A number of key initiatives have been undertaken to ensure that we have access to terminal loading capacity in excess of our planned shipments. Neptune Bulk Terminals, in which we have a 46% ownership interest, is expanding its annual coal throughput capacity from 9 million tonnes to 12.5 million tonnes in the spring of 2013 with the addition of a new stacker reclaimer. The feasibility study for the next expansion phase, to increase capacity from 12.5 million tonnes to 18.5 million tonnes, was completed in the fourth quarter of 2012 and detailed engineering will be carried out in 2013.
| Teck 2012 Management’s Discussion and Analysis | 12 |
In addition, in the fourth quarter of 2012 Westshore Terminals (Westshore) completed the installation of a second double railcar dumper, which completes the majority of the work required for the planned expansion of their capacity to 33 million tonnes per year. Teck’s contract with Westshore, which was extended by five years in 2012, increases to 19 million tonnes annually from April 2014 where it remains over its nine-year term through March 2021. Finally, in November of 2012, Ridley Terminals took possession of a new stacker reclaimer that is part of its plan to double capacity to 24 million tonnes per year by 2015. We have reached agreement with Ridley Terminals for sufficient annual capacity to meet our shipping needs for planned exports from Quintette through 2024.
In December 2012, an incident at Westshore resulted in damage to one of its two coal berths. We took measures to secure additional loading capacity at other coal terminals while repairs were carried out. Those repairs were completed in early February 2013 and port operations returned to normal.
Sales
A major focus of our coal marketing strategy has been to maintain and enhance relationships with our traditional customers while establishing new customers in markets where long-term growth in steel production and demand for seaborne steelmaking coal will support our expansion efforts over the long term. We are continuing to build our existing business position and to establish important new customer relationships in both China and India to assist in achieving our growth objectives. In 2012, we exceeded previously established record sales into both China and India and, for the first time, China became our largest market for coal sales. In 2013, we are expecting China to continue to be our largest market, but the ratio of Chinese sales to total sales will likely decline compared to the fourth quarter of 2012 and be more reflective of the level experienced in the first three quarters of 2012.
Markets
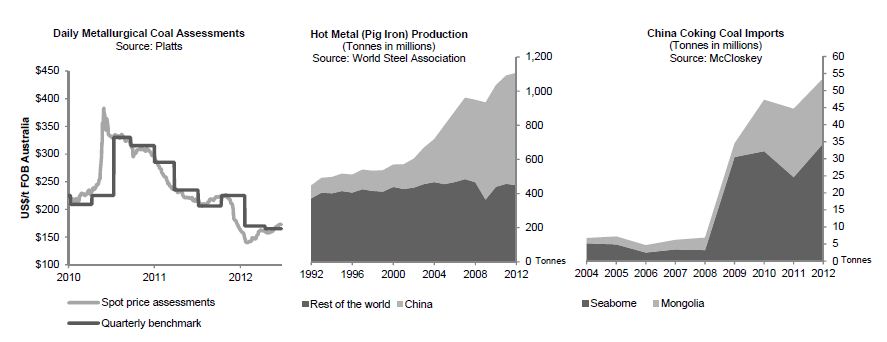
Sufficient supply of high-quality seaborne steelmaking coal and a large drop in pricing levels characterized 2012. Recovery from weather- and labour-related production shortfalls in Australia, production ramp-up in China and new supply areas contributed to increased availability of steelmaking coal. Economic uncertainty across most market areas affected steel demand. Weaker demand and better availability of coal caused the benchmark price for our highest-quality products to decrease from US$235 per tonne earlier in the year to US$165 per tonne for the first quarter of 2013. The lower pricing environment forced production cuts by a number of suppliers, with total reduction estimates ranging up to 30 million tonnes. The below graphs show key metrics affecting steelmaking coal sales: spot price assessments and quarterly benchmark pricing, hot metal production (each tonne of hot metal, or pig iron, produced requires approximately 650-700 kilograms of steelmaking coal), and China’s steelmaking coal imports by source.
| Teck 2012 Management’s Discussion and Analysis | 13 |
| Teck 2012 Management’s Discussion and Analysis | 14 |
Zinc
We are one of the world’s largest producers of zinc, primarily from our Red Dog mine in Alaska and Antamina mine in northern Peru. Our metallurgical complex in Trail, B.C. is also one of the world’s largest integrated zinc and lead smelting and refining operations. In total we produced 597,900 tonnes of zinc contained in concentrate while our Trail Operations produced 284,200 tonnes of refined zinc in 2012. In 2013, we estimate production of zinc in concentrate to be in the range of 560,000 to 590,000 tonnes and production of refined zinc to be in the range of 280,000 to 290,000 tonnes.
As an integrated metal producer, we also provide recycling solutions for metal-bearing scrap and residue, also known as electronic waste (e-waste). In 2012, we processed 12,000 tonnes of e-waste at our Trail Operations.
In 2012, our zinc business unit accounted for 25% of revenue and 12% of gross profit before depreciation and amortization.
| | | Revenues | | | Gross Profit Before Depreciation and Amortization | |
| ($ in millions) | | 2012 | | | 2011 | | | 2010 | | | 2012 | | | 2011 | | | 2010 | |
| | | | | | | | | | | | | | | | | | | |
| Red Dog | | $ | 892 | | | $ | 1,008 | | | $ | 1,106 | | | $ | 418 | | | $ | 547 | | | $ | 571 | |
| Trail | | | 1,865 | | | | 1,989 | | | | 1,447 | | | | 64 | | | | 256 | | | | 155 | |
| Other | | | 7 | | | | 18 | | | | 40 | | | | (2 | ) | | | 2 | | | | 9 | |
| Inter-segment sales | | | (214 | ) | | | (250 | ) | | | (230 | ) | | | – | | | | 3 | | | | (20 | ) |
| Total | | $ | 2,550 | | | $ | 2,765 | | | $ | 2,363 | | | $ | 480 | | | $ | 808 | | | $ | 715 | |
| | | Production | | | Sales | |
| (000’s tonnes) | | 2012 | | | 2011 | | | 2010 | | | 2012 | | | 2011 | | | 2010 | |
| | | | | | | | | | | | | | | | | | | |
| Refined zinc | | | | | | | | | | | | | | | | | | |
Trail | | | 284 | | | | 291 | | | | 278 | | | | 287 | | | | 289 | | | | 274 | |
| | | | | | | | | | | | | | | | | | | | | | | | | |
| Contained in concentrate | | | | | | | | | | | | | | | | | | | | | | | | |
Red Dog | | | 529 | | | | 572 | | | | 538 | | | | 510 | | | | 556 | | | | 585 | |
Other business
units | | | 69 | | | | 74 | | | | 107 | | | | 68 | | | | 75 | | | | 111 | |
| Total | | | 598 | | | | 646 | | | | 645 | | | | 578 | | | | 631 | | | | 696 | |
Operations
Red Dog
Red Dog, which is located in northwest Alaska, is one of the world’s largest zinc mines. Red Dog’s gross profit before depreciation and amortization was $418 million, compared with $547 million in 2011 and $571 million in 2010. The lower 2012 gross profit was mainly due to lower metal prices and lower zinc sales volumes.
In 2012, zinc production at Red Dog was 529,100 tonnes compared to 572,200 tonnes in 2011. This was due to milling rates being lowered to reduce silica in the zinc concentrate and due to lower ore grades. Lead production in 2012 was 95,400 tonnes compared to 84,000 in 2011, due to improved recoveries as
| Teck 2012 Management’s Discussion and Analysis | 15 |
significantly less near-surface weathered ore from the Aqqaluk pit was processed.
Red Dog’s location exposes the operation to severe weather and winter ice conditions, which can significantly affect production, sales volumes and operating costs. In addition, the mine’s bulk supply deliveries and all concentrate shipments occur during a short ocean shipping season that normally runs from early July to late October. This short shipping season means that Red Dog’s sales volumes are higher in the last six months of the year, resulting in significant variability in its quarterly profit, depending on metal prices.
In accordance with the operating agreement governing the Red Dog mine between Teck and NANA Regional Corporation Inc. (NANA), the royalty we pay NANA increased in the fourth quarter of 2012 to 30% of net proceeds of production from the previous 25%. This royalty increases by 5% every fifth year to a maximum of 50%. The NANA royalty charge in 2012 was US$137 million, compared with US$129 million in 2011. NANA has advised us that it ultimately shares approximately 62% of the royalty, net of allowable costs, with other Regional Alaskan Native Corporations pursuant to section 7(i) of the Alaska Native Claims Settlement Act.
In February 2013, the State of Alaska issued a renewal of Red Dog’s main water discharge permit. The water discharge permit was previously renewed in 2010 by the United States Environmental Protection Agency (EPA), but was stayed following a third-party appeal. As a result of the appeal, the conditions of the 2010 permit governing effluent limitations for lead, selenium, zinc, cyanide and total dissolved solids (TDS) were withdrawn and the limitations in the mine’s 1998 water discharge permit remained in effect. The limitations in the 1998 permit included an effluent limitation for TDS that the mine could not meet. That appeal was favourably resolved (although a related court decision is the subject of further appeal to the Ninth Circuit Court of Appeals) and jurisdiction over the permit passed to the State of Alaska. The 2013 permit issued by the State of Alaska reinstated the 2010 permit effluent limitations for TDS. Despite the issuance of this new permit, there can be no assurance that further appeals or permit uncertainty will not give rise to liability or impede mining activities, or that permit conditions that are ultimately issued will not impose significant costs on the Red Dog operation.
We expect 2013 production to be approximately 500,000 to 525,000 tonnes of zinc contained in concentrate and approximately 85,000 to 90,000 tonnes of lead contained in concentrate.
Trail Operations
Our Trail Operations in B.C. is one of the world’s largest fully integrated zinc and lead smelting and refining complexes. It also produces a variety of precious and specialty metals, chemicals and fertilizer products. Trail Operations has a two-thirds interest in the Waneta hydroelectric dam as well as ownership of the related transmission system. The Waneta Dam provides low-cost, clean, renewable power to the metallurgical operations.
Trail Operations contributed $64 million to gross profits before depreciation and amortization in 2012, compared with $256 million in 2011 and $155 million in 2010. Gross profit in 2012 decreased due primarily to a combination of lower metal prices and a one-time labour settlement charge of $59 million for a five-year labour agreement.
Refined zinc production totalled 284,200 tonnes in 2012, compared with 291,200 tonnes the previous year, as production was affected by poor operating performance in the zinc electrolytic cell house near the end of the fourth quarter.
Refined lead production of 87,900 tonnes was higher than the 85,600 tonnes produced in 2011, mainly due
| Teck 2012 Management’s Discussion and Analysis | 16 |
to higher feed rates to the KIVCET furnace.
Record silver production of 22.9 million ounces resulted from increased treatment of silver-bearing concentrate and an increased capacity to refine silver.
Operating costs in 2012, before the one-time labour settlement charge of $59 million, rose by $24 million. This was partly due to higher workforce levels to allow for succession planning, higher wages, increased consumable costs, the use of additional operating supplies and increased maintenance activity.
Our e-waste recycling process treated 12,000 tonnes of material during the year, and we plan to treat about 13,500 tonnes in 2013. We continue to process zinc alkaline batteries and fluorescent light bulbs as part of our expanded efforts in recycling post-consumer waste.
Construction continued on the new $125 million acid plant, which will replace two existing plants and is expected to deliver enhanced operating reliability and flexibility as well as improved environmental performance. The new plant is expected to go into service in the first quarter of 2014. As part of the capital deferrals announced in October 2012, work on the $210 million No. 4 Furnace Project was deferred as major excavation and construction had not commenced and detailed engineering had yet to be completed.
In 2013, we expect to produce in the range of 280,000 to 290,000 tonnes of refined zinc, approximately 87,000 tonnes of refined lead and approximately 23.5 million ounces of silver.
Other Zinc Operations
Our Pend Oreille mine, located in Washington State, has been on care and maintenance since February 2009. A core group of employees is working to keep the site ready in the event of a future restart. All regulatory and environmental requirements are being met.
Markets
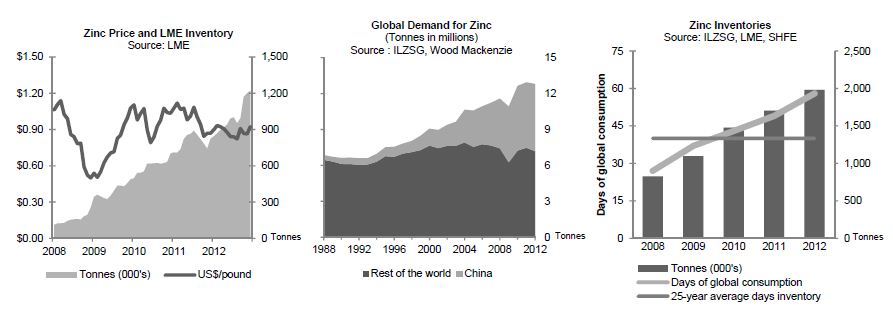
Zinc prices on the LME averaged US$0.88 per pound for the year, down US$0.11 per pound from the 2011 average.
In 2012, global zinc metal consumption was 12.8 million tonnes, which was an increase of 0.5% over 2011 levels. Metal premiums increased in North America, while premiums in Asia and in Europe remained stable. Metal supply grew at a greater rate than demand in 2012, leading to a surplus metal market in 2012 of approximately 200,000 tonnes. LME stocks increased by 399,000 tonnes, or 49%, over 2011 levels and finished the year at 1,220,750 tonnes. We estimate that total reported global stocks (which include producer, consumer, merchant and terminal stocks) increased by 279,000 tonnes in 2012 and at year-end represented an estimated 58 days of global consumption compared to the 25-year average of an estimated 40 days.
In 2012, global mine production grew by 2%, or 230,000 tonnes of contained zinc, while global refined production fell by 100,000 tonnes or 1.0%. This was a result of China increasing mine production by 14% and dropping refined production by 8%. As a result of this, the global concentrate market recorded a modest surplus in 2012, representing less than 1% of global mine production.
In 2013, we believe that the global zinc concentrate market will record a further modest surplus representing less than 2% of global mine production. We further believe that global refined production will grow at a greater rate than refined demand, leading to a global zinc metal surplus.
| Teck 2012 Management’s Discussion and Analysis | 17 |
| Teck 2012 Management’s Discussion and Analysis | 18 |
Energy
Located in the Athabasca oil sands region of northeastern Alberta, our energy assets include a 20% interest in the Fort Hills oil sands project and a 100% interest in the Frontier oil sands project. In addition, we hold a 50% interest in various other oil sands leases in the exploration phase, including the Lease 421 Area. Our recoverable contingent bitumen resources totalled 3.5 billion barrels at the end of 2012. These valuable long-term assets are located in a politically stable jurisdiction and will be mined using conventional technologies that build upon our core skills in large-scale truck and shovel operations.
We recognize that there are concerns over the potential environmental effects of developing oil sands projects. As such, we are researching methods to improve extraction and processing to enhance the sustainability of our projects. We are proud to be one of the founding members of the Canadian Oil Sands Innovation Alliance (COSIA) and are encouraged by the progress of the industry towards improving technology and production processes, reducing water consumption, improving tailings management, and increasing land reclamation and revegetation.
We are also developing renewable energy projects. We have a 30% interest in the Wintering Hills Wind Power Facility, which completed its first full year of operation in 2012.
The disclosure that follows includes references to contingent bitumen resource estimates. Further information on these estimates, and the related risks and uncertainties, is set out in our most recent Annual Information Form, which is available on our website at www.teck.com, or on the Canadian Securities Administrators website at www.sedar.com (SEDAR) and under cover of Form 40-F on the EDGAR section of the Securities Exchange Commission (SEC) website at www.sec.gov. There is no certainty that it will be commercially viable to produce any portion of the contingent resources.
Fort Hills Oil Sands Project
The Fort Hills oil sands project is located approximately 90 kilometres north of Fort McMurray in northern Alberta. We hold a 20% interest in the Fort Hills Energy Limited Partnership (Fort Hills Partnership), which owns the Fort Hills oil sands project, with 39.2% held by Total E&P Canada Ltd. (Total) and the remaining 40.8% held by the operator of the project, Suncor Energy Inc. (Suncor).
At December 31, 2012, our best estimate of our 20% share of the recoverable bitumen at Fort Hills is 662 million barrels. To the end of 2012, approximately $3.3 billion has been spent on the Fort Hills project. Our share was $1.1 billion, of which $122 million was spent in 2012. In connection with our ownership interest, we are committed to fund 27.5% of the next $4.2 billion of project spending and our 20% pro rata share thereafter.
Suncor has provided a forecast project spending estimate of approximately $1.05 billion for 2013, of which our share should be $290 million, including our earn-in commitments.
Engineering studies are ongoing to update the design basis for the project and improve the accuracy of the cost estimates in anticipation of a project sanction decision by the partners in 2013. Should the partners sanction Fort Hills (Phase 1), production is not expected to start before 2017, ramping up to approximately 160,000 barrels per day of bitumen production. Potential exists to double production with Phase 2, up to
| Teck 2012 Management’s Discussion and Analysis | 19 |
320,000 barrels per day.
Teck/SilverBirch Agreement
In April 2012, we completed the purchase of SilverBirch Energy Corporation. The transaction gave us full ownership of the Frontier project, including the Equinox property. SilverBirch assets, other than its interest in Frontier, Equinox and Twin Lakes were transferred to a new company owned by SilverBirch’s shareholders. Completion of this transaction created a simplified ownership structure for Frontier, provided an opportunity to explore new partnerships and other alternatives to move the project towards development, and reduced our exposure to oil sands leases not amenable to mining.
Frontier Project
The Frontier project is located immediately northwest of the Fort Hills project in northern Alberta. We hold a 100% interest in the Frontier project. In November 2011, the Frontier project application was submitted to regulators. In 2012, provincial and federal regulatory agencies completed their initial review of the Frontier project application and provided supplemental information requests. We prepared and submitted responses to all of these information requests in January 2013. The Canadian Environmental Assessment Agency has provided estimates of the federal review schedule for the Frontier project application. The cumulative federal review period is estimated to be approximately two years. When time to respond to information requests is included, 2015 is the earliest an approval decision and receipt of required permits are expected.
The Frontier project consists of approximately 28,960 hectares of oil sands leases and as at December 31, 2012, our best estimate is that our 100% interest in the Frontier project represents approximately 2.8 billion barrels of contingent bitumen resources. The project has been designed for up to four production lines with a total capacity of approximately 277,000 barrels per day of bitumen; the first two production lines are planned to have a production capacity of 159,000 barrels per day. The Frontier project includes an option of developing Equinox, 10 kilometres south of Frontier, as a satellite operation.
In 2012, no field exploration activities were undertaken — the focus was on supporting the regulatory application review, consultations with stakeholders and ongoing engineering studies. A field exploration program is planned for 2013 to acquire additional geotechnical information to assist in future engineering studies.
Lease 421 Area
We hold a 50% interest in the Lease 421 Area, which is located east of the Fort Hills project in northern Alberta. Imperial Oil and ExxonMobil jointly own the remaining 50%. During the first quarter of 2012, we acquired a 50% working interest in Lease 899, which is immediately southwest of and adjacent to the Lease 421 Area. This increases the contiguous land area of the Lease 421 Area project by 34%. To date, a total of 89 core holes have been completed in the Lease 421 Area, including 30 core holes previously completed on Lease 899.
Wintering Hills Wind Power Facility
Wintering Hills is located near Drumheller, Alberta. We hold a 30% interest in Wintering Hills with Suncor Energy Products Inc., a wholly owned subsidiary of Suncor Inc., the project operator. In 2012, the first full year of operation, our share of power generation from Wintering Hills was 88 GWh, enough power to provide 57,000 tonnes of CO2-equivalent credits. Our share of expected power generation in 2013 is 85 to 90 GWh, which is dependent on weather conditions.
| Teck 2012 Management’s Discussion and Analysis | 20 |
Exploration
Throughout 2012, exploration efforts were carried out around the world by our nine regional offices. Expenditures of $102 million in 2012 were focused on copper, zinc and gold opportunities.
Exploration plays three critical roles at Teck: discovery of new orebodies through early stage exploration and acquisition; pursuit, evaluation and acquisition of development opportunities; and delivery of geoscience solutions and services to create value at our existing mines.
Our copper exploration is focused on porphyry copper deposits and, during 2012, we drilled several porphyry copper projects in Canada, Chile, Mexico, Peru, Turkey and Namibia. In addition to our 100% owned projects, several resource stage joint venture projects advanced in 2012, including Zafranal in Peru, Haib in Namibia and La Verde in Mexico. Significant exploration work was focused in and around our existing operations and advanced projects in 2012. At our Highland Valley Copper Operations in Canada we successfully completed ground geophysical surveys and target definition drilling adjacent to the historical Bethlehem pits, outlining some near-surface and copper mineralization. At our Quebrada Blanca Operations in Chile, we drilled high-quality targets within 10 kilometres of the existing mine and at our Relincho project in Chile we made new discoveries within 2 kilometres of the current pit design. In 2013, we plan to drill copper projects in Canada, Peru, Chile, Namibia and Turkey and aggressively explore around our existing operations.
Zinc exploration remains focused on three areas: the Red Dog mine district in Alaska, northeastern Australia, and Ireland. In both Alaska and Australia, the target type is a large, high-grade, sediment-hosted deposit similar to major world-class deposits such as Red Dog in Alaska and Century or McArthur River in Australia. In 2012, we undertook approximately 4,000 metres of exploration drilling on the Noatak project, where we have identified multiple high-quality targets near our existing Red Dog mine. We also conducted exploration drilling for zinc in northeastern Australia and in Ireland, where the target is a large high-grade deposit similar to the producing Navan mine. Drill programs will continue in all three regions in 2013.
In addition to exploring for copper and zinc, we are exploring for, and looking to partner in, new gold opportunities. Our plan is to explore, find and advance gold resources through targeted exploration activity in select jurisdictions. Once an opportunity has been recognized, the strategy is to optimize that opportunity or asset through further definition drilling and engineering studies, then capture value through periodic divestitures. Our current exploration efforts and drill testing for gold are primarily focused in Turkey, Canada, Chile, Peru and Colombia. In 2012, we had encouraging results from TV Tower in Turkey, which is a joint venture with Pilot Gold, and we expect this to progress towards a resource estimate in 2013. Our 100% Demir and 60% Halilaga gold projects, also in Turkey, moved towards the resource estimate stage in 2012.
| Teck 2012 Management’s Discussion and Analysis | 21 |
Financial Overview
Financial Summary
| ($ in millions, except per share data) | | 2012 | | | 2011 | | | 2010 | |
| | | | | | | | | | |
| Revenue and profit | | | | | | | | | |
Revenues | | $ | 10,343 | | | $ | 11,514 | | | $ | 9,223 | |
Gross profit before depreciation and amortization | | $ | 4,017 | | | $ | 5,788 | | | $ | 4,438 | |
EBITDA* | | $ | 2,819 | | | $ | 5,459 | | | $ | 4,326 | |
Profit attributable to shareholders | | $ | 811 | | | $ | 2,668 | | | $ | 1,820 | |
| | | | | | | | | | | | | |
| Cash flow | | | | | | | | | | | | |
Cash flow from operations | | $ | 2,795 | | | $ | 3,957 | | | $ | 3,274 | |
Capital expenditures | | $ | 1,809 | | | $ | 1,236 | | | $ | 810 | |
Investments | | $ | 758 | | | $ | 463 | | | $ | 46 | |
| | | | | | | | | | | | | |
| Balance sheet | | | | | | | | | | | | |
Cash balances | | $ | 3,267 | | | $ | 4,405 | | | $ | 832 | |
Total assets | | $ | 34,617 | | | $ | 34,219 | | | $ | 29,055 | |
Debt, including current portion | | $ | 7,195 | | | $ | 7,035 | | | $ | 4,948 | |
| | | | | | | | | | | | | |
| Per share amounts | | | | | | | | | | | | |
Profit attributable to shareholders | | | | | | | | | | | | |
Basic | | $ | 1.39 | | | $ | 4.52 | | | $ | 3.09 | |
Diluted | | $ | 1.38 | | | $ | 4.50 | | | $ | 3.08 | |
Dividends declared per share | | $ | 0.85 | | | $ | 0.70 | | | $ | 0.50 | |
*EBITDA is a non-GAAP financial measure. See “Use of Non-GAAP Financial Measures” section for further information.
Our revenue and profit depend on prices for the commodities we produce, sell and use in our production processes. Commodity prices are determined by the supply of and demand for those commodities, which are influenced by global economic conditions. We normally sell the products that we produce at prevailing market prices or, in the case of steelmaking coal, at negotiated prices on term contracts or on a spot basis. Prices for these products, particularly for exchange-traded commodities, can fluctuate significantly and that volatility can have a material effect on our financial results.
We record our financial results using the Canadian dollar and, accordingly, our operating results and cash flows are affected by changes in the Canadian dollar exchange rate relative to the currencies of other countries where we operate and relative to the United States (U.S.) dollar. Exchange rate movements can have a significant effect on our results, as a significant portion of our operating costs are incurred in Canadian and other currencies, and most of our revenues and debt are denominated in U.S. dollars.
Profit attributable to shareholders for 2012 was $811 million, or $1.39 per share, which included $784 million of after-tax debt refinancing charges. This compares with $2.7 billion or $4.52 per share in 2011, and $1.8 billion, or $3.09 per share in 2010.
Our profit over the past three years has included items that we segregate for presentation to investors so that the ongoing profit of the company may be more clearly understood. These are described below and summarized in the table that follows. Excluding these items, our profit for 2012 was negatively affected by lower prices for our major commodities.
| Teck 2012 Management’s Discussion and Analysis | 22 |
Our profit in 2012 included $784 million of after-tax refinancing charges related to debt refinancing transactions completed during the year, $70 million of collective agreement charges, $39 million of gains on asset sales and $98 million of gains on various derivatives.
Our profit in 2011 included $146 million of after-tax gains on the sale of various assets that were undertaken as part of our debt reduction plan and $128 million of gains on various derivatives.
Our profit in 2010 included $65 million of after-tax non-cash foreign exchange gains and $768 million of after-tax gains on the sale of various assets that were undertaken as part of our debt reduction plan. Partially offsetting these favourable items was $658 million of after-tax unamortized discounts and issues costs related to our Fording acquisition debt that we wrote off as we repaid and refinanced that debt.
The table below shows the effect of these items on our profit.
| | | 2012 | | | 2011 | | | 2010 | |
| | | | | | | | | | |
| Profit attributable to shareholders | | $ | 811 | | | $ | 2,668 | | | $ | 1,820 | |
| | | | | | | | | | | | | |
| Add (deduct) the after-tax effect of: | | | | | | | | | | | | |
Gains on sale of assets | | | (39 | ) | | | (146 | ) | | | (768 | ) |
Foreign exchange (gains) losses | | | 20 | | | | (4 | ) | | | (65 | ) |
Derivative gains | | | (98 | ) | | | (128 | ) | | | (153 | ) |
Financing items | | | 784 | | | | – | | | | 658 | |
Collective agreement charges | | | 70 | | | | 55 | | | | – | |
Asset write-downs | | | – | | | | 23 | | | | – | |
Tax items | | | (29 | ) | | | – | | | | 11 | |
| | | | | | | | | | | | | |
| Adjusted profit * | | $ | 1,519 | | | $ | 2,468 | | | $ | 1,503 | |
| | | | | | | | | | | | | |
| Adjusted earnings per share * | | $ | 2.60 | | | $ | 4.18 | | | $ | 2.55 | |
*Adjusted profit and adjusted earnings per share are all non-GAAP measures. See “Use of Non-GAAP Financial Measures” section for further information.
Cash flow from operations in 2012 was $2.8 billion, compared with $4.0 billion in 2011 and $3.3 billion in 2010. The changes in cash flow from operations are due mainly to the volatility in commodity prices.
At December 31, 2012, our cash balance was $3.3 billion. Total debt was $7.2 billion and our net debt to net debt-plus-equity ratio was 18% compared with 13% at December 31, 2011 and 21% at the end of 2010.
Gross Profit
Our gross profit is made up of our revenues less the operating, depreciation and amortization expenses at our producing operations. Income and expenses from our business activities that do not produce commodities for sale are included in our other operating income and expenses or in our non-operating income and expenses.
Our principal commodities are copper, steelmaking coal and zinc, which accounted for 26%, 45% and 11% of revenues respectively in 2012. Silver and lead are significant byproducts of our zinc operations, accounting for 9% and 3% each, respectively, of our 2012 revenues. We also produce a number of other byproducts including molybdenum, various specialty metals, and chemicals and fertilizers, which in total accounted for 6% of our revenue in 2012.
| Teck 2012 Management’s Discussion and Analysis | 23 |
Our revenues are affected by sales volumes, which are determined by our production levels and by demand for the commodities we produce, commodity prices and currency exchange rates.
Our revenues were $10.3 billion in 2012 compared with the record $11.5 billion in 2011 and $9.2 billion in 2010. The reduction in 2012 was due mainly to a 25% reduction in the average realized coal price, lower metal prices and lower zinc sales volumes. The reduction was partially offset by higher sales volumes of copper and coal, which increased by 13% and 8%, respectively, compared with 2011. The increase in 2011 revenue over 2010 revenue was due to higher average prices for our main commodities and higher sales volumes for copper, partially offset by lower sales volumes of steelmaking coal and zinc.
Our cost of sales includes all of the expenses required to produce our products, such as labour, energy, operating supplies, concentrates purchased for our Trail Operations’ refining and smelting operation, royalties, and marketing and distribution costs required to sell and transport our products to various delivery points. Our cost of sales also includes depreciation and amortization expense. Due to the geographic locations of many of our operations, we are highly dependent on third parties for the provision of rail, port and other distribution services. In certain circumstances, we negotiate prices for the provision of these services where we may not have viable alternatives to using specific providers, or may not have access to regulated rate-setting mechanisms. Contractual disputes, demurrage charges, rail and port capacity issues, availability of vessels and railcars, weather problems and other factors can have a material effect on our ability to transport materials from our suppliers and to our customers in accordance with schedules and contractual commitments.
The magnitude of our costs is dictated mainly by our production volumes, the costs for labour, operating supplies and concentrate purchases and by strip ratios, haul distances, ore grades, distribution costs, commodity prices, foreign exchange rates and costs related to non-routine maintenance projects. Production volumes mainly affect our variable operating and our distribution costs. In addition, production may also affect our sales volumes and, when combined with commodity prices, affects profitability and ultimately our royalty expenses.
Our cost of sales was $7.3 billion in 2012, compared with $6.6 billion in 2011 and $5.7 billion in 2010. Costs of sales in 2012 increased from 2011 primarily due to higher production levels in our copper and coal business units, which increased 16% and 8% respectively, and accounted for approximately $380 million of the increase. Higher transportation unit costs in our coal business unit accounted for approximately $110 million of the increase in cost of sales in 2012. This was due to higher ocean freight, port and rail costs as
| Teck 2012 Management’s Discussion and Analysis | 24 |
well as to a higher proportion of coal being sold inclusive of freight charges. Although we achieved lower unit costs at most of our copper operations, unit costs increased significantly at our Quebrada Blanca Operations and accounted for approximately $100 million of the increase in cost of sales in 2012. This was due to significant increases for labour costs, reflecting new terms of the collective agreement ratified early in 2012, and higher contractor and consumable costs. We also incurred one-time labour settlement costs at various operations totalling $103 million in 2012 compared with $84 million in 2011.
Comparing 2011 with 2010, the higher costs were due mainly to the new copper concentrator at Carmen de Andacollo operating for a full year in 2011, compared with three months in 2010, as commercial production commenced October 1, 2010. This accounted for approximately $250 million of the increase in cost of sales in 2011. We also incurred one-time labour settlement costs at Highland Valley Copper and our coal operations totalling $84 million in 2011. The balance of our higher costs of sales was partly due to increased energy costs, consumables and the use of contractors to maximize production at our coal operations. In addition, the cost of concentrate purchases at our Trail Operations increased by approximately $400 million, due to higher metal prices, especially for silver, and as a result of our Trail Operations operating at higher production levels compared with 2010.
In 2012, our depreciation expense was $951 million compared with $911 million in 2011 and $916 million in 2010. Increased throughput and production levels at our coal and copper operations, the commencement of the amortization of Antamina’s major expansion project and Highland Valley’s two-year waste stripping campaign and buttress placement project were the main reasons for the higher depreciation expense in 2012. However, this was partially offset by the effect of an increase in our coal reserves, which reduced our per-unit amortization rate and our overall depreciation charge for coal. We expect that these increased reserves will have a more significant effect in reducing the depreciation charge in 2013.
Other Expenses
| ($ in millions) | | 2012 | | | 2011 | | | 2010 | |
| | | | | | | | | | |
| General and administrative | | $ | 136 | | | $ | 125 | | | $ | 137 | |
| Exploration | | | 102 | | | | 105 | | | | 56 | |
| Research and development | | | 19 | | | | 17 | | | | 20 | |
| Other operating expense (income) | | | 24 | | | | 174 | | | | (640 | ) |
| Finance income | | | (135 | ) | | | (113 | ) | | | (95 | ) |
| Finance expense | | | 577 | | | | 595 | | | | 691 | |
| Non-operating expense (income) | | | 848 | | | | (197 | ) | | | 418 | |
| Share of losses of associates | | | 10 | | | | 5 | | | | 5 | |
| | | $ | 1,581 | | | $ | 711 | | | $ | 592 | |
We must continually replace our reserves as they are depleted in order to maintain production levels over the long term. We try to do this through our exploration and development program and through acquisition of interests in new properties or in companies that own such properties. Exploration for minerals and oil is highly speculative and the projects involve many risks. The vast majority of exploration projects are unsuccessful and there are no assurances that current or future exploration programs will find deposits that are ultimately brought into production. We have expanded our exploration activities in 2012 and 2011, resulting in the costs being significantly higher than in 2010.
Our research and development expenditures are primarily focused on advancing our proprietary CESL hydrometallurgical technology, the development of internal and external growth opportunities, and the
| Teck 2012 Management’s Discussion and Analysis | 25 |
development and implementation of process and environmental technology improvements at operations.
Other operating income and expenses include items we consider to be related to the operation of our business, such as final pricing adjustments (which are further described in the next paragraph), share-based compensation, gains or losses on commodity derivatives, gains or losses on sale of operating or exploration assets, and provisions for various costs at our closed properties. Significant items in 2012 include $24 million from gains on the sale of assets, $45 million of positive pricing adjustments and a $34 million expense for share-based compensation. Significant items in 2011 include $130 million of gains on the sale of assets, $210 million of negative pricing adjustments, and a $21 million expense recovery for share-based compensation resulting from the decline in our share price. 2010 included $721 million of gains on the sale of assets, $116 million of positive pricing adjustments and a $124 million charge for share-based compensation.
Sales of metals in concentrate or copper cathodes are recognized in revenue on a provisional pricing basis when the rights, obligations, risks and benefits of ownership pass to the customer, which usually occurs upon shipment. However, final pricing is typically not determined until a subsequent date, often in the following quarter. Revenue in a quarter is based on prices at the date of sale. These pricing adjustments result in gains in a rising price environment, and losses in a declining price environment and are recorded as other operating income or expense. The extent of the pricing adjustments also takes into account the actual price participation terms as provided in certain concentrate sales agreements. It should be noted that these effects arise on the sale of concentrates, as well as on the purchase of concentrates at our Trail Operations.
The table below outlines our outstanding receivable positions, which were provisionally valued at December 31, 2011 and 2012, respectively.
| | Outstanding at | Outstanding at |
| | December 31, 2011 | December 31, 2012 |
| (pounds in millions) | Pounds | US$/lb | Pounds | US$/lb |
| | | | | |
| Copper | 164 | 3.43 | 179 | 3.59 |
| Zinc | 184 | 0.83 | 143 | 0.93 |
Our finance income includes the expected return on our pension plan assets in the form of interest and investment income. Our finance expense includes interest expense on our debt, financing fees and amortization, and the interest components of our pension obligations and our decommissioning and restoration provisions, less any interest that we capitalize against the cost of our development projects. The reduction in our finance expense relates primarily to lower average interest rates. Although our debt levels have increased since the end of 2010, the effect of the higher debt was offset by the reduction in interest rates arising from several refinancing transactions undertaken since the second half of 2010 in which we issued new lower-cost notes and used the proceeds and some cash to redeem high-yield notes issued in 2009 to refinance the Fording acquisition debt.
Non-operating income (expense) includes items that arise from financial and other matters and includes such items as foreign exchange, debt refinancing, realized gains or losses on marketable securities, and gains and losses on the revaluation of the call options on certain of our high-yield notes. In 2012, other non-operating income included $965 million of charges related to debt refinancing activities described in more detail below under the caption “Financing Activities”, $119 million of gains on the revaluation of the call options on our high-yield notes prior to their settlement and $29 million of gains on the sale of various investments. In 2011, other non-operating income consisted primarily of $146 million of gains on the revaluation of the call options on our high-yield notes and $44 million of gains on the sale of various
| Teck 2012 Management’s Discussion and Analysis | 26 |
investments. 2010 included debt repurchase and refinancing charges of $782 million related to our debt refinancing transactions, partly offset by $168 million of gains on the revaluation of our call options and $138 million from the sale of investments.
We account for our investment in the Fort Hills Energy Limited Partnership using the equity method. The majority of the activities on this project to date relate to capital projects, rather than expenditures that affect profit.
Income and resource taxes were $615 million, or 41% of pre-tax profit. This is higher than the Canadian statutory income tax rate of 25%. This is due mainly to the effect of resource taxes and higher taxes in foreign jurisdictions, including withholding taxes. The loss on redemption of our high-yield notes that was not fully tax deductible also contributed to the higher effective rate. Offsetting this was the settlement of tax appeals in our favour, and adjustments to accrued withholding taxes on unremitted foreign earnings based on our reinvestment plans. The tax rate on our adjusted profit was 35%. We currently have approximately $6.8 billion of various unused tax pools that shield us from cash income taxes, but not resource taxes in Canada. We remain subject to cash taxes in foreign jurisdictions.
Profit attributable to non-controlling interests relate to the ownership interests in our Highland Valley Copper, Quebrada Blanca, Carmen de Andacollo and Elkview mines that are held by third parties.
Financial Position and Liquidity
Our financial position and liquidity remains strong. Our total debt balance was $7.2 billion at December 31, 2012 compared with $7.0 billion at the end of 2011 and $4.9 billion at the end of 2010.
Our debt positions and credit ratios are summarized in the following table.
| | | December 31, | | | December 31, | | | December 31, | |
| | | 2012 | | | 2011 | | | 2010 | |
| | | | | | | | | | |
| Fixed rate term notes | | $ | 7,119 | | | $ | 6,698 | | | $ | 4,694 | |
| Other | | | 113 | | | | 219 | | | | 281 | |
| Total debt (US$ in millions) | | | 7,232 | | | | 6,917 | | | | 4,975 | |
| | | | | | | | | | | | | |
| Canadian $ equivalent at year-end exchange rate | | | 7,195 | | | | 7,035 | | | | 4,948 | |
| Less cash balances | | | (3,267 | ) | | | (4,405 | ) | | | (832 | ) |
| Net debt | | $ | 3,928 | | | $ | 2,630 | | | $ | 4,116 | |
| | | | | | | | | | | | | |
| Debt to debt-plus-equity | | | 29 | % | | | 28 | % | | | 24 | % |
| Net debt to net debt-plus-equity | | | 18 | % | | | 13 | % | | | 21 | % |
| Average interest rate at year-end | | | 4.8 | % | | | 6.9 | % | | | 7.6 | % |
The cost of funds under our credit facilities depends in part on our credit ratings. Moody’s currently rates us at Baa2 with a stable outlook, Standard & Poor’s rates us at BBB with a stable outlook, Dominion Bond Rating Service rates us as BBB with a stable trend and Fitch Ratings rates Teck as BBB with a stable outlook. The costs under our credit facilities would change if certain of our credit ratings were to change.
Our primary sources of liquidity and capital resources are our cash and temporary investments, cash flow provided from operations and funds available under our committed and uncommitted bank credit facilities, of which approximately $1.1 billion is currently available.
| Teck 2012 Management’s Discussion and Analysis | 27 |
Operating Cash Flow
Cash flow from operations was $2.8 billion in 2012 compared with $4.0 billion in 2011 and $3.3 billion in 2010. The decreased cash flow from operations in 2012 was due mainly to lower gross profits at our operations from falling commodity prices. The increase in 2011 compared with 2010 was due mainly to the higher gross profits at our operations from rising commodity prices.
Investing Activities
Capital expenditures were $1.8 billion in 2012 and included $709 million on sustaining capital and $1.1 billion on development projects. The largest components of sustaining expenditures were $327 million at our coal operations, primarily related to new and replacement mobile equipment; $99 million at Trail Operations; $35 million at Red Dog; $51 million at Quebrada Blanca and $69 million at Highland Valley Copper. Development expenditures included $314 million at Teck Coal as part of our plans to increase coal production to over 30 million tonnes, $111 million for our share of the Antamina expansion project, $226 million for Highland Valley Copper’s mill optimization project, $192 million for the Quebrada Blanca Phase 2 hypogene project, $16 million at Carmen de Andacollo and $60 million related to our oil sands properties.
Investments in 2012 included $432 million for the acquisition of SilverBirch Energy Corporation, which gave us full ownership of the Frontier oil sands project, including the Equinox property, $197 million for interests in a number of publicly traded companies and $122 million for our share of the costs of our equity accounted investment in Fort Hills. Investments in 2011 totalled $463 million, of which $300 million was for publicly traded companies and $54 million was for our share of the Fort Hills costs. Investments in 2010 were $46 million, with no individually significant items.
Cash proceeds from the sale of non-core assets were $51 million in 2012, $289 million in 2011 and $1.2 billion in 2010. In 2012, we sold various small, non-core mining properties. 2011 included $128 million for the sale of our Carrapateena project in Australia and $161 million from other assets and investments in publicly traded companies. 2010 included the sale of our one-third interest in the Waneta Dam for $825 million, $230 million from the sale of an interest in the future gold production from our Carmen de Andacollo Operations and $24 million from the sale of gold projects in Turkey.
Financing Activities
During 2012, we issued US$2.75 billion of long-term notes and used the proceeds to redeem the remaining outstanding balance of the various high-yield notes issued in 2009 and repay the US$200 million notes due in September 2012.
The notes issued, which are all denominated in U.S. dollars, include $500 million due in 2018 bearing interest at 2.5%, $500 million due in 2019 bearing interest at 3.0%, $750 million due in 2023 bearing interest at 3.75%, $500 million due in 2042 bearing interest at 5.2% and $500 million due in 2043 bearing interest at 5.4%.
We also repaid the US$200 million notes due in September 2012, and repurchased 3.9 million Class B subordinate voting shares for cancellation pursuant to our normal course issuer bids at a cost of $129 million.
Significant financing activities during 2011 included the US$2 billion of notes issued in July for net proceeds of $1.9 billion, and the repurchase of 4.8 million Class B subordinate voting shares for $171 million for cancellation pursuant to our normal course issuer bid.
During the first half of 2010, we repaid the remaining outstanding balance of US$2.35 billion on the term loan
| Teck 2012 Management’s Discussion and Analysis | 28 |
related to our 2008 acquisition of Fording Coal with cash flow derived from our operations and proceeds from the sale of non-core assets. In the latter half of 2010 we initiated three tender offers totalling US$1.450 billion and acquired and cancelled US$1.993 billion of the high-yield notes that we issued in May 2009. We financed these tender offers with cash on hand and the issuance of new lower coupon notes maturing in 2017, 2021 and 2040.
As a result of the refinancing activities described above, we have reduced the interest cost of our debt and extended its tenor. At December 31, 2012 the weighted average maturity of our consolidated indebtedness is approximately 16.5 years and the weighted average coupon rate is approximately 4.8%.
Quarterly Earnings and Cash Flow
| ($ in millions except per share data) | | 2012 | | | 2011 | |
| | | | Q4 | | | | Q3 | | | | Q2 | | | | Q1 | | | | Q4 | | | | Q3 | | | | Q2 | | | | Q1 | |
| | | | | | | | | | | | | | | | | | | | | | | | | | | | | | | | | |
| Revenues | | $ | 2,730 | | | $ | 2,505 | | | $ | 2,561 | | | $ | 2,547 | | | $ | 2,972 | | | $ | 3,380 | | | $ | 2,796 | | | $ | 2,366 | |
| Gross profit | | | 719 | | | | 694 | | | | 735 | | | | 918 | | | | 1,212 | | | | 1,571 | | | | 1,197 | | | | 897 | |
| EBITDA | | | 527 | | | | 721 | | | | 790 | | | | 781 | | | | 1,304 | | | | 1,660 | | | | 1,461 | | | | 1,034 | |
| Profit attributable to shareholders | | | 145 | | | | 180 | | | | 268 | | | | 218 | | | | 637 | | | | 814 | | | | 756 | | | | 461 | |
| Earnings per share | | $ | 0.25 | | | $ | 0.31 | | | $ | 0.46 | | | $ | 0.37 | | | $ | 1.08 | | | $ | 1.38 | | | $ | 1.28 | | | $ | 0.78 | |
| Cash flow from operations | | $ | 796 | | | $ | 587 | | | $ | 768 | | | $ | 644 | | | $ | 1,199 | | | $ | 1,383 | | | $ | 621 | | | $ | 754 | |
Revenues from operations were $2.7 billion in the fourth quarter compared with revenues of $3.0 billion a year ago. Revenues from our copper business unit increased by $117 million from a year ago primarily due to higher sales volumes resulting from increased production levels. Coal revenues decreased by $424 million compared with the fourth quarter of 2011 as a result of significantly lower coal prices, despite a 16% increase in sales volumes. Revenues from our zinc business unit rose by $64 million from a year ago as a result of the timing of lead sales from Red Dog and slightly higher metal prices.
Gross profit before depreciation and amortization from our copper business unit in the fourth quarter increased by $91 million compared with a year ago as a result of production and sales volumes, which
increased by approximately 15%. Copper production in the fourth quarter was 103,000 tonnes compared with 89,000 tonnes a year ago, which was a new quarterly production record, and an increase of 4% from the third quarter of 2012. The higher production is a result of our share of additional production from Antamina’s mine expansion and the mining of higher grade sections at Highland Valley Copper. Copper prices were also higher at US$3.59 per pound in the fourth quarter compared with US$3.40 per pound a year ago. The higher copper prices were partly offset by a stronger Canadian dollar and lower molybdenum revenues.
Gross profit before depreciation and amortization from our coal business unit decreased by $544 million in the fourth quarter compared with the same period a year ago as a result of significantly lower coal prices, despite a 16% increase in sales volumes. The average coal price of US$159 per tonne in the fourth quarter was 37% lower than the same quarter a year ago, reflecting weaker steelmaking coal market conditions. Coal sales of 6.4 million tonnes in the fourth quarter were 16% higher than the same period last year and exceeded prior guidance of 6.2 million tonnes. The increase in sales volume predominantly reflects strong demand for coal delivered to China, partially offset by lower demand in our traditional markets. Production in the fourth quarter decreased to 6.4 million tonnes, or by 5% compared with the same quarter in 2011 as a result of our decision to reduce production starting in mid-August through to the end of the year to align with
| Teck 2012 Management’s Discussion and Analysis | 29 |
customer demand. Cost of product sold in the fourth quarter was $62 per tonne, before transportation and depreciation charges, or $3 per tonne lower than the same quarter a year ago, and 17% lower than in the first three quarters of 2012, reflecting our cost-reduction efforts at our mines. Transportation costs in the fourth quarter were $41 per tonne, 24% higher compared with the same quarter a year ago, as a result of higher ocean freight, port and rail costs and a higher than normal proportion of coal being sold inclusive of ocean freight.
Gross profit before depreciation and amortization from our zinc business unit decreased by $22 million to $182 million in the fourth quarter compared with a year ago primarily due to a lower contribution from our Trail Operations. Trail’s refined zinc production and sales volumes declined by approximately 10% compared with the fourth quarter of last year due to electrolytic plant operating performance, which resulted in a temporary buildup of in-process inventories. Red Dog’s zinc production rose by 5% to 142,300 tonnes in the fourth quarter compared with the same period a year ago as a result of increased mill throughput. Higher lead sales from Red Dog were the result of weather-related shipping delays that deferred sales from the third quarter. This was offset by an increase in the NANA royalty rate from 25% to 30% in the fourth quarter of 2012.
Profit attributable to shareholders was $145 million, or $0.25 per share, in the fourth quarter compared with $637 million or $1.08 per share in the same period last year, primarily due to lower steelmaking coal prices in the fourth quarter compared with the same period a year ago. Profit attributable to shareholders in the fourth quarter was also affected by a $259 million after-tax charge related to the refinancing of the final portion of our high-yield notes, which is excluded from adjusted profit.
Cash flow from operations was $796 million in the fourth quarter compared with $1.2 billion a year ago, with the reduction due mainly to the effect of lower coal prices in the period.
Outlook
We continue to experience volatile markets for our products. Commodity markets have historically been volatile, prices can change rapidly and customers can alter shipment plans. This can have a substantial effect on our business. Ongoing economic uncertainties in Europe and the United States and less robust growth rates in China, India and other emerging markets have affected both demand and prices for some of our products. We believe that the medium- to longer-term fundamentals for steelmaking coal are quite favourable, although the recent weakness in the seaborne steelmaking coal market is expected to persist for at least the first half of 2013. Markets for copper remain steady while zinc markets have shown some weakness. In the meantime, the Company’s financial position is strong, and we continuously monitor all aspects of our key markets as conditions evolve in order to be in a position to take whatever actions may be appropriate.
Commodity Prices and 2013 Production
Commodity prices are a key driver of our profit. On the supply side, the depleting nature of ore reserves, difficulties in finding new orebodies, the permitting processes and the availability of skilled resources to develop projects, as well as infrastructure constraints, political risk and significant cost inflation may continue to have a moderating effect on the growth in future production. Although we are concerned about current global economic conditions, we believe that, over the longer term, the industrialization of emerging market economies will continue to be a major positive factor in the future demand for commodities. Therefore, we believe that the long-term price environment for the products that we produce and sell remains favourable.
| Teck 2012 Management’s Discussion and Analysis | 30 |
Based on our expected 2013 mid-range production estimates and a Canadian/U.S. dollar exchange rate of $1.00, the sensitivity of our annual profit attributable to shareholders to the indicated changes in commodity prices, before pricing adjustments and the U.S. dollar exchange rate is as follows:
| | 2013 | | | | | | | |
| | Mid-Range | | | | Effect of | | | |
| | Production | | | | Change | | | Effect on |
| | Estimates | Change | | | on Profit | | | EBITDA |
| | | | | | | | | |
| Coal (000’s tonnes) | 24,500 | US$1/tonne | | $ | 16 million | | $ | 25 million |
| Copper (tonnes) | 350,000 | US$0.01/lb | | $ | 4 million | | $ | 7 million |
| Zinc (tonnes) | 860,000 | US$0.01/lb | | $ | 7 million | | $ | 11 million |
| US$ exchange | | Cdn$0.01 | | $ | 45 million | | $ | 70 million |
Notes:
(1) The effect on our profit attributable to shareholders of commodity price and exchange rate movements will vary from quarter to quarter depending on sales volumes.
(2) Zinc includes 285,000 tonnes of refined zinc and 575,000 tonnes of zinc contained in concentrates.
(3) All production estimates are subject to change based on market and operating conditions.
Foreign exchange translation gains and losses on our U.S. dollar denominated debt arising from exchange rate fluctuations are not expected to have a significant effect on our 2013 profit, as our debt level is expected to be designated as a hedge against our investments in U.S. dollar denominated foreign operations and working capital items.
Copper and zinc prices, to date in 2013, are trading similar to 2012 average prices. Coal market conditions softened in the third quarter and remained lower through the fourth quarter. The fluctuations in the Canadian/U.S. dollar exchange rate can have a significant effect on our profit and financial position. The Canadian dollar, to date in 2013, has averaged approximately $1.00 against the U.S. dollar compared with $1.00 in 2012.
Our copper production for 2013 is expected to be in the range of 340,000 to 360,000 tonnes compared with 373,000 tonnes produced in 2012. The lower expected production is a result of declining production from Quebrada Blanca and lower ore grades at Highland Valley Copper.
Our coal production in 2013 is expected to be in the range of 24.0 to 25.0 million tonnes. Our actual production will depend primarily on customer demand for deliveries of steelmaking coal. Depending on market conditions and the sales outlook, we may adjust our production plans. We have the flexibility to devote additional resources to pre-stripping in these circumstances. Our current production capacity is approximately 27 million tonnes and is expected to grow to 28 million tonnes by the end of 2013.
Our zinc in concentrate production in 2013 is expected to be in the range of 560,000 to 590,000 tonnes compared with 598,000 tonnes in 2012, as Red Dog’s production is expected to decrease by approximately 15,000 tonnes. Refined zinc production from our Trail metallurgical complex in 2013 is expected to be in the range of 280,000 to 290,000 tonnes compared with 284,200 tonnes in 2012.
| Teck 2012 Management’s Discussion and Analysis | 31 |
Capital Expenditures
Our forecast of approved capital expenditures for 2013 is expected to be approximately $2.0 billion and is summarized in the following table:
| ($ in millions) | | Sustaining | | | Major Enhancement | | | New Mine Development | | | Total | |
| | | | | | | | | | | | | |
| Copper | | $ | 265 | | | $ | 360 | | | $ | 530 | | | $ | 1,155 | |
| Coal | | | 265 | | | | 80 | | | | 120 | | | | 465 | |
| Zinc | | | 195 | | | | 20 | | | | – | | | | 215 | |
| Energy | | | – | | | | – | | | | 110 | | | | 110 | |
| Corporate | | | 20 | | | | – | | | | – | | | | 20 | |
| | | $ | 745 | | | $ | 460 | | | $ | 760 | | | $ | 1,965 | |
These amounts do not include expenditures on mine development projects that have not received board approval and are expected to be incurred should those projects proceed. In addition, we expect to capitalize additional overburden removal work at operating mines under the provisions of new accounting standards (IFRIC 20) as they come into effect in 2013.
We also expect to invest approximately $290 million in 2013 for our share of costs for the Fort Hills oil sands project, which is accounted for as an investment.
Major enhancement projects in 2013 include: $310 million for Highland Valley’s mill optimization project, $25 million for the completion of the Antamina mill expansion and $80 million at our coal operations, which includes $50 million for the Neptune Terminals expansion. New mine development in 2013 includes $450 million for Quebrada Blanca Phase 2, $70 million for Relincho, $120 million for Quintette and $110 million for our Frontier oil sands project.
The amount and timing of actual capital expenditures is also dependent upon being able to secure permits, equipment, supplies, materials and labour on a timely basis and at expected costs to enable the projects to be completed as currently anticipated. We may change capital spending plans for the balance of this year and next, depending on commodity markets, our financial position, results of feasibility studies and other factors.
Foreign Exchange and Debt Revaluation
The sales of our products are denominated in U.S. dollars, while a significant portion of our expenses are incurred in local currencies, particularly the Canadian dollar. Foreign exchange fluctuations can have a significant effect on our operating margins, unless such fluctuations are offset by related changes to commodity prices.
Our U.S. dollar denominated debt is subject to revaluation based on changes in the Canadian/U.S. dollar exchange rate. As at December 31, 2012, all of our U.S. dollar denominated debt is designated as a hedge against our U.S. dollar denominated foreign operations and working capital items. As a result, any foreign exchange gains or losses arising on our designated U.S. dollar debt are recorded in other comprehensive income.
Taxes
In September, the Chilean government approved a tax reform bill retroactively effective to January 1, 2012
| Teck 2012 Management’s Discussion and Analysis | 32 |
that increased the corporate first category income tax rate from 18.5% to 20%. The effective all-in corporate income tax rate, including withholding taxes on profits distributed out of Chile, remains at 35%.
Other Information
British Columbia Carbon Tax and Cap and Trade
The Province of British Columbia (B.C.) introduced a carbon tax on virtually all fossil fuels in 2008. The tax is imposed on various fossil fuels used in B.C. and, on July 1, 2012, the final increase planned by government saw the tax rate reach $30 per tonne of CO2-emission equivalent. For 2012, our seven B.C.-based operations paid $46 million in provincial carbon tax, primarily from our use of coal, diesel fuel and natural gas. We anticipate that this will increase to approximately $40–50 million in carbon tax in 2013 as the current tax rate will apply for the full calendar year. The B.C. government also established a greenhouse gas emissions reporting regulation. Beginning in 2010, the regulation required facilities in the province that emit over 10,000 tonnes of CO2-equivalent annually from regulated sources to report their emissions and those that emit over 25,000 tonnes per year from regulated sources to obtain independent verification of their emissions. These obligations, including third-party verification where required, were met in 2012 for the 2011 performance of our seven B.C.-based operations. The B.C. government was expected to implement greenhouse gas cap-and-trade regulations in 2012 as part of its Western Climate Initiative commitments. These regulations have not materialized and it is not known when or whether they will be established.
Financial Instruments and Derivatives
We hold a number of financial instruments and derivatives, which are recorded on our balance sheet at fair value with gains and losses in each period included in other comprehensive income and profit for the period as appropriate. The most significant of these instruments are marketable securities, foreign exchange forward sales contracts, metal-related forward contracts and settlements receivable and payable. Some of our gains and losses on metal-related financial instruments are affected by smelter price participation and are taken into account in determining royalties and other expenses. All are subject to varying rates of taxation depending on their nature and jurisdiction.
Critical Accounting Estimates and Judgments
In preparing consolidated financial statements, management has to make estimates and judgments that affect the reported amounts of assets, liabilities, revenues and expenses. Based on historical experience and other factors, including expectations of future events, management makes judgments that are believed to be reasonable under the circumstances. Actual results could differ from our estimates. Critical accounting estimates are those that could affect the consolidated financial statements materially and involve a significant level of judgment by management. Management’s critical accounting estimates apply to the assessment of the impairment of goodwill, the estimated recoverable reserves and resources, and the valuation of other assets and liabilities such as decommissioning and restoration provisions and accounting for income taxes.
Goodwill Impairment Testing
We allocate goodwill arising from business combinations to the cash-generating unit or group of cash-generating units acquired that is expected to receive the benefits from the business combination. When performing annual goodwill impairment tests, we are required to determine the recoverable amount of each cash-generating unit or group of cash-generating units to which goodwill has been allocated. The recoverable amount of each cash-generating unit or group of cash-generating units is determined as the higher of its fair value less cost to sell and its value in use.
| Teck 2012 Management’s Discussion and Analysis | 33 |
We determine the recoverable amount of individual cash-generating units or groups of cash-generating units by using discounted cash flow models prepared by internal experts with assistance from third-party advisors when required. Significant assumptions used include commodity prices, mineral reserves and resources, operating costs, capital expenditures, discount rates, foreign exchange rates and inflation rates. The assumptions used are based on management’s best estimates and are reviewed by senior management. Significant judgment is applied and changes in these assumptions may alter the results of goodwill impairment testing, impairment charges recorded in the income statement and the resulting carrying values of assets.
We did not record any impairment of our goodwill balances in 2012. Significant changes to long-term commodity prices and discount rates would be required before impairment would be indicated.
Estimated Recoverable Reserves and Resources
Mineral reserve and resource estimates are based on various assumptions relating to operating matters. These include production costs, mining and processing recoveries, cut-off values or grades, and assumptions relating to long-term commodity prices. In some cases, mineral reserve and resource estimates are further affected by exchange rates, inflation rates and capital costs assumptions. Cost estimates are based on feasibility study estimates or operating history. Estimates are prepared by appropriately qualified persons, but will be affected by forecasted commodity prices, inflation rates, exchange rates, capital and production costs and recoveries, amongst other factors.
Estimated recoverable reserves and resources are used to determine the depreciation of property plant and equipment at operating mine sites, in accounting for deferred stripping costs, in performing impairment testing and for forecasting the timing of the payment of decommissioning and restoration costs. Therefore, changes in the assumptions used could change the carrying value of assets, depreciation and impairment charges recorded in the income statement and the carrying value of the decommissioning and restoration provision.
Decommissioning and Restoration Provisions
The decommissioning and restoration provisions (DRP) are based on future costs estimates using information available at the balance sheet date. These estimates are based on engineering studies of the work that is required by environmental laws or public statements by management that results in an obligation.
The DRP is adjusted at each reporting period for changes to factors such as the expected amount of cash flows required to discharge the liability, the timing of such cash flows and the discount rate. The DRP requires other significant estimates and assumptions such as requirements of the relevant legal and regulatory framework, and the timing, extent and costs of required decommissioning and restoration activities. To the extent the actual costs differ from these estimates, adjustments will be recorded and the income statement may be affected.
Current and Deferred Income Taxes
The determination of our tax expense for the year and its deferred tax liabilities and assets involves significant management estimate and judgment involving a number of assumptions. In determining these amounts, management interprets tax legislation in a variety of jurisdictions and makes estimates of the expected timing of the reversal of deferred tax assets and liabilities. Deferred tax liabilities arising from temporary differences on investments in subsidiaries and joint ventures are recognized unless the reversal of the temporary differences is not expected to occur in the foreseeable future and can be controlled.
| Teck 2012 Management’s Discussion and Analysis | 34 |
Management also makes estimates of future taxable profits, which affects the extent to which potential future tax benefits may be used. Assumptions about the generation of future taxable profits and repatriation of retained earnings depend on management’s estimates of future production and sales volumes, commodity prices, reserves, operating costs, decommissioning and restoration costs, capital expenditures, dividends and other capital management transactions. We are subject to assessments by various taxation authorities who may interpret tax legislation differently. These differences may affect the final amount or timing of the payment of taxes. We provide for these differences, where known, based on management’s best estimate of the probable outcome of these matters.
Adoption of New Accounting Standards and Accounting Developments
New International Financial Reporting Standards (IFRS) pronouncements have been issued and will have an effect on our financial statements beginning on January 1, 2013. The following is a summary of the IFRSs that we will apply effective January 1, 2013 and the expected effect on our consolidated financial statements.
Consolidated Financial Statements
In May 2011, the IASB issued IFRS 10, Consolidated Financial Statements (IFRS 10). IFRS 10 establishes principles for the presentation and preparation of consolidated financial statements when an entity controls one or more other entities. This IFRS defines the principle of control and establishes control as the basis for determining which entities are consolidated in an entity’s consolidated financial statements. IFRS 10 sets out three elements of control: power over the investee; exposure, or rights, to variable returns from involvement with the investee; and the ability to use power over the investee to affect the amount of the investors’ return. IFRS 10 sets out the requirements on how to apply the control principle. IFRS 10 supersedes International Accounting Standards (IAS) 27, Consolidated and Separate Financial Statements and Standing Interpretations Committee (SIC) 12, Consolidation – Special Purpose Entities.
We will apply IFRS 10 beginning on January 1, 2013. We have substantially completed our analysis of IFRS 10 and do not expect any significant changes to our consolidated financial statements as a result of adopting this standard.
Joint Arrangements
In May 2011, the IASB issued IFRS 11, Joint Arrangements (IFRS 11), which provides guidance on accounting for joint arrangements. If an arrangement results in joint control, IFRS 11 classifies joint arrangements as either joint operations or joint ventures, depending on the rights and obligations of the parties involved.
A joint operation is an arrangement where the jointly controlling parties have rights to the assets and obligations in respect of the liabilities relating to the arrangement. An entity accounts for a joint operation by recognizing its portion of the assets, liabilities, revenues and expenses. A joint venture is an arrangement where the jointly controlling parties only have rights to the net assets of the arrangement. A joint venture is accounted for using the equity method.
We will apply IFRS 11 as at January 1, 2013, with retrospective application from the date of our earliest period presented, which will be January 1, 2012. We have substantially completed an analysis of all of our joint arrangements to determine the appropriate accounting treatment under the new standard, as it is our current accounting policy to proportionately consolidate all of our joint ventures. Based on our analysis to date, we expect that all of our joint arrangements will be considered joint operations under IFRS 11 and, accordingly, we will record the assets, liabilities, revenues and expenses in relation to our interest in each
| Teck 2012 Management’s Discussion and Analysis | 35 |
joint operation. As at the date of financial statement approval, we do not expect the adoption of IFRS 11 to result in significant changes to our consolidated financial statements.
Disclosures of Interests in Other Entities
In May 2011, the IASB issued IFRS 12, Disclosures of Interests in Other Entities (IFRS 12), which outlines the disclosure requirements for interests in subsidiaries and other entities to enable users to evaluate the risks associated with interests in other entities and the effects of those interests on an entity’s financial position, financial performance and cash flows.
We will apply IFRS 12 beginning on January 1, 2013. We have substantially completed our analysis of IFRS 12 and expect to include additional disclosures about interests in other entities in our annual consolidated financial statements for the year ended December 31, 2013.
Fair Value Measurement
In May 2011, the IASB issued IFRS 13, Fair Value Measurement (IFRS 13). This standard defines fair value, sets out a single IFRS framework for measuring fair value and outlines disclosure requirements about fair value measurements.
IFRS 13 defines fair value as the price that would be received to sell an asset or paid to transfer a liability in an orderly transaction between market participants at the measurement date. Fair value is a market-based measurement, not an entity-specific measurement, so assumptions that market participants would use should be applied in measuring fair value.
We will apply IFRS 13 prospectively beginning on January 1, 2013. The disclosure requirements of IFRS 13 do not need to be applied in comparative periods before initial application. We have substantially completed our analysis of IFRS 13 and do not expect the adoption to result in significant changes to our consolidated financial statements.
Other Comprehensive Income
In June 2011, the IASB and the Financial Accounting Standards Board (FASB) issued amendments to standards to align the presentation requirements for other comprehensive income. The IASB issued amendments to IAS 1, Presentation of Financial Statements (IAS 1) to require companies preparing financial statements under IFRS to group items within other comprehensive income that may be reclassified to profit or loss. We will apply this amendment to IAS 1 in our consolidated financial statements beginning in 2013. We will present these changes in our consolidated statement of comprehensive income in our consolidated financial statements in the first quarter of 2013.
Post-Employment Benefits
In June 2011, the IASB issued an amended version of IAS 19, Employee Benefits (IAS 19). For defined benefit plans, the amendments eliminate the option to defer actuarial gains and losses on the balance sheet through the “corridor method”. The amendments also require any remeasurement gains or losses, including actuarial gains and losses, to be recognized immediately and presented in other comprehensive income, eliminating the option to recognize and present these through the income statement. The amendments to IAS 19 require one discount rate to be applied to the net asset or liability for the purposes of determining the interest element of the pension cost and require the recognition of unvested past service cost awards into profit immediately. There is also a requirement to change the presentation of finance income and finance expense as a net finance expense (income) amount in the consolidated financial statements. Additional disclosures will also be required to present better information about the characteristics, amounts recognized
| Teck 2012 Management’s Discussion and Analysis | 36 |
and risks related to defined benefit plans.
We will apply the amendments to IAS 19 starting on January 1, 2013 with retrospective application and have substantially completed our analysis of the amendments. We expect changes to our consolidated financial statements as a result of the requirement to recognize unvested past service cost awards into profit immediately. We also expect an increase in our finance expense (income) for underfunded plans as a result of the application of one discount rate.
We are in the process of calculating the effect of these amendments to IAS 19 on our comparative consolidated financial statements for all periods in 2012. We do not expect the amendments in IAS 19 to significantly change our 2012 comparative consolidated financial statements.
Production Stripping Costs
In October 2011, the IASB issued IFRIC 20, Stripping Costs in the Production Phase of a Surface Mine (IFRIC 20). The interpretation provides guidance on how to account for overburden waste removal stripping costs in the production phase of a surface mine. Stripping activity related to inventory produced is accounted for in accordance with IAS 2, Inventories. Stripping activity that improves access to ore is accounted for as an addition to or enhancement of an existing asset.
We have substantially completed our analysis of IFRIC 20 and are in the process of calculating the effect on our consolidated financial statements for the 2012 comparative periods. We will apply IFRIC 20 prospectively from January 1, 2012.
Based on our analysis to date, we have identified components of our orebodies to be phases, pits or sub-pits depending on the orebody being analyzed. These components align with how we view each mine and plan our mining activities. Previously, we recorded stripping activity assets only relating to major expansions. Under IFRIC 20, we will be required to recognize stripping activity assets when we meet the following three criteria:
| | — | It is probable that the future economic benefit (improved access to the orebody) associated with the stripping activity will flow to the entity; |
| | — | The entity can identify the component of the orebody for which access has been improved; and |
| | — | The costs relating to the stripping activity associated with that component can be measured reliably. |
Stripping activity assets capitalized under IFRIC 20 will be classified consistently with the assets that they relate to within property, plant and equipment. These assets will be amortized on a units-of-production basis over the remaining reserves of the respective components.
We are in the process of calculating the impact of IFRIC 20 on our comparative consolidated financial statements for all periods of 2012. We expect to capitalize significant stripping activity assets in 2012 under the requirements of IFRIC 20.
Control Activities
For all changes to policies and procedures that have been identified relating to the above items, the effectiveness of internal controls over financial reporting and disclosure controls and procedures have been assessed and any changes have been implemented. We have identified and implemented accounting process changes relating to the above new policies and these changes were not significant. We applied our existing control framework to the implementation of the new standards. All accounting policy changes and
| Teck 2012 Management’s Discussion and Analysis | 37 |
financial effects are subject to review by senior management and the Audit Committee of the Board of Directors.
Business Activities, Key Performance Measures and Information Systems
We do not expect the preceding changes to significantly affect our financial covenants or key ratios. The implementation of the above IFRS pronouncements is not expected to significantly impact our information systems.
Outstanding Share Data
As at February 20, 2013, there were 572,936,551 Class B subordinate voting shares and 9,353,470 Class A common shares outstanding. In addition, there were 8,893,876 employee stock options outstanding, with exercise prices ranging between $4.15 and $58.80 per share. More information on these instruments and the terms of their conversion are set out in the equity note to our 2012 consolidated financial statements.
Contractual and Other Obligations
| ($ in millions) | | Less than 1 Year | | | 1–3 Years | | | 4–5 Years | | | More than 5 Years | | | Total | |
| | | | | | | | | | | | | | | | |
| Debt | | $ | 380 | | | $ | 1,017 | | | $ | 1,246 | | | $ | 11,083 | | | $ | 13,726 | |
| Operating leases | | | 55 | | | | 46 | | | | 28 | | | | 19 | | | | 148 | |
| Capital leases | | | 34 | | | | 11 | | | | 5 | | | | 27 | | | | 77 | |
| Road and port lease at Red Dog (Note 1) | | | 18 | | | | 35 | | | | 35 | | | | 240 | | | | 328 | |
| Minimum purchase obligations (Note 2) | | | | | | | | | | | | | | | | | | | | |
| Concentrate, equipment and supply purchases | | | 830 | | | | 274 | | | | 131 | | | | 1 | | | | 1,236 | |
| Shipping and distribution | | | 77 | | | | 13 | | | | 5 | | | | 1 | | | | 96 | |
| Pension funding (Note 3) | | | 143 | | | | – | | | | – | | | | – | | | | 143 | |
| Other non-pension post-retirement benefits (Note 4) | | | 12 | | | | 27 | | | | 31 | | | | 429 | | | | 499 | |
| Decommissioning and restoration provision (Note 5) | | | 38 | | | | 95 | | | | 66 | | | | 1,190 | | | | 1,389 | |
| Other long-term liabilities (Note 6) | | | 17 | | | | 22 | | | | 15 | | | | 24 | | | | 78 | |
| Contributions to the Fort Hills oil sands project (Note 7) | | | 289 | | | | 884 | | | | – | | | | – | | | | 1,173 | |
| | | $ | 1,893 | | | $ | 2,424 | | | $ | 1,562 | | | $ | 13,014 | | | $ | 18,893 | |
Notes:
| (1) | We lease road and port facilities from the Alaska Industrial Development and Export Authority through which we ship metal concentrates produced at the Red Dog mine. Minimum lease payments are US$18 million per annum and are subject to deferral and abatement for force majeure events. |
| (2) | The majority of our minimum purchase obligations are subject to continuing operations and force majeure provisions. |
| (3) | As at December 31, 2012, the company had a net pension deficit of $255 million based on actuarial estimates prepared on a going concern basis. The amount of minimum funding for 2013 in respect of defined benefit pension plans is $143 million. The timing and amount of additional funding after 2013 is dependent upon future returns on plan assets, discount rates and other actuarial assumptions. |
| (4) | We had a discounted, actuarially determined liability of $499 million in respect of other non-pension post-retirement benefits as at December 31, 2012. Amounts shown are estimated expenditures in the indicated years. |
| (5) | We accrue environmental and reclamation obligations over the life of our mining operations and amounts shown are estimated expenditures in the indicated years at fair value, assuming credit-adjusted risk-free discount rates between 4.95% and 5.95% and an inflation factor of 2.00%. |
| (6) | Other long-term liabilities include amounts for post-closure, environmental costs and other items. |
| (7) | In November 2005, we acquired a 15% interest in the Fort Hills Energy Limited Partnership, which is developing the Fort Hills oil sands project in Alberta, Canada. In September 2007, we acquired an additional 5% interest, bringing our total interest to 20%. To earn our additional 5% interest, we are required to contribute 27.5% of $5 billion of project expenditures after project spending reaches $2.5 billion. We are presently funding at this level. Thereafter, we are responsible for our 20% share of development costs. As a decision to proceed with the project has not yet been made, no additional commitments beyond our earn-in commitment are presently shown. In the event of project abandonment, as agreed to by the partners, monies held by the Fort Hills Energy Limited Partnership would be returned to the partners in the respective equity ratios after having fulfilled all funding obligations to an aggregate of $7.5 billion. |
| Teck 2012 Management’s Discussion and Analysis | 38 |
Disclosure Controls and Internal Control Over Financial Reporting
Disclosure Controls and Procedures
Disclosure controls and procedures are designed to provide reasonable assurance that information required to be disclosed in reports filed or submitted by us under U.S. and Canadian securities legislation is recorded, processed, summarized and reported within the time periods specified in those rules and include controls and procedures designed to ensure that information required to be disclosed in reports filed or submitted by us under U.S. and Canadian securities legislation is accumulated and communicated to management, including the Chief Executive Officer and Chief Financial Officer, as appropriate to permit timely decisions regarding required disclosure. Management, including the Chief Executive Officer and Chief Financial Officer, has evaluated the effectiveness of the design and operation of our disclosure controls and procedures, as defined in the rules of the U.S. Securities and Exchange Commission and the Canadian Securities Administrators, as at December 31, 2012. Based on this evaluation, the Chief Executive Officer and Chief Financial Officer have concluded that our disclosure controls and procedures were effective as at December 31, 2012.
Management’s Report on Internal Control Over Financial Reporting
Our management is responsible for establishing and maintaining adequate internal control over financial reporting. Any system of internal control over financial reporting, no matter how well designed, has inherent limitations. Therefore, even those systems determined to be effective can provide only reasonable assurance with respect to financial statement preparation and presentation. Management has used the Committee of Sponsoring Organizations of the Treadway Commission (COSO) framework to evaluate the effectiveness of our internal control over financial reporting. Based on this assessment, management has concluded that as at December 31, 2012, our internal control over financial reporting was effective.
The effectiveness of our internal controls over financial reporting has been audited by PricewaterhouseCoopers LLP, an independent registered public accounting firm, who have expressed their opinion in their report included with our annual consolidated financial statements.
Use of Non-GAAP Financial Measures
Our financial results are prepared in accordance with International Financial Reporting Standards (IFRS). This document refers to gross profit before depreciation and amortization, EBITDA, adjusted profit, adjusted earnings per share, total debt, net debt, debt to debt-plus-equity ratio, and the net debt to net debt-plus-equity ratio, which are not measures recognized under IFRS in Canada and do not have a standardized meaning prescribed by IFRS or Generally Accepted Accounting Principles (GAAP) in the United States.
Gross profit before depreciation and amortization is gross profit with depreciation and amortization added back. EBITDA is profit attributable to shareholders before net finance expense, income and resource taxes, and depreciation and amortization. For adjusted profit, we adjust profit attributable to shareholders as reported to remove the effect of certain kinds of transactions in these measures. Adjusted earnings per share is calculated by dividing the adjusted profit amount by our reported weighted average shares outstanding. Net debt is total debt less cash and cash equivalents. The debt to debt-plus-equity ratio takes total debt as reported and divides that by the sum of total debt plus total equity. The net debt to net debt-plus-equity ratio takes total debt as reported, and divides that by the sum of net debt plus total equity.
These measures may differ from those used by different issuers, and may not be comparable to such measures as reported by others. We disclose these measures, which have been derived from our financial statements and applied on a consistent basis, because we believe they assist readers in understanding the
| Teck 2012 Management’s Discussion and Analysis | 39 |
results of our operations and financial position and are meant to provide further information about our financial results to investors.
| Reconciliation of Gross Profit Before Depreciation and Amortization | |
| ($ in millions) | | 2012 | | | 2011 | | | 2010 | |
| | | | | | | | | | |
| Gross profit | | $ | 3,066 | | | $ | 4,877 | | | $ | 3,522 | |
| Depreciation and amortization | | | 951 | | | | 911 | | | | 916 | |
| Gross profit before depreciation and amortization | | $ | 4,017 | | | $ | 5,788 | | | $ | 4,438 | |
| | | | | | | | | | | | | |
| Reported as: | | | | | | | | | | | | |
| Copper | | | | | | | | | | | | |
| Highland Valley Copper | | $ | 513 | | | $ | 486 | | | $ | 487 | |
| Antamina | | | 633 | | | | 588 | | | | 420 | |
| Quebrada Blanca | | | 82 | | | | 255 | | | | 406 | |
| Carmen de Andacollo | | | 225 | | | | 288 | | | | 91 | |
| Duck Pond | | | 42 | | | | 57 | | | | 58 | |
| Other | | | 5 | | | | – | | | | – | |
Coal | | | 2,033 | | | | 3,306 | | | | 2,261 | |
| | | | | | | | | | | | | |
| Zinc | | | | | | | | | | | | |
| Red Dog | | | 418 | | | | 547 | | | | 571 | |
| Trail | | | 64 | | | | 256 | | | | 155 | |
| Other | | | (2 | ) | | | 2 | | | | 9 | |
| Inter-segment sales | | | – | | | | 3 | | | | (20 | ) |
| Energy | | | 4 | | | | – | | | | – | |
| Gross profit before depreciation and amortization | | $ | 4,017 | | | $ | 5,788 | | | $ | 4,438 | |
| Reconciliation of Profit Attributable to Shareholders to EBITDA | |
| ($ in millions) | | 2012 | | | 2011 | | | 2010 | |
| | | | | | | | | | |
| Profit attributable to shareholders | | $ | 811 | | | $ | 2,668 | | | $ | 1,820 | |
| Finance expense net of finance income | | | 442 | | | | 482 | | | | 596 | |
| Provision for income and resource taxes | | | 615 | | | | 1,398 | | | | 994 | |
| Depreciation and amortization | | | 951 | | | | 911 | | | | 916 | |
| EBITDA | | $ | 2,819 | | | $ | 5,459 | | | $ | 4,326 | |
| Teck 2012 Management’s Discussion and Analysis | 40 |
| Quarterly Reconciliation | |
| ($ in millions) | | 2012 | | | 2011 | |
| | | | Q4 | | | | Q3 | | | | Q2 | | | | Q1 | | | | Q4 | | | | Q3 | | | | Q2 | | | | Q1 | |
| Profit attributable to shareholders | | $ | 145 | | | $ | 180 | | | $ | 268 | | | $ | 218 | | | $ | 637 | | | $ | 814 | | | $ | 756 | | | $ | 461 | |
| Finance expense net of finance income | | | 74 | | | | 116 | | | | 118 | | | | 134 | | | | 134 | | | | 133 | | | | 109 | | | | 106 | |
| Provision for income and resource taxes | | | 66 | | | | 186 | | | | 147 | | | | 216 | | | | 311 | | | | 470 | | | | 366 | | | | 251 | |
| Depreciation and amortization | | | 242 | | | | 239 | | | | 257 | | | | 213 | | | | 222 | | | | 243 | | | | 230 | | | | 216 | |
| EBITDA | | $ | 527 | | | $ | 721 | | | $ | 790 | | | $ | 781 | | | $ | 1,304 | | | $ | 1,660 | | | $ | 1,461 | | | $ | 1,034 | |
| Teck 2012 Management’s Discussion and Analysis | 41 |
Caution on Forward-Looking Information
This document contains certain forward-looking information and forward-looking statements as defined in applicable securities laws. All statements other than statements of historical fact are forward-looking statements. These forward-looking statements, principally under the heading “Outlook”, but also elsewhere in this document, include estimates, forecasts and statements as to management’s expectations with respect to, among other things, mine life, anticipated production at our business units and individual operations, costs at our business units and individual operations, our expectation that we will meet our production guidance, sales volume and selling prices for our products (including settlement of coal contracts with customers), plans and expectations for our development projects, including resulting increases in forecast operating costs and costs of product sold, expected production, expected progress, costs and outcomes of our various projects and investments, including, but not limited to, those described in the discussions of our operations, the sensitivity of our profit to changes in commodity prices and exchange rates, the effect of potential production disruptions, the effect of currency exchange rates, our expectations for the general market for our commodities, future trends for the company, increased coal and copper production as a result of our expansion plans, results of our mill modernization program at Highland Valley Copper, reduced operating costs as a result of our restructuring plan at Quebrada Blanca, timing of the re-filing of the SEIA for the Quebrada Blanca Phase 2 project, our estimates of the effect of measures to manage selenium discharges and costs related thereto, the timing of permit approval, production and anticipated production levels from the Quintette mine, timing and results of the Neptune Bulk Terminals capacity expansions, timing of operation of our new acid plant at Trail Operations, the statements under the heading “Energy” regarding timing of sanction, production permitting decisions, timing of final supplemental information requests on our Frontier project and our responses to the review process thereto, anticipated capital expenditures and demand and market outlook for commodities. These forward-looking statements involve numerous assumptions, risks and uncertainties and actual results may vary materially.
These statements are based on a number of assumptions, including, but not limited to, assumptions regarding general business and economic conditions, the supply and demand for, deliveries of, and the level and volatility of prices of zinc, copper and coal and other primary metals and minerals as well as oil, and related products, the timing of the receipt of regulatory and governmental approvals for our development projects and other operations, our costs of production and production and productivity levels, as well as those of our competitors, power prices, continuing availability of water and power resources for our operations, market competition, the accuracy of our reserve estimates (including with respect to size, grade and recoverability) and the geological, operational and price assumptions on which these are based, conditions in financial markets, the future financial performance of the company, our ability to attract and retain skilled staff, our ability to procure equipment and operating supplies, positive results from the studies on our expansion projects, our coal and other product inventories, our ability to secure adequate transportation for our products, our ability to obtain permits for our operations and expansions, and our ongoing relations with our employees and business partners and joint venturers. Statements concerning timing of the re-filing of our SEIA for the Quebrada Blanca Phase 2 project are based on assumption of our ability to revise our application in response to comments in the time projected. Our selenium management plans are based on the assumptions, and subject to the factors, described under “Selenium Management”. The foregoing list of assumptions is not exhaustive. Events or circumstances could cause actual results to vary materially.
Factors that may cause actual results to vary materially include, but are not limited to, changes in commodity and power prices, changes in market demand for our products, changes in interest and currency exchange rates, acts of foreign governments and the outcome of legal proceedings, inaccurate geological and
| Teck 2012 Management’s Discussion and Analysis | 42 |
metallurgical assumptions (including with respect to the size, grade and recoverability of mineral reserves and resources), unanticipated operational difficulties (including failure of plant, equipment or processes to operate in accordance with specifications or expectations, cost escalation, unavailability of materials and equipment, government action or delays in the receipt of government approvals, changes in tax or royalty rates, industrial disturbances or other job action, adverse weather conditions and unanticipated events related to health, safety and environmental matters), union labour disputes, political risk, social unrest, failure of customers or counterparties to perform their contractual obligations, changes in our credit ratings, unanticipated increases in costs to construct our development projects, difficulty in obtaining permits, inability to address concerns regarding permits or environmental impact assessments, and changes or further deterioration in general economic conditions. Our Fort Hills project is not controlled by us and construction, sanction and production schedules may be adjusted by our partner.
Statements concerning future production costs or volumes, and the sensitivity of the company’s profit to changes in commodity prices and exchange rates, are based on numerous assumptions of management regarding operating matters and on assumptions that demand for products develops as anticipated, that customers and other counterparties perform their contractual obligations, that operating and capital plans will not be disrupted by issues such as mechanical failure, unavailability of parts and supplies, labour disturbances, interruption in transportation or utilities, adverse weather conditions, and that there are no material unanticipated variations in the cost of energy or supplies.
We assume no obligation to update forward-looking statements except as required under securities laws. Further information concerning risks and uncertainties associated with these forward-looking statements and our business can be found in our Annual Information Form for the year ended December 31, 2012, filed on SEDAR and on EDGAR under cover of Form 40-F.
| Teck 2012 Management’s Discussion and Analysis | 43 |