EXHIBIT 99.3
Management’s Discussion and Analysis
February 26, 2014
Management’s Discussion and Analysis
February 26, 2014
Management’s Discussion and Analysis
Our business is exploring for, acquiring, developing and producing natural resources. We are organized into business units focused on copper, steelmaking coal, zinc and energy. These are supported by our corporate business unit, which manages our corporate growth initiatives and provides administrative, technical, financial and other functions.
Through our interests in mining and processing operations in Canada, the United States (U.S.), Chile and Peru, we are the world’s second-largest exporter of seaborne high-quality steelmaking coal, an important producer of copper and one of the world’s largest zinc producers. We also produce lead, molybdenum, silver, and various specialty and other metals, chemicals and fertilizers. In addition, we own a 20% interest in the Fort Hills oil sands project, and interests in other significant assets in the Athabasca region of Alberta. We also actively explore for copper, zinc and gold.
This Management’s Discussion and Analysis of our results of operations is prepared as at February 26, 2014 and should be read in conjunction with our audited consolidated financial statements as at and for the year ended December 31, 2013. Unless the context otherwise dictates, a reference to Teck, Teck Resources, the Company, us, we, or our refers to Teck Resources Limited and its subsidiaries including Teck Metals Ltd. and Teck Coal Partnership. All dollar amounts are in Canadian dollars, unless otherwise stated, and are based on our consolidated financial statements that are prepared in accordance with International Financial Reporting Standards (IFRS). In addition, we use certain non-GAAP financial measures, which are identified throughout the Management’s Discussion and Analysis in this report. See “Use of Non-GAAP Financial Measures” on page 44 for an explanation of these financial measures and reconciliation to the most directly comparable financial measure under IFRS. Certain comparative amounts have been reclassified to conform to the presentation adopted for 2013.
This Management’s Discussion and Analysis contains certain forward-looking information and forward-looking statements. You should review the cautionary statement on forward-looking information under the heading “Caution on Forward-Looking Information” on page 47, which forms part of this Management’s Discussion and Analysis.
Additional information about us, including our most recent Annual Information Form, is available on the Canadian Securities Administrators website at www.sedar.com (SEDAR) and on the EDGAR section of the United States Securities and Exchange Commission (SEC) website at www.sec.gov.
| Teck 2013 Management’s Discussion and Analysis | Page 2 |
Business Unit Results
The table below shows our share of production of our major commodities for the last five years and estimated production for 2014.
Five-Year Production Record and Our Expected Share of Production in 2014
| | | Units | | | | | | | | | | | | | | | | | | | |
| | | (000’s) | | | | 2009 | | | | 2010 | | | | 2011 | | | | 2012 | | | | 2013 | | | 2014(2) estimate | |
| | | | | | | | | | | | | | | | | | | | | | | | | | | |
| Principal Products | | | | | | | | | | | | | | | | | | | | | | | | | | |
Copper(1) | | | | | | | | | | | | | | | | | | | | | | | | | | |
| Contained in concentrate | | tonnes | | | | 203 | | | | 216 | | | | 251 | | | | 307 | | | | 304 | | | | 278 | |
| Cathode | | tonnes | | | | 105 | | | | 97 | | | | 70 | | | | 66 | | | | 60 | | | | 52 | |
| | | | | | | 308 | | | | 313 | | | | 321 | | | | 373 | | | | 364 | | | | 330 | |
| | | | | | | | | | | | | | | | | | | | | | | | | | | | |
| Steelmaking coal | | tonnes | | | | 18,930 | | | | 23,109 | | | | 22,785 | | | | 24,652 | | | | 25,622 | | | | 26,500 | |
| | | | | | | | | | | | | | | | | | | | | | | | | | | | |
| Zinc | | | | | | | | | | | | | | | | | | | | | | | | | | | |
| Contained in concentrate | | tonnes | | | | 711 | | | | 645 | | | | 646 | | | | 598 | | | | 623 | | | | 570 | |
| Refined | | tonnes | | | | 240 | | | | 278 | | | | 291 | | | | 284 | | | | 290 | | | | 285 | |
| | | | | | | | | | | | | | | | | | | | | | | | | | | | |
| Other Products | | | | | | | | | | | | | | | | | | | | | | | | | | | |
| Lead | | | | | | | | | | | | | | | | | | | | | | | | | | | |
| Contained in concentrate | | tonnes | | | | 132 | | | | 110 | | | | 84 | | | | 95 | | | | 97 | | | | 97 | |
| Refined | | tonnes | | | | 73 | | | | 72 | | | | 86 | | | | 88 | | | | 86 | | | | 85 | |
| | | | | | | | | | | | | | | | | | | | | | | | | | | | |
| Molybdenum contained in concentrate | | pounds | | | | 7,798 | | | | 8,557 | | | | 10,983 | | | | 12,692 | | | | 8,322 | | | | 6,000 | |
| (1) | We include 100% of the production and sales from our Highland Valley Copper, Quebrada Blanca and Carmen de Andacollo mines in our production and sales volumes, even though we own 97.5%, 76.5% and 90%, respectively, of these operations, because we fully consolidate their results in our financial statements. We include 22.5% of production and sales from Antamina, representing our proportionate equity interest in Antamina. |
| (2) | Production estimate for 2014 represents the mid-range of our production guidance. |
| Teck 2013 Management’s Discussion and Analysis | Page 3 |
Average commodity prices and exchange rates for the past three years, which are key drivers of our profit, are summarized in the following table.
| | | US$ | | | CAD$ | |
| | | 2013 | | | % chg | | | 2012 | | | % chg | | | 2011 | | | 2013 | | | % chg | | | 2012 | | | % chg | | | 2011 | |
| | | | | | | | | | | | | | | | | | | | | | | | | | | | | | | |
| Copper (LME cash – $/pound) | | | 3.32 | | | | -8% | | | | 3.61 | | | | -10% | | | | 4.00 | | | | 3.42 | | | | -5% | | | | 3.61 | | | | -9% | | | | 3.96 | |
| Coal (realized – $/tonne) | | | 149 | | | | -23% | | | | 193 | | | | -25% | | | | 257 | | | | 153 | | | | -21% | | | | 194 | | | | -24% | | | | 254 | |
| Zinc (LME cash – $/pound) | | | 0.87 | | | | -1% | | | | 0.88 | | | | -11% | | | | 0.99 | | | | 0.90 | | | | +2% | | | | 0.88 | | | | -10% | | | | 0.98 | |
| Silver (LME PM fix – $/ounce) | | | 24 | | | | -23% | | | | 31 | | | | -11% | | | | 35 | | | | 25 | | | | -20% | | | | 31 | | | | -11% | | | | 35 | |
Molybdenum (Platts(1) – $/pound) | | | 10 | | | | -23% | | | | 13 | | | | -13% | | | | 15 | | | | 10 | | | | -23% | | | | 13 | | | | -13% | | | | 15 | |
| Lead (LME cash – $/pound) | | | 0.97 | | | | +3% | | | | 0.94 | | | | -14% | | | | 1.09 | | | | 1.00 | | | | +6% | | | | 0.94 | | | | -13% | | | | 1.08 | |
| Exchange rate (Bank of Canada) | | | | | | | | | | | | | | | | | | | | | | | | | | | | | | | | | | | | | | | | |
US$1 = CAD$ | | | 1.03 | | | | +3% | | | | 1.00 | | | | +1% | | | | 0.99 | | | | | | | | | | | | | | | | | | | | | |
CAD$1 = US$ | | | 0.97 | | | | -3% | | | | 1.00 | | | | -1% | | | | 1.01 | | | | | | | | | | | | | | | | | | | | | |
Note:
| (1) | Published major supplier selling price in Platts Metals Week. |
Our revenue and gross profit before depreciation and amortization by business unit are summarized in the following table.
| | | Revenues | | | Gross Profit Before Depreciation and Amortization(1) | |
| ($ in millions) | | 2013 | | | 2012 | | | 2011 | | | 2013 | | | 2012 | | | 2011(2) | |
| | | | | | | | | | | | | | | | | | | |
| Copper | | $ | 2,853 | | | $ | 3,142 | | | $ | 3,108 | | | $ | 1,391 | | | $ | 1,601 | | | $ | 1,674 | |
| Coal | | | 4,113 | | | | 4,647 | | | | 5,641 | | | | 1,729 | | | | 2,405 | | | | 3,306 | |
| Zinc | | | 2,410 | | | | 2,550 | | | | 2,765 | | | | 534 | | | | 497 | | | | 808 | |
| Energy | | | 6 | | | | 4 | | | | – | | | | 5 | | | | 4 | | | | – | |
| Total | | $ | 9,382 | | | $ | 10,343 | | | $ | 11,514 | | | $ | 3,659 | | | $ | 4,507 | | | $ | 5,788 | |
| (1) | Gross profit before depreciation and amortization is a non-GAAP financial measure. See “Use of Non-GAAP Financial Measures” section for further information. |
| (2) | 2011 results have not been restated for the new and amended accounting pronouncements. Please refer to Note 29 to our consolidated financial statements for the year ended December 31, 2013 for more details. |
| Teck 2013 Management’s Discussion and Analysis | Page 4 |
Copper
In 2013, we produced 364,300 tonnes of copper from Highland Valley Copper in British Columbia (B.C.), our 22.5% interest in Antamina in Peru, Quebrada Blanca and Carmen de Andacollo in Chile, and Duck Pond in Newfoundland. Copper production was above our 2013 guidance, with record production in the fourth quarter. We achieved a key milestone in 2013, with substantial mechanical completion of the mill optimization project at Highland Valley Copper. The completion of the optimization project is already providing benefits with higher mill throughput rates. Improved metal recoveries are expected once final commissioning and ramp-up activities are completed during the first half of 2014. After transitioning to open pit mining at our Duck Pond Operations in 2013, we have confirmed that closure will occur in early 2015 as the main orebody is depleted.
In 2014, we estimate copper production will be in the range of 320,000 to 340,000 tonnes, with similar production rates expected over the next few years. Production is expected to be lower than 2013, due mainly to lower production from Antamina as the mine enters a period of significantly lower grades consistent with the mine plan. Antamina is expected to gradually increase production after 2014 as grades improve, which, together with higher production from Highland Valley Copper, is expected to offset declines from the closure of Duck Pond and lower grades at Quebrada Blanca and Carmen de Andacollo.
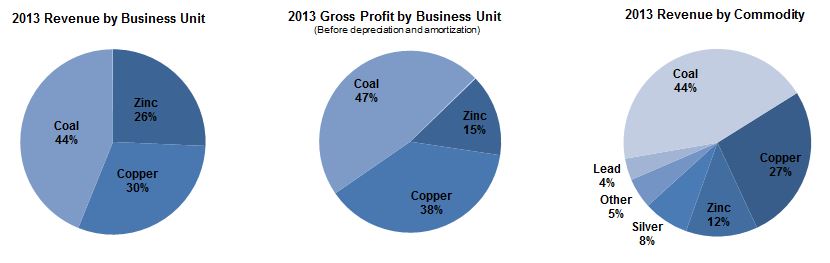
In 2013, our copper operations accounted for 30% of our revenue and 38% of our gross profit before depreciation and amortization.
| | | Revenues | | | Gross Profit Before Depreciation and Amortization | |
| ($ in millions) | | 2013 | | | 2012 | | | 2011 | | | 2013 | | | 2012 | | | 2011(1) | |
| | | | | | | | | | | | | | | | | | | |
| Highland Valley Copper | | $ | 882 | | | $ | 1,012 | | | $ | 997 | | | $ | 408 | | | $ | 530 | | | $ | 486 | |
| Antamina | | | 822 | | | | 897 | | | | 799 | | | | 596 | | | | 682 | | | | 588 | |
| Quebrada Blanca | | | 422 | | | | 499 | | | | 562 | | | | 121 | | | | 115 | | | | 255 | |
| Carmen de Andacollo | | | 606 | | | | 597 | | | | 608 | | | | 244 | | | | 227 | | | | 288 | |
| Duck Pond | | | 113 | | | | 130 | | | | 142 | | | | 19 | | | | 42 | | | | 57 | |
| Other | | | 8 | | | | 7 | | | | – | | | | 3 | | | | 5 | | | | – | |
| Total | | $ | 2,853 | | | $ | 3,142 | | | $ | 3,108 | | | $ | 1,391 | | | $ | 1,601 | | | $ | 1,674 | |
| (1) | 2011 results have not been restated for the new and amended accounting pronouncements. Please refer to Note 29 to our consolidated financial statements for the year ended December 31, 2013 for more details. |
| | | Production | | | Sales | |
| (000’s tonnes) | | 2013 | | | 2012 | | | 2011 | | | 2013 | | | 2012 | | | 2011 | |
| | | | | | | | | | | | | | | | | | | |
| Highland Valley Copper | | | 113 | | | | 116 | | | | 97 | | | | 112 | | | | 117 | | | | 104 | |
| Antamina | | | 100 | | | | 101 | | | | 75 | | | | 98 | | | | 101 | | | | 76 | |
| Quebrada Blanca | | | 56 | | | | 62 | | | | 64 | | | | 55 | | | | 62 | | | | 64 | |
| Carmen de Andacollo | | | 81 | | | | 80 | | | | 72 | | | | 83 | | | | 77 | | | | 69 | |
| Duck Pond | | | 14 | | | | 14 | | | | 13 | | | | 14 | | | | 15 | | | | 13 | |
| Total | | | 364 | | | | 373 | | | | 321 | | | | 362 | | | | 372 | | | | 326 | |
| Teck 2013 Management’s Discussion and Analysis | Page 5 |
Operations
Highland Valley Copper
We have a 97.5% interest in Highland Valley Copper, located in south-central B.C. Gross profit before depreciation and amortization was $408 million in 2013, compared to $530 million in 2012 and $486 million in 2011. Gross profit decreased in 2013 primarily due to lower copper and molybdenum prices and reduced sales volumes of both copper and molybdenum. Highland Valley Copper’s 2013 copper production was 113,200 tonnes of copper in concentrate, slightly lower than last year, primarily due to lower mill throughput as a result of shutdowns associated with the mill optimization project. Molybdenum production was 39% lower than 2012 levels at 6.1 million pounds, due to lower ore grades and recoveries.
Ore is currently mined from the Valley, Lornex and Highmont pits. The Valley pit is the main source of feed to the mill for the next few years while we continue the pre-stripping program to extend the Lornex pit, which will be an important feed source for the remainder of the current mine life. In 2013, work continued on defining resources in the Bethlehem area, which was previously mined in the 1960s and 1970s. The Bethlehem deposits have the potential to further extend the mine life and supplement feed to the mill within the next few years. Additional drilling and engineering studies are planned in 2014.
The mill optimization project includes the construction of new flotation and pebble-crushing capacity adjacent to the existing circuits, which is designed to increase plant availability and increase copper recovery by 2%, molybdenum recovery by 3% and annual mill throughput by 10% over the remaining life of the mine. The new pebble crushing facility and grinding line upgrades were commissioned in the third quarter and are operating as designed. The flotation plant started commissioning activities in early 2014.
As a result of completion of the mill optimization project, Highland Valley Copper is expected to produce between 100,000 and 150,000 tonnes of copper per year, depending on ore grades and hardness, for an average of 125,000 tonnes per year, until 2027, the current expected mine life.
Highland Valley Copper’s production in 2014 is expected to be in the range of 110,000 to 120,000 tonnes of copper. Molybdenum production in 2014 is expected to be in the range of five to six million pounds contained in concentrate.
Antamina
We have a 22.5% share interest in Antamina, a copper-zinc mine in Peru. The other shareholders are BHP Billiton plc (33.75%), Glencore Xstrata plc (33.75%) and Mitsubishi Corporation (10%). In 2013, our share of gross profit before depreciation and amortization was $596 million, compared with $682 million in 2012 and $588 million in 2011. The decline in gross profit in 2013 was primarily due to lower copper prices and reduced molybdenum revenues.
Copper production in 2013 was 443,000 tonnes, similar to 2012, after achieving record production for the second half of the year. This was primarily due to record milling throughput rates, which are expected to continue in 2014. Zinc production increased by 19% to 260,400 tonnes in 2013, primarily due to higher grades. Molybdenum production totalled 10.0 million pounds, which was 17% lower than in 2012, due to lower grades.
Although mill throughput rates are expected to continue to increase as a result of optimization initiatives, production in 2014 is expected to be significantly lower than 2013 as a result of feeding lower grade ore, both from active mine phases and from stockpiles, consistent with the mine plan. Antamina is a skarn deposit and
| Teck 2013 Management’s Discussion and Analysis | Page 6 |
grades can vary significantly, depending on which area of the open pit is being mined. A gradual return to higher production is expected after 2014 as grades improve.
Our 22.5% share of Antamina’s 2014 production is expected to be in the range of 75,000 to 80,000 tonnes of copper, 40,000 to 45,000 tonnes of zinc and approximately 1 million pounds of molybdenum in concentrate.
Quebrada Blanca
Quebrada Blanca is located in northern Chile, 240 kilometres southeast of the city of Iquique. We own a 76.5% share interest of Quebrada Blanca; the other shareholders are Inversiones Mineras S.A. (13.5%) and Empresa Nacional de Minería (ENAMI) (10%). The operation mines ore from an open pit and leaches the ore to produce copper cathodes via a conventional solvent extraction and electrowinning (SX-EW) process. Gross profit before depreciation and amortization was $121 million in 2013, compared with $115 million in 2012 and $255 million in 2011. Despite lower copper prices and declining production, Quebrada Blanca’s gross profit remained similar to 2012, as the mine achieved significant operating cost reductions in 2013.
In 2013, Quebrada Blanca produced 56,200 tonnes of copper cathode, compared to 62,400 tonnes in 2012. Despite ongoing challenges associated with aging plant equipment and lower ore grades, the restructuring plan put in place for 2013 was successful in substantially lowering operating costs, which decreased by US$90 million in 2013 compared with 2012. A continued focus on cost reduction and further improvements to the processing facilities and water management infrastructure are planned for 2014.
Production of approximately 45,000 to 50,000 tonnes of copper cathode is expected in 2014, as grades are forecasted to continue to decline as the supergene deposit is gradually depleted.
Work progressed on updating the permits for the existing facilities for the supergene operation, with an anticipated mine life that has some cathode production extending into 2020. We expect to submit the Social and Environmental Impact Assessment (SEIA) for the supergene facilities to the regulatory authorities in the second quarter of 2014.
The SEIA for Quebrada Blanca Phase 2 was submitted to Chilean authorities in 2012. We subsequently voluntarily withdrew the SEIA. The resubmission of the SEIA will depend to some extent on the progress of updating permits for the existing facilities. Our current expectation is that the Phase 2 SEIA will not be resubmitted before the end of 2014.
Detailed design work on the Quebrada Blanca Phase 2 project continued in 2013, although at a slower pace as a result of the permitting issues. The level of future engineering activities and associated costs are under review, with a further slowdown in activities anticipated in 2014. Certain commitments have been made by Quebrada Blanca in connection with the development of Quebrada Blanca Phase 2, including with respect to certain long-lead equipment and power purchase contracts. Quebrada Blanca is evaluating ways to manage its exposure in connection with these commitments in light of the permitting delays discussed above.
Carmen de Andacollo
We have a 90% share interest in the Carmen de Andacollo mine in Chile, which is located 350 kilometres north of Santiago. The remaining 10% is owned by ENAMI. Gross profit before depreciation and amortization was $244 million in 2013, compared with $227 million in 2012, and $288 million in 2011. Gross profit was higher in 2013, due to higher copper sales and lower operating costs, partially offset by lower copper prices.
| Teck 2013 Management’s Discussion and Analysis | Page 7 |
Carmen de Andacollo produced 76,800 tonnes of copper contained in concentrate in 2013, similar to 2012. Copper cathode production was 4,400 tonnes in 2013, compared with 4,000 tonnes in 2012. Gold production was 68,000 ounces compared with 57,600 ounces in 2012, with 75% of the gold produced for the account of Royal Gold Inc. pursuant to an agreement made in 2010.
Consistent with the mine plan, copper grades are expected to continue to decline in 2014 and in future years. Carmen de Andacollo’s production in 2014 is expected to be in the range of 65,000 to 75,000 tonnes of copper in concentrate and approximately 5,000 tonnes of copper cathode. Cathode production is currently planned until mid-2015, but further extensions could be possible, depending on economics and ore sources available.
Duck Pond
We own 100% of the Duck Pond underground copper-zinc mine located in central Newfoundland. Duck Pond’s gross profit before depreciation and amortization was $19 million in 2013, compared to $42 million in 2012 and $57 million in 2011. Gross profit declined in 2013, primarily due to lower copper prices.
Copper production in 2013 was 14,000 tonnes, similar to 2012. Zinc production was 12,700 tonnes compared with 19,500 tonnes of zinc production in 2012 as a result of significantly lower zinc grades.
Mining of the Boundary open pit began in 2013 and provides a supplemental feed source as underground reserves are depleted. An extension to the existing deposit at depth had been under review, but analysis of exploration results has shown that this deposit is not a viable option to extend the mine’s life. The current deposits being mined are expected to be exhausted in the first half of 2015, after which time the mine will be permanently closed. Closure and reclamation costs, which have been provided for, are estimated to be $10 million.
Duck Pond’s production in 2014 is expected to be approximately 14,000 to 16,000 tonnes of copper and approximately 15,000 tonnes of zinc.
Relincho
A feasibility study was completed in the fourth quarter of 2013 on our 100% owned Relincho project and concludes that developing a 173,000 tonnes-per-day concentrator and associated facilities would cost approximately US$4.5 billion (in August 2013 dollars, not including working capital or interest during construction) with an estimated mine life of 21 years, based on mineral reserves.
The total mineral reserve and mineral resource estimates for the project, as at December 31, 2013, are set out in the tables below. Mineral resources are reported separately from and do not include that portion of mineral resources that are classified as mineral reserves.
Mineral Reserves
| | | Tonnes (000’s) | | | %Copper | | | %Molybdenum | |
Proven | | | 435,300 | | | | 0.38 | | | | 0.016 | |
| Probable | | | 803,800 | | | | 0.37 | | | | 0.018 | |
| Total | | | 1,239,100 | | | | 0.37 | | | | 0.017 | |
| Teck 2013 Management’s Discussion and Analysis | Page 8 |
Mineral Resources
| | | Tonnes (000’s) | | | %Copper | | | %Molybdenum | |
Measured | | | 79,900 | | | | 0.27 | | | | 0.009 | |
| Indicated | | | 317,100 | | | | 0.34 | | | | 0.012 | |
| Inferred | | | 610,800 | | | | 0.38 | | | | 0.013 | |
Reserves have been reported within designed life of mine pits created during the feasibility study assuming prices of US$2.80 per pound for copper and US$13.70 per pound for molybdenum with a mining cost of US$0.95 per tonne of material moved, a processing cost of US$9.13 per tonne milled, and with assumed metallurgical recoveries of 88.8% for copper and 47.2% for molybdenum.
Estimated key project operating parameters are summarized in the following table.
| | | Years 2–6(1) | | | Life of Mine | |
Strip ratio (tonnes waste/tonnes ore) | | 1.28:1 | | | 1.28:1 | |
| Tonnes milled (nominal tonnes per day) | | 173,000 | | | 173,000 | |
| Copper grade (%Cu) | | 0.41% | | | 0.37% | |
| Molybdenum grade (%Mo) | | 0.018% | | | 0.017% | |
| Contained copper production (tonnes per annum) | | 228,000 | | | 207,000 | |
| Contained molybdenum production (tonnes per annum) | | 5,300 | | | 5,100 | |
C1 cash costs (US$)(2) | | 1.53 | | | 1.72 | |
Notes:
| (1) | First five years at full production rate. |
| (2) | C1 cash costs are presented after byproduct credit assuming US$10.00 per pound of molybdenum. |
Estimates of mineral reserves and resources have been prepared under the general supervision of Rodrigo Marinho, P.Geo., who is an employee of Teck and a qualified person for the purposes of National Instrument 43-101.
Given current economic conditions, no significant activities are planned for Relincho in 2014. We will work on optimization studies that will focus on capital and operating cost reductions and explore other ways to enhance the value of the project.
Other Copper Projects
In 2013, a work program, including approximately 12,000 metres of infill and geotechnical drilling, was completed at the 50% owned Galore Creek project, located in northwest B.C. A small technical work program is planned for 2014 to incorporate the results of recent drilling activity and engineering studies, with no significant field activity planned.
In July 2013, Teck entered into a joint venture agreement to hold a 75% interest in the Schaft Creek project, a copper-gold exploration property situated in northwest B.C., approximately 26 kilometres northeast of the Galore Creek property. A small exploration and geotechnical drill program was completed in the third quarter of 2013. Some engineering studies will continue, but no drilling activities are currently planned for 2014.
Work on various engineering studies continued in 2013 at the 100% owned Mesaba copper-nickel project in northern Minnesota. While there are no drilling activities planned for 2014, engineering study work will continue to further our understanding of this longer term opportunity.
| Teck 2013 Management’s Discussion and Analysis | Page 9 |
In 2013, our CESL hydrometallurgical bench and pilot plant facility, located in Richmond, B.C., focused on evaluating proprietary technology applications. A pilot was conducted on Carmen de Andacollo copper-gold concentrates that recovered commercially competitive quantities of copper and gold, and generated preliminary cost information to inform next-stage engineering studies. An additional pilot was completed on copper-nickel-PGM concentrates from the same district as our Mesaba project that demonstrated high recovery of platinum group and precious metals to a saleable concentrate. In 2014, CESL will continue commercialization efforts on our proprietary technologies as well as executing technology pilot campaigns in support of Teck’s core businesses.
Markets
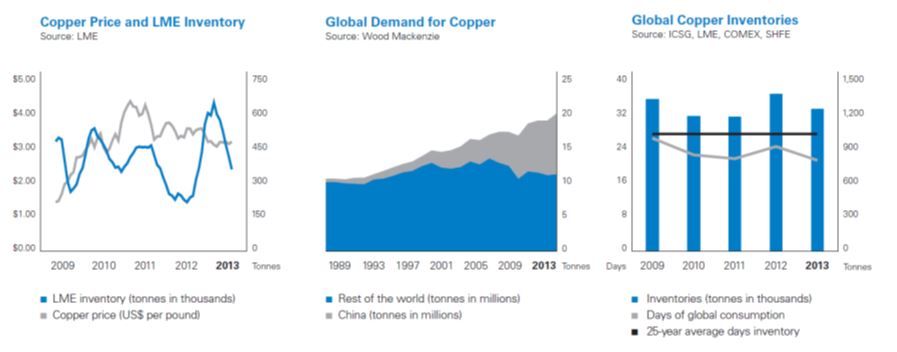
Copper prices on the London Metal Exchange (LME) averaged US$3.32 per pound in 2013, down US$0.29 per pound from the 2012 average.
Demand for copper metal grew by 5.6% in 2013 to reach an estimated 20.7 million tonnes globally. Growth outside of China improved in several regions in 2013, with improved growth in North America more than offsetting continued weakness in Europe. Growth in real demand in China is estimated at approximately 12%.
In 2013, global copper mine production increased 5.5% to just under 17.7 million tonnes, which was well below most estimates of mine production growth for the year. Copper scrap availability remained tight for most of 2013, with Chinese imports down 10% over the previous year. We expect that scrap will again play an important part of the supply picture in 2014, as demand for scrap will again likely outstrip total scrap availability.
Copper stocks in the LME, Shanghai and COMEX warehouses decreased 13.8% or 81,500 tonnes during the year. At year-end, total reported global stocks, which include producer, consumer, merchant and terminal stocks, stood at an estimated 25 days of global consumption versus the 25-year average of 28 days of global consumption.
Production disruptions continued to affect the market in 2013, with estimates of close to 1.2 million tonnes of planned production lost during the year. Based on a history of mine production shortfalls, combined with the difficulties in bringing new mine production to market on time, we continue to expect unplanned mine production disruptions to increase through 2014.
With global copper metal demand projected by Wood Mackenzie, a commodity research consultancy, to increase by 5.1% in 2014, projected supply is expected to exceed demand slightly, moving the refined market into a small surplus. If mine production continues to disappoint in 2014 from current projections, the refined market could again slip into deficit in 2014.
| Teck 2013 Management’s Discussion and Analysis | Page 10 |
| Teck 2013 Management’s Discussion and Analysis | Page 11 |
Coal
In 2013, our coal operations sold a record 26.9 million tonnes of steelmaking coal, 1.9 million tonnes above the previous high in 2004 when we had an effective 43.4% interest in the Elk Valley Coal Partnership. We produced 25.6 million tonnes of steelmaking coal in 2013, the majority of which was shipped to the Asia-Pacific region, with lesser amounts going primarily to Europe and the Americas. Our proven and probable reserves of more than 1 billion tonnes of coal position us to continue to meet global demand for many years. In addition, our measured and indicated resources now total over 3.6 billion tonnes and our inferred resources are over 2 billion tonnes of raw coal.
Our current production capacity is approximately 28 million tonnes. However, to align production rates with anticipated demand and to effectively manage inventories, we plan to produce 26 to 27 million tonnes of coal in 2014.
With the potential restart of our Quintette project, we could reach an annualized production capacity of approximately 31 million tonnes of coal per year, subject to permitting and customer demand, which will dictate our decision on the timing of the Quintette restart. Our actual production will be matched to the demand from our customers.
In 2013, our coal business unit accounted for 44% of revenue and 47% of gross profit before depreciation and amortization.
| ($ in millions) | | 2013 | | | 2012 | | | 2011(1) | |
| | | | | | | | | | |
| Revenues | | $ | 4,113 | | | $ | 4,647 | | | $ | 5,641 | |
| Gross profit before depreciation and amortization | | $ | 1,729 | | | $ | 2,405 | | | $ | 3,306 | |
| | | | | | | | | | | | | |
| Production (000’s tonnes) | | | 25,622 | | | | 24,652 | | | | 22,785 | |
| Sales (000’s tonnes) | | | 26,911 | | | | 23,989 | | | | 22,207 | |
| (1) | 2011 results have not been restated for the new and amended accounting pronouncements. Please refer to Note 29 to our consolidated financial statements for the year ended December 31, 2013 for more details. |
Operations
Gross profit before depreciation and amortization declined in 2013, primarily due to significantly lower coal prices, partially offset by significantly higher sales volumes and lower operating costs resulting from our successful cost reduction program. The average realized selling price in 2013 decreased to US$149 per tonne, compared with US$193 per tonne in 2012 and US$257 per tonne in 2011.
Coal sales volumes of 26.9 million tonnes increased 12%, or 2.9 million tonnes, from 2012 and were 1.9 million tonnes higher than the previous record in 2004.
Our 2013 production of 25.6 million tonnes increased from 2012 and was at the high end of our 2013 guidance, which had been revised upwards mid-year. This was due largely to strong demand from contract customers, sales to new customers, good spot sales and consistently strong performance of our logistics chain, including the expanded vessel loading capacity at Neptune Bulk Terminals.
| Teck 2013 Management’s Discussion and Analysis | Page 12 |
The cost of product sold in 2013, before transportation and depreciation charges, was $51 per tonne compared with $57 per tonne in 2012. The cost improvement is primarily due to productivity improvements in the areas of mining, maintenance and processing, in conjunction with further reductions in the consumption of key inputs, including repair parts, and minimizing the use of maintenance contractors and contract miners. These initiatives continue to expand as part of a coordinated cost reduction initiative across the company, which focuses on productivity improvement in mining, maintenance and processing operations, as well as the reduction of input consumption and overhead costs that can be maintained on an ongoing basis. In addition, we also had a number of one-time cost savings and deferrals that are not expected to occur on a regular basis.
Despite these cost reduction efforts, future costs per tonne could begin to increase over time from inflationary pressures on pricing for our key inputs, if we experience more difficult mining conditions, from changes in the Canadian dollar exchange rate and completion of any operating projects deferred from 2013. We expect our 2014 annual cost of product sold to be in the range of $55 to $60 per tonne based on our current production plans, reflecting longer haul distances and higher fuel prices.
In the third quarter of 2013 we received the necessary regulatory approvals for our Line Creek Phase 2 project, which represents the next phase of mining for our Line Creek Operations. The Line Creek Phase 2 project is expected to extend the life of the mine by approximately 19 years.
Capital spending in 2013 included $255 million for sustaining capital, $74 million for major enhancements to increase productive capacity and approximately $145 million for the Quintette project.
Elk Valley Water Management
In the course of mining we generate large quantities of rock that contains naturally occurring substances such as selenium. Water from both precipitation and runoff flows through rock piles and carries these substances into the local watershed. If present in high enough concentrations, those substances have the potential to adversely affect aquatic health. Although studies that we have commissioned have found no population-level effects on fish within the Elk Valley watershed to date, our research indicates that without additional measures, concentrations will increase over time to levels that may have ecological effects.
In February 2013, Teck submitted a draft valley-wide Selenium Management Action Plan to the B.C. provincial government, which proposed draft selenium concentration targets for the Elk Valley watershed and a water management strategy, including water diversion and treatment facilities in order to achieve those targets. While the provincial government did not adopt this plan, it led to an Area Based Management Plan Order in April 2013, which provided further clarity around the Province’s requirements for a water quality plan and a regulatory framework in which water quality can be managed on a regional basis.
The Order calls for Teck to develop an Elk Valley Water Quality Plan (Plan) to address the effects of selenium as well as other substances released by mining activities throughout the watershed, assess the associated economic and social costs and benefits of treatment, and establish the concentration targets and time frames required to stabilize and reduce levels of these substances over the short, medium and long term. The Plan will be informed by scientific advice received from a Technical Advisory Committee chaired by the B.C. Ministry of Environment, and including representatives from Teck, the U.S. Environmental Protection Agency, the State of Montana, the Ktunaxa First Nation, other provincial and federal agencies, and an independent scientist. The Plan is now being developed and is expected to be complete and submitted to the B.C. Ministry of Environment in the third quarter of 2014.
| Teck 2013 Management’s Discussion and Analysis | Page 13 |
While the previous draft valley-wide Selenium Management Action Plan contemplated total capital spending over the next five years of up to $600 million on the installation of water diversion and treatment facilities, the estimated capital and operating costs of implementing the Elk Valley Water Quality Plan are not yet known. The final costs will depend on the water quality targets established in the Plan, as well as the technologies applied to manage selenium and other substances. The initial cost estimate in the previous valley-wide Selenium Management Action Plan assumed the application of biological treatment technology, which is currently being installed in the water treatment plant under construction at our Line Creek operation. This facility is progressing satisfactorily towards expected commissioning in the second quarter of 2014. We are actively investigating alternative technologies with the potential to reduce treatment costs while ensuring water quality objectives are met.
Our work on the Plan is expected to result in revised cost estimates in the third quarter of 2014. We expect that, in order to maintain water quality, water treatment will need to continue for an indefinite period after mining operations end. Our ongoing work could reveal technical issues or advances associated with potential treatment technologies, which could substantially increase or decrease both capital and operating costs associated with water quality management. Delays in obtaining approval of the Plan could result in consequential delays in permitting new mining areas, which would limit our ability to maintain or increase coal production in accordance with our long-term plans. If this were to occur, the potential shortfall in future production could be material.
Quintette Project
We received a Mines Act Permit Amendment for our Quintette project in northeast B.C. in June 2013. The feasibility study contemplates an average clean coal production rate of 3.5 million tonnes per year over the estimated 12-year life of Quintette. After reviewing market conditions in the second quarter of 2013, we delayed the final decision to place Quintette into production. We are continuing to proceed with detailed engineering work so that we will be in a position to proceed with the reopening if market conditions are favourable. Production could commence within 14 months of a construction decision.
Rail
Rail transportation from our five mines in southeast B.C. for seaborne export is provided under a 10-year agreement with Canadian Pacific Railway (CP Rail) that commenced in April 2011. This agreement provides us with access to increased rail capacity to support our ongoing coal expansion and includes a commitment by CP Rail to invest capital to increase its capacity to transport coal. CP Rail’s investment in its network resulted in added capacity throughout 2013, with siding and loadout extensions carried out. As a result, all of our westbound trains are now running at 152 cars in length, compared with an average of 126 cars prior to the investment, allowing more coal to be transported with fewer trains. The eastbound agreement with CP Rail covering shipments to our North American customers expired at the end of 2013. Discussions for contract extension are underway.
Port
A number of key initiatives have been undertaken to ensure that we have access to terminal loading capacity in excess of our planned shipments. Neptune Bulk Terminals, in which we have a 46% ownership interest, expanded its annual coal throughput capacity from 9 million tonnes to 12.5 million tonnes in the summer of 2013 with the addition of a new stacker reclaimer. The feasibility study for the next expansion phase, to increase capacity from 12.5 million tonnes to 18.5 million tonnes, was completed in the fourth quarter of 2012 and detailed engineering is being carried out in parallel with permitting.
| Teck 2013 Management’s Discussion and Analysis | Page 14 |
In addition, Westshore Terminals (Westshore) completed the planned expansion of their capacity to 33 million tonnes per year. Our contract with Westshore provides us with 19 million tonnes of annual capacity from April 2014 through to March 2021.
Sales
A major focus of our coal marketing strategy has been to maintain and enhance relationships with our traditional customers while establishing new customers in markets where long-term growth in steel production and demand for seaborne steelmaking coal will support our expansion efforts over the long term. We are continuing to build our existing customer base and to establish important new customer relationships in China, India and other market areas to assist in achieving our growth objectives. In 2013, we exceeded previously established record sales into both China and India. In 2014, we are expecting China to continue to be our largest market; however, the ratio of Chinese sales to total sales will likely decline due to expected increases in sales to other market areas.
Markets
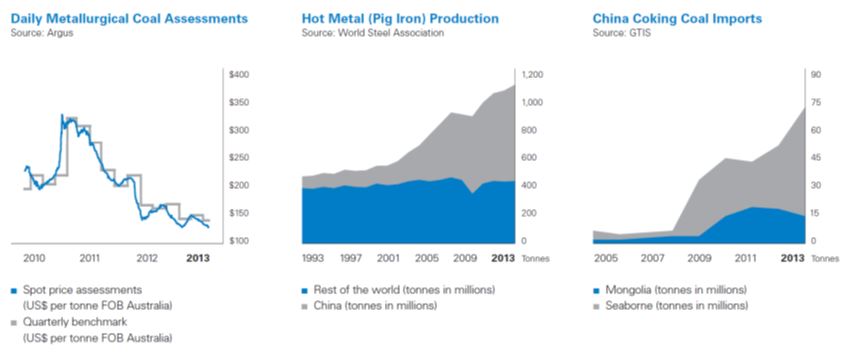
Sufficient supply of high-quality seaborne steelmaking coal and a large drop in pricing levels characterized 2013. Contributing factors leading to increased availability in steelmaking coal included mine expansions in Australia, the U.S. and Canada, production ramp-up in China and new supply areas, combined with recovery from severe weather disruptions and labour-related production shortfalls in Australia. Despite economic uncertainty across most market areas, steel production improved modestly in 2013, with China being the driving force behind the growth. Better availability of coal and increased utilization of lower grade coal by steelmakers to control costs in an environment of low steel prices caused the benchmark price for our highest quality products to decrease from US$165 per tonne earlier in the year to US$143 per tonne for the first quarter of 2014.
Spot price assessments declined in mid-2013 to levels not seen since the global financial crisis in 2009. Earlier in the year, a number of steelmakers moved to price a portion of their coal purchases on a spot basis to capitalize on the downward market trend. The lower pricing environment beginning in mid-2012 forced production cuts by a number of suppliers, with total reduction estimates ranging up to 40 million tonnes.
Coal prices continue to be weak. Expectations are that steel production will continue to increase in 2014 in a range similar to 2013, as a number of key market areas are showing signs of improving demand. More curtailment on the coal supply side would be required to bring the market into a healthier balance.
The graphs below show key metrics affecting steelmaking coal sales: spot price assessments and quarterly benchmark pricing, hot metal production (each tonne of hot metal, or pig iron, produced requires approximately 650–700 kilograms of steelmaking coal), and China’s steelmaking coal imports by source.
| Teck 2013 Management’s Discussion and Analysis | Page 15 |
| Teck 2013 Management’s Discussion and Analysis | Page 16 |
Zinc
We are one of the world’s largest producers of zinc, primarily from our Red Dog mine in Alaska and Antamina mine in northern Peru. Our metallurgical complex in Trail, B.C. is also one of the world’s largest integrated zinc and lead smelting and refining operations. In total, we produced 623,000 tonnes of zinc in concentrate while our Trail Operations produced 290,100 tonnes of refined zinc in 2013. In 2014, we estimate production of zinc in concentrate to be in the range of 555,000 to 585,000 tonnes and production of refined zinc to be in the range of 280,000 to 290,000 tonnes.
As an integrated metal producer, we also provide recycling solutions for metal-bearing scrap and residue. In 2013, we recycled 43,400 tonnes of material at our Trail Operations.
In 2013, our zinc business unit accounted for 26% of revenue and 15% of gross profit before depreciation and amortization.
| | | Revenues | | | Gross Profit Before Depreciation and Amortization | |
| ($ in millions) | | 2013 | | | 2012 | | | 2011 | | | 2013 | | | 2012 | | | 2011(1) | |
| | | | | | | | | | | | | | | | | | | |
| Red Dog | | $ | 874 | | | $ | 892 | | | $ | 1,008 | | | $ | 418 | | | $ | 440 | | | $ | 547 | |
| Trail | | | 1,751 | | | | 1,865 | | | | 1,989 | | | | 112 | | | | 59 | | | | 256 | |
| Other | | | 13 | | | | 7 | | | | 18 | | | | 4 | | | | (2 | ) | | | 2 | |
| Inter-segment sales | | | (228 | ) | | | (214 | ) | | | (250 | ) | | | – | | | | – | | | | 3 | |
| Total | | $ | 2,410 | | | $ | 2,550 | | | $ | 2,765 | | | $ | 534 | | | $ | 497 | | | $ | 808 | |
| | | Production | | | Sales | |
| (000’s tonnes) | | 2013 | | | 2012 | | | 2011 | | | 2013 | | | 2012 | | | 2011 | |
| | | | | | | | | | | | | | | | | | | |
| Refined zinc | | | | | | | | | | | | | | | | | | |
Trail | | | 290 | | | | 284 | | | | 291 | | | | 294 | | | | 287 | | | | 289 | |
| | | | | | | | | | | | | | | | | | | | | | | | | |
Contained in concentrate | | | | | | | | | | | | | | | | | | | | | | | | |
Red Dog | | | 551 | | | | 529 | | | | 572 | | | | 504 | | | | 510 | | | | 556 | |
Other business units | | | 72 | | | | 69 | | | | 74 | | | | 74 | | | | 68 | | | | 75 | |
| Total | | | 623 | | | | 598 | | | | 646 | | | | 578 | | | | 578 | | | | 631 | |
| (1) | 2011 results have not been restated for the new and amended accounting pronouncements. Please refer to Note 29 to our consolidated financial statements for the year ended December 31, 2013 for more details. |
Operations
Red Dog
Red Dog, located in northwest Alaska, is one of the world’s largest zinc mines. Red Dog’s gross profit before depreciation and amortization in 2013 was $418 million, compared with $440 million in 2012 and $547 million in 2011. The lower 2013 gross profit was mainly due to lower byproduct revenue from silver.
| Teck 2013 Management’s Discussion and Analysis | Page 17 |
In 2013, zinc production at Red Dog was 551,300 tonnes compared to 529,100 tonnes in 2012. Annual mill throughput was a record high at 3.85 million tonnes in 2013 and, combined with improved recoveries, resulted in the higher zinc production. Lead production in 2013 was 96,700 tonnes compared to 95,400 in 2012, due to higher recoveries from treating less weathered ore, which was only partially offset by lower grades in the mill feed.
Red Dog’s location exposes the operation to severe weather and winter ice conditions, which can significantly affect production, sales volumes and operating costs. In addition, the mine’s bulk supply deliveries and all concentrate shipments occur during a short ocean shipping season that normally runs from early July to late October. This short shipping season means that Red Dog’s sales volumes are usually higher in the last six months of the year, resulting in significant variability in its quarterly profit, depending on metal prices.
In accordance with the operating agreement governing the Red Dog mine between Teck and NANA Regional Corporation, Inc. (NANA), the royalty we pay NANA increased in the fourth quarter of 2012 to 30% of net proceeds of production from the previous 25%. This royalty increases by 5% every fifth year to a maximum of 50%. The NANA royalty charge in 2013 was US$120 million, compared with US$137 million in 2012. NANA has advised us that it ultimately shares approximately 64% of the royalty, net of allowable costs, with other Regional Alaska Native corporations pursuant to section 7(i) of the Alaska Native Claims Settlement Act.
We expect 2014 production to be approximately 500,000 to 525,000 tonnes of zinc in concentrate and approximately 95,000 to 100,000 tonnes of lead in concentrate.
Trail Operations
Our Trail Operations in B.C. is one of the world’s largest fully integrated zinc and lead smelting and refining complexes. It also produces a variety of precious and specialty metals, chemicals and fertilizer products. Trail Operations has a two-thirds interest in the Waneta hydroelectric dam as well as ownership of the related transmission system. The Waneta Dam provides low-cost, clean, renewable power to the metallurgical operations.
Trail Operations contributed $112 million to gross profits before depreciation and amortization in 2013, compared with $118 million, before a one-time $59 million labour settlement charge, in 2012 and $256 million in 2011.
Refined zinc production totalled 290,100 tonnes in 2013, compared with 284,200 tonnes the previous year, as a result of improved operating efficiencies and improved throughput.
Refined lead production of 86,400 tonnes was similar to the 87,900 tonnes produced in 2012.
Silver production of 22.8 million ounces was near 2012 record levels, despite being affected by lower levels of silver in feed and reduced lead furnace availability due to a series of mechanical incidents in the last two months of the year that reduced online time.
Our recycling process treated 43,400 tonnes of material during the year, and we plan to treat about 39,900 tonnes in 2014. We continue to focus on treating lead acid batteries and cathode ray tube glass while expanding our processing of zinc alkaline batteries and fluorescent light bulbs as part of our efforts in recycling post-consumer waste.
| Teck 2013 Management’s Discussion and Analysis | Page 18 |
Construction continued on the new acid plant, which will replace two existing plants and is expected to deliver enhanced operating reliability and flexibility as well as improved environmental performance. The new plant is expected to go into service in the second quarter of 2014.
In 2014, we expect to produce in the range of 280,000 to 290,000 tonnes of refined zinc, 82,000 to 87,000 tonnes of refined lead and 22 to 25 million ounces of silver.
Other Zinc Operations
Our Pend Oreille mine, located in Washington State, has been on care and maintenance since February 2009. A core group of employees is working to keep the site ready in the event of a future restart. All regulatory and environmental requirements are being met.
Markets
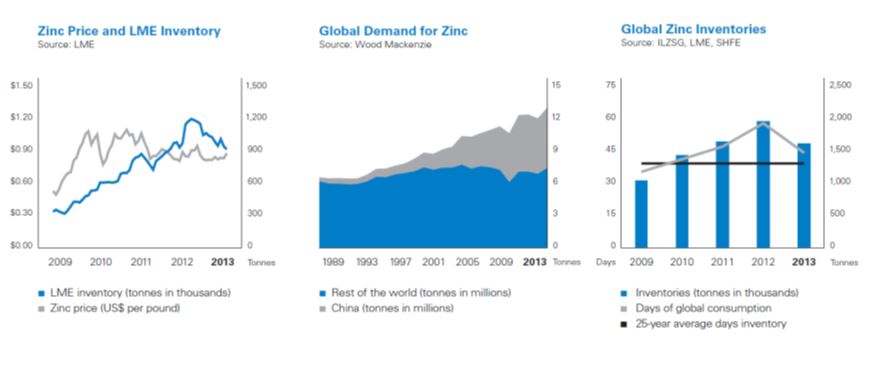
Zinc prices on the LME averaged US$0.87 per pound for the year, down US$0.01 per pound from the 2012 average.
In 2013, global zinc metal consumption was 13.3 million tonnes, 4% over 2012 levels. Metal premiums increased in North America, Asia and Europe as a result of good demand growth and constrained access to metal stocks. LME stocks fell by 287,275 tonnes, 24% below 2012 levels, to 933,475 tonnes. We estimate that total reported global stocks, which include producer, consumer, merchant and terminal stocks, fell by approximately 350,000 tonnes in 2013 and at year-end were 1.6 million tonnes. That represented an estimated 45 days of global consumption compared to the 25-year average of an estimated 40 days.
In 2013, global mine production grew by 2% to 13.1 million tonnes of contained zinc, while global refined production rose by 4% to 13.1 million tonnes. The global concentrate market recorded a modest surplus in 2013, representing less than 2% of global mine production.
In 2013, closures of large long-life mines started in Canada with the Brunswick and Perseverance mines closing. This will continue with the expected closure of the Century mine in Australia in 2015. Over the next few years, global mine production is expected to peak. This will put a cap on refined production while demand is expected to continue to grow, leading to a tightening global zinc market.
In 2014, we believe that the global zinc concentrate market will record a smaller surplus, representing less than 1% of global mine production. We expect that global refined production will grow at a similar rate as refined demand, leading to a balanced global zinc metal market.
| Teck 2013 Management’s Discussion and Analysis | Page 19 |
| Teck 2013 Management’s Discussion and Analysis | Page 20 |
Energy
Located in the Athabasca oil sands region of northeastern Alberta, our energy assets include a 20% interest in the Fort Hills oil sands project, a 100% interest in the Frontier oil sands project and a 50% interest in various other oil sands leases in the exploration phase, including the Lease 421 Area. Our proven and probable reserves totalled 608 million barrels and our contingent bitumen resources totalled 3.1 billion barrels at the end of 2013. These valuable long-term assets are located in a politically stable jurisdiction and are expected to be mined using conventional technologies that build on our core skills in large-scale truck and shovel operations.
We recognize that there are concerns over the potential environmental effects of developing oil sands projects. We are researching methods to improve extraction and processing to enhance the sustainability of our projects. We are proud to be one of the founding members of Canada’s Oil Sands Innovation Alliance (COSIA) and are encouraged by the progress of the industry towards improving environmental performance, reducing water consumption, improving tailings management, and increasing land reclamation and revegetation.
We have a 30% interest in the Wintering Hills Wind Power Facility and continue to examine opportunities to enhance our renewable energy portfolio.
The disclosure that follows includes references to reserves and contingent bitumen resource estimates. Further information on these estimates, the related risks and uncertainties, and contingencies that prevent the classification of resources as reserves is set out in our most recent Annual Information Form, which is available on our website at www.teck.com, or on the Canadian Securities Administrators website at www.sedar.com (SEDAR) and under cover of Form 40-F on the EDGAR section of the Securities Exchange Commission (SEC) website at www.sec.gov. There is no certainty that it will be commercially viable to produce any portion of the contingent resources.
Fort Hills Oil Sands Project
The Fort Hills oil sands project is located approximately 90 kilometres north of Fort McMurray in northern Alberta. We hold a 20% interest in the Fort Hills Energy Limited Partnership (Fort Hills Partnership), which owns the Fort Hills oil sands project, with 39.2% held by Total E&P Canada Ltd. (Total) and the remaining 40.8% held by Suncor Energy Inc. (Suncor). An affiliate of Suncor is the operator of the project.
In the fourth quarter of 2013, we along with our partners Suncor and Total announced that we are proceeding with the construction of the Fort Hills oil sands project. Based on Suncor’s project cost estimates, our portion of the fully escalated capital investment in Fort Hills from the date of project sanction is estimated at approximately $2.94 billion over four years (2014–2017), including remaining earn-in commitments of $240 million. The gross overall project costs for all partners since the project restart in 2011 are estimated by Suncor at a capital intensity of approximately $84,000 per daily flowing barrel of bitumen, which is within the range of similar recent oil sands projects.
At December 31, 2013, our 20% share of the proven and probable reserves at Fort Hills is 608 million barrels and our best estimate of our share of the incremental contingent bitumen resource is 26 million barrels.
| Teck 2013 Management’s Discussion and Analysis | Page 21 |
The project is scheduled to produce first oil as early as the fourth quarter of 2017 and is expected to achieve 90% of its planned production capacity of 180,000 barrels per day (bpd) of bitumen within 12 months. Our share of production is expected to be 36,000 bpd (13 million barrels per year) of bitumen. Construction is on budget and progressing substantially in accordance with the project schedule.
Frontier Project
We hold a 100% interest in the Frontier project, which is located about 10 kilometres northwest of the Fort Hills oil sands project in northern Alberta. In November 2011, the Frontier project application was submitted to regulators. We have subsequently responded to two rounds of supplemental information requests and review of the application continues. The cumulative federal review period is estimated to be approximately two years, making 2015 the earliest an approval decision and receipt of required permits is expected.
In 2013, we did fieldwork to acquire additional geotechnical information to support the regulatory application and future engineering design efforts.
In the second quarter of 2013, we announced the exchange of certain oil sands leases relating to the Frontier project with Shell Canada Energy (Shell). The asset exchange significantly reduces the lease boundary interfaces between the Frontier project and Shell's Pierre River Mine project, and is anticipated to benefit the economic recovery of oil sands for the parties' respective projects. The leases we acquired in the exchange generally lie east of the Frontier project area and form a continuous series of leases with the Frontier leases.
In connection with the asset exchange, Teck and Shell have entered into a projects agreement with respect to future activities on the Frontier and Pierre River Mine projects. Under the projects agreement, among other matters, Teck and Shell will work to minimize certain impacts of their respective projects on the other’s project and on the environment, while maximizing the economic recovery of oil sands along common boundaries and improving the efficiency of both projects.
As of December 31, 2013, our best estimate of contingent bitumen resources for the Frontier project is approximately 3.05 billion barrels. The project has been designed for a total nominal production of approximately 277,000 bpd of bitumen.
Lease 421 Area
We hold a 50% interest in the Lease 421 Area, which is located east of the Fort Hills project in northern Alberta. Imperial Oil and ExxonMobil jointly own the remaining 50%. To date, a total of 89 core holes have been completed in the Lease 421 Area, including 30 core holes previously completed on Lease 899.
Wintering Hills Wind Power Facility
Wintering Hills is a wind power facility located near Drumheller, Alberta. We hold a 30% interest in Wintering Hills with Suncor, the project operator, holding the remaining 70%. In 2013, our share of power generation from Wintering Hills was 85 GWh, enough power to provide 55,000 tonnes of CO2-equivalent credits. Our share of expected power generation in 2014 is 85 GWh, which is dependent on weather conditions.
| Teck 2013 Management’s Discussion and Analysis | Page 22 |
Exploration
Throughout 2013, exploration efforts were carried out around the world by our nine regional offices. Expenditures of $86 million in 2013 were focused on copper, zinc and gold opportunities.
Exploration plays three critical roles at Teck: discovery of new orebodies through early stage exploration and acquisition; pursuit, evaluation and acquisition of development opportunities; and delivery of geoscience solutions and services to create value at our existing mines.
Our copper exploration is focused on porphyry copper deposits and, during 2013, we drilled several porphyry copper projects in Canada, Chile and Peru. Significant exploration work was focused in and around our existing operations and advanced projects in 2013. At our Highland Valley Copper Operations in Canada we completed 69.5 kilometres of drilling primarily focused on copper mineralization adjacent to the historical Bethlehem pits. In 2014, we plan to drill copper projects in Canada, Chile and Peru, and continue to explore around our existing operations. In addition to our 100% owned projects, we entered into option agreements on several drill stage projects in 2013 and we plan to test a number of these systems in 2014.
Zinc exploration remains focused on four areas: the Red Dog mine district in Alaska, central B.C., northeastern Australia, and Ireland. In Alaska, Australia and Canada, the target type is a large, high-grade, sediment-hosted deposit similar to major world-class deposits such as Red Dog in Alaska and Century or McArthur River in Australia. In 2013, we completed four holes at the Teena prospect on the Reward project in Australia, a joint venture with Rox Resources Limited. Drilling intersected 15- to 20-metre thicknesses of zinc and lead sulphide mineralization, grading 10% to 13% zinc plus lead over a strike length of 1 kilometre. Teck is earning up to 70% in the project. We also continued to drill on the Noatak project near our existing Red Dog mine, where we have been testing high-quality targets with promising results. Exploration programs will continue in these regions in 2014.
In addition to exploring for copper and zinc, we are exploring for, and looking to partner in, new gold opportunities. Our plan is to explore, find and advance gold resources through targeted exploration activity in select jurisdictions. Once an opportunity has been recognized, the strategy is to optimize that opportunity or asset through further definition drilling and engineering studies, then capture value through periodic divestitures. Our current exploration efforts and drill testing for gold are primarily focused in Turkey, Canada, Chile, Peru and Colombia. In 2013, we had more encouraging results from TV Tower in Turkey, which is a joint venture with Pilot Gold Inc., and have had success in drilling new gold systems in South America.
| Teck 2013 Management’s Discussion and Analysis | Page 23 |
Financial Overview
Financial Summary
| ($ in millions, except per share data) | | 2013 | | | 2012 | | | 2011(2) | |
| | | | | | | | | | |
| Revenues and profit | | | | | | | | | |
Revenues | | $ | 9,382 | | | $ | 10,343 | | | $ | 11,514 | |
Gross profit before depreciation and amortization(1) | | $ | 3,659 | | | $ | 4,507 | | | $ | 5,788 | |
EBITDA(1) | | $ | 3,153 | | | $ | 3,295 | | | $ | 5,459 | |
Profit attributable to shareholders | | $ | 961 | | | $ | 1,068 | | | $ | 2,668 | |
| | | | | | | | | | | | | |
| Cash flow | | | | | | | | | | | | |
Cash flow from operations | | $ | 2,878 | | | $ | 3,418 | | | $ | 3,957 | |
Capital expenditures | | $ | 1,858 | | | $ | 1,700 | | | $ | 1,236 | |
Capitalized production stripping costs(2) | | $ | 744 | | | $ | 732 | | | | – | |
Investments | | $ | 325 | | | $ | 758 | | | $ | 463 | |
| | | | | | | | | | | | | |
| Balance sheet | | | | | | | | | | | | |
Cash balances | | $ | 2,772 | | | $ | 3,267 | | | $ | 4,405 | |
Total assets | | $ | 36,183 | | | $ | 35,055 | | | $ | 34,213 | |
Debt, including current portion | | $ | 7,723 | | | $ | 7,195 | | | $ | 7,035 | |
| | | | | | | | | | | | | |
| Per share amounts | | | | | | | | | | | | |
Profit attributable to shareholders | | | | | | | | | | | | |
Basic | | $ | 1.66 | | | $ | 1.82 | | | $ | 4.52 | |
Diluted | | $ | 1.66 | | | $ | 1.82 | | | $ | 4.50 | |
Dividends declared per share | | $ | 0.90 | | | $ | 0.85 | | | $ | 0.70 | |
| (1) | Gross profit before depreciation and amortization and EBITDA are non-GAAP financial measures. See “Use of Non-GAAP Financial Measures” section for further information. |
| (2) | 2011 results have not been restated for the new and amended accounting pronouncements. Please refer to Note 29 to our consolidated financial statements for the year endedDecember 31, 2013 for more details. |
Our revenue and profit depend on prices for the commodities we produce, sell and use in our production processes. Commodity prices are determined by the supply of and demand for those commodities, which are influenced by global economic conditions. We normally sell the products that we produce at prevailing market prices or, in the case of steelmaking coal, at negotiated prices on term contracts or on a spot basis. Prices for these products, particularly for exchange-traded commodities, can fluctuate significantly and that volatility can have a material effect on our financial results.
We record our financial results using the Canadian dollar and, accordingly, our operating results and cash flows are affected by changes in the Canadian dollar exchange rate relative to the currencies of other countries where we operate and relative to the United States (U.S.) dollar. Exchange rate movements can have a significant effect on our results, as a significant portion of our operating costs are incurred in Canadian and other currencies, and most of our revenues and debt are denominated in U.S. dollars.
Profit attributable to shareholders for 2013 was $961 million, or $1.66 per share. This compares with $1.1 billion or $1.82 per share in 2012, which included $784 million of after-tax debt refinancing charges, and $2.7 billion, or $4.52 per share in 2011.
| Teck 2013 Management’s Discussion and Analysis | Page 24 |
Our profit over the past three years has included items that we segregate for presentation to investors so that the ongoing profit of the company may be more clearly understood. These are described below and summarized in the table that follows.
There were no significant unusual items in 2013.
In 2012, our profit included $784 million of after-tax refinancing charges related to debt refinancing transactions completed during the year, $70 million of collective agreement charges, $39 million of gains on asset sales and $98 million of gains on various derivatives.
Our profit in 2011 included $146 million of after-tax gains on the sale of various assets that were undertaken as part of our debt reduction plan and $128 million of gains on various derivatives.
The table below shows the effect of these items on our profit.
| | | 2013 | | | 2012 | | | 2011(1) | |
| | | | | | | | | | |
| Profit attributable to shareholders | | $ | 961 | | | $ | 1,068 | | | $ | 2,668 | |
| | | | | | | | | | | | | |
| Add (deduct) the after-tax effect of: | | | | | | | | | | | | |
Asset sales and provisions | | | (9 | ) | | | (39 | ) | | | (146 | ) |
Foreign exchange (gains) losses | | | 11 | | | | 20 | | | | (4 | ) |
Derivative gains | | | – | | | | (98 | ) | | | (128 | ) |
Financing items | | | – | | | | 784 | | | | – | |
Collective agreement charges | | | – | | | | 70 | | | | 55 | |
| Asset impairments and other | | | 31 | | | | – | | | | 23 | |
Tax items | | | 10 | | | | (29 | ) | | | – | |
| | | | | | | | | | | | | |
Adjusted profit(2) | | $ | 1,004 | | | $ | 1,776 | | | $ | 2,468 | |
| | | | | | | | | | | | | |
Adjusted earnings per share(2) | | $ | 1.74 | | | $ | 3.03 | | | $ | 4.18 | |
| (1) | 2011 results have not been restated for the new and amended accounting pronouncements. Please refer to Note 29 to our consolidated financial statements for the year ended December 31, 2013 for more details. |
| (2) | Adjusted profit and adjusted earnings per share are non-GAAP financial measures. See “Use of Non-GAAP Financial Measures” section for further information. |
Cash flow from operations in 2013 was $2.9 billion, compared with $3.4 billion in 2012 and $4.0 billion in 2011. The changes in cash flow from operations are due mainly to the volatility in commodity prices.
At December 31, 2013, our cash balance was $2.8 billion. Total debt was $7.7 billion and our net debt to net debt-plus-equity ratio was 21% compared with 18% at December 31, 2012 and 13% at the end of 2011.
Gross Profit
Our gross profit is made up of our revenues less the operating, depreciation and amortization expenses at our producing operations. Income and expenses from our business activities that do not produce commodities for sale are included in our other operating income and expenses or in our non-operating income and expenses.
Our principal commodities are copper, steelmaking coal and zinc, which accounted for 27%, 44% and 12% of revenues respectively in 2013. Silver and lead are significant byproducts of our zinc operations, accounting for 8% and 4% each, respectively, of our 2013 revenues. We also produce a number of other byproducts including molybdenum, various specialty metals, and chemicals and fertilizers, which in total accounted for 5% of our revenue in 2013.
| Teck 2013 Management’s Discussion and Analysis | Page 25 |
Our revenues are affected by sales volumes, which are determined by our production levels and by demand for the commodities we produce, commodity prices and currency exchange rates.
Our revenues were $9.4 billion in 2013 compared with $10.3 billion in 2012 and the record $11.5 billion in 2011. The reduction in 2013 revenues was due mainly to lower commodity prices, partially offset by increased sales volumes of steelmaking coal and a stronger U.S. dollar. The reduction in 2012 over 2011 was due mainly to a 25% reduction in the average realized coal price, lower metal prices and lower zinc sales volumes. The reduction was partially offset by higher sales volumes of copper and coal, which increased by 13% and 8%, respectively, compared with 2011.
Our cost of sales includes all of the expenses required to produce our products, such as labour, energy, operating supplies, concentrates purchased for our Trail Operations’ refining and smelting operation, royalties, and marketing and distribution costs required to sell and transport our products to various delivery points. Our cost of sales also includes depreciation and amortization expense. Due to the geographic locations of many of our operations, we are highly dependent on third parties for the provision of rail, port and other distribution services. In certain circumstances, we negotiate prices for the provision of these services where we may not have viable alternatives to using specific providers, or may not have access to regulated rate-setting mechanisms. Contractual disputes, demurrage charges, rail and port capacity issues, availability of vessels and railcars, weather problems and other factors can have a material effect on our ability to transport materials from our suppliers and to our customers in accordance with schedules and contractual commitments.
The magnitude of our costs is dictated mainly by our production volumes, by the costs for labour, operating supplies and concentrate purchases, and by strip ratios, haul distances, ore grades, distribution costs, commodity prices, foreign exchange rates and costs related to non-routine maintenance projects. Production volumes mainly affect our variable operating and our distribution costs. In addition, production may also affect our sales volumes and, when combined with commodity prices, it affects profitability and, ultimately, our royalty expenses.
In the second half of 2012 we implemented a cost reduction program at all of our sites that to date has identified approximately $380 million of potential ongoing annual operating cost savings across the company, of which $360 million has been implemented. An additional $150 million of one-time cost savings and deferrals has also been identified and implemented. This cost reduction program has contributed to the lower operating costs incurred in 2013.
Our cost of sales was $6.9 billion in 2013 compared with $6.8 billion in 2012 and $6.6 billion in 2011. Cost of
| Teck 2013 Management’s Discussion and Analysis | Page 26 |
sales increased in 2013 from 2012, primarily due to substantially higher coal sales volumes and higher depreciation and amortization expense. Coal sales volumes increased by 2.9 million tonnes in 2013, which accounted for $275 million of the increase. Depreciation and amortization expense was $250 million higher than in 2012 as a result of increasing amortization of capitalized production stripping costs and partly due to the effect of the higher coal sales volumes. These items were partially offset by the efforts of our cost reduction program and a $90 million reduction in operating costs at Quebrada Blanca Operations, as a result of the restructuring plan we put in place in 2013. In addition, there was no labour agreement settlement charge in 2013, compared with $103 million incurred in 2012.
Comparing 2012 with 2011, the higher costs were due primarily to higher production levels in our copper and coal business units, which increased 16% and 8%, respectively. In addition, cost of sales for 2011 have not been restated for the new accounting rules related to production stripping costs and post-employment benefits (please refer to Note 29 to our consolidated financial statements for the year ended December 31, 2013 for more details). Higher transportation unit costs in our coal business unit accounted for approximately $110 million of the increase in cost of sales in 2012. This was due to higher ocean freight, port and rail costs as well as to a higher proportion of coal being sold inclusive of freight charges. Although we achieved lower unit costs at most of our copper operations, unit costs increased significantly at our Quebrada Blanca Operations and accounted for approximately $100 million of the increase in cost of sales in 2012. This was due to significant increases for labour costs, reflecting new terms of the collective agreement ratified early in 2012, and higher contractor and consumable costs. We also incurred one-time labour settlement costs at various operations totalling $103 million in 2012 compared with $84 million in 2011.
Other Expenses
| ($ in millions) | | 2013 | | | 2012 | | | 2011(1) | |
| | | | | | | | | | |
| General and administration | | $ | 129 | | | $ | 137 | | | $ | 125 | |
| Exploration | | | 86 | | | | 102 | | | | 105 | |
| Research and development | | | 18 | | | | 19 | | | | 17 | |
| Other operating expense (income) | | | 216 | | | | 24 | | | | 174 | |
| Finance income | | | (13 | ) | | | (33 | ) | | | (113 | ) |
| Finance expense | | | 339 | | | | 510 | | | | 595 | |
| Non-operating expense (income) | | | 6 | | | | 848 | | | | (197 | ) |
| Share of losses of associates | | | 2 | | | | 10 | | | | 5 | |
| | | $ | 783 | | | $ | 1,617 | | | $ | 711 | |
| (1) | 2011 results have not been restated for the new and amended accounting pronouncements. Please refer to Note 29 to our consolidated financial statements for the year ended December 31, 2013 for more details. |
We must continually replace our reserves as they are depleted in order to maintain production levels over the long term. We try to do this through our exploration and development programs and through acquisition of interests in new properties or in companies that own such properties. Exploration for minerals and oil is highly speculative and the projects involve many risks. The vast majority of exploration projects are unsuccessful and there are no assurances that current or future exploration programs will find deposits that are ultimately brought into production.
Our research and development expenditures are primarily focused on advancing our proprietary CESL hydrometallurgical technology, the development of internal and external growth opportunities, and the
| Teck 2013 Management’s Discussion and Analysis | Page 27 |
development and implementation of process and environmental technology improvements at operations.
Other operating income and expenses include items we consider to be related to the operation of our business, such as final pricing adjustments (which are further described in the next paragraph), share-based compensation, gains or losses on commodity derivatives, gains or losses on the sale of operating or exploration assets, and provisions for various costs at our closed properties. Significant items in 2013 include $62 million of negative pricing adjustments, $33 million on asset write-downs, $27 million on environmental costs and a $22 million expense for share-based compensation. Significant items in 2012 included $24 million from gains on the sale of assets, $45 million of positive pricing adjustments and a $34 million expense for share-based compensation. 2011 included $130 million of gains on the sale of assets, $210 million of negative pricing adjustments, and a $21 million expense recovery for share-based compensation resulting from the decline in our share price.
Sales of metals in concentrate or copper cathodes are recognized in revenue on a provisional pricing basis when the rights, obligations, risks and benefits of ownership pass to the customer, which usually occurs upon shipment. However, final pricing is typically not determined until a subsequent date, often in the following quarter. Revenue in a quarter is based on prices at the date of sale. These pricing adjustments result in gains in a rising price environment and losses in a declining price environment and are recorded as other operating income or expense. The extent of the pricing adjustments also takes into account the actual price participation terms as provided in certain concentrate sales agreements. It should be noted that these effects arise on the sale of concentrates, as well as on the purchase of concentrates at our Trail Operations.
The table below outlines our outstanding receivable positions, which were provisionally valued at December 31, 2013 and 2012, respectively.
| | | Outstanding at | | | Outstanding at | |
| | | December 31, 2013 | | | December 31, 2012 | |
| (pounds in millions) | | Pounds | | | US$/lb | | | Pounds | | | US$/lb | |
| | | | | | | | | | | | | |
| Copper | | | 135 | | | | 3.35 | | | | 179 | | | | 3.59 | |
| Zinc | | | 109 | | | | 0.94 | | | | 143 | | | | 0.93 | |
Our finance expense includes interest expense on our debt, financing fees and amortization, and the interest components of our pension obligations and our decommissioning and restoration provisions, less any interest that we capitalize against the cost of our development projects. The reduction in our finance expense relates primarily to lower average interest rates as a result of several debt refinancing activities that were completed in 2012. In addition, net interest expense was reduced by $91 million in 2013 compared with 2012 as more interest was capitalized to our various development projects.
Non-operating income (expense) includes items that arise from financial and other matters and includes such items as foreign exchange, debt refinancing, realized gains or losses on marketable securities, and gains and losses on the revaluation of the call options on certain of our high-yield notes that were refinanced in 2012. In 2013, other non-operating income included $42 million of gains on the sale of various investments, $32 million of provisions taken against various marketable securities and $12 million of foreign exchange losses. In 2012, other non-operating income consisted primarily of $965 million of charges related to debt refinancing activities described in more detail below under the caption “Financing Activities”, $119 million of gains on the revaluation of the call options on our high-yield notes prior to their settlement and $29 million of gains on the sale of various investments. 2011 included $146 million of gains on the revaluation of the call
| Teck 2013 Management’s Discussion and Analysis | Page 28 |
options on our high-yield notes and $44 million of gains on the sale of various investments.
Until October 29, 2013, we accounted for our investment in the Fort Hills Energy Limited Partnership using the equity method. As a result of changes made to the agreements governing the project at the time of project sanction, we are now accounting for our investment in Fort Hills by recording our share of the assets, liabilities, revenues, expenses and cash flows. The majority of the activities on this project to date relate to capital expenditures, rather than expenditures that affect profit.
Income and resource taxes were $633 million, or 39% of pre-tax profit. This is higher than the Canadian statutory income tax rate of 25% due mainly to the effect of resource taxes and higher taxes in foreign jurisdictions, including withholding taxes. During 2013, the Canada Revenue Agency issued a proposed adjustment to our 2006 taxable income that would deny a deduction of $346 million claimed in relation to a premium paid on the redemption of our Cominco exchangeable debentures. The proposed adjustment would reduce the loss carry forward pools available to us to reduce taxes payable in the future rather than have an immediate cash effect. In light of the uncertainty raised by the proposed adjustment and as the original amount was credited directly to equity, we recognized a provision of $124 million that has also been charged directly to equity.
At December 31, 2013, we had approximately $6.3 billion of various unused tax pools that shield us from cash income taxes, but not resource taxes, in Canada. We remain subject to cash taxes in foreign jurisdictions.
Subsequent to year-end, the Canada Revenue Agency proposed that most of the gains realized in 2008 on the sale of our 19.95% interest in Fording Canadian Coal Trust at the time of our acquisition of the Trust’s assets should be taxed as income rather than capital gains. Although management remains confident that the gains were capital gains, the Canada Revenue Agency may nonetheless raise assessments on this basis. There can be no assurance that such assessments would not be upheld in whole or in part, in which case up to approximately $900 million of additional income for tax purposes would reduce our existing tax pools, resulting in an additional deferred tax liability of $235 million. In addition, cash interest of up to approximately $50 million could be due.
Profit attributable to non-controlling interests relates to the ownership interests in our Highland Valley Copper, Quebrada Blanca, Carmen de Andacollo and Elkview mines that are held by third parties.
Financial Position and Liquidity
Our financial position and liquidity remains strong. Our outstanding debt was $7.7 billion at December 31, 2013 compared with $7.2 billion at the end of 2012 and $7.0 billion at the end of 2011. As substantially all of our debt is denominated in U.S. dollars, the increase is due primarily to the strengthening of the U.S. dollar that occurred in 2013.
Our debt positions and credit ratios are summarized in the following table.
| Teck 2013 Management’s Discussion and Analysis | Page 29 |
| | | December 31, | | | December 31, | | | December 31, | |
| | | 2013 | | | 2012 | | | 2011 | |
| | | | | | | | | | |
| Fixed-rate term notes | | $ | 7,124 | | | $ | 7,119 | | | $ | 6,698 | |
| Other | | | 137 | | | | 113 | | | | 219 | |
| Total debt (US$ in millions) | | | 7,261 | | | | 7,232 | | | | 6,917 | |
| | | | | | | | | | | | | |
| Canadian $ equivalent at year-end exchange rate | | | 7,723 | | | | 7,195 | | | | 7,035 | |
| Less cash balances | | | (2,772 | ) | | | (3,267 | ) | | | (4,405 | ) |
| Net debt | | $ | 4,951 | | | $ | 3,928 | | | $ | 2,630 | |
| | | | | | | | | | | | | |
| Debt to debt-plus-equity | | | 29% | | | | 29% | | | | 28% | |
| Net debt to net debt-plus-equity | | | 21% | | | | 18% | | | | 13% | |
| Average interest rate at year-end | | | 4.8% | | | | 4.8% | | | | 6.9% | |
The cost of funds under our credit facilities depends in part on our credit ratings. Moody’s currently rates us at Baa2 with a stable outlook, Standard & Poor’s rates us at BBB with a stable outlook, Dominion Bond Rating Service rates us as BBB with a stable trend and Fitch Ratings rates us as BBB with a stable outlook. The costs under our credit facilities would change if certain of our credit ratings were to change.
Our primary sources of liquidity and capital resources are our cash and temporary investments, cash flow provided from operations, and funds available under our committed and uncommitted bank credit facilities, of which US$2 billion is currently available.
Operating Cash Flow
Cash flow from operations was $2.9 billion in 2013 compared with $3.4 billion in 2012 and $4.0 billion in 2011. The decreases in 2013 and 2012 compared to 2011 were due mainly to lower gross profits at our operations from falling commodity prices.
Investing Activities
Capital expenditures were $1.9 billion in 2013 and included $685 million on sustaining capital, $554 million on major enhancement projects and $619 million on new mine development. In addition, $744 million was spent on production stripping activities.
The largest components of sustaining capital expenditures were $255 million at our coal operations, primarily related to equipment replacement and the water quality plan to reduce selenium levels in mine discharge water; $123 million at Trail Operations, which included $79 million on construction of a new acid plant that is replacing an aging facility; $77 million at Highland Valley Copper; $59 million for our share of spending at Antamina and $54 million at Quebrada Blanca.
Major enhancement expenditures included $396 million for the mill optimization project at Highland Valley Copper and $74 million at Teck Coal to increase productive capacity to 28 million tonnes.
New mine development included $246 million for Quebrada Blanca’s Phase 2 hypogene project, $65 million for Relincho, $145 million for the potential restart of the Quintette project, $60 million for our share of spending on the Fort Hills project, and $64 million on the Frontier oil sands project.
Investments in 2013 included $244 million for our share of the Fort Hills project until October 29, 2013. Beginning October 30, 2013, we began accounting for our investment in Fort Hills as a joint operation,
| Teck 2013 Management’s Discussion and Analysis | Page 30 |
resulting in our share of the project costs being included as part of our capital expenditures. Investments in 2012 were $432 million for the acquisition of SilverBirch Energy Corporation, which gave us full ownership of the Frontier oil sands project, including the Equinox property, $197 million for interests in a number of publicly traded companies and $122 million for our share of the costs of our equity accounted investment in Fort Hills. Investments in 2011 totalled $463 million, of which $300 million was for publicly traded companies and $54 million was for our share of the Fort Hills costs.
Cash proceeds from the sale of assets and investments were $502 million in 2013, $51 million in 2012 and $289 million in 2011. In 2012, we sold various small non-core mining properties. 2011 included $128 million for the sale of our Carrapateena project in Australia, and $161 million from other assets and investments in publicly traded companies.
Financing Activities
We had no significant financings in 2013, but we did increase the amount of our U.S. dollar revolving line of credit to US$2 billion, all of which was undrawn at the end of the year.
In 2012, we issued US$2.75 billion of long-term notes and used the proceeds to redeem the remaining outstanding balance of the various high-yield notes issued in 2009 and repay the US$200 million notes due in September 2012. Significant financing activities during 2011 included US$2 billion of notes issued in July for net proceeds of $1.9 billion.
Class B subordinate voting shares repurchased for cancellation pursuant to normal course issuer bids included 6.1 million shares at a cost of $176 million in 2013, 3.9 million shares for $129 million in 2012 and 4.8 million shares for $171 million in 2011.
At December 31, 2013 the weighted average maturity of our consolidated indebtedness is approximately 15 years and the weighted average coupon rate is approximately 4.8%.
Quarterly Earnings and Cash Flow
| ($ in millions except per share data) | | 2013 | | | 2012 | |
| | | | Q4 | | | | Q3 | | | | Q2 | | | | Q1 | | | | Q4 | | | | Q3 | | | | Q2 | | | | Q1 | |
| | | | | | | | | | | | | | | | | | | | | | | | | | | | | | | | | |
| Revenues | | $ | 2,376 | | | $ | 2,524 | | | $ | 2,152 | | | $ | 2,330 | | | $ | 2,730 | | | $ | 2,505 | | | $ | 2,561 | | | $ | 2,547 | |
| Gross profit | | | 546 | | | | 597 | | | | 582 | | | | 701 | | | | 825 | | | | 827 | | | | 880 | | | | 992 | |
| EBITDA | | | 766 | | | | 815 | | | | 670 | | | | 902 | | | | 653 | | | | 861 | | | | 933 | | | | 848 | |
| Profit attributable to shareholders | | | 232 | | | | 267 | | | | 143 | | | | 319 | | | | 200 | | | | 256 | | | | 354 | | | | 258 | |
| Earnings per share | | $ | 0.40 | | | $ | 0.46 | | | $ | 0.25 | | | $ | 0.55 | | | $ | 0.34 | | | $ | 0.44 | | | $ | 0.60 | | | $ | 0.44 | |
| Cash flow from operations | | $ | 769 | | | $ | 656 | | | $ | 690 | | | $ | 763 | | | $ | 911 | | | $ | 729 | | | $ | 965 | | | $ | 813 | |
Revenues from operations were $2.4 billion in the fourth quarter compared with $2.7 billion a year ago. Revenues from our copper business unit decreased by $133 million from a year ago as a result of softer copper prices, reduced byproduct revenues and lower sales volumes due to timing of shipments. Coal revenues decreased by $47 million compared with the fourth quarter of 2012, primarily due to weaker coal prices. Revenues from our zinc business unit decreased by $175 million compared with a year ago. The decrease was primarily due to substantially lower silver revenues from Trail Operations and a 22% decrease in Red Dog’s zinc sales volumes. The effect of the stronger U.S. dollar in the fourth quarter compared with a
| Teck 2013 Management’s Discussion and Analysis | Page 31 |
year ago partly offset the declines in commodity prices.
Gross profit before depreciation and amortization from our copper business unit in the fourth quarter decreased by $79 million compared with a year ago. The decrease was primarily a result of lower realized copper prices, reduced byproduct revenues and a 7% decrease in sales volumes due to the timing of shipments, which were behind production. These items were partly offset by lower operating costs, particularly at our Quebrada Blanca and Carmen de Andacollo operations. Copper production in the fourth quarter was 105,000 tonnes, which was a new quarterly production record, compared with 103,000 tonnes a year ago and an increase of 15% from the third quarter of 2013. The higher production is a result of record mine and mill throughput at Antamina and from improved production from Quebrada Blanca.
In our coal unit, gross profit before depreciation and amortization in the fourth quarter declined by $83 million compared with last year due primarily to lower realized coal prices and increased unit operating costs. Production in the fourth quarter was 6.7 million tonnes, or 5% higher than in the same period in 2012. Sales volumes of 6.5 million tonnes in the fourth quarter reflect continued demand for our products from customers in all market areas and were slightly ahead of levels a year ago. For the year, sales volumes of 26.9 million tonnes represent a record for the coal operations, 2.9 million tonnes above 2012 and 1.9 million tonnes above the previous high in 2004 when we had an effective 43.4% interest in the Elk Valley Coal Partnership. Coal prices were 11% lower than a year ago and averaged US$142 per tonne in the fourth quarter. The lower coal price was partially offset by the effect of the stronger U.S. dollar. The cost of product sold in the fourth quarter, before transportation and depreciation charges, was $6 per tonne higher than the same period a year ago due to higher fuel costs, contracted labour rate increases and the completion of deferred maintenance activities. Operating costs also included a $3 per tonne charge related to the write-down of thermal coal inventories, which form a small portion of our production. Depreciation and amortization, before the inventory write-downs noted above, rose by $7 per tonne as a result of increasing amortization for capitalized stripping costs and new capital equipment investments made during the year, which are now being depreciated.
Gross profit before depreciation and amortization from our zinc business unit decreased by $56 million to $138 million in the fourth quarter compared with a year ago as a result of substantially lower sales volumes from Red Dog due to the timing of shipments. In 2012, poor weather in the third quarter caused delays to shipments originally scheduled for the third quarter, which were then deferred to the fourth quarter. Trail Operations’ refined zinc production increased 3% from a year ago due to better roaster throughput and improved operating efficiencies. Refined lead and silver production was lower in the fourth quarter compared with a year ago, as throughput from the lead furnace was affected by a series of production interruptions. Zinc and lead production from Red Dog in the fourth quarter was similar to a year ago.
Profit attributable to shareholders was $232 million, or $0.40 per share, in the fourth quarter compared with $200 million, or $0.34 per share, in the same period last year. Profit last year was affected by a $259 million after-tax charge related to the refinancing of our remaining high-yield notes. Cash flow from operations was $769 million in the fourth quarter, compared with $911 million a year ago, with the reduction due mainly to the lower gross profits driven by the effect of lower prices for our products.
Outlook
We continue to experience volatile markets for our products, and prices for some of our products have declined significantly. Commodity markets have historically been volatile, prices can change rapidly and customers can alter shipment plans. This can have a substantial effect on our business. Demand for our
| Teck 2013 Management’s Discussion and Analysis | Page 32 |
products, particularly coal, remains strong. However, new sources of supply have put downward pressure on coal prices. While we believe that the longer term fundamentals for steelmaking coal, copper and zinc are favourable, the recent weakness in some of these markets may well persist for some time. We are also significantly affected by foreign exchange rates. The Canadian dollar has fallen significantly against the U.S. dollar to date in 2014 and this has had a positive effect on the profitability of our Canadian operations. It will, to a lesser extent, put upward pressure on a portion of our operating costs and capital spending.
We have committed to spending an estimated $2.94 billion over the next four years on the development of the Fort Hills oil sands project, which will consume a significant portion of our cash resources. In the meantime, the Company’s financial position is strong. We are taking further steps to manage our capital spending profile and we continuously monitor all aspects of our cost reduction program, our capital spending and key markets as conditions evolve, in order to be in a position to take whatever actions may be appropriate.
Commodity Prices and 2014 Production
Commodity prices are a key driver of our profit. On the supply side, the depleting nature of ore reserves, difficulties in finding new orebodies, the permitting processes, the availability of skilled resources to develop projects, as well as infrastructure constraints, political risk and significant cost inflation may continue to have a moderating effect on the growth in future production for the industry as a whole. We are starting to see improvements in global economic conditions and believe that, over the longer term, the industrialization of emerging market economies will continue to be a major positive factor in the future demand for commodities. Therefore, we believe that the long-term price environment for the products that we produce and sell remains favourable.
Based on our expected 2014 mid-range production estimates and a Canadian/U.S. dollar exchange rate of $1.10, the sensitivity of our annual profit attributable to shareholders to the indicated changes in commodity prices, before pricing adjustments and the U.S. dollar exchange rate, is as follows:
| | | 2014 | | | | | | | |
| | | Mid-Range | | | | Effect of | | | |
| | | Production | | | | Change | | | Effect on |
| | | Estimates | Change | | | On Profit | | | EBITDA |
| | | | | | | | | | |
| Coal (000’s tonnes) | | 26,500 | US$1/tonne | | $ | 19 million | | $ | 29 million |
| Copper (tonnes) | | 330,000 | US$0.01/lb | | $ | 5 million | | $ | 7 million |
| Zinc (tonnes) | | 855,000 | US$0.01/lb | | $ | 7 million | | $ | 10 million |
| US$ exchange | | | CAD$0.01 | | $ | 40 million | | $ | 62 million |
Notes:
| (1) | The effect on our profit attributable to shareholders of commodity price and exchange rate movements will vary from quarter to quarter depending on sales volumes. |
| (2) | Zinc includes 285,000 tonnes of refined zinc and 570,000 tonnes of zinc contained in concentrates. |
| (3) | All production estimates are subject to change based on market and operating conditions. |
Foreign exchange translation gains and losses on our U.S. dollar denominated debt arising from exchange rate fluctuations are not expected to have a significant effect on our 2014 profit, as our U.S. dollar debt is expected to be designated as a hedge against our investments in U.S. dollar denominated foreign operations.
Copper and zinc prices, to date in 2014, are trading similar to 2013 average prices. Coal prices continue to be weak. The fluctuations in the Canadian/U.S. dollar exchange rate can have a significant effect on our profit and financial position. The Canadian dollar, to date in 2014, has averaged approximately $1.10 against
| Teck 2013 Management’s Discussion and Analysis | Page 33 |
the U.S. dollar compared with $1.03 on average for 2013.
Our copper production for 2014 is expected to be in the range of 320,000 to 340,000 tonnes compared with 364,300 tonnes produced in 2013. The lower expected production is a result of lower production from Quebrada Blanca, with less dump leach production, and from Antamina as the mine enters a period of significantly lower grades consistent with the mine plan. Antamina is expected to gradually increase production after 2014 as grades improve, which, together with higher production from Highland Valley Copper, is expected to offset declines from the closure of Duck Pond and lower grades at Quebrada Blanca and Carmen de Andacollo. We expect our copper cash unit costs in 2014, before and after byproduct credits, to be in the range of US$2.00 to US$2.20 per pound and US$1.70 and US$1.90 per pound, respectively.
Our coal production in 2014 is expected to be in the range of 26 to 27 million tonnes. Our actual production will depend primarily on customer demand for deliveries of steelmaking coal. Depending on market conditions and the sales outlook, we may adjust our production plans. We have the flexibility to devote additional resources to pre-stripping in these circumstances. Our current production capacity is approximately 28 million tonnes, but our actual production will ultimately depend on the demand from our customers. Our plan for 2014 includes a significant increase in the average waste haul distance for our coal operation, which will have a significant effect on unit costs, and this trend will continue in 2015.
Our zinc in concentrate production in 2014 is expected to be in the range of 555,000 to 585,000 tonnes compared with 623,000 tonnes in 2013, as Red Dog’s production is expected to decrease by approximately 25,000 tonnes, and our share of Antamina is expected to decline by 15,000 tonnes. Refined zinc production from our Trail metallurgical complex in 2014 is expected to be in the range of 280,000 to 290,000 tonnes compared with 290,000 tonnes in 2013.
Capital Expenditures
Our forecast of approved capital expenditures, including $700 million of capitalized production stripping costs, for 2014 is expected to be approximately $2.6 billion and is summarized in the following table:
| ($ in millions) | | Sustaining | | | Major Enhancement | | | New Mine Development | | | Capitalized Stripping | | | Total | |
| | | | | | | | | | | | | | | | |
| Copper | | $ | 235 | | | $ | 100 | | | $ | 120 | | | $ | 255 | | | $ | 710 | |
| Coal | | | 215 | | | | 70 | | | | 25 | | | | 415 | | | | 725 | |
| Zinc | | | 150 | | | | – | | | | 15 | | | | 30 | | | | 195 | |
| Energy | | | – | | | | – | | | | 955 | | | | – | | | | 955 | |
| Corporate | | | 20 | | | | – | | | | – | | | | – | | | | 20 | |
| | | | | | | | | | | | | | | | | | | | | |
| | | $ | 620 | | | $ | 170 | | | $ | 1,115 | | | $ | 700 | | | $ | 2,605 | |
These amounts do not include expenditures on new mine development projects that have not received Board approval and that would be incurred, should those projects proceed.
Major enhancement projects in 2014 include: $70 million for the completion of Highland Valley Copper’s mill optimization project and $70 million at our coal operations. New mine development in 2014 includes $100 million for Quebrada Blanca Phase 2, $25 million for Quintette, $850 million for Fort Hills and $105 million for our Frontier oil sands project.
| Teck 2013 Management’s Discussion and Analysis | Page 34 |
The amount and timing of actual capital expenditures is also dependent upon being able to secure permits, equipment, supplies, materials and labour on a timely basis and at expected costs to enable the projects to be completed as currently anticipated. We may change capital spending plans for the balance of this year and next, depending on commodity markets, our financial position, results of feasibility studies and other factors.
Foreign Exchange and Debt Revaluation
The sales of our products are denominated in U.S. dollars, while a significant portion of our expenses are incurred in local currencies, particularly the Canadian dollar. Foreign exchange fluctuations can have a significant effect on our operating margins, unless such fluctuations are offset by related changes to commodity prices.
Our U.S. dollar denominated debt is subject to revaluation based on changes in the Canadian/U.S. dollar exchange rate. As at December 31, 2013, all of our U.S. dollar denominated debt is designated as a hedge against our U.S. dollar denominated foreign operations. As a result, any foreign exchange gains or losses arising on our designated U.S. dollar debt are recorded in other comprehensive income.
Other Information
British Columbia Carbon Tax
The Province of British Columbia (B.C.) introduced a carbon tax on virtually all fossil fuels in 2008. The tax is imposed on various fossil fuels used in B.C. and, on July 1, 2012, the final increase planned by government saw the tax rate reach $30 per tonne of CO2-emission equivalent. For 2013, our seven B.C.-based operations paid $47 million in provincial carbon tax, primarily from our use of coal, diesel fuel and natural gas.
Financial Instruments and Derivatives
We hold a number of financial instruments and derivatives, which are recorded on our balance sheet at fair value with gains and losses in each period included in other comprehensive income and profit for the period as appropriate. The most significant of these instruments are marketable securities, foreign exchange forward sales contracts, metal-related forward contracts, and settlements receivable and payable. Some of our gains and losses on metal-related financial instruments are affected by smelter price participation and are taken into account in determining royalties and other expenses. All are subject to varying rates of taxation depending on their nature and jurisdiction.
Critical Accounting Estimates and Judgments
In preparing consolidated financial statements, management makes estimates and judgments that affect the reported amounts of assets, liabilities, revenues and expenses. Based on historical experience and other factors, including expectations of future events, management makes judgments that are believed to be reasonable under the circumstances. Actual results could differ from our estimates. Critical accounting estimates are those that could affect the consolidated financial statements materially and involve a significant level of judgment by management. These estimates impact all of our reportable segments. Management’s critical accounting estimates apply to the assessment of the impairment of assets, including goodwill, joint arrangements, the estimated recoverable reserves and resources, and the valuation of other assets and liabilities such as decommissioning and restoration provisions and accounting for income taxes.
| Teck 2013 Management’s Discussion and Analysis | Page 35 |
Impairment testing is based on discounted cash flow models prepared by internal experts with assistance from third-party advisors when required. Significant assumptions used include commodity prices, mineral reserves and resources, operating costs, capital expenditures, discount rates, foreign exchange rates and inflation rates. The assumptions used are based on management’s best estimates of what an independent market participant would consider appropriate and are reviewed by senior management. Significant judgment is applied and changes in these assumptions may alter the results of impairment testing, the amount of the impairment charges recorded in the statement of income and the resulting carrying values of assets.
We allocate goodwill arising from business combinations to the cash-generating unit or group of cash-generating units acquired that is expected to receive the benefits from the business combination. When performing annual goodwill impairment tests, we are required to determine the recoverable amount of each cash-generating unit or group of cash-generating units to which goodwill has been allocated. The recoverable amount of each cash-generating unit or group of cash-generating units is determined as the higher of its fair value less costs of disposal and its value in use.
We have performed our annual goodwill impairment testing and did not identify any impairment losses. The recoverable amounts for our goodwill impairment testing were determined based on a fair value less costs of disposal basis. The fair value less costs of disposal was calculated using a discounted cash flow methodology taking account of assumptions that would be made by market participants. Significant changes to long-term commodity prices and discount rates would be required before an impairment would be indicated for our coal operations or Quebrada Blanca. However, the results of our annual goodwill impairment test and an updated analysis as at December 31, 2013 resulted in the recoverable amount of Carmen de Andacollo exceeding its carrying value by approximately $100 million. The recoverable amount is most sensitive to the long-term commodity price and discount rate assumptions. The recoverable amount is based on a long-term copper price of US$3.50 per pound and a nominal post-tax discount rate of 8.5%. A 3% decrease in the long-term price assumption would result in the recoverable amount equalling the carrying value. An increase of 65 basis points in the nominal post-tax discount rate would also result in the recoverable amount equalling the carrying value.
Joint Arrangements
We are a party to a number of arrangements in which we do not have control. Judgment is required in determining whether joint control over these arrangements exists and if so, which parties have joint control and whether each arrangement is a joint venture or joint operation. In assessing whether we have joint control, we analyze the activities of each arrangement and determine which activities most significantly affect the returns of the arrangement. These activities are determined to be the relevant activities of the arrangement. If unanimous consent is required over the decisions about the relevant activities, the parties whose consent is required would have joint control over the arrangement. The judgments around which activities are considered the relevant activities of the arrangement are subject to analysis by each of the parties to the arrangement and may be interpreted differently. When performing this assessment, we consider decisions about activities such as managing the asset during its life, acquisition, expansion and dispositions of assets, financing, operating and capital decisions. We may also consider activities including the approval of budgets, appointment of key management personnel, representation on the Board of Directors, and other items.
If we conclude that we have joint control over the arrangement, an assessment of whether the arrangement is a joint venture or joint operation is required. This assessment is based on whether we have rights to the
| Teck 2013 Management’s Discussion and Analysis | Page 36 |
assets, and obligations for the liabilities, relating to the arrangement or whether we have rights to the net assets of the arrangement. In making this determination, we review the legal form of the arrangement, the terms of the contractual arrangement, and other facts and circumstances. In a situation where the legal form and the terms of the contractual arrangement do not give us rights to the assets and obligations for the liabilities, an assessment of other facts and circumstances is required, including whether the activities of the arrangement are primarily designed for the provision of output to the parties and whether the parties are substantially the only source of cash flows contributing to the arrangement. In such circumstances we may conclude that the application of other facts and circumstances to conclude that a joint arrangement is a joint operation is appropriate. This conclusion requires judgment and is specific to each arrangement. We have applied the use of other facts and circumstances to conclude that Antamina and Fort Hills are joint operations for the purposes of our consolidated financial statements. The other facts and circumstances considered for both of these arrangements are the provisions for output to the parties of the joint arrangements. For both Antamina and Fort Hills, we will take our share of the output from the assets directly over the life of the arrangement. We have concluded that this, combined with other factors, gives us direct rights to the assets and obligations for the liabilities of these arrangements, proportionate to our ownership interests.
Estimated Recoverable Reserves and Resources
Mineral reserve and resource estimates are based on various assumptions relating to operating matters. These include production costs, mining and processing recoveries, cut-off values or grades, and assumptions relating to long-term commodity prices. In some cases, mineral reserve and resource estimates are further affected by exchange rates, inflation rates and capital cost assumptions. Cost estimates are based on feasibility study estimates or operating history. Estimates are prepared by appropriately qualified persons, but will be affected by forecasted commodity prices, inflation rates, exchange rates, capital and production costs and recoveries, amongst other factors.
Estimated recoverable reserves and resources are used to determine the depreciation of property, plant and equipment at operating mine sites, in accounting for deferred stripping costs, in performing impairment testing and for forecasting the timing of the payment of decommissioning and restoration costs. Therefore, changes in the assumptions used could change the carrying value of assets, depreciation and impairment charges recorded in the income statement, and the carrying value of the decommissioning and restoration provision.
Decommissioning and Restoration Provisions
The decommissioning and restoration provisions (DRP) are based on future cost estimates using information available at the balance sheet date. These estimates are based on engineering studies of the work that is required by environmental laws or public statements by management that result in an obligation.
The DRP is adjusted at each reporting period for changes to factors such as the expected amount of cash flows required to discharge the liability, the timing of such cash flows, and the discount rate. The DRP requires other significant estimates and assumptions such as requirements of the relevant legal and regulatory framework, and the timing, extent and costs of required decommissioning and restoration activities. To the extent the actual costs differ from these estimates, adjustments will be recorded and the income statement may be affected.
Current and Deferred Income Taxes
The determination of our tax expense for the year and its deferred tax liabilities and assets involves significant management estimate and judgment involving a number of assumptions. In determining these
| Teck 2013 Management’s Discussion and Analysis | Page 37 |
amounts, management interprets tax legislation in a variety of jurisdictions and makes estimates of the expected timing of the reversal of deferred tax assets and liabilities. Deferred tax liabilities arising from temporary differences on investments in subsidiaries and joint ventures are recognized unless the reversal of the temporary differences is not expected to occur in the foreseeable future and can be controlled. Management also makes estimates of future taxable profits, which affects the extent to which potential future tax benefits may be used. Assumptions about the generation of future taxable profits and repatriation of retained earnings depend on management’s estimates of future production and sales volumes, commodity prices, reserves, operating costs, decommissioning and restoration costs, capital expenditures, dividends and other capital management transactions. We are subject to assessments by various taxation authorities who may interpret tax legislation differently. These differences may affect the final amount or timing of the payment of taxes. We provide for these differences, where known, based on management’s best estimate of the probable outcome of these matters.
Adoption of New Accounting Standards and Accounting Developments
Effective January 1, 2013, we have adopted several new and amended IFRS pronouncements and have applied them to our results in accordance with the transitional provisions outlined in the respective standards. The new pronouncements are described below and can be categorized as those that result in changes to our results, those that affect our financial statement presentation or disclosures, and those that affect accounting policies, but had no effect on our results as they were consistent with our existing policies. More detail on these changes and any effects on our results and financial statement disclosures are provided in Note 29 to our audited consolidated financial statements for the year ended December 31, 2013.
Pronouncements Affecting Our Financial Results
The adoption of the following new and amended IFRS pronouncements has resulted in adjustments to how we determine our current and previously reported figures, as described below.
Production Stripping Costs
IFRIC 20, Stripping Costs in the Production Phase of a Surface Mine (IFRIC 20) provides guidance on how to account for overburden waste stripping costs in the production phase of a surface mine. Stripping activities that improve access to ore are considered to be an addition or enhancement of an existing asset and accordingly, these costs should be capitalized.
The adoption of IFRIC 20 resulted in an increase in the capitalization of stripping activity assets on our consolidated balance sheet and an increase in our profit and earnings per share, as costs that would have been expensed under our previous accounting policy are now being capitalized and amortized on a units-of-production basis in subsequent periods. Inventories were adjusted to capitalize production stripping costs and the depreciation of stripping activity assets is included in the cost of inventories.
The adoption of IFRIC 20 has significantly increased our capitalization of production stripping costs compared to our previous accounting policy. During 2013, we capitalized $801 million of stripping activity assets, which included $57 million of depreciation charges, primarily at our coal operations, and recorded depreciation expense on stripping activity assets of $313 million. We have described the effect of IFRIC 20 on our profit and business unit results throughout this Management’s Discussion and Analysis.
This new pronouncement has no effect on our cash balance, our total cash flow (other than the presentation in our cash flow statement) or how we operate our mines.
| Teck 2013 Management’s Discussion and Analysis | Page 38 |
Post-Employment Benefits
IAS 19, Employee Benefits (IAS 19), has amendments related to defined benefit pension plans that eliminate the option to defer certain actuarial gains and losses on the balance sheet. The amendments also require any remeasurement gains or losses, including actuarial gains and losses, to be recognized immediately and presented in other comprehensive income, eliminating the option to recognize and present these amounts through the income statement. The amendments to IAS 19 also require one discount rate be applied to the net defined benefit asset or liability for the purposes of determining the interest element of the defined benefit cost and require the recognition of unvested past service cost awards into profit immediately. There is also a requirement to change the presentation of finance income and finance expense to present both as a net finance expense (income) amount in the consolidated financial statements. Additional disclosures are required to present more information about the characteristics, amounts recognized and risks related to defined benefit plans.
The adoption of the amendments to IAS 19 did not have a significant effect on our results for the year ended December 31, 2013 and the amended disclosure requirements for IAS 19 are incorporated in our audited consolidated financial statements as at December 31, 2013.
Pronouncements Affecting Our Financial Statement Presentation or Disclosures
The adoption of the following new and amended IFRS pronouncements has resulted in enhanced financial statement disclosures in our interim or annual consolidated financial statements or a change in financial statement presentation. These pronouncements did not affect our financial results and the additional disclosures required by the new pronouncements have been included in our annual consolidated financial statements for the year ended December 31, 2013.
Disclosures of Interests in Other Entities
IFRS 12, Disclosures of Interests in Other Entities (IFRS 12) outlines the disclosure requirements for interests in subsidiaries and other entities to enable users to evaluate the risks associated with interests in other entities and the effects of those interests on an entity’s financial position, financial performance and cash flows. The adoption of IFRS 12 did not significantly affect our disclosures for the year ended December 31, 2013. We have included a non-controlling interests’ financial statement note (Note 22) in our audited consolidated financial statements as at December 31, 2013 to comply with the requirements of IFRS 12.
Fair Value Measurement
IFRS 13, Fair Value Measurement (IFRS 13) defines fair value, sets out a single IFRS framework for measuring fair value and outlines disclosure requirements for fair value measurements.
IFRS 13 defines fair value as the price that would be received to sell an asset or paid to transfer a liability in an orderly transaction between market participants at the measurement date. Fair value is a market-based measurement, not an entity-specific measurement, so assumptions that market participants would use should be applied in measuring fair value.
The disclosure requirements of IFRS 13 include disclosures about fair values of financial assets and liabilities measured on a recurring basis and non-financial assets and liabilities measured on a non-recurring basis. It also requires disclosures about assumptions used in calculating fair value less cost of disposal for our annual goodwill impairment test.
| Teck 2013 Management’s Discussion and Analysis | Page 39 |
The amendments to IAS 1, Presentation of Financial Statements (IAS 1) require companies preparing financial statements under IFRS to group items within other comprehensive income based on whether or not the item may be subsequently reclassified to profit or loss.
We have amended our consolidated statement of comprehensive income for all periods presented in our audited consolidated financial statements as at December 31, 2013 to reflect the presentation changes required under the amended IAS 1. Since these changes are reclassifications within our statement of comprehensive income, there is no net impact on our comprehensive income.
Other Pronouncements
The adoption of the following new IFRS pronouncements did not affect our financial results or disclosures, as no changes were required to our existing accounting treatment. These pronouncements did not have an effect on our consolidated financial statements for the current period or prior periods.
Consolidated Financial Statements
IFRS 10, Consolidated Financial Statements (IFRS 10) establishes principles for the presentation and preparation of consolidated financial statements when an entity controls one or more other entities. This IFRS defines the principle of control and establishes control as the basis for determining which entities are consolidated in an entity’s financial statements.
Joint Arrangements
If an arrangement results in joint control, IFRS 11, Joint Arrangements (IFRS 11) classifies joint arrangements as either joint operations or joint ventures, depending on the rights and obligations of the parties involved. We also adopted IAS 28(R), Investments in Associates and Joint Ventures (IAS 28), which included amendments to address the accounting for joint ventures.
We completed an analysis of all of our joint arrangements to determine the appropriate accounting treatment under IFRS 11 and to assess whether there would be any changes required from our previous accounting policy of proportionate consolidation for our jointly controlled entities. Based on our analysis, we have concluded that all of our joint arrangements are joint operations under IFRS 11 and, accordingly, we have recorded the assets, liabilities, revenues and expenses in relation to our interest in each joint operation. The adoption of IFRS 11 did not have an effect on our consolidated financial statements for the current period or prior periods presented for comparative purposes.
The change in accounting treatment of our interest in Fort Hills from an investment in an associate to a joint operation during the year ended December 31, 2013 was due to changes made to the Limited Partnership Agreement, the Unanimous Shareholder Agreement and the Fort Hills Oil Sands Project Operating Services contract on October 30, 2013, and not the adoption of IFRS 11 on January 1, 2013.
Accounting Developments
New IFRS pronouncements that have been issued but are not yet effective are listed below. We plan to apply the new standard or interpretation in the annual period for which it is first required.
Financial Instruments
IFRS 9, Financial Instruments (IFRS 9), addresses the classification, measurement and recognition of financial assets and financial liabilities. IFRS 9 was issued in November 2009 and amended in October 2010.
| Teck 2013 Management’s Discussion and Analysis | Page 40 |
It replaces the parts of IAS 39, Financial Instruments: Recognition and Measurement (IAS 39) that relate to the classification and measurement of financial instruments. IFRS 9 requires financial assets to be classified into two measurement categories: those measured at fair value and those measured at amortized cost. The determination is made at initial recognition. The classification depends on the entity’s business model for managing its financial instruments and the contractual cash flow characteristics of the instrument. For financial liabilities, the standard retains most of the IAS 39 requirements. The main change is that, in cases where the fair value option is taken for financial liabilities, the part of a fair value change due to an entity’s own credit risk is recorded in other comprehensive income rather than the income statement, unless this creates an accounting mismatch.
In November 2013, the International Accounting Standards Board (IASB) issued the hedge accounting section of IFRS 9, as well as two amendments to the previously issued IFRS 9. The new hedge accounting model will align hedge accounting with risk management activities undertaken by an entity. Components of both financial and non-financial items will now be eligible for hedge accounting as long as the risk component can be identified and measured. The new hedge accounting model includes eligibility criteria that must be met but these criteria are based on an economic assessment of the strength of the hedging relationship, which can be determined using internal risk management data. New disclosure requirements relating to hedge accounting will be required and are meant to simplify existing disclosures. The IASB currently has a separate project on macro hedging activities and until that project is completed, entities are permitted to continue to apply IAS 39 for all of their hedge accounting.
In November 2013, the IASB amended IFRS 9 to remove the mandatory effective date of January 1, 2015 due to continued work being performed on other phases of the IFRS 9 project relating to impairment. The IASB will be announcing a mandatory effective date for IFRS 9 in the future when IFRS 9 is closer to completion. Entities are still permitted to early adopt all or part of IFRS 9.
We are currently assessing the effect of this standard and related amendments on our consolidated financial statements.
Levies
In May 2013, the IASB issued IFRIC 21, Levies (IFRIC 21), which provides guidance on the accounting for a liability to pay a levy, if that liability is within the scope of IAS 37, Provisions, Contingent Liabilities and Contingent Assets. Levies are imposed by governments in accordance with legislation and do not include income taxes, which are accounted for under IAS 12, Income Taxes or fines or other penalties imposed for breaches of legislation. The interpretation was issued to address diversity in practice around when the liability to pay a levy is recognized.
IFRIC 21 defines an obligating event as the activity that triggers the payment of the levy, as identified by the legislation. A liability to pay a levy is recognized at the date of the obligating event, which may be at a point in time or over a period of time. The fact that an entity is economically compelled to continue to operate in the future, or prepares its financial statements on a going concern basis, does not create an obligation to pay a levy that will arise in a future period as a result of continuing to operate.
IFRIC 21 is effective for annual periods beginning on or after January 1, 2014 and is required to be applied retrospectively. We are currently assessing the effect of this standard on our consolidated financial statements.
| Teck 2013 Management’s Discussion and Analysis | Page 41 |
Control Activities
For all changes to policies and procedures that have been identified relating to the above items, the effectiveness of internal controls over financial reporting and disclosure controls and procedures has been assessed and any changes have been implemented. We have identified and implemented accounting process changes relating to the above new policies and these changes were not significant. We applied our existing control framework to the implementation of the new standards. All accounting policy changes and financial effects are subject to review by senior management and the Audit Committee of the Board of Directors.
Business Activities, Key Performance Measures and Information Systems
We do not expect the preceding changes to significantly affect our financial covenants or key ratios. The implementation of the above IFRS pronouncements is not expected to significantly impact our information systems.
Outstanding Share Data
As at February 26, 2014, there were 566,908,607 Class B subordinate voting shares and 9,353,470 Class A common shares outstanding. In addition, there were 11,147,606 employee stock options outstanding, with exercise prices ranging between $4.15 and $58.80 per share. More information on these instruments and the terms of their conversion are set out in the equity note to our 2013 consolidated financial statements.
| Teck 2013 Management’s Discussion and Analysis | Page 42 |
| ($ in millions) | | Less than 1 Year | | | 1–3 Years | | | 4–5 Years | | | More than 5 Years | | | Total | |
| | | | | | | | | | | | | | | | |
| Principal and interest payments on debt | | $ | 369 | | | $ | 1,060 | | | $ | 1,826 | | | $ | 10,980 | | | $ | 14,235 | |
| Operating leases | | | 50 | | | | 43 | | | | 28 | | | | 12 | | | | 133 | |
| Capital leases | | | 59 | | | | 12 | | | | 5 | | | | 32 | | | | 108 | |
Road and port lease at Red Dog(1) | | | 19 | | | | 38 | | | | 38 | | | | 238 | | | | 333 | |
Minimum purchase obligations(2) | | | | | | | | | | | | | | | | | | | | |
| Concentrate, equipment and supply purchases | | | 967 | | | | 232 | | | | 1 | | | | – | | | | 1,200 | |
| Shipping and distribution | | | 42 | | | | 50 | | | | 46 | | | | 49 | | | | 187 | |
Pension funding(3) | | | 64 | | | | – | | | | – | | | | – | | | | 64 | |
Other non-pension post-retirement benefits(4) | | | 15 | | | | 33 | | | | 37 | | | | 322 | | | | 407 | |
Decommissioning and restoration provision(5) | | | 62 | | | | 122 | | | | 85 | | | | 820 | | | | 1,089 | |
Other long-term liabilities(6) | | | 17 | | | | 22 | | | | 15 | | | | 24 | | | | 78 | |
Contributions to the Fort Hills oil sands project(7) | | | 721 | | | | – | | | | – | | | | – | | | | 721 | |
| | | $ | 2,385 | | | $ | 1,612 | | | $ | 2,081 | | | $ | 12,477 | | | $ | 18,555 | |
Notes:
| (1) | We lease road and port facilities from the Alaska Industrial Development and Export Authority through which we ship metal concentrates produced at the Red Dog mine. Minimum lease payments are US$18 million per annum and are subject to deferral and abatement for force majeure events. |
| (2) | The majority of our minimum purchase obligations are subject to continuing operations and force majeure provisions. |
| (3) | As at December 31, 2013, the company had a net pension asset of $39 million based on actuarial estimates prepared on a going concern basis. The amount of minimum funding for 2014 in respect of defined benefit pension plans is $64 million. The timing and amount of additional funding after 2014 is dependent upon future returns on plan assets, discount rates and other actuarial assumptions. |
| (4) | We had a discounted, actuarially determined liability of $407 million in respect of other non-pension post-retirement benefits as at December 31, 2013. Amounts shown are estimated expenditures in the indicated years. |
| (5) | We accrue environmental and reclamation obligations over the life of our mining operations and amounts shown are estimated expenditures in the indicated years at fair value, assuming credit-adjusted risk-free discount rates between 6.00% and 7.13% and an inflation factor of 2.00%. |
| (6) | Other long-term liabilities include amounts for post-closure, environmental costs and other items. |
| (7) | In November 2005, we acquired a 15% interest in the Fort Hills Energy Limited Partnership, which is developing the Fort Hills oil sands project in Alberta, Canada. In September 2007, we acquired an additional 5% interest, bringing our total interest to 20%. To earn our additional 5% interest, we are required to contribute 27.5% of $5 billion of project expenditures after project spending reaches $2.5 billion. We are presently funding at this level. Thereafter, we are responsible for our 20% share of development costs. |
Disclosure Controls and Internal Control Over Financial Reporting
Disclosure Controls and Procedures
Disclosure controls and procedures are designed to provide reasonable assurance that information required to be disclosed in reports filed or submitted by us under U.S. and Canadian securities legislation is recorded, processed, summarized and reported within the time periods specified in those rules and include controls and procedures designed to ensure that information required to be disclosed in reports filed or submitted by us under U.S. and Canadian securities legislation is accumulated and communicated to management, including the Chief Executive Officer and Chief Financial Officer, as appropriate to permit timely decisions regarding required disclosure. Management, including the Chief Executive Officer and Chief Financial Officer, has evaluated the effectiveness of the design and operation of our disclosure controls and procedures, as defined in the rules of the U.S. Securities and Exchange Commission and the Canadian Securities Administrators, as at December 31, 2013. Based on this evaluation, the Chief Executive Officer and Chief Financial Officer have concluded that our disclosure controls and procedures were effective as at December 31, 2013.
Management’s Report on Internal Control Over Financial Reporting
Our management is responsible for establishing and maintaining adequate internal control over financial reporting. Any system of internal control over financial reporting, no matter how well designed, has inherent
| Teck 2013 Management’s Discussion and Analysis | Page 43 |
limitations. Therefore, even those systems determined to be effective can provide only reasonable assurance with respect to financial statement preparation and presentation. Management has used the Committee of Sponsoring Organizations of the Treadway Commission (COSO) 1992 framework to evaluate the effectiveness of our internal control over financial reporting. Based on this assessment, management has concluded that as at December 31, 2013, our internal control over financial reporting was effective.
The effectiveness of our internal controls over financial reporting has been audited by PricewaterhouseCoopers LLP, an independent registered public accounting firm, who have expressed their opinion in their report included with our annual consolidated financial statements.
Use of Non-GAAP Financial Measures
Our financial results are prepared in accordance with International Financial Reporting Standards (IFRS). This document refers to gross profit before depreciation and amortization, EBITDA, adjusted profit, adjusted earnings per share, net debt, debt to debt-plus-equity ratio, and the net debt to net debt-plus-equity ratio, which are not measures recognized under IFRS in Canada and do not have a standardized meaning prescribed by IFRS or Generally Accepted Accounting Principles (GAAP) in the U.S.
Gross profit before depreciation and amortization is gross profit with depreciation and amortization added back. EBITDA is profit attributable to shareholders before net finance expense, income and resource taxes, and depreciation and amortization. For adjusted profit, we adjust profit attributable to shareholders as reported to remove the effect of certain types of transactions that in our judgment are not indicative of our normal operating activities or do not necessarily occur on a regular basis. Adjusted earnings per share is calculated by dividing the adjusted profit amount by our reported weighted average shares outstanding. We believe that disclosing these measures assists readers in understanding the cash-generating potential of our business in order to provide liquidity to fund working capital needs, service outstanding debt, fund future capital expenditures and investment opportunities, and pay dividends.
Net debt is total debt less cash and cash equivalents. The debt to debt-plus-equity ratio takes total debt as reported and divides that by the sum of total debt plus total equity. The net debt to net debt-plus-equity ratio takes net debt and divides that by the sum of net debt plus total equity. These measures are disclosed as we believe they provide readers with information that allows them to assess our potential financing needs and capacity and the ability to meet our short- and long-term financial obligations.
The measures described above do not have standardized meanings under IFRS, may differ from those used by different issuers, and may not be comparable to such measures as reported by others. These measures have been derived from our financial statements and applied on a consistent basis as appropriate. We disclose these measures because we believe they assist readers in understanding the results of our operations and financial position and are meant to provide further information about our financial results to investors. These measures should not be considered in isolation or used in substitute for other measures of performance prepared in accordance with IFRS.
| Teck 2013 Management’s Discussion and Analysis | Page 44 |
| Reconciliation of Gross Profit Before Depreciation and Amortization | |
| ($ in millions) | | 2013 | | | 2012 | | | 2011 | |
| | | | | | | | | | |
| Gross profit | | $ | 2,426 | | | $ | 3,524 | | | $ | 4,877 | |
| Depreciation and amortization | | | 1,233 | | | | 983 | | | | 911 | |
| Gross profit before depreciation and amortization | | $ | 3,659 | | | $ | 4,507 | | | $ | 5,788 | |
| | | | | | | | | | | | | |
| Reported as: | | | | | | | | | | | | |
| Copper | | | | | | | | | | | | |
| Highland Valley Copper | | $ | 408 | | | $ | 530 | | | $ | 486 | |
| Antamina | | | 596 | | | | 682 | | | | 588 | |
| Quebrada Blanca | | | 121 | | | | 115 | | | | 255 | |
| Carmen de Andacollo | | | 244 | | | | 227 | | | | 288 | |
| Duck Pond | | | 19 | | | | 42 | | | | 57 | |
| Other | | | 3 | | | | 5 | | | | – | |
Coal | | | 1,729 | | | | 2,405 | | | | 3,306 | |
| | | | | | | | | | | | | |
| Zinc | | | | | | | | | | | | |
| Red Dog | | | 418 | | | | 440 | | | | 547 | |
| Trail | | | 112 | | | | 59 | | | | 256 | |
| Other | | | 4 | | | | (2 | ) | | | 2 | |
| Inter-segment sales | | | – | | | | – | | | | 3 | |
Energy | | | 5 | | | | 4 | | | | – | |
| Gross profit before depreciation and amortization | | $ | 3,659 | | | $ | 4,507 | | | $ | 5,788 | |
| Reconciliation of Profit Attributable to Shareholders to EBITDA | |
| ($ in millions) | | 2013 | | | 2012 | | | 2011 | |
| | | | | | | | | | |
| Profit attributable to shareholders | | $ | 961 | | | $ | 1,068 | | | $ | 2,668 | |
| Finance expense net of finance income | | | 326 | | | | 477 | | | | 482 | |
| Provision for income and resource taxes | | | 633 | | | | 767 | | | | 1,398 | |
| Depreciation and amortization | | | 1,233 | | | | 983 | | | | 911 | |
| EBITDA | | $ | 3,153 | | | $ | 3,295 | | | $ | 5,459 | |
| Teck 2013 Management’s Discussion and Analysis | Page 45 |
| Quarterly Reconciliation | |
| ($ in millions) | | 2013 | | | 2012 | |
| | | | Q4 | | | | Q3 | | | | Q2 | | | | Q1 | | | | Q4 | | | | Q3 | | | | Q2 | | | | Q1 | |
Profit attributable to shareholders | | $ | 232 | | | $ | 267 | | | $ | 143 | | | $ | 319 | | | $ | 200 | | | $ | 256 | | | $ | 354 | | | $ | 258 | |
Finance expense net of finance income | | | 71 | | | | 82 | | | | 86 | | | | 87 | | | | 83 | | | | 124 | | | | 127 | | | | 143 | |
Provision for income and resource taxes | | | 134 | | | | 144 | | | | 152 | | | | 203 | | | | 101 | | | | 232 | | | | 195 | | | | 239 | |
Depreciation and amortization | | | 329 | | | | 322 | | | | 289 | | | | 293 | | | | 269 | | | | 249 | | | | 257 | | | | 208 | |
| EBITDA | | $ | 766 | | | $ | 815 | | | $ | 670 | | | $ | 902 | | | $ | 653 | | | $ | 861 | | | $ | 933 | | | $ | 848 | |
| Teck 2013 Management’s Discussion and Analysis | Page 46 |
This document contains certain forward-looking information and forward-looking statements as defined in applicable securities laws. All statements other than statements of historical fact are forward-looking statements. These forward-looking statements, principally under the heading “Outlook”, but also elsewhere in this document, include estimates, forecasts and statements as to management’s expectations with respect to, among other things, mine life, anticipated production at our business units and individual operations, costs at our business units and individual operations, our expectation that we will meet our production guidance, sales volume and selling prices for our products (including settlement of coal contracts with customers), plans and expectations for our development projects, including resulting increases in forecast operating costs and costs of product sold, expected production, expected progress, costs and outcomes of our various projects and investments, including, but not limited to, those described in the discussions of our operations, the sensitivity of our profit to changes in commodity prices and exchange rates, the effect of potential production disruptions, the effect of currency exchange rates, our expectations for the general market for our commodities, future trends for the company, results of our mill optimization program at Highland Valley Copper, timing of the closing of our Duck Pond mine, projected increase in Antamina production post-2014, the economic and production estimates for our Relincho project, our ability to continue our cost reduction initiative and the results of the initiative, timing of the re-filing of the SEIA for the Quebrada Blanca Phase 2 project, our estimates of the effect of measures to manage selenium discharges and costs related thereto, the anticipated production levels from the Quintette project, the mine life, capital costs and timing of first oil from the Fort Hills project, timing expectations regarding the Frontier review and permitting process, anticipated capital expenditures and demand and market outlook for commodities. These forward-looking statements involve numerous assumptions, risks and uncertainties and actual results may vary materially.
These statements are based on a number of assumptions, including, but not limited to, assumptions regarding general business and economic conditions, the supply and demand for, deliveries of, and the level and volatility of prices of zinc, copper and coal and other primary metals and minerals as well as oil, and related products, the timing of the receipt of regulatory and governmental approvals for our development projects and other operations, our costs of production and production and productivity levels, as well as those of our competitors, power prices, continuing availability of water and power resources for our operations, market competition, the accuracy of our reserve estimates (including with respect to size, grade and recoverability) and the geological, operational and price assumptions on which these are based, conditions in financial markets, the future financial performance of the company, our ability to attract and retain skilled staff, our ability to procure equipment and operating supplies, positive results from the studies on our expansion projects, our coal and other product inventories, our ability to secure adequate transportation for our products, our ability to obtain permits for our operations and expansions, and our ongoing relations with our employees and business partners and joint venturers. Statements concerning timing of the re-filing of our SEIA for the Quebrada Blanca Phase 2 project are based on assumptions regarding the permitting process of our existing project. Our selenium management plans are based on the assumptions, and subject to the factors, described under “Elk Valley Water Management”. The foregoing list of assumptions is not exhaustive. Events or circumstances could cause actual results to vary materially.
Factors that may cause actual results to vary materially include, but are not limited to, changes in commodity and power prices, changes in market demand for our products, changes in interest and currency exchange rates, acts of foreign governments and the outcome of legal proceedings, inaccurate geological and metallurgical assumptions (including with respect to the size, grade and recoverability of mineral reserves and resources), unanticipated operational difficulties (including failure of plant, equipment or processes to operate in accordance with specifications or expectations, cost escalation, unavailability of materials and
| Teck 2013 Management’s Discussion and Analysis | Page 47 |
Statements concerning future production costs or volumes, and the sensitivity of the company’s profit to changes in commodity prices and exchange rates, are based on numerous assumptions of management regarding operating matters and on assumptions that demand for products develops as anticipated, that customers and other counterparties perform their contractual obligations, that operating and capital plans will not be disrupted by issues such as mechanical failure, unavailability of parts and supplies, labour disturbances, interruption in transportation or utilities, and adverse weather conditions, and that there are no material unanticipated variations in the cost of energy or supplies.
We assume no obligation to update forward-looking statements except as required under securities laws. Further information concerning risks and uncertainties associated with these forward-looking statements and our business can be found in our Annual Information Form for the year ended December 31, 2013, filed on SEDAR and on EDGAR under cover of Form 40-F.
| Teck 2013 Management’s Discussion and Analysis | Page 48 |