| | UNITED STATES | | |
| | SECURITIES AND EXCHANGE COMMISSION |
| | Washington, D.C. 20549 | | |
| | | | |
| | FORM N-CSR | | |
| | | | |
| CERTIFIED SHAREHOLDER REPORT OF REGISTERED MANAGEMENT |
| | INVESTMENT COMPANIES | | |
| | | | |
| Investment Company Act file number 811-6642 | | |
| | | | |
| DREYFUS CONNECTICUT INTERMEDIATE MUNICIPAL BOND FUND |
| | (Exact name of Registrant as specified in charter) |
| | | | |
| | c/o The Dreyfus Corporation | | |
| | 200 Park Avenue | | |
| | New York, New York 10166 | | |
| | (Address of principal executive offices) | | (Zip code) |
| | | | |
| | Mark N. Jacobs, Esq. | | |
| | 200 Park Avenue | | |
| | New York, New York 10166 | | |
| | (Name and address of agent for service) |
| | | | |
| Registrant's telephone number, including area code: | | (212) 922-6000 |
| | | | |
| Date of fiscal year end: | 3/31 | | |
| | | | |
| Date of reporting period: | 3/31/04 | | |
FORM N-CSR
Item 1. Reports to Stockholders.
| Dreyfus |
| Connecticut Intermediate |
| Municipal Bond Fund |
ANNUAL REPORT March 31, 2004

The views expressed in this report reflect those of the portfolio manager only through the end of the period covered and do not necessarily represent the views of Dreyfus or any other person in the Dreyfus organization. Any such views are subject to change at any time based upon market or other conditions and Dreyfus disclaims any responsibility to update such views.These views may not be relied on as investment advice and, because investment decisions for a Dreyfus fund are based on numerous factors, may not be relied on as an indication of trading intent on behalf of any Dreyfus fund.
Not FDIC-Insured • Not Bank-Guaranteed • May Lose Value
Contents
T H E F U N D
2
| Letter from the Chairman
|
3
| Discussion of Fund Performance
|
6
| Fund Performance
|
7
| Statement of Investments
|
12
| Statement of Assets and Liabilities
|
13
| Statement of Operations
|
14
| Statement of Changes in Net Assets
|
15
| Financial Highlights
|
16
| Notes to Financial Statements
|
22
| Report of Independent Auditors
|
23
| Important Tax Information
|
24
| Board Members Information
|
26
| Officers of the Fund
|
F O R M O R E I N F O R M AT I O N
Back Cover
| Dreyfus Connecticut |
| Intermediate Municipal Bond Fund |

LETTER FROM THE CHAIRMAN
Dear Shareholder:
This annual report for Dreyfus Connecticut Intermediate Municipal Bond Fund covers the 12-month period from April 1, 2003, through March 31, 2004. Inside, you’ll find valuable information about how the fund was managed during the reporting period, including a discussion with the fund’s portfolio manager, James Welch.
Municipal bonds generally continued to rally during the reporting period, despite heightened market volatility and the onset of a stronger U.S. economy.Although recovering economies historically have given rise to inflationary pressures, which have tended to hinder returns from the more interest-rate-sensitive areas of the tax-exempt bond market, the current cycle has been different to date. Sluggish job growth has helped forestall potential inflationary factors, and a rising supply of municipal bonds has supported their yields compared to comparable taxable bonds, benefiting performance.
Although our analysts and portfolio managers work hard to identify trends that may move the markets, no one can know with complete certainty what lies ahead for the U.S. economy and the municipal bond market.As always, we encourage you to review your investments regularly with your financial advisor, who may be in the best position to suggest ways to position your portfolio for the opportunities and challenges of today’s financial markets.
Thank you for your continued confidence and support.
Sincerely,

| Stephen E. Canter |
| Chairman and Chief Executive Officer |
| The Dreyfus Corporation |
| April 15, 2004 |
2

DISCUSSION OF FUND PERFORMANCE
James Welch, Portfolio Manager
How did Dreyfus Connecticut Intermediate Municipal Bond Fund perform relative to its benchmark?
For the 12-month period ended March 31, 2004, the fund achieved a total return of 4.02%.1 In comparison, the Lehman Brothers 7-Year Municipal Bond Index (the “Index”), the fund’s benchmark, achieved a total return of 5.60% for the same period.2 In addition, the average total return for all funds reported in the Lipper Other States Intermediate Municipal Debt Funds category was 3.96%.3
Although the market was volatile in a recovering economy, municipal bonds generally ended the reporting period with prices slightly higher than where they began. The fund’s performance was roughly in line with that of its Lipper category average, despite realizing a slight drop in the net asset value (“NAV”) after several of the funds’ housing bonds were “called” during the summer of 2003.The fund’s return was lower than that of the Index, mainly because the Index contains bonds from many states, not just Connecticut, and does not reflect fund fees and other expenses.
What is the fund’s investment approach?
The fund seeks as high a level of income exempt from federal and Connecticut state income taxes as is consistent with the preservation of capital.
To pursue its goal, the fund normally invests substantially all of its assets in municipal bonds that provide income exempt from federal and Connecticut state personal income taxes.The dollar-weighted average maturity of the fund’s portfolio ranges between three and 10 years. Although the fund currently intends to invest only in investment-grade municipal bonds, or the unrated equivalent as determined by Dreyfus, it has the ability to invest up to 20% of its assets in municipal bonds of below investment-grade credit quality.
The Fund 3
DISCUSSION OF FUND PERFORMANCE (continued)
The portfolio manager may buy and sell bonds based on credit quality, market outlook and yield potential. In selecting municipal bonds for investment, the portfolio manager may assess the current interest-rate environment and the municipal bond’s potential volatility in different rate environments. The portfolio manager focuses on bonds with the potential to offer attractive current income, typically looking for bonds that can provide consistently attractive current yields or that are trading at competitive market prices.A portion of the fund’s assets may be allocated to “discount” bonds, which are bonds that sell at a price below their face value, or to “premium” bonds, which are bonds that sell at a price above their face value.The fund’s allocation to either discount bonds or to premium bonds will change along with the portfolio manager’s changing views of the current interest-rate and market environment. The portfolio manager also may look to select bonds that are most likely to obtain attractive prices when sold.
What other factors influenced the fund’s performance?
When the reporting period began, tax-exempt bonds continued to rally in anticipation of lower interest rates from the Federal Reserve Board (the “Fed”). Indeed, in late June 2003, the Fed reduced the federal funds rate to 1%, a 45-year low. Shortly thereafter, however, the economy began to recover more robustly, raising concerns that interest rates might begin to rise. Consequently, in the summer of 2003, municipal bonds suffered one of the most severe six-week declines in their history.Although the market subsequently recovered gradually, it continued to be affected by heightened day-to-day volatility.
Despite the economic recovery, many states and municipalities continued to face fiscal challenges. When tax revenues fell short of projections, Connecticut took steps to balance its 2004 budget by cutting spending and raising taxes on the sale of alcohol, tobacco products and gasoline. Nonetheless, the state’s budget shortfall was more modest than that of many other states, and there was little need for the state to increase issuance in the tax-exempt bond market. As a result, the supply of Connecticut municipal bonds remained relatively tight. However, a rising supply of municipal securities on the national level kept upward pressure on tax-exempt yields, and at times during the
4
reporting period, tax-exempt yields equaled those of comparable taxable securities.
In seeking to manage the fund with respect to market volatility, we maintained an average duration that we considered to be modestly shorter than that of its benchmark.When making new purchases, we focused primarily on highly-rated or insured securities4 with maturities in the seven- to 10-year range, including bonds that are backed by the property taxes collected by localities. In contrast, we made no additions to the fund’s holdings of the state’s uninsured general obligation debt during the reporting period.
On the other hand, the fund’s returns were hindered early during the reporting period when Connecticut redeemed bonds it had issued on behalf of its housing program. Because these higher-yielding bonds had been valued at a premium but were “called” at their face values, the fund’s NAV fell marginally when they were redeemed.
What is the fund’s current strategy?
We have continued to position the fund conservatively by maintaining a relatively short average duration and emphasizing high-quality securities. In our view, this positioning is appropriate in a recovering economy that carries the risk that interest rates may rise.
April 15, 2004
1
| Total return includes reinvestment of dividends and any capital gains paid. Past performance is no guarantee of future results. Share price, yield and investment return fluctuate such that upon redemption, fund shares may be worth more or less than their original cost. Income may be subject to state and local taxes for non-Connecticut residents, and some income may be subject to the federal alternative minimum tax (AMT) for certain investors. Capital gains, if any, are fully taxable. Return figures provided reflect the absorption of fund expenses by The Dreyfus Corporation pursuant to an undertaking in effect that may be extended, terminated or modified at any time. Had these expenses not been absorbed, the fund’s return would have been lower.
|
2
| SOURCE: LIPPER INC. — Reflects reinvestment of dividends and, where applicable, capital gain distributions.The Lehman Brothers 7-Year Municipal Bond Index is an unmanaged total return performance benchmark for the investment-grade, geographically unrestricted 7-year tax-exempt bond market, consisting of municipal bonds with maturities of 6-8 years. Index returns do not reflect the fees and expenses associated with operating a mutual fund.
|
3
| SOURCE: LIPPER INC. — Category average returns reflect the fees and expenses of the funds composing the average.
|
4
| Insurance on individual securities extends to the repayment of principal and the payment of interest in the event of default. It does not extend to the market value of the fund’s securities or the value of the fund’s shares.
|
The Fund 5
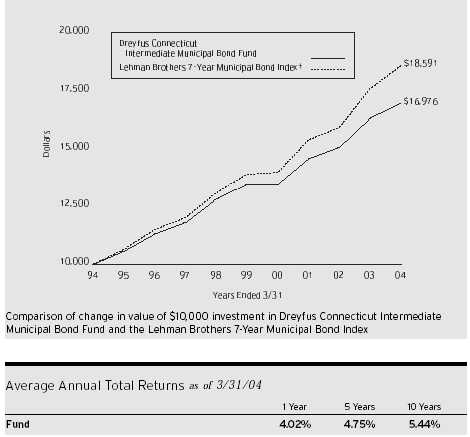
† Source: Lipper Inc.
Past performance is not predictive of future performance.The fund’s performance shown in the graph and table does not reflect the deduction of taxes that a shareholder would pay on fund distributions or the redemption of fund shares. The above graph compares a $10,000 investment made in Dreyfus Connecticut Intermediate Municipal Bond Fund on 3/31/94 to a $10,000 investment made in the Lehman Brothers 7-Year Municipal Bond Index (the “Index”) on that date.All dividends and capital gain distributions are reinvested.
The fund invests primarily in Connecticut municipal securities and maintains a portfolio with a weighted average maturity ranging between 3 and 10 years.The fund’s performance shown in the line graph takes into account fees and expenses.The Index is not limited to investments principally in Connecticut municipal obligations and does not take into account charges, fees and other expenses.The Index, unlike the fund, is an unmanaged, total return performance benchmark for the investment-grade, geographically unrestricted 7-year tax-exempt bond market, consisting of municipal bonds with maturities of 6-8 years.These factors can contribute to the Index potentially outperforming or underperforming the fund. Further information relating to fund performance, including expense reimbursements, if applicable, is contained in the Financial Highlights section of the prospectus and elsewhere in this report.
6
STATEMENT OF INVESTMENTS
March 31, 2004
| | Principal | | | |
| Long-Term Municipal Investments—96.6% | Amount ($) | Value ($) | |
|
|
| |
| Connecticut—73.7% | | | | |
| Bridgeport 6%, 9/1/2006 (Insured; AMBAC) | 1,750,000 | | 1,931,387 | |
| Connecticut: | | | | |
| 5.25%, 3/15/2010 (Insured; MBIA) | 5,100,000 | | 5,690,478 | |
| 5.25%, 12/15/2010 | 50,000 | | 57,440 | |
| 5.25%, 12/15/2010 (Insured; FSA) | 2,200,000 | | 2,531,694 | |
| 5.375%, 12/15/2010 (Insured; MBIA) | 4,100,000 | | 4,749,358 | |
| 9.077%, 12/15/2010 | 1,250,000 | a,b | 1,621,988 | |
| 5.75%, 6/15/2011 | 30,000 | | 35,034 | |
| 10.077%, 6/15/2011 | 1,500,000 | a,b | 2,003,385 | |
| 5.125%, 11/15/2013 | 1,500,000 | | 1,687,410 | |
| 5.50%, 12/15/2014 (Insured; FSA) | 3,155,000 | | 3,737,445 | |
| Airport Revenue (Bradley International Airport) | | | | |
| 5.25%, 10/1/2017 (Insured; FGIC) | 2,275,000 | | 2,430,314 | |
| (Clean Water Fund) Revenue: | | | | |
| 5.40%, 6/1/2007 (Prerefunded 6/1/2004) | 1,805,000 | c | 1,854,258 | |
| 5.125%, 7/1/2007 (Insured; MBIA) | 2,000,000 | | 2,074,820 | |
| Special Tax Obligation Revenue | | | | |
| (Transportation Infrastructure): | | | | |
| 5.25%, 9/1/2007 | 1,115,000 | | 1,239,467 | |
| 5.25%, 9/1/2007 (Insured; MBIA) | 1,360,000 | | 1,514,686 | |
| 5.375%, 9/1/2008 | 2,500,000 | | 2,829,825 | |
| 5.50%, 11/1/2012 (Insured; FSA) | 4,180,000 | | 4,907,111 | |
| 5.375%, 7/1/2013 (Insured; FSA) | 1,000,000 | | 1,144,310 | |
| Connecticut Development Authority, Revenue: | | | | |
| (Duncaster Project) 5.50%, 8/1/2011 (Insured; FGIC) | 2,405,000 | | 2,708,920 | |
| First Mortgage Gross: | | | | |
| (Church Homes, Inc.) 5.70%, 4/1/2012 | 1,990,000 | | 2,011,353 | |
| (Elim Park Baptist) 5.375%, 12/1/2011 | 1,765,000 | | 1,806,142 | |
| Pollution Control 3%, 6/1/2026 | 2,500,000 | | 2,503,175 | |
| Connecticut Health and Educational | | | | |
| Facilities Authority, Revenue: | | | | |
| (Connecticut State University System) | | | | |
| 5%, 11/1/2016 (Insured; FGIC) | 1,000,000 | | 1,095,440 | |
| (Greenwich Hospital) | | | | |
| 5.75%, 7/1/2006 (Insured; MBIA) | 1,000,000 | | 1,093,070 | |
| (Hospital for Special Care) 5.125%, 7/1/2007 | 1,400,000 | | 1,384,852 | |
| (New Haven) 6.625%, 7/1/2016 | 2,000,000 | | 2,102,280 | |
| (Park Fairfield Health Center) 6.25%, 11/1/2021 | 2,500,000 | | 2,749,525 | |
| (Saint Marys Hospital) 6%, 7/1/2005 | 1,070,000 | | 1,089,153 | |
| (Stamford Hospital) | | | | |
| 5.20%, 7/1/2007 (Insured; MBIA) | 2,210,000 | | 2,412,966 | |
| (University of New Haven) 6%, 7/1/2006 | 400,000 | | 418,208 | |
The Fund 7
STATEMENT OF INVESTMENTS (continued)
| | Principal | | | |
| Long-Term Municipal Investments (continued) | Amount ($) | Value ($ | |
|
|
| |
| Connecticut (continued) | | | | |
| Connecticut Health and Educational | | | | |
| Facilities Authority, Revenue (continued): | | | | |
| (Windham Community Memorial Hospital) | | | | |
| 5.75%, 7/1/2011 | 730,000 | | 783,035 | |
| (Yale New Haven Hospital) | 1,000,000 | | 1,094,320 | |
| 5.50%, 7/1/2013 (Insured; MBIA) | | | | |
| Connecticut Higher Education Supplemental Loan Authority, | | | | |
| Revenue (Family Education Loan Program): | | | | |
| 5.70%, 11/15/2004 | 705,000 | | 708,208 | |
| 5.80%, 11/15/2005 | 960,000 | | 964,627 | |
| 5.90%, 11/15/2006 | 1,010,000 | | 1,015,121 | |
| 5.50%, 11/15/2008 | 1,010,000 | | 1,023,645 | |
| 5.60%, 11/15/2009 | 1,075,000 | | 1,089,889 | |
| 5.625%, 11/15/2011 (Insured; AMBAC) | 860,000 | | 908,220 | |
| Connecticut Housing Finance Authority | | | | |
| (Housing Mortgage Finance Program) | | | | |
| 5.65%, 11/15/2007 | 290,000 | | 295,330 | |
| Connecticut Resource Recovery Authority, Revenue: | | | | |
| (American Refunding-Fuel Co) 5.50%, 11/15/2015 | 3,250,000 | | 3,416,368 | |
| (Bridgeport Resco Co. LP Project) 5.375%, 1/1/2006 | 2,500,000 | | 2,668,675 | |
| (Mid-Connecticut System) 5.50%, 11/15/2012 | 1,000,000 | | 997,900 | |
| Danbury 5.25%, 8/15/2004 | 815,000 | | 827,853 | |
| Fairfield: | | | | |
| 5.50%, 4/1/2011 | 2,030,000 | | 2,366,391 | |
| 5%, 1/1/2013 | 1,000,000 | | 1,133,520 | |
| Greenwich Housing Authority, MFHR | | | | |
| (Greenwich Close) 6.25%, 9/1/2017 | 2,000,000 | | 2,032,580 | |
| Hamden 5.25%, 8/15/2014 (Insured; MBIA) | 1,000,000 | | 1,138,470 | |
| Hartford, Package System Revenue 6.40%, 7/1/2020 | 1,000,000 | | 1,053,100 | |
| Middletown 5%, 4/15/2008 | 1,760,000 | | 1,945,222 | |
| New Canaan: | | | | |
| 5.25%, 2/1/2009 (Prerefunded 2/1/2006) | 550,000 | c | 587,851 | |
| 5.30%, 2/1/2010 (Prerefunded 2/1/2006) | 650,000 | c | 695,318 | |
| New Haven: | | | | |
| 5.25%, 8/1/2006 (Insured; FGIC) | 1,200,000 | | 1,282,824 | |
| 5.25%, 11/1/2011 (Insured; FGIC) | 1,335,000 | | 1,535,490 | |
| 5.375%, 11/1/2013 (Insured; FGIC) | 1,420,000 | | 1,634,065 | |
| (Air Rights Parking Facility Revenue): | | | | |
| 5.375%, 12/1/2011 (Insured; AMBAC) | 1,165,000 | | 1,350,002 | |
| Norwich 5.75%, 9/15/2005 (Prerefunded 9/15/2004) | 875,000 | c | 911,260 | |
| Ridgefield 5%, 3/1/2011 | 1,790,000 | | 2,028,679 | |
8
| | Principal | | | |
| Long-Term Municipal Investments (continued) | Amount ($) | Value ($) | |
|
|
| |
| Connecticut (continued) | | | | |
| South Central Regional Water Authority, | | | | |
| Water System Revenue | | | | |
| 5.25%, 8/1/2011 (Insured; MBIA) | 1,500,000 | | 1,730,970 | |
| University of Connecticut: | | | | |
| 5.25%, 2/15/2012 | 2,000,000 | | 2,291,180 | |
| 5.75%, 3/1/2013 (Insured; FGIC, | | | | |
| Prerefunded 3/1/2010) | 1,850,000 | c | 2,172,603 | |
| Westport: | | | | |
| 5%, 8/15/2013 | 1,400,000 | | 1,594,586 | |
| 5%, 8/15/2016 | 1,500,000 | | 1,681,455 | |
| 5%, 8/15/2017 | 3,470,000 | | 3,866,274 | |
| U.S. Related—22.9% | | | | |
| Childrens Trust Fund, Tobacco Settlement Revenue: | | | | |
| 5%, 5/15/2011 | 1,430,000 | | 1,483,225 | |
| 5.75%, 7/1/2012 (Prerefunded 7/1/2010) | 1,500,000 | c | 1,767,570 | |
| 5.75%, 7/1/2013 (Prerefunded 7/1/2010) | 1,300,000 | c | 1,531,894 | |
| 5.75%, 7/1/2014 (Prerefunded 7/1/2010) | 4,000,000 | c | 4,713,520 | |
| Commonwealth of Puerto Rico: | | | | |
| 5.30%, 7/1/2004 (Insured; MBIA) | 55,000 | | 55,590 | |
| 5.30%, 7/1/2004 (Insured; MBIA) | 945,000 | | 955,140 | |
| (Public Improvement): | | | | |
| 5.25%, 7/1/2012 (Insured; FSA) | 2,600,000 | | 2,996,890 | |
| 5.25%, 7/1/2014 (Insured; MBIA) | 1,000,000 | | 1,159,400 | |
| 5.50%, 7/1/2016 (Insured; FGIC) | 3,270,000 | | 3,850,654 | |
| Guam Economic Development Authority, | | | | |
| Tobacco Settlement: | | | | |
| 0/5.20%, 5/15/2012 | 795,000 | d | 659,937 | |
| 0/5.45%, 5/15/2016 | 1,445,000 | d | 1,145,061 | |
| 5%, 5/15/2022 | 305,000 | | 305,726 | |
| Puerto Rico Electric Power Authority, | | | | |
| Power Revenue: | | | | |
| 6.125%, 7/1/2009 (Insured; MBIA) | 4,000,000 | | 4,736,120 | |
| 5%, 7/1/2011 | 3,000,000 | | 3,337,560 | |
| Virgin Islands Public Finance Authority, Revenue: | | | | |
| Gross Receipts Taxes Loan: | | | | |
| 5.625%, 10/1/2010 | 1,000,000 | | 1,089,640 | |
| 6.375%, 10/1/2019 | 3,000,000 | | 3,393,450 | |
| Matching Fund | | | | |
| 5.50%, 10/1/2008 | 1,500,000 | | 1,656,960 | |
| Total Long-Term Municipal Investments | | | | |
| (cost $137,990,867) | | | 147,078,862 | |
The Fund 9
STATEMENT OF INVESTMENTS (continued)
| | | | Principal | | | |
| Short-Term Municipal Investments—1.6% | Amount ($) | Value ($ | |
|
|
| |
| Connecticut Health and Educational Facilities Authority, | | | | |
| Revenue,VRDN (Quinnipiac University) 1.12% | | | | |
| (cost $ | 2,400,000) | | 2,400,000 | e | 2,400,000 | |
|
|
|
|
|
| |
| | | | | | | |
| Total Investments (cost $ | 140,390,867) | 98.2% | | 149,478,862 | |
| Cash and Receivables (Net) | 1.8% | | 2,811,514 | |
| Net Assets | | 100.0% | | 152,290,376 | |
10
| Summary of Abbreviations | | |
| AMBAC | American Municipal Bond | MBIA | Municipal Bond Investors |
| | Assurance Corporation | | Assurance Insurance |
| FGIC | Financial Guaranty Insurance | | Corporation |
| | Company | MFHR | Multi-Family Housing Revenue |
| FSA | Financial Security Assurance | VRDN | Variable Rate Demand Notes |
| Summary of Combined Ratings (Unaudited) | | |
| | | | | | | |
| Fitch | or | Moody’s | or | Standard & Poor’s | Value (%) | |
|
|
|
|
|
| |
| AAA | | Aaa | | AAA | 59.4 | |
| AA | | Aa | | AA | 16.6 | |
| A | | A | | A | 6.0 | |
| BBB | | Baa | | BBB | 14.1 | |
| BB | | Ba | | BB | .9 | |
| F1 | | MIG1/P1 | | SP1/A1 | 1.6 | |
| Not Rated f | | Not Rated f | | Not Rated f | 1.4 | |
| | | | | | 100.0 | |
a Inverse floater security—the interest rate is subject to change periodically.
|
b
| Securities exempt from registration under Rule 144A of the Securities Act of 1933.These securities may be resold in transactions exempt from registration, normally to qualified institutional buyers.At March 31, 2004, these securities amounted to $3,625,373 or 2.4% of net assets.
|
c
| Bonds which are prerefunded are collateralized by U.S. Government securities which are held in escrow and are used to pay principal and interest on the municipal issue and to retire the bonds in full at the earliest refunding date.
|
d
| Zero coupon until a specified date at which time the stated coupon rate becomes effective until maturity.
|
e
| Securities payable on demand.Variable interest rate—subject to periodic change.
|
f
| Security which, while not rated by Fitch, Moody’s and Standard & Poor’s, have been determined by the Manager to be of comparable quality to those rated securities in which the fund may invest.
See notes to financial statements.
|
The Fund 11
STATEMENT OF ASSETS AND LIABILITIES
| March 31, 2004 | | | | |
|
|
|
| |
| | | | | |
| | | | | |
| | | | | |
| | | | | |
| | | | | |
| | | Cost | Value | |
|
|
|
| |
| Assets ($): | | | | |
| Investments in securities—See Statement of Investments | 140,390,867 | 149,478,862 | |
| Cash | | | 1,039,206 | |
| Interest receivable | | 1,956,918 | |
| Receivable for shares of Beneficial Interest subscribed | | 94,190 | |
| Prepaid expenses | | 13,157 | |
| | | | 152,582,333 | |
|
|
|
| |
| Liabilities ($): | | | |
| Due to The Dreyfus Corporation and affiliates—Note 3(a) | | 85,321 | |
| Payable for shares of Beneficial Interest redeemed | | 143,740 | |
| Accrued expenses | | 62,896 | |
| | | | 291,957 | |
|
|
|
| |
| Net Assets ( | $) | | 152,290,376 | |
|
|
|
| |
| Composition of Net Assets ($): | | | |
| Paid-in capital | | | 143,766,674 | |
| Accumulated net realized gain (loss) on investments | | (564,293) | |
| Accumulated net unrealized appreciation | | | |
| (depreciation) on investments | | 9,087,995 | |
|
|
| |
| Net Assets ( | $) | | 152,290,376 | |
|
|
|
| |
| Shares Outstanding | | | |
| (unlimited number of $.001 par value shares of Beneficial Interest authorized) | 10,659,214 | |
| Net Asset Value, offering and redemption price per share—Note 3(d) ($) | 14.29 | |
| | | | | |
| See notes to financial statements. | | | |
12
| STATEMENT OF OPERATIONS | | |
| Year Ended March 31, 2004 | | |
|
| |
| | | |
| | | |
| | | |
| | | |
| | | |
| | | |
| Investment Income ($): | | |
| lnterest Income | 7,126,432 | |
| Expenses: | | |
| Management fee—Note 3(a) | 928,840 | |
| Shareholder servicing costs—Note 3(b) | 156,428 | |
| Professional fees | 49,140 | |
| Custodian fees | 20,295 | |
| Trustees’ fees and expenses—Note 3(c) | 16,739 | |
| Prospectus and shareholders’ reports | 13,258 | |
| Registration fees | 10,116 | |
| Loan commitment fees—Note 2 | 1,555 | |
| Miscellaneous | 17,488 | |
| Total Expenses | 1,213,859 | |
| Less—reduction in management fee due to | | |
| undertaking—Note 3(a) | (6,596) | |
| Net Expenses | 1,207,263 | |
| Investment Income—Net | 5,919,169 | |
|
| |
| Realized and Unrealized Gain (Loss) on Investments—Note 4 ($): | | |
| Net realized gain (loss) on investments | (244,747) | |
| Net unrealized appreciation (depreciation) on investments | 396,878 | |
| Net Realized and Unrealized Gain (Loss) on Investments | 152,131 | |
| Net Increase in Net Assets Resulting from Operations | 6,071,300 | |
| | | |
| See notes to financial statements. | | |
The Fund 13
STATEMENT OF CHANGES IN NET ASSETS
| | | | Year Ended March 31, | |
| | | |
| |
| | 2004 | | 2003 | |
|
| |
| |
| Operations ($): | | | | |
| Investment income—net | 5,919,169 | | 6,151,906 | |
| Net realized gain (loss) on investments | (244,747) | | 667,381 | |
| Net unrealized appreciation | | | | |
| (depreciation) on investments | 396,878 | | 5,025,731 | |
| Net Increase (Decrease) in Net Assets | | | | |
| Resulting from Operations | 6,071,300 | | 11,845,018 | |
|
| |
| |
| Dividends to Shareholders from ($): | | | | |
| Investment income—net | (5,892,086) | | (6,169,004) | |
|
| |
| |
| Beneficial Interest Transactions ($): | | | | |
| Net proceeds from shares sold | 25,013,243 | | 37,289,223 | |
| Dividends reinvested | 4,443,263 | | 4,679,374 | |
| Cost of shares redeemed | (35,926,410) | | (27,066,690) | |
| Increase (Decrease) in Net Assets | | | | |
| from Beneficial Interest Transactions | (6,469,904) | | 14,901,907 | |
| Total Increase (Decrease) in Net Assets | (6,290,690) | | 20,577,921 | |
|
| |
| |
| Net Assets ($): | | | | |
| Beginning of Period | 158,581,066 | | 138,003,145 | |
| End of Period | 152,290,376 | | 158,581,066 | |
|
| |
| |
| Capital Share Transactions (Shares): | | | | |
| Shares sold | 1,757,248 | | 2,642,104 | |
| Shares issued for dividends reinvested | 312,102 | | 330,526 | |
| Shares redeemed | (2,525,363) | | (1,914,455) | |
| Net Increase (Decrease) in Shares Outstanding | (456,013) | | 1,058,175 | |
| | | | | |
| See notes to financial statements. | | | | |
14
FINANCIAL HIGHLIGHTS
The following table describes the performance for the fiscal periods indicated.Total return shows how much your investment in the fund would have increased (or decreased) during each period, assuming you had reinvested all dividends and dis-tributions.These figures have been derived from the fund’s financial statements.
| | | | Year Ended March 31, | | | |
| | | |
| | | |
| | 2004 | | 2003 | | 2002a | | 2001 | | 2000 | |
|
| |
| |
| |
| |
| |
| Per Share Data ($): | | | | | | | | | | |
| Net asset value, beginning of period | 14.27 | | 13.72 | | 13.86 | | 13.37 | | 13.97 | |
| Investment Operations: | | | | | | | | | | |
| Investment income—net | .54b | | .57b | | .61b | | .60 | | .58 | |
| Net realized and unrealized | | | | | | | | | | |
| gain (loss) on investments | .02 | | .56 | | (.15) | | .49 | | (.60) | |
| Total from Investment Operations | .56 | | 1.13 | | .46 | | 1.09 | | (.02) | |
| Distributions: | | | | | | | | | | |
| Dividends from investment income—net | (.54) | | (.58) | | (.60) | | (.60) | | (.58) | |
| Dividends from net realized | | | | | | | | | | |
| gain on investments | — | | — | | — | | (.00)c | | — | |
| Total Distributions | (.54) | | (.58) | | (.60) | | (.60) | | (.58) | |
| Net asset value, end of period | 14.29 | | 14.27 | | 13.72 | | 13.86 | | 13.37 | |
|
| |
| |
| |
| |
| |
| Total Return (%) | 4.02 | | 8.31 | | 3.44 | | 8.31 | | (.10) | |
|
| |
| |
| |
| |
| |
| Ratios/Supplemental Data (%): | | | | | | | | | | |
| Ratio of expenses to average net assets | .78 | | .78 | | .77 | | .79 | | .79 | |
| Ratio of net investment income | | | | | | | | | | |
| to average net assets | 3.82 | | 4.05 | | 4.38 | | 4.46 | | 4.29 | |
| Decrease reflected in above expense | | | | | | | | | | |
| ratios due to undertakings by | | | | | | | | | | |
| The Dreyfus Corporation | .00d | | — | | .00d | | .02 | | .03 | |
| Portfolio Turnover Rate | 23.49 | | 21.13 | | 28.50 | | 34.90 | | 13.33 | |
|
| |
| |
| |
| |
| |
| Net Assets, end of period ($ x 1,000) | 152,290 | | 158,581 | | 138,003 | | 135,571 | | 125,702 | |
a As required, effective April 1, 2001, the fund has adopted the provisions of the AICPA Audit and Accounting Guide for Investment Companies and began amortizing discount or premium on a scientific basis for debt securities.The effect of this change for the period ended March 31, 2002 was to increase net investment income per share by $.01 and decrease net realized and unrealized gain (loss) on investments per share by $.01 and increase the ratio of net investment income to average net assets from 4.35% to 4.38%. Per share data and ratios/supplemental data for periods prior to April 1, 2001 have not been restated to reflect this change in presentation.
b
| Based on average shares outstanding at each month end.
|
c
| Amount represents less than $.01 per share.
|
d
| Amount represents less than .01%.
|
See notes to financial statements.
The Fund 15
NOTES TO FINANCIAL STATEMENTS
NOTE 1—Significant Accounting Policies:
Dreyfus Connecticut Intermediate Municipal Bond Fund (the “fund”) is registered under the Investment Company Act of 1940, as amended (the “Act”), as a non-diversified open-end management investment company.The fund’s investment objective is to provide investors with as high a level of current income exempt from federal and Connecticut state income taxes as is consistent with the preservation of capital. The Dreyfus Corporation (the “Manager” or “Dreyfus”) serves as the fund’s investment adviser. The Manager is a wholly-owned subsidiary of Mellon Financial Corporation (“Mellon Financial”). Dreyfus Service Corporation (the “Distributor”), a wholly-owned subsidiary of the Manager, is the distributor of the fund’s shares, which are sold without a sales charge.
The fund’s financial statements are prepared in accordance with accounting principles generally accepted in the United States, which may require the use of management estimates and assumptions.Actual results could differ from those estimates.
The fund enters into contracts that contain a variety of indemnifications. The fund’s maximum exposure under these arrangements is unknown.The fund does not anticipate recognizing any loss related to these arrangements.
(a) Portfolio valuation: Investments in securities (excluding options and financial futures on municipal and U.S.Treasury securities) are valued each business day by an independent pricing service (“Service”) approved by the Board of Trustees. Investments for which quoted bid prices are readily available and are representative of the bid side of the market in the judgment of the Service are valued at the mean between the quoted bid prices (as obtained by the Service from dealers in such securities) and asked prices (as calculated by the Service based upon its evaluation of the market for such securities). Other investments (which constitute a majority of the portfolio securities) are carried at fair value as determined by the Service, based on methods which include consideration of: yields or prices of municipal securities of
16
comparable quality, coupon, maturity and type; indications as to values from dealers; and general market conditions. Options and financial futures on municipal and U.S.Treasury securities are valued at the last sales price on the securities exchange on which such securities are primarily traded or at the last sales price on the national securities market on each business day.
(b) Securities transactions and investment income: Securities transactions are recorded on a trade date basis. Realized gain and loss from securities transactions are recorded on the identified cost basis. Interest income, adjusted for amortization of discount and premium on investments, is earned from settlement date and recognized on the accrual basis. Securities purchased or sold on a when-issued or delayed-delivery basis may be settled a month or more after the trade date. Under the terms of the custody agreement, the fund received net earnings credits of $7,681 during the period ended March 31, 2004, based on available cash balances left on deposit. Income earned under this arrangement is included in interest income.
The fund follows an investment policy of investing primarily in municipal obligations of one state. Economic changes affecting the state and certain of its public bodies and municipalities may affect the ability of issuers within the state to pay interest on, or repay principal of, municipal obligations held by the fund.
(c) Dividends to shareholders: It is the policy of the fund to declare dividends daily from investment income-net. Such dividends are paid monthly. Dividends from net realized capital gain, if any, are normally declared and paid annually, but the fund may make distributions on a more frequent basis to comply with the distribution requirements of the Internal Revenue Code of 1986, as amended (the “Code”).To the extent that net realized capital gain can be offset by capital loss carryovers, it is the policy of the fund not to distribute such gain. Income and capital gain distributions are determined in accordance with income tax regulations, which may differ from accounting principles generally accepted in the United States.
The Fund 17
NOTES TO FINANCIAL STATEMENTS (continued)
(d) Federal income taxes: It is the policy of the fund to continue to qualify as a regulated investment company, which can distribute tax exempt dividends, by complying with the applicable provisions of the Code, and to make distributions of income and net realized capital gain sufficient to relieve it from substantially all federal income and excise taxes.
At March 31, 2004, the components of accumulated earnings on a tax basis were as follows: accumulated capital losses $564,293 and unrealized appreciation $9,173,779.
The accumulated capital loss carryover is available to be applied against future net securities profits, if any, realized subsequent to March 31, 2004. If not applied, $42,968 of the carryover expires in fiscal 2008, $276,703 expires in fiscal 2009 and $244,622 expires in fiscal 2012.
The tax character of distributions paid to shareholders during the fiscal periods ended March 31, 2004 and March 31, 2003, were as follows: tax exempt income $5,892,086 and $6,169,004, respectively.
During the period ended March 31, 2004, as a result of permanent book to tax differences, the fund decreased accumulated undistributed investment income-net by $27,083, increased accumulated net realized gain (loss) on investments by $51,779 and decreased paid-in capital by $24,696. Net assets were not affected by this reclassification.
NOTE 2—Bank Line of Credit:
The fund participates with other Dreyfus-managed funds in a $350 million redemption credit facility (the “Facility”) to be utilized for temporary or emergency purposes, including the financing of redemptions. In connection therewith, the fund has agreed to pay commitment fees on its pro rata portion of the Facility. Interest is charged to the fund based on prevailing market rates in effect at the time of borrowings. During the period ended March 31, 2004, the fund did not borrow under the Facility.
18
NOTE 3—Management Fee and Other Transactions With Affiliates:
(a) Pursuant to a management agreement with the Manager, the management fee is computed at the annual rate of .60 of 1% of the value of the fund’s average daily net assets and is payable monthly. The Manager had undertaken from April 1, 2003 through March 31, 2004, to reduce the management fee paid by the fund, if the aggregate annual expenses of the fund, exclusive of taxes, brokerage fees, interest on borrowings, commitment fees and extraordinary expenses, exceed an annual rate of .80 of 1% of the value of the fund’s average daily net assets.The reduction in management fee, pursuant to the undertaking, amounted to $6,596 during the period ended March 31, 2004.
The components of Due to The Dreyfus Corporation and affiliates consists of: management fees $77,321 and transfer agency per account fees $8,000.
(b) Under the fund’s Shareholder Services Plan, the fund reimburses the Distributor an amount not to exceed an annual rate of .25 of 1% of the value of the fund’s average daily net assets for certain allocated expenses of providing personal services and/or maintaining shareholder accounts.The services provided may include personal services relating to shareholder accounts, such as answering shareholder inquiries regarding the fund and providing reports and other information, and services related to the maintenance of shareholder accounts. During the period ended March 31, 2004, the fund was charged $82,307 pursuant to the Shareholder Services Plan.
The fund compensates Dreyfus Transfer, Inc., a wholly-owned subsidiary of the Manager, under a transfer agency agreement for providing personnel and facilities to perform transfer agency services for the fund. During the period ended March 31, 2004, the fund was charged $44,030 pursuant to the transfer agency agreement.
The Fund 19
NOTES TO FINANCIAL STATEMENTS (continued)
(c) Each Board member also serves as a Board member of other funds within the Dreyfus complex. Annual retainer fees and attendance fees are allocated to each fund based on net assets.
(d) A 1% redemption fee is charged and retained by the fund on shares redeemed within thirty days following the date of issuance, including redemptions made through use of the fund exchange privilege. During the period ended March 31, 2004, redemption fees charged and retained by the fund amounted to $1,810.
NOTE 4—Securities Transactions:
The aggregate amount of purchases and sales of investment securities, excluding short-term securities, during the period ended March 31, 2004, amounted to $35,558,392 and $43,292,153, respectively.
At March 31, 2004, the cost of investments for federal income tax purposes was $140,305,083; accordingly, accumulated net unrealized appreciation on investments was $9,173,779, consisting of $9,306,990 gross unrealized appreciation and $133,211 gross unrealized depreciation.
NOTE 5—Legal Matters:
Two class actions have been filed against Mellon Financial and Mellon Bank, N.A., and Dreyfus and Founders Asset Management LLC (the “Investment Advisers”), and the directors of all or substantially all of the Dreyfus funds, alleging that the Investment Advisers improperly used assets of the Dreyfus funds, in the form of directed brokerage commissions and 12b-1 fees, to pay brokers to promote sales of Dreyfus funds, and that the use of fund assets to make these payments was not properly disclosed to investors.The complaints further allege that the directors breached their fiduciary duties to fund shareholders under the Investment Company Act of 1940 and at common law.The complaints seek unspecified compensatory and punitive damages,
20
rescission of the funds’ contracts with the Investment Advisers, an accounting of all fees paid, and an award of attorneys’ fees and litigation expenses. Dreyfus and the Dreyfus funds believe the allegations to be totally without merit and will defend the actions vigorously.
Additional lawsuits arising out of these circumstances and presenting similar allegations and requests for relief may be filed against the defendants in the future. Neither Dreyfus nor the Dreyfus funds believe that any of the pending actions will have a material adverse affect on the Dreyfus funds or Dreyfus’ ability to perform its contracts with the Dreyfus funds.
The Fund 21
REPORT OF INDEPENDENT AUDITORS
Shareholders and Board of Trustees
Dreyfus Connecticut Intermediate Municipal Bond Fund
We have audited the accompanying statement of assets and liabilities of Dreyfus Connecticut Intermediate Municipal Bond Fund, including the statement of investments, as of March 31, 2004, and the related statement of operations for the year then ended, the statement of changes in net assets for each of the two years in the period then ended and financial highlights for each of the years indicated therein. These financial statements and financial highlights are the responsibility of the Fund’s management. Our responsibility is to express an opinion on these financial statements and financial highlights based on our audits.
We conducted our audits in accordance with auditing standards generally accepted in the United States. Those standards require that we plan and perform the audit to obtain reasonable assurance about whether the financial statements and financial highlights are free of material misstatement. An audit includes examining, on a test basis, evidence supporting the amounts and disclosures in the financial statements and financial highlights. Our procedures included confirmation of securities owned as of March 31, 2004 by correspondence with the custodian. An audit also includes assessing the accounting principles used and significant estimates made by management, as well as evaluating the overall financial statement presentation.We believe that our audits provide a reasonable basis for our opinion.
In our opinion, the financial statements and financial highlights referred to above present fairly, in all material respects, the financial position of Dreyfus Connecticut Intermediate Municipal Bond Fund at March 31, 2004, the results of its operations for the year then ended, the changes in its net assets for each of the two years in the period then ended, and the financial highlights for each of the indicated years, in conformity with accounting principles generally accepted in the United States.
| New York, New York |
| May 5, 2004 |

22
IMPORTANT TAX INFORMATION (Unaudited)
In accordance with federal tax law, the fund hereby designates all the dividends paid from investment income-net during its fiscal year ended March 31, 2004 as “exempt-interest dividends” (not generally subject to regular federal and, for individuals who are Connecticut residents, Connecticut personal income taxes).
As required by federal tax law rules, shareholders will receive notification of their portion of the fund’s taxable ordinary dividends (if any) and capital gain distributions (if any) paid for the 2004 calendar year on Form 1099-DIV which will be mailed by January 31, 2005.
The Fund 23
BOARD MEMBERS INFORMATION (Unaudited)
| Joseph S. DiMartino (60) |
| Chairman of the Board (1995) |
| Principal Occupation During Past 5 Years: |
| • Corporate Director and Trustee |
| Other Board Memberships and Affiliations: |
| • The Muscular Dystrophy Association, Director |
| • Levcor International, Inc., an apparel fabric processor, Director |
| • Century Business Services, Inc., a provider of outsourcing functions for small and medium size |
| companies, Director |
| • The Newark Group, a provider of a national market of paper recovery facilities, |
| paperboard mills and paperboard converting plants, Director |
| No. of Portfolios for which Board Member Serves: 186 |
| ——————— |
| David W. Burke (68) |
| Board Member (1994) |
| Principal Occupation During Past 5 Years: |
| • Corporate Director and Trustee |
| Other Board Memberships and Affiliations: |
| • John F. Kennedy Library Foundation, Director |
| • U.S.S. Constitution Museum, Director |
| No. of Portfolios for which Board Member Serves: 83 |
| ——————— |
| Diane Dunst (64) |
| Board Member (1990) |
| Principal Occupation During Past 5 Years: |
| • President, Huntting House Antiques |
| No. of Portfolios for which Board Member Serves: 11 |
| ——————— |
| Rosalind Gersten Jacobs (78) |
| Board Member (1994) |
| Principal Occupation During Past 5 Years: |
| • Merchandise and marketing consultant |
| No. of Portfolios for which Board Member Serves: 33 |
| ——————— |
| Jay I. Meltzer (75) |
| Board Member (1991) |
| Principal Occupation During Past 5 Years: |
| • Physician, Internist and Specialist in Clinical Hypertension |
| • Clinical Professor of Medicine at Columbia University & College of Physicians and Surgeons |
| • Adjunct Clinical Professor of Medicine at Cornell Medical College |
| No. of Portfolios for which Board Member Serves: 11 |
24
| Daniel Rose (74) |
| Board Member (1992) |
| Principal Occupation During Past 5 Years: |
| • Chairman and Chief Executive Officer of Rose Associates, Inc., a New York based real estate |
| development and management firm |
| Other Board Memberships and Affiliations: |
| • Baltic-American Enterprise Fund,Vice Chairman and Director |
| • Harlem Educational Activities Fund, Inc., Chairman |
| • Housing Committee of the Real Estate Board of New York, Inc., Director |
| No. of Portfolios for which Board Member Serves: 21 |
| ——————— |
| Warren B. Rudman (73) |
| Board Member (1993) |
| Principal Occupation During Past 5 Years: |
| • Of Counsel to (from January 1993 to December 31, 2002, Partner in) the law firm Paul, |
| Weiss, Rifkind,Wharton & Garrison LLP |
| Other Board Memberships and Affiliations: |
| • Collins & Aikman Corporation, Director |
| • Allied Waste Corporation, Director |
| • Chubb Corporation, Director |
| • Raytheon Company, Director |
| • Boston Scientific, Director |
| No. of Portfolios for which Board Member Serves: 20 |
| ——————— |
| Sander Vanocur (76) |
| Board Member (1992) |
| Principal Occupation During Past 5 Years: |
| • President, Old Owl Communications |
| No. of Portfolios for which Board Member Serves: 21 |
| ——————— |
Once elected all Board Members serve for an indefinite term.Additional information about the Board Members, including their address is available in the fund’s Statement of Additional Information which can be obtained from Dreyfus free of charge by calling this toll free number: 1-800-554-4611.
The Fund 25
| OFFICERS OF THE FUND (Unaudited) |
| |
| |
| STEPHEN E. CANTER, President since |
| March 2000. |
| Chairman of the Board, Chief Executive |
| Officer and Chief Operating Officer of the |
| Manager, and an officer of 96 investment |
| companies (comprised of 185 portfolios) |
| managed by the Manager. Mr. Canter also is a |
| Board member and, where applicable, an |
| Executive Committee Member of the other |
| investment management subsidiaries of Mellon |
| Financial Corporation, each of which is an |
| affiliate of the Manager. He is 58 years old and |
| has been an employee of the Manager since |
| May 1995. |
| STEPHEN R. BYERS, Executive Vice |
| President since November 2002. |
| Chief Investment Officer,Vice Chairman and a |
| Director of the Manager, and an officer of 96 |
| investment companies (comprised of 185 |
| portfolios) managed by the Manager. Mr. Byers |
| also is an officer, director or an Executive |
| Committee Member of certain other |
| investment management subsidiaries of Mellon |
| Financial Corporation, each of which is an |
| affiliate of the Manager. He is 50 years old and |
| has been an employee of the Manager since |
| January 2000. Prior to joining the Manager, he |
| served as an Executive Vice President-Capital |
| Markets, Chief Financial Officer and Treasurer |
| at Gruntal & Co., L.L.C. |
| MARK N. JACOBS, Vice President since |
| March 2000. |
| Executive Vice President, Secretary and |
| General Counsel of the Manager, and an |
| officer of 97 investment companies (comprised |
| of 201 portfolios) managed by the Manager. |
| He is 58 years old and has been an employee |
| of the Manager since June 1977. |
| JOHN B. HAMMALIAN, Secretary since |
| March 2000. |
| Associate General Counsel of the Manager, |
| and an officer of 37 investment companies |
| (comprised of 46 portfolios) managed by the |
| Manager. He is 40 years old and has been an |
| employee of the Manager since February 1991. |
| STEVEN F. NEWMAN, Assistant |
| Secretary since March 2000. |
| Associate General Counsel and Assistant |
| Secretary of the Manager, and an officer of 97 |
| investment companies (comprised of 201 |
| portfolios) managed by the Manager. He is 54 |
| years old and has been an employee of the |
| Manager since July 1980. |
| MICHAEL A. ROSENBERG, Assistant |
| Secretary since March 2000. |
| Associate General Counsel of the Manager, |
| and an officer of 94 investment companies |
| (comprised of 194 portfolios) managed by the |
| Manager. He is 44 years old and has been an |
| employee of the Manager since October 1991. |
| JAMES WINDELS, Treasurer since |
| November 2001. |
| Director – Mutual Fund Accounting of the |
| Manager, and an officer of 97 investment |
| companies (comprised of 201 portfolios) |
| managed by the Manager. He is 45 years old |
| and has been an employee of the Manager |
| since April 1985. |
26
| GREGORY S. GRUBER, Assistant |
| Treasurer since March 2000. |
| Senior Accounting Manager – Municipal Bond |
| Funds of the Manager, and an officer of 30 |
| investment companies (comprised of 59 |
| portfolios) managed by the Manager. He is 45 |
| years old and has been an employee of the |
| Manager since August 1981. |
| KENNETH J. SANDGREN, Assistant |
| Treasurer since November 2001. |
| Mutual Funds Tax Director of the Manager, |
| and an officer of 97 investment companies |
| (comprised of 201 portfolios) managed by the |
| Manager. He is 49 years old and has been an |
| employee of the Manager since June 1993. |
| WILLIAM GERMENIS, Anti-Money |
| Laundering Compliance Officer since |
| September 2002. |
| Vice President and Anti-Money Laundering |
| Compliance Officer of the Distributor, and the |
| Anti-Money Laundering Compliance Officer |
| of 92 investment companies (comprised of 196 |
| portfolios) managed by the Manager. He is 33 |
| years old and has been an employee of the |
| Distributor since October 1998. |
The Fund 27
NOTES
For More Information
| Dreyfus Connecticut |
| Intermediate Municipal |
| Bond Fund |
| 200 Park Avenue |
| New York, NY 10166 |
| |
| Manager |
| The Dreyfus Corporation |
| 200 Park Avenue |
| New York, NY 10166 |
| |
| Custodian |
|
| The Bank of New York |
| 100 Church Street |
| New York, NY 10286 |
| |
| Transfer Agent & |
| Dividend Disbursing Agent |
| Dreyfus Transfer, Inc. |
| 200 Park Avenue |
| New York, NY 10166 |
| |
| Distributor |
| Dreyfus Service Corporation |
| 200 Park Avenue |
| New York, NY 10166 |
| To obtain information: |
|
| |
| By telephone |
| Call 1-800-645-6561 |
| By mail Write to: |
| The Dreyfus Family of Funds |
| 144 Glenn Curtiss Boulevard |
| Uniondale, NY 11556-0144 |
By E-mail Send your request to info@dreyfus.com
On the Internet Information can be viewed online or downloaded from: http://www.dreyfus.com
© 2004 Dreyfus Service Corporation 0914AR0304
Item 2. Code of Ethics.
The Registrant has adopted a code of ethics that applies to the Registrant's principal executive officer, principal financial officer, principal accounting officer or controller, or persons performing similar functions.
Item 3. Audit Committee Financial Expert.
The Registrant's Board has determined that Joseph S. DiMartino, a member of the Audit Committee of the Board, is an audit committee financial expert as defined by the Securities and Exchange Commission (the "SEC"). Joseph S. DiMartino is "independent" as defined by the SEC for purposes of audit committee financial expert determinations.
Item 4. Principal Accountant Fees and Services
(a) Audit Fees. The aggregate fees billed for each of the last two fiscal years (the "Reporting Periods") for professional services rendered by the Registrant's principal accountant (the "Auditor") for the audit of the Registrant's annual financial statements, or services that are normally provided by the Auditor in connection with the statutory and regulatory filings or engagements for the Reporting Periods, were $25,900 in 2003 and $27,195 in 2004.
(b) Audit-Related Fees. The aggregate fees billed in the Reporting Periods for assurance and related services by the Auditor that are reasonably related to the performance of the audit of the Registrant's financial statements and are not reported under paragraph (a) of this Item 4 were $0.00 in 2003 and $0.00 in 2004.
The aggregate fees billed in the Reporting Periods for non-audit assurance and related services by the Auditor to the Registrant's investment adviser (not including any sub-investment adviser whose role is primarily portfolio management and is subcontracted with or overseen by another investment adviser), and any entity controlling, controlled by or under common control with the investment adviser that provides ongoing services to the Registrant ("Service Affiliates"), that were reasonably related to the performance of the annual audit of the Service Affiliate, which required pre-approval by the Audit Committee were $15,000 in 2003 and $288,500 in 2004.
Note: For the second paragraph in each of (b) through (d) of this Item 4, certain of such services were not pre-approved prior to May 6, 2003, when such services were required to be pre-approved. On and after May 6, 2003, 100% of all services provided by the Auditor were pre-approved as required. For comparative purposes, the fees shown assume that all such services were pre-approved, including services that were not pre-approved prior to the compliance date of the pre-approval requirement.
(c) Tax Fees. The aggregate fees billed in the Reporting Periods for professional services rendered by the Auditor for tax compliance, tax advice and tax planning ("Tax Services") were $2,009 in 2003 and $2,720 in 2004. [These services consisted of (i) review or preparation of U.S. federal, state, local and excise tax returns; (ii) U.S. federal, state and local tax planning, advice and assistance regarding statutory, regulatory or administrative developments, (iii) tax advice regarding tax qualification matters and/or treatment of various
-2-
SSL-DOCS2 70128344v10
financial instruments held or proposed to be acquired or held, and (iv) determination of Passive Foreign Investment Companies.]
The aggregate fees billed in the Reporting Periods for Tax Services by the Auditor to Service Affiliates which required pre-approval by the Audit Committee were $0.00 in 2003 and $0.00 in 2004.
(d) All Other Fees. The aggregate fees billed in the Reporting Periods for products and services provided by the Auditor, other than the services reported in paragraphs (a) through (c) of this Item, were less than $0.00 in 2003 and $104 in 2004. These services consisted of a review of the Registrant's anti-money laundering program.
The aggregate fees billed in the Reporting Periods for Non-Audit Services by the Auditor to Service Affiliates, other than the services reported in paragraphs (b) and (c) of this Item, which required pre-approval by the Audit Committee were $0.00 in 2003 and $0.00in 2004.
Audit Committee Pre-Approval Policies and Procedures. The Registrant's Audit Committee has established policies and procedures (the "Policy") for pre-approval (within specified fee limits) of the Auditor's engagements for non-audit services to the Registrant and Service Affiliates without specific case-by-case consideration. Pre-approval considerations include whether the proposed services are compatible with maintaining the Auditor's independence. Pre-approvals pursuant to the Policy are considered annually.
Non-Audit Fees. The aggregate non-audit fees billed by the Auditor for services rendered to the Registrant, and rendered to Service Affiliates, for the Reporting Periods were $483,587 in 2003 and $639,435 in 2004.
Auditor Independence. The Registrant's Audit Committee has considered whether the provision of non-audit services that were rendered to Service Affiliates which were not pre-approved (not requiring pre-approval) is compatible with maintaining the Auditor's independence.
Item 5. Audit Committee of Listed Registrants.
Not applicable.
Item 6. [Reserved]
Item 7. Disclosure of Proxy Voting Policies and Procedures for Closed-End Management
Investment Companies.
Not applicable.
Item 8. Purchases of Equity Securities by Closed-End Management Investment Companies and Affiliated Purchasers.
Not applicable.
Item 9. Submission of Matters to a Vote of Security Holders.
Not applicable.
Item 10. Controls and Procedures.
(a) The Registrant's principal executive and principal financial officers have concluded, based on their evaluation of the Registrant's disclosure controls and procedures as of a date within 90 days of the filing date
-3-
SSL-DOCS2 70128344v10
of this report, that the Registrant's disclosure controls and procedures are reasonably designed to ensure that information required to be disclosed by the Registrant on Form N-CSR is recorded, processed, summarized and reported within the required time periods and that information required to be disclosed by the Registrant in the reports that it files or submits on Form N-CSR is accumulated and communicated to the Registrant's management, including its principal executive and principal financial officers, as appropriate to allow timely decisions regarding required disclosure.
(b) There were no changes to the Registrant's internal control over financial reporting that occurred during the Registrant's most recently ended fiscal half-year that have materially affected, or are reasonably likely to materially affect, the Registrant's internal control over financial reporting.
Item 11. Exhibits.
(a)(1) Code of ethics referred to in Item 2.
(a)(2) Certifications of principal executive and principal financial officers as required by Rule 30a-2(a) under the Investment Company Act of 1940.
(a)(3) Not applicable.
(b) Certification of principal executive and principal financial officers as required by Rule 30a-2(b) under the Investment Company Act of 1940.
-4-
SSL-DOCS2 70128344v10
SIGNATURES
Pursuant to the requirements of the Securities Exchange Act of 1934 and the Investment Company Act of 1940, the Registrant has duly caused this Report to be signed on its behalf by the undersigned, thereunto duly authorized.
| DREYFUS CONNECTICUT INTERMEDIATE MUNICIPAL BOND FUND |
| | |
| By: | /s/Stephen E. Canter |
| | Stephen E. Canter |
| | President |
| | |
| Date: | May 27, 2004 |
Pursuant to the requirements of the Securities Exchange Act of 1934 and the Investment Company Act of 1940, this Report has been signed below by the following persons on behalf of the Registrant and in the capacities and on the dates indicated.
| By: | /s/ Stephen E. Canter |
| | Stephen E. Canter |
| | Chief Executive Officer |
| | |
| Date: | May 27, 2004 |
| | |
| By: | /s/James Windels |
| | James Windels |
| | Chief Financial Officer |
| | |
| Date: | May 27, 2004 |
EXHIBIT INDEX
(a)(1) Code of ethics referred to in Item 2.
(a)(2) Certifications of principal executive and principal financial officers as required by Rule 30a-2(a) under the Investment Company Act of 1940. (EX-99.CERT)
(b) Certification of principal executive and principal financial officers as required by Rule 30a-2(b) under the Investment Company Act of 1940. (EX-99.906CERT)
-5-
SSL-DOCS2 70128344v10