| UNITED STATES |
| SECURITIES AND EXCHANGE COMMISSION |
| Washington, D.C. 20549 |
| |
| |
| FORM N-CSR |
| |
| CERTIFIED SHAREHOLDER REPORT OF REGISTERED MANAGEMENT |
| INVESTMENT COMPANIES |
| |
| Investment Company Act file number 811-6642 |
| |
| Dreyfus Connecticut Intermediate Municipal Bond Fund |
| (Exact name of Registrant as specified in charter) |
| |
| |
| c/o The Dreyfus Corporation |
| 200 Park Avenue |
| New York, New York 10166 |
| (Address of principal executive offices) (Zip code) |
| |
| Mark N. Jacobs, Esq. |
| 200 Park Avenue |
| New York, New York 10166 |
| (Name and address of agent for service) |
| |
| Registrant's telephone number, including area code: (212) 922-6000 |
| Date of fiscal year end: | | 3/31 |
| Date of reporting period: | | 3/31/06 |
| | | | | FORM N-CSR |
| Item 1. | | Reports to Stockholders. | | |
| Dreyfus |
| Connecticut Intermediate |
| Municipal Bond Fund |
ANNUAL REPORT March 31, 2006

Save time. Save paper. View your next shareholder report online as soon as it’s available. Log into www.dreyfus.com and sign up for Dreyfus eCommunications. It’s simple and only takes a few minutes.
The views expressed in this report reflect those of the portfolio manager only through the end of the period covered and do not necessarily represent the views of Dreyfus or any other person in the Dreyfus organization. Any such views are subject to change at any time based upon market or other conditions and Dreyfus disclaims any responsibility to update such views.These views may not be relied on as investment advice and, because investment decisions for a Dreyfus fund are based on numerous factors, may not be relied on as an indication of trading intent on behalf of any Dreyfus fund.
Not FDIC-Insured • Not Bank-Guaranteed • May Lose Value
| Contents |
| |
| | | THE FUND |
| |
|
| 2 | | Letter from the Chairman |
| 3 | | Discussion of Fund Performance |
| 6 | | Fund Performance |
| 7 | | Understanding Your Fund’s Expenses |
| 7 | | Comparing Your Fund’s Expenses |
| With Those of Other Funds |
| 8 | | Statement of Investments |
| 16 | | Statement of Assets and Liabilities |
| 17 | | Statement of Operations |
| 18 | | Statement of Changes in Net Assets |
| 19 | | Financial Highlights |
| 20 | | Notes to Financial Statements |
| 25 | | Report of Independent Registered |
| | | Public Accounting Firm |
| 26 | | Important Tax Information |
| 27 | | Board Members Information |
| 29 | | Officers of the Fund |
| FOR MORE INFORMATION |
|
| | | Back Cover |
The Fund
| Dreyfus Connecticut |
| Intermediate Municipal Bond Fund |

LETTER FROM THE CHAIRMAN
Dear Shareholder:
We are pleased to present this annual report for Dreyfus Connecticut Intermediate Municipal Bond Fund, covering the 12-month period from April 1, 2005, through March 31, 2006.
Although short-term interest rates continued to rise steadily over the past six months, municipal bond yields fell modestly, supporting their prices, primarily due to robust investor demand for a more limited supply of newly issued securities. However, longer-maturity bonds generally fared better than short- and intermediate-term securities. As a result, yield differences between two-year and 30-year high-grade municipal bonds narrowed to slightly more than half a percentage point as of the end of the reporting period, which was steeper than the U.S. Treasury yield curve but still considerably narrower than historical norms.
Recent economic data have been mixed and inflation appeared to remain contained at the end of the first quarter, conditions that could continue to support longer-term bond prices. In addition, our chief economist, Richard Hoey, currently expects continued economic growth, with any slack in consumer spending likely to be taken up by corporate capital investment, exports and non-residential construction. However, if yield differences among tax-exempt bonds widen and move closer to historical averages, shorter maturities may begin to fare better than longer maturities.As always, we encourage you to talk with your financial advisor to discuss investment options and portfolio allocations that may be suitable for you in this environment.
For more information about how the fund performed, as well as information on market perspectives, we have provided a Discussion of Fund Performance given by the fund’s portfolio manager.
Thank you for your continued confidence and support.
2

DISCUSSION OF FUND PERFORMANCE
James Welch, Portfolio Manager
| How did Dreyfus Connecticut Intermediate Municipal Bond Fund |
| perform relative to its benchmark? |
For the 12-month period ended March 31, 2006, the fund achieved a total return of 2.43% .1 In comparison, the Lehman Brothers 7-Year Municipal Bond Index (the “Index”), the fund’s benchmark, achieved a total return of 2.63% for the same period.2 In addition, the average total return for all funds reported in the Lipper Other States Intermediate Municipal Debt Funds category was 2.19. 3
Despite rising interest rates throughout the reporting period, municipal bond prices held up relatively well due to persistently low inflation and robust investor demand.The fund produced higher returns than its Lipper category average, primarily due to our security selection strategy, which enabled participation in relatively attractive returns from bonds issued to finance Connecticut housing, health care and education facilities. However, the fund’s return fell short of the benchmark, which contains bonds from many states, not just Connecticut, and does not reflect fund fees and expenses.
What is the fund’s investment approach?
The fund seeks as high a level of income exempt from federal and Connecticut state income taxes as is consistent with the preservation of capital.
To pursue its goal, the fund normally invests substantially all of its assets in municipal bonds that provide income exempt from federal and Connecticut state personal income taxes.The dollar-weighted average maturity of the fund’s portfolio ranges between three and 10 years. Although the fund currently intends to invest only in investment-grade municipal bonds, or the unrated equivalent as determined by Dreyfus, it has the ability to invest up to 20% of its assets in municipal bonds of below investment-grade credit quality.
| | DISCUSSION OF FUND PERFORMANCE (continued)
|
We may buy and sell bonds based on credit quality, market outlook and yield potential. In selecting municipal bonds for investment, we may assess the current interest-rate environment and the municipal bond’s potential volatility in different rate environments. We focus on bonds with the potential to offer attractive current income, typically looking for bonds that can provide consistently attractive current yields or that are trading at competitive market prices. A portion of the fund’s assets may be allocated to “discount” bonds, which are bonds that sell at a price below their face value, or to “premium” bonds, which are bonds that sell at a price above their face value.The fund’s allocation to either discount bonds or to premium bonds will change along with our changing views of the current interest-rate and market environment.We also may look to select bonds that are most likely to obtain attractive prices when sold.
What other factors influenced the fund’s performance?
The reporting period generally continued to be characterized by rising short-term interest rates and surprisingly stable longer-term rates.The Federal Reserve Board (the “Fed”) implemented eight more increases in the overnight federal funds rate, driving it to 4.75% by the reporting period’s end. Short-term municipal bond yields rose along with the Fed’s interest-rate target.While longer-term bond yields also climbed somewhat, they rose less than short-term yields, contributing to a further narrowing of yield differences (known as “spreads”) between the short and long ends of the market’s maturity range. In fact, the market ended the reporting period with a spread of just 83 basis points between high-grade municipal bonds with two-year maturities and similarly rated 30-year municipal bonds.
In addition, the fund’s results were influenced by supply-and-demand factors within the municipal bond market.The steadily growing U.S. economy benefited Connecticut along with most other states, helping to reduce unemployment and boost corporate and personal incomes. Consequently, Connecticut enjoyed a budget surplus for its 2006 fiscal year, requiring the state to issue fewer tax-exempt bonds. The reduced supply of newly issued securities was met with robust investor demand, putting downward pressure on yields and supporting prices.
In this economic environment, we generally maintained our strategy of emphasizing bonds with maturities toward the longer end of the intermediate-term range. Conversely, we maintained relatively light exposure to securities in the two- to five-year area. These strategies enabled the fund to participate more fully in strength among longer-term bonds when their yields continued to fall and prices rose. In addition, the fund benefited from our security selection strategy, in which we allocated a portion of the fund’s assets to bonds that we believed offered yield advantages over Connecticut’s general obligation bonds, including those issued by localities to finance housing projects, health care facilities and schools.
What is the fund’s current strategy?
Although some analysts recently have forecast the impending end of the Fed’s credit tightening campaign, recent strong economic data suggest to us that some additional rate-hikes may be expected over the months ahead. Therefore, we generally have maintained the fund’s existing investment posture, emphasizing longer-term securities over shorter-term ones. However, we are watching carefully the economy and market conditions in Connecticut, and we are prepared to adjust our strategies when we see more definite evidence that short-term interest rates have peaked.
April 17, 2006
| 1 | | Total return includes reinvestment of dividends and any capital gains paid. Past performance is no |
| | | guarantee of future results. Share price, yield and investment return fluctuate such that upon |
| | | redemption, fund shares may be worth more or less than their original cost. Income may be subject |
| | | to state and local taxes for non-Connecticut residents, and some income may be subject to the |
| | | federal alternative minimum tax (AMT) for certain investors. Capital gains, if any, are fully |
| | | taxable. Return figures provided reflect the absorption of certain fund expenses by The Dreyfus |
| | | Corporation pursuant to an undertaking in effect that may be extended, terminated or modified at |
| | | any time. Had these expenses not been absorbed, the fund’s return would have been lower. |
| 2 | | SOURCE: LIPPER INC. — Reflects reinvestment of dividends and, where applicable, capital |
| | | gain distributions.The Lehman Brothers 7-Year Municipal Bond Index is an unmanaged total |
| | | return performance benchmark for the investment-grade, geographically unrestricted 7-year tax- |
| | | exempt bond market, consisting of municipal bonds with maturities of 6-8 years. Index returns do |
| | | not reflect the fees and expenses associated with operating a mutual fund. |
| 3 | | Source: Lipper Inc. |
The Fund 5
FUND PERFORMANCE
| Average Annual Total Returns | | as of 3/31/06 | | | | |
| |
| | | 1 Year | | 5 Years | | 10 Years |
| |
| |
| |
|
| Fund | | 2.43% | | 3.74% | | 4.46% |
| † Source: Lipper Inc. | | | | | | |
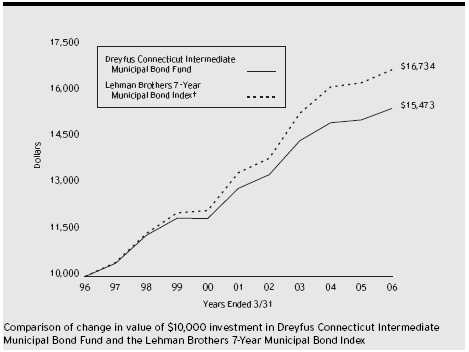
| Past performance is not predictive of future performance.The fund’s performance shown in the graph and table does not |
| reflect the deduction of taxes that a shareholder would pay on fund distributions or the redemption of fund shares. |
| The above graph compares a $10,000 investment made in Dreyfus Connecticut Intermediate Municipal Bond Fund on |
| 3/31/96 to a $10,000 investment made in the Lehman Brothers 7-Year Municipal Bond Index (the “Index”) on that |
| date. All dividends and capital gain distributions are reinvested. | | | | |
| The fund invests primarily in Connecticut municipal securities and maintains a portfolio with a weighted average |
| maturity ranging between 3 and 10 years.The fund’s performance shown in the line graph takes into account fees and |
| expenses.The Index is not limited to investments principally in Connecticut municipal obligations and does not take into |
| account charges, fees and other expenses.The Index, unlike the fund, is an unmanaged, total return performance |
| benchmark for the investment-grade, geographically unrestricted 7-year tax-exempt bond market, consisting of municipal |
| bonds with maturities of 6-8 years.These factors can contribute to the Index potentially outperforming or underperforming |
| the fund. Further information relating to fund performance, including expense reimbursements, if applicable, is contained |
| in the Financial Highlights section of the prospectus and elsewhere in this report. | | | | |
6
UNDERSTANDING YOUR FUND’S EXPENSES(Unaudited)
As a mutual fund investor, you pay ongoing expenses, such as management fees and other expenses. Using the information below, you can estimate how these expenses affect your investment and compare them with the expenses of other funds.You also may pay one-time transaction expenses, including sales charges (loads) and redemption fees, which are not shown in this section and would have resulted in higher total expenses. For more information, see your fund’s prospectus or talk to your financial adviser.
Review your fund’s expenses
The table below shows the expenses you would have paid on a $1,000 investment in Dreyfus Connecticut Intermediate Municipal Bond Fund from October 1, 2005 to March 31, 2006. It also shows how much a $1,000 investment would be worth at the close of the period, assuming actual returns and expenses.
| Expenses and Value of a $1,000 Investment |
| assuming actual returns for the six months ended March 31, 2006 |
|
| |
| Expenses paid per $1,000 † | | $ 3.90 |
| Ending value (after expenses) | | $1,003.10 |
| COMPARING YOUR FUND’S EXPENSES |
| WITH THOSE OF OTHER FUNDS (Unaudited) |
Using the SEC’s method to compare expenses
The Securities and Exchange Commission (SEC) has established guidelines to help investors assess fund expenses. Per these guidelines, the table below shows your fund’s expenses based on a $1,000 investment, assuming a hypothetical 5% annualized return. You can use this information to compare the ongoing expenses (but not transaction expenses or total cost) of investing in the fund with those of other funds.All mutual fund shareholder reports will provide this information to help you make this comparison. Please note that you cannot use this information to estimate your actual ending account balance and expenses paid during the period.
| Expenses and Value of a $1,000 Investment |
| assuming a hypothetical 5% annualized return for the six months ended March 31, 2006 |
|
| |
| Expenses paid per $1,000 † | | $ 3.93 |
| Ending value (after expenses) | | $1,021.04 |
| |
| † Expenses are equal to the fund’s annualized expense ratio of .78%, multiplied by the average account value over the |
| period, multiplied by 182/365 (to reflect the one-half year period). |
| STATEMENT OF INVESTMENTS |
| March 31, 2006 |
| Long-Term Municipal | | Coupon | | Maturity | | Principal | | |
| Investments—96.4% | | Rate (%) | | Date | | Amount ($) | | Value ($) |
| |
| |
| |
| |
|
| Connecticut���70.9% | | | | | | | | |
| Bridgeport | | | | | | | | |
| (Insured; AMBAC) | | 6.00 | | 9/1/06 | | 1,750,000 | | 1,768,008 |
| Bristol Resource Recovery Facility | | | | | | |
| Operating Committee, Solid Waste | | | | | | |
| Revenue (Covanta Bristol Inc. | | | | | | |
| Project) (Insured; AMBAC) | | 5.00 | | 7/1/14 | | 2,000,000 | | 2,118,860 |
| Connecticut | | 5.75 | | 6/15/10 | | 30,000 a | | 32,307 |
| Connecticut | | 5.25 | | 12/15/10 | | 50,000 | | 53,307 |
| Connecticut | | 6.56 | | 12/15/10 | | 1,250,000 b,c | | 1,415,363 |
| Connecticut | | 7.56 | | 6/15/11 | | 1,500,000 b,c | | 1,730,655 |
| Connecticut | | 5.13 | | 11/15/13 | | 1,500,000 | | 1,591,980 |
| Connecticut | | | | | | | | |
| (Insured; MBIA) | | 5.25 | | 3/15/10 | | 5,100,000 | | 5,299,818 |
| Connecticut | | | | | | | | |
| (Insured; MBIA) | | 5.38 | | 12/15/10 | | 4,100,000 | | 4,396,799 |
| Connecticut | | | | | | | | |
| (Insured; MBIA) | | 5.25 | | 10/15/22 | | 1,600,000 | | 1,721,264 |
| Connecticut, | | | | | | | | |
| Airport Revenue (Bradley | | | | | | | | |
| International Airport) | | | | | | | | |
| (Insured; FGIC) | | 5.25 | | 10/1/14 | | 2,000,000 | | 2,100,620 |
| Connecticut, | | | | | | | | |
| Airport Revenue (Bradley | | | | | | | | |
| International Airport) | | | | | | | | |
| (Insured; FGIC) | | 5.25 | | 10/1/17 | | 2,275,000 | | 2,379,172 |
| Connecticut, | | | | | | | | |
| Special Tax Obligation | | | | | | | | |
| (Transportation | | | | | | | | |
| Infrastructure Purposes) | | 5.25 | | 9/1/07 | | 1,115,000 | | 1,141,058 |
| Connecticut, | | | | | | | | |
| Special Tax Obligation | | | | | | | | |
| (Transportation | | | | | | | | |
| Infrastructure Purposes) | | 5.38 | | 9/1/08 | | 2,500,000 | | 2,601,625 |
| Connecticut, | | | | | | | | |
| Special Tax Obligation | | | | | | | | |
| (Transportation Infrastructure | | | | | | |
| Purposes) (Insured; AMBAC) | | 5.25 | | 7/1/19 | | 3,000,000 | | 3,344,910 |
| Connecticut, | | | | | | | | |
| Special Tax Obligation | | | | | | | | |
| (Transportation Infrastructure | | | | | | |
| Purposes) (Insured; FSA) | | 5.50 | | 11/1/12 | | 4,180,000 | | 4,581,405 |
8
| Long-Term Municipal | | Coupon | | Maturity | | Principal | | |
| Investments (continued) | | Rate (%) | | Date | | Amount ($) | | Value ($) |
| |
| |
| |
| |
|
| Connecticut (continued) | | | | | | | | |
| Connecticut, | | | | | | | | |
| Special Tax Obligation | | | | | | | | |
| (Transportation | | | | | | | | |
| Infrastructure Purposes) | | | | | | | | |
| (Insured; FSA) | | 5.38 | | 7/1/13 | | 1,000,000 | | 1,083,940 |
| Connecticut, | | | | | | | | |
| Special Tax Obligation | | | | | | | | |
| (Transportation | | | | | | | | |
| Infrastructure Purposes) | | | | | | | | |
| (Insured; MBIA) | | 5.25 | | 9/1/07 | | 1,360,000 | | 1,392,150 |
| Connecticut Clean Water Fund, | | | | | | | | |
| Revenue (Insured; MBIA) | | 5.13 | | 7/1/07 | | 2,000,000 | | 2,012,400 |
| Connecticut Development Authority, | | | | | | |
| First Mortgage Gross Revenue | | | | | | |
| (Church Homes, Inc. Congregational | | | | | | |
| Avery Heights Project) | | 5.70 | | 4/1/12 | | 1,990,000 | | 2,036,586 |
| Connecticut Development Authority, | | | | | | |
| First Mortgage Gross Revenue | | | | | | |
| (The Elim Park Baptist | | | | | | | | |
| Home Inc. Project) | | 5.38 | | 12/1/11 | | 1,765,000 | | 1,767,683 |
| Connecticut Development Authority, | | | | | | |
| Revenue (Duncaster Project) | | | | | | | | |
| (Insured; Radian) | | 5.50 | | 8/1/11 | | 2,405,000 | | 2,574,721 |
| Connecticut Health and Educational | | | | | | |
| Facilities Authority, Revenue | | | | | | | | |
| (Children’s Medical Center) | | | | | | | | |
| (Insured; MBIA) | | 5.00 | | 7/1/21 | | 1,045,000 | | 1,094,920 |
| Connecticut Health and Educational | | | | | | |
| Facilities Authority, Revenue | | | | | | | | |
| (Greenwich Hospital) | | | | | | | | |
| (Insured; MBIA) | | 5.75 | | 7/1/06 | | 1,000,000 | | 1,005,590 |
| Connecticut Health and Educational | | | | | | |
| Facilities Authority, Revenue | | | | | | | | |
| (Hospital for Special Care) | | 5.13 | | 7/1/07 | | 800,000 | | 801,664 |
| Connecticut Health and Educational | | | | | | |
| Facilities Authority, Revenue | | | | | | | | |
| (Nursing Home Program-3030 | | | | | | |
| Park Fairfield Health Center) | | 6.25 | | 11/1/21 | | 2,500,000 | | 2,580,200 |
| Connecticut Health and Educational | | | | | | |
| Facilities Authority, Revenue | | | | | | | | |
| (Stamford Hospital) | | | | | | | | |
| (Insured; MBIA) | | 5.20 | | 7/1/07 | | 2,210,000 | | 2,254,067 |
The Fund 9
STATEMENT OF INVESTMENTS (continued)
| Long-Term Municipal | | Coupon | | Maturity | | Principal | | |
| Investments (continued) | | Rate (%) | | Date | | Amount ($) | | Value ($) |
| |
| |
| |
| |
|
| Connecticut (continued) | | | | | | | | |
| Connecticut Health and Educational | | | | | | |
| Facilities Authority, Revenue | | | | | | | | |
| (University of Hartford) | | | | | | | | |
| (Insured; Radian) | | 5.50 | | 7/1/22 | | 2,000,000 | | 2,158,620 |
| Connecticut Health and Educational | | | | | | |
| Facilities Authority, Revenue | | | | | | | | |
| (University of New Haven) | | 6.00 | | 7/1/06 | | 100,000 | | 100,580 |
| Connecticut Health and Educational | | | | | | |
| Facilities Authority, Revenue | | | | | | | | |
| (University of New Haven) | | 6.63 | | 7/1/06 | | 2,000,000 a | | 2,054,260 |
| Connecticut Health and Educational | | | | | | |
| Facilities Authority, Revenue | | | | | | | | |
| (Windham Community Memorial | | | | | | |
| Hospital) (Insured; ACA) | | 5.75 | | 7/1/11 | | 600,000 | | 617,796 |
| Connecticut Health and Educational | | | | | | |
| Facilities Authority, Revenue | | | | | | | | |
| (Yale-New Haven Hospital) | | | | | | | | |
| (Insured; MBIA) | | 5.50 | | 7/1/13 | | 1,000,000 | | 1,023,980 |
| Connecticut Higher Education | | | | | | | | |
| Supplemental Loan Authority, | | | | | | | | |
| Revenue (Family Education | | | | | | | | |
| Loan Program) | | 5.50 | | 11/15/08 | | 720,000 | | 721,570 |
| Connecticut Higher Education | | | | | | | | |
| Supplemental Loan Authority, | | | | | | | | |
| Revenue (Family Education | | | | | | | | |
| Loan Program) | | 5.60 | | 11/15/09 | | 770,000 | | 771,763 |
| Connecticut Higher Education | | | | | | | | |
| Supplemental Loan Authority, | | | | | | | | |
| Revenue (Family Education Loan | | | | | | |
| Program) (Insured; AMBAC) | | 5.63 | | 11/15/11 | | 450,000 | | 455,171 |
| Connecticut Resource Recovery | | | | | | | | |
| Authority, Revenue (American | | | | | | | | |
| Refunding Fuel Co.) | | 5.50 | | 11/15/15 | | 3,250,000 | | 3,342,820 |
| Connecticut Resource Recovery | | | | | | | | |
| Authority, Revenue | | | | | | | | |
| (Mid-Connecticut System) | | 5.50 | | 11/15/10 | | 1,000,000 a | | 1,069,870 |
| Fairfield | | 5.50 | | 4/1/11 | | 2,030,000 | | 2,198,287 |
| Greater New Haven Water Pollution | | | | | | |
| Control Authority, Regional | | | | | | | | |
| Wastewater System Revenue | | | | | | | | |
| (Insured; MBIA) | | 5.00 | | 11/15/23 | | 2,655,000 | | 2,796,857 |
| Long-Term Municipal | | Coupon | | Maturity | | Principal | | |
| Investments (continued) | | Rate (%) | | Date | | Amount ($) | | Value ($) |
| |
| |
| |
| |
|
| Connecticut (continued) | | | | | | | | |
| Greenwich Housing Authority, | | | | | | | | |
| MFHR (Greenwich Close | | | | | | | | |
| Apartments) | | 6.25 | | 9/1/17 | | 2,000,000 | | 2,101,920 |
| Hamden | | | | | | | | |
| (Insured; MBIA) | | 5.25 | | 8/15/11 | | 265,000 a | | 288,982 |
| Hamden | | | | | | | | |
| (Insured; MBIA) | | 5.25 | | 8/15/14 | | 730,000 | | 790,554 |
| Hamden | | | | | | | | |
| (Insured; MBIA) | | 5.25 | | 8/15/14 | | 5,000 | | 5,452 |
| Hartford, | | | | | | | | |
| Parking System Revenue | | 6.40 | | 7/1/10 | | 1,000,000 a | | 1,101,290 |
| Middletown | | 5.00 | | 4/15/08 | | 1,760,000 | | 1,809,843 |
| New Haven | | | | | | | | |
| (Insured; FGIC) | | 5.25 | | 8/1/06 | | 1,200,000 | | 1,207,116 |
| New Haven, | | | | | | | | |
| Air Rights Parking Facility | | | | | | | | |
| Revenue (Insured; AMBAC) | | 5.38 | | 12/1/11 | | 1,165,000 | | 1,258,188 |
| University of Connecticut | | | | | | | | |
| (Insured; FGIC) | | 5.75 | | 3/1/10 | | 1,850,000 a | | 2,006,232 |
| University of Connecticut | | | | | | | | |
| (Insured; FSA) | | 5.00 | | 2/15/24 | | 1,225,000 | | 1,289,949 |
| University of Connecticut, | | | | | | | | |
| GO (Insured; FGIC) | | 5.00 | | 2/15/24 | | 3,100,000 | | 3,279,304 |
| Waterbury | | | | | | | | |
| (Insured; FSA) | | 5.25 | | 2/1/14 | | 1,000,000 | | 1,084,140 |
| Weston | | 5.25 | | 7/15/15 | | 1,000,000 a | | 1,096,940 |
| Westport | | 5.00 | | 8/15/16 | | 1,500,000 | | 1,614,150 |
| Westport | | 5.00 | | 8/15/17 | | 3,470,000 | | 3,724,524 |
| U.S. Related—25.5% | | | | | | | | |
| Children’s Trust Fund of Puerto | | | | | | | | |
| Rico, Tobacco Settlement | | | | | | | | |
| Asset-Backed Bonds | | 5.75 | | 7/1/10 | | 1,500,000 a | | 1,621,335 |
| Children’s Trust Fund of Puerto | | | | | | | | |
| Rico, Tobacco Settlement | | | | | | | | |
| Asset-Backed Bonds | | 5.75 | | 7/1/10 | | 1,300,000 a | | 1,405,157 |
| Childrens’s Trust Fund of Puerto | | | | | | |
| Rico, Tobacco Settlement | | | | | | | | |
| Asset-Backed Bonds | | 5.75 | | 7/1/10 | | 4,000,000 a | | 4,323,560 |
The Fund 11
| | STATEMENT OF INVESTMENTS (continued)
|
| Long-Term Municipal | | Coupon | | Maturity | | Principal | | |
| Investments (continued) | | Rate (%) | | Date | | Amount ($) | | Value ($) |
| |
| |
| |
| |
|
| U.S. Related (continued) | | | | | | | | |
| Guam Economic Development | | | | | | | | |
| Authority, Tobacco Settlement | | | | | | | | |
| Asset-Backed Bonds | | 0/5.20 | | 11/15/07 | | 795,000 d | | 739,040 |
| Guam Economic Development | | | | | | | | |
| Authority, Tobacco Settlement | | | | | | | | |
| Asset-Backed Bonds | | 0/5.45 | | 11/15/07 | | 1,445,000 d | | 1,321,568 |
| Guam Economic Development | | | | | | | | |
| Authority, Tobacco Settlement | | | | | | | | |
| Asset-Backed Bonds | | 5.00 | | 5/15/22 | | 170,000 | | 172,142 |
| Guam Waterworks Authority, | | | | | | | | |
| Water and Wastewater | | | | | | | | |
| System Revenue | | 5.50 | | 7/1/16 | | 1,000,000 | | 1,052,090 |
| Puerto Rico Commonwealth | | | | | | | | |
| (Public Improvement) | | | | | | | | |
| (Insured; FGIC) | | 5.50 | | 7/1/16 | | 3,270,000 | | 3,648,306 |
| Puerto Rico Commonwealth | | | | | | | | |
| (Public Improvement) | | | | | | | | |
| (Insured; FSA) | | 5.25 | | 7/1/12 | | 2,600,000 | | 2,802,592 |
| Puerto Rico Commonwealth | | | | | | | | |
| (Public Improvement) | | | | | | | | |
| (Insured; MBIA) | | 5.25 | | 7/1/14 | | 1,000,000 | | 1,088,140 |
| Puerto Rico Commonwealth Highway | | | | | | |
| and Transportation Authority, | | | | | | | | |
| Highway Revenue (Insured; FGIC) | | 5.50 | | 7/1/16 | | 2,460,000 | | 2,744,597 |
| Puerto Rico Electric Power | | | | | | | | |
| Authority, Power Revenue | | 5.00 | | 7/1/11 | | 3,000,000 | | 3,140,610 |
| Puerto Rico Electric Power | | | | | | | | |
| Authority, Power Revenue | | | | | | | | |
| (Insured; MBIA) | | 6.13 | | 7/1/09 | | 4,000,000 | | 4,301,160 |
| Virgin Islands Public Finance | | | | | | | | |
| Authority, Revenue (Virgin | | | | | | | | |
| Islands Gross Receipts | | | | | | | | |
| Taxes Loan Note) | | 5.63 | | 10/1/10 | | 820,000 | | 846,019 |
12
| Long-Term Municipal | | Coupon | | Maturity | | Principal | | |
| Investments (continued) | | Rate (%) | | Date | | Amount ($) | | Value ($) |
| |
| |
| |
| |
|
| U.S. Related (continued) | | | | | | | | |
| Virgin Islands Public Finance | | | | | | | | |
| Authority, Revenue (Virgin | | | | | | | | |
| Islands Gross Receipts | | | | | | | | |
| Taxes Loan Note) | | 6.38 | | 10/1/19 | | 3,000,000 | | 3,306,750 |
| Virgin Islands Public Finance | | | | | | | | |
| Authority, Revenue (Virgin | | | | | | | | |
| Islands Matching Loan Notes) | | 5.50 | | 10/1/08 | | 1,500,000 | | 1,557,555 |
| Total Long-Term Municipal Investments | | | | | | |
| (cost $126,079,203) | | | | | | | | 128,921,851 |
| |
| |
| |
| |
|
| |
| Short-Term Municipal | | | | | | | | |
| Investment—2.2% | | | | | | | | |
| |
| |
| |
| |
|
| Connecticut; | | | | | | | | |
| Connecticut Health and Educational | | | | | | |
| Facilities Authority, Revenue | | | | | | | | |
| (Yale University Issue) | | | | | | | | |
| (cost $3,000,000) | | 2.95 | | 4/1/06 | | 3,000,000 | | 3,000,000 |
| |
| |
| |
| |
|
| |
| Total Investments (cost $129,079,203) | | | | 98.6% | | 131,921,851 |
| |
| Cash and Receivables (Net) | | | | | | 1.4% | | 1,825,539 |
| |
| Net Assets | | | | | | 100.0% | | 133,747,390 |
| |
| a These securities are prerefunded; the date shown represents the prerefunded date. Bonds which are prerefunded are |
| collateralized by U.S. Government securities which are held in escrow and are used to pay principal and interest on |
| the municipal issue and to retire the bonds in full at the earliest refunding date. | | |
| b Inverse floater security—the interest rate is subject to periodic change periodically. | | |
| c Securities exempt from registration under Rule 144A of the Securities Act of 1933.These securities may be resold in |
| transactions exempt from registration, normally to qualified institutional buyers. At March 31, 2006, these securities |
| amounted to $3,146,018 or 2.4% of net assets. | | | | | | |
| d Zero coupon until a specified date at which time the stated coupon rate becomes effective until maturity. |
STATEMENT OF INVESTMENTS (continued)
| Summary of Abbreviations | | | | |
| |
| ACA | | American Capital Access | | AGC | | ACE Guaranty Corporation |
| AGIC | | Asset Guaranty Insurance | | AMBAC | | American Municipal Bond |
| | | Company | | | | Assurance Corporation |
| ARRN | | Adjustable Rate Receipt Notes | | BAN | | Bond Anticipation Notes |
| BIGI | | Bond Investors Guaranty Insurance | | BPA | | Bond Purchase Agreement |
| CGIC | | Capital Guaranty Insurance | | CIC | | Continental Insurance |
| | | Company | | | | Company |
| CIFG | | CDC Ixis Financial Guaranty | | CMAC | | Capital Market Assurance |
| | | | | | | Corporation |
| COP | | Certificate of Participation | | CP | | Commercial Paper |
| EDR | | Economic Development Revenue | | EIR | | Environmental Improvement |
| | | | | | | Revenue |
| FGIC | | Financial Guaranty Insurance | | | | |
| | | Company | | FHA | | Federal Housing Administration |
| FHLB | | Federal Home Loan Bank | | FHLMC | | Federal Home Loan Mortgage |
| | | | | | | Corporation |
| FNMA | | Federal National | | | | |
| | | Mortgage Association | | FSA | | Financial Security Assurance |
| GAN | | Grant Anticipation Notes | | GIC | | Guaranteed Investment Contract |
| GNMA | | Government National | | | | |
| | | Mortgage Association | | GO | | General Obligation |
| HR | | Hospital Revenue | | IDB | | Industrial Development Board |
| IDC | | Industrial Development Corporation | | IDR | | Industrial Development Revenue |
| LOC | | Letter of Credit | | LOR | | Limited Obligation Revenue |
| LR | | Lease Revenue | | MBIA | | Municipal Bond Investors |
| | | | | | | Assurance Insurance |
| | | | | | | Corporation |
| MFHR | | Multi-Family Housing Revenue | | MFMR | | Multi-Family Mortgage Revenue |
| PCR | | Pollution Control Revenue | | RAC | | Revenue Anticipation |
| | | | | | | Certificates |
| RAN | | Revenue Anticipation Notes | | RAW | | Revenue Anticipation Warrants |
| RRR | | Resources Recovery Revenue | | SAAN | | State Aid Anticipation Notes |
| SBPA | | Standby Bond Purchase Agreement | | SFHR | | Single Family Housing Revenue |
| SFMR | | Single Family Mortgage Revenue | | SONYMA | | State of New York Mortgage |
| | | | | | | Agency |
| SWDR | | Solid Waste Disposal Revenue | | TAN | | Tax Anticipation Notes |
| TAW | | Tax Anticipation Warrants | | TRAN | | Tax and Revenue |
| | | | | | | Anticipation Notes |
| XLCA | | XL Capital Assurance | | | | |
| Summary of Combined Ratings (Unaudited) | | |
| |
| Fitch | | or Moody’s | | or | | Standard & Poor’s | | Value (%) † |
| |
| |
| |
| |
|
| AAA | | Aaa | | | | AAA | | 62.6 |
| AA | | Aa | | | | AA | | 14.5 |
| A | | | | A | | | | A | | 2.9 |
| BBB | | Baa | | | | BBB | | 14.7 |
| BB | | Ba | | | | BB | | 1.4 |
| F1 | | MIG1/P1 | | | | SP1/A1 | | 2.3 |
| Not Rated e | | Not Rated e | | | | Not Rated e | | 1.6 |
| | | | | | | | | | | 100.0 |
| |
| † | | Based on total investments. | | | | | | |
| e | | Securities which, while not rated by Fitch, Moody’s and Standard & Poor’s, have been determined by the Manager to |
| | | be of comparable quality to those rated securities in which the fund may invest. | | |
| See notes to financial statements. | | | | | | |
| STATEMENT OF ASSETS AND LIABILITIES |
| March 31, 2006 |
| | | Cost | | Value |
| |
| |
|
| Assets ($): | | | | |
| Investments in securities—See Statement of Investments | | 129,079,203 | | 131,921,851 |
| Cash | | | | 276,564 |
| Interest receivable | | | | 1,823,102 |
| Receivable for shares of Beneficial Interest subscribed | | | | 3,730 |
| Prepaid expenses | | | | 5,375 |
| | | | | 134,030,622 |
| |
| |
|
| Liabilities ($): | | | | |
| Due to The Dreyfus Corporation and affiliates—Note 3(b) | | | | 72,693 |
| Payable for shares of Beneficial Interest redeemed | | | | 151,239 |
| Accrued expenses | | | | 59,300 |
| | | | | 283,232 |
| |
| |
|
| Net Assets ($) | | | | 133,747,390 |
| |
| |
|
| Composition of Net Assets ($): | | | | |
| Paid-in capital | | | | 131,649,826 |
| Accumulated net realized gain (loss) on investments | | | | (745,084) |
| Accumulated net unrealized appreciation | | | | |
| (depreciation) on investments | | | | 2,842,648 |
| |
| |
|
| Net Assets ($) | | | | 133,747,390 |
| |
| |
|
| Shares Outstanding | | | | |
| (unlimited number of $.001 par value shares of Beneficial Interest authorized) | | 9,794,718 |
| Net Asset Value, offering and redemption price per share—Note 3(d) ($) | | 13.66 |
See notes to financial statements
| STATEMENT OF OPERATIONS |
| Year Ended March 31, 2006 |
| Investment Income ($): | | |
| Interest Income | | 6,291,136 |
| Expenses: | | |
| Management fee—Note 3(a) | | 825,836 |
| Shareholder servicing costs—Note 3(b) | | 122,494 |
| Professional fees | | 56,519 |
| Trustees’ fees and expenses—Note 3(c) | | 17,199 |
| Custodian fees | | 16,933 |
| Prospectus and shareholders’ reports | | 11,955 |
| Registration fees | | 11,247 |
| Loan commitment fees—Note 2 | | 1,023 |
| Miscellaneous | | 20,001 |
| Total Expenses | | 1,083,207 |
| Less—reduction in management fee | | |
| due to undertaking—Note 3(a) | | (8,647) |
| Less—reduction in custody fees | | |
| due to earnings credits—Note 1(b) | | (6,233) |
| Net Expenses | | 1,068,327 |
| Investment Income—Net | | 5,222,809 |
| |
|
| Realized and Unrealized Gain (Loss) on Investments—Note 4 ($): |
| Net realized gain (loss) on investments | | (56,483) |
| Net unrealized appreciation (depreciation) on investments | | (1,823,668) |
| Net Realized and Unrealized Gain (Loss) on Investments | | (1,880,151) |
| Net Increase in Net Assets Resulting from Operations | | 3,342,658 |
See notes to financial statements.
The Fund 17
STATEMENT OF CHANGES IN NET ASSETS
| | | | | Year Ended March 31, |
| |
| |
|
| | | 2006 | | 2005 |
| |
| |
|
| Operations ($): | | | | |
| Investment income—net | | 5,222,809 | | 5,308,817 |
| Net realized gain (loss) on investments | | (56,483) | | (229,840) |
| Net unrealized appreciation | | | | |
| (depreciation) on investments | | (1,823,668) | | (4,421,679) |
| Net Increase (Decrease) in Net Assets | | | | |
| Resulting from Operations | | 3,342,658 | | 657,298 |
| |
| |
|
| Dividends to Shareholders from ($): | | | | |
| Investment income—net | | (5,199,546) | | (5,280,176) |
| Net realized gain on investments | | (13,760) | | — |
| Total Dividends | | (5,213,306) | | (5,280,176) |
| |
| |
|
| Beneficial Interest Transactions ($): | | | | |
| Net proceeds from shares sold | | 19,830,138 | | 18,924,936 |
| Dividends reinvested | | 3,839,427 | | 3,921,020 |
| Cost of shares redeemed | | (27,238,609) | | (31,326,372) |
| Increase (Decrease) in Net Assets | | | | |
| from Beneficial Interest Transactions | | (3,569,044) | | (8,480,416) |
| Total Increase (Decrease) in Net Assets | | (5,439,692) | | (13,103,294) |
| |
| |
|
| Net Assets ($): | | | | |
| Beginning of Period | | 139,187,082 | | 152,290,376 |
| End of Period | | 133,747,390 | | 139,187,082 |
| |
| |
|
| Capital Share Transactions (Shares): | | | | |
| Shares sold | | 1,432,280 | | 1,350,588 |
| Shares issued for dividends reinvested | | 277,015 | | 280,172 |
| Shares redeemed | | (1,966,203) | | (2,238,348) |
| Net Increase (Decrease) in Shares Outstanding | | (256,908) | | (607,588) |
See notes to financial statements.
FINANCIAL HIGHLIGHTS
The following table describes the performance for the fiscal periods indicated. Total return shows how much your investment in the fund would have increased (or decreased) during each period, assuming you had reinvested all dividends and distributions.These figures have been derived from the fund’s financial statements.
| | | | | | | Year Ended March 31, | | |
| | | |
| |
| |
|
| | | | | 2006 | | 2005 | | 2004 | | 2003 | | 2002 |
| |
| |
| |
| |
| |
| |
|
| Per Share Data ($): | | | | | | | | | | |
| Net asset value, beginning of period | | 13.85 | | 14.29 | | 14.27 | | 13.72 | | 13.86 |
| Investment Operations: | | | | | | | | | | |
| Investment income—net a | | .53 | | .53 | | .54 | | .57 | | .61 |
| Net realized and unrealized | | | | | | | | | | |
| gain (loss) on investments | | (.20) | | (.44) | | .02 | | .56 | | (.15) |
| Total from Investment Operations | | .33 | | .09 | | .56 | | 1.13 | | .46 |
| Distributions: | | | | | | | | | | |
| Dividends from investment income—net | | (.52) | | (.53) | | (.54) | | (.58) | | (.60) |
| Dividends from net realized | | | | | | | | | | |
| gain on investments | | (.00)b | | — | | — | | — | | — |
| Total Distributions | | (.52) | | (.53) | | (.54) | | (.58) | | (.60) |
| Net asset value, end of period | | 13.66 | | 13.85 | | 14.29 | | 14.27 | | 13.72 |
| |
| |
| |
| |
| |
|
| Total Return (%) | | 2.43 | | .63 | | 4.02 | | 8.31 | | 3.44 |
| |
| |
| |
| |
| |
|
| Ratios/Supplemental Data (%): | | | | | | | | | | |
| Ratio of total expenses | | | | | | | | | | |
| to average net assets | | .79 | | .78 | | .78 | | .78 | | .77 |
| Ratio of net expenses | | | | | | | | | | |
| to average net assets | | .78 | | .77 | | .78 | | .78 | | .77 |
| Ratio of net investment income | | | | | | | | | | |
| to average net assets | | 3.79 | | 3.78 | | 3.82 | | 4.05 | | 4.38 |
| Portfolio Turnover Rate | | 16.45 | | 18.79 | | 23.49 | | 21.13 | | 28.50 |
| |
| |
| |
| |
| |
|
| Net Assets, end of period ($ x 1,000) | | 133,747 | | 139,187 | | 152,290 | | 158,581 | | 138,003 |
| |
| a | | Based on average shares outstanding at each month end. | | | | | | | | |
| b | | Amount represents less than $.01 per share. | | | | | | | | |
| See notes to financial statements. | | | | | | | | | | |
The Fund 19
NOTES TO FINANCIAL STATEMENTS
NOTE 1—Significant Accounting Policies:
Dreyfus Connecticut Intermediate Municipal Bond Fund (the “fund”) is registered under the Investment Company Act of 1940, as amended (the “Act”), as a non-diversified open-end management investment company.The fund’s investment objective is to provide investors with as high a level of current income exempt from federal and Connecticut state income taxes as is consistent with the preservation of capital.The Dreyfus Corporation (the “Manager” or “Dreyfus”) serves as the fund’s investment adviser. The Manager is a wholly-owned subsidiary of Mellon Financial Corporation (“Mellon Financial”). Dreyfus Service Corporation (the “Distributor”), a wholly-owned subsidiary of the Manager, is the distributor of the fund’s shares, which are sold to the public without a sales charge.
The fund’s financial statements are prepared in accordance with U.S. generally accepted accounting principles, which may require the use of management estimates and assumptions. Actual results could differ from those estimates.
The fund enters into contracts that contain a variety of indemnifications. The fund’s maximum exposure under these arrangements is unknown.The fund does not anticipate recognizing any loss related to these arrangements.
(a) Portfolio valuation: Investments in securities are valued each business day by an independent pricing service (the “Service”) approved by the Board of Trustees. Investments for which quoted bid prices are readily available and are representative of the bid side of the market in the judgment of the Service are valued at the mean between the quoted bid prices (as obtained by the Service from dealers in such securities) and asked prices (as calculated by the Service based upon its evaluation of the market for such securities). Other investments (which constitute a majority of the portfolio securities) are carried at fair value as determined by the Service, based on methods which include consideration of: yields or prices of municipal securities of comparable quality, coupon, maturity and type; indications as to values
20
from dealers; and general market conditions. Options and financial futures on municipal and U.S.Treasury securities are valued at the last sales price on the securities exchange on which such securities are primarily traded or at the last sales price on the national securities market on each business day.
(b) Securities transactions and investment income: Securities transactions are recorded on a trade date basis. Realized gain and loss from securities transactions are recorded on the identified cost basis. Interest income, adjusted for accretion of discount and amortization of premium on investments, is earned from settlement date and recognized on the accrual basis. Securities purchased or sold on a when-issued or delayed-delivery basis may be settled a month or more after the trade date.
The fund has an arrangement with the custodian bank whereby the fund receives earnings credits from the custodian when positive cash balances are maintained, which are used to offset custody fees. For financial reporting purposes, the fund includes net earnings credits as an expense offset in the Statement of Operations.
The fund follows an investment policy of investing primarily in municipal obligations of one state. Economic changes affecting the state and certain of its public bodies and municipalities may affect the ability of issuers within the state to pay interest on, or repay principal of, municipal obligations held by the fund.
(c) Dividends to shareholders: It is the policy of the fund to declare dividends daily from investment income-net. Such dividends are paid monthly. Dividends from net realized capital gain, if any, are normally declared and paid annually, but the fund may make distributions on a more frequent basis to comply with the distribution requirements of the Internal Revenue Code of 1986, as amended (the “Code”).To the extent that net realized capital gain can be offset by capital loss carryovers, it is the policy of the fund not to distribute such gain.Income and capital gain distributions are determined in accordance with income tax regulations, which may differ from U.S. generally accepted accounting principles.
The Fund 21
NOTES TO FINANCIAL STATEMENTS (continued)
(d) Federal income taxes: It is the policy of the fund to continue to qualify as a regulated investment company, which can distribute tax exempt dividends, by complying with the applicable provisions of the Code, and to make distributions of income and net realized capital gain sufficient to relieve it from substantially all federal income and excise taxes.
At March 31, 2006, the components of accumulated earnings on a tax basis were as follows: undistributed tax exempt income $69,597, accumulated capital losses $756,304 and unrealized appreciation $2,946,313. In addition, the fund had $92,445 of capital losses realized after October 31, 2005, which were deferred for tax purposes to the first day of the following fiscal year.
The accumulated capital loss carryover is available to be applied against future net securities profits, if any, realized subsequent to March 31, 2006. If not applied, $28,967 expires in fiscal 2008, $276,703 expires in fiscal 2009, $244,622 expires in fiscal 2012 and $206,012 expires in fiscal 2013.
The tax character of distributions paid to shareholders during the fiscal periods ended March 31, 2006 and March 31, 2005 were as follows: tax exempt income $5,199,546 and $5,280,176 and ordinary income $13,760 and $0, respectively.
During the period ended March 31, 2006, as a result of permanent book to tax differences primarily due to the tax treatment for amortization adjustments, the fund decreased accumulated undistributed investment income-net by $23,263, increased accumulated net realized gain (loss) on investments by $117,424 and decreased paid-in capital by $94,161. Net assets were not affected by this reclassification.
NOTE 2—Bank Line of Credit:
The fund participates with other Dreyfus-managed funds in a $350 million redemption credit facility (the “Facility”) to be utilized for temporary or emergency purposes, including the financing of redemptions. In connection therewith, the fund has agreed to pay commitment fees
22
on its pro rata portion of the Facility. Interest is charged to the fund based on prevailing market rates in effect at the time of borrowing. During the period ended March 31, 2006, the fund did not borrow under the Facility.
| NOTE 3—Management Fee and Other Transactions With |
| Affiliates: |
(a) Pursuant to a management agreement with the Manager, the management fee is computed at the annual rate of .60% of the value of the fund’s average daily net assets and is payable monthly.The Manager had undertaken from April 1, 2005 through March 31, 2006 to reduce the management fee paid by the fund, to the extent that, the fund’s aggregate annual expenses, exclusive of taxes, brokerage fees, interest on borrowings, commitment fees and extraordinary expenses, exceed an annual rate of .80% of the value of the fund’s average daily net assets. The reduction in management fee, pursuant to the undertaking, amounted to $8,647 during the period ended March 31, 2006.
(b) Under the fund’s Shareholder Services Plan, the fund reimburses the Distributor an amount not to exceed an annual rate of .25% of the value of the fund’s average daily net assets for certain allocated expenses of providing personal services and/or maintaining shareholder accounts.The services provided may include personal services relating to shareholder accounts, such as answering shareholder inquiries regarding the fund and providing reports and other information, and services related to the maintenance of shareholder accounts. During the period ended March 31, 2006, the fund was charged $62,003 pursuant to the Shareholder Services Plan.
The fund compensates Dreyfus Transfer, Inc., a wholly-owned subsidiary of the Manager, under a transfer agency agreement for providing personnel and facilities to perform transfer agency services for the fund. During the period ended March 31, 2006, the fund was charged $38,698 pursuant to the transfer agency agreement.
The Fund 23
NOTES TO FINANCIAL STATEMENTS (continued)
During the period ended March 31, 2006, the fund wad charged $3,784 for services performed by the Chief Compliance Officer.
The components of Due to The Dreyfus Corporation and affiliates in the Statement of Assets and Liabilities consist of: management fees $69,150, chief compliance officer fees $1,910 and transfer agency per account fees $6,432, which are offset against an expense reimbursement currently in effect in the amount of $4,799.
(c) Each Board member also serves as a Board member of other funds within the Dreyfus complex. Annual retainer fees and attendance fees are allocated to each fund based on net assets.
(d) A 1% redemption fee is charged and retained by the fund on certain shares redeemed within thirty days following the date of issuance, subject to exceptions, including redemptions made through the use of the fund’s exchange privilege. During the period ended March 31, 2006, redemption fees charged and retained by the fund amounted to $79.
NOTE 4—Securities Transactions:
The aggregate amount of purchases and sales of investment securities, excluding short-term securities, during the period ended March 31, 2006, amounted to $22,078,120 and $23,934,286, respectively.
At March 31, 2006, the cost of investments for federal income tax purposes was $128,975,538 accordingly, accumulated net unrealized appreciation on investments was $2,946,313, consisting of $3,300,757 gross unrealized appreciation and $354,444 gross unrealized depreciation.
24
| REPORT OF INDEPENDENT REGISTERED |
| PUBLIC ACCOUNTING FIRM |
| Shareholders and Board of Trustees |
| Dreyfus Connecticut Intermediate Municipal Bond Fund |
We have audited the accompanying statement of assets and liabilities of Dreyfus Connecticut Intermediate Municipal Bond Fund, including the statement of investments, as of March 31, 2006, and the related statement of operations for the year then ended, the statement of changes in net assets for each of the two years in the period then ended and financial highlights for each of the years indicated therein.These financial statements and financial highlights are the responsibility of the Fund’s management. Our responsibility is to express an opinion on these financial statements and financial highlights based on our audits.
We conducted our audits in accordance with the standards of the Public Company Accounting Oversight Board (United States).Those standards require that we plan and perform the audit to obtain reasonable assurance about whether the financial statements and financial highlights are free of material misstatement.We were not engaged to perform an audit of the Fund’s internal control over financial reporting. Our audits included consideration of internal control over financial reporting as a basis for designing audit procedures that are appropriate in the circumstances, but not for the purpose of expressing an opinion on the effectiveness of the Fund’s internal control over financial reporting.Accordingly, we express no such opinion. An audit also includes examining, on a test basis, evidence supporting the amounts and disclosures in the financial statements and financial highlights,assessing the accounting principles used and significant estimates made by management,and evaluating the overall financial statement presentation. Our procedures included confirmation of securities owned as of March 31, 2006 by correspondence with the custodian and others. We believe that our audits provide a reasonable basis for our opinion.
In our opinion, the financial statements and financial highlights referred to above present fairly, in all material respects, the financial position of Dreyfus Connecticut Intermediate Municipal Bond Fund at March 31, 2006, the results of its operations for the year then ended, the changes in its net assets for each of the two years in the period then ended, and the financial highlights for each of the indicated years, in conformity with U.S. generally accepted accounting principles.

| New York, New York |
| May 5, 2006 |
The Fund 25
IMPORTANT TAX INFORMATION (Unaudited)
In accordance with federal tax law, the fund hereby designates all the dividends paid from investment income-net during its fiscal year ended March 31, 2006 as “exempt-interest dividends” (not generally subject to regular federal and, for individuals who are Connecticut residents, Connecticut personal income taxes). As required by federal tax law rules, shareholders will receive notification of their portion of the fund’s taxable ordinary dividends (if any) and capital gain distributions (if any) paid for the 2006 calendar year on Form 1099-DIV which will be mailed by January 31, 2007.
BOARD MEMBERS INFORMATION (Unaudited)
| Joseph S. DiMartino (62) |
| Chairman of the Board (1995) |
| Principal Occupation During Past 5 Years: |
| • Corporate Director and Trustee |
Other Board Memberships and Affiliations:
- The Muscular Dystrophy Association, Director
- Levcor International, Inc., an apparel fabric processor, Director
- Century Business Services, Inc., a provider of outsourcing functions for small and medium size companies, Director
- The Newark Group, a provider of a national market of paper recovery facilities, paperboard mills and paperboard converting plants, Director
- Sunair Services Corporation, engages in the design, manufacture and sale of high frequency systems for long-range voice and data communications, as well as provides certain outdoor-related services to homes and businesses, Director
No. of Portfolios for which Board Member Serves: 185
———————
| David W. Burke (69) |
| Board Member (1994) |
| Principal Occupation During Past 5 Years: |
| • Corporate Director and Trustee |
Other Board Memberships and Affiliations:
- John F. Kennedy Library Foundation, Director
- U.S.S. Constitution Museum, Director
No. of Portfolios for which Board Member Serves: 79
———————
| Diane Dunst (66) |
| Board Member (1990) |
| Principal Occupation During Past 5 Years: |
| • President, Huntting House Antiques |
No. of Portfolios for which Board Member Serves: 9
———————
| Jay I. Meltzer (77) |
| Board Member (1991) |
Principal Occupation During Past 5 Years:
- Physician, Internist and Specialist in Clinical Hypertension
- Clinical Professor of Medicine at Columbia University & College of Physicians and Surgeons
- Faculty Associate, Center for Bioethics, Columbia
No. of Portfolios for which Board Member Serves: 9
The Fund 27
BOARD MEMBERS INFORMATION (Unaudited) (continued)
| Daniel Rose (76) |
| Board Member (1992) |
Principal Occupation During Past 5 Years:
- Chairman and Chief Executive Officer of Rose Associates, Inc., a New York based real estate development and management firm
Other Board Memberships and Affiliations:
- Baltic-American Enterprise Fund,Vice Chairman and Director
- Harlem Educational Activities Fund, Inc., Chairman
- Housing Committee of the Real Estate Board of New York, Inc., Director
No. of Portfolios for which Board Member Serves: 18
———————
| Warren B. Rudman (75) |
| Board Member (1993) |
Principal Occupation During Past 5 Years:
- Of Counsel to (from January 1993 to December 31, 2003, Partner in) the law firm Paul, Weiss, Rifkind,Wharton & Garrison LLP
Other Board Memberships and Affiliations:
- Collins & Aikman Corporation, Director
- Allied Waste Corporation, Director
- Raytheon Company, Director
- Boston Scientific, Director
No. of Portfolios for which Board Member Serves: 18
———————
| Sander Vanocur (78) |
| Board Member (1992) |
| Principal Occupation During Past 5 Years: |
| • President, Old Owl Communications |
No. of Portfolios for which Board Member Serves: 18
———————
Once elected all Board Members serve for an indefinite term.The address of the Board Members and Officers is in c/o The Dreyfus Corporation, 200 Park Avenue, New York, New York 10166. Additional information about the Board Members is available in the fund’s Statement of Additional Information which can be obtained from Dreyfus free of charge by calling this toll free number: 1-800-554-4611.
Rosalind Gersten Jacobs, Emeritus Board Member
OFFICERS OF THE FUND (Unaudited)
| STEPHEN E. CANTER, President since |
| March 2000. |
Chairman of the Board and Chief Executive Officer of the Manager, and an officer of 90 investment companies (comprised of 185 portfolios) managed by the Manager. Mr. Canter also is a Board member and, where applicable, an Executive Committee Member of the other investment management subsidiaries of Mellon Financial Corporation, each of which is an affiliate of the Manager. He is 60 years old and has been an employee of the Manager since May 1995.
| STEPHEN R. BYERS, Executive Vice |
| President since November 2002. |
Chief Investment Officer,Vice Chairman and a director of the Manager, and an officer of 90 investment companies (comprised of 185 portfolios) managed by the Manager. Mr. Byers also is an officer, director or an Executive Committee Member of certain other investment management subsidiaries of Mellon Financial Corporation, each of which is an affiliate of the Manager. He is 52 years old and has been an employee of the Manager since January 2000.
| MARK N. JACOBS, Vice President since |
| March 2000. |
Executive Vice President, Secretary and General Counsel of the Manager, and an officer of 91 investment companies (comprised of 201 portfolios) managed by the Manager. He is 59 years old and has been an employee of the Manager since June 1977.
| MICHAEL A. ROSENBERG, Vice President |
| and Secretary since August 2005. |
Associate General Counsel of the Manager, and an officer of 91 investment companies (comprised of 201 portfolios) managed by the Manager. He is 46 years old and has been an employee of the Manager since October 1991.
| JAMES BITETTO, Vice President and |
| Assistant Secretary since August 2005. |
Assistant General Counsel and Assistant Secretary of the Manager, and an officer of 91 investment companies (comprised of 201 portfolios) managed by the Manager. He is 39 years old and has been an employee of the Manager since December 1996.
| JONI LACKS CHARATAN, Vice President |
| and Assistant Secretary since |
| August 2005. |
Associate General Counsel of the Manager, and an officer of 91 investment companies (comprised of 201 portfolios) managed by the Manager. She is 50 years old and has been an employee of the Manager since October 1988.
| JOSEPH M. CHIOFFI, Vice President and |
| Assistant Secretary since August 2005. |
Assistant General Counsel of the Manager, and an officer of 91 investment companies (comprised of 201 portfolios) managed by the Manager. He is 44 years old and has been an employee of the Manager since June 2000.
| JANETTE E. FARRAGHER, Vice President |
| and Assistant Secretary since |
| August 2005. |
Associate General Counsel of the Manager, and an officer of 91 investment companies (comprised of 201 portfolios) managed by the Manager. She is 43 years old and has been an employee of the Manager since February 1984.
| JOHN B. HAMMALIAN, Vice President and |
| Assistant Secretary since August 2005. |
Associate General Counsel of the Manager, and an officer of 91 investment companies (comprised of 201 portfolios) managed by the Manager. He is 42 years old and has been an employee of the Manager since February 1991.
The Fund 29
OFFICERS OF THE FUND (Unaudited) (continued)
| ROBERT R. MULLERY, Vice President and |
| Assistant Secretary since August 2005. |
Associate General Counsel of the Manager, and an officer of 91 investment companies (comprised of 201 portfolios) managed by the Manager. He is 54 years old and has been an employee of the Manager since May 1986.
| JEFF PRUSNOFSKY, Vice President and |
| Assistant Secretary since August 2005. |
Associate General Counsel of the Manager, and an officer of 91 investment companies (comprised of 201 portfolios) managed by the Manager. He is 40 years old and has been an employee of the Manager since October 1990.
| JAMES WINDELS, Treasurer since |
| November 2001. |
Director – Mutual Fund Accounting of the Manager, and an officer of 91 investment companies (comprised of 201 portfolios) managed by the Manager. He is 47 years old and has been an employee of the Manager since April 1985.
| ERIK D. NAVILOFF, Assistant Treasurer |
| since August 2005. |
Senior Accounting Manager – Taxable Fixed Income Funds of the Manager, and an officer of 91 investment companies (comprised of 201 portfolios) managed by the Manager. He is 37 years old and has been an employee of the Manager since November 1992.
| ROBERT ROBOL, Assistant Treasurer |
| since August 2005. |
Senior Accounting Manager – Money Market and Municipal Bond Funds of the Manager, and an officer of 91 investment companies (comprised of 201 portfolios) managed by the Manager. He is 42 years old and has been an employee of the Manager since October 1988.
| ROBERT SVAGNA, Assistant Treasurer |
| since August 2005. |
Senior Accounting Manager – Equity Funds of the Manager, and an officer of 91 investment companies (comprised of 201 portfolios) managed by the Manager. He is 39 years old and has been an employee of the Manager since November 1990.
| GAVIN C. REILLY, Assistant Treasurer |
| since December 2005. |
Tax Manager of the Investment Accounting and Support Department of the Manager, and an officer of 91 investment companies (comprised of 201 portfolios) managed by the Manager. He is 37 years old and has been an employee of the Manager since April 1991.
| JOSEPH W. CONNOLLY, Chief Compliance |
| Officer since October 2004. |
Chief Compliance Officer of the Manager and The Dreyfus Family of Funds (91 investment companies, comprised of 201 portfolios). From November 2001 through March 2004, Mr. Connolly was first Vice-President, Mutual Fund Servicing for Mellon Global Securities Services. In that capacity, Mr. Connolly was responsible for managing Mellon’s Custody, Fund Accounting and Fund Administration services to third-party mutual fund clients. He is 48 years old and has served in various capacities with the Manager since 1980, including manager of the firm’s Fund Accounting Department from 1997 through October 2001.
| WILLIAM GERMENIS, Anti-Money |
| Laundering Compliance Officer since |
| September 2002. |
Vice President and Anti-Money Laundering Compliance Officer of the Distributor, and the Anti-Money Laundering Compliance Officer of 87 investment companies (comprised of 197 portfolios) managed by the Manager. He is 35 years old and has been an employee of the Distributor since October 1998.
30
NOTES
| For More | | Information |
| |
|
| |
| Dreyfus Connecticut | | Transfer Agent & |
| Intermediate Municipal | | Dividend Disbursing Agent |
| Bond Fund | | Dreyfus Transfer, Inc. |
| 200 Park Avenue | | 200 Park Avenue |
| New York, NY 10166 | | New York, NY 10166 |
| Manager | | Distributor |
| The Dreyfus Corporation | | Dreyfus Service Corporation |
| 200 Park Avenue | | 200 Park Avenue |
| New York, NY 10166 | | New York, NY 10166 |
| Custodian | | |
| The Bank of New York | | |
| One Wall Street | | |
| New York, NY 10286 | | |
| |
|
| |
| |
| Telephone 1-800-645-6561 | | |
Mail The Dreyfus Family of Funds, 144 Glenn Curtiss Boulevard, Uniondale, NY 11556-0144 E-mail Send your request to info@dreyfus.com Internet Information can be viewed online or downloaded at: http://www.dreyfus.com
The fund files its complete schedule of portfolio holdings with the Securities and Exchange Commission (“SEC”) for the first and third quarters of each fiscal year on Form N-Q. The fund's Forms N-Q are available on the SEC’s website at http://www.sec.gov and may be reviewed and copied at the SEC’s Public Reference Room in Washington, DC. Information on the operation of the Public Reference Room may be obtained by calling 1-800-SEC-0330.
Information regarding how the fund voted proxies relating to portfolio securities for the 12-month period ended June 30, 2005, is available on the SEC’s website at http://www.sec.gov and without charge, upon request, by calling 1-800-645-6561.

Item 2. Code of Ethics.
The Registrant has adopted a code of ethics that applies to the Registrant's principal executive officer, principal financial officer, principal accounting officer or controller, or persons performing similar functions. There have been no amendments to, or waivers in connection with, the Code of Ethics during the period covered by this Report.
Item 3. Audit Committee Financial Expert.
The Registrant's Board has determined that Joseph S. DiMartino, a member of the Audit Committee of the Board, is an audit committee financial expert as defined by the Securities and Exchange Commission (the "SEC"). Joseph S. DiMartino is "independent" as defined by the SEC for purposes of audit committee financial expert determinations.
Item 4. Principal Accountant Fees and Services
(a) Audit Fees. The aggregate fees billed for each of the last two fiscal years (the "Reporting Periods") for professional services rendered by the Registrant's principal accountant (the "Auditor") for the audit of the Registrant's annual financial statements, or services that are normally provided by the Auditor in connection with the statutory and regulatory filings or engagements for the Reporting Periods, were $29,480 in 2005 and $30,881 in 2006.
(b) Audit-Related Fees. The aggregate fees billed in the Reporting Periods for assurance and related services by the Auditor that are reasonably related to the performance of the audit of the Registrant's financial statements and are not reported under paragraph (a) of this Item 4 were $0 in 2005 and $0 in 2006.
The aggregate fees billed in the Reporting Periods for non-audit assurance and related services by the Auditor to the Registrant's investment adviser (not including any sub-investment adviser whose role is primarily portfolio management and is subcontracted with or overseen by another investment adviser), and any entity controlling, controlled by or under common control with the investment adviser that provides ongoing services to the Registrant ("Service Affiliates"), that were reasonably related to the performance of the annual audit of the Service Affiliate, which required pre-approval by the Audit Committee were $0 in 2005 and $0 in 2006.
Note: For the second paragraph in each of (b) through (d) of this Item 4, certain of such services were not pre-approved prior to May 6, 2003, when such services were required to be pre-approved. On and after May 6, 2003, 100% of all services provided by the Auditor were pre-approved as required. For comparative purposes, the fees shown assume that all such services were pre-approved, including services that were not pre-approved prior to the compliance date of the pre-approval requirement.
(c) Tax Fees. The aggregate fees billed in the Reporting Periods for professional services rendered by the Auditor for tax compliance, tax advice and tax planning ("Tax Services") were $2,725 in 2005 and $2,999 in 2006. These services consisted of (i) review or preparation of U.S. federal, state, local and excise tax returns; (ii) U.S. federal, state and local tax planning, advice and assistance regarding statutory, regulatory or administrative developments, and (iii) tax advice regarding tax qualification matters and/or treatment of various financial instruments held.
The aggregate fees billed in the Reporting Periods for Tax Services by the Auditor to Service Affiliates which required pre-approval by the Audit Committee were $0 in 2005 and $0 in 2006.
(d) All Other Fees. The aggregate fees billed in the Reporting Periods for products and services provided by the Auditor, other than the services reported in paragraphs (a) through (c) of this Item, were $88 in 2005 and $88 in 2006. These services consisted of a review of the Registrant's anti-money laundering program.
The aggregate fees billed in the Reporting Periods for Non-Audit Services by the Auditor to Service Affiliates, other than the services reported in paragraphs (b) through (c) of this Item, which required pre-approval by the Audit Committee were $0 in 2005 and $0 in 2006.
Audit Committee Pre-Approval Policies and Procedures. The Registrant's Audit Committee has established policies and procedures (the "Policy") for pre-approval (within specified fee limits) of the Auditor's engagements for non-audit services to the Registrant and Service Affiliates without specific case-by-case consideration. Pre-approval considerations include whether the proposed services are compatible with maintaining the Auditor's independence. Pre-approvals pursuant to the Policy are considered annually.
Non-Audit Fees. The aggregate non-audit fees billed by the Auditor for services rendered to the Registrant, and rendered to Service Affiliates, for the Reporting Periods were $605,451 in 2005 and $769,395 in 2006.
Auditor Independence. The Registrant's Audit Committee has considered whether the provision of non-audit services that were rendered to Service Affiliates which were not pre-approved (not requiring pre-approval) is compatible with maintaining the Auditor's independence.
| Item 5. | | Audit Committee of Listed Registrants. |
| | | Not applicable. |
| Item 6. | | Schedule of Investments. |
| | | Not applicable. |
| Item 7. | | Disclosure of Proxy Voting Policies and Procedures for Closed-End Management |
| | | Investment Companies. |
| | | Not applicable. |
| Item 8. | | Portfolio Managers of Closed-End Management Investment Companies. |
| | | Not applicable. |
| Item 9. | | Purchases of Equity Securities by Closed-End Management Investment Companies and |
| | | Affiliated Purchasers. |
| | | Not applicable. |
| Item 10. | | Submission of Matters to a Vote of Security Holders. |
The Registrant has a Nominating Committee (the "Committee"), which is responsible for selecting and nominating persons for election or appointment by the Registrant's Board as Board members. The Committee has adopted a Nominating Committee Charter (the "Charter"). Pursuant to the Charter, the
Committee will consider recommendations for nominees from shareholders submitted to the Secretary of the Registrant, c/o The Dreyfus Corporation Legal Department, 200 Park Avenue, 8th Floor East, New York, New York 10166. A nomination submission must include information regarding the recommended nominee as specified in the Charter. This information includes all information relating to a recommended nominee that is required to be disclosed in solicitations or proxy statements for the election of Board members, as well as information sufficient to evaluate the factors to be considered by the Committee, including character and integrity, business and professional experience, and whether the person has the ability to apply sound and independent business judgment and would act in the interests of the Registrant and its shareholders.
Nomination submissions are required to be accompanied by a written consent of the individual to stand for election if nominated by the Board and to serve if elected by the shareholders, and such additional information must be provided regarding the recommended nominee as reasonably requested by the Committee.
Item 11. Controls and Procedures.
(a) The Registrant's principal executive and principal financial officers have concluded, based on their evaluation of the Registrant's disclosure controls and procedures as of a date within 90 days of the filing date of this report, that the Registrant's disclosure controls and procedures are reasonably designed to ensure that information required to be disclosed by the Registrant on Form N-CSR is recorded, processed, summarized and reported within the required time periods and that information required to be disclosed by the Registrant in the reports that it files or submits on Form N-CSR is accumulated and communicated to the Registrant's management, including its principal executive and principal financial officers, as appropriate to allow timely decisions regarding required disclosure.
(b) There were no changes to the Registrant's internal control over financial reporting that occurred during the second fiscal quarter of the period covered by this report that have materially affected, or are reasonably likely to materially affect, the Registrant's internal control over financial reporting.
| Item 12. Exhibits. |
| (a)(1) | | Code of ethics referred to in Item 2. |
| (a)(2) | | Certifications of principal executive and principal financial officers as required by Rule 30a-2(a) |
| under the Investment Company Act of 1940. |
| (a)(3) | | Not applicable. |
| (b) | | Certification of principal executive and principal financial officers as required by Rule 30a-2(b) |
| under the Investment Company Act of 1940. |
Pursuant to the requirements of the Securities Exchange Act of 1934 and the Investment Company Act of 1940, the Registrant has duly caused this Report to be signed on its behalf by the undersigned, thereunto duly authorized.
Dreyfus Connecticut Intermediate Municipal Bond Fund
| By: | | /s/ Stephen E. Canter |
| | | Stephen E. Canter |
| | | President |
| |
| Date: | | May 26, 2006 |
Pursuant to the requirements of the Securities Exchange Act of 1934 and the Investment Company Act of 1940, this Report has been signed below by the following persons on behalf of the Registrant and in the capacities and on the dates indicated.
| By: | | /s/ Stephen E. Canter |
| | | Stephen E. Canter |
| | | Chief Executive Officer |
| |
| Date: | | May 26, 2006 |
| |
| By: | | /s/James Windels |
| | | James Windels |
| | | Chief Financial Officer |
| |
| Date: | | May 26, 2006 |
| | | EXHIBIT INDEX |
| (a)(1) | | Code of ethics referred to in Item 2. |
| (a)(2) | | Certifications of principal executive and principal financial officers as required by Rule 30a- |
| 2(a) under the Investment Company Act of 1940. (EX-99.CERT) |
| (b) | | Certification of principal executive and principal financial officers as required by Rule 30a- |
| 2(b) under the Investment Company Act of 1940. (EX-99.906CERT) |