UNITED STATES
SECURITIES AND EXCHANGE COMMISSION
Washington, D.C. 20549
FORM 10-Q/A
(Amendment No. 1)
X | QUARTERLY REPORT PURSUANT TO SECTION 13 OR 15(d) OF THE SECURITIES | |
| EXCHANGE ACT OF 1934 |
|
For the quarterly period ended March 31, 2006
or
_ | TRANSITION REPORT PURSUANT TO SECTION 13 OR 15(d) OF THE SECURITIES | ||
| EXCHANGE ACT OF 1934 |
| |
For the transition period from __________ to __________
Commission file number 0-20148
CITIZENS FINANCIAL CORPORATION
(Exact name of registrant as specified in its charter)
Kentucky | 61-1187135 |
(State of Incorporation) | (I.R.S. Employer Identification No.) |
12910 Shelbyville Road, Louisville, Kentucky 40243
(Address of principal executive offices)
(502) 244-2420
(Registrant’s telephone number)
Indicate by check mark whether the registrant (1) has filed all reports required to be filed by Sections 13 or 15(d) of the Securities Exchange Act of 1934 during the preceding 12 months (or for such shorter period that the registrant was required to file such reports), and (2) has been subject to such filing requirements for the past 90 days. Yes X No
Indicate by check mark whether the registrant is a large accelerated filer, an accelerated filer, or a non-accelerated filer. See definition of “accelerated filer and large accelerated filer” in Rule 12b-2 of the Exchange Act. (Check one):
Large accelerated filer ___ | Accelerated filer ___ | Non-accelerated filer | X . |
Indicate by check mark whether the registrant is a shell company (as determined in Rule 12b-2 of the Securities Exchange Act of 1934). Yes No X
APPLICABLE ONLY TO ISSUERS INVOLVED IN BANKRUPTCY
PROCEEDINGS DURING THE PRECEDING FIVE YEARS:
Indicate by check mark whether the registrant has filed all documents and reports required to be filed by Sections 12, 13, or 15(d) of the Securities Exchange Act of 1934 subsequent to the distribution of securities under a plan confirmed by the court.
Yes ___ No ___
APPLICABLE ONLY TO CORPORATE ISSUERS:
Indicate the number of shares outstanding of each of the issuer’s classes of common stock, as of the latest practicable date: Class A Stock 1,664,471 as of May 10, 2006.
The date of this Form 10-Q/A is July 12, 2006.
1
EXPLANATORY NOTE
This Amendment No. 1 on Form 10-Q/A (this “Form 10-Q/A”) amends the Quarterly Report of Citizens Financial Corporation (the “Company”) on Form 10-Q for the quarter ended March 31, 2006, as filed with the Securities and Exchange Commission on May 12, 2006 (the “Original Filing”). This Form 10-Q/A is being filed solely for the purpose of correcting document submission errors in Exhibit 11 (the substitution of an assets table for the Computation of Per Share Earnings) and in Exhibits 31.1, 31.2, 32.1 and 32.2 (the substitution of assets tables for signature lines in the certifications of the Principal Executive Officer and Principal Financial Officer) attached to the Original Filing.
For the convenience of the reader, this Form 10-Q/A sets forth the Original Filing in its entirety. However, this amendment does not affect the original financial statements or footnotes as originally filed (other than Exhibit 11 as noted above). This Form 10-Q/A continues to describe conditions as of the date of the Original Filing, and the disclosures contained herein have not been updated to reflect events, results or developments that occurred at a later date. Among other things, forward looking statements made in the Original Filing have not been revised to reflect events, results or developments that occurred or facts that became known to the Company after the date of the Original Filing, and such forward looking statements should be read in their historical context. Accordingly, this Form 10-Q/A should be read in conjunction with the Company’s filings made with the Securities and Exchange Commission subsequent to the filing of the Original Filing.
2
Part I – Financial Information; Item 1 – Financial Statements
Citizens Financial Corporation and Subsidiaries
Condensed Consolidated Statements of Operations
(Unaudited)

See Notes to Condensed Consolidated Financial Statements.
3
Part I; Item 1 (continued)
Citizens Financial Corporation and Subsidiaries
Condensed Consolidated Statements of Financial Condition
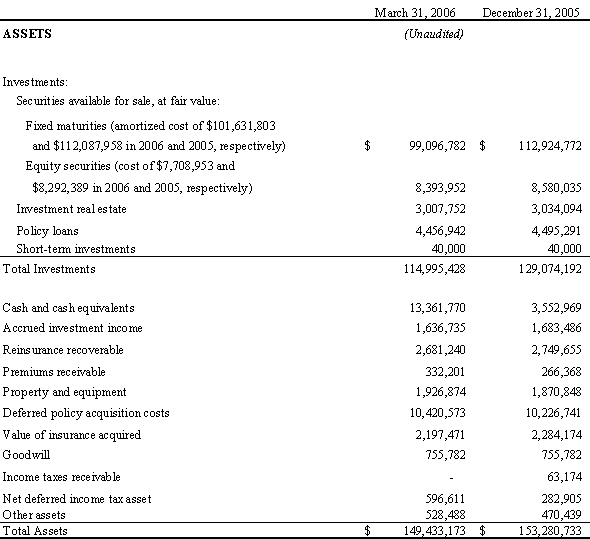
See Notes to Condensed Consolidated Financial Statements.
4
Part I; Item 1 (continued)
Citizens Financial Corporation and Subsidiaries
Condensed Consolidated Statements of Financial Condition

See Notes to Condensed Consolidated Financial Statements.
5
Part I; Item 1 (continued)
Citizens Financial Corporation and Subsidiaries
Condensed Consolidated Statements of Cash Flows
(Unaudited)

See Notes to Condensed Consolidated Financial Statements.
6
Part I; Item 1 (continued)
Citizens Financial Corporation and Subsidiaries
Notes to Condensed Consolidated Financial Statements
March 31, 2006 (Unaudited)
Note 1 - BASIS OF PRESENTATION
The accompanying unaudited condensed consolidated financial statements include the accounts of Citizens Financial Corporation and its wholly-owned subsidiaries: Citizens Security Life Insurance Company (“Citizens Security”), United Liberty Life Insurance Company (“United Liberty”), Citizens Insurance Company (“Citizens Insurance”), and Corporate Realty Services, Inc. (“Corporate Realty”). The accompanying unaudited condensed consolidated financial statements have been prepared in accordance with the instructions to Form 10-Q and in conformity with U.S. generally accepted accounting principles.
The accompanying unaudited condensed consolidated financial statements reflect all adjustments that are, in the opinion of management, necessary to a fair presentation of the results for the interim periods. All such adjustments are of a normal recurring nature. Certain 2005 amounts reported previously have been reclassified to conform with the 2006 presentation. For further information, refer to the December 31, 2005 consolidated financial statements and footnotes included in the Company’s annual report on Form 10-K.
Use of Estimates. The preparation of financial statements in conformity with U.S. generally accepted accounting principles (“GAAP”) requires management to make estimates and assumptions that affect the amounts reported in the financial statements and accompanying notes. Actual results could differ from those estimates.
Note 2 - COMPREHENSIVE LOSS
The components of comprehensive loss, net of related income taxes, for the three-month period ended March 31, 2006 and 2005, are as follows:

Unrealized losses, net of related deferred income taxes, are the result of the net change in the excess or deficit of market values over book values of the investment portfolios. Therefore, comprehensive loss is impacted by the volatility of the equities and fixed maturities markets. First quarter results may not be indicative of results for the full year.
Note 3 – DERIVATIVE INSTRUMENTS AND HEDGING ACTIVITIES
The Company’s derivatives outstanding at March 31, 2006 include approximately $37,000 of embedded options on convertible bonds and $(3,000) of other open option positions. Hedge accounting is not used for these securities and changes in market value are reported currently as realized investment gains or losses.
Note 4 - NET REALIZED INVESTMENT GAINS
The Company recorded pretax reductions to the carrying amount of available for sale securities totaling $218,000 for the three months ended March 31, 2006 relating to declines in value which were considered by management to be other than temporary (none for the three months ended March 31, 2005). This amount is included in net realized gains.
7
Part I; Item 1 (continued)
Note 5 - INCOME TAXES
Income taxes are provided based on estimates of the projected annual effective tax rate. Deferred income taxes reflect the net effects of temporary differences between the carrying amounts of assets and liabilities for financial reporting purposes and the amounts used for income tax purposes. Income before income taxes differs from taxable income principally due to the small life insurance company tax deduction, operating loss carry forwards and capital loss carry forwards. The Company has generally not been currently taxable, accumulating operating and capital loss carryovers for tax purposes that create uncertainties as to future realization of related tax benefits and ultimate effective rates. This significantly impacts the Company’s determination of its deferred income tax accounts. During the first quarter of 2005, the Company made revisions to its deferred income tax estimates made in prior periods, including related estimates of its required valuation allowance for the realization of deferred tax assets, resulting in a tax benefit of $(51,531) being recognized in that quarter. No such revisions were required at March 31, 2006, giving rise to an increase in the effective rate over that of the prior corresponding period.
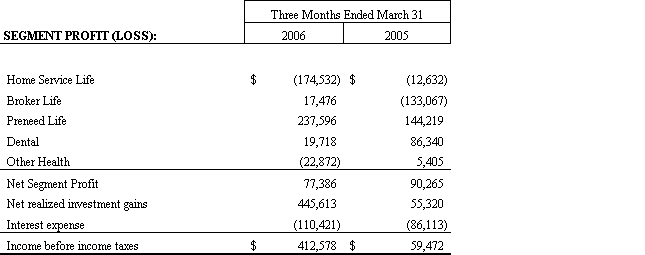
Note 6 - SEGMENT INFORMATION
The Company’s operations are managed along five principal insurance product lines: Home Service Life, Broker Life, Pre-need Life, Dental, and Other Health. Products in all five lines are sold through independent agency operations. Home Service Life consists primarily of traditional life insurance coverage sold in amounts of $10,000 and less to middle and lower income individuals. This distribution channel is characterized by a significant amount of agent contact with customers throughout the year. Broker Life product sales consist primarily of simplified issue and graded-benefit policies in amounts of $10,000 and less and final expense policies in amounts of $3,000 to $35,000. Other products in this segment, which are not aggressively marketed, include: group life, universal life, annuities and participating life policies. Pre-need Life products are sold to individuals in connection with prearrangement of their funeral and include single premium and multi-pay policies with benefits generally in amounts of $10,000 and less. These policies are generally sold to middle aged to elderly individuals. Dental products are term policies generally sold to small and intermediate size employer groups. Other Health products include various accident and health policies sold to individuals and employer groups.
Segment information as of March 31, 2006 and 2005, and for the periods then ended, is as follows:

8
Part I; Item 1 (continued)
Below are the net investment income amounts, which are included in the revenue totals above.

The Company evaluates performance based on several factors, of which the primary financial measure is segment profit (loss). Segment profit (loss) represents pretax income, except that net realized investment gains and interest expense are excluded. A significant portion of the Company’s realized investment gains are generated from investments in equity securities. The equities portfolio averaged (on a cost basis) approximately $7,827,000 and $8,316,000 during the three months ended March 31, 2006 and 2005, respectively.
9
Part I; Item 1 (continued)
Depreciation and amortization amounts below consist of depreciation expense along with amortization of the value of insurance acquired and deferred policy acquisition costs.

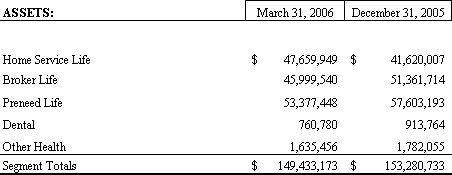
Segment asset totals, determined based on policy liabilities outstanding in each segment, are as shown below.
Note 7 – CONTINGENCIES
The Company is party to various lawsuits in the normal course of business. Management believes that recorded claim liabilities are adequate to ensure that these suits will be resolved without material financial impact to the Company.
10
Part I; Item 1 (continued)
Note 8 – DEBT
Debt consists of the following notes payable:

The Company’s outstanding commercial bank borrowings relate primarily to various insurance company acquisitions. Interest is payable quarterly at the lower of the bank’s prime lending rate or the one-month LIBOR rate plus 2.75% (8.04% at March 31, 2006). Scheduled principal installments are due as follows: 2006 - $708,334; and 2007 - $312,503. The loan agreement for the bank note contains covenants regarding asset acquisitions, shareholders’ equity and dividends, and maintenance of a debt to earnings ratio. During the first half of 2005, the Company did not comply with a loan covenant (debt to earnings ratio) on this debt and received a waiver from the lender of such violation through June 30, 2005. In return for the waiver, the Company’s Chairman agreed to personally guarantee the outstanding bank debt. While the Company has met this covenant since June 30, 2005, there are no assurances that the Company will meet this covenant throughout 2006. Although the Company does not expect the full balance to be called during 2006, it believes such an obligation could be met through a refinancing arrangement or sale of selected assets or a block of insurance business. Regarding the currently scheduled debt repayments, the Company believes its available resources will be adequate to service the remaining 2006 debt obligations. In addition, the Company’s Chairman has expressed potential willingness to loan the Company an additional $640,000 if necessary, to service bank debt obligations through 2007. The Company has pledged the issued and outstanding common and preferred stock of Citizens Security as collateral for the commercial bank note.
The Company borrowed $2,000,000 from its Chairman in December 2002 to strengthen the statutory capital position of its principal insurance subsidiary. The Company borrowed an additional $1,000,000 in 2003, an additional $1,000,000 in 2005 and an additional $360,000 in March 2006 from its Chairman for general operating capital, including servicing bank debt. Interest on the debt is payable quarterly by the Company at an annual rate equal to the greater of 6.00% or the prime lending rate plus 1% (8.5% at March 31, 2006). The outstanding principal is callable upon 90 days notice or otherwise due on June 30, 2007; except however, under terms of a subordination agreement between the Chairman and the Company’s commercial bank, repayment is prohibited until all outstanding commercial bank borrowings are repaid.
Note 9 – RECENTLY ISSUED ACCOUNTING PRONOUNCEMENTS
On September 15, 2005, the Accounting Standards Executive Committee (“AcSEC”) issued Statement of Position (“SOP”) No. 05-1, Accounting by Insurance Enterprises for Deferred Acquisition Costs in Connection With Modifications or Exchanges of Insurance Contracts. AcSEC defines an internal replacement as a modification in product benefits, features, rights, or coverages that occurs by the exchange of a contract for a new contract, or by amendment, endorsement, or rider to a contract, or by the election of a feature or coverage within a contract. An internal replacement that is determined to result in a replacement contract that is substantially unchanged from the replaced contract should be accounted for as a continuation of the replaced contract. Contract modifications resulting in a replacement contract that is substantially changed from the replaced contract should be accounted for as an extinguishment of the replaced contract and any unamortized deferred policy acquisition costs, unearned revenue liabilities, and deferred sales inducement costs from the replaced contract should be written off and acquisition costs of the new contract capitalized as appropriate. This SOP is effective for internal replacements occurring in fiscal years beginning after December 15, 2006. Management is still evaluating the impact this guidance will have on its consolidated financial statements.
11
Part I; Item 2 – Management’s Discussion and Analysis of Financial Condition and Results of Operations
EXECUTIVE SUMMARY
The Company’s management continuously monitors the performance of and outlook for the Company by analyzing several indicators that they judge to be critical. The key indicators of particular interest to management are (a) the general economic environment relative to outlook, (b) trend of premium volume, (c) lapse rates, (d) mortality and morbidity rates (e) trend of general expense levels, (f) asset and capital and surplus growth, (g) general interest rate movements, (h) investment yields, (i) diversity (e.g. by industry) and mix (e.g. between fixed income securities and equity securities) of our investment portfolios and (j) segment performance and trends.
As more fully outlined in the Management’s Discussion and Analysis in the Company’s Form 10-K for 2005, Management sees the following as its key challenges for 2006:
• Financial |
(1) | earning an operating profit for all segments |
(2) | continuing to solidify the ratings from A.M. Best and setting the stage for a future rating upgrade (see the section titles “Competition” in Item 1 in the Company’s Form 10-K for 2005 for a discussion of the Company’s rating) |
(3) | using a portion of profits to fund higher sales growth in 2006 and beyond without straining capital and surplus |
(4) | evaluating plans to reduce compliance costs in 2007 and beyond |
• Operational |
(1) | controlling operating expenses |
(2) | updating hardware and software technology |
• Product line |
(1) | for Group Dental: creating a plan to offer Preferred Provider networks and Third Party Administration products in 2006, building on the Company’s strength of providing high quality service and exploring plans to sell other products through the Dental marketing channel |
(2) | for Final Expense: performing a controlled growth path through select Managing General Agents who focus on this type of product |
(3) | for Home Service: improving 13-month persistency, strengthening controls over field premium collection, recruiting satisfactory agents and controlling expenses |
(4) | for Preneed: maintaining current distribution relationships and controlling costs and expenses |
The following discussion is presented to provide the reader with a clearer understanding of some of the operational elements impacting the financial position and results as reported in the accompanying unaudited condensed consolidated financial statements.
12
During the first three months of 2006, the Company reported a consolidated pretax operating loss (which excludes realized investment gains) of $33,000, compared to a pretax operating income of $4,000 for the first three months of 2005 and a net income of $319,000 for the first quarter of 2006, compared to a net income of $111,000 for the first quarter of 2005.
The Company is subject to various market risks. The most significant risks relate to fluctuations in interest rates (which impact prices of fixed maturity securities) and prices of equity securities. The Company has at times experienced negative total returns (defined as investment income and realized and unrealized investment gains and losses) on its investment portfolio, and the total return for the first three months of 2006 was a negative 2.67% (the Company recorded pre-tax unrealized gains (losses), of $(3,372,000) on debt securities and $374,000 on equities) compared to a negative total return of 2.61% during the first three months of 2005. Historically these returns have been favorable and the Company has successfully managed the risk over many years. Company management devotes significant attention to the capital markets, and repositions the Company’s portfolio upon detection of adverse risk trends associated with individual securities or overall markets.
In an effort to increase levels of risk adjusted statutory surplus at the insurance subsidiary level, management repositions the portfolio to take advantage of opportunities and accordingly, decreased its investment in equity securities on a market value basis by $186,000 or 2% and in fixed maturity securities by $13,828,000 or 12% (principally, securities with longer maturity dates resulting in greater risks) during the first three months of 2006. Management anticipates that this action will negatively impact long-term total returns. The Company will further reposition the portfolios, as opportunities become available, in order to increase total returns and maintain an acceptable risk-adjusted statutory surplus at the insurance subsidiary level.
General expenses for the first three months of 2006 were up $114,000 compared to the first three months of 2005, principally due to the costs of employing a marketing executive for life insurance products in the second quarter of 2005 and two marketing executives for the group dental product in the fall of 2005. We also placed in service, and therefore began to depreciate, the new group administration system in January 2006.
CRITICAL ACCOUNTING POLICIES AND ESTIMATES
The Company’s discussion and analysis of its financial condition and results of operations are based on its unaudited condensed consolidated financial statements, which have been prepared in accordance with U.S. generally accepted accounting principles. Preparation of these financial statements requires the Company to make estimates and judgments that affect the reported amounts of assets, liabilities, revenues and expenses, and related disclosure of contingent assets and liabilities. On an on-going basis, the Company evaluates its estimates, including those related to investments, agent receivables, intangible assets, policy liabilities, income taxes, regulatory requirements, contingencies and litigation. The Company bases its estimates on historical experience and on various other assumptions that are believed to be reasonable under the circumstances, the results of which form the basis for making judgments about the carrying amounts of assets and liabilities that are not readily apparent from other sources. Actual results may differ from these estimates under different assumptions or conditions. The Company believes the following accounting policies, judgments and estimates, which have been discussed with the Audit Committee of the Board of Directors, critically impact preparation of its consolidated financial statements.
Investment in Debt and Equity Securities. The Company holds debt and equity interests in a variety of companies, most of which are publicly traded with volatile market prices. We periodically evaluate whether the declines in fair value of our investments are other-than-temporary. These evaluations involve significant judgment. Our evaluation consists of a review of qualitative and quantitative factors, including analysis of the Company’s competitive position in its markets, deterioration in the financial condition of the issuer, downgrades of the security by a rating agency, and other publicly available issuer-specific news or general market conditions. Declines in fair values of securities deemed to be temporary are included as an unrealized loss in shareholders’ equity. Declines in fair values of securities deemed to be other-than-temporary are included in net income as realized investment losses. Future adverse changes in market conditions or poor operating results of underlying investments could result in losses or an inability to recover the current carrying amount of the investments, thereby possibly requiring an impairment charge in the future.
13
Deferred Acquisition Costs (“DAC”). The Company defers certain policy acquisition costs and amortizes them over future periods. These costs include commissions and certain other expenses that vary with and are primarily associated with acquiring new business. The deferred costs are recorded as an asset commonly referred to as deferred policy acquisition costs. The DAC asset balance is subsequently charged to income over the lives of the underlying contracts in relation to the anticipated emergence of revenues or profits. Actual revenues or profits on certain products can vary from Company estimates resulting in increases or decreases in the rate of amortization. The Company regularly evaluates its DAC balances to determine if actual experience or other evidence suggests that earlier estimates should be revised. Assumptions considered significant include surrender and lapse rates, mortality, expense levels, investment performance, and estimated interest spread. Should actual experience dictate that the Company change its assumptions regarding the emergence of future profits (commonly referred to as “unlocking”), the Company would record a charge or credit to bring its DAC balance to the level it would have been if using the new assumptions from the inception date of each policy.
DAC is also subject to periodic recoverability and loss recognition testing. These tests ensure that the present value of future contract-related cash flows will support the capitalized DAC balance to be amortized in the future. The present value of these cash flows, less the benefit reserve, is compared with the unamortized DAC balance and if the DAC balance is greater, the deficiency is charged to expense as a component of amortization and the asset balance is reduced to the recoverable amount.
Goodwill and Intangible Impairment. The balance of our goodwill and value of insurance acquired (“VIF”) was $2.95 million at March 31, 2006. The recovery of this asset is dependent on the fair value of the business to which it relates. Pursuant to Statement of Financial Accounting Standards No. 142, “Goodwill and Other Intangible Assets”, (“SFAS No. 142”), goodwill is subject to annual impairment tests based on the estimated fair value of the respective assets. There are numerous assumptions and estimates underlying the determination of the estimated fair value of these assets. Different valuation methods and assumptions can produce significantly different results that could affect the amount of any potential impairment charge that might be required to be recognized. During 2005 the Company concluded that no impairment adjustment was necessary for its goodwill or VIF.
Policy Liabilities. Establishing policy liabilities for the Company’s long-duration insurance contracts requires making many assumptions, including policyholder persistency, mortality rates, investment yields, discretionary benefit increases, new business pricing, and operating expense levels. The Company evaluates historical experience for these factors when assessing the need for changing current assumptions. However, since many of these factors are interdependent and subject to short-term volatility during the long-duration contract period, substantial estimates and judgment are required. Accordingly, if actual experience emerges differently from that assumed, any such difference would be recognized in the current year’s consolidated statement of operations.
Deferred Income Taxes. The Company records a valuation allowance to reduce its deferred income tax assets to the amount that it believes is more likely than not to be realized. In the event the Company were to determine that it would be able to realize its deferred tax assets in the future in excess of its net recorded amount, an adjustment to deferred tax assets would increase income in the period such determination was made. Likewise, should the Company determine that it would not be able to realize all or part of its net deferred tax assets in the future, an adjustment to deferred tax assets would be charged to income in the period such determination was made.
14
OPERATIONS. Net premiums earned decreased approximately $622,000 or 9.6% during the three months ended March 31, 2006 compared to the three months ended March 31, 2005. Below is a summary of net premiums earned, by segment, for the three-month period ended March 31, 2006, along with the change from the same periods of 2005:

Home Service Life premiums decreased approximately 2.3% during the first three months of 2006 compared to the same period in 2005 due to higher lapse rates. New sales began to decline in the fourth quarter of 2005 and have continued to decline in 2006 as a result of producer response to the Company’s introduction of a variable first year commission program designed to improve persistency in this segment. The Company also lost our regional representative for the Florida and Georgia region, as well as several producers in that region early in 2005. The Company continues its efforts to attract successful, experienced Home Service agents. In the fourth quarter of 2004, the Company began to geographically expand the Home Service market, hiring two new regional representatives to recruit new agents in Ohio and Pennsylvania. Company management considers it a challenge to increase new sales even modestly, while providing incentive to keep business in force for longer periods than we have historically experienced (i.e. improve our persistency rate) in this segment.
Broker Life premiums increased 17.9% in the first three months of 2006 compared to the same period of 2005 primarily because the Company has been aggressively developing relationships with new Managing General Agents to market the new final expense product introduced in 2005.
Pre-need Life premiums continued to decrease during the first three months of 2006 compared to the same period in 2005 as the result of the Company’s earlier modification of certain policy benefits and commissions (which resulted in a loss in the number of producers) and an intentional refocusing of marketing efforts toward segments that the Company believes offer more positive potential in the current environment.
Dental premiums decreased 5.7% during the first three months of 2006 compared to the first three months of 2005 because the competition in this market continues to intensify and the Company has strengthened renewal underwriting standards in an effort to improve the loss ratio for this product. The Dental loss ratio for the first three months of 2006 was 62.2% compared to 65.7% for the same period in 2005.
Other Health premiums declined modestly because these products are not being actively marketed as the Company continues to redirect the focus of its marketing efforts to the Home Service Life, Broker Life and Dental segments in an effort to improve profitability in those segments.
Net benefits decreased $448,000, or 8.4% during the first three months of 2006 compared to the first three months of 2005 due primarily to an improved mortality rate in the Pre-need Life segment. The decrease in net benefit reserves decreased $220,000 during the first three months of 2006 compared to the same period in 2005 primarily due to the decrease in Pre-need policies issued and in force during the period. Commissions increased $42,000 or 3.7% for the first three months of 2006 compared to the same period of 2005 due to the increased premiums collected for the period and a higher first year commission rate paid on the new final expense premiums written. As discussed above, General expenses increased $114,000, or 6.9% during the first three months of 2006 compared to the same period of 2005 principally due to the costs of employing a marketing executive for life insurance products in the second quarter of 2005 and two marketing executives for the group dental product in the
15
fall of 2005. We also placed in service, and therefore began to depreciate, the new group administration system in January 2006.
The deferral of policy acquisition costs increased $45,000 for the three months ended March 31, 2006 compared to the same period in 2005 principally due to the costs associated with issuing the new final expense product. Amortization of deferred policy acquisition costs and the value of insurance acquired decreased $82,000 in the first quarter of 2006 compared to the first quarter of 2005, primarily due to the decreasing amount of Pre-need and acquired Home Service insurance in force.
Pretax income increased approximately $353,000 to $413,000 for the three months ended March 31, 2006 compared to a pretax income of $59,000 for the same period in 2005. Net investment income decreased $70,000, or 4% for the first three months of 2006 compared to the same period of 2005, due to a 3.2% decline in invested assets and cash and cash equivalents, the disposal of high interest bonds, and less dividends received from equity investments.
Net realized investment gains increased to $446,000 for the first three months of 2006 from net investment gains of $55,000 for the same period in 2005 because the Company took advantage of opportunities to realize gains in 2006, while restructuring its portfolio to reduce investment in long duration fixed maturities.
Pretax Segment profit (excluding realized investment gains and interest expense) for the first three months of 2006 was approximately $77,000 compared to $90,000 for the first three months of 2005. This is attributable to the factors described above.
Following are the approximate, annualized pretax investment income and “total return” yields (defined as yields including net investment income, net realized investment gains or losses and net change in the excess or deficit of market values over book values of the investment portfolios or unrealized gains (losses)) for the three months ended March 31, 2006 and 2005. Pretax unrealized gains (losses) totaled $374,000 and $(3,372,000) on equities and fixed maturity securities, respectively for the three-month period ended March 31, 2006 and $(668,000) and $(2,019,000) on equities and fixed maturity securities, respectively for the three-month period ended March 31, 2005.

FINANCIAL POSITION. Shareholders’ equity totaled approximately $15,154,000 and $17,437,000 at March 31, 2006 and December 31, 2005, respectively. These balances reflect an approximate 13.09% decrease for the three months ended March 31, 2006. Comprehensive loss totaled approximately $(2,235,000) and $(1,605,000) for the three months ended March 31, 2006 and 2005, respectively. A significant portion of the comprehensive loss is attributable to changes in the fair value of the Company’s fixed maturity and equity portfolios. Equity securities comprised approximately 5.6% of the Company’s total assets as of both March 31, 2006 and December 31, 2005. Accordingly, movements in the equities markets can significantly affect the Company’s financial position. Equity portfolio positions decreased $583,000 on a cost basis (including $218,000 in other than temporary impairment write downs) and $186,000 on a market value basis, during the first three months of 2006. Fixed maturity portfolio positions decreased $10,456,000 on an amortized cost basis and $13,828,000 on a market value basis during the same period. These decreases result from the disposal of equity securities and high-yield, long duration fixed maturity securities in an effort to increase the risk adjusted capital levels of the Company’s insurance subsidiaries. Cash and cash equivalent positions increased, pending investment, approximately $9,809,000 during the three months ended March 31, 2006.
16
The fixed maturities markets continue to be highly volatile and were unfavorable in the first quarter of 2006. Interest yields on fixed maturity investments held in our portfolio are continuing to slowly increase. Low short-term rates continue to adversely impact the Company’s investment portfolio yield and operating earnings. The 2006 environment continues to generate a relatively high level of qualitative investment risk. However, measures of quantitative risk per unit of investment are not believed to have changed significantly from those previously disclosed in the Company’s 2005 Form 10-K.
OFF-BALANCE SHEET ARRANGEMENTS
The Company does not participate in any off-balance sheet arrangements.
CASH FLOWS AND LIQUIDITY
Cash used in operations totaled $(1,087,000) for the three months ended March 31, 2006 compared to $1,000 for the same period in the prior year. The increase in the negative cash flow is primarily attributable to the decrease in premiums collected in the period. The $11,112,000 of cash provided by investing activities for the three months ended March 31, 2006 resulted from the net decrease in the investment portfolio on a cost basis. The $216,000 of cash used in financing activities during the first three months of 2006 is attributable to bank loan principal repayments, repurchases of Company common stock, and net annuity and Universal Life account withdrawals, offset by proceeds from additional borrowings from a related party. Regarding the currently scheduled bank debt repayments, the Company believes its available resources will be adequate to service 2006 debt obligations. The Company’s Chairman has expressed potential willingness to loan the Company an additional $640,000 if necessary, to service bank debt obligations through 2007.
A summary of all known commitments of the Company as of March 31, 2006, including the aforementioned borrowings, and an estimate (based on reasonable assumptions and anticipated trends) of payments to be made for future policy benefits and contract claims, is as follows:
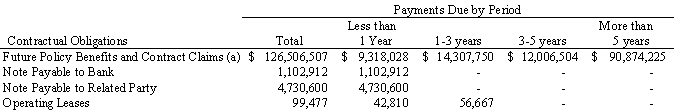
(a) | anticipated cash benefit payments not including any future earnings or additional premiums. |
Management is not aware of any other commitments or unusual events that could materially affect the Company’s capital resources.
FORWARD-LOOKING INFORMATION.
All statements, trend analyses and other information contained in this report relative to markets for the Company’s products and trends in the Company’s operations or financial results, as well as other statements including words such as “anticipate”, “believe”, “plan”, “estimate”, “expect”, “intend”, and other similar expressions, constitute forward-looking statements under the Private Securities Litigation Reform Act of 1995. These forward-looking statements are subject to known and unknown risks, uncertainties and other factors which may cause actual results to be materially different from those contemplated by the forward-looking statements. Such factors include, among other things:
• | the market value of the Company’s investments, including stock market performance and prevailing interest rate levels; |
• | customer and agent response to new products, distribution channels and marketing initiatives, including exposure to unrecoverable advanced commissions; |
17
• | mortality, morbidity, lapse rates, and other factors which may affect the profitability of the Company’s insurance products; | |||
• | regulatory changes or actions, including those relating to regulation of insurance products and insurance companies; | |||
• | ratings assigned to the Company’s insurance subsidiaries by independent rating organizations which the Company believes are important to the sale of its products; | |||
• | general economic conditions and increasing competition which may affect the Company’s ability to sell its products; | |||
• | the Company’s ability to achieve anticipated levels of operating efficiencies and meet cash requirements based upon projected liquidity sources; | |||
| • | unanticipated adverse litigation outcomes; and |
| |
• | changes in the Federal income tax laws and regulations that may affect the relative tax advantages of some of the Company’s products. | |||
There can be no assurance that other factors not currently anticipated by management will not also materially and adversely affect the Company’s results of operations.
Part I; Item 3 - Quantitative and Qualitative Disclosures about Market Risk
Quantitative and Qualitative Risk. The primary changes in quantitative market risks during the three months ended March 31, 2006 are discussed in Part I, Item 2 above.
Part I; Item 4 – Controls and Procedures
EVALUATION OF DISCLOSURE CONTROLS AND PROCEDURES. Within the past 90 days, the Company conducted an evaluation of its disclosure controls and procedures, with the supervision and participation of its Chief Executive Officer and Chief Financial Officer. The Company does not expect that its disclosure controls and procedures will prevent all errors and fraud. Such a control system, no matter how well conceived and operated, can provide only reasonable, not absolute, assurance that the objectives of the control system are met. Further, the design of a control system must balance the constraint of prudent resource expenditure with a judgmental evaluation of risks and benefits. Based on this evaluation of disclosure controls and procedures, including controls and procedures related to the new group administration system, the Company’s Chief Executive Officer and Chief Financial Officer have concluded that such controls and procedures provide reasonable assurance that material information required to be included in the Company’s periodic SEC reports is made known on a timely basis to the Company’s principal executive and financial officers.
CHANGES IN INTERNAL CONTROLS. There have been no significant changes in the Company’s internal controls or changes in other factors that could significantly affect these controls subsequent to their evaluation, nor has the Company implemented any corrective actions regarding significant deficiencies or material weaknesses in internal controls.
18
Part II – Other Information
Item 2. Unregistered Sales of Equity Securities and Use of Proceeds.
Issuer Purchases of Equity Securities
|
|
|
|
|
Period |
Total Number of Shares Purchased
|
Average Price Paid per Share (a ) | Total Number of Shares Purchased as part of Publicly Announced Plans or Programs ( b ) | Approximate Dollar Value of Shares that May Yet be Purchased Under the Plans or Programs ( b ) |
January 1, 2006 through January 31, 2006 |
0 |
$0.00 |
0 |
$147,109 |
February 1, 2006 through February 28, 2006 |
0 |
0 |
0 |
$147,109 |
March 1, 2006 through March 31, 2006 |
7,157 |
$6.62 |
7,157 |
$99,733 |
Total | 7,157 | $6.62 | 7,157 |
|
(a) | The average price paid per share of stock repurchased under the stock repurchase program includes any commissions paid to the brokers. |
(b) | Repurchased pursuant to the stock repurchase program publicly announced on August 12, 1998 under which our Board of Directors authorized the repurchase of up to an aggregate of $1,200,000 of our common stock and amended November 12, 2002 to authorize the repurchase of an additional $250,000. Under the repurchase program, we may repurchase outstanding shares of our common stock from time to time in the open market and through privately negotiated transactions. Unless terminated earlier by resolution of our Board of Directors, the repurchase program will expire when we have repurchased all shares authorized for repurchase under the repurchase program. |
Item 6. Exhibits.
a). | Exhibit 11 | Statement re: computation of per share earnings. |
| |||||
| Exhibit 31.1 | Rule 13a-14(a)/15d-14(a) Certification --Principal Executive Officer | ||||||
| Exhibit 31.2 | Rule 13a-14(a)/15d-14(a) Certification --Principal Financial Officer |
| |||||
| Exhibit 32.1 | Section 1350 Certification --Principal Executive Officer |
| |||||
| Exhibit 32.2 | Section 1350 Certification --Principal Financial Office |
| |||||
19
SIGNATURES
In accordance with the requirements of the Securities and Exchange Act of 1934, the registrant caused this report to be signed on its behalf by the undersigned, thereunto duly authorized.

Date: July 12, 2006
20