UNITED STATES
SECURITIES AND EXCHANGE COMMISSION
Washington, D.C. 20549
FORM N-CSR
CERTIFIED SHAREHOLDER REPORT OF REGISTERED
MANAGEMENT INVESTMENT COMPANIES
Investment Company Act File Number: 811-06665
| T. Rowe Price Mid-Cap Growth Fund, Inc. |
|
| (Exact name of registrant as specified in charter) |
| |
| 100 East Pratt Street, Baltimore, MD 21202 |
|
| (Address of principal executive offices) |
| |
| David Oestreicher |
| 100 East Pratt Street, Baltimore, MD 21202 |
|
| (Name and address of agent for service) |
Registrant’s telephone number, including area code: (410) 345-2000
Date of fiscal year end: December 31
Date of reporting period: June 30, 2017
Item 1. Report to Shareholders
| Mid-Cap Growth Fund | June 30, 2017 |
The views and opinions in this report were current as of June 30, 2017. They are not guarantees of performance or investment results and should not be taken as investment advice. Investment decisions reflect a variety of factors, and the managers reserve the right to change their views about individual stocks, sectors, and the markets at any time. As a result, the views expressed should not be relied upon as a forecast of the fund’s future investment intent. The report is certified under the Sarbanes-Oxley Act, which requires mutual funds and other public companies to affirm that, to the best of their knowledge, the information in their financial reports is fairly and accurately stated in all material respects.
REPORTS ON THE WEB
Sign up for our Email Program, and you can begin to receive updated fund reports and prospectuses online rather than through the mail. Log in to your account at troweprice.com for more information.
Manager’s Letter
Fellow Shareholders
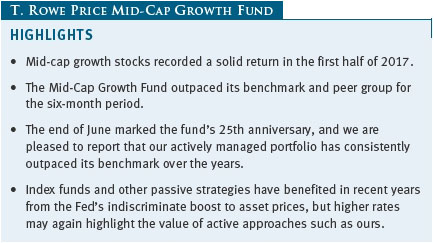
Mid-cap growth stocks powered ahead in the first half of 2017, trailing only large-cap growth shares among the major asset categories. Even more impressive than the scale of the market’s advance may have been its steadiness, with the major benchmarks rarely moving over 1% on a daily basis and not suffering any major setbacks over the period. We are pleased to report that our fund managed to handily outpace its benchmark in the first half of the year, and we discuss below how our performance stacks up even better over its 25 years of operation. We are always on guard against possible volatility ahead, however, and we consider how the market’s broad advance is itself a cause for concern.
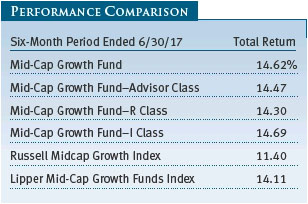
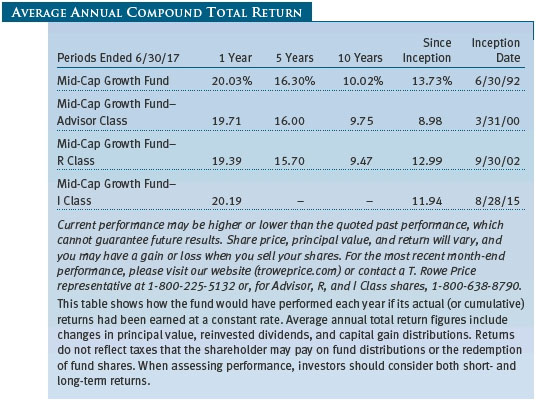
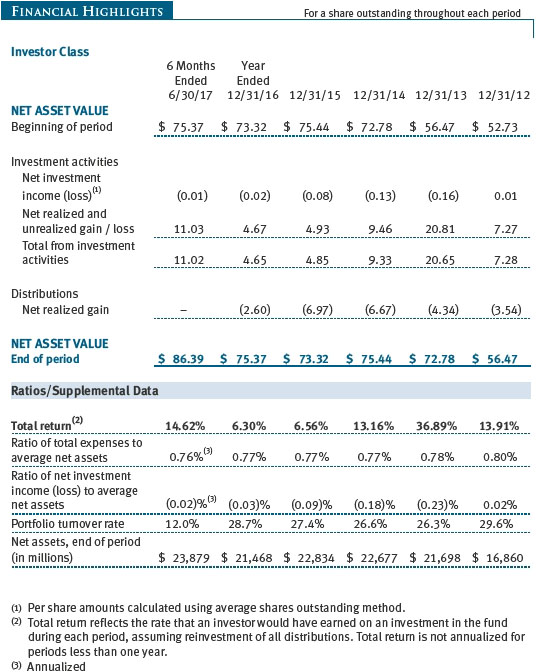
The Mid-Cap Growth Fund returned 14.62% in the six months ended June 30, 2017. The fund outperformed its benchmark and peer group index. (Returns for the Advisor, R, and I Class shares varied slightly, reflecting their different fee structures.) The fund remained favorably ranked relative to its competitors over all time periods and is the top-ranked fund of its kind since its inception in 1992. (Based on cumulative total return, Lipper ranked the Mid-Cap Growth Fund 144 of 397, 15 of 371, 20 of 328, 5 of 237, and 1 of 18 funds in the mid-cap growth funds category for the 1-, 3-, 5-, and 10-year and since-inception periods ended June 30, 2017, respectively. Past performance cannot guarantee future results.)
A NOTE ON THE FUND’S 25TH ANNIVERSARY
Five years ago, when the fund celebrated its 20th anniversary, we used this letter to offer our perspective on how the markets had evolved over the previous two decades and described some of the lessons we had learned over that time. As we now mark a quarter century since our fund’s inception in June 1992, our perspective continues to evolve. In fact, we would like to use this chance to briefly address the most fundamental question of all: Why are we here? Of course, we do not mean that in a cosmic sense, which would make for a rather odd shareholder letter. Rather, the question is a more parochial one: What purpose does our fund serve? Has our management made a difference?
Given the rise of index funds and other passive investing strategies, this is a question that many in our industry are asking themselves. To be sure, the answer can be complicated, especially when day after day of diligent research into individual stocks can still result in performance that lags the market for long periods of time. And the questions that advocates of passive strategies ask are valid ones. Can any investor consistently make better judgments than the consensus? Hasn’t technology made information advantages obsolete? Why do so many active funds so often trail their benchmarks? Are managers who outperform just lucky?
It is not our role to try to provide definitive answers to these questions, much less to serve as spokespeople for the entire active management industry. What we can say with some satisfaction, however, is that with each passing year, even the greatest skeptics of active management would have to concede that it’s highly unlikely that we are the proverbial blind monkey, throwing darts and managing to hit our target. In past letters, we have described what we see as the most important factor driving our results—a disciplined investment process that hasn’t changed in 25 years. Key components of our approach are our long-term perspective, which allows us to exploit market inefficiencies, the depth of the fundamental research we can undertake with the help of our analysts, and our assessments of company managements.
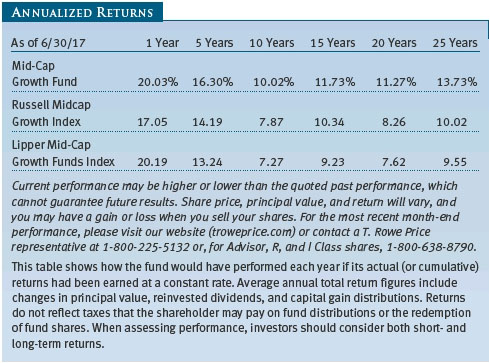
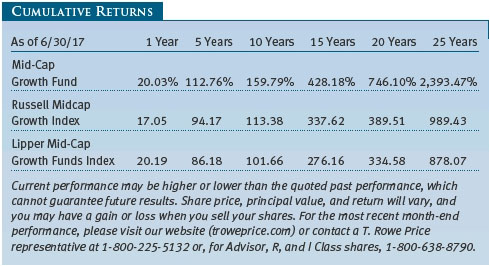
Quantifying the precise chance that our long-term success is attributable to some degree of skill is difficult. For this reason, perhaps it is best to simply show our performance over various time horizons and let readers decide (see tables that follow). We are pleased to note that over a quarter century, we’ve beaten our benchmark by 3.71% a year after fees and expenses. In the last 10 years, a much more difficult period for active management, we’ve beaten our benchmark by 2.15% a year. Put differently, an investment of $10,000 in our benchmark 25 years ago would have been worth $108,943 on June 30, 2017, while an identical investment in our fund would be worth $249,347.
Above all, these results demonstrate the value of compounding excess returns and vindicate our efforts to do just a bit better every year, if possible—a goal we do not always achieve but often have. We never seek to shoot the lights out by making large wagers on individual stocks. Instead, we have attempted through the years to structure a portfolio of mid-cap growth stocks that we hope will keep up with the market when stocks are rising (which can be challenging given the periodic waves of euphoria that can sweep up mid-cap growth stocks), and, conversely, we aspire to do better (or, more accurately, less badly) than our benchmark and peers when stocks are falling.
Of course, past performance is not a guarantee of future results—and we might add that a quarter century of manager tenure is not a guarantee of another quarter century to come! Nevertheless, we are pleased to report to you on our long-term record, and we are grateful for the many shareholders who have placed their confidence in us for much of the past 25 years.
MARKET ENVIRONMENT
The postcrisis bull market and economic expansion marked their eighth birthdays in the first half of 2017, placing both among the longest-lived in postwar history. The promise of a “Trump reflation” predicated on deregulation and fiscal stimulus deserve part of the credit for the market’s gains. Postelection expectations were elevated, with measures of both business and consumer confidence hovering close to multiyear highs. Surveys of manufacturing and service sector activity also indicated solid expansion. Yet a notable gap emerged between such “soft” survey data and “hard” data on consumer spending and business investment. Overall economic growth was subdued in the first quarter, with gross domestic product increasing at an annualized pace of only 1.4%. As we write, we believe the data will show that growth picked up slightly in the second quarter, but we anticipate the pace for the year as a whole to remain roughly in line with 2016’s modest advance.
Fear that the Trump administration’s agenda of tax cuts and infrastructure spending was being subsumed by political gridlock was a primary reason for the reduced growth expectations. The Republicans’ inability to quickly pass an Obamacare replacement called into question their broader legislative program, particularly since the party’s leaders had suggested that the tax cuts in their health care bill were a necessary first step in broader tax reform. The deepening political controversy over the Trump campaign’s alleged ties with Russia also sowed doubts about how much political capital the president could call upon to manage a widespread change in the nation’s tax laws—a process which inevitably creates losers as well as winners. These controversies resulted in only temporary ripples in the market as investors concluded, rightly or wrongly, that much of the squabbling in Washington was merely a continuation of the partisan political warfare we’ve witnessed now for many years.
The market’s resilience in the face of the administration’s inability to begin to enact a growth agenda might also be attributable to the favorable earnings environment. In particular, it became clear that the profits recession of 2015 and 2016 had ended. Stocks recorded the bulk of their gains in January and February, as fourth-quarter earnings reports were released, and again in April and May as first-quarter reports proved even more favorable. Indeed, earnings for the S&P 500 Index as a whole increased by nearly 14% in the first quarter, according to research firm FactSet, its best showing since 2011. A swing to profitability in the energy sector deserved much of the credit, but technology, financials, and materials companies also recorded strong gains. Investors were also pleased to see growth picking up again in Europe and remaining strong in China and other emerging markets.
Finally, the Federal Reserve’s intent to nurture asset prices again deserved some of the credit for the market’s gains. The Fed raised interest rates twice in early 2017, but policymakers took constant care to assure investors that they were moving slowly to normalize monetary policy and would pause the moment that they saw signs not only of an economic slowdown, but also turmoil in financial markets. In this context, it is not surprising that the market’s advance was generally slow and steady; in fact, in May, the Chicago Board Options Exchange’s Volatility Index, the VIX, briefly touched its lowest level in almost a quarter of a century.
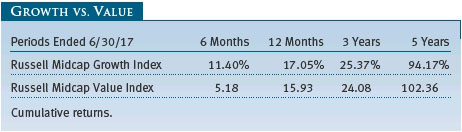
A mixture of these dynamics helped growth stocks dramatically outperform value shares in the first half of the year, as shown in the Growth vs. Value table on page 5. In particular, technology and other “secular” growth stocks seized market leadership back from the cyclically sensitive value stocks that outperformed in 2016. The outperformance was particularly strong following the election. Within the Russell Midcap Growth Index, health care and information technology shares performed best, while consumer staples, consumer discretionary, and industrials and business services shares lagged.
PORTFOLIO REVIEW
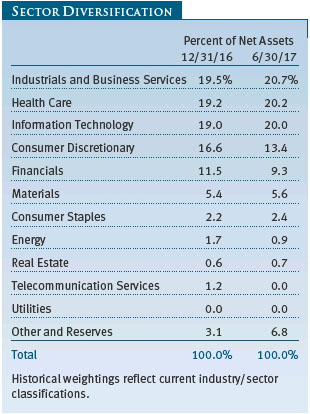
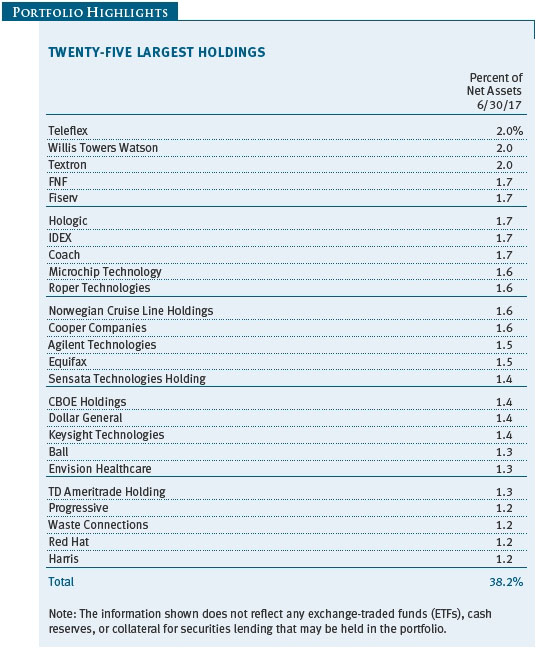
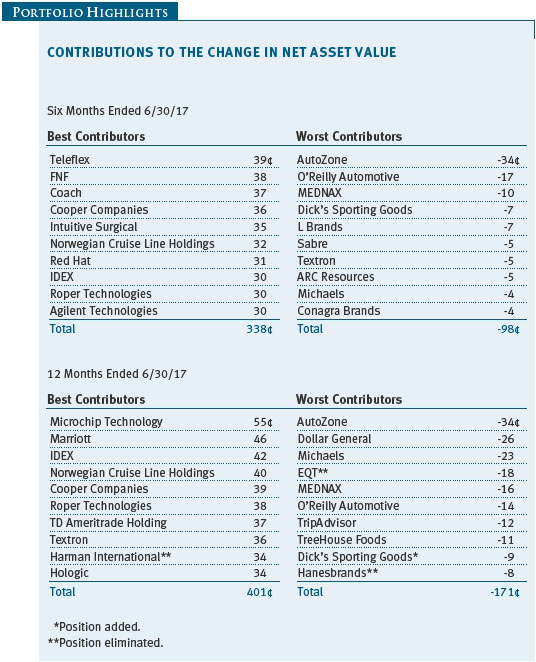
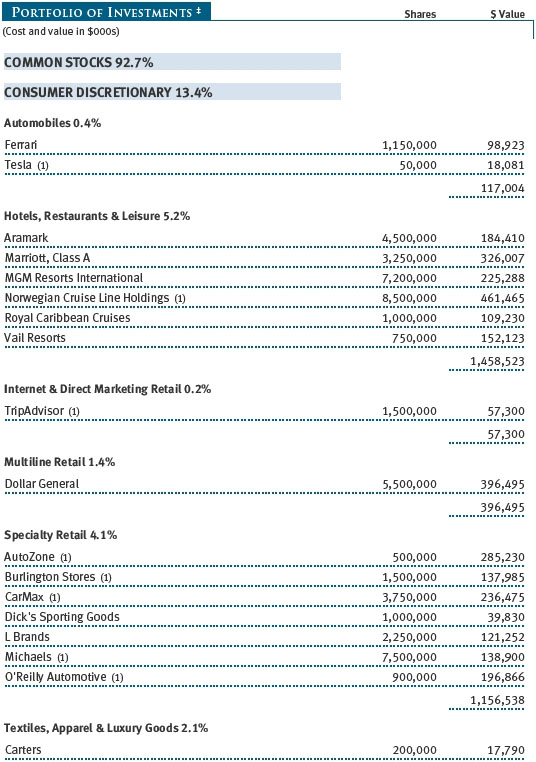
In such a strong market, it is not surprising that a large majority of the fund’s holdings experienced positive returns in the first half of our fiscal year, with only the very small energy sector (around 1% of the portfolio) detracting from overall results. The technology sector, which represents about one-fifth of the portfolio, contributed the most to our results. Our standout contributors here included Microchip Technology, a maker of microcontrollers that benefited from the very successful integration of its acquisition of Atmel and from an updraft in semiconductor stocks, and longtime holding Fiserv, which provides financial processing and mobile payments services. (Please refer to the fund’s portfolio of investments for a complete list of our holdings and the amount each represents in the portfolio.)
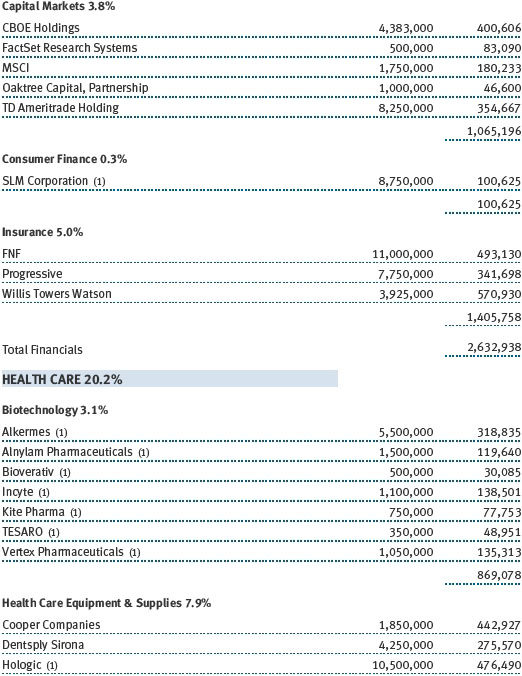
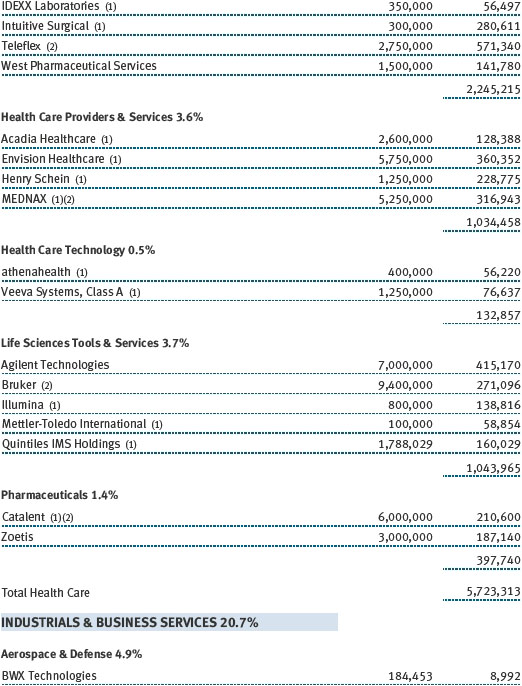
In our last letter, we described our continued focus on service providers within the health care sector, and three of our top 10 contributors in the first half of 2017 came from the segment. Teleflex, which specializes in single-use medical devices used in surgery and acute care, rose in part as investors rewarded its astute acquisition of a vascular equipment provider. Intuitive Surgical remains the world’s leading provider of operating room robots, with little competition on the horizon, and the stock rose as the company continued its strong profit growth. Cooper Companies, a leading maker of specialty contact lenses (such as the multifocal contact lenses that we both use), has benefited as acquisitions made several years ago have been successfully integrated and have begun to flow through to the bottom line. MEDNAX, which offers outsourced physician services, was a notable detractor after the company experienced a decline in hospital admissions in both its neonatology and anesthesiology businesses. We expect both downturns to be temporary.
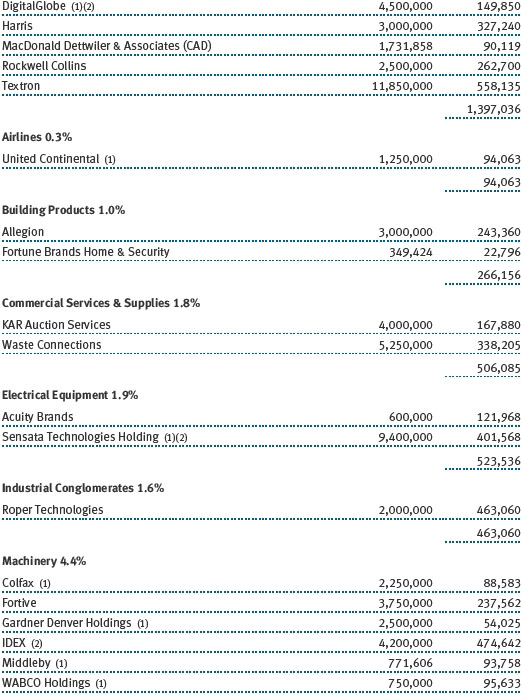
Although the industrial sector—long a focus of the portfolio—lagged the market, it was quite additive to our results as several longtime holdings performed well. IHS Markit, the product of a merger last year between IHS, held in our fund since 2006, and financial services provider Markit, was a top contributor within the sector, and we reduced our position on the gains. IDEX, which we’ve held since 2007, rose on an uptick in sales of its pumps and flow meters. Roper Technologies, a broadly diversified industrial company built through acquisitions that we’ve held since 2002, was also strong, thanks in part to improved oil and gas markets. Acuity Brands, a maker of lighting fixtures and controls, was a notable detractor after the company missed earnings estimates.
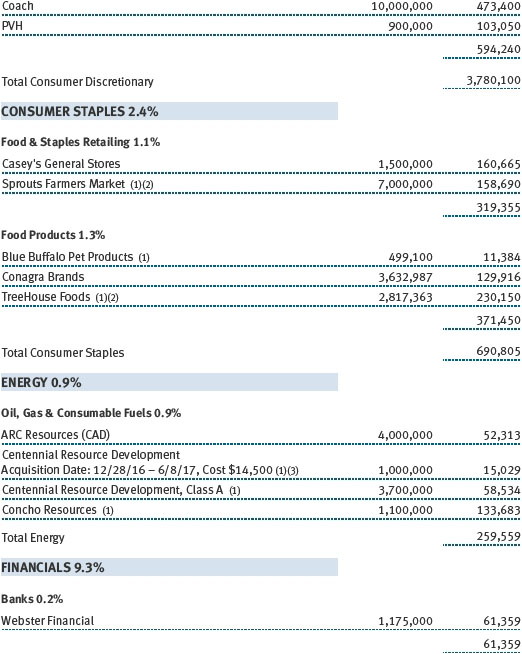
Consumer discretionary is another large sector within the fund, although we have remained underweight relative to our benchmark given our guarded outlook about consumer spending and wage growth. Marriott, the world’s largest hotel operator, provided a large boost to our returns after beating earnings estimates in consecutive quarters. Coach also performed well; the company’s fundamentals continued to improve as it transitions to more of a lifestyle brand from one focused almost exclusively on handbags. Retailers exposed to the onslaught of Amazon performed poorly, however. For instance, sales and earnings faltered at Dick’s Sporting Goods, which we had thought might benefit from being the last man standing in the brick-and-mortar sporting goods sector. We had also surmised that auto parts stores might be better insulated from the move online—especially since such stores also include service providers such as repair shops—but AutoZone and O’Reilly Automotive suffered from greater caution among Hispanic consumers, generally mild weather—which occasions fewer auto repairs—and fears that Amazon is encroaching on their businesses. L Brands, the operator of Victoria’s Secret and Bath & Body Works, struggled with issues specific to its businesses (such as assortment and fashion shifts) but also with a precipitous decline in foot traffic within many of the malls in which it operates, a phenomenon being exacerbated by the move by consumers to online.
We experienced mixed results in our financials sector holdings. TD Ameritrade Holding fell significantly in the period over worries of a price war among discount brokerages. We are less concerned about this issue than the market and added to this longtime holding. The stock’s poor performance was offset in our portfolio, however, by good results from CBOE Holdings and MSCI. We also benefited from the robust performance of title insurance and mortgage services provider FNF. The company reported solid trends in both its residential and commercial markets, and we think it should continue to grow earnings as the housing market recovers.
As always, recent additions to the portfolio reflect our desire to remain well diversified while focusing on growth segments where valuations are reasonable. We initiated a position in IAC InterActiveCorp, a holding company that nurtures consumer-oriented Internet firms. The company will soon own a majority stake in ANGI Homeservices, the home services marketplace resulting from the pending merger of HomeAdvisor and Angie’s List, which we think offers strong potential. We also established a new position in Casey’s General Stores, a convenience store operator that continues to grow at a solid pace, primarily in very small towns across the Midwest. We also purchased Marvell Technology Group, a digital semiconductor company that we believe can significantly grow its profitability in the years ahead under a new management team.
INVESTMENT STRATEGY AND OUTLOOK
Over the 25 years we’ve written these letters, we have often described how we find ourselves fighting the tide of market sentiment. Over the past several years, it seems as if that tide has strengthened. Both good and bad companies have been swept up in the market’s gains or losses, often with seemingly little attention paid to corporate fundamentals. In market terms, stock correlations have increased—a trend that was particularly evident in the years immediately after the financial crisis. From this perspective, our favorable relative performance in recent years has been somewhat surprising.
Extreme monetary accommodation has been at least partly responsible for the increased correlations. Thanks to the near-zero interest rate policy of the Federal Reserve and other central banks, even poorly performing companies have had access to cheap capital. This has allowed some firms, that might otherwise have failed, to stay in business. It has also allowed many more marginal firms to buy back stock, acquire competitors, and engage in financial engineering that boosts their stock prices. In addition, the meager yields on bonds have pushed investors into stocks and other risky assets, just as policymakers intended.
Increased stock correlations have also enjoyed a symbiotic relationship with the rise of passive investing. On the one hand, the growing prominence of index funds and exchange-traded funds (ETFs) has fostered correlations as assets now move in and out of the market as a whole, rather than in and out of individual securities. Higher correlations have also made it harder for active managers to outperform, drawing more money into passive strategies.
This suggests that a change in Fed policy could undermine both correlations and foster an environment more conducive to active management. In fact, correlations among sectors in the market have begun very recently to show more dispersion. To be sure, the turn toward monetary tightening is only in its beginning stages with the federal funds rate still exceptionally low by historical standards and companies still able to issue debt at negligible costs. After several years, however, a return to a meaningful cost of capital is likely to put pressure on marginal businesses, some of which will probably buckle. Rising rates could also arrive against the background of peaking profit margins due to higher wage costs.
To be clear, we are not predicting an imminent recession or bear market. When the next downturn does come, however, we believe that our willingness to swim against the tide when necessary in search of reasonably valued growth stocks will once again benefit our shareholders. At the same time, we suspect that many individual investors who believe they have taken a conservative stance by investing in highly diversified index funds will find, to their dismay, how risky such funds can actually be. (As an aside, the liquidity of many ETFs is illusory because it far exceeds the liquidity of the underlying securities. This does not matter when ETF flows are steady or somewhat balanced, but it will matter a lot when sentiment swings to one extreme or another.)
We are grateful that our shareholders have chosen to swim against the tide themselves by forgoing the rush to passive management and placing their faith in our stock picking. We will do our best to continue to merit your confidence.
Respectfully submitted,

Brian W.H. Berghuis
President of the fund and chairman of its Investment Advisory Committee

John F. Wakeman
Executive vice president of the fund
July 17, 2017
The committee chairman has day-to-day responsibility for managing the portfolio and works with committee members in developing and executing the fund’s investment program.
RISKS OF STOCK INVESTING
As with all stock and bond mutual funds, the fund’s share price can fall because of weakness in the stock or bond markets, a particular industry, or specific holdings. The financial markets can decline for many reasons, including adverse political or economic developments, changes in investor psychology, or heavy institutional selling. The prospects for an industry or company may deteriorate because of a variety of factors, including disappointing earnings or changes in the competitive environment. In addition, the investment manager’s assessment of companies held in a fund may prove incorrect, resulting in losses or poor performance even in rising markets. The stocks of mid-cap companies entail greater risk and are usually more volatile than the shares of larger companies. In addition, growth stocks can be volatile for several reasons. Since they usually reinvest a high proportion of earnings in their own businesses, they may lack the dividends usually associated with value stocks that can cushion their decline in a falling market. Also, since investors buy these stocks because of their expected superior earnings growth, earnings disappointments often result in sharp price declines.
GLOSSARY
Gross domestic product: The total market value of all goods and services produced in a country in a given year.
Lipper indexes: Fund benchmarks that consist of a small number of the largest mutual funds in a particular category as defined by Lipper Inc.
Price-to-book ratio: A valuation measure that compares a stock’s market price with its book value; i.e., the company’s net worth divided by the number of outstanding shares.
Russell Midcap Growth Index: An unmanaged index that measures the performance of those Russell Midcap companies with higher price-to-book ratios and higher forecast growth values.
Russell Midcap Value Index: An unmanaged index that measures the performance of those Russell Midcap companies with lower price-to-book ratios and lower forecast growth values.
S&P 500 Index: An unmanaged index that tracks the stocks of 500 primarily large-cap U.S. companies.
Note: Russell Investment Group is the source and owner of the trademarks, service marks, and copyrights related to the Russell indexes. Russell® is a trademark of Russell Investment Group.
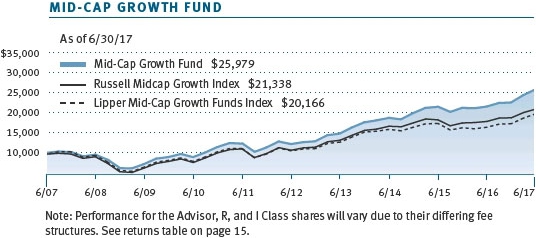
Performance and Expenses
This chart shows the value of a hypothetical $10,000 investment in the fund over the past 10 fiscal year periods or since inception (for funds lacking 10-year records). The result is compared with benchmarks, which may include a broad-based market index and a peer group average or index. Market indexes do not include expenses, which are deducted from fund returns as well as mutual fund averages and indexes.
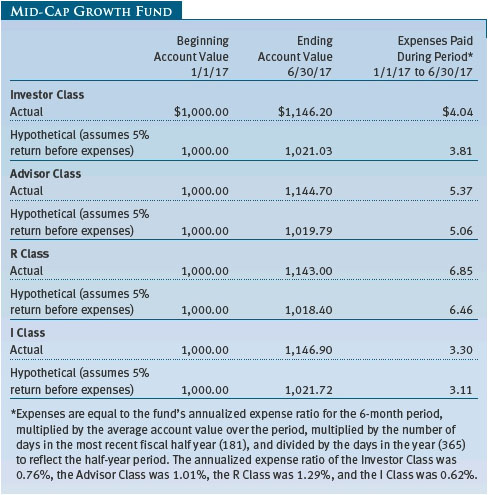
As a mutual fund shareholder, you may incur two types of costs: (1) transaction costs, such as redemption fees or sales loads, and (2) ongoing costs, including management fees, distribution and service (12b-1) fees, and other fund expenses. The following example is intended to help you understand your ongoing costs (in dollars) of investing in the fund and to compare these costs with the ongoing costs of investing in other mutual funds. The example is based on an investment of $1,000 invested at the beginning of the most recent six-month period and held for the entire period.
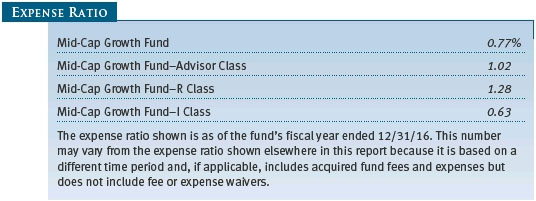
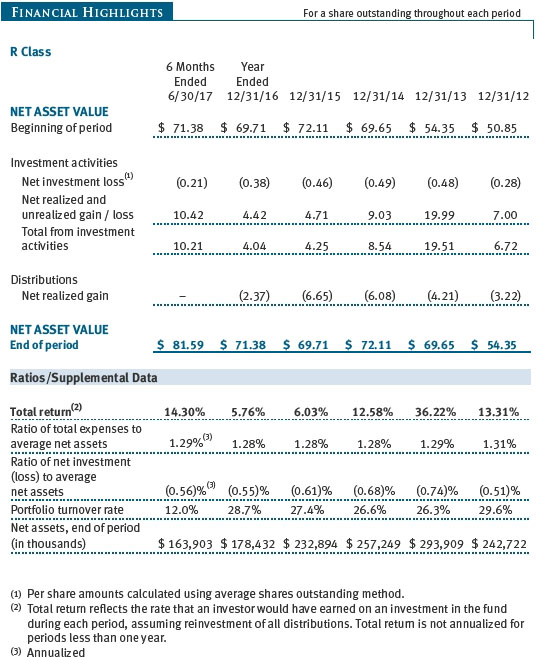
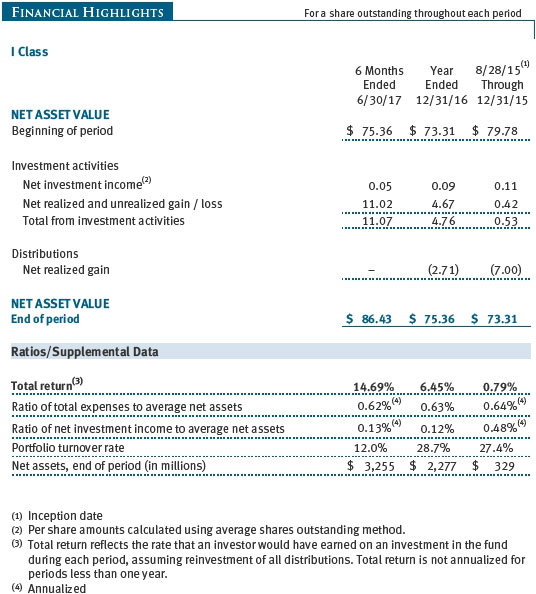
Please note that the fund has four share classes: The original share class (Investor Class) charges no distribution and service (12b-1) fee, Advisor Class shares are offered only through unaffiliated brokers and other financial intermediaries and charge a 0.25% 12b-1 fee, R Class shares are available to retirement plans serviced by intermediaries and charge a 0.50% 12b-1 fee, and I Class shares are available to institutionally oriented clients and impose no 12b-1 or administrative fee payment. Each share class is presented separately in the table.
Actual Expenses
The first line of the following table (Actual) provides information about actual account values and expenses based on the fund’s actual returns. You may use the information on this line, together with your account balance, to estimate the expenses that you paid over the period. Simply divide your account value by $1,000 (for example, an $8,600 account value divided by $1,000 = 8.6), then multiply the result by the number on the first line under the heading “Expenses Paid During Period” to estimate the expenses you paid on your account during this period.
Hypothetical Example for Comparison Purposes
The information on the second line of the table (Hypothetical) is based on hypothetical account values and expenses derived from the fund’s actual expense ratio and an assumed 5% per year rate of return before expenses (not the fund’s actual return). You may compare the ongoing costs of investing in the fund with other funds by contrasting this 5% hypothetical example and the 5% hypothetical examples that appear in the shareholder reports of the other funds. The hypothetical account values and expenses may not be used to estimate the actual ending account balance or expenses you paid for the period.
Note: T. Rowe Price charges an annual account service fee of $20, generally for accounts with less than $10,000. The fee is waived for any investor whose T. Rowe Price mutual fund accounts total $50,000 or more; accounts electing to receive electronic delivery of account statements, transaction confirmations, prospectuses, and shareholder reports; or accounts of an investor who is a T. Rowe Price Personal Services or Enhanced Personal Services client (enrollment in these programs generally requires T. Rowe Price assets of at least $250,000). This fee is not included in the accompanying table. If you are subject to the fee, keep it in mind when you are estimating the ongoing expenses of investing in the fund and when comparing the expenses of this fund with other funds.
You should also be aware that the expenses shown in the table highlight only your ongoing costs and do not reflect any transaction costs, such as redemption fees or sales loads. Therefore, the second line of the table is useful in comparing ongoing costs only and will not help you determine the relative total costs of owning different funds. To the extent a fund charges transaction costs, however, the total cost of owning that fund is higher.
Unaudited
The accompanying notes are an integral part of these financial statements.
Unaudited

The accompanying notes are an integral part of these financial statements.
Unaudited
The accompanying notes are an integral part of these financial statements.
Unaudited
The accompanying notes are an integral part of these financial statements.
Unaudited
The accompanying notes are an integral part of these financial statements.
Unaudited
The accompanying notes are an integral part of these financial statements.
Unaudited
The accompanying notes are an integral part of these financial statements.
Unaudited
The accompanying notes are an integral part of these financial statements.
Unaudited
| Notes to Financial Statements |
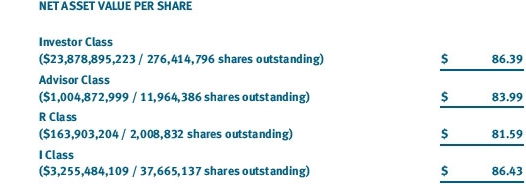
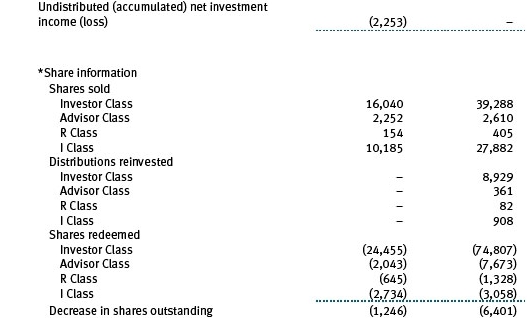
T. Rowe Price Mid-Cap Growth Fund, Inc. (the fund), is registered under the Investment Company Act of 1940 (the 1940 Act) as a diversified, open-end management investment company. The fund seeks to provide long-term capital appreciation by investing in mid-cap stocks with potential for above-average earnings growth. The fund has four classes of shares: the Mid-Cap Growth Fund (Investor Class), the Mid-Cap Growth Fund–Advisor Class (Advisor Class), the Mid-Cap Growth Fund–R Class (R Class), and the Mid-Cap Growth Fund–I Class (I Class). Advisor Class shares are sold only through unaffiliated brokers and other unaffiliated financial intermediaries, and R Class shares are available to retirement plans serviced by intermediaries. I Class shares generally are available only to investors meeting a $1,000,000 minimum investment or certain other criteria. The Advisor Class and R Class each operate under separate Board-approved Rule 12b-1 plans, pursuant to which each class compensates financial intermediaries for distribution, shareholder servicing, and/or certain administrative services; the Investor and I Classes do not pay Rule 12b-1 fees. Each class has exclusive voting rights on matters related solely to that class; separate voting rights on matters that relate to all classes; and, in all other respects, the same rights and obligations as the other classes.
NOTE 1 - SIGNIFICANT ACCOUNTING POLICIES
Basis of Preparation The fund is an investment company and follows accounting and reporting guidance in the Financial Accounting Standards Board (FASB) Accounting Standards Codification Topic 946 (ASC 946). The accompanying financial statements were prepared in accordance with accounting principles generally accepted in the United States of America (GAAP), including, but not limited to, ASC 946. GAAP requires the use of estimates made by management. Management believes that estimates and valuations are appropriate; however, actual results may differ from those estimates, and the valuations reflected in the accompanying financial statements may differ from the value ultimately realized upon sale or maturity.
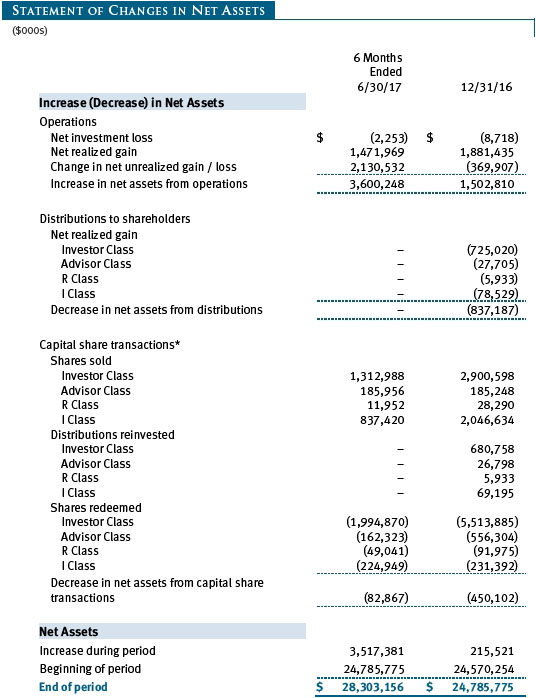
Investment Transactions, Investment Income, and Distributions Income and expenses are recorded on the accrual basis. Dividends received from mutual fund investments are reflected as dividend income; capital gain distributions are reflected as realized gain/loss. Earnings on investments recognized as partnerships for federal income tax purposes reflect the tax character of such earnings. Dividend income and capital gain distributions are recorded on the ex-dividend date. Income tax-related interest and penalties, if incurred, would be recorded as income tax expense. Investment transactions are accounted for on the trade date. Realized gains and losses are reported on the identified cost basis. Distributions from REITs are initially recorded as dividend income and, to the extent such represent a return of capital or capital gain for tax purposes, are reclassified when such information becomes available. Income distributions are declared and paid by each class annually. Distributions to shareholders are recorded on the ex-dividend date. A capital gain distribution may also be declared and paid by the fund annually.
Currency Translation Assets, including investments, and liabilities denominated in foreign currencies are translated into U.S. dollar values each day at the prevailing exchange rate, using the mean of the bid and asked prices of such currencies against U.S. dollars as quoted by a major bank. Purchases and sales of securities, income, and expenses are translated into U.S. dollars at the prevailing exchange rate on the date of the transaction. The effect of changes in foreign currency exchange rates on realized and unrealized security gains and losses is reflected as a component of security gains and losses.
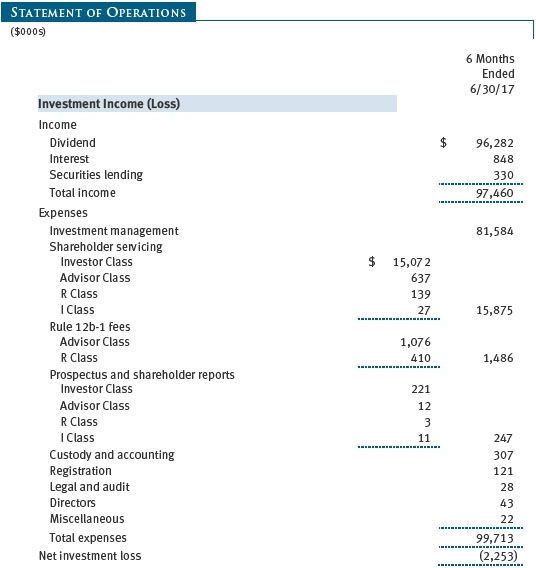
Class Accounting Shareholder servicing, prospectus, and shareholder report expenses incurred by each class are charged directly to the class to which they relate. Expenses common to all classes, investment income, and realized and unrealized gains and losses are allocated to the classes based upon the relative daily net assets of each class. The Advisor Class and R Class each pay Rule 12b-1 fees, in an amount not exceeding 0.25% and 0.50%, respectively, of the class’s average daily net assets.
Rebates Subject to best execution, the fund may direct certain security trades to brokers who have agreed to rebate a portion of the related brokerage commission to the fund in cash. Commission rebates are reflected as realized gain on securities in the accompanying financial statements and totaled $160,000 for the six months ended June 30, 2017.
In-Kind Redemptions In accordance with guidelines described in the fund’s prospectus, and when considered to be in the best interest of all shareholders, the fund may distribute portfolio securities rather than cash as payment for a redemption of fund shares (in-kind redemption). Gains and losses realized on in-kind redemptions are not recognized for tax purposes and are reclassified from undistributed realized gain (loss) to paid-in capital. During the six months ended June 30, 2017, the fund realized $118,695,000 of net gain on $253,834,000 of in-kind redemptions.
New Accounting Guidance In October 2016, the Securities and Exchange Commission (SEC) issued a new rule, Investment Company Reporting Modernization, which, among other provisions, amends Regulation S-X to require standardized, enhanced disclosures, particularly related to derivatives, in investment company financial statements. Compliance with the guidance is effective for financial statements related to periods ending on or after August 1, 2017; adoption will have no effect on the fund’s net assets or results of operations.
NOTE 2 - VALUATION
The fund’s financial instruments are valued and each class’s net asset value (NAV) per share is computed at the close of the New York Stock Exchange (NYSE), normally 4 p.m. ET, each day the NYSE is open for business. However, the NAV per share may be calculated at a time other than the normal close of the NYSE if trading on the NYSE is restricted, if the NYSE closes earlier, or as may be permitted by the SEC.
Fair Value The fund’s financial instruments are reported at fair value, which GAAP defines as the price that would be received to sell an asset or paid to transfer a liability in an orderly transaction between market participants at the measurement date. The T. Rowe Price Valuation Committee (the Valuation Committee) is an internal committee that has been delegated certain responsibilities by the fund’s Board of Directors (the Board) to ensure that financial instruments are appropriately priced at fair value in accordance with GAAP and the 1940 Act. Subject to oversight by the Board, the Valuation Committee develops and oversees pricing-related policies and procedures and approves all fair value determinations. Specifically, the Valuation Committee establishes procedures to value securities; determines pricing techniques, sources, and persons eligible to effect fair value pricing actions; oversees the selection, services, and performance of pricing vendors; oversees valuation-related business continuity practices; and provides guidance on internal controls and valuation-related matters. The Valuation Committee reports to the Board and has representation from legal, portfolio management and trading, operations, risk management, and the fund’s treasurer.
Various valuation techniques and inputs are used to determine the fair value of financial instruments. GAAP establishes the following fair value hierarchy that categorizes the inputs used to measure fair value:
Level 1 – quoted prices (unadjusted) in active markets for identical financial instruments that the fund can access at the reporting date
Level 2 – inputs other than Level 1 quoted prices that are observable, either directly or indirectly (including, but not limited to, quoted prices for similar financial instruments in active markets, quoted prices for identical or similar financial instruments in inactive markets, interest rates and yield curves, implied volatilities, and credit spreads)
Level 3 – unobservable inputs
Observable inputs are developed using market data, such as publicly available information about actual events or transactions, and reflect the assumptions that market participants would use to price the financial instrument. Unobservable inputs are those for which market data are not available and are developed using the best information available about the assumptions that market participants would use to price the financial instrument. GAAP requires valuation techniques to maximize the use of relevant observable inputs and minimize the use of unobservable inputs. When multiple inputs are used to derive fair value, the financial instrument is assigned to the level within the fair value hierarchy based on the lowest-level input that is significant to the fair value of the financial instrument. Input levels are not necessarily an indication of the risk or liquidity associated with financial instruments at that level but rather the degree of judgment used in determining those values.
Valuation Techniques Equity securities listed or regularly traded on a securities exchange or in the over-the-counter (OTC) market are valued at the last quoted sale price or, for certain markets, the official closing price at the time the valuations are made. OTC Bulletin Board securities are valued at the mean of the closing bid and asked prices. A security that is listed or traded on more than one exchange is valued at the quotation on the exchange determined to be the primary market for such security. Listed securities not traded on a particular day are valued at the mean of the closing bid and asked prices for domestic securities and the last quoted sale or closing price for international securities.
For valuation purposes, the last quoted prices of non-U.S. equity securities may be adjusted to reflect the fair value of such securities at the close of the NYSE. If the fund determines that developments between the close of a foreign market and the close of the NYSE will, in its judgment, materially affect the value of some or all of its portfolio securities, the fund will adjust the previous quoted prices to reflect what it believes to be the fair value of the securities as of the close of the NYSE. In deciding whether it is necessary to adjust quoted prices to reflect fair value, the fund reviews a variety of factors, including developments in foreign markets, the performance of U.S. securities markets, and the performance of instruments trading in U.S. markets that represent foreign securities and baskets of foreign securities. The fund may also fair value securities in other situations, such as when a particular foreign market is closed but the fund is open. The fund uses outside pricing services to provide it with quoted prices and information to evaluate or adjust those prices. The fund cannot predict how often it will use quoted prices and how often it will determine it necessary to adjust those prices to reflect fair value. As a means of evaluating its security valuation process, the fund routinely compares quoted prices, the next day’s opening prices in the same markets, and adjusted prices.
Actively traded equity securities listed on a domestic exchange generally are categorized in Level 1 of the fair value hierarchy. Non-U.S. equity securities generally are categorized in Level 2 of the fair value hierarchy despite the availability of quoted prices because, as described above, the fund evaluates and determines whether those quoted prices reflect fair value at the close of the NYSE or require adjustment. OTC Bulletin Board securities, certain preferred securities, and equity securities traded in inactive markets generally are categorized in Level 2 of the fair value hierarchy.
Investments in mutual funds are valued at the mutual fund’s closing NAV per share on the day of valuation and are categorized in Level 1 of the fair value hierarchy. Assets and liabilities other than financial instruments, including short-term receivables and payables, are carried at cost, or estimated realizable value, if less, which approximates fair value.
Thinly traded financial instruments and those for which the above valuation procedures are inappropriate or are deemed not to reflect fair value are stated at fair value as determined in good faith by the Valuation Committee. The objective of any fair value pricing determination is to arrive at a price that could reasonably be expected from a current sale. Financial instruments fair valued by the Valuation Committee are primarily private placements, restricted securities, warrants, rights, and other securities that are not publicly traded.
Subject to oversight by the Board, the Valuation Committee regularly makes good faith judgments to establish and adjust the fair valuations of certain securities as events occur and circumstances warrant. For instance, in determining the fair value of an equity investment with limited market activity, such as a private placement or a thinly traded public company stock, the Valuation Committee considers a variety of factors, which may include, but are not limited to, the issuer’s business prospects, its financial standing and performance, recent investment transactions in the issuer, new rounds of financing, negotiated transactions of significant size between other investors in the company, relevant market valuations of peer companies, strategic events affecting the company, market liquidity for the issuer, and general economic conditions and events. In consultation with the investment and pricing teams, the Valuation Committee will determine an appropriate valuation technique based on available information, which may include both observable and unobservable inputs. The Valuation Committee typically will afford greatest weight to actual prices in arm’s length transactions, to the extent they represent orderly transactions between market participants, transaction information can be reliably obtained, and prices are deemed representative of fair value. However, the Valuation Committee may also consider other valuation methods such as market-based valuation multiples; a discount or premium from market value of a similar, freely traded security of the same issuer; or some combination. Fair value determinations are reviewed on a regular basis and updated as information becomes available, including actual purchase and sale transactions of the issue. Because any fair value determination involves a significant amount of judgment, there is a degree of subjectivity inherent in such pricing decisions, and fair value prices determined by the Valuation Committee could differ from those of other market participants. Depending on the relative significance of unobservable inputs, including the valuation technique(s) used, fair valued securities may be categorized in Level 2 or 3 of the fair value hierarchy.
Valuation Inputs The following table summarizes the fund’s financial instruments, based on the inputs used to determine their fair values on June 30, 2017:
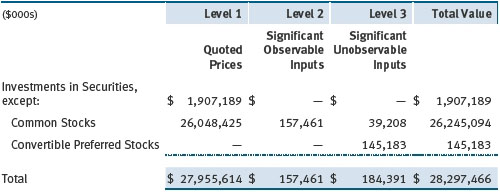
There were no material transfers between Levels 1 and 2 during the six months ended June 30, 2017.
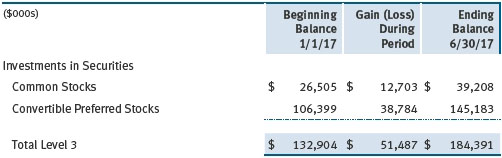
Following is a reconciliation of the fund’s Level 3 holdings for the six months ended June 30, 2017. Gain (loss) reflects both realized and change in unrealized gain/loss on Level 3 holdings during the period, if any, and is included on the accompanying Statement of Operations. The change in unrealized gain/loss on Level 3 instruments held at June 30, 2017, totaled $51,487,000 for the six months ended June 30, 2017.
NOTE 3 - OTHER INVESTMENT TRANSACTIONS
Consistent with its investment objective, the fund engages in the following practices to manage exposure to certain risks and/or to enhance performance. The investment objective, policies, program, and risk factors of the fund are described more fully in the fund’s prospectus and Statement of Additional Information.
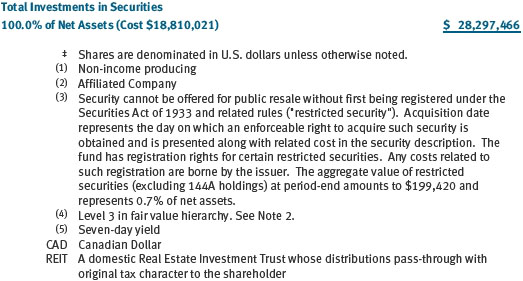
Restricted Securities The fund may invest in securities that are subject to legal or contractual restrictions on resale. Prompt sale of such securities at an acceptable price may be difficult and may involve substantial delays and additional costs.
Securities Lending The fund may lend its securities to approved brokers to earn additional income. Its securities lending activities are administered by a lending agent in accordance with a securities lending agreement. Security loans generally do not have stated maturity dates, and the fund may recall a security at any time. The fund receives collateral in the form of cash or U.S. government securities, valued at 102% to 105% of the value of the securities on loan. Collateral is maintained over the life of the loan in an amount not less than the value of loaned securities; any additional collateral required due to changes in security values is delivered to the fund the next business day. Cash collateral is invested by the lending agent(s) in accordance with investment guidelines approved by fund management. Additionally, the lending agent indemnifies the fund against losses resulting from borrower default. Although risk is mitigated by the collateral and indemnification, the fund could experience a delay in recovering its securities and a possible loss of income or value if the borrower fails to return the securities, collateral investments decline in value, and the lending agent fails to perform. Securities lending revenue consists of earnings on invested collateral and borrowing fees, net of any rebates to the borrower, compensation to the lending agent, and other administrative costs. In accordance with GAAP, investments made with cash collateral are reflected in the accompanying financial statements, but collateral received in the form of securities is not. At June 30, 2017, there were no securities on loan.
Other Purchases and sales of portfolio securities other than short-term securities aggregated $3,021,806,000 and $4,248,913,000, respectively, for the six months ended June 30, 2017.
NOTE 4 - FEDERAL INCOME TAXES
No provision for federal income taxes is required since the fund intends to continue to qualify as a regulated investment company under Subchapter M of the Internal Revenue Code and distribute to shareholders all of its taxable income and gains. Distributions determined in accordance with federal income tax regulations may differ in amount or character from net investment income and realized gains for financial reporting purposes. Financial reporting records are adjusted for permanent book/tax differences to reflect tax character but are not adjusted for temporary differences. The amount and character of tax-basis distributions and composition of net assets are finalized at fiscal year-end; accordingly, tax-basis balances have not been determined as of the date of this report.
At June 30, 2017, the cost of investments for federal income tax purposes was $18,814,748,000. Net unrealized gain aggregated $9,482,729,000 at period-end, of which $9,729,021,000 related to appreciated investments and $246,292,000 related to depreciated investments.
NOTE 5 - RELATED PARTY TRANSACTIONS
The fund is managed by T. Rowe Price Associates, Inc. (Price Associates), a wholly owned subsidiary of T. Rowe Price Group, Inc. (Price Group). The investment management agreement between the fund and Price Associates provides for an annual investment management fee, which is computed daily and paid monthly. The fee consists of an individual fund fee and a group fee. The individual fund fee is equal to 0.35% of the fund’s average daily net assets up to $15 billion and 0.30% of the fund’s average daily net assets in excess of $15 billion. The group fee rate is calculated based on the combined net assets of certain mutual funds sponsored by Price Associates (the group) applied to a graduated fee schedule, with rates ranging from 0.48% for the first $1 billion of assets to 0.265% for assets in excess of $650 billion. The fund’s group fee is determined by applying the group fee rate to the fund’s average daily net assets. At June 30, 2017, the effective annual group fee rate was 0.29%.
The I Class is subject to an operating expense limitation (I Class limit) pursuant to which Price Associates is contractually required to pay all operating expenses of the I Class, excluding management fees, interest, expenses related to borrowings, taxes, brokerage, and other non-recurring expenses permitted by the investment management agreement, to the extent such operating expenses, on an annualized basis, exceed 0.05% of average net assets. This agreement will continue until April 30, 2018, and may be renewed, revised, or revoked only with approval of the fund’s Board. The I Class is required to repay Price Associates for expenses previously paid to the extent the class’s net assets grow or expenses decline sufficiently to allow repayment without causing the class’s operating expenses to exceed the I Class limit in effect at the time of the waiver. However, no repayment will be made more than three years after the date of a payment or waiver. For the six months ended June 30, 2017, the I Class operated below its expense limitation.
In addition, the fund has entered into service agreements with Price Associates and two wholly owned subsidiaries of Price Associates (collectively, Price). Price Associates provides certain accounting and administrative services to the fund. T. Rowe Price Services, Inc. provides shareholder and administrative services in its capacity as the fund’s transfer and dividend-disbursing agent. T. Rowe Price Retirement Plan Services, Inc. provides subaccounting and recordkeeping services for certain retirement accounts invested in the Investor Class, R Class and I Class. For the six months ended June 30, 2017, expenses incurred pursuant to these service agreements were $41,000 for Price Associates; $1,610,000 for T. Rowe Price Services, Inc.; and $3,443,000 for T. Rowe Price Retirement Plan Services, Inc. The total amount payable at period-end pursuant to these service agreements is reflected as Due to Affiliates in the accompanying financial statements.
Additionally, the fund is one of several mutual funds in which certain college savings plans managed by Price Associates may invest. As approved by the fund’s Board of Directors, shareholder servicing costs associated with each college savings plan are borne by the fund in proportion to the average daily value of its shares owned by the college savings plan. For the six months ended June 30, 2017, the fund was charged $126,000 for shareholder servicing costs related to the college savings plans, of which $105,000 was for services provided by Price. The amount payable at period-end pursuant to this agreement is reflected as Due to Affiliates in the accompanying financial statements. At June 30, 2017, Less than 1% of the outstanding shares of the Investor Class were held by college savings plans.
The fund is also one of several mutual funds sponsored by Price Associates (underlying Price funds) in which the T. Rowe Price Spectrum Funds (Spectrum Funds) and T. Rowe Price Retirement Funds (Retirement Funds) may invest. None of the Spectrum Funds or Retirement Funds invest in the underlying Price funds for the purpose of exercising management or control. Pursuant to special servicing agreements, expenses associated with the operation of the Spectrum Funds and Retirement Funds are borne by each underlying Price fund to the extent of estimated savings to it and in proportion to the average daily value of its shares owned by the Spectrum Funds and Retirement Funds. Expenses allocated under these agreements are reflected as shareholder servicing expense in the accompanying financial statements. For the six months ended June 30, 2017, the fund was allocated $49,000 of Spectrum Funds’ expenses and $3,307,000 of Retirement Funds’ expenses. Of these amounts, $1,252,000 related to services provided by Price. At period-end, the amount payable to Price pursuant to these agreements is reflected as Due to Affiliates in the accompanying financial statements. At June 30, 2017, approximately 19% of the outstanding shares of the Investor Class were held by the Spectrum Funds and Retirement Funds.
In addition, other mutual funds, trusts, and other accounts managed by Price Associates or its affiliates (collectively, Price funds and accounts) may invest in the fund and are not subject to the special servicing agreements disclosed above. No Price fund or account may invest for the purpose of exercising management or control over the fund. At June 30, 2017, approximately 12% of the I Class’s outstanding shares were held by Price funds and accounts.
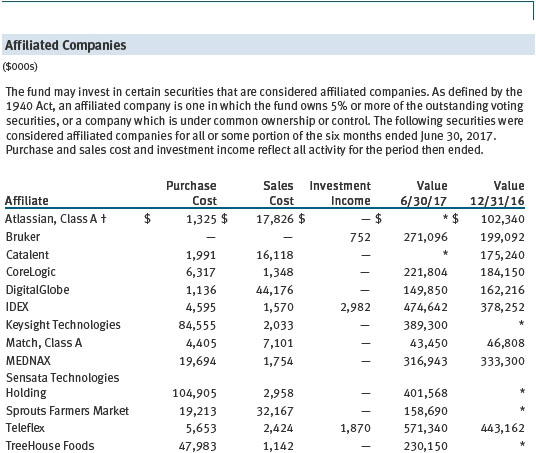
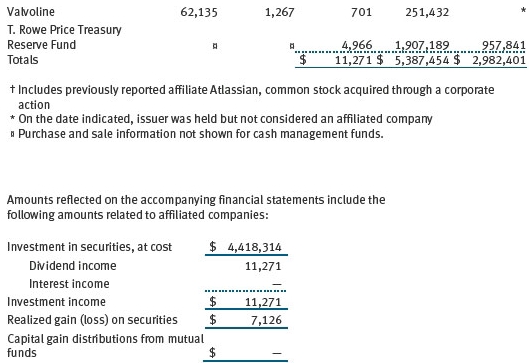
The fund may invest in the T. Rowe Price Government Reserve Fund, the T. Rowe Price Treasury Reserve Fund, or the T. Rowe Price Short-Term Fund (collectively, the Price Reserve Funds), open-end management investment companies managed by Price Associates and considered affiliates of the fund. The Price Reserve Funds are offered as short-term investment options to mutual funds, trusts, and other accounts managed by Price Associates or its affiliates and are not available for direct purchase by members of the public. The Price Reserve Funds pay no investment management fees.
The fund may participate in securities purchase and sale transactions with other funds or accounts advised by Price Associates (cross trades), in accordance with procedures adopted by the fund’s Board and Securities and Exchange Commission rules, which require, among other things, that such purchase and sale cross trades be effected at the independent current market price of the security. During the six months ended June 30, 2017, the aggregate value of purchases and sales cross trades with other funds or accounts advised by Price Associates was less than 1% of the fund’s net assets as of June 30, 2017.
| Information on Proxy Voting Policies, Procedures, and Records |
A description of the policies and procedures used by T. Rowe Price funds and portfolios to determine how to vote proxies relating to portfolio securities is available in each fund’s Statement of Additional Information. You may request this document by calling 1-800-225-5132 or by accessing the SEC’s website, sec.gov.
The description of our proxy voting policies and procedures is also available on our corporate website. To access it, please visit the following Web page:
https://www3.troweprice.com/usis/corporate/en/utility/policies.html
Scroll down to the section near the bottom of the page that says, “Proxy Voting Policies.” Click on the Proxy Voting Policies link in the shaded box.
Each fund’s most recent annual proxy voting record is available on our website and through the SEC’s website. To access it through T. Rowe Price, visit the website location shown above, and scroll down to the section near the bottom of the page that says, “Proxy Voting Records.” Click on the Proxy Voting Records link in the shaded box.
| How to Obtain Quarterly Portfolio Holdings |
The fund files a complete schedule of portfolio holdings with the Securities and Exchange Commission for the first and third quarters of each fiscal year on Form N-Q. The fund’s Form N-Q is available electronically on the SEC’s website (sec.gov); hard copies may be reviewed and copied at the SEC’s Public Reference Room, 100 F St. N.E., Washington, DC 20549. For more information on the Public Reference Room, call 1-800-SEC-0330.
| Approval of Investment Management Agreement |
Each year, the fund’s Board of Directors (Board) considers the continuation of the investment management agreement (Advisory Contract) between the fund and its investment advisor, T. Rowe Price Associates, Inc. (Advisor). In that regard, at an in-person meeting held on March 6–7, 2017 (Meeting), the Board, including a majority of the fund’s independent directors, approved the continuation of the fund’s Advisory Contract. At the Meeting, the Board considered the factors and reached the conclusions described below relating to the selection of the Advisor and the approval of the Advisory Contract. The independent directors were assisted in their evaluation of the Advisory Contract by independent legal counsel from whom they received separate legal advice and with whom they met separately.
In providing information to the Board, the Advisor was guided by a detailed set of requests for information submitted by independent legal counsel on behalf of the independent directors. In considering and approving the Advisory Contract, the Board considered the information it believed was relevant, including, but not limited to, the information discussed below. The Board considered not only the specific information presented in connection with the Meeting but also the knowledge gained over time through interaction with the Advisor about various topics. The Board meets regularly and, at each of its meetings, covers an extensive agenda of topics and materials and considers factors that are relevant to its annual consideration of the renewal of the T. Rowe Price funds’ advisory contracts, including performance and the services and support provided to the funds and their shareholders.
Services Provided by the Advisor
The Board considered the nature, quality, and extent of the services provided to the fund by the Advisor. These services included, but were not limited to, directing the fund’s investments in accordance with its investment program and the overall management of the fund’s portfolio, as well as a variety of related activities such as financial, investment operations, and administrative services; compliance; maintaining the fund’s records and registrations; and shareholder communications. The Board also reviewed the background and experience of the Advisor’s senior management team and investment personnel involved in the management of the fund, as well as the Advisor’s compliance record. The Board concluded that it was satisfied with the nature, quality, and extent of the services provided by the Advisor.
Investment Performance of the Fund
The Board took into account discussions with the Advisor and reports that it receives throughout the year relating to fund performance. In connection with the Meeting, the Board reviewed the fund’s net annualized total returns for the 1-, 2-, 3-, 4-, 5-, and 10-year periods as of September 30, 2016, and compared these returns with the performance of a peer group of funds with similar investment programs and a wide variety of other previously agreed-upon comparable performance measures and market data, including those supplied by Broadridge, which is an independent provider of mutual fund data.
On the basis of this evaluation and the Board’s ongoing review of investment results, and factoring in the relative market conditions during certain of the performance periods, the Board concluded that the fund’s performance was satisfactory.
Costs, Benefits, Profits, and Economies of Scale
The Board reviewed detailed information regarding the revenues received by the Advisor under the Advisory Contract and other benefits that the Advisor (and its affiliates) may have realized from its relationship with the fund, including any research received under “soft dollar” agreements and commission-sharing arrangements with broker-dealers. The Board considered that the Advisor may receive some benefit from soft-dollar arrangements pursuant to which research is received from broker-dealers that execute the fund’s portfolio transactions. The Board received information on the estimated costs incurred and profits realized by the Advisor from managing the T. Rowe Price funds. The Board also reviewed estimates of the profits realized from managing the fund in particular, and the Board concluded that the Advisor’s profits were reasonable in light of the services provided to the fund.
The Board also considered whether the fund benefits under the fee levels set forth in the Advisory Contract from any economies of scale realized by the Advisor. Under the Advisory Contract, the fund pays a fee to the Advisor for investment management services composed of two components—a group fee rate based on the combined average net assets of most of the T. Rowe Price funds (including the fund) that declines at certain asset levels and an individual fund fee rate based on the fund’s average daily net assets that also declines at certain asset levels—and the fund pays its own expenses of operations (subject to an expense limitation agreed to by the Advisor with respect to the fund’s I Class). At the Meeting, the Board approved an additional 0.005% breakpoint to the group fee schedule, effective May 1, 2017. With the new breakpoint, the group fee rate will decline to 0.265% when the combined average net assets of the applicable T. Rowe Price funds exceed $650 billion. The Board concluded that the advisory fee structure for the fund continued to provide for a reasonable sharing of benefits from any economies of scale with the fund’s investors.
Fees and Expenses
The Board was provided with information regarding industry trends in management fees and expenses. Among other things, the Board reviewed data for peer groups that were compiled by Broadridge, which compared: (i) contractual management fees, total expenses, actual management fees, and non-management expenses of the Investor Class of the fund with a group of competitor funds selected by Broadridge (Investor Class Expense Group); (ii) total expenses and actual management fees of the Advisor Class of the fund with a group of competitor funds selected by Broadridge (Advisor Class Expense Group); and (iii) total expenses, actual management fees, and non-management expenses of the Investor Class of the fund with a broader set of funds within the Lipper investment classification (Expense Universe). The Board considered the fund’s contractual management fee rate, actual management fee rate (which reflects the management fees actually received from the fund by the Advisor after any applicable waivers, reductions, or reimbursements), operating expenses, and total expenses (which reflect the net total expense ratio of the fund after any waivers, reductions, or reimbursements) in comparison with the information for the Broadridge peer groups. Broadridge generally constructed the peer groups by seeking the most comparable funds based on similar investment classifications and objectives, expense structure, asset size, and operating components and attributes and ranked funds into quintiles, with the first quintile representing the funds with the lowest relative expenses and the fifth quintile representing the funds with the highest relative expenses. The information provided to the Board indicated that the fund’s contractual management fee ranked in the second quintile (Investor Class Expense Group), the fund’s actual management fee rate ranked in the second quintile (Investor Class Expense Group) and first quintile (Advisor Class Expense Group and Expense Universe), and the fund’s total expenses ranked in the first and second quintiles (Investor Class Expense Group) and first quintile (Advisor Class Expense Group and Expense Universe).
The Board also reviewed the fee schedules for institutional accounts and private accounts with similar mandates that are advised or subadvised by the Advisor and its affiliates. Management provided the Board with information about the Advisor’s responsibilities and services provided to subadvisory and other institutional account clients, including information about how the requirements and economics of the institutional business are fundamentally different from those of the mutual fund business. The Board considered information showing that the Advisor’s mutual fund business is generally more complex from a business and compliance perspective than its institutional account business and considered various relevant factors, such as the broader scope of operations and oversight, more extensive shareholder communication infrastructure, greater asset flows, heightened business risks, and differences in applicable laws and regulations associated with the Advisor’s proprietary mutual fund business. In assessing the reasonableness of the fund’s management fee rate, the Board considered the differences in the nature of the services required for the Advisor to manage its mutual fund business versus managing a discrete pool of assets as a subadvisor to another institution’s mutual fund or for an institutional account and that the Advisor generally performs significant additional services and assumes greater risk in managing the fund and other T. Rowe Price funds than it does for institutional account clients.
On the basis of the information provided and the factors considered, the Board concluded that the fees paid by the fund under the Advisory Contract are reasonable.
Approval of the Advisory Contract
As noted, the Board approved the continuation of the Advisory Contract. No single factor was considered in isolation or to be determinative to the decision. Rather, the Board concluded, in light of a weighting and balancing of all factors considered, that it was in the best interests of the fund and its shareholders for the Board to approve the continuation of the Advisory Contract (including the fees to be charged for services thereunder).
Item 2. Code of Ethics.
A code of ethics, as defined in Item 2 of Form N-CSR, applicable to its principal executive officer, principal financial officer, principal accounting officer or controller, or persons performing similar functions is filed as an exhibit to the registrant’s annual Form N-CSR. No substantive amendments were approved or waivers were granted to this code of ethics during the registrant’s most recent fiscal half-year.
Item 3. Audit Committee Financial Expert.
Disclosure required in registrant’s annual Form N-CSR.
Item 4. Principal Accountant Fees and Services.
Disclosure required in registrant’s annual Form N-CSR.
Item 5. Audit Committee of Listed Registrants.
Not applicable.
Item 6. Investments.
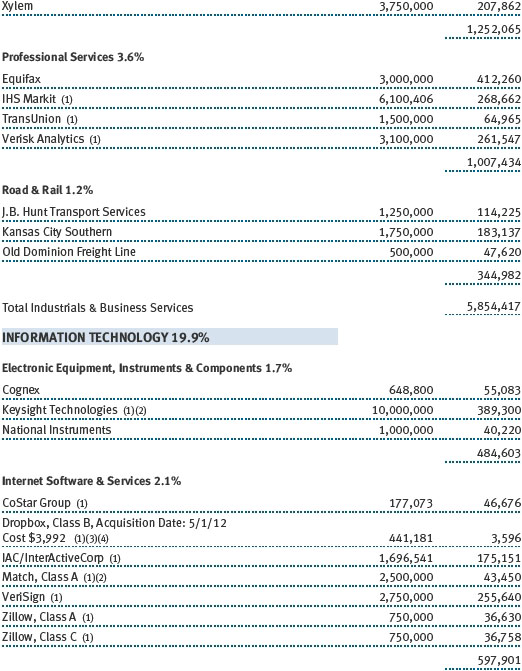
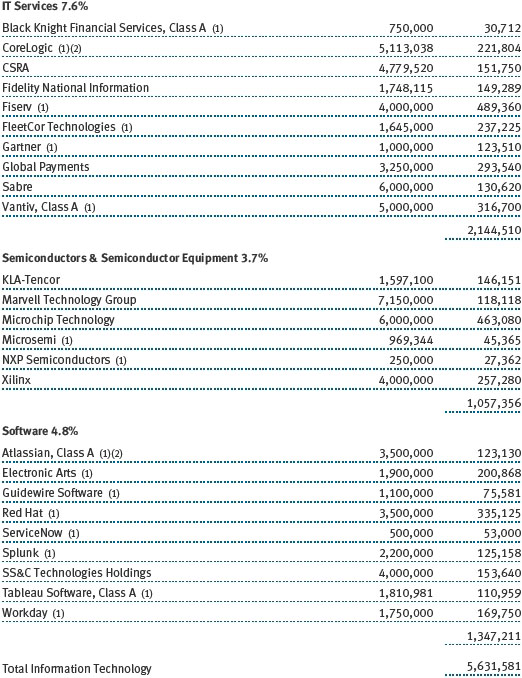
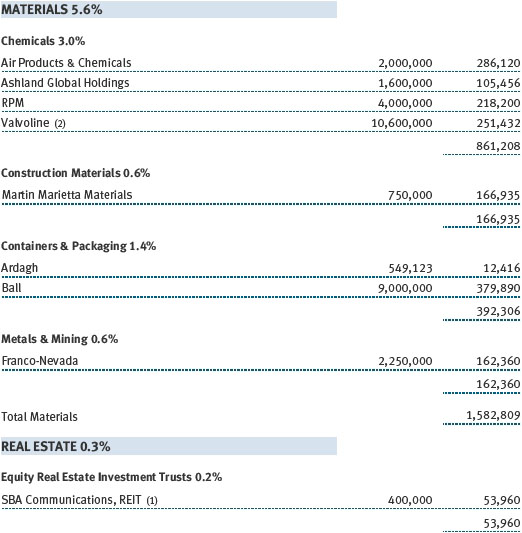
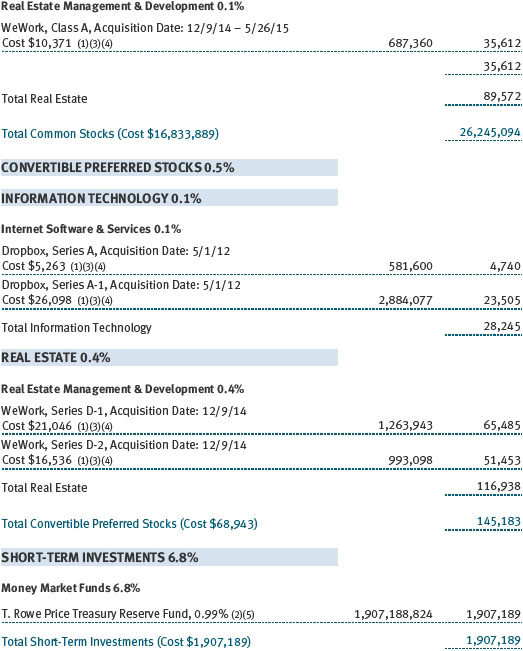
(a) Not applicable. The complete schedule of investments is included in Item 1 of this Form N-CSR.
(b) Not applicable.
Item 7. Disclosure of Proxy Voting Policies and Procedures for Closed-End Management Investment Companies.
Not applicable.
Item 8. Portfolio Managers of Closed-End Management Investment Companies.
Not applicable.
Item 9. Purchases of Equity Securities by Closed-End Management Investment Company and Affiliated Purchasers.
Not applicable.
Item 10. Submission of Matters to a Vote of Security Holders.
Not applicable.
Item 11. Controls and Procedures.
(a) The registrant’s principal executive officer and principal financial officer have evaluated the registrant’s disclosure controls and procedures within 90 days of this filing and have concluded that the registrant’s disclosure controls and procedures were effective, as of that date, in ensuring that information required to be disclosed by the registrant in this Form N-CSR was recorded, processed, summarized, and reported timely.
(b) The registrant’s principal executive officer and principal financial officer are aware of no change in the registrant’s internal control over financial reporting that occurred during the registrant’s second fiscal quarter covered by this report that has materially affected, or is reasonably likely to materially affect, the registrant’s internal control over financial reporting.
Item 12. Exhibits.
(a)(1) The registrant’s code of ethics pursuant to Item 2 of Form N-CSR is filed with the registrant’s annual Form N-CSR.
(2) Separate certifications by the registrant's principal executive officer and principal financial officer, pursuant to Section 302 of the Sarbanes-Oxley Act of 2002 and required by Rule 30a-2(a) under the Investment Company Act of 1940, are attached.
(3) Written solicitation to repurchase securities issued by closed-end companies: not applicable.
(b) A certification by the registrant's principal executive officer and principal financial officer, pursuant to Section 906 of the Sarbanes-Oxley Act of 2002 and required by Rule 30a-2(b) under the Investment Company Act of 1940, is attached.
SIGNATURES
Pursuant to the requirements of the Securities Exchange Act of 1934 and the Investment Company Act of 1940, the registrant has duly caused this report to be signed on its behalf by the undersigned, thereunto duly authorized.
T. Rowe Price Mid-Cap Growth Fund, Inc.
| By | | /s/ Edward C. Bernard |
| | | Edward C. Bernard |
| | | Principal Executive Officer |
| |
| Date | | August 17, 2017 | | | | |
Pursuant to the requirements of the Securities Exchange Act of 1934 and the Investment Company Act of 1940, this report has been signed below by the following persons on behalf of the registrant and in the capacities and on the dates indicated.
| By | | /s/ Edward C. Bernard |
| | | Edward C. Bernard |
| | | Principal Executive Officer |
| |
| Date | | August 17, 2017 | | | | |
| |
| |
| By | | /s/ Catherine D. Mathews |
| | | Catherine D. Mathews |
| | | Principal Financial Officer |
| |
| Date | | August 17, 2017 | | | | |