UNITED STATES
SECURITIES AND EXCHANGE COMMISSION
Washington, D.C. 20549
FORM 10-K
(Mark One)
x | ANNUAL REPORT PURSUANT TO SECTION 13 OR 15(d) OF THE SECURITIES EXCHANGE ACT OF 1934 |
For the fiscal year ended December 31, 2012
OR
| ¨ | TRANSITION REPORT PURSUANT TO SECTION 13 OR 15(d) OF THE SECURITIES EXCHANGE ACT OF 1934 |
For the transition period from to
Commission File Number: 000-20201
HAMPSHIRE GROUP, LIMITED
(Exact name of registrant as specified in its charter)
| Delaware | 06-0967107 |
(State or other jurisdiction of incorporation or organization) | (I.R.S. Employer Identification No.) |
| | |
| 114 W. 41st Street, New York, New York | 10036 |
| (Address of principal executive offices) | (Zip Code) |
Registrant’s telephone number, including area code: (212) 840-5666
Securities registered pursuant to Section 12(b) of the Act: None
Securities registered pursuant to Section 12(g) of the Act:
(Title of Class)
Common Stock, $0.10 par value
Indicate by check mark if the registrant is a well-known seasoned issuer, as defined in Rule 405 of the Securities Act. Yes ¨ No x
Indicate by check mark if the registrant is not required to file reports pursuant to Section 13 or Section 15(d) of the Exchange Act. Yes ¨ No x
Indicate by check mark whether the registrant (1) has filed all reports required to be filed by Section 13 or 15(d) of the Securities Exchange Act of 1934 during the preceding 12 months (or for such shorter period that the registrant was required to file such reports), and (2) has been subject to such filing requirements for the past 90 days. Yes x No ¨
Indicate by check mark whether the registrant has submitted electronically and posted to its corporate Web site, if any, every Interactive Data File required to be submitted and posted pursuant to Rule 405 of Regulation S-T (§232.405 of this chapter) during the preceding 12 months (or for such shorter period that the registrant was required to file such reports). Yes x No ¨
Indicate by check mark if disclosure of delinquent filers pursuant to Item 405 of Regulation S-K (§229.405 of this chapter) is not contained herein, and will not be contained, to the best of the registrant’s knowledge, in definitive proxy or information statements incorporated by reference in Part III of this Form 10-K or any amendment to this Form 10-K. ¨
Indicate by check mark whether registrant is a large accelerated filer, an accelerated filer, a non-accelerated filer or a smaller reporting company. See definitions of “large accelerated filer,” “accelerated filer,” and “smaller reporting company” in Rule 12b-2 of the Exchange Act.
| | Large accelerated filer ¨ | Accelerated filer ¨ |
| | Non-accelerated filer ¨ | Smaller Reporting Company x |
| | (Do not check if Smaller Reporting Company) | |
Indicate by check mark whether registrant is a shell company (as defined in Rule 12b-2 of the Exchange Act). Yes ¨ No x
As of June 30, 2012, the aggregate market value of the voting and non-voting Common Stock held by non-affiliates of the registrant was $15,209,466. Such aggregate market value was computed by reference to the closing sale price of the Common Stock as reported on the OTC Markets, a centralized quotation service that collects and publishes market maker quotes for over-the-counter securities, on such date. For purposes of making this calculation only, the Registrant has defined “affiliates” as including all directors and executive officers, but excluding any institutional stockholders owning more than ten percent of the Registrant’s Common Stock.
Number of shares of Common Stock outstanding as of March 2, 2013: 7,472,457
DOCUMENTS INCORPORATED BY REFERENCE
Certain portions of the Registrant’s Definitive Proxy Statement, relative to our 2013 Annual Meeting of Stockholders to be filed with the Securities and Exchange Commission not later than 120 days after the end of the fiscal year, are incorporated by reference into Part III of this Annual Report on Form 10-K.
HAMPSHIRE GROUP, LIMITED
ANNUAL REPORT ON FORM 10-K
For the Fiscal Year Ended December 31, 2012
| "SAFE HARBOR” STATEMENT | ii |
PART I. | | 1 |
| Item 1. | Business | 1 |
| Item 1A. | Risk Factors | 6 |
| Item 1B. | Unresolved Staff Comments | 11 |
| Item 2. | Properties | 11 |
| Item 3. | Legal Proceedings | 12 |
| Item 4. | Mine Safety Disclosures | 12 |
PART II. | | 13 |
| Item 5. | Market for Registrant’s Common Equity, Related Stockholder Matters and Issuer Purchases of Equity Securities | 13 |
| Item 6. | Selected Financial Data. | 14 |
| Item 7. | Management’s Discussion and Analysis of Financial Condition and Results of Operations | 15 |
| Item 7A. | Quantitative and Qualitative Disclosures About Market Risk | 25 |
| Item 8. | Financial Statements and Supplementary Data | 26 |
| Item 9. | Changes in and Disagreements With Accountants on Accounting and Financial Disclosure | 56 |
| Item 9A. | Controls and Procedures | 56 |
| Item 9B. | Other Information | 56 |
PART III. | | 57 |
| Item 10. | Directors, Executive Officers and Corporate Governance | 57 |
| Item 11. | Executive Compensation | 57 |
| Item 12. | Security Ownership of Certain Beneficial Owners and Management and Related Stockholder Matters | 57 |
| Item 13. | Certain Relationships and Related Transactions and Director Independence | 57 |
| Item 14. | Principal Accounting Fees and Services | 57 |
| PART IV. | | 58 |
| Item 15. | Exhibits, Financial Statement Schedules | 58 |
“SAFE HARBOR” STATEMENT
UNDER THE PRIVATE SECURITIES LITIGATION REFORM ACT OF 1995
From time to time, we make oral and written statements that may constitute “forward looking statements” (rather than historical facts) as defined in the Private Securities Litigation Reform Act of 1995 or by the Securities and Exchange Commission (the “SEC”) in its rules, regulations and releases, including Section 27A of the Securities Act of 1933, as amended (the “Securities Act”) and Section 21E of the Securities Exchange Act of 1934, as amended (the “Exchange Act”). We desire to take advantage of the “safe harbor” provisions in the Private Securities Litigation Reform Act of 1995 for forward looking statements made from time to time, including, but not limited to, the forward looking statements made in this Annual Report on Form 10-K (the “Annual Report”), as well as those made in other filings with the SEC.
Forward looking statements can be identified by our use of forward looking terminology such as “may,” “will,” “expect,” “anticipate,” “estimate,” “believe,” “continue,” “forecast,” “foresee” or other similar words. Such forward looking statements are based on our management’s current plans and expectations and are subject to risks, uncertainties and changes in plans that could cause actual results to differ materially from those described in the forward looking statements. Important factors that could cause actual results to differ materially from those anticipated in our forward looking statements include, but are not limited to, those described under “Risk Factors” set forth in Item 1A of this Annual Report.
We expressly disclaim any obligation to release publicly any updates or any changes in our expectations or any changes in events, conditions or circumstances on which any forward-looking statement is based.
As used herein, except as otherwise indicated by the context, the terms “Hampshire,” “Company,” “we” and “us” are used to refer to Hampshire Group, Limited and our wholly-owned subsidiaries.
ii
PART I.
Item 1. Business.
Company Overview
General
Hampshire Group, Limited is a provider of fashion apparel across a broad range of product categories, channels of distribution and price points. As a holding company, we operate through our wholly-owned subsidiaries, Hampshire Brands, Inc., Rio Garment S.A. and scott james, LLC. We were established in 1976 and are incorporated in the state of Delaware.
Hampshire Brands designs and markets men’s sportswear to department stores, chain stores and mass market retailers under licensed brands, our own proprietary brands and the private labels of our customers. Among others, we offer a full tops assortment under the Dockers® brand and a t-shirt and board short assortment under the Panama Jack® brand, both of which are licensed, as well as private label t-shirt and sweater offerings to retailers under their private labels.
The scott james® brand is a designer apparel collection for men, which includes a full sportswear offering. It is sold primarily through upscale department and specialty stores, scott james® retail shops and online at www.scottjamesonline.com.
Rio Garment S.A. (“Rio”), acquired August 25, 2011, is a Honduras-based apparel manufacturer, designing, sourcing and manufacturing knit tops for men, women and children, which are sold to retailers and distributors, primarily in the United States. Rio’s manufacturing platform primarily supports the vertical specialty store channel. Our manufacturing operations begin with the purchase of fabric and other raw materials from third party suppliers. The fabrics are ultimately sewn into finished garments at our textile facility or at the facilities of third party contractors located in Honduras. Rio also purchases yarn and outsources fabric production to third parties, where upon completion, the fabric returns to the Rio facility for production. Our garments may also be embellished and prepared for retail (with any combination of services, including ticketing, hang tags and hangers).
Recent Initiatives
The economic environment over the past several years has been challenging and has been characterized by, among other things, restrained consumer spending, weak credit market conditions and inflationary pressures on our cost of goods. In an effort to preserve gross margin dollars in the face of rising costs of goods and stagnant out the door prices, during the past two years we have taken significant steps to reposition our Company for growth and profitability, including:
| ▪ | Disposition of the women’s businesses. In May 2011, we announced a significant shift in our growth strategy with the disposition of our underperforming women’s businesses. The disposition of these businesses allowed us to focus on leveraging our operating platform in the men’s business and actively pursue other strategic opportunities. On May 5, 2011, in connection with this new strategic direction, we sold our women’s businesses, Hampshire Designers and Item-Eyes, in two separate transactions for a total purchase price of $12.3 million plus inventory before consideration of certain transaction costs and assets and liabilities that were not sold. |
| ▪ | Integration of Rio. On August 25, 2011, we reached a significant milestone with the acquisition of Rio. Rio has provided us an opportunity to grow our core business into the fast-growing vertical specialty store channel and has allowed us to leverage our existing operating platforms to expand Rio’s business into the department and chain store channels. Rio has the ability to produce for a variety of apparel categories including performance and fashion. Since completing the acquisition we have augmented Rio’s infrastructure in place to support growth. We are realizing the benefits of our strategy for Rio as we continue to develop a more robust product offering, grow its capacity within its current physical footprint and improve the efficiency of its operations. |
| ▪ | Added Dockers® and Panama Jack® licenses while phasing out legacy licenses with declining sales. We entered into a multi-year licensing agreement with Dockers® for its men’s “good” category tops in the United States. As part of this agreement, we oversee the design, production, sales and distribution of the line, to certain chain and department stores including Kohl’s Department Stores, Inc., J.C. Penney Company, Inc. and Sears Holding Corporation. The woven and knit line includes button down shirts, polos, fleece tops and t-shirts. We believe that these additional categories complement and strengthen the marketability of our Dockers® sweater offering and, taken together, help to ensure we have a compelling international brand to offer to retailers. We also entered into a licensing agreement with Panama Jack® to provide a new line of lifestyle apparel for men, including a full tops and board short assortment. The Dockers® and Panama Jack® licenses are well-recognized growing brands that have allowed us to phase out legacy licenses with declining sales. |
| ▪ | Broadening and diversifying our customer base. We remain focused on exploring opportunities to grow our sales and expand our retail relationships. We continued through 2012 to build brand recognition and market presence, as demonstrated by a new customer relationship with Bloomingdale’s. Further, we have begun new customer relationships with Wal-Mart and Kmart through our Panama Jack business. |
| ▪ | Restructuring and cost savings plan. In 2012, we implemented a cost savings plan, primarily through workforce reduction, that has allowed us to operate our business more efficiently and reduce costs. |
| ▪ | Reorganization plan. On January 15, 2013 Heath L. Golden resigned as chief executive officer of the Company. At the time of the resignation the Board of Directors of the Company (the “Board”) appointed Paul Buxbaum to serve as the Company’s new chief executive officer. Additionally, on January 28, 2013, the Company entered into an agreement with Buxbaum Group to provide certain restructuring and advisory consulting services. Pursuant to the agreement, Buxbaum Group is tasked with providing specific recommendations to the Board concerning the organization, operations and expenses to better support the Company’s business model and sales levels. Additionally, under the agreement Buxbaum Group is responsible for the implementation of such recommendations to the extent adopted by the Board. |
Our ProductsWe have continued to enhance and diversify our product lines in 2012. Our expanded product line and capabilities through the acquisition of Rio and development of scott james® permit us to supply many more departments of our existing customers and helps us attract new customers.
The emphasis with every garment we offer is a compelling product that features high quality and good value. The recent diversification and expansion of our product offerings allows us to participate in a range of retail price points from "main floor" traditional styles to fashion forward designer styles.
Our Strengths
We believe that we occupy a strong competitive position in a consolidating industry. We plan to further solidify our position through:
Business Focus. We continually review our portfolio of labels, business lines and divisions to evaluate whether they meet profitability and performance requirements and are in line with our business focus. During 2012, we expanded the product categories under our Dockers® license and entered into a Panama Jack® license. In 2011, we discontinued and sold the women’s businesses and acquired Rio.
Solid Infrastructure. We are recognized by leading retailers for our compelling product design, high quality value proposition, sourcing expertise and commitment to customer service. Our international sourcing abilities permit us to deliver trend right, quality product to each of the tiers of distribution we supply, which are primarily located within the United States. The quality of our garments is assured in a variety of ways. Each garment is manufactured using fine quality yarns and undergoes rigorous quality assurance checks. We utilize our own personnel, as well as factory personnel, independent inspection agencies and independent test labs to ensure that our products meet the high quality standards required for our brands. Extensive and Diverse Retail Relationships. Our relationships with major retailers range from national and regional department stores such as Macy’s, Inc. and Belk, Inc., to upscale department stores such as Bloomingdale’s, to national chain stores such as J.C. Penney Company, Inc. and Kohl’s Department Stores, Inc., to vertical specialty stores such as Aeropostale, Inc., to off-price retailers such as TJ Maxx, a division of The TJX Companies, Inc., and Ross Stores, Inc. These relationships enable our products to reach a large consumer base both in number and in geographical area.
Our Strategy
Hampshire’s strategies for the future include leveraging our:
Experienced Design and Sourcing Capabilities. We have and continue to invest in high quality design talent and resources. Our investments are aimed at further strengthening our design and sourcing efficiencies to ensure our brands fulfill the demand for high quality, value and trend right product.
Strong Competitive Position. As our retail customers seek to differentiate their assortments from competitors, they are increasingly turning to select designer and exclusive labels. We have demonstrated our value to retailers by offering such well known licensed brands as Dockers® and Panama Jack® lines. In addition, we are continuing to develop our owned scott james® brand. Also, Rio provides dependable and optimal pricing for the vertical specialty store customers. As we continue to integrate Rio into our business, we believe that we can benefit from considerable cross-selling opportunities and that our acquisition of Rio positions us well with respect to the strong industry trend toward migrating production to the western hemisphere.
Constant Improvement of our Infrastructure. As efficient systems and technologies are critical to meeting our retail customers’ needs, we are constantly re-evaluating our infrastructure to obtain additional synergies and efficiencies. During 2012 we were able to successfully integrate Rio onto certain reporting and operating platforms. Also, the Company is in the process of implementing a state-of-the-art production and planning system that will further enhance and improve Rio’s operating capabilities.
Growth Opportunities in Existing and New Channels. We are focused both on growing our sales to retailers in the moderate department and chain store channel, as well as actively exploring new sales channels including international, vertical specialty stores and direct-to-consumer. Our efforts with scott james® and Rio have been critical to achieving growth in this respect.
Organization
We have a long history of supplying men's branded and private label apparel to the department stores and national chains throughout the United States. We utilize our own sales force and contract third party salespersons to sell our products. With our established international sourcing relationships, we have the ability to respond quickly to changing fashion trends. Our acquisition of Rio has allowed us to continue to build upon our product diversification, sales force and agility within the apparel industry.
Customers
We have long term relationships with many of our customers. Hampshire Brands sells products principally into the moderate price sector of most major department and chain stores in the United States. scott james® sells products primarily to upscale specialty stores. Rio sells primarily to the vertical specialty store channel. Sales to our three largest customers in 2012, Aeropostale, Kohl's Department Stores, Inc. and J.C. Penney Company, Inc. represented 52%, 14% and 12%, respectively, of total annual sales. These same three customers represented 30%, 16% and 28%, respectively, of total sales during 2011. The growth in sales from Aeropostale from 2011 to 2012 was primarily due to a full year of sales in 2012 as compared to 2011 as Rio was acquired on August 25, 2011 and represents sales from that date forward. For each of the last two years, more than 99% of our sales from continuing operations were to customers located in the United States.
Suppliers
Hampshire Brands and scott james® primarily use foreign suppliers for their raw materials and product manufacturing. During 2012, the majority of our products were produced by independent manufacturers located in Southeast Asia. Keynote Services, Limited, our subsidiary based in China, assists with our sourcing needs and provides quality control. Rio primarily purchases raw materials, including yarn and fabric, from suppliers in the United States. Fabric is also purchased locally in Honduras. Purchased fabric is used in the manufacturing process at our facility located in Honduras. We outsource the fabric production to third party manufacturers.
Competition
The apparel market remains highly competitive. Competition is primarily based on design, price, quality and service. While we face competition from domestic manufacturers and distributors, our primary competition comes from private label programs of the internal sourcing organizations of many of our customers and factories located in Southeast Asia.
Our ability to compete is enhanced by our in-house design capabilities and our international sourcing relationships. Our launches of both Dockers® and Panama Jack® in additional categories and of scott james®, as well as the acquisition of Rio are the most recent examples of our ongoing efforts to deploy our financial resources in a manner that helps develop a competitive advantage by broadening our apparel offerings and product lines to reach multiple tiers of distribution.
Seasonality
In the past our business was highly seasonal as a result of our product mix including a high concentration of sweaters. Although not as significant as in prior years, our business continues to maintain a fairly high degree of seasonality with approximately 65% of our sales during 2012 occurring in the third and fourth quarters. As a result of such seasonality, inventory begins to rise in the second quarter and typically peaks during the third quarter before descending to its cyclical low in the fourth quarter. Trade receivable balances rise commensurately with sales. Cash balances follow this cycle as inventory is purchased, product is sold, and trade receivables are collected. Funding inventory and pending trade receivable collections deplete cash balances and may require draws from our revolving credit facility in the third or fourth quarters. Our income or loss from continuing operations has generally been correlated with revenue, as a large percentage of our profits have historically been generated in the third and fourth fiscal quarters.
Seasonality in 2012 declined largely as a result of Rio’s more even distribution of sales throughout the year as compared to our other subsidiaries. In 2013 and beyond, we expect this seasonality to decline further as a result of the Dockers® and Panama Jack® licenses which we believe will increase our sales during the spring season.
Rio’s manufacturing platform primarily supports the vertical specialty store channel. Our manufacturing operations begin with the purchase of fabric and other raw materials from third party suppliers. The fabrics are ultimately sewn into finished garments at our textile facility or at third party contractors located in Honduras. Rio also purchases yarn and outsources fabric production to third parties, where upon completion, the fabric returns to the Rio facility for production. Our garments may also be embellished and prepared for retail (with any combination of services, including ticketing, hang tags and hangers). For a description of risks associated with our operations located outside the United States, see Item 1A. Risk Factors.
Effects of Changing Prices
We are subject to increased prices for the products we source. We have historically managed our gross margin by achieving sourcing efficiencies, controlling costs in other parts of our operation and, when appropriate, passing along a portion of our cost increases to our customers through higher selling prices. We confront inflationary pressures in transportation costs, labor and materials.
Backlog
Our sales order backlog as of March 2, 2013 was approximately $71.5 million compared to approximately $67.7 million as of March 2, 2012. The sales order backlog as of March 2, 2012 included $20.4 million of orders related to license agreements that expired in 2012. The timing of the placement of seasonal orders by customers affects the backlog; accordingly, a comparison of backlog from year to year is not necessarily indicative of a trend in sales for the year. The backlog as of March 2, 2013 is expected to be filled during 2013.
Trademarks and Licenses
We consider our owned trademarks to have significant value in the marketing of our products. In addition, we have entered into licensing agreements to manufacture and market apparel under certain labels for which we pay royalties based on the volume of sales. The licensing agreements are generally for three year terms. We do not own any patents.
Electronic Information Systems
In order to schedule production, fill customer orders, transmit shipment data to our customers' distribution centers and invoice electronically, we have developed a number of integrated electronic information systems applications. Approximately 40% of our customer orders for 2012 were received electronically. In some instances, our customers' computer systems generate these orders based on sales and inventory levels. We electronically send advance shipment notices and invoices to our customers, which result in the timely update of their inventory levels.
Credit and Collection
We manage our credit and collection functions by approving and monitoring our customers' credit limits. Credit limits are determined by past payment history and financial information obtained from credit agencies and other sources. The majority of high risk accounts are factored without recourse, if possible, with financial institutions to reduce our credit risk exposure. We believe that our review procedures and our credit and collection staff have contributed significantly toward minimizing our losses from bad debt.
Governmental Regulation and Trade Agreements
The apparel industry and our business are subject to a wide variety of international trade agreements as well as federal, state and local regulations. We believe we are in compliance in all material respects with these agreements and regulations.
International trade agreements in particular can have a significant impact on the apparel industry and consequently on our business. These agreements generally provide for tariffs, which impose a duty charge on the product being imported, and quotas, which limit the amount of a product that may be imported from a specific country, both of which increase the cost of importing a product.
Primary among the trade agreements existing between the United States and certain foreign countries is the World Trade Organization (“WTO”), which is the governing body for international trade among the 151 originating member countries, including the United States. Effective January 1, 2005, all such quota restrictions involving trade with WTO member countries were terminated. In addition to the WTO, apparel imports into the United States are affected by other trade agreements and legislation, including the Dominican Republic – Central American Free Trade Agreement and the North American Free Trade Agreement, which has eliminated all apparel tariffs and quotas between the member countries and legislation granting similar trade benefits to 23 Caribbean countries. Further, Congress passed the African Growth and Opportunity Act in 2000, which gave 38 countries in sub-Saharan Africa similar trade privileges on apparel and certain other products exported to the United States.
Rio is authorized to operate under the Honduran Free Trade Zone Regime (“FTZ”). Therefore, Rio qualifies for exemption from Honduran customs duties, charges and surcharges, internal consumption, production sales tax and other excise taxes on imported and exported goods. Rio is also exempt from municipal taxes, asset taxes and income taxes, provided that Rio does not benefit from income tax exemption granted in another country. In order to maintain the FTZ exemption, Rio must export at least 95% of its annual production. Rio currently exports 99% of its production.
Compliance with Environmental Laws
We believe that we are in compliance with applicable environmental laws and that such compliance will not have a major adverse financial impact on us. We further believe that there are no environmental matters that are likely to have a significant financial impact on us. There can be no assurance, however, that future changes in federal, state or local regulations, interpretations of existing regulations or the discovery of currently unknown problems or conditions will not require substantial additional expenditures. Similarly, while we are not currently aware of any violations, the extent of our liability, if any, for past failures to comply with laws, regulations and permits applicable to our operations cannot be determined and could have a material adverse effect on our operations, financial condition or liquidity.
Employees
As of March 2, 2013, we employed approximately 979 full-time employees in Honduras, 76 full-time employees in the United States and 18 full-time employees in China. We believe our relationship with our employees is good. We have invested significant time and resources in ensuring that the working conditions in our Honduras facility meet or exceed the standards imposed by the relevant governing laws. In addition, we have proactive programs to promote workplace safety, personal health and employee wellness.
Available Information
Our periodic and current reports, including amendments to such reports as filed or furnished pursuant to Section 13(a) or 15(d) of the Securities Exchange Act of 1934, as amended, are available, free of charge, on our website, www.hamp.com, as soon as reasonably practicable after such material is electronically filed with, or furnished to, the SEC. Information contained on our website is not and should not be deemed a part of this Annual Report or a part of any other report or filing with the SEC.
Item 1A. Risk Factors.
In addition to the risks that are described below, there may be risks that we do not yet know of or that we currently think are immaterial that may also impair our business. If any of the events or circumstances described as risks below or elsewhere in this report actually occur, our business, results of operations or financial condition could be materially and adversely affected. The following risks, as well as other information contained herein, including our consolidated financial statements and notes thereto, should be carefully considered in evaluating our business and any investment in our common stock.
The apparel industry is heavily influenced by general economic cycles that affect consumer spending. A prolonged period of depressed consumer spending would have a material adverse effect on us.
The apparel industry has historically been subject to cyclical variations, recessions in the general economy and uncertainties regarding future economic prospects that affect consumer spending habits, which could negatively impact our business. The success of our operations depends on a number of factors impacting discretionary consumer spending, including general economic conditions, consumer confidence, wages and unemployment, housing prices, consumer debt, interest rates, fuel and energy costs, taxation and political conditions. A downturn in the economy may affect consumer purchases of our products and adversely impact our growth and profitability.
We use foreign suppliers for our raw materials and the manufacture of products for our men’s division and our operations include a manufacturing facility based in Honduras, which poses risks to our business operations.
During 2012, the majority of our production took place in Honduras, and a significant portion of our products were also produced by independent manufacturers located outside the United States. Although no single supplier is critical to our production needs, any of the following could adversely affect the production and delivery of our products and, as a result, have an adverse effect on our business, financial condition and results of operations:
| · | political or labor instability in countries where contractors and suppliers are located; |
| · | political or military conflict involving the United States; |
| · | heightened terrorism security concerns, which could subject imported goods to additional, more frequent or more thorough inspections, leading to delays in deliveries or impoundment of goods for extended periods; |
| · | a significant decrease in availability or increase in cost of labor or raw materials, particularly in petroleum based synthetic fabrics; |
| · | impact of the global economic downturn on third party factories and their viability; |
| · | disease epidemics and health related concerns which could result in closed factories, reduced workforces and scrutiny or embargo of goods produced in infected areas; |
| · | imposition of regulations, quotas or duties relating to imports, which, among other things, could limit our ability to produce products in cost effective countries that have the labor force and expertise required; |
| · | any action that may change the foreign currency exchange rate against the dollar or permit the exchange rate to float; and |
| · | significant fluctuation of the value of the dollar as compared to other foreign currencies. |
The occurrence of any, some, or all of these events could have a material adverse impact on our business, operating results and financial condition. There can be no assurance that if a disruption occurred we could replace our manufacturing capacity and/or find other manufacturing resources.
There may not be an established public trading market for the Company’s common stock.
There is currently no established public trading market for our common stock. Our common stock is currently quoted on the OTC Markets (formerly known as “Pink Sheets”) under the symbol “HAMP”. The OTC Markets is a centralized quotation service that collects and publishes market maker quotes for over-the-counter securities in real time. Over-the-counter market quotations, like those on the OTC Markets, reflect inter-dealer prices, without retail mark-up, mark-down or commission and may not necessarily represent actual transactions. Currently, we are not actively seeking to become listed on the Nasdaq Global Market or any other exchange. There can be no assurance that our common stock will again be listed on a national exchange, or that a trading market for our common stock will be established.
We rely on our key customers, and a significant decrease in business from or the loss of any one of these key customers would substantially reduce our revenues and adversely affect our business.
Aeropostale, Kohl’s Department Stores, Inc. and J.C. Penney Company Inc. account for a significant portion of our revenues. We do not have long term agreements with any of our customers and purchases generally occur on an order by order basis. A decision by any of our major customers, whether motivated by marketing strategy, competitive conditions, financial difficulties or otherwise, to decrease significantly the amount of merchandise purchased from us or to change their manner of doing business with us, could substantially reduce our revenues and have a material adverse effect on our profitability.
The retail industry has, in the past several years, experienced a great deal of consolidation and other ownership changes and we expect such changes to be ongoing. In the future, retailers may further consolidate, undergo restructurings or reorganizations, realign their affiliations or re-position their stores' target markets. Any of these types of actions could decrease the number of stores that carry our products or increase the ownership concentration within the retail industry. These changes could decrease our opportunities in the market, increase our reliance on a smaller number of customers and decrease our negotiating strength with them.
Our business has been and could continue to be adversely affected by financial instability experienced by our customers. During the past several years, various retailers have experienced significant financial difficulties, which have resulted in bankruptcies, liquidations and store closings. Over the last few years, several of our customers, including Goody’s, Mervyns, Gottschalks and Boscov’s, either reorganized or liquidated. We sell our product primarily to national and regional department stores, and vertical specialty stores in the United States on credit and evaluate each customer's financial condition on a regular basis in order to determine the credit risk we take in selling goods to them. The financial difficulties of a customer could cause us to curtail business with that customer and we may be unable to shift sales to another customer at comparable margins. We may also assume more credit risk relating to receivables of a customer experiencing financial instability. Should these circumstances arise with respect to our customers, our inability to shift sales or to collect on our trade accounts receivable from any one of our customers could substantially reduce our revenues and have a material adverse effect on our financial condition and results of operations.
Chargebacks and margin support payments may have a material adverse effect on our business.
Consistent with industry practice, we may allow customers to deduct agreed upon amounts from the purchase price for sales allowances, co-op advertising, new store opening discounts and other marketing development funds, which in the opinion of management promotes brand awareness. In addition, margin support payments may be required due to lower than anticipated sell through rates, which may be caused by uncontrollable factors, such as general economic conditions, changing fashion trends and weather conditions, as well as controllable factors, such as wholesale prices, design, merchandising and the quality of our goods. These deductions have a dilutive effect on our business and results of operations since they reduce overall gross profit margins on sales. If our efforts to reduce our margin support are unsuccessful, we will likely continue to experience significant levels of chargebacks and margin support payments, which may further reduce our profitability resulting in a material adverse effect on our business.
We are dependent upon the revenues generated by our licensing alliances and the loss or inability to renew certain licenses could reduce our revenue and consequently reduce our net income.
We license brands from third parties for specific products. The term of each of our licenses is generally three years and we typically have the opportunity to renew or extend the licenses, which are sometimes conditioned upon our meeting certain sales targets. We may not be able to renew or extend these licenses on favorable terms, if at all. If we are unable to renew or extend any one of these licenses, we could experience a decrease in net sales.
We may not be able to anticipate consumer preferences and fashion trends, which could negatively affect acceptance of our products by retailers and consumers and result in a significant decrease in net sales.
Our failure to anticipate, identify and respond effectively to changing consumer demands and fashion trends could adversely affect acceptance of our products by retailers and consumers and may result in a significant decrease in net sales or leave us with a substantial amount of unsold inventory. Our products must appeal to a broad range of consumers whose preferences cannot be predicted with certainty and are subject to rapid change. We may not be able to continue to develop appealing styles or successfully meet constantly changing consumer demands in the future. In addition, any new products or brands that we introduce may not be received successfully by retailers and consumers. If our products are not received successfully by retailers and consumers and we are left with a substantial amount of unsold inventory, we may be forced to rely on markdowns or promotional sales to dispose of excess inventory. If this occurs, our business, financial condition and results of operations could be materially adversely affected.
If our manufacturers fail to use acceptable ethical business practices, our business could be adversely affected. We require our manufacturers to operate in compliance with applicable laws, rules and regulations regarding working conditions, employment practices and environmental compliance. However, we do not control the labor and other business practices of the independent manufacturers of our products. If one of our manufacturers violates labor or other laws or implements labor or other business practices that are generally regarded as unethical in the United States, the shipment of products to us could be interrupted and our reputation could be damaged. Any of these events could have a material adverse effect on our results of operations.
Our business could be harmed if we do not deliver quality products in a timely manner.
Our sourcing, logistics and technology functions operate within substantial production and delivery requirements and subject us to the risks associated with unaffiliated manufacturers, transportation and other factors. If we do not comply with customer product requirements or meet their delivery requirements, our customers could seek reduced purchase prices, require significant margin support, reduce the amount of business they do with us or cease to do business with us, all of which would adversely affect our business.
If we encounter problems with our distribution system, our ability to deliver our products to the market would be adversely affected.
We rely on third party distribution facilities to warehouse and to ship product to our customers. Due to the fact that substantially all of our product is distributed from a relatively small number of locations, our operations could be interrupted by earthquakes, floods, fires or other natural disasters near our distribution centers. We maintain business interruption insurance, but it may not adequately protect us from the loss of customers. In addition, our distribution capacity is dependent on the timely performance of services by third parties, including transportation of product to and from distribution facilities. If we encounter problems with our distribution system, our inability to meet customer expectations on managing inventory, complete sales and achieve objectives for operating efficiencies could have a material adverse effect on our business.
Labor disruptions at ports or our suppliers’ facilities, manufacturers’ facilities or distribution facilities may adversely affect our business.
Our business depends on our ability to source and distribute product in a timely manner. As a result, we rely on the free flow of goods on a consistent basis from our suppliers and manufacturers. Labor disputes at various ports or at our suppliers, manufacturers or our distribution facilities create significant risks for our business, particularly if these disputes result in work slowdowns, lockouts, strikes or other disruptions during our peak importing or manufacturing seasons. An interruption in the flow of goods could have a material adverse effect on our business, potentially resulting in cancelled orders by customers, unanticipated inventory accumulation or shortages and reduced net sales and net income.
We rely significantly on information technology and any failure, inadequacy, interruption or security lapse of that technology could adversely affect our ability to effectively operate our business.
Our ability to manage and maintain our inventory and internal reports and to ship products to customers and invoice them on a timely basis depends significantly on our internally developed enterprise resource planning system, as approximately 40% of our orders are received electronically. The failure of this system to operate effectively or to integrate with other systems or a breach in security of this system could cause delays in product fulfillment and reduced efficiency of our operations, and it could require significant capital investments to remedy any such failure, problem or breach.
We operate in a highly competitive and fragmented industry and our failure to compete successfully could result in a loss of one or more significant customers.
The apparel industry is highly competitive and fragmented. Our competitors include numerous apparel designers, manufacturers, retailers, importers and licensors, many of which have greater financial and marketing resources than we possess. We believe that the principal competitive factors in the apparel industry are:
| | · | brand name and brand identity; |
| | · | timeliness, reliability and quality of product and services provided; |
| | · | market share and visibility; |
| | · | the ability to anticipate customer and consumer demands. |
The level of competition and the nature of our competitors vary by product segment with low margin manufacturers being our main competitors in the less expensive segment of the market and with domestic and foreign designers and licensors competing with us in the more upscale segment of the market. Increasingly, we experience competition from our customers' in-house private labels. If we do not maintain our brand names and identities and continue to provide high quality and reliable services on a timely basis at competitive prices, our ability to compete in our industry will be adversely affected. If we are unable to compete successfully, we could lose one or more of our significant customers, which could have a material adverse effect on our sales and financial performance.
We may face challenges in the management of the sales and profitability of any acquisitions that we may make, as well as in integrating the acquired businesses, any of which may negatively impact our business.
As part of our growth strategy, we have acquired and licensed, and in the future, may acquire or license new brands and product categories. We may also make strategic acquisitions in addition to Rio. Acquisitions have inherent risks, including the risk that the projected sales and net income from the acquisition may not be generated, the risk that the integration of the acquired business is more costly and takes longer than anticipated, the risk of diversion of the attention and resources of management, risks associated with additional customer concentration and related credit risk, risks of retaining key personnel and risks associated with unanticipated events and unknown legal liabilities despite the due diligence efforts that we undertake. Any of these risks could have a material adverse effect on our business.
We may be subject to the impairment of acquired intangible assets.
When we acquire a business, a portion of the purchase price of the acquisition may be allocated to goodwill and other identifiable intangible assets. At December 31, 2012 and 2011, our goodwill and intangible assets were approximately $17.2 million and $18.6 million, respectively. We conduct an annual review, and more frequent reviews if events or circumstances dictate, to determine whether goodwill is impaired. We also determine whether impairment indicators are present related to our identifiable intangible assets. If we determine that goodwill or other intangible assets are impaired, we would be required to write down the value of these assets.
The ultimate resolution of income and other possible tax liabilities may require us to incur expense beyond amounts reserved on our balance sheet or make cash payments beyond those that we anticipated.
The ultimate resolution of income and other possible tax liabilities may require us to incur expense beyond amounts reserved on our balance sheet or make cash payments beyond those that we anticipated. Our historic income and other tax positions may be challenged by the appropriate taxing authorities. We believe that we have provided adequate reserves for these tax positions for all periods open under the applicable statutes of limitations, but a challenge by a taxing authority could prove costly to defend as well as to resolve. If the actual liability for taxes exceeds our reserves, earnings could be materially adversely affected, and we may be required to make cash payments beyond what we anticipated.
Utilization of our net operating losses and tax credit carry-forwards may be subject to substantial annual limitations due to the ownership change limitations provided by the Internal Revenue Code (the “Code”) Section 382. Such annual limitations could result in the expiration of the net operating loss and tax credit carryforwards before their utilization. The events that may cause ownership changes include, but are not limited to, a cumulative stock ownership change of greater than 50% over a three year period. Calculating whether an ownership change has occurred is subject to uncertainty, both because of the complexity of Section 382 of the Code and because of limitations on a publicly-traded company's knowledge as to the ownership of, and transactions in, its securities. Therefore, the calculation of the amount of our net operating loss carryforwards may be changed as a result of a challenge by a governmental authority or our learning of new information about the ownership of, and transactions in, our securities. Our ability to fully utilize our net operating losses could be limited if there are future ownership changes that, together with certain ownership changes in our common stock that have occurred during any prior three year period (including, as of the date hereof, any shares issued in connection with the Rio transaction), result in a “change of control” for the purposes of Section 382.
Rio is authorized to operate under the Honduran Free Trade Zone Regime (“FTZ”). Therefore, Rio qualifies for exemption from Honduran customs duties, charges and surcharges, internal consumption, production sales tax and other excise taxes on imported and exported goods. Rio is also exempt from municipal taxes, asset taxes and income taxes, provided that Rio does not benefit from income tax exemption granted in another country. In order to maintain the FTZ exemption, Rio must export at least 95% of its annual production. Rio currently exports 99% of its production. Although the FTZ is indefinite by nature, subsequent repeal or modification of the FTZ, or any failure to qualify for the aforementioned exemptions, could materially adversely affect our results of operations.
Significant changes to international trade regulations could adversely affect our results of operations.
A large portion of our products are manufactured in Honduras. We therefore benefit from the Dominican Republic – Central America Free Trade Agreement (“DR-CAFTA”). Our claims for duty free or reduced duty treatment under DR-CAFTA and other available programs are largely conditioned on our ability to produce or obtain accurate records, some of which are provided to us by third parties, about production processes and sources of raw materials. Subsequent repeal or modification of DR-CAFTA, or the inadequacy or unavailability of supporting records, could materially adversely affect our results of operations. In addition, our products are subject to foreign competition, which in the past has been faced with significant U.S. government import restrictions. The extent of import protection afforded to domestic apparel producers has been, and is likely to remain, subject to political considerations. The elimination of import protections for domestic apparel producers could significantly increase global competition, which could adversely affect our business. In addition, any failure to comply with international trade regulations could cause us to become subject to investigation resulting in significant penalties or claims or an inability to conduct our business, adversely affecting our results of operations.
We are dependent on certain key personnel, the loss of whom could negatively impact our ability to manage our business and thereby adversely affect our business.
Our future success depends to a significant extent on retaining the services of key executive officers, other key members of management and directors. The loss of the services of any one of these individuals, or any other key member of management, could have a material adverse effect on our business.
The stockholders’ rights plan adopted by the Board of Directors in 2008 may inhibit takeovers and may adversely affect the market price of our common stock.
In 2008, our Board of Directors (“Board”) approved the creation of our Series A Preferred Stock and adopted a stockholders’ rights plan pursuant to which it declared a dividend of one Series A Preferred Stock purchase right for each share of our common stock held by stockholders of record. The preferred share purchase rights will also attach to any additional shares of common stock issued. Initially, these rights will not be exercisable and will trade with the shares of our common stock. Under the rights plan, these rights will generally be exercisable only if a person or group acquires, or commences a tender or exchange offer, for 15% or more of our common stock. If the rights become exercisable, each right will permit its holder to purchase one one-thousandth of a share of Series A Preferred Stock for the exercise price of $33.00 per right. The rights plan also contains customary “flip-in” and “flip-over” provisions such that if a person or group acquires beneficial ownership of fifteen percent or more of our common stock, each right will permit its holder, other than the acquiring person or group, to purchase shares of our common stock for a price equal to the quotient obtained by dividing $33.00 per right by one-half the then current market price of our common stock. In addition, if, after a person acquires such ownership, we are later acquired in a merger or similar transaction, each right will permit its holder, other than the acquiring person or group, to purchase shares of the acquiring corporation’s stock for a price equal to the quotient obtained by dividing $33.00 per right by one-half of the then current market price of the acquiring company’s common stock, based on the market price of the acquiring corporation’s stock prior to such merger.
The stockholders’ rights plan and the associated Series A Preferred Stock purchase rights may discourage a hostile takeover and prevent our stockholders from receiving a premium over the prevailing market price for the shares of our common stock.
Global economic, political and social conditions may harm our ability to do business, increase our costs and negatively affect our stock price.
Global credit and financial markets have experienced extreme disruptions in recent years, including severely diminished liquidity and credit availability, declines in consumer confidence, declines in economic growth, increases in unemployment rates and uncertainty about economic stability. While the decline in consumer spending has recently moderated, these economic conditions could still lead to continued declines in consumer spending and may have resulted in a resetting of consumer spending habits that makes it unlikely that such spending will return to prior levels for the foreseeable future which in turn may lead to further decreases in our net sales or a material adverse effect on our operating results, financial position and cash flows. Economic conditions have also led to a highly promotional environment and strong discounting pressure from our customers, which have had a negative effect on our revenues and profitability. This promotional environment may continue even after economic growth returns, as we expect that consumer spending trends are likely to remain below historical levels for the foreseeable future.
The price of purchased yarn and other raw materials used by us or our suppliers is prone to significant fluctuations and volatility.
Fluctuations in the price, availability and quality of the fabrics or other raw materials used to manufacture our products could have a material adverse effect on our cost of goods sold or our ability to meet our customers’ demands. The prices for fabrics depend largely on the market prices for the raw materials used to produce them. The price and availability of such raw materials may fluctuate significantly, depending on many factors. At times in the past we have experienced significant upward pressure on each of the foregoing cost inputs, which resulted in pressure on our gross margin. Whenever possible, we pass along these cost increases to our customers through higher selling prices. Should our customers not accept such increases or should they accept them in the first instance, but fail to achieve higher average unit retails thereby increasing their need for margin support from us, our profitability may be materially adversely affected.
The price of energy and fuel costs are prone to significant fluctuations and volatility which could adversely affect our results of operations.
Our manufacturing operations and those of our suppliers require high inputs of energy, and therefore changes in energy prices directly impact our gross profits. In addition, we incur significant shipping and freight costs to transport goods from our offshore facility and suppliers’ offshore facilities to the United States. The cost of energy and fuel fluctuate due to a number of factors outside our control, including government policy and regulation and weather conditions. We continue to focus on manufacturing methods that will reduce the amount of energy used in the production of our products to mitigate risks of fluctuations in the cost of energy. However, significant increases in energy and fuel prices may make us less competitive as compared to others in the industry, which may have a material adverse effect on our results of operations.
We may be restricted in our ability to borrow under our revolving credit facility.
Significant operating losses or significant uses of cash in our operations could cause us to default on our asset-based revolving credit facility. Our ability to borrow under the credit facility depends on our accounts receivable and inventory levels. A significant deterioration in our accounts receivable or inventory levels could restrict our ability to borrow funds. In addition, the credit facility includes customary conditions to funding, representations and warranties, covenants and events of default. The covenants include, among other things, limitations on asset sales, consolidations, mergers, liens, indebtedness, loans, investments, guaranties, acquisitions, dividends, stock repurchases and transactions with affiliates. An event of default under the credit facility could result in an acceleration of our obligations under the agreement, in the foreclosure on any assets subject to liens in favor of the credit facility’s lenders, and in our inability to borrow additional amounts under the credit facility.
We may be unable to realize expected benefits from our restructuring and cost savings plan
In order to operate more efficiently and control costs, we announce from time to time restructuring and cost savings plans, such as our ongoing cost savings plan implemented in 2012, which may include workforce reductions and other cost reduction initiatives. These plans are intended to generate operating expense savings through selling, general and administrative expense reductions as well as other savings. We may undertake further workforce reductions or restructuring actions in the future. These types of cost reduction and restructuring activities are complex. If we do not successfully manage our current restructuring activities, or any other restructuring activities that we may undertake in the future, expected efficiencies and benefits might be delayed or not realized, and our operations and business could be disrupted. Risks associated with these actions include delays in implementation of anticipated workforce reductions, additional unexpected costs and the failure to meet operational targets due to the loss of employees, any of which may impair our ability to achieve anticipated cost reductions or may otherwise harm our business, which could have a material adverse effect on our competitive position, results of operations, cash flows or financial condition.
Item 1B. Unresolved Staff Comments.
Not Applicable.
Item 2. Properties.
We lease our manufacturing facility, administrative offices, operations center, sales offices, sourcing offices, showrooms and a retail store. Rio’s manufacturing facility is located in San Pedro Sula, Honduras. Our sales offices and showrooms are in New York, New York. Our scott james® retail store is in Boston, Massachusetts, and our scott james® outlet store is in Minneapolis, Minnesota. We have administrative offices in Anderson, South Carolina, operations centers in New York, New York and Minneapolis, Minnesota, and sourcing offices in Dongguan, China and Hong Kong. We believe that all of our properties are well maintained and suitable for their intended use, with the exception of our New York office. See Item 3. Legal Proceedings.
Item 3. Legal Proceedings.
New York Office Lease
In July 2007, the Company entered into a lease (the “New York Lease”) for corporate office space located at 114 West 41st Street, New York, NY 10036 (the “New York Office”). As part of the New York Lease, the landlord (“Landlord”) agreed to commence and substantially complete major capital improvements to the common areas of the New York Office by June 2008. After June 2008, if such capital improvements have not been substantially completed, the New York Lease provides, among other things, for a reduction in rent by one half for each day beyond June 30, 2008 that the capital improvements remain incomplete and are not being diligently prosecuted toward completion.
On February 16, 2011, the Company filed a complaint in the Supreme Court, New York County, with respect to the New York Lease. The Company asserted claims against the Landlord of the New York Office and the receiver of such property appointed in connection with a foreclosure action commenced against Landlord by its lender. The complaint sought (i) a judgment declaring (a) that the Company is not in default under the New York Lease and (b) that the rent previously paid by the Company represents the full amount of rent; and (ii) for rescission of the New York Lease as of June 30, 2008 by reason of default by the Landlord with respect to a material provision under the New York Lease requiring prompt completion of major capital improvements of the New York Office’s common areas. The Supreme Court action was dismissed on December 16, 2011 without prejudice to renew the action if complete relief is not afforded in the Civil Court action.
On February 23, 2011, the court appointed Receiver of the subject property commenced a non-payment proceeding in the Civil Court of the City of New York against the Company. The Receiver seeks payment of allegedly past due and unpaid rent and additional rent under the New York Lease. The Company vigorously denies that any rent or additional rent is due and owing under the New York Lease and has moved for an order removing this action to the Supreme Court, New York County, and consolidating it with the previously commenced action described above. The motion for removal and consolidation was denied by the Supreme Court and the matter has been proceeding in Civil Court. The Company has filed its answer, affirmative defenses and counterclaims and has moved for discovery in that action dated June 16, 2011. The motion and subsequent cross-motion were argued before the court on July 18, 2011. On October 5, 2011, that court granted the Company’s motion for discovery. On July 30, 2012 the Civil Court commenced a trial on the matter. The trial was concluded on December 19, 2012 and the respective parties filed post trial briefs and reply briefs with the Court on January 23 and February 5, 2013, respectively. A decision by the trial court is expected during the second quarter of 2013. See Item 8. Financial Statements and Supplementary Data Note 7 – Accrued Expenses and Other Liabilities and Note 13 – Commitments and Contingencies to the audited consolidated financial statements.
The Company is from time to time involved in other litigation incidental to the conduct of its business, none of which is expected to be material to its business, financial condition or operations.
Item 4. Mine Safety Disclosures.
Not applicable.
PART II.
Item 5. Market for Registrant’s Common Equity, Related Stockholder Matters and Issuer Purchases of Equity Securities.
There is currently no established public trading market for our common stock. Our common stock is currently quoted on the OTC Markets under the symbol “HAMP”. The OTC Markets is a centralized quotation service that collects and publishes market maker quotes for over-the-counter securities in real time. Over-the-counter market quotations, like those on the OTC Markets, reflect inter-dealer prices, without retail mark-up, mark-down or commission and may not necessarily represent actual transactions.
As of March 2, 2013, the Company had 37 stockholders of record of our common stock, although we believe there are a significantly larger number of beneficial owners. The following table sets forth the low and high sales prices of shares of our common stock for each of the quarters of 2012 and 2011 as reported by the OTC Markets:
| | | 2012 | | | 2011 | |
| | | Low | | | High | | | Low | | | High | |
| First Quarter | | $ | 2.05 | | | $ | 2.69 | | | $ | 3.35 | | | $ | 5.00 | |
| Second Quarter | | | 1.90 | | | | 3.20 | | | | 3.05 | | | | 4.25 | |
| Third Quarter | | | 2.65 | | | | 3.50 | | | | 2.26 | | | | 3.93 | |
| Fourth Quarter | | | 2.50 | | | | 3.45 | | | | 1.85 | | | | 3.20 | |
The closing stock price on March 2, 2013 was $3.00.
Any determination to pay dividends will be made by our Board and will be dependent upon our financial condition, results of operations, capital requirements and such other factors as our Board may deem relevant. Our revolving credit facility contains restrictive covenants placing limitations on payment of cash dividends. We did not pay dividends on our outstanding stock during the years ended December 31, 2012 and 2011.
On March 31, 2012 and 2011, shares of Hampshire common stock in the amount of 6,518 and 2,881, respectively, were returned to the Hampshire Group, Limited 2009 Stock Incentive Plan which allows employees to satisfy their applicable withholding tax obligations by using shares of common stock that would otherwise be deliverable upon the vesting of the restricted stock.
In connection with the adoption of the Hampshire Group, Limited 2009 Stock Incentive Plan (the “Stock Plan”), the Board authorized 880,000 shares of common stock under the Stock Plan and initially approved grants totaling 862,500 shares, which consisted of grants to certain employees, managers, named executive officers and directors. Ten percent of each award of restricted stock was subject to time-based vesting with the remaining 90% of each award subject to performance-based vesting. During 2012, 459,000 shares of non-vested restricted stock previously granted to certain employees who were participants in the Stock Plan were surrendered for cancellation by such employees pursuant to transactions that, with respect to each such employee, provided that such employee would be granted options to purchase Hampshire Common Stock in consideration for the cancellation of such shares of restricted stock held by it. In connection with such transactions, a total of 331,250 options were granted. In addition, during 2012, certain other employees who were participants in the Stock Plan were granted, in the aggregate, 375,750 options to purchase Hampshire Common Stock. Twenty-five percent (25%) of such options vested and became exercisable on December 31, 2012 and another twenty-five percent (25%) will vest and become exercisable on December 31st of each of 2013, 2014 and 2015, and the options will expire on March 30, 2022.
On October 1, 2012, 10,455 shares of Hampshire common stock were returned to the Company by Heath L. Golden pursuant to a net issuance in connection with the settlement of certain Restricted Stock Units in order to satisfy applicable withholding tax obligations.
See Item 12. Security Ownership of Certain Beneficial Owners and Management and Related Shareholder Matters for information regarding our equity compensation plan.
Item 6. Selected Financial Data.
The following selected consolidated financial data should be read in conjunction with Item 7. Management’s Discussion and Analysis of Financial Condition and Results of Operations and the consolidated financial statements, including the related notes, included herein in Item 8. Financial Statements and Supplementary Data. The selected consolidated financial data under the captions Statement of Operations Data and Balance Sheet Data as of and for the end of each of the years in the five year period ended December 31, 2012 are derived from our consolidated financial statements. The statement of operations data includes results from continuing operations, which excludes the discontinued operations of Hampshire Designers, Item-Eyes, Marisa Christina, Shane Hunter and David Brooks in each year presented. Our historical results are not necessarily indicative of results to be expected in any future period.
| | | Year Ended December 31, | |
| (in thousands, except per share data) | | 2012 | | | 2011 | | | 2010 | | | 2009 | | | 2008 | |
| | | | | | | | | | | | | | | | |
| Statement of Operations Data: | | | | | | | | | | | | | | | |
| Net sales | | $ | 117,560 | | | $ | 86,148 | | | $ | 57,318 | | | $ | 64,820 | | | $ | 69,752 | |
| | | | | | | | | | | | | | | | | | | | | |
| Gross profit | | | 23,454 | | | | 14,560 | | | | 9,879 | | | | 15,030 | | | | 15,147 | |
| Selling, general and administrative expenses | | | 33,965 | | | | 27,977 | | | | 16,871 | | | | 15,910 | | | | 20,337 | |
| Loss on lease obligation | | | — | | | | 6,306 | | | | — | | | | — | | | | — | |
| Restructuring costs | | | 644 | | | | 179 | | | | — | | | | 4,175 | | | | 215 | |
| Goodwill impairment loss | | | — | | | | 1,204 | | | | — | | | | — | | | | — | |
| Special costs | | | — | | | | — | | | | 4,481 | | | | 4,547 | | | | 3,761 | |
| Tender offer related costs | | | — | | | | — | | | | — | | | | 2,053 | | | | 386 | |
| Loss from operations | | $ | (11,155 | ) | | $ | (21,106 | ) | | $ | (11,473 | ) | | $ | (11,655 | ) | | $ | (9,552 | ) |
| Loss from continuing operations | | $ | (12,522 | ) | | $ | (20,301 | ) | | $ | (9,471 | ) | | $ | (5,826 | ) | | $ | (13,134 | ) |
| Basic loss per share from continuing operations | | $ | (1.72 | ) | | $ | (3.41 | ) | | $ | (1.70 | ) | | $ | (1.06 | ) | | $ | (1.91 | ) |
| Diluted loss per share from continuing operations | | $ | (1.72 | ) | | $ | (3.41 | ) | | $ | (1.70 | ) | | $ | (1.06 | ) | | $ | (1.91 | ) |
| Basic weighted average common shares outstanding | | | 7,271 | | | | 5,941 | | | | 5,554 | | | | 5,482 | | | | 6,884 | |
| Diluted weighted average common shares outstanding | | | 7,271 | | | | 5,941 | | | | 5,554 | | | | 5,482 | | | | 6,884 | |
| | | | 2012 | | | | 2011 | | | | 2010 | | | | 2009 | | | | 2008 | |
Balance Sheet Data: | | | | | | | | | | | | | | | | | | | | |
| Cash and short term investments | | $ | 12,500 | | | $ | 25,801 | | | $ | 33,720 | | | $ | 33,365 | | | $ | 35,098 | |
| Restricted cash | | | — | | | | — | | | | 2,725 | | | | — | | | | — | |
Working capital (1) | | | 24,926 | | | | 35,922 | | | | 48,098 | | | | 52,883 | | | | 51,324 | |
Total assets (1) | | | 72,085 | | | | 89,035 | | | | 78,553 | | | | 86,929 | | | | 98,706 | |
| Long-term liabilities | | | 16,277 | | | | 21,588 | | | | 13,948 | | | | 14,656 | | | | 14,076 | |
| Total stockholders’ equity | | | 34,339 | | | | 42,407 | | | | 49,402 | | | | 58,849 | | | | 64,797 | |
| Book value per share outstanding | | | 4.57 | | | | 5.95 | | | | 7.81 | | | | 9.32 | | | | 11.85 | |
(1) Excludes discontinued operations
Item 7. Management’s Discussion and Analysis of Financial Condition and Results of Operations.
The following discussion contains statements that are forward-looking. These statements are based on expectations and assumptions that are subject to risks and uncertainties. Actual results could differ materially because of, among other reasons, factors discussed in the “Safe Harbor” statement on page ii of this report and Item 1A – Risk Factors and elsewhere in this report. The commentary should be read in conjunction with the consolidated financial statements and related notes and other statistical information included in this report.
OVERVIEW
The following is a graphical illustration (it does not represent an actual time period, actual revenues, actual cash balances, etc.) of the historical seasonal nature of our business.
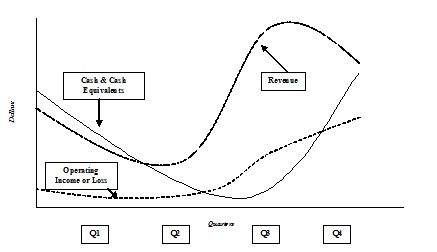
In the past our business was highly seasonal as a result of our product mix including a high concentration of sweaters. Although not as significant as in prior years, our business continues to maintain a fairly high degree of seasonality with approximately 65% of our sales during 2012 occurring in the third and fourth quarters. As a result of such seasonality, inventory begins to rise in the second quarter and typically peaks during the third quarter before descending to its cyclical low in the fourth quarter. Trade receivable balances rise commensurately with sales. Cash balances follow this cycle as inventory is purchased, product is sold and trade receivables are collected. Funding inventory and pending trade receivable collections deplete cash balances and may require draws from our revolving credit facility in the third or fourth quarters. Our income or loss from continuing operations has generally been correlated with revenue, as a large percentage of our profits have historically been generated in the third and fourth fiscal quarters.
Seasonality in 2012 declined as a result of Rio’s more even distribution of sales throughout the year as compared to our other subsidiaries. In 2013 and beyond, we expect this seasonality to decline further as a result of the Dockers® and Panama Jack® licenses which we believe will increase our sales during the spring season.
We are a provider of fashion apparel across a broad range of product categories, channels of distribution and price points. As a holding company, we operate through our wholly-owned subsidiaries, Hampshire Brands, Inc., Rio Garment S.A. and scott james, LLC. We were established in 1976 and are incorporated in the state of Delaware.
Hampshire Brands designs and markets men’s sportswear to department stores, chain stores and mass market retailers under licensed brands, our own proprietary brands and the private labels of our customers. Among others, we offer a full tops assortment under the Dockers® brand and a t-shirt and board short assortment under the Panama Jack® brand, both of which are licensed, as well as private label t-shirt and sweater offerings to retailers under their private labels.
The scott james® brand is a designer apparel collection for men, which includes a full sportswear offering. It is sold primarily through upscale department and specialty stores, scott james® retail shops and online at www.scottjamesonline.com.
Rio, acquired on August 25, 2011, is a Honduras-based apparel manufacturer, designing, sourcing and manufacturing knit tops for men, women and children, which are sold to retailers and distributors, primarily in the United States. Rio’s manufacturing platform primarily supports the vertical specialty store channel. Our manufacturing operations begin with the purchase of fabric and other raw materials from third party suppliers. The fabrics are ultimately sewn into finished garments at our textile facility or at the facilities of third party contractors located in Honduras. Rio also purchases yarn and outsources fabric production to third parties, where upon completion, the fabric returns to the Rio facility for production. Our garments may also be embellished and prepared for retail (with any combination of services, including ticketing, hang tags and hangers).
Our primary strength is our ability to design, develop, source and deliver quality products within a given price range, while providing superior levels of customer service. Our diversification of product lines allows for vertical integration through Rio, multi-category licensing through Hampshire Brands and owned lifestyle ways through scott james®. We have developed international sourcing abilities that permit us to deliver quality merchandise at competitive prices to our customers.
The apparel market is highly competitive. Competition is primarily based on product design, price, quality and service. We face competition from apparel designers, manufacturers, importers, licensors and our own customers’ private label programs, many of which are larger and have greater financial and marketing resources than we have available to us.
The economic environment over the past several years has been challenging and has been characterized by, among other things, restrained consumer spending, weak credit market conditions and inflationary pressures on our cost of goods. In an effort to preserve gross margin dollars in the face of rising costs of goods and stagnant out the door prices, during the past two years we have taken significant steps to reposition our Company for growth and profitability, including:
| ▪ | Disposition of the women’s businesses. In May 2011, we announced a significant shift in our growth strategy with the disposition of our underperforming women’s businesses. The disposition of these businesses allowed us to focus on leveraging our operating platform in the men’s business and actively pursue other strategic opportunities. On May 5, 2011, in connection with this new strategic direction, we sold our women’s businesses, Hampshire Designers and Item-Eyes, in two separate transactions for a total purchase price of $12.3 million plus inventory before consideration of certain transaction costs and assets and liabilities that were not sold. |
| ▪ | Integration of Rio. On August 25, 2011, we reached a significant milestone with the acquisition of Rio. Rio has provided us an opportunity to grow our core business into the fast-growing vertical specialty store channel and has allowed us to leverage our existing operating platforms to expand Rio’s business into the department and chain store channels. Rio has the ability to produce for a variety of apparel categories including performance and fashion. Since completing the acquisition we have augmented Rio’s infrastructure in place to support growth. We are realizing the benefits of our strategy for Rio as we continue to develop a more robust product offering, grow its capacity within its current physical footprint and improve the efficiency of its operations. |
| ▪ | Added Dockers® and Panama Jack® licenses while phasing out legacy licenses with declining sales. We entered into a multi-year licensing agreement with Dockers® for its men’s “good” category tops in the United States. As part of this agreement, we oversee the design, production, sales and distribution of the line, to certain chain and department stores including Kohl’s Department Stores, Inc., J.C. Penney Company, Inc. and Sears Holding Corporation. The woven and knit line includes button down shirts, polos, fleece tops and t-shirts. We believe that these additional categories complement and strengthen the marketability of our Dockers® sweater offering and, taken together, help to ensure we have a compelling international brand to offer to retailers. We also entered into a licensing agreement with Panama Jack® to provide a new line of lifestyle apparel for men, including a full tops and board short assortment. The Dockers® and Panama Jack® licenses are well-recognized growing brands that have allowed us to phase out legacy licenses with declining sales. |
| ▪ | Broadening and diversifying our customer base. We remain focused on exploring opportunities to grow our sales and expand our retail relationships. We continued through 2012 to build brand recognition and market presence, as demonstrated by a new customer relationship with Bloomingdale’s. Further, we have begun new customer relationships with Wal-Mart and Kmart through our Panama Jack business. |
| ▪ | Restructuring and cost savings plan. In 2012, we implemented a cost savings plan, primarily through workforce reduction, that has allowed us to operate our business more efficiently and reduce costs. |
| ▪ | Reorganization plan. On January 15, 2013 Heath L. Golden resigned as chief executive officer of the Company. At the time of the resignation the Board of Directors of the Company (the “Board”) appointed Paul Buxbaum to serve as the Company’s new chief executive officer. Additionally, on January 28, 2013, the Company entered into an agreement with Buxbaum Group to provide certain restructuring and advisory consulting services. Pursuant to the agreement, Buxbaum Group is tasked with providing specific recommendations to the Board concerning the organization, operations and expenses to better support the Company’s business model and sales levels. Additionally under the agreement, Buxbaum Group is responsible for the implementation of such recommendations to the extent adopted by the Board. |
Stock and Compensation Plans
The Hampshire Group, Limited 2009 Stock Incentive Plan (the “Stock Plan”) is designed to assist us in attracting, retaining, motivating and rewarding key employees, officers, directors and consultants, and promoting the creation of long term value for stockholders of the Company by closely aligning the interests of these individuals with those of our stockholders. The Stock Plan permits us to award eligible persons nonqualified stock options, restricted stock and other stock-based awards. In connection with the adoption of the Stock Plan, the Board authorized 880,000 shares of common stock under the Stock Plan and initially approved grants totaling 862,500 shares, which consisted of grants to certain employees, managers, named executive officers and directors. Ten percent of each award of restricted stock was subject to time-based vesting with the remaining 90% of each award subject to performance-based vesting. During 2012, 459,000 shares of non-vested restricted stock previously granted to certain employees who were participants in the Stock Plan were surrendered for cancellation by such employees pursuant to transactions that, with respect to each such employee, provided that such employee would be granted options to purchase Hampshire Common Stock in consideration for the cancellation of such shares of restricted stock held by it. In connection with such transactions, a total of 331,250 options were granted. In addition, during 2012, certain other employees who were participants in the Stock Plan were granted, in the aggregate, 375,750 options to purchase Hampshire Common Stock. Twenty-five percent (25%) of such options vested and became exercisable on December 31, 2012 and another twenty-five percent (25%) will vest and become exercisable on December 31st of each of 2013, 2014 and 2015, and the options will expire on March 30, 2022. See Item 12. Security Ownership of Certain Beneficial Owners and Management and Related Shareholder Matters for information regarding our equity compensation plan.
Separate from the Stock Plan, we granted to our previous chief executive officer 100,000 stock options (the “Options”) and 100,000 restricted stock units (“RSUs”), each on May 2, 2011, and 150,000 restricted shares of Hampshire Common Stock (the “Restricted Stock”) on August 25, 2011. The Options expire ten years from the grant date and vest ratably over two years following the grant date. One-third of the Options were unvested as of December 31, 2012. Each RSU represents the right to receive one share of the Company’s common stock upon settlement. The RSUs vest and settle ratably over two years following the grant date. One-third of the RSUs were unvested as of December 31, 2012. The shares of Restricted Stock vest ratably over two years following the grant date. As of December 31, 2012, 50,000 shares of Restricted Stock were unvested. Each of these stock awards were subject to the chief executive officer’s continued service through the applicable vesting dates. As a result of the resignation of our previous chief executive officer on January 15, 2013, all of the remaining unvested Options, RSUs, and Restricted Stock were forfeited at that time.
In addition, we adopted the Hampshire Group, Limited 2010 Cash Incentive Bonus Plan (the “Bonus Plan”) pursuant to which we will grant annual performance-based bonuses to certain employees, managers and named executive officers. The goal of the Bonus Plan is to align the annual interests of our management and other key employees with those of the Company and our stockholders by providing a cash bonus incentive for meeting annual goals set by the Board. Target bonus amounts under the Bonus Plan will be a percentage of each participant’s base salary and actual bonus amounts paid under the Bonus Plan will depend on the extent to which annual performance metrics are achieved.
See Item 8. Financial Statements and Supplementary Data Note 15 – Stock Plans, Compensation Plans and Retirement Savings Plan to the audited consolidated financial statements for additional discussion of these events.
Acquisition of Rio
On August 25, 2011, we acquired Rio by way of a merger for an aggregate purchase price of approximately $21.6 million (the “Merger”). Upon closing, we paid the former Rio equity holders a total of $7.0 million in cash, $3.5 million of which was deposited into an escrow account pending certain adjustments. We also paid in cash certain liabilities of Rio totaling approximately $5.9 million. We financed the cash portion of the acquisition with cash on hand. Of the $3.5 million deposited into the escrow account, we subsequently released $3.1 million to the equity holders with the remaining approximately $0.4 million released back to us pursuant to the terms of the merger agreement. Additionally, we issued to the former Rio equity holders an aggregate of $2.6 million in Hampshire common stock, par value, $0.10, and held back an additional $6.5 million of Hampshire common stock, par value, $0.10, (1,781,798 shares) for potential post-closing purchase price adjustments and indemnification claims. Of the $6.5 million that was held back, we have subsequently released to the equity holders approximately $3.0 million in Hampshire common stock during 2012. See Item 8. Financial Statements and Supplementary Data Note 2 – Acquisitions to the audited consolidated financial statements for additional discussion of this event.
Discontinued Operations
We continually review our portfolio of labels, business lines and divisions to evaluate whether they meet profitability and performance requirements and are in line with our business focus. As a part of this review, we disposed and discontinued operations of certain divisions as outlined below.
On May 5, 2011, we completed the sale of our women’s businesses in two separate transactions to LF USA Inc., a subsidiary of Hong Kong-headquartered multinational Li & Fung Limited, and KBL Group International Ltd., for a total purchase price of $12.3 million plus the value of the inventory being sold in the transaction. As part of the agreements, LF USA Inc. acquired our Hampshire Designers business, whose brands include Designers Originals®, Mercer Street Studio® and Hampshire Studio®. KBL Group International Ltd. acquired our Item-Eyes business, whose brands include Requirements® and RQT®.
As a part of the transactions, we sold the related inventory, as well as customer and production purchase orders and certain other assets. Further, severance costs resulting from the transactions were approximately $0.9 million. In both cases, we retained ownership of our accounts receivable relating to the shipments prior to the closing date. Excluding production purchase orders, liabilities incurred prior to the sale remained with us. Net of severance and transaction costs, among other things, we recognized a $11.8 million gain on the sale of the women’s businesses.
In accordance with accounting principles generally accepted in the United States (“GAAP”), our consolidated financial statements reflect discontinued operations separately on the results of operations and financial position. For the year ended December 31, 2012, we had income from discontinued operations, net of taxes, of $0.8 million compared to income from discontinued operations of $10.3 million for the year ended December 31, 2011. See Item 8. Financial Statements and Supplementary Data Note 17 – Dispositions and Discontinued Operations to the audited consolidated financial statements for additional discussion of these events.
RESULTS OF CONTINUING OPERATIONS
Years ended December 31, 2012 and 2011
Net Sales
Net sales increased by 36.5% to $117.6 million in 2012 from $86.1 million in 2011. The reconciliation of net sales is outlined in the table below:
| | | Annual Rate/Volume | |
| (In thousands) | | Dollars | | Percentage of 2011 | |
| Net sales for the year ended December 31, 2011 | | $ | 86,148 | | 100.0% | |
| Volume | | | 65,956 | | 76.6% | |
| Average selling prices | | (34,544 | ) | (40.1%) | |
| Net sales for the year ended December 31, 2012 | | $ | 117,560 | | 136.5% | |
The $31.5 million increase in net sales over the prior year was primarily a result of the inclusion of a full year of Rio’s net sales for the year ended December 31, 2012, which accounted for an increase in net sales of $37.6 million. This was offset by a decrease in net sales of Hampshire Brands of $9.0 million compared to the prior year due to lower volume primarily associated with the winddown of the JOE Joseph Abboud® licensing agreement. Rio also sells a higher volume of units at a lower price point than Hampshire Brands which has contributed to the significant increase in volume over the prior year. We believe that continued growth at Rio and the Dockers® and Panama Jack® licensing arrangements for Hampshire Brands will have an accretive impact to our net sales in 2013.
Gross Profit
Gross profit for 2012 was $23.5 million compared with $14.6 million for the prior year, which, as a percentage of net sales, represented an increase from 16.9% to 20.0%. The 2012 improvement in gross profit over 2011 was primarily due to the current year including a full year of operations for Rio. In addition cost of goods sold increased to $94.1 million for the year ended December 31, 2012 from $71.6 million for the year ended December 31, 2011 primarily due to the acquisition of Rio. The increase in cost of goods sold as a result of Rio was $28.7 million which was somewhat offset by a volume driven decrease in cost of goods sold for Hampshire Brands of $5.5 million. We expect that increases in volume at Rio and the new licensing arrangements at Hampshire Brands will contribute to increasing gross profit in 2013.
Selling, General and Administrative Expenses
Selling, general and administrative expenses for the year ended December 31, 2012 were $34.0 million compared with $28.0 million for the year ended December 31, 2011, which as a percentage of net sales represented a decrease from 32.5% to 28.9%. The decrease as a percentage of net sales is due to a combination of factors including increased sales volume as compared to fixed expenses and overall reductions in expense as a result of cost savings measures we have implemented.
Restructuring Costs
During the current year we announced a cost savings plan primarily related to a workforce reduction. We incurred approximately $0.6 million in severance costs for the year ended December 31, 2012. We expect that cost savings measures already implemented will result in annualized savings of $2.2 million in compensation costs. Additionally, during 2013 we have been and will continue to work with Buxbaum Group to develop and implement an overall plan to restructure the organization, operations and expenses to better support our Company’s business model and sales levels.
Loss on Lease Obligation
In November 2011, Hampshire employees and office equipment were completely vacated from two of the five floors leased at the New York office. GAAP requires that the fair value of the liability for costs that will continue to be incurred under an operating lease for its remaining term without economic benefit to the entity shall be recognized at the cease-use date based on the remaining lease rentals, adjusted for the effects of any prepaid or deferred items recognized under the lease, and reduced by estimated sublease rentals that could be reasonably obtained for the property, even if the entity does not intend to enter into a sublease. We recorded a loss on lease charge of $6.3 million during the fourth quarter of 2011, net of the release of deferred rent attributable to the vacant space. See Item 8. Financial Statements and Supplementary Data Note 9 – Loss on Lease Obligations.
Goodwill Impairment Loss
Goodwill is tested for impairment at least on an annual basis and otherwise when warranted. The impairment test involves a comparison of the fair value of its reporting unit as defined under GAAP to carrying amounts. If the reporting unit’s aggregated carrying amount exceeds its fair value, then an indication exists that the reporting unit’s goodwill may be impaired. The impairment to be recognized is measured by the amount by which the carrying value of the reporting unit being measured exceeds its fair value, up to the total amount of its net assets. Based upon tests performed, we recorded an impairment charge of $1.2 million in connection with the goodwill related to scott james® during the second quarter of 2011. We have also evaluated the carrying value of goodwill as of December 31, 2012 and have determined that no impairment of goodwill was necessary. See Critical Accounting Policies and Estimates and Item 8. Financial Statements and Supplementary Data Note 6 – Goodwill and Intangible Assets and Note 14 – Fair Value Measurements.
Income Taxes
Our income tax expense for the year ended December 31, 2012 of $1.0 million was due to (i) the accrual of interest and penalties on income tax reserves, partially offset by the recognition of tax benefits associated with the expiration of certain statutes of limitations, (ii) foreign income taxes (iii) and minimum state and local income taxes.
Our income tax benefit for the year ended December 31, 2011 of $1.0 million was mostly due to the recognition of tax benefits associated with the expiration of certain statutes of limitations that were partially offset by the accrual of additional interest and penalties on remaining income tax reserves. See Item 8. Financial Statements and Supplementary Data Note 12 – Income Taxes.
INFLATION
We are subject to increased prices for the products we source due to both inflation and exchange rate fluctuations. We have historically managed to lessen the impact of inflation by achieving sourcing efficiencies, controlling costs in other parts of our operations and, when necessary, passing along a portion of our cost increases to our customers through higher selling prices. We confront increasing inflationary pressures in our cost of goods, including those caused by rising costs in transportation, labor and materials. If these costs continue to rise at rates higher than those we have historically experienced, there can be no assurance that we will be successful in passing a sufficient portion of such increases onto our customers to preserve our gross profit.
LIQUIDITY AND CAPITAL RESOURCES
Our primary liquidity and capital requirements are to fund working capital for current operations, consisting of funding the seasonal buildup in inventories and accounts receivable and funding markdown allowances. During the current year we have expanded the conversion cycle in our manufacturing processes and have more working capital in raw materials inventory. Due to the seasonality of our business, cash used in operations typically exceeds cash provided by operations during the first nine months of the year, and as such borrowing under our revolving credit facility, if any, will generally occur during the third and fourth quarters of the year. Our primary sources of funds to meet our liquidity and capital requirements include cash on hand, funds generated from operations and borrowings under our revolving credit facility.
On October 28, 2010, we entered into a credit agreement (referred to as the “Credit Facility”) with Wells Fargo Capital Finance, LLC (“WFCF”), which replaced our prior facility in its entirety.
On August 15, 2011, we entered into a First Amendment to Credit Agreement and Consent (the “Amendment and Consent”) with WFCF. Pursuant to the Amendment and Consent, WFCF, as agent under the Credit Facility consented to the Merger and also waived certain defaults that would otherwise have arisen under the Credit Facility as a result of the Merger.
On April 30, 2012, we entered into a second amendment to our credit agreement with WFCF to properly align our Credit Facility with our business model going forward (the “Second Amendment”). The Second Amendment provides for, among other things, amendments to the fixed charge coverage ratio and liquidity covenants, and the inclusion of certain accounts receivable in the calculation of the borrowing base under the Credit Facility. The Second Amendment also provides for an increase in the amount of intercompany advances that are permitted under the Credit Facility.
The Credit Facility is a $50.0 million asset based revolving credit facility, including trade and standby letters of credit, with a $30.0 million sub-limit for letters of credit. The Credit Facility has a term of four years, matures on October 28, 2014, and is secured by substantially all assets of the Company and each of its domestic subsidiaries with the exception of internationally held inventory. Revolving credit loans are limited to a borrowing base, which considers cash deposited into a restricted account, eligible accounts receivable and eligible inventory. The Credit Facility contains customary conditions precedent to each borrowing, including absence of defaults and accuracy of representation and warranties. The Credit Facility contains customary affirmative and negative covenants which include a fixed charge coverage covenant that takes effect only when and so long as we do not meet minimum liquidity and availability requirements that adjust based on the seasonality of our business. The Credit Facility is designed to provide working capital and letters of credit that will be used primarily for the purchase and importation of inventory and for general corporate purposes.
We, at our discretion, may prepay outstanding principal, in whole or part, at any time. The Credit Facility requires prepayment of outstanding obligations and accrued interest upon certain events, including in the event the amount outstanding under the Credit Facility exceeds the borrowing base. The Credit Facility also contains customary provisions that enable WFCF to accelerate payment of outstanding obligations under the Credit Facility upon certain events, including, among others, non-payment of amounts due under the Credit Facility, breach of the fixed charge coverage ratio (which is applicable only so long as we do not meet minimum liquidity and availability requirements), insolvency, bankruptcy, a change of control of the Company and failure to perfect certain liens on the collateral securing the obligations under the Credit Facility. We were in compliance with all covenants related to the Credit Facility as of December 31, 2012.
At December 31, 2012, there were no outstanding borrowings under the Credit Facility with approximately $3.1 million of availability and approximately $12.5 million of cash and cash equivalents that was not included in the availability calculation. The highest level of borrowings outstanding during 2012 was approximately $17.9 million. At December 31, 2012, letters of credit outstanding were approximately $8.3 million as compared to $4.7 million at December 31, 2011, an increase that is primarily the result of an anticipated increase in spring 2013 deliveries. The highest balance of letters of credit outstanding during the year ended December 31, 2012 was approximately $11.2 million attained during June 2012, with an average balance outstanding for the year of $7.8 million.
We, in the normal course of business, issue binding purchase orders to secure product for future sales to our customers. At December 31, 2012, these open purchase orders amounted to approximately $12.3 million, of which approximately $6.3 million were covered by open letters of credit. The majority of the purchases made pursuant to open letters of credit will be received during the first six months of 2013. In addition, there were standby letters of credit for approximately $2.0 million related to other matters.
We believe that our cash on hand, borrowings available to us under the Credit Facility and cash flow from operations will provide adequate resources to meet our capital requirements and operational needs for the next twelve months.
CONTRACTUAL OBLIGATIONS
Future contractual obligations related to long-term debt, deferred compensation, non-cancelable operating leases, minimum royalty payments and other obligations at December 31, 2012 were as follows:
Payments Due By Period
| (in thousands) | | Total | | | Less than 1 Year | | | 1 – 3 Years | | | 3 – 5 Years | | | After 5 Years | |
| Operating leases | | $ | 50,597 | | | $ | 5,628 | | | $ | 9,926 | | | $ | 10,333 | | | $ | 24,710 | |
| Royalty payments | | | 7,917 | | | | 1,990 | | | | 2,712 | | | | 3,215 | | | | - | |
| Standby letters of credit | | | 2,000 | | | | 2,000 | | | | - | | | | - | | | | - | |
| Open purchase orders | | | 12,261 | | | | 12,261 | | | | - | | | | - | | | | - | |
| Other commitments | | | 22 | | | | 14 | | | | 8 | | | | - | | | | - | |
Total (1) | | $ | 72,797 | | | $ | 21,893 | | | $ | 12,646 | | | $ | 13,548 | | | $ | 24,710 | |
(1) Contingent obligations such as those relating to uncertain tax positions generally do not have specific payment dates and accordingly have been excluded from the above table. We believe that within the next 12 months it is reasonably possible that we could pay an amount less than $0.1 million related to uncertain tax positions, which includes an estimate for interest and penalties.
Net cash used in continuing operating activities was $12.4 million for both years ended December 31, 2012 and 2011. There was an overall decrease in the net change of operating assets and liabilities of approximately $2.6 million which was offset by a decrease in loss from continuing operations after adjustments for non-cash reconciling items.
Net cash used in continuing investing activities was approximately $0.8 million for the year ended December 31, 2012, as compared to net cash provided by continuing investing activities of $2.3 million in 2011. The 2012 activity was related to capital expenditures whereas the 2011 activity primarily reflects the disposition of the women’s businesses in May 2011 and the acquisition of Rio in August 2011. See Item 8. Financial Statements and Supplementary Data Note 2 – Acquisitions and Note – 17 Dispositions and Discontinued Operations.
Net cash used in continuing financing activities in the year ended December 31, 2012 was $0.1 million and primarily reflects the purchases of treasury stock and repayment of long-term debt. Additionally, approximately $2.7 million of cash was restricted temporarily during 2012 to collateralize letters of credit in accordance with our Credit Facility. During the year ended December 31, 2011, net cash provided by continuing financing activities was approximately $2.7 million which primarily reflected a decrease in cash collateralized with our previous issuing bank that was used to pay the related letters of credit as needed. In addition, approximately $8.1 million and $4.6 million of cash were restricted temporarily during 2011 in connection with the acquisition of Rio and to collateralize letters of credit in accordance with our Credit Facility, respectively. See Item 8. Financial Statements and Supplementary Data Note 10 - Borrowings.
We spent $0.8 million on capital expenditures during 2012, primarily for computer equipment and software for our reporting and operating infrastructure as well as leasehold improvements at our leased facilities. We currently are considering the implementation of an enterprise resource planning system to continue to support our infrastructure.
OFF-BALANCE SHEET ARRANGEMENTS
We utilize letters of credit and are a party to operating leases. It is currently not our business practice to have material relationships with unconsolidated entities or financial partnerships, such as entities often referred to as structured finance or special purpose entities, which would have been established for the purpose of facilitating off-balance sheet arrangements.
CRITICAL ACCOUNTING POLICIES AND ESTIMATES
The preparation of financial statements requires us to make estimates and judgments that affect the reported amounts of assets, liabilities, revenues and expenses and related disclosure of contingent assets and liabilities. On an ongoing basis, we evaluate our estimates, including those related to allowances for markdowns, customer returns and adjustments, doubtful accounts, inventory reserves, discontinued operations and income taxes. We base our estimates on historical information and experience and on various other assumptions that we believe to be reasonable under the circumstances, the results of which form a basis for making judgments about the carrying value of assets and liabilities that are not readily apparent from other sources. Actual results may differ from these estimates because of conditions, which differ from those assumed.
The following critical accounting policies relate to the more significant judgments and estimates used in the preparation of the consolidated financial statements:
Revenue Recognition
Revenues from product sales are recognized when ownership is transferred to the customer, which includes not only the passage of title, but also the transfer of the risk of loss related to the product. At this point, the sales price is fixed and determinable, and we are reasonably assured of the collectability of the sale. The majority of Rio’s sales are shipped FOB destination point and revenue is recognized when the goods are received by the customer. The majority of Hampshire Brand’s sales are shipped FOB shipping point and revenue is recognized when the customer picks up the goods from our third party warehouse. Shipping and handling charges billed to our customers are not included in net sales as the related costs are included in selling, general and administrative expenses. Revenues are reported on a net sales basis, which is computed by deducting product returns, discounts and estimated returns and allowances. We estimate returns and allowances on an ongoing basis by considering historical and current trends.
Income Taxes
We account for income taxes under the asset and liability method. We recognize deferred income taxes, net of valuation allowances, for the estimated future tax effects of temporary differences between the financial statement carrying amounts of existing assets and liabilities and their tax basis and net operating loss carryforwards. Deferred tax assets and liabilities are measured using enacted tax rates expected to apply to taxable income in the years in which those temporary differences are expected to be recovered or settled. The effect on deferred tax assets and liabilities of a change in tax rates is recognized in income in the period that includes the enactment date.
We evaluate the realizability of deferred tax assets on a regular basis for each taxable jurisdiction. In making this assessment, we consider whether it is more likely than not that some portion or all of deferred tax assets will not be realized. The ultimate realization of deferred tax assets is dependent upon the generation of future taxable income during the periods in which those temporary differences become deductible. We consider all available evidence, both positive and negative, in making this assessment.
If we determine that we expect to realize deferred tax assets in excess of the recorded net amounts, a reduction in the deferred tax asset valuation allowance would decrease income tax expense in the period such determination is made. Alternatively, if we determine that we no longer expect to realize a portion of our net deferred tax assets, an increase in the deferred tax asset valuation allowance would increase income tax expense in the period such determination is made.
We assess our income tax positions and record tax benefits for all years subject to examination based upon our evaluation of the facts, circumstances and information available at the reporting date. For those tax positions where it is more likely than not that a tax benefit will be sustained, we have recorded the largest amount of tax benefit that may potentially be realized upon ultimate settlement with a taxing authority that has full knowledge of all relevant information. For those income tax positions where it is not more likely than not that a tax benefit will be sustained, no tax benefit has been recognized in the financial statements.
Intangible Assets
We recorded goodwill and intangibles with definite lives, including customer relationships and non-compete agreements, in conjunction with the acquisition of Rio. These intangible assets are amortized based on their estimated economic lives. Goodwill represents the excess of the purchase price over the fair value of net identified tangible and intangible assets and liabilities acquired, and is not amortized.
GAAP requires us to perform an impairment test of goodwill on an annual basis or whenever events or circumstances make it more likely than not that impairment of goodwill may have occurred. As part of the annual impairment test, we first have the option to make a qualitative assessment of goodwill for impairment. If we are able to determine through the qualitative assessment that the fair value of a reporting unit more likely than not exceeds its carrying value, no further evaluation is necessary. For those reporting units for which the qualitative assessment is either not performed or indicates that further testing may be necessary, we then assess goodwill for impairment using a two-step process. The first step requires comparing the fair value of the reporting unit with its carrying amount, including goodwill. If that fair value exceeds the carrying amount, the second step of the process is not required to be performed, and no impairment charge is required to be recorded. If that fair value does not exceed that carrying amount, we must perform the second step, which requires an allocation of the fair value of the reporting unit to all assets and liabilities of that unit as if the reporting unit had been acquired in a purchase business combination and the fair value of the reporting unit was the purchase price. The goodwill resulting from that purchase price allocation is then compared to the carrying amount with any excess recorded as an impairment charge.
We also review intangible assets with definite lives for impairment whenever events or circumstances indicate that the carrying amount may not be recoverable. If the sum of the expected undiscounted cash flows is less than the carrying value of the related asset, a loss is recognized for the difference between the fair value and carrying value of the intangible asset.
We conducted our annual impairment analysis of goodwill on December 31, 2012, and based on our analysis, no impairment of goodwill was necessary during 2012. We also noted no events or circumstances during 2012 indicating that the carrying value of intangible assets with definite lives was not recoverable, and as such no impairment of intangible assets was recorded during 2012.
Allowances for Customer Returns and Adjustments
We reserve for customer returns, trade discounts, advertising allowances, customer chargebacks and for sales and markdown allowances granted to customers at the end of selling seasons, which enable customers to markdown the retail sales prices on closeout products. The estimates for these allowances and discounts are based on a number of factors, including: (a) historical experience, (b) industry trends and (c) specific agreements or negotiated amounts with customers.
Further, while we believe that we have negotiated all substantial sales and markdown allowances with our customers for the season recently completed, additional allowances for the spring season are anticipated and have been provided for goods shipped prior to year end and others may be requested by customers for the concluded seasons. Likewise, should the performance of our products at retail establishments exceed our historical performance levels and result in favorable settlements of previously reserved amounts, we may reduce our recorded allowances.
Inventory Reserves
We analyze out of season merchandise to determine reserves, if any, that may be required to reduce the carrying value to net realizable value. Additionally, we provide reserves for current season merchandise whose carrying value is expected, based on historical experience, to exceed our net realizable value. Factors considered in evaluating the requirement for reserves include product styling, color, current fashion trends and quantities on hand. Some of our products are "classics" and remain saleable from one season to the next, and therefore, generally, no reserves are required on these products. Rio recognizes reserves on finished goods which are not considered to be first quality. An estimate is made of the market value, less expense to dispose, of products whose value is determined to be impaired. If these products are ultimately sold at less than estimated amounts, additional losses will be recorded. Likewise, if these products are sold for more than estimated amounts, reserves and related losses may be reduced.
Other Operating Lease Obligations
We recognize a liability for costs to terminate an operating lease obligation before the end of its term if we no longer derive an economic benefit from the lease. The liability is recognized and measured at its fair value when we determine that the cease use date has occurred and the fair value of the liability is determined based on the remaining lease rentals due, reduced by estimated sublease rental income that could be reasonably obtained for the property. The estimate of subsequent sublease rental income may change and require future changes to the fair value of the liabilities for the lease obligations.
Commitments and Contingencies
Under GAAP we are required to establish reserves for loss contingencies when it is probable and we can reasonably estimate its financial impact. We are required to assess the likelihood of material adverse judgments or outcomes as well as potential ranges or probability of losses. We determine the amount of reserves required, if any, for contingencies after carefully analyzing each individual item. We do not recognize gain contingencies until the contingency is resolved. We recognize liabilities for contingencies and commitments when a loss is probable and estimable. Given the nature of contingencies, the required reserves may change due to new developments in each issue.
The Company is currently a party in a trial in the Civil Court of the City of New York regarding the Company’s lease for corporate office space located at 114 West 41st Street, New York, NY 10036. See Item 8. Financial Statements and Supplementary Data Note 7 – Accrued Expenses and Other Liabilities and Note 13 – Commitments and Contingencies to the audited consolidated financial statements.
Discontinued Operations
We have reclassified from continuing operations the results of operations and financial position of the Hampshire Designers and Item-Eyes divisions separately as discontinued operations.
RECENT ACCOUNTING PRONOUNCEMENTS
In September 2011, the Financial Accounting Standards Board issued Accounting Standard Update (“ASU”) 2011-08, Intangibles-Goodwill and Other (Topic 350) Testing Goodwill for Impairment (“ASU 2011-08”). ASU 2011-08 gives entities testing goodwill for impairment the option of performing a qualitative assessment before calculating the fair value of a reporting unit in step 1 of the goodwill impairment test. For those entities that determine, on the basis of qualitative factors, that the fair value of a reporting unit is more likely than not less than the carrying amount, an entity is required to perform step 2 of the goodwill impairment test. ASU 2011-08 is effective for fiscal years, and interim periods within those years, beginning after December 15, 2011. ASU 2011-08 was effective for the Company’s fiscal year ending December 31, 2012, and the adoption did not have an impact to the Company’s consolidated financial statements.
Item 7A. Quantitative and Qualitative Disclosures About Market Risk.
Market risk represents the risk of loss that may affect the financial position, results of operations or cash flows of the Company due to adverse changes in financial and product market prices and rates. We are exposed to market risk in the area of changing interest rates. We are also exposed to market risk due to increased costs of our products.
Our borrowings under the Credit Facility have variable rates based on, at our option, the prime interest rate of the lending institution, or the LIBOR rate. The impact of a hypothetical 100 basis point increase in interest rates on our variable rate debt (borrowings under the revolving Credit Facility and prior credit facility) would have been minimal in 2012 and 2011 due to the short-term nature of borrowings under our credit facility during these periods.
In purchasing apparel in international markets, we initiate production orders that require the payment of U.S. dollars. Prices are fixed in U.S. dollars at the time the Company submits an order to a vendor; therefore, we do not have any reason to engage in derivative financial instruments to mitigate these market risks.
Item 8. Financial Statements and Supplementary Data.
(a) Audited Financial Statements
REPORT OF INDEPENDENT REGISTERED PUBLIC ACCOUNTING FIRM
Board of Directors and Stockholders
Hampshire Group, Limited
New York, New York
We have audited the accompanying consolidated balance sheet of Hampshire Group, Limited and Subsidiaries (the “Company”) as of December 31, 2012 and the related consolidated statements of operations, stockholders’ equity, and cash flows for the year then ended. In connection with our audit of the financial statements, we have also audited the financial statement schedule listed in the accompanying index. These financial statements and schedule are the responsibility of the Company’s management. Our responsibility is to express an opinion on these financial statements and schedule based on our audit.
We conducted our audit in accordance with the standards of the Public Company Accounting Oversight Board (United States). Those standards require that we plan and perform the audit to obtain reasonable assurance about whether the financial statements are free of material misstatement. The Company is not required to have, nor were we engaged to perform, an audit of its internal control over financial reporting. Our audit included consideration of internal control over financial reporting as a basis for designing audit procedures that are appropriate in the circumstances, but not for the purpose of expressing an opinion on the effectiveness of the Company’s internal control over financial reporting. Accordingly, we express no such opinion. An audit also includes examining, on a test basis, evidence supporting the amounts and disclosures in the financial statements, assessing the accounting principles used and significant estimates made by management, as well as evaluating the overall presentation of the financial statements and schedule. We believe that our audit provides a reasonable basis for our opinion.
In our opinion, the consolidated financial statements referred to above present fairly, in all material respects, the financial position of Hampshire Group, Limited and Subsidiaries at December 31, 2012, and the results of their operations and their cash flows for the year then ended, in conformity with accounting principles generally accepted in the United States of America.
Also, in our opinion, the financial statement schedule, when considered in relation to the basic consolidated financial statements taken as a whole, presents fairly, in all material respects, the information set forth therein.
| | /s/ Elliott Davis, LLC | |
| | Elliott Davis, LLC | |
| | | |
| | | |
Greenville, South Carolina
March 18, 2013
REPORT OF INDEPENDENT REGISTERED PUBLIC ACCOUNTING FIRM
Board of Directors and Stockholders
Hampshire Group, Limited
New York, New York
We have audited the accompanying consolidated balance sheet of Hampshire Group, Limited and Subsidiaries (the “Company”) as of December 31, 2011 and the related consolidated statements of operations, stockholders’ equity, and cash flows for the year then ended. In connection with our audit of the financial statements, we have also audited the 2011 financial statement schedule listed in the accompanying index. These financial statements and schedule are the responsibility of the Company’s management. Our responsibility is to express an opinion on these financial statements and schedule based on our audit.
We conducted our audit in accordance with the standards of the Public Company Accounting Oversight Board (United States). Those standards require that we plan and perform the audit to obtain reasonable assurance about whether the financial statements are free of material misstatement. The Company is not required to have, nor were we engaged to perform, an audit of its internal control over financial reporting. Our audit included consideration of internal control over financial reporting as a basis for designing audit procedures that are appropriate in the circumstances, but not for the purpose of expressing an opinion on the effectiveness of the Company’s internal control over financial reporting. Accordingly, we express no such opinion. An audit also includes examining, on a test basis, evidence supporting the amounts and disclosures in the financial statements, assessing the accounting principles used and significant estimates made by management, as well as evaluating the overall presentation of the financial statements and schedule. We believe that our audit provides a reasonable basis for our opinion.
In our opinion, the consolidated financial statements referred to above present fairly, in all material respects, the financial position of Hampshire Group, Limited and Subsidiaries at December 31, 2011, and the results of their operations and their cash flows for the year then ended, in conformity with accounting principles generally accepted in the United States of America.
As discussed in Note 1 to the consolidated financial statements, the Company has applied the effect of a reclassification adjustment between retained earnings and additional paid-in capital to the consolidated financial statements for the year ended December 31, 2011. As discussed in Note 2 to the financial statements, the Company has applied the effect of a retrospective adjustment related to purchase accounting to the consolidated financial statements for the year ended December 31, 2011.
Also, in our opinion, the financial statement schedule, when considered in relation to the basic consolidated financial statements taken as a whole, present fairly, in all material respects, the information set forth therein.
| | /s/ BDO USA, LLP | |
| | BDO USA, LLP | |
Charlotte, North Carolina
March 19, 2012, except as to Notes 1 and 2 to the consolidated financial statements, as to
which the date is March 18, 2013
Hampshire Group, Limited and Subsidiaries
Consolidated Balance Sheets
December 31, 2012 and 2011
| (In thousands, except par value and shares) | | 2012 | | | 2011 | |
| Current assets: | | | | | | |
| Cash and cash equivalents | | $ | 12,500 | | | $ | 25,801 | |
| Accounts receivable, net | | | 8,134 | | | | 13,150 | |
| Other receivables | | | 338 | | | | 823 | |
| Inventories, net | | | 22,194 | | | | 18,591 | |
| Other current assets | | | 3,132 | | | | 1,701 | |
| Assets of discontinued operations | | | 123 | | | | 174 | |
| Total current assets | | | 46,421 | | | | 60,240 | |
| Fixed assets, net | | | 7,967 | | | | 9,203 | |
| Goodwill | | | 2,559 | | | | 2,559 | |
| Intangible assets, net | | | 14,624 | | | | 16,161 | |
| Other assets | | | 637 | | | | 1,046 | |
| Total assets | | $ | 72,208 | | | $ | 89,209 | |
| | | | | | | | | |
| | | | | | | | | |
| Current liabilities: | | | | | | | | |
| Current portion of long-term debt | | $ | — | | | $ | 36 | |
| Accounts payable | | | 5,741 | | | | 11,534 | |
| Accrued expenses and other liabilities | | | 15,631 | | | | 12,574 | |
| Liabilities of discontinued operations | | | 220 | | | | 1,070 | |
| Total current liabilities | | | 21,592 | | | | 25,214 | |
| Long-term debt less current portion | | | — | | | | 5 | |
| Other long-term liabilities | | | 16,277 | | | | 21,583 | |
| Total liabilities | | | 37,869 | | | | 46,802 | |
| | | | | | | | | |
| Commitments and contingencies – Note 13 | | | | | | | | |
| | | | | | | | | |
| Stockholders’ equity: | | | | | | | | |
| Preferred stock, $0.10 par value, 1,000,000 shares authorized; none issued | | | — | | | | — | |
| Series A junior participating preferred stock, $0.10 par value, 10,000 shares authorized at December 31, 2012 and December 31, 2011, respectively; none issued | | | — | | | | — | |
| Common stock, $0.10 par value, 13,333,333 shares authorized; 8,243,784 shares issued at December 31, 2012 and 2011 | | | 824 | | | | 824 | |
| Additional paid-in capital | | | 37,554 | | | | 36,804 | |
| Retained earnings | | | 1,211 | | | | 12,977 | |
| Treasury stock, 725,881 and 1,116,796 shares at cost at December 31, 2012 and 2011, respectively | | | (5,250 | ) | | | (8,198 | ) |
| Total stockholders’ equity | | | 34,339 | | | | 42,407 | |
| Total liabilities and stockholders’ equity | | $ | 72,208 | | | $ | 89,209 | |
See accompanying notes to consolidated financial statements.
Hampshire Group, Limited and Subsidiaries
Consolidated Statements of Operations
Years Ended December 31, 2012 and 2011
| (In thousands, except per share data) | | 2012 | | | 2011 | |
| | | | | | | |
| Net sales | | $ | 117,560 | | | $ | 86,148 | |
| Cost of goods sold | | | 94,106 | | | | 71,588 | |
| Gross profit | | | 23,454 | | | | 14,560 | |
| Selling, general and administrative expenses | | | 33,965 | | | | 27,977 | |
| Restructuring costs | | | 644 | | | | 179 | |
| Loss on lease obligation | | | — | | | | 6,306 | |
| Goodwill impairment loss | | | — | | | | 1,204 | |
| Loss from operations | | | (11,155 | ) | | | (21,106 | ) |
| Other income (expense): | | | | | | | | |
| Interest income | | | 2 | | | | 5 | |
| Interest expense | | | (532 | ) | | | (400 | ) |
| Other, net | | | 204 | | | | 228 | |
| Loss from continuing operations before income taxes | | | (11,481 | ) | | | (21,273 | ) |
| Income tax provision (benefit) | | | 1,041 | | | | (972 | ) |
| Loss from continuing operations | | | (12,522 | ) | | | (20,301 | ) |
| Income from discontinued operations, net of taxes | | | 783 | | | | 10,341 | |
| Net loss | | $ | (11,739 | ) | | $ | (9,960 | ) |
| Basic income (loss) per share: | | | | | | | | |
| Loss from continuing operations | | $ | (1.72 | ) | | $ | (3.41 | ) |
| Income from discontinued operations, net of taxes | | | 0.11 | | | | 1.74 | |
| Net loss | | $ | (1.61 | ) | | $ | (1.67 | ) |
| Diluted income (loss) per share: | | | | | | | | |
| Loss from continuing operations | | $ | (1.72 | ) | | $ | (3.41 | ) |
| Income from discontinued operations, net of taxes | | | 0.11 | | | | 1.74 | |
| Net loss | | $ | (1.61 | ) | | $ | (1.67 | ) |
| Weighted average number of shares outstanding: | | | | | | | | |
| Basic weighted average number of common shares outstanding | | | 7,271 | | | | 5,941 | |
| Diluted weighted average number of common shares outstanding | | | 7,271 | | | | 5,941 | |
See accompanying notes to consolidated financial statements.
Hampshire Group, Limited and Subsidiaries
Consolidated Statements of Stockholders’ Equity
Years Ended December 31, 2012 and 2011
| | | | | | | | | | | | | | | | |
| (In thousands, except shares) | | Common Stock | | | Additional | | | | | | Treasury Stock | | | Total | |
| | | | | | | | | | | | Retained | | | | | | | | | | |
| | | Shares | | | Amount | | | Capital | | | Earnings | | | Shares | | | Amount | | | Equity | |
| | | | | | | | | | | | | | | | | | | | | | |
| Balance at December 31, 2010 | | | 8,243,784 | | | $ | 824 | | | $ | 35,202 | | | $ | 27,449 | | | | 1,914,549 | | | $ | (14,073 | ) | | $ | 49,402 | |
| Net loss | | | — | | | | — | | | | — | | | | (9,960 | ) | | | — | | | | — | | | | (9,960 | ) |
| Restricted stock grants | | | — | | | | — | | | | (1,102 | ) | | | — | | | | (150,000 | ) | | | 1,102 | | | | — | |
| Restricted stock forfeitures | | | — | | | | — | | | | 2,326 | | | | — | | | | 316,375 | | | | (2,326 | ) | | | — | |
| Issuance of treasury stock for acquisition | | | — | | | | — | | | | — | | | | (4,512 | ) | | | (967,009 | ) | | | 7,108 | | | | 2,596 | |
| Stock based compensation | | | — | | | | — | | | | 378 | | | | — | | | | — | | | | — | | | | 378 | |
| Purchase of treasury shares | | | — | | | | — | | | | — | | | | — | | | | 2,881 | | | | (9 | ) | | | (9 | ) |
| Balance at December 31, 2011 | | | 8,243,784 | | | $ | 824 | | | $ | 36,804 | | | $ | 12,977 | | | | 1,116,796 | | | $ | (8,198 | ) | | $ | 42,407 | |
| Net loss | | | — | | | | — | | | | — | | | | (11,739 | ) | | | — | | | | — | | | | (11,739 | ) |
| Restricted stock forfeitures | | | — | | | | — | | | | — | | | | 3,472 | | | | 472,875 | | | | (3,472 | ) | | | — | |
| Issuance of treasury stock for employee grant | | | — | | | | — | | | | — | | | | (488 | ) | | | (66,667 | ) | | | 488 | | | | — | |
Issuance of treasury stock for acquisition’s contingent consideration | | | — | | | | — | | | | — | | | | (3,011 | ) | | | (814,096 | ) | | | 5,979 | | | | 2,968 | |
| Stock based compensation | | | — | | | | — | | | | 750 | | | | — | | | | — | | | | — | | | | 750 | |
| Purchase of treasury shares | | | — | | | | — | | | | — | | | | — | | | | 16,973 | | | | (47 | ) | | | (47 | ) |
| Balance at December 31, 2012 | | | 8,243,784 | | | $ | 824 | | | $ | 37,554 | | | $ | 1,211 | | | | 725,881 | | | $ | (5,250 | ) | | $ | 34,339 | |
See accompanying notes to consolidated financial statements.
Hampshire Group, Limited and Subsidiaries
Consolidated Statements of Cash Flows
Years Ended December 31, 2012 and 2011
| (In thousands) | | 2012 | | | 2011 | |
| Cash flows from operating activities: | | | | | | |
| Net loss | | $ | (11,739 | ) | | $ | (9,960 | ) |
| Less: Income from discontinued operations, net of taxes | | | 783 | | | | 10,341 | |
| Loss from continuing operations | | | (12,522 | ) | | | (20,301 | ) |
| Adjustments to reconcile loss from continuing operations to net cash used in operating activities: | | | | | | | | |
| Depreciation and amortization | | | 3,750 | | | | 2,606 | |
| Loss on goodwill impairment | | | — | | | | 1,204 | |
| Loss on lease obligation | | | — | | | | 6,306 | |
| Stock based compensation | | | 750 | | | | 378 | |
| Deferred income tax | | | 890 | | | | — | |
| Loss on sale or disposal of fixed assets | | | 6 | | | | 4 | |
| Changes in operating assets and liabilities: | | | | | | | | |
| Receivables, net | | | 5,501 | | | | 2,131 | |
| Inventories, net | | | (3,603 | ) | | | (2,542 | ) |
| Other assets | | | (997 | ) | | | 1,509 | |
| Liabilities | | | (6,175 | ) | | | (3,734 | ) |
| Net cash used in continuing operating activities | | | (12,400 | ) | | | (12,439 | ) |
| Net cash used in discontinued operations | | | (16 | ) | | | (449 | ) |
| Net cash used in operating activities | | | (12,416 | ) | | | (12,888 | ) |
| Cash flows from investing activities: | | | | | | | | |
| Capital expenditures | | | (797 | ) | | | (409 | ) |
| Acquisition of a business, net of cash acquired | | | — | | | | (12,332 | ) |
| Proceeds from sale of businesses | | | — | | | | 15,032 | |
| Net cash provided by (used in) investing activities | | | (797 | ) | | | 2,291 | |
| Cash flows from financing activities: | | | | | | | | |
| Increase in restricted cash | | | (2,750 | ) | | | (12,732 | ) |
| Decrease in restricted cash | | | 2,750 | | | | 15,457 | |
| Proceeds from line of credit | | | 27,986 | | | | 15,488 | |
| Repayment of line of credit | | | (27,986 | ) | | | (15,488 | ) |
| Purchase of treasury stock | | | (47 | ) | | | (9 | ) |
| Repayment of long-term debt | | | (41 | ) | | | (38 | ) |
| Net cash provided by (used in) financing activities | | | (88 | ) | | | 2,678 | |
| Net decrease in cash and cash equivalents | | | (13,301 | ) | | | (7,919 | ) |
| Cash and cash equivalents at beginning of year | | | 25,801 | | | | 33,720 | |
| Cash and cash equivalents at end of year | | $ | 12,500 | | | $ | 25,801 | |
| Supplemental disclosures of cash flow information: | | | | | | | | |
| Cash paid during the year for income taxes | | $ | 78 | | | $ | 62 | |
| Cash paid during the year for interest | | $ | 524 | | | $ | 418 | |
Non-cash issuance of stock for acquisition’s contingent consideration | | $ | 2,968 | | | $ | — | |
| Non-cash restricted stock forfeitures | | $ | 3,472 | | | $ | — | |
| Non-cash issuance of treasury stock for employee grant | | $ | 488 | | | $ | — | |
See accompanying notes to consolidated financial statements.
Note 1 - Organization and Summary of Significant Accounting Policies
Organization
Hampshire Group, Limited ("Hampshire Group" or the "Company"), through its wholly-owned subsidiaries Hampshire Brands, Inc. ("Hampshire Brands"), Rio Garment S.A. ("Rio"), scott james, LLC (“scott james®”) and Keynote Services, Limited ("Keynote Services"), engages in the apparel business and operates as one segment as its subsidiaries have similar economic characteristics. The Company's corporate offices, sales and showrooms are in New York, NY with back office functions in Anderson, SC. Hampshire Brands source the manufacture of its products from manufacturers worldwide and their products are sold primarily in the United States to various national and regional department stores and mass merchant retailers. Rio, located in San Pedro Sula, Honduras, is an apparel manufacturer, designing, sourcing and producing knit tops for retailers and distributors primarily in the United States. scott james® is a men’s specialty retailer and wholesale provider. Keynote Services, based in China, assists with the sourcing and quality control needs of Hampshire Brands.
Summary of Significant Accounting Policies
The preparation of financial statements in accordance with accounting principles generally accepted in the United States (“GAAP”) requires management to make estimates and judgments that affect the reported amounts of assets, liabilities, revenues and expenses and related disclosure of contingent assets and liabilities. On an ongoing basis, management evaluates its estimates including those related to allowances for markdowns, customer returns and adjustments, doubtful accounts, inventory reserves, discontinued operations, and income taxes. The Company’s revenues have a fairly high degree of seasonality which can cause significant fluctuations in financial results for interim periods. The Company sells apparel throughout the year but more than 65% of its annual sales occured in the third and fourth quarters of 2012, primarily due to the large concentration of sweaters in the product mix and seasonality of the apparel industry in general. Management bases its estimates on historical experience and on various other assumptions that management believes to be reasonable under the circumstances, the results of which form a basis for making judgments about the carrying value of assets and liabilities that are not readily apparent from other sources. Actual results may differ from these estimates under different assumptions or conditions; however, management believes that its estimates, including those for the above described items, are reasonable and that the actual results will not vary significantly from the estimated amounts.
Income Taxes
The Company accounts for income taxes under the asset and liability method. The Company recognizes deferred income taxes, net of valuation allowances, for the estimated future tax effects of temporary differences between the financial statement carrying amounts of existing assets and liabilities and their tax basis and net operating loss carryforwards. Deferred tax assets and liabilities are measured using enacted tax rates expected to apply to taxable income in the years in which those temporary differences are expected to be recovered or settled. The effect on deferred tax assets and liabilities of a change in tax rates is recognized in income in the period that includes the enactment date.
Management evaluates the realizability of deferred tax assets on a regular basis for each taxable jurisdiction. In making this assessment, management considers whether it is more likely than not that some portion or all of the deferred tax assets will not be realized. The ultimate realization of deferred tax assets is dependent upon the generation of future taxable income during the periods in which those temporary differences become deductible. Management considers all available evidence, both positive and negative, in making this assessment.
If the Company determines that it expects to realize deferred tax assets in excess of the recorded net amounts, a reduction in the deferred tax asset valuation allowance would decrease income tax expense in the period such determination is made. Alternatively, if the Company determines that it no longer expects to realize a portion of its net deferred tax assets, an increase in the deferred tax asset valuation allowance would increase income tax expense in the period such determination is made.
The Company assesses its income tax positions and records tax benefits for all years subject to examination based upon its evaluation of the facts, circumstances and information available at the reporting date. For those tax positions where it is more likely than not that a tax benefit will be sustained, the Company has recorded the largest amount of tax benefit that may potentially be realized upon ultimate settlement with a taxing authority that has full knowledge of all relevant information. For those income tax positions where it is not more likely than not that a tax benefit will be sustained, no tax benefit has been recognized in the financial statements. See Note 12 – Income Taxes.
Allowances for Customer Returns and Adjustments
The Company reserves for customer returns, trade discounts, advertising allowances, customer chargebacks and for sales and markdown allowances granted to customers at the end of the selling seasons, which enable customers to markdown the retail sales prices on closeout products. The estimates for these allowances and discounts are based on a number of factors, including: (a) historical experience, (b) industry trends and (c) specific agreements or negotiated amounts with customers.
Further, while the Company believes that it has negotiated all substantial sales and markdown allowances with its customers for the season recently completed, additional allowances for the spring season are anticipated and have been provided for goods shipped prior to year end and others may be requested by customers for the concluded seasons. Likewise, should the performance of the Company’s products at retail establishments exceed its historical performance levels and result in favorable settlements of previously reserved amounts, recorded allowances may be reduced.
Inventory Reserves
The Company analyzes out-of-season merchandise on an individual stock keeping unit or SKU basis, to determine reserves, if any, that may be required to reduce the carrying value to net realizable value. Additionally, the Company provides reserves for current season merchandise whose carrying value is expected, based on historical experience, to exceed its net realizable value. Factors considered in evaluating the requirement for reserves include product styling, color, current fashion trends and quantities on hand. Some of the Company's products are "classics" and remain saleable from one season to the next and therefore no reserves are generally required on these products. The Company recognizes reserves on finished goods manufactured in its Honduran manufacturing facility that are not considered to be first quality. An estimate is made of the market value, less expense to dispose, of products whose value is determined to be impaired. If these products are ultimately sold at less than estimated amounts, additional reserves may be required. Likewise, if these products are sold for more than estimated amounts, reserves and related losses may be reduced.
Other Operating Lease Obligations
The Company recognizes a liability for costs to terminate an operating lease obligation before the end of its term if the Company no longer derives economic benefit from the lease. The liability is recognized and measured at its fair value when the Company determines that the cease use date has occurred and the fair value of the liability is determined based on the remaining lease rentals due, reduced by estimated sublease rental income that could be reasonably obtained for the property. The estimate of subsequent sublease rental income may change and require future changes to the fair value of the liabilities for the lease obligations. See Note 9 – Loss on Lease Obligations.
Goodwill and Intangible Assets
The Company recorded goodwill and intangible assets with definite lives, including customer relationships and non-compete agreements, in conjunction with the acquisition of Rio. These identifiable intangible assets are amortized based on their estimated economic lives, over a range of 5 to 11 years. Goodwill represents the excess of the purchase price over the fair value of net identified tangible and intangible assets and liabilities acquired and is not amortized.
GAAP requires the Company to perform an impairment test of goodwill on an annual basis or whenever events or circumstances make it more likely than not that impairment of goodwill may have occurred. As part of the annual impairment test, the Company first has the option to make a qualitative assessment of goodwill for impairment. If the Company is able to determine through the qualitative assessment that the fair value of a reporting unit more likely than not exceeds its carrying value, no further evaluation is necessary. For those reporting units for which the qualitative assessment is either not performed or indicates that further testing may be necessary, the Company then assesses goodwill for impairment using a two-step process. The first step requires comparing the fair value of the reporting unit with its carrying amount, including goodwill. If that fair value exceeds the carrying amount, the second step of the process is not required to be performed, and no impairment charge is required to be recorded. If that fair value does not exceed that carrying amount, the Company must perform the second step, which requires an allocation of the fair value of the reporting unit to all assets and liabilities of that unit as if the reporting unit had been acquired in a purchase business combination and the fair value of the reporting unit was the purchase price. The goodwill resulting from that purchase price allocation is then compared to the carrying amount with any excess recorded as an impairment charge.
The Company reviews intangible assets with definite lives for impairment whenever events or circumstances indicate that the carrying amount may not be recoverable. If the sum of the expected undiscounted cash flows is less than the carrying value of the related asset, a loss is recognized for the difference between the fair value and carrying value of the intangible asset.
The Company performs its annual impairment test of goodwill on December 31 of each fiscal year. During 2011, the Company recorded an impairment charge of $1.2 million in connection with the goodwill related to scott james®. Management has evaluated the carrying value of goodwill as of December 31, 2012 and has determined that no impairment of goodwill was necessary. The Company also noted no events or circumstances during 2012 indicating that the carrying value of the intangible assets was not recoverable, and as such no impairment of intangible assets was recorded during 2012. See Note 6 - Goodwill and Intangible Assets and Note 14 – Fair Value Measurements.
Principles of Consolidation
The consolidated financial statements include the accounts of the Company and its wholly-owned subsidiaries. The foreign currency transactional gains or losses related to the Company’s foreign subsidiaries are not significant to the consolidated financial statements. All significant intercompany accounts and transactions have been eliminated in consolidation.
Financial Instruments
The Company's financial instruments primarily consist of cash and cash equivalents, restricted cash, short-term investments, accounts receivable, accounts payable, and long-term debt. The fair value of long-term debt is disclosed in Note 10 – Borrowings. The carrying amounts of the other financial instruments are considered a reasonable estimate of their fair value at December 31, 2012 and 2011, due to the short-term nature of the items. See Note 14 – Fair Value Measurements.
Concentrations of Credit Risk
Financial instruments which potentially expose the Company to concentrations of credit risk consist primarily of trade accounts receivable. See Note 3 – Receivables.
Cash Equivalents
Cash equivalents consist of highly liquid investments with initial maturities of ninety days or less from the date of purchase. At December 31, 2012 and 2011 the Company did not have cash invested in interest bearing accounts.
Inventories
Inventories are stated at the lower of cost or market. Cost is determined using the first-in, first-out method for all purchased inventories and average cost for all raw materials, work-in-process and finished goods manufactured in the Honduran facility.
Fixed assets are recorded at cost. The Company provides for depreciation using the straight-line method over the estimated useful lives of the assets. Additions and major replacements or improvements are capitalized, while minor replacements and maintenance costs are charged to expense as incurred. The cost and accumulated depreciation of assets sold or retired are removed from the accounts and any gain or loss is included in the results of operations for the period of the transaction.
Impairment of Long-Lived Assets
The Company evaluates the carrying value of its long-lived assets based on criteria set forth in GAAP, and records impairment losses on such assets when indicators of impairment are present and the fair value estimated for those assets are less than the assets' carrying amount.
Revenue Recognition
The Company recognizes revenues from product sales upon transfer of title and risk of goods is transferred to the customer. At this point, the sales price is fixed and determinable, and the Company is reasonably assured of the collectability of the sale. The majority of Rio’s sales are shipped FOB destination point and revenue is recognized when the goods are received by the customer. The majority of the sales of Hampshire Brands and scott james® are shipped FOB shipping point and revenue is recognized when the customer picks up the goods from a third party warehouse. Shipping and handling charges billed to customers are not included in net sales as the related costs are included in selling, general and administrative expenses. Revenues are reported on a net sales basis, which is computed by deducting product returns, discounts and estimated returns and allowances. The Company estimates returns and allowances on an ongoing basis by considering historical and current trends.
Advertising Costs
Advertising costs are expensed as incurred and are included in Selling, general and administrative expenses. Total advertising costs for continuing operations were approximately $0.9 million and $0.7 million for the years ended December 31, 2012 and 2011, respectively.
Shipping and Freight Costs
Costs to ship products to customers are expensed as incurred and are included in Selling, general and administrative expenses. These costs primarily consist of freight expenses, customs duties and fees incurred by third party shippers to transport product to our customers. Total shipping and freight costs for continuing operations were approximately $3.4 million and $1.5 million for the years ended December 31, 2012 and 2011, respectively.
Earnings (Loss) Per Common Share
Basic earnings (loss) per common share are computed by dividing net income (loss) by the weighted-average number of shares outstanding for the year. Diluted earnings per common share are computed similarly; however, it is adjusted for the effects of the assumed exercise of the Company's outstanding restricted stock grants or stock options, if applicable. The weighted-average number of shares outstanding and the weighted-average number of diluted shares outstanding are calculated in accordance with GAAP. See Note 18 – Loss Per Share.
Stock Based Compensation
Stock-based compensation cost is measured at the grant date based on the fair value of the award and is recognized as expense ratably over the requisite service period, net of estimated forfeitures. The Company awards market-based restricted stock or stock options to employees, managers, named executive officers and directors.
During the years ended December 31, 2012 and 2011, the Company incurred $0.8 million and $0.4 million in stock based compensation expense. The Company’s stock-based employee compensation plans are described more fully in Note 15 – Stock Plans, Compensation Plans and Retirement Savings Plan.
Treasury Stock
The Company accounts for treasury shares using the cost method. Purchases of shares of common stock are recorded at cost and result in a reduction of stockholders' equity. The Company holds repurchased shares in treasury for general corporate purposes, including issuances under various employee compensation plans and consideration for acquisitions. When treasury shares are reissued, the Company uses a weighted average cost method. Purchase costs in excess of reissue price are treated as a reduction of retained earnings. Reissue price in excess of purchase costs is treated as additional paid-in capital.
Discontinued Operations
In accordance with GAAP, the accompanying consolidated financial statements present separately the results of operations and financial position of discontinued operations. See Note 17 – Dispositions and Discontinued Operations.
Reclassifications
Certain reclassifications have been made to prior period amounts between Retained earnings and Additional paid-in capital to conform to the current period financial statement presentation. There was no impact to the Company’s Net loss or Total stockholders’ equity as a result of such reclassifications.
Recent Accounting Standards
In September 2011, the Financial Accounting Standards Board issued Accounting Standard Update (“ASU”) 2011-08, Intangibles-Goodwill and Other (Topic 350) Testing Goodwill for Impairment (“ASU 2011-08”). ASU 2011-08 gives entities testing goodwill for impairment the option of performing a qualitative assessment before calculating the fair value of a reporting unit in step 1 of the goodwill impairment test. For those entities that determine, on the basis of qualitative factors, that the fair value of a reporting unit is more likely than not less than the carrying amount, an entity is required to perform step 2 of the goodwill impairment test. ASU 2011-08 is effective for fiscal years, and interim periods within those years, beginning after December 15, 2011. ASU 2011-08 was adopted by the Company for the fiscal year ending December 31, 2012. The adoption of ASU 2011-08 did not have an impact to the Company’s consolidated financial statements.
Subsequent Events
The Company has evaluated subsequent events from the date of the consolidated balance sheet through the date the financial statements were issued. Other than those events identified in Note 2 – Acquisitions, Note 13 – Commitments and Contingencies and Note 20 – Subsequent Events, no material subsequent events were identified.
Note 2 – Acquisitions
On August 25, 2011, pursuant to a merger agreement, dated June 13, 2011 as amended (the “Merger Agreement”) by and among the Company, RG Merger Sub S.A. (a wholly-owned subsidiary of the Company), Rio Garment S. de R.L., the Rio Garment S. de R.L. equity holders, and BGY II, LLC, the Company completed its acquisition of Rio Garment S. de R.L. by way of a merger of Rio Garment S. de R.L. with and into RG Merger Sub S.A., (the “Merger”) for an aggregate purchase price of approximately $21.6 million. RG Merger Sub S.A. was subsequently renamed Rio Garment S. A. (“Rio”). Upon closing, pursuant to the Merger Agreement, the Company paid to the former Rio equity holders, a total of $7.0 million in cash, $3.5 million of which was deposited into an escrow account pending certain post-closing purchase price adjustments. Additionally, the Company issued to the former Rio equity holders an aggregate of $2.6 million in Hampshire common stock, par value $0.10 (“Hampshire Common Stock”) and held back an additional $6.5 million of Hampshire Common Stock (1,781,798 shares) for potential post-closing purchase price adjustments and indemnification claims. The Company also paid in cash certain liabilities of Rio totaling approximately $5.9 million. The Company financed the cash portion of the acquisition with cash-on-hand.
During 2012, in respect of a net working capital purchase price adjustment, approximately $1.4 million of the escrowed amount was paid to the equity holders’ representative and approximately $0.3 million was released to the Company pursuant to the terms of the merger agreement. An additional $1.8 million of the escrowed amount was paid to the former Rio equityholders relating to Rio’s 2011 “Adjusted EBITDA,” as determined in accordance with the merger agreement.
Also, an additional installment of purchase price which included contingent consideration in the amount of approximately $6.5 million was to be paid to the sellers based on post-closing purchase price adjustments in accordance with the Merger Agreement. As a result of Rio’s 2011 Adjusted EBITDA multiplied by three equaling or exceeding $23.0 million and the release of certain shares previously being held back in connection with potential tax indemnification claims, during 2012, the Company issued to a representative of the former Rio equityholders a total of $3.0 million of Hampshire Common Stock pursuant to the terms of the merger agreement. The remaining recorded value of the contingent consideration of $3.5 million to be issued in the Company’s stock approximates fair value at December 31, 2012.
On March 7, 2013, the Company entered into a letter agreement with the former Rio equity holders amending the Merger Agreement such that the approximately $3.0 million of contingent consideration which was due to the former Rio equity holders within 5 days of 18 months of the closing date will be paid no later than the earlier of April 1, 2013 or within 5 days of an ownership change as defined by Internal Revenue Code Section 382 (“Section 382”). Under Section 382 the utilization of our net operating losses and tax credit carry-forwards may be subject to substantial annual limitations or expiration due to ownership changes. The events that may cause ownership changes include, but are not limited to, a cumulative stock ownership change greater than 50% over a three year period.
The Company acquired Rio to diversify its distribution channels with the vertical specialty stores and improve its profitability and growth potential. The following table summarizes the fair values of the assets acquired and liabilities, including purchase price adjustments, assumed at the acquisition date:
| (In thousands) | | August 25, 2011 | |
| Purchase price at acquisition date, adjusted | | $ | 15,111 | |
| Additional installment of purchase price | | | 6,500 | |
| Total | | $ | 21,611 | |
| Assets | | | | |
| Cash | | $ | 183 | |
| Accounts receivable | | | 1,896 | |
| Inventories | | | 11,921 | |
| Other current assets | | | 872 | |
| Fixed assets | | | 1,203 | |
| Goodwill | | | 2,559 | |
| Intangible assets | | | 16,681 | |
| Other assets | | | 25 | |
| Total assets acquired | | $ | 35,340 | |
| | | | | |
| Liabilities | | | | |
| Accounts payable | | $ | 9,098 | |
| Accrued expenses and other liabilities | | | 4,631 | |
| Total liabilities assumed | | $ | 13,729 | |
| | | | | |
| Purchase price (net assets acquired) | | $ | 21,611 | |
During 2012 we retrospectively adjusted our previously reported preliminary purchase price allocation for changes to our original estimates. These changes are the result of additional information obtained since the filing of our form 10-K for the year ended December 31, 2011. During 2012 the Company received a favorable tax ruling on certain tax obligations that were assumed by the Company upon the acquisition of Rio. As a result, Accrued expenses and other liabilities decreased by approximately $1.9 million. Also, an indemnification asset related primarily to the tax withholding obligations decreased by approximately $2.0 million. Among other revisions, goodwill increased by approximately $0.1 million as an offset to the above-mentioned changes.
Intangible assets include approximately $16.4 million and $0.2 million attributable to customer relationships and a non-compete agreement, respectively, that are being amortized on a straight-line basis over a range of 5 to 11 years that reflects their estimated economic lives. The Company’s $2.6 million of goodwill represents the enhancement of the Company’s creative design and retail industry and sourcing relationships and the resulting cross-selling opportunities for the Company divisions. The Company does not expect goodwill to be deductible for tax purposes.
The unaudited financial information in the table below summarizes the combined results of continuing operations of the Company and Rio, on a pro forma basis, as though the Merger had occurred as of the first date of the twelve months ended December 31, 2011. The pro forma financial information is presented for informational purposes only and is not indicative of the results of operations that would have been achieved if the acquisition had taken place on that date or of results that may occur in the future. The unaudited pro forma financial information for the year ended December 31, 2011 combines the historical results for the Company and the historical results for Rio. The basic and diluted weighted average number of common shares outstanding assumes that the Company issued all shares of common stock consideration as contemplated by the Merger Agreement on January 1, 2011.
| (In thousands except per share data) | | December 31, 2012 | | | December 31, 2011 | |
| Net sales | | $ | 117,560 | | | $ | 121,708 | |
| Net loss from continuing operations | | $ | (12,522 | ) | | $ | (19,334 | ) |
| Basic loss from continuing operations per share | | $ | (1.57 | ) | | $ | (2.29 | ) |
| Diluted loss from continuing operations per share | | $ | (1.57 | ) | | $ | (2.29 | ) |
| Basic weighted average number of common shares outstanding | | | 7,994 | | | | 8,426 | |
| Diluted weighted average number of common shares outstanding | | | 7,994 | | | | 8,426 | |
In connection with the Merger, the Company incurred approximately $2.1 million of acquisition related costs during the year ended December 31, 2011. These costs were recorded in Selling, general and administrative expenses in the consolidated statement of operations. The Company’s results of operations for the year ended December 31, 2011 include approximately $29.2 million attributable to the net sales of Rio since August 25, 2011, the date of the Merger. Substantially all of Rio’s sales were to United States based customers. Approximately $1.4 million and $1.3 million of the Company’s long lived assets are attributable to Rio and located in Honduras as of December 31, 2012 and 2011, respectively.
Note 3 - Receivables and Major Customers
The Company performs ongoing evaluations of the credit worthiness of its customers and maintains allowances for potential doubtful accounts. The accounts receivable at December 31, 2012 and 2011 are stated net of allowances for doubtful accounts, customer returns, co-op advertising, customer charge backs and for sales and markdown allowances of approximately $4.8 million and $6.1 million, respectively.
The Company sells principally to department stores, chain stores, specialty stores, mass merchants and other retailers located principally in the United States. The Company's sales to its three largest customers for the year ended December 31, 2012 represented 52%, 14% and 12% of total sales. For the year ended December 31, 2011, these three major customers represented 30%, 16% and 28% of total sales, respectively. The growth in sales from our largest customer from 2011 to 2012 was primarily due to a full year of sales in 2012 as compared to 2011 as Rio was acquired on August 25, 2011 and represents sales from that date forward. At December 31, 2012 and 2011, 60% and 71%, respectively, of the total gross trade receivables were due from these major customers.
The major components of other receivables at December 31, 2012 and 2011 were as follows:
(In thousands) | | 2012 | | | 2011 | |
| Receivable from escrow | | $ | — | | | $ | 370 | |
| Income tax refunds receivable | | | 52 | | | | 86 | |
| Other | | | 286 | | | | 367 | |
| Other receivables | | $ | 338 | | | $ | 823 | |
Note 4 - Inventories
Inventories at December 31, 2012 and 2011 consisted of the following:
(In thousands) | | 2012 | | | 2011 | |
| Finished goods | | $ | 8,245 | | | $ | 9,253 | |
| Work in process | | | 3,478 | | | | 2,878 | |
| Raw materials and supplies | | | 11,421 | | | | 7,600 | |
| Total cost | | | 23,144 | | | | 19,731 | |
| Less: reserves | | | (950 | ) | | | (1,140 | ) |
| Inventories, net | | $ | 22,194 | | | $ | 18,591 | |
Note 5 - Fixed Assets
Fixed assets at December 31, 2012 and 2011 consisted of the following:
| (In thousands) | | Estimated Useful Lives | | | 2012 | | | 2011 | |
| Leasehold improvements (years) | | 5 | – | 15 | | | $ | 8,311 | | | $ | 7,821 | |
| Machinery and equipment (years) | | 3 | – | 7 | | | | 4,484 | | | | 4,094 | |
| Furniture and fixtures (years) | | 3 | – | 7 | | | | 3,662 | | | | 3,691 | |
| Software (years) | | | 3 | | | | | 1,357 | | | | 1,383 | |
| Vehicles (years) | | | 5 | | | | | 27 | | | | 27 | |
| Construction in progress | | | — | | | | | 18 | | | | 387 | |
| Total cost | | | | | | | | 17,859 | | | | 17,403 | |
| Less: accumulated depreciation | | | | | | | | (9,892 | ) | | | (8,200 | ) |
| Fixed assets, net | | | | | | | $ | 7,967 | | | $ | 9,203 | |
Depreciation expense was approximately $2.0 million and $1.9 million for the years ended December 31, 2012 and 2011, respectively.
Note 6 – Goodwill and Intangible Assets
GAAP specifies criteria that intangible assets acquired in a purchase method business combination must meet in order to be recognized and reported apart from goodwill and that goodwill and intangible assets with indefinite useful lives no longer be amortized, but instead be tested for impairment at least on an annual basis. During the second quarter of 2011, the Company determined that based on the operating results of scott james®, an indicator of impairment was present and based upon present value tests performed, the Company recorded an impairment charge of $1.2 million in connection with the goodwill related to scott james®. Management has evaluated the carrying value of goodwill as of December 31, 2012 and has determined that no impairment was necessary during 2012.
In connection with the Merger, the Company recorded identifiable intangible assets. As of December 31, 2012, $16.4 million represents customer relationships that are being amortized on a straight-line basis over 11 years and $0.2 million represents a non-compete agreement amortizable over 5 years. Management noted no events or circumstances during 2012 indicating that the carrying value of the intangible assets was not recoverable, and as such no impairment of intangible assets was recorded during 2012.
The following tables highlight the Company’s intangible assets as of December 31, 2012 and 2011:
| | 2012 | | 2011 |
(In thousands) | Gross Carrying Amount | | Accumulated Amortization | | Gross Carrying Amount | | Accumulated Amortization | |
| Intangible assets not subject to amortization: | | | | | | | | | | | | |
| Goodwill | | | 2,559 | | | | — | | 2,559 | | — | |
| Intangible assets subject to amortization: | | | | | | | | | | | | |
| Customer relationships | | $ | 16,441 | | | $ | (1,993 | ) | | $ | 16,441 | | | $ | (504 | ) |
| Non-compete agreement | | | 240 | | | | (64 | ) | | | 240 | | | | (16 | ) |
| Total | | $ | 16,681 | | | $ | (2,057 | ) | | $ | 16,681 | | | $ | (520 | ) |
(In thousands) | | 2012 | | | 2011 | |
| Amortization expense | | $ | 1,537 | | | $ | 520 | |
During 2012 we retrospectively adjusted the balance in goodwill as a result of finalizing our previously reported preliminary purchase price allocation for the acquisition of Rio. See Note 2 – Acquisitions.
Amortization expense for intangible assets for each fiscal year ending December 31 for 2013 through 2017 is expected to be approximately $1.5 million.
Note 7 - Accrued Expenses and Other Liabilities
Accrued expenses and other liabilities at December 31, 2012 and 2011 consisted of the following:
| (In thousands) | | 2012 | | | 2011 | |
| Accrued Rent | | $ | 6,149 | | | $ | 5,487 | |
| Earn-out liability | | | 3,500 | | | | 2,750 | |
| Current portion of loss on lease obligations | | | 2,061 | | | | 1,499 | |
| Compensation, benefits and related taxes | | | 1,610 | | | | 1,314 | |
| Royalties | | | 110 | | | | 150 | |
| Income tax reserves | | | 7 | | | | 46 | |
| Other | | | 2,194 | | | | 1,328 | |
| Accrued expenses and other liabilities | | $ | 15,631 | | | $ | 12,574 | |
Accrued rent represents disputed unpaid rent for the Company’s New York, NY office. See Note 13 – Commitments and Contingencies.
Earn-out liability represents contingent consideration to be issued in the Company’s stock to the former Rio equityholders. See Note 2 – Acquisitions.
Note 8 – Other Long-term Liabilities
Other long-term liabilities at December 31, 2012 and 2011 consisted of the following:
(In thousands) | | 2012 | | | 2011 | |
| Long-term portion of loss on lease obligations | | $ | 4,661 | | | $ | 7,198 | |
| Deferred tax liability | | | 1,492 | | | | 391 | |
| Non-current income tax liabilities | | | 4,556 | | | | 4,458 | |
| Deferred rent | | | 5,479 | | | | 5,519 | |
| Earn-out liability | | | — | | | | 3,750 | |
| Other | | | 89 | | | | 267 | |
| Other long-term liabilities | | $ | 16,277 | | | $ | 21,583 | |
Note 9 – Loss on Lease Obligations
In November 2011, the Company completely vacated two of the five floors leased at the New York Office. GAAP requires that the fair value of the liability for costs that will continue to be incurred under an operating lease for its remaining term without economic benefit to the entity shall be recognized at the cease-use date based on the remaining lease rentals, adjusted for the effects of any prepaid or deferred items recognized under the lease, and reduced by estimated sublease rentals that could be reasonably obtained for the property, even if the entity does not intend to enter into a sublease. The Company recorded a loss on lease charge of $6.3 million during the fourth quarter of 2011, net of the release of deferred rent attributable to the vacant space. The expense for 2011 is recorded in Loss on lease obligation in the consolidated statement of operations. As of December 31, 2012, the assumptions used in the calculation of the loss on lease obligation include a discount rate of 5% and future sublease income based on the current market rate per square foot for the New York Office.
At December 31, 2012, $2.0 million and $4.7 million of deferred loss on lease obligations is included in Accrued expenses and other liabilities and Other long-term liabilities, respectively, of the consolidated balance sheet. At December 31, 2011, $1.5 million and $7.2 million of deferred loss on lease obligations is included in Accrued expenses and other liabilities and Other long-term liabilities, respectively, of the consolidated balance sheet. The Company had loss on lease obligations separate from the New York Office lease of $0.5 million and $0.8 million at December 31, 2012 and December 31, 2011, respectively. A reconciliation of the beginning and ending liability balances for the total loss on lease obligations is shown in the tables below:
| | | Year Ended | |
| | | December 31, 2012 | | | December 31, 2011 | |
(In thousands) | | | | | Other | | | Total | | | | | | Other | | | Total | |
| Beginning of period | | $ | 7,871 | | | $ | 826 | | | $ | 8,697 | | | $ | — | | | $ | 572 | | | $ | 572 | |
| Charges (credits) to expense | | | (86 | ) | | | 38 | | | | (48 | ) | | | 7,965 | | | | 475 | | | | 8,440 | |
| Costs paid or settled | | | (1,551 | ) | | | (376 | ) | | | (1,927 | ) | | | (94 | ) | | | (221 | ) | | | (315 | ) |
| End of period | | $ | 6,234 | | | $ | 488 | | | $ | 6,722 | | | $ | 7,871 | | | $ | 826 | | | $ | 8,697 | |
Note 10 - Borrowings
Long-Term Debt
Long-term debt, which was collateralized by equipment, consisted of a note payable that was payable in monthly installments of $4,000 including interest at 6.15%. The total amount owed as of December 31, 2012 and 2011 was $0 and approximately $41,000, respectively. Of the total amount owed, the amount included in current liabilities as of December 31, 2012 and 2011 was $0 and approximately $36,000, respectively.
The fair value of the long-term debt at December 31, 2011, based on current market interest rates discounted to present value, was approximately equal to the recorded amount.
Revolving Credit Facility
On October 28, 2010, the Company entered into a credit agreement (referred to as the “Credit Facility”) with Wells Fargo Capital Finance, LLC (“WFCF”).
Approximately $0.3 million and $0.5 million of capitalized credit facility fees net of accumulated amortization are included in Other Assets in the consolidated balance sheet as of December 31, 2012 and 2011, respectively. Amortization expense for the Credit Facility costs for both the years ended December 31, 2012 and 2011 was approximately $0.2 million. For each fiscal year ending on December 31, for 2013 and 2014, amortization expense relating to credit facility costs is expected to be approximately $0.2 million.
On August 15, 2011, the Company entered into a First Amendment to Credit Agreement and Consent (the “Amendment and Consent”) with WFCF. Pursuant to the Amendment and Consent, WFCF, as agent under the Credit Facility consented to the Merger and also waived certain defaults that would otherwise have arisen under the Credit Facility as a result of the Merger. The Amendment and Consent also provides that upon satisfaction of certain conditions, certain provisions of the Credit Facility will be amended to permit, among other things, the financing of the operations by means of loans, advances or other cash investments, the purchase of accounts receivable and inclusion of such purchased receivables in the calculation of the borrowing base under the Credit Facility, certain transactions with affiliates and the existence of certain indebtedness and liens on the property of the acquired company that were not expected to be paid in full or terminated and released in connection with the Merger.
On April 30, 2012, the Company entered into a Second Amendment to Credit Agreement (the “Second Amendment”) with WFCF to better align certain Credit Facility covenants to the Company’s go-forward business model. The Second Amendment provides for, among other things, amendments to the fixed charge coverage ratio and liquidity covenants, and the inclusion of certain accounts receivable in the calculation of the borrowing base under the Credit Facility. The Second Amendment also provides for an increase in the amount of intercompany advances that are permitted under the Credit Facility.
The Credit Facility is a $50.0 million asset based revolving credit facility, including trade and standby letters of credit, with a $30.0 million sub-limit for letters of credit. The Credit Facility has a term of four years, matures on October 28, 2014, and is secured by substantially all assets of the Company and each of its domestic subsidiaries with the exception of internationally held inventory. Revolving credit loans are limited to a borrowing base, which considers cash deposited into a restricted account, eligible accounts receivable and eligible inventory. The Credit Facility contains customary conditions precedent to each borrowing, including absence of defaults and accuracy of representation and warranties. The Credit Facility contains customary affirmative and negative covenants, which include a fixed charge coverage covenant that takes effect only when and so long as the Company does not meet minimum liquidity and availability requirements that adjust based on the seasonality of the Company’s business. The Credit Facility is designed to provide working capital and letters of credit that will be used primarily for the purchase and importation of inventory and for general corporate purposes.
The Company, at its discretion, may prepay outstanding principal, in whole or part, at any time. The Credit Facility requires prepayment of outstanding obligations and accrued interest upon certain events, including in the event the amount outstanding under the Credit Facility exceeds the borrowing base. The Credit Facility also contains customary provisions that enable WFCF to accelerate payment of outstanding obligations under the Credit Facility upon certain events, including, among others, non-payment of amounts due under the Credit Facility, breach of the fixed charge coverage ratio (which is applicable only so long as the Company does not meet minimum liquidity and availability requirements), insolvency, bankruptcy, a change of control of the Company and failure to perfect certain liens on the collateral securing the obligations under the Credit Facility. Management believes the Company was in compliance with all covenants related to the Credit Facility as of December 31, 2012.
The obligations under the Credit Facility are secured by (i) a first priority security interest in certain assets of the Company and the domestic subsidiaries of the Company that are party to the Credit Facility in their capacity as borrowers or party to the separate guaranty agreement executed in connection with the Credit Facility, (ii) a pledge of all issued and outstanding common stock of each operating domestic subsidiary of the Company, and (iii) an assignment of proceeds of insurance covering collateral.
Interest accrues on outstanding indebtedness under revolving credit loans at an annual rate, equal to: (a) the LIBOR Rate (as defined in the Credit Facility) plus 2.50% for obligations with a LIBOR based interest rate, or (b) a base rate equal to 1.75% plus the greatest of (i) the Federal Funds Rate (as defined in the Credit Facility) plus 0.50%, (ii) one-month LIBOR rate plus 1.50%, and (iii) the prime rate of interest announced, from time to time, by WFCF at its principal office. All interest is calculated on the basis of actual number of days elapsed based on a 360 day year. In addition, the Credit Facility requires the Company to pay certain customary fees, costs and expenses of WFCF.
At December 31, 2012, there were no outstanding borrowings and approximately $8.3 million outstanding under letters of credit. Borrowing availability was approximately $3.1 million at December 31, 2012 and the Company had approximately $12.5 million of cash and cash equivalents not included in the availability calculation.
Note 11 - Stockholder Rights Plan
On August 13, 2008, the Board adopted a Stockholder Rights Plan (the “Rights Plan”) in which preferred share purchase rights (a “Right”) were distributed as a dividend at the rate of one Right for each outstanding share of common stock as of the close of business on August 25, 2008. There were 5,469,165 outstanding shares of common stock on August 25, 2008, and the Rights extend to shares issued after this date. The Rights are intended to enable all of the Company’s stockholders to realize the long-term value of their investment in the Company. The Rights will not prevent a takeover, but should encourage anyone seeking to acquire the Company to negotiate with the Board prior to attempting a takeover. The Rights will expire on August 23, 2013.
Each Right will entitle stockholders, in certain circumstances, to buy one one-thousandth of a newly issued share of Series A Junior Participating Preferred Stock of the Company at an exercise price of $33.00. The Rights will be exercisable and transferable apart from the common stock only if a person or group acquires beneficial ownership of 15% or more of the common stock (such person or group, an “Acquiring Person”) (except, subject to certain limitations, for stockholders who, together with their affiliates and associates, in excess of 15% of the common stock) as of August 13, 2008 or commences a tender or exchange offer upon consummation of which a person or group would own 15% or more of the outstanding common stock. In accordance with the Merger Agreement dated June 13, 2011, the Rights Plan was amended to permit the issuance of Hampshire Common Stock to the former Rio equity holders in connection with the Merger.
If any person becomes an Acquiring Person other than pursuant to an offer for all shares which is determined by the Board to be fair to and otherwise in the best interests of the Company and its stockholders, then each Right not owned by an Acquiring Person or certain related parties will entitle its holder to purchase, at the Right’s then-current exercise price, shares of common stock (or, in certain circumstances as determined by the Board, cash, other property or other securities) having a value of twice the Right’s exercise price. In addition, if, after any person has become an Acquiring Person, the Company is involved in a merger or other business combination transaction with another person in which its common stock is changed or converted, or sells 50% or more of its assets or earning power to another person, each Right will entitle its holder to purchase, at the Right’s then-current exercise price, shares of common stock of such other person having a value of twice the Right’s exercise price.
The Company will generally be entitled to redeem the Rights at $0.01 per Right at any time until a person or group has become an Acquiring Person.
Note 12 - Income Taxes
The components of loss before income tax provision (benefit) for the years ended December 31, 2012 and 2011 consists of the following:
| (In thousands) | | 2012 | | | 2011 | |
| US | | $ | (16,049 | ) | | $ | (13,558 | ) |
| Foreign | | | 5,351 | | | | 2,626 | |
| Loss before income tax provision (benefit) | | $ | (10,698 | ) | | $ | (10,932 | ) |
The income tax provision (benefit) related to continuing operations for the years ended December 31, 2012 and 2011 consists of the following:
| (In thousands) | | 2012 | | | 2011 | |
| Current: | | | | | | |
| Federal | | $ | 20 | | | $ | (813 | ) |
| Foreign | | | 56 | | | | 23 | |
| State and local | | | 75 | | | | (182 | ) |
| Total current | | | 151 | | | | (972 | ) |
| Deferred: | | | | | | | | |
| Federal | | | — | | | | — | |
| Foreign | | | 890 | | | | — | |
| State and local | | | — | | | | — | |
| Total deferred | | | 890 | | | | — | |
| Total income tax provision (benefit) | | $ | 1,041 | | | $ | (972 | ) |
Deferred income taxes reflect the tax effects of temporary differences between the carrying amounts of assets and liabilities for financial reporting purposes and the amounts used for income tax purposes.
Significant components of the Company’s deferred tax assets and liabilities as of December 31, 2012 and 2011 are as follows:
| (In thousands) | | 2012 | | | 2011 | |
| Deferred tax assets: | | | | | | |
| Basis in intangible assets | | $ | 390 | | | $ | 438 | |
| Accounts receivable reserves | | | 521 | | | | 341 | |
| Inventory reserves | | | 317 | | | | 556 | |
| Unrecognized tax benefits | | | 1,618 | | | | 1,655 | |
| All other accrued expenses | | | 2,848 | | | | 2,862 | |
| Deferred compensation | | | 296 | | | | 205 | |
| Deferred rent | | | 2,303 | | | | 2,329 | |
| Loss on lease obligations | | | 2,678 | | | | 3,486 | |
| Net operating loss carryforwards | | | 21,346 | | | | 15,398 | |
| Foreign tax credit carryforwards | | | 890 | | | | 255 | |
| Charitable contributions carryforwards | | | 158 | | | | 152 | |
| Capital loss and AMT credit carryforwards | | | 83 | | | | 164 | |
| Total deferred tax assets | | | 33,448 | | | | 27,841 | |
| Less: valuation allowances | | | (29,193 | ) | | | (25,827 | ) |
| Net deferred tax assets | | $ | 4,255 | | | $ | 2,014 | |
| Deferred tax liabilities: | | | | | |
| Basis in fixed assets | | $ | 708 | | | $ | 989 | |
| Undistributed foreign earnings | | | 3,547 | | | | 1,025 | |
| Foreign tax withholding | | | 890 | | | | — | |
| Total deferred tax liabilities | | $ | 5,145 | | | $ | 2,014 | |
GAAP requires companies to assess whether valuation allowances should be recorded to offset its deferred tax assets based on consideration of all available evidence using a “more likely than not” standard. In making such assessments, significant weight is given to evidence that can be objectively verified. A company’s current and/or previous losses are given more weight than its future projections. A cumulative loss position is considered a significant factor that is difficult to overcome.
The Company evaluates its deferred tax assets each reporting period, including assessment of its cumulative loss position, to determine if valuation allowances are required. A significant negative factor is the Company’s cumulative loss position. This, combined with uncertain near-term economic conditions, reduces the Company’s ability to rely on projections of future taxable income in establishing its deferred tax assets valuation allowance. Due to the weight of the significant negative evidence, GAAP requires that a valuation allowance be established on all of the Company’s net deferred tax assets.
The valuation allowances do not impact the Company’s cash position, nor do they preclude the Company from using net operating loss carryforwards and/or carrybacks, tax credits or other deferred tax assets in the future. Further, the valuation allowances are not the result of a significant change in the Company’s view of its long-term financial outlook.
The following table reconciles the income tax expense (benefit) from continuing operations computed at the U.S. federal statutory tax rates to the income tax expense (benefit) for the years ended December 31, 2012 and 2011:
| (In thousands except percentages) | | 2012 | | | 2011 | |
| Federal income tax rate | | | 34 | % | | | 34 | % |
| Income tax benefit at the federal statutory rate | | $ | (3,857 | ) | | $ | (7,233 | ) |
| State benefit, net of federal benefit | | | (834 | ) | | | (1,272 | ) |
| Changes in uncertain tax positions | | | 73 | | | | (960 | ) |
| Changes in valuation allowances | | | 3,704 | | | | 7,274 | |
| Changes in valuation allowances attributable to tax on foreign earnings | | | 2,528 | | | | 1,025 | |
| Changes in valuation allowances with no tax effect | | | 221 | | | | 373 | |
| Permanent differences, net | | | 1,094 | | | | 923 | |
| Differences between U.S. and foreign tax rates | | | (2,187 | ) | | | (893 | ) |
| Differences between current and deferred tax rates | | | (13 | ) | | | 83 | |
| Foreign taxes | | | 56 | | | | 23 | |
| Foreign tax credits | | | (634 | ) | | | (255 | ) |
| Foreign tax withholding | | | 890 | | | | — | |
| State tax refunds | | | — | | | | (60 | ) |
| Income tax provision (benefit) | | $ | 1,041 | | | $ | (972 | ) |
Consistent with GAAP, the Company determines whether the benefits of tax positions are more likely than not to be sustained upon audit based on the technical merits of the tax position. For tax positions that are more likely than not to be sustained upon audit, the Company recognizes the largest amount of the benefit that is more likely than not to be realized upon settlement with the taxing authority. For tax positions that are not more likely than not to be sustained upon audit, the Company does not recognize any portion of the benefit in the financial statements. The Company recognizes interest and penalties associated with uncertain tax positions as a component of taxes on income in the consolidated statements of operations.
The Company’s liability for unrecognized tax benefits was $4.6 million and $4.5 million as of December 31, 2012 and 2011, respectively. The Company’s liability for unrecognized tax benefits as of December 31, 2012 and 2011 includes accrued interest of $1.9 million and $1.8 million, respectively, and penalties of $0.2 million and $0.3 million, respectively. If the Company were to recognize these benefits, the effective rate would reflect a favorable net impact of $1.5 million and $1.6 million, excluding interest and penalties, in 2012 and 2011, respectively. The Company recognized a net tax expense for interest of $0.1 million during 2012 and no net tax expense or benefit for interest during 2011. The Company recognized no net tax expense or benefit for penalties during 2012 and 2011.
During 2013, the Company anticipates that total unrecognized tax benefits will decrease by approximately $2.3 million, including interest of approximately $0.8 million and nominal penalties, due to the lapsing of statutes of limitations within 12 months of December 31, 2012.
A reconciliation of the beginning and ending balances of the total amounts of gross unrecognized tax benefits is as follows:
| (In thousands) | | 2012 | | | 2011 | |
| Gross unrecognized tax benefits at January 1 | | $ | 2,673 | | | $ | 3,632 | |
| Decreases in tax positions for prior years | | | (16 | ) | | | (22 | ) |
| Increases in tax positions for current year | | | — | | | | — | |
| Settlements | | | — | | | | (1 | ) |
| Lapse in statute of limitations | | | (118 | ) | | | (936 | ) |
| Gross unrecognized tax benefits at December 31 | | $ | 2,539 | | | $ | 2,673 | |
The Company elected to carry back its 2009 federal net operating loss to tax years 2004 and 2005. As a result, the statute of limitations with respect to the Company’s federal income tax returns is open for tax years 2004 and 2005, up to the amount of the 2009 federal net operating loss carryback. In addition, the Company’s federal statute of limitations is open for tax years 2009 and beyond. With limited exceptions, the statutes of limitations for state income tax returns remain open for tax years 2008 and beyond. The Company also files income tax returns in Hong Kong and Honduras. The statute of limitations for the Company’s Hong Kong income tax returns is open for tax years 2006 and beyond, and the statute of limitations for the Company’s Honduran income tax returns is open for tax years 2012 and beyond.
As of December 31, 2012, the Company has net operating loss carryforwards for U.S. federal income tax purposes of $50.3 million, which expire in varying amounts from 2019 to 2032. Approximately $3.9 million of these federal net operating loss carryforwards were obtained in the acquisition of Marisa Christina in May 2006. The Company has state net operating loss carryforwards of $71.8 million as of December 31, 2012 expiring from 2013 to 2032. Approximately $0.7 million of these state net operating loss carryforwards were obtained in the acquisition of Marisa Christina in May 2006. Valuation allowances have been established for all of these federal and state net operating loss carryforwards due to the uncertainty of their future usage.
Rio operates under a Honduran Free Trade Zone Regime. This regime exempts Rio from Honduran municipal taxes, asset taxes and income taxes. To maintain the exemption, Rio must export at least 95% of its annual production; currently, Rio exports 99% of its production. GAAP requires a presumption that all undistributed subsidiary earnings, including undistributed foreign earnings, will be transferred to the parent unless sufficient evidence shows that a subsidiary has invested or will invest the undistributed earnings indefinitely. Currently, the Company cannot conclude that Rio’s undistributed foreign earnings will be invested indefinitely. Thus, the Company has recorded $0.9 million in deferred foreign income tax expense, which represents a 10% Honduran dividend withholding tax on such undistributed foreign earnings, for the year ended December 31, 2012.
Note 13 - Commitments and Contingencies
The Company leases premises and equipment under operating leases having terms from month-to-month to fifteen years and one month. At December 31, 2012, future minimum lease payments under leases having an initial or remaining non-cancelable term in excess of one year are as set forth in the table below:
| | | | |
| Year | | (In thousands) | |
| 2013 | | $ | 5,628 | |
| 2014 | | | 4,888 | |
| 2015 | | | 5,038 | |
| 2016 | | | 5,139 | |
| 2017 | | | 5,194 | |
| Thereafter | | | 24,710 | |
| | | $ | 50,597 | |
At December 31, 2012, future rental revenue to be received under non-cancellable subleases having an initial or remaining non-cancelable term in excess of one year are as set forth in the table below:
| | | | |
| Year | | (In thousands) | |
| 2013 | | $ | 763 | |
| 2014 | | | 95 | |
| 2015 | | | 96 | |
| 2016 | | | 25 | |
| 2017 | | | 25 | |
| | | $ | 1,004 | |
For the years ended December 31, 2012 and 2011, rent expense for operating leases was approximately $2.9 million and $4.1 million, respectively.
The Company entered into a 15 year, one month lease of approximately 77,000 square feet of office space in New York, NY on July 11, 2007 (the “New York Lease”). The New York Lease provides for minimum payments of $63.7 million over the lease term. The Company’s possession of the space commenced in September 2007 and lease payments began in March 2008. The New York Lease includes guaranteed minimum consumer price index (“CPI”) increases that commenced in 2009 and tiered rent escalations commencing in 2010. The New York Lease and associated incentives are being amortized on a straight-line basis over the expected lease term, including any rent holidays, guaranteed minimum CPI increases and tiered rent escalations.
As part of the New York Lease, the landlord (“Landlord”) agreed to commence and substantially complete major capital improvements to the common areas of the New York Office by June 2008. After June 2008, if such capital improvements have not been substantially completed, the New York Lease provides, among other things, for a reduction in rent by one half for each day beyond June 30, 2008 that the capital improvements remain incomplete and are not being diligently prosecuted toward completion.
On February 16, 2011, the Company filed a complaint in the Supreme Court, New York County, with respect to the New York Lease. The Company asserted claims against the Landlord of the New York Office and the receiver of such property appointed in connection with a foreclosure action commenced against Landlord by its lender. The complain sought (i) a judgment declaring (a) that the Company is not in default under the New York Lease and (b) that the rent previously paid by the Company represents the full amount of rent; and (ii) for rescission of the New York Lease as of June 30, 2008 by reason of default by the Landlord with respect to a material provision under the New York Lease requiring prompt completion of major capital improvements of the New York Office’s common areas. The Supreme Court action was dismissed on December 16, 2011 without prejudice to renew the action if complete relief is not afforded in the Civil Court action.
On February 23, 2011, the court appointed Receiver of the subject property commenced a non-payment proceeding in the Civil Court of the City of New York against the Company. The Receiver seeks payment of allegedly past due and unpaid rent and additional rent under the New York Lease. The Company vigorously denies that any rent or additional rent is due and owing under the New York Lease and has moved for an order removing this action to the Supreme Court, New York County, and consolidating it with the previously commenced action described above. The motion for removal and consolidation was denied by the Supreme Court and the matter has been proceeding in Civil Court. The Company has filed its answer, affirmative defenses and counterclaims and has moved for discovery in that action dated June 16, 2011. The motion and subsequent cross-motion were argued before the court on July 18, 2011. On October 5, 2011, that court granted the Company’s motion for discovery. On July 30, 2012 the Civil Court commenced a trial on the matter. The trial was concluded on December 19, 2012 and the respective parties filed post trial briefs and reply briefs with the Court on January 23 and February 5, 2013, respectively. A decision by the trial court is expected during the second quarter of 2013. See Note 7 – Accrued Expenses and Other Liabilities.
The Company has entered into licensing agreements with several companies for the use of certain trademarks for the marketing of products produced by the Company. These contracts normally have a term of three years and provide for minimum annual royalty payments. The future minimum royalty payments as of December 31, 2012 are set forth in the table below:
| Year | | (In thousands) | |
| 2013 | | $ | 1,990 | |
| 2014 | | | 2,712 | |
| 2015 | | | 3,215 | |
| | | $ | 7,917 | |
For the years ended December 31, 2012 and 2011, royalty expenses for licensing for continuing operations were approximately $3.4 million and $3.8 million, respectively.
The Company, in the normal course of business, issues binding purchase orders to secure product for future sales to its customers. At December 31, 2012, these open purchase order commitments amounted to approximately $12.3 million, of which approximately $6.2 million were covered by letters of credit. The majority of the product is scheduled to be received during the first six months of 2013, at which time these commitments will be fulfilled. In addition, there were standby letters of credit for approximately $2.0 million related to other matters.
The Company is from time to time involved in other litigation incidental to the conduct of its business, none of which is expected to be material to its business, financial condition or operations.
Note 14 – Fair Value Measurements
GAAP defines fair value as the exchange price that would be received for an asset or paid to transfer a liability (an exit price) in the principal or most advantageous market for the asset or liability in an orderly transaction between market participants on the measurement date. GAAP also established a fair value hierarchy which requires an entity to maximize the use of observable inputs and minimize the use of unobservable inputs when measuring fair value. As of December 31, 2012, the Company did not have any assets measured at fair value on a recurring basis that would require disclosure based on the fair value hierarchy of valuation techniques.
In addition, certain non-financial assets and liabilities are to be initially measured at fair value on a non-recurring basis. This includes items such as non-financial assets and liabilities initially measured at fair value in a business combination (but not measured at fair value in subsequent periods) and non-financial, long-lived assets measured at fair value for an impairment assessment. In general, non-financial assets and liabilities including goodwill and property and equipment are measured at fair value when there is an indication of impairment and are recorded at fair value only when impairment is recognized.
The Company recorded an impairment charge of $1.2 million in connection with the goodwill related to scott james® during 2011. See Note 6 – Goodwill and Intangible Assets.
Note 15 - Stock Plans, Compensation Plans and Retirement Savings Plan
Equity Plans
The Hampshire Group, Limited 2009 Stock Incentive Plan (the “Stock Plan”) is designed to assist the Company in attracting, retaining, motivating and rewarding key employees, officers, directors and consultants, and promoting the creation of long-term value for stockholders of the Company by closely aligning the interests of these individuals with those of the Company’s stockholders, though the Company’s stockholder will experience dilution when such shares vest. The Stock Plan permits the Company to award eligible persons nonqualified stock options, restricted stock, and other stock-based awards.
In connection with the adoption of the Stock Plan, the Board authorized 880,000 Stock Plan shares and approved grants of restricted stock under the Stock Plan to employees, managers, named executive officers and directors. Ten percent of each award of restricted stock was subject to time-based vesting (the “Time-Vested Shares”), and the remaining 90% of each award of restricted stock was subject to performance-based vesting (the “Performance-Vested Shares”). No Performance-Vested Shares vested during 2011. During the year ended December 31, 2012, 459,000 shares of non-vested restricted stock previously granted to certain employees who were participants in the Stock Plan were surrendered for cancellation by such employees pursuant to transactions that, with respect to each such employee, provided that such employee would be granted options to purchase Hampshire Common Stock in consideration for the cancellation of such shares of restricted stock held by it. In connection with such transactions, a total of 331,250 options were granted.
The following summarizes the activity for the Stock Plan’s non-vested restricted stock for the years ended December 31, 2012 and 2011:
| | | 2012 | | | 2011 | |
| | | Shares | | | Weighted Average Fair Value at Grant Date | | | Shares | | | Weighted Average Fair Value at Grant Date | |
| Non-vested at beginning of period | | | 502,375 | | | $ | 3.52 | | | | 840,184 | | | $ | 3.38 | |
| Granted – restricted stock | | | — | | | $ | — | | | | — | | | $ | — | |
| Forfeited | | | (472,875 | ) | | $ | 3.51 | | | | (316,375 | ) | | $ | 3.15 | |
| Vested | | | (29,500 | ) | | $ | 3.67 | | | | (21,434 | ) | | $ | 3.37 | |
| Non-vested at end of period | | | — | | | $ | — | | | | 502,375 | | | $ | 3.52 | |
In addition, during 2012, certain other employees who were participants in the Stock Plan were granted, in the aggregate, 375,750 options to purchase Hampshire Common Stock such that. Twenty-five percent (25%) of such options vested and became exercisable on December 31, 2012 and another twenty-five percent (25%) will vest and become exercisable on December 31st of each of 2013, 2014 and 2015, and the options will expire on March 30, 2022.
For the 707,000 options issued during the year under the Stock Plan, the Company used the Black-Scholes option pricing model to estimate the weighted average per share grant date fair value. The weighted average assumptions used in the Black-Scholes option pricing models included (1) a risk-free interest rate of 1% for the periods within the expected life of the option based on the U.S. Treasury yield curve in effect at the time of grant, (2) an expected life of options granted to be 6.1 years, the midpoint between the average vesting term and the contractual term, (3) an expected volatility of 79% for the periods of the expected life of the option determined using historical volatilities based on historical stock prices and (4) an expected dividend yield of 0% that is based on the Company’s historical practice and expected annual dividend.
A summary of stock options under the Stock Plan is presented in the table below:
| | 2012 | |
| | Options | | | Weighted- Average Exercise Price | | Weighted- Average Remaining Contractual Life | | | Aggregate Intrinsic Value | |
| Outstanding, beginning of period | — | | | $ | — | | | | | | |
| Granted during the period | 707,000 | | | $ | 2.25 | | | | | | |
| Exercised during the period | — | | | $ | — | | | | | | |
Canceled, forfeited or expired during the period | (151,750 | ) | | $ | 2.05 | | | | | | |
| Outstanding, end of period | 555,250 | | | $ | 2.30 | | 9.33 | | $ | 443,000 | |
| Vested and expected to vest at December 31, 2012 | 555,250 | | | $ | 2.30 | | 9.33 | | $ | 443,000 | |
| Exercisable, end of period | 138,812 | | | $ | 2.30 | | 9.33 | | $ | | 111,000 | |
Exercise prices for options outstanding under the Stock Plan at December 31, 2012 ranged from $2.05 to $3.48. The intrinsic value is based on the Company’s market price of stock at December 31, 2012 of $3.02.
The following table summarizes the stock options under the Stock Plan that are expected to vest is as follows:
| | | 2012 | |
| | | Options | | | Weighted Average Exercise Price | | | Weighted Average Grant Date Fair- Value | |
| Unvested, beginning of period | | | — | | | $ | — | | | $ | — | |
| Granted during the period | | | 707,000 | | | $ | 2.25 | | | $ | 1.54 | |
| Vested during the period | | | (138,812 | ) | | $ | 2.30 | | | $ | 1.58 | |
| Canceled , forfeited or expired during the period | | | (151,750 | ) | | $ | 2.05 | | | $ | 1.40 | |
| Unvested, end of period | | | 416,438 | | | $ | 2.30 | | | $ | 1.58 | |
Separate from the Stock Plan, the Company granted 100,000 stock options (the “Options”) on May 2, 2011 to the chief executive officer. The Options expire ten years from the grant date and vest ratably over two years following the grant date, subject to the chief executive officer’s continued service through the applicable vesting dates. 33,333 of the Options vested on the grant date and an additional 33,333 of the Options vested on May 2, 2012. As of December 31, 2012 33,334 of the Options were unvested. The weighted average exercise price was $3.09 per option. During fiscal year 2012, no Options were exercised, forfeited or expired. The remaining contractual term for the Options is approximately 8.3 years. The weighted average per share grant date fair value of the Options was $1.92 per option. The Company used the Black-Scholes option pricing model to estimate the weighted average per share grant date fair value. The assumptions used in the Black-Scholes option pricing model included (1) a risk-free interest rate of 3% for the periods within the expected life of the option based on the U.S. Treasury yield curve in effect at the time of grant, (2) an expected life of options granted to be 5.5 years, the midpoint between the average vesting term and the contractual term, (3) an expected volatility of 70% for the periods of the expected life of the option determined using historical volatilities based on historical stock prices and (4) an expected dividend yield of 0% that is based on the Company’s historical practice and expected annual dividend. Subsequent to December 31, 2012, the Company’s chief executive officer resigned, and the remaining unvested options were forfeited at that time. See Note 19 – Restructuring and Cost Savings Plan.
The Company also granted 100,000 restricted stock units (“RSUs”) on May 2, 2011 to the chief executive officer. Each RSU represents the right to receive one share of the Company’s common stock upon settlement. The RSUs will vest and settle ratably over two years following the grant date, subject to the chief executive officer’s continued service through the applicable vesting dates. As previously noted, subsequent to December 31, 2012, the Company’s chief executive officer resigned, and the remaining unvested RSUs were forfeited at that time.
The following table summarizes the activity for the non-vested RSUs granted on May 2, 2011 for the years ended December 31, 2012 and 2011:
| | | 2012 | | | 2011 | |
| | | Shares | | | Weighted Average Fair Value at Grant Date | | | Shares | | | Weighted Average Fair Value at Grant Date | |
| Non-vested at beginning of period | | | 100,000 | | | $ | 3.09 | | | | — | | | $ | — | |
| Granted | | | — | | | | — | | | | 100,000 | | | | 3.09 | |
| Forfeited | | | — | | | | — | | | | — | | | | — | |
| Vested | | | (66,667 | ) | | | 3.09 | | | | — | | | | — | |
| Non-vested at end of period | | | 33,333 | | | $ | 3.09 | | | | 100,000 | | | $ | 3.09 | |
On August 25, 2011 the Company granted 150,000 restricted shares of the Hampshire Common Stock (the “Restricted Stock”) to the chief executive officer. The shares of Restricted Stock will vest ratably over two years following the grant date, subject to the chief executive officer’s continued service through the applicable vesting dates. As noted above, the Company’s chief executive officer resigned subsequent to December 31, 2012 and the remaining unvested restricted shares were forfeited at that time.
The following table summarizes the activity for the non-vested Restricted Stock granted on August 25, 2011 for the year ended December 31, 2011:
| | | 2012 | | | 2011 | |
| | | Shares | | | Weighted Average Fair Value at Grant Date | | | Shares | | | Weighted Average Fair Value at Grant Date | |
| Non-vested at beginning of period | | | 100,000 | | | $ | 2.74 | | | | — | | | $ | — | |
| Granted | | | — | | | $ | — | | | | 150,000 | | | $ | 2.74 | |
| Forfeited | | | — | | | $ | — | | | | — | | | $ | — | |
| Vested | | | (50,000 | ) | | $ | 2.74 | | | | (50,000 | ) | | $ | 2.74 | |
| Non-vested at end of period | | | 50,000 | | | $ | 2.74 | | | | 100,000 | | | $ | 2.74 | |
Compensation expense related to the equity plans is recorded in Selling, general and administrative expense in the consolidated statements of operations on a straight-line basis over the vesting periods. During the years ended December 31, 2012 and 2011, the Company incurred $0.8 million and $0.4 million in compensation cost related to all stock awards and was reflected as non-cash equity compensation on the Consolidated Statements of Cash Flows. At December 31, 2012, there was $0.6 million in unrecognized compensation expense related to stock awards to be recognized over a period of approximately three years.
Cash Incentive Plan
The Company adopted The Hampshire Group, Limited 2010 Cash Incentive Bonus Plan (the “Bonus Plan”) pursuant to which the Company will grant annual performance-based bonuses to certain of its employees. The goal of the Bonus Plan is to align the annual interests of management and other key employees with those of the Company and its stockholders by providing a cash bonus incentive for meeting annual goals set by the Board. Target bonus amounts under the Bonus Plan are a percentage of each participant’s base salary, and actual bonus amounts paid under the Bonus Plan will depend on the extent to which annual performance metrics are achieved. The Company did not grant a bonus under the Bonus Plan for fiscal years 2012 and 2011.
Retirement Savings Plan
The Company and certain subsidiaries have a 401(k) retirement savings plan under which employees may participate after having completed certain service requirements and meeting certain age requirements. The Company's matching contribution is determined annually at the discretion of the Board. All Company matching contributions vest fully after six years of employment. The Board suspended matching contributions in May 2009 and resumed matching contributions effective January 1, 2012. Matching contributions for the year ended December 31, 2012 were $0.1 million.
Note 16 - Related Party Transactions
Upon closing on August 25, 2011, pursuant to the Merger Agreement, the Company paid to the equityholders of Rio (the “Equityholders”) a total of $7.0 million in cash, $3.5 million of which was deposited into an escrow account pending certain post-closing purchase price adjustments. Approximately $0.4 million due from escrow relating to a purchase price adjustment is recorded in Other receivables as of December 31, 2011. Additionally, the Company issued to the Equityholders an aggregate of $2.6 million of Hampshire Common Stock and held back an additional $6.5 million of Hampshire Common Stock for potential post-closing purchase price adjustments and indemnification claims. The Equityholders include Mr. Buxbaum, a director of the Company who was appointed to the position of chief executive officer subsequent to December 31, 2012. See Note 19 – Restructuring and Cost Savings Plan. The Equityholders also include current director Mr. Yogel and the current president of Rio, Mr. Gren.
In addition, pursuant to the Merger Agreement, at closing the Company repaid to Buxbaum Company, LLC, an entity affiliated with, and controlled by, Mr. Buxbaum, indebtedness of Rio totaling $2.2 million, YIH III, LLC, an entity affiliated with, and controlled by, Mr. Yogel, indebtedness of Rio totaling $0.8 million, and repaid to David Gren indebtedness of Rio totaling $0.1 million. In addition, Buxtradefina, LLC (“BTF”), an entity affiliated with, and controlled by, Mr. Buxbaum, was a co-obligor of a promissory note issued by Rio to a third party; in connection with the Merger Agreement, the Company agreed to indemnify BTF for any amounts required to be paid by BTF under the terms of such note. The promissory note issued by Rio was fully paid as of December 31, 2011.
During 2012, in respect of a net working capital purchase price adjustment, approximately $1.4 million of the escrowed amount was paid to the equity holders’ representative and approximately $0.3 million was released to the Company pursuant to the terms of the merger agreement. An additional $1.8 million of the escrowed amount was paid to the Equityholders relating to Rio’s 2011 “Adjusted EBITDA,” as determined in accordance with the merger agreement.
Also, an additional installment of purchase price which included contingent consideration in the amount of approximately $6.5 million was to be paid to the sellers based on post-closing purchase price adjustments in accordance with the Merger Agreement. As a result of Rio’s 2011 Adjusted EBITDA multiplied by three equaling or exceeding $23.0 million and the release of certain shares previously being held back in connection with potential tax indemnification claims, during 2012, the Company issued to a representative of the Equityholders a total of $3.0 million of Hampshire Common Stock pursuant to the terms of the merger agreement. The remaining recorded value of the contingent consideration of $3.5 million approximates fair value at December 31, 2012.
On March 7, 2013, the Company entered into a letter agreement with the former Rio equity holders amending the Merger Agreement such that the approximately $3.0 million of contingent consideration which was due to the former Rio equity holders within 5 days of 18 months of the closing date will be paid no later than the earlier of April 1, 2013 or within 5 days of an ownership change as defined by Internal Revenue Code Section 382 (“Section 382”). Under Section 382 the utilization of our net operating losses and tax credit carry-forwards may be subject to substantial annual limitations or expiration due to ownership changes. The events that may cause ownership changes include, but are not limited to, a cumulative stock ownership change greater than 50% over a three year period.
The Company paid approximately $0.2 million for screen printing services to a vendor affiliated with Mr. Gren for each of the years ended December 31, 2012 and 2011. Accounts payable to this vendor was approximately $0 and $0.1 million at December 31, 2012 and 2011, respectively.
Note 17 – Dispositions and Discontinued Operations
The Company continually reviews its portfolio of labels, business lines and divisions to evaluate whether they meet profitability and performance requirements and are in line with the Company’s business strategy. As a part of this review, the Company has disposed and discontinued operations of certain divisions as outlined below.
On May 5, 2011, in two separate transactions, the Company sold certain assets of Hampshire Designers for a total purchase price of $12.0 million, plus inventory valued at approximately $2.4 million, and certain assets of Item-Eyes for a total purchase price of $0.3 million, plus inventory and factory advances valued at approximately $0.9 million, to third party buyers. Inventory in transit, valued at $1.6 million and $0.4 million for Hampshire Designers and Item-Eyes, respectively, was also purchased by each buyer and was payable upon delivery. As part of the sale transactions, the Company transferred and assigned certain assets, primarily the divisions’ trademark labels, to each respective buyer.
As part of the sale transactions, the Company agreed to provide to each respective buyer certain transitional services for fixed fees and for a limited period of time following closing. Further, in connection with the sale transactions, the Company entered into a separation and release agreement with the president of the Company’s now former women’s division, effective May 6, 2011, that entitled him to separation pay of $0.6 million.
In addition, each buyer assumed outstanding vendor and customer purchase orders and outstanding orders for shipments of goods-in-transit and the Item-Eyes buyer assumed certain open letters of credit. In each case, the Company retained ownership of its accounts receivable relating to the inventory sales made prior to the closing date and accounts payable relating to the inventory sold. The Company recognized a pre-tax gain of $12.1 million on the sale of Hampshire Designers and a pre-tax loss of $0.3 million on the sale of Item-Eyes net of, among other things, severance and transaction related costs. The Company believes its net operating loss carryforwards will offset any tax liability resulting from the net gain. The funds from the sale of assets and the liquidation of the remaining assets were used to fund operations and other general corporate purposes.
The assets and liabilities of the discontinued operations are presented in the consolidated balance sheets under the captions Assets of discontinued operations and Liabilities of discontinued operations. The underlying assets and liabilities of the discontinued operations for the years ended December 31, 2012 and 2011 were as follows:
| (In thousands) | 2012 | | 2011 | |
| Other receivables | | | 122 | | | | 170 | |
| Other current assets | | | 1 | | | | 4 | |
| Assets of discontinued operations | | $ | 123 | | | $ | 174 | |
| | | | | | | | | |
| Accounts payable | | $ | — | | | $ | 237 | |
| Accrued expenses and other liabilities | | | 220 | | | | 833 | |
| Liabilities of discontinued operations | | $ | 220 | | | $ | 1,070 | |
At December 31, 2012 and 2011, approximately $0 and $0.2 million, respectively, remains accrued in Accrued expenses and other liabilities in the table above relating to divisions disposed and discontinued prior to 2011.
The operating results for the discontinued operations for the years ended December 31, 2012 and 2011 were as follows:
| (In thousands) | | 2012 | | | 2011 | |
| Net sales | | $ | — | | | $ | 16,311 | |
| | | | | | | | | |
| Gross loss | | $ | — | | | $ | (2,455 | ) |
| | | | | | | | | |
| Gain on sale of discontinued operations | | $ | — | | | $ | 11,814 | |
| | | | | | | | | |
| Income from discontinued operations before income taxes | | $ | 783 | | | $ | 10,341 | |
| Income tax provision | | | — | | | | — | |
Income from discontinued operations, net of taxes | | $ | 783 | | | $ | 10,341 | |
Note 18 –Loss Per Share
Set forth in the table below is the reconciliation by year of the numerator (loss from continuing operations) and the denominator (shares) for the computation of basic and diluted loss per share ("EPS"):
| (In thousands, except per share data) | | Numerator Income (Loss) | | | Denominator Shares | | | Per Share Amount | |
| 2012: | | | | | | | | | |
| Basic loss from continuing operations | | $ | (12,522 | ) | | | 7,271 | | | $ | (1.72 | ) |
| Effect of dilutive securities: | | | | | | | | | | | | |
| Preferred stock rights | | | — | | | | — | | | | — | |
| Restricted stock | | | — | | | | — | | | | — | |
| Stock options | | | — | | | | — | | | | — | |
| Diluted loss from continuing operations | | $ | (12,522 | ) | | | 7,271 | | | $ | (1.72 | ) |
| 2011: | | | | | | | | | | | | |
| Basic loss from continuing operations | | $ | (20,301 | ) | | | 5,941 | | | $ | (3.41 | ) |
| Effect of dilutive securities: | | | | | | | | | | | | |
| Preferred stock rights | | | — | | | | — | | | | — | |
| Restricted stock | | | — | | | | — | | | | — | |
| Diluted loss from continuing operations | | $ | (20,301 | ) | | | 5,941 | | | $ | (3.41 | ) |
For the years ended December 31, 2012 and 2011, potentially dilutive shares of 688,583, and 622,500, respectively, were excluded from the calculation of dilutive shares because their effect would have been anti-dilutive. These shares consist of stock options and RSUs at December 31, 2012. At December 31, 2011, these shares consist of Performance Vested Shares and RSUs. See Note 14 - Stock Plans, Compensation Plans and Retirement Savings Plan.
Note 19 – Restructuring and Cost Savings Plan
During the current year the Company initiated a cost savings plan primarily related to workforce reduction. The Company has incurred approximately $0.6 million in severance costs related to personnel reductions for the year ended December 31, 2012. Severance costs are included in Restructuring costs in the consolidated statement of operations. A reconciliation of the beginning and ending liability balances for severance costs under the current year restructuring plan included in Accrued expenses and other liabilities on the consolidated balance sheet is shown below:
(In thousands) | | Accrued Severance | |
| Beginning of period | | $ | — | |
| Costs charged to expense | | | 644 | |
| Costs paid or settled | | | (401 | ) |
| End of period | | $ | 243 | |
Note 20 – Subsequent Events
On January 15, 2013, Heath L. Golden resigned as chief executive officer of the Company. In connection with the resignation, the Company entered into a separation and release agreement with Mr. Golden that entitled him to separation pay of approximately $0.7 million to be paid in several installments through a date no later than May 15, 2013. At the time of the resignation, the Company’s Board of Directors (the “Board”) appointed Paul Buxbaum to serve as the Company’s new chief executive officer.
On January 28, 2013, the Company entered into a letter agreement (the “Agreement”) with Buxbaum Holdings, Inc., d/b/a Buxbaum Group (“Buxbaum Group”). Pursuant to the Agreement, Buxbaum Group will provide certain restructuring and advisory consulting services, including providing the services of Paul Buxbaum to serve as the Company’s Chief Executive Officer, in exchange for a fee of $75,000 per month during the period commencing on January 16, 2013 and ending (unless extended by mutual agreement) on May 16, 2013 (the “Term”). Mr. Buxbaum will not be entitled to any direct compensation from the Company in respect of his service as its Chief Executive Officer.
During the Term, Buxbaum Group will be tasked with providing specific recommendations to the Board in order to restructure the organization, operations and expenses to better support the Company’s business model and sales levels. Additionally, Buxbaum Group will be responsible for the implementation of such recommendations to the extent adopted by the Board.
(b) Unaudited Quarterly Financial Information
The tables herein set forth the Company’s unaudited condensed consolidated 2012 and 2011 quarterly statements of operations.
The following tables set forth the Company’s unaudited condensed consolidated statement of operations for the 2012 quarters ended:
| (In thousands, except per share data) | | March 31, 2012 | | | June 30, 2012 | | | September 29, 2012 | | | December 31, 2012 | |
| Net sales | | $ | 22,592 | | | $ | 18,149 | | | $ | 36,309 | | | $ | 40,510 | |
| | | | | | | | | | | | | | | | | |
| Gross profit | | | 3,828 | | | | 4,263 | | | | 7,207 | | | | 8,156 | |
| Selling, general and administrative expenses | | | 9,031 | | | | 8,168 | | | | 8,349 | | | | 8,417 | |
| Restructuring costs | | | 40 | | | | 101 | | | | 259 | | | | 244 | |
| Loss from operations | | | (5,243 | ) | | | (4,006 | ) | | | (1,401 | ) | | | (505 | ) |
| Loss from continuing operations before income taxes | | | (5,294 | ) | | | (4,093 | ) | | | (1,413 | ) | | | (681 | ) |
| Provision for income taxes | | | 46 | | | | 46 | | | | 10 | | | | 939 | |
Loss from continuing operations | | | (5,340 | ) | | | (4,139 | ) | | | (1,423 | ) | | | (1,620 | ) |
| Income (loss) from discontinued operations, net of taxes | | | 386 | | | | 373 | | | | (99 | ) | | | 123 | |
| Net loss | | $ | (4,954 | ) | | $ | (3,766 | ) | | $ | (1,522 | ) | | $ | (1,497 | ) |
| | | | | | | | | | | | | | | | | |
| Basic income (loss) per share: | | | | | | | | | | | | | | | | |
| Loss from continuing operations | | $ | (0.80 | ) | | $ | (0.56 | ) | | $ | (0.19 | ) | | $ | (0.22 | ) |
| Income (loss) from discontinued operations, net of taxes | | | 0.06 | | | | 0.05 | | | | (0.01 | ) | | | 0.02 | |
| Net income (loss) | | $ | (0.74 | ) | | $ | (0.51 | ) | | $ | (0.20 | ) | | $ | (0.20 | ) |
| | | | | | | | | | | | | | | | | |
| Diluted income (loss) per share: | | | | | | | | | | | | | | | | |
| Loss from continuing operations | | $ | (0.80 | ) | | $ | (0.56 | ) | | $ | (0.19 | ) | | $ | (0.22 | ) |
| Income (loss) from discontinued operations, net of taxes | | | 0.06 | | | | 0.05 | | | | (0.01 | ) | | | 0.02 | |
| Net income (loss) | | $ | (0.74 | ) | | $ | (0.51 | ) | | $ | (0.20 | ) | | $ | (0.20 | ) |
The following tables set forth the Company’s unaudited condensed consolidated statement of operations for the 2011 quarters ended:
| (In thousands, except per share data) | | April 2, 2011 | | | July 2, 2011 | | | October 1, 2011 | | | December 31, 2011 | |
| Net sales | | $ | 3,511 | | | $ | 3,467 | | | $ | 33,492 | | | $ | 45,678 | |
| | | | | | | | | | | | | | | | | |
| Gross profit (loss) | | | 731 | | | | (27 | ) | | | 5,639 | | | | 8,217 | |
| Selling, general and administrative expenses | | | 4,277 | | | | 5,875 | | | | 8,667 | | | | 9,158 | |
| Restructuring costs | | | | | | | 73 | | | | 59 | | | | 47 | |
| Loss on lease obligation | | | — | | | | — | | | | — | | | | 6,306 | |
| Goodwill impairment loss | | | — | | | | 1,204 | | | | — | | | | — | |
| Loss from operations | | | (3,546 | ) | | | (7,179 | ) | | | (3,087 | ) | | | (7,294 | ) |
| Loss from continuing operations before income taxes | | | (3,626 | ) | | | (7,300 | ) | | | (3,234 | ) | | | (7,113 | ) |
| Provision (benefit) for income taxes | | | 69 | | | | (27 | ) | | | (1,056 | ) | | | 42 | |
Loss from continuing operations | | | (3,695 | ) | | | (7,273 | ) | | | (2,178 | ) | | | (7,155 | ) |
| Income (loss) from discontinued operations, net of taxes | | | (1,302 | ) | | | 10,386 | | | | 356 | | | | 901 | |
| Net income (loss) | | $ | (4,997 | ) | | $ | 3,113 | | | $ | (1,822 | ) | | $ | (6,254 | ) |
| | | | | | | | | | | | | | | | | |
| Basic income (loss) per share: | | | | | | | | | | | | | | | | |
| Loss from continuing operations | | $ | (0.67 | ) | | $ | (1.30 | ) | | $ | (0.36 | ) | | $ | (1.08 | ) |
| Income (loss) from discontinued operations, net of taxes | | | (0.23 | ) | | | 1.85 | | | | 0.06 | | | | 0.14 | |
| Net income (loss) | | $ | (0.90 | ) | | $ | 0.55 | | | $ | (0.30 | ) | | $ | (0.94 | ) |
| | | | | | | | | | | | | | | | | |
| Diluted income (loss) per share: | | | | | | | | | | | | | | | | |
| Loss from continuing operations | | $ | (0.67 | ) | | $ | (1.30 | ) | | $ | (0.36 | ) | | $ | (1.08 | ) |
| Income (loss) from discontinued operations, net of taxes | | | (0.23 | ) | | | 1.85 | | | | 0.06 | | | | 0.14 | |
| Net income (loss) | | $ | (0.90 | ) | | $ | 0.55 | | | $ | (0.30 | ) | | $ | (0.94 | ) |
Item 9. Changes in and Disagreements With Accountants on Accounting and Financial Disclosure.
On September 18, 2012, we dismissed BDO USA, LLP as our independent registered public accountants. Concurrently, and upon the recommendation and approval of the Audit Committee, we engaged Elliott Davis, LLC as our independent registered public accountants for the fiscal year ended December 31, 2012. See “Item 4.01 Changes in Registrant’s Certifying Accountant” in our Form 8-K filed with the SEC on September 21, 2012.
Item 9A. Controls and Procedures.
(a) Controls and Procedures
The Company’s Chief Executive Officer and Chief Financial Officer carried out an evaluation of the effectiveness of the Company’s disclosure controls and procedures, as of the end of the period covered by this Annual Report on Form 10-K. Based upon that evaluation, the Chief Executive Officer and Chief Financial Officer concluded that, as of the end of the period covered by this report, the Company’s disclosure controls and procedures were effective such that information relating to the Company (including its combined subsidiaries) required to be disclosed in the Company’s SEC reports (1) is recorded, processed, summarized and reported within the time periods specified in the SEC rules and forms and (2) is accumulated and communicated to the Company’s management, including the Chief Executive Officer and Chief Financial Officer, as appropriate, to allow timely decisions regarding required disclosure.
(b) Management’s Report on Internal Control Over Financial Reporting
The management of the Company is responsible for establishing and maintaining adequate internal control over financial reporting, as such term is defined in Rules 13a-15(f) and 15d-15(f) under the Exchange Act. There are inherent limitations on the effectiveness of any system of internal controls and procedures, including the possibility of human error and the circumvention or overriding of the controls and procedures. Accordingly, even effective internal controls and procedures provide only reasonable assurance of achieving their objectives.
In connection with filing this Annual Report, management assessed the effectiveness of its internal control over financial reporting as of December 31, 2012.
In making its assessments, management used the criteria set forth by the Committee of Sponsoring Organizations of the Treadway Commission in Internal Control—Integrated Framework. Management has determined that no material weaknesses in its internal control over financial reporting existed as of December 31, 2012, and based on the criteria noted above, concluded that its internal control over financial reporting was effective as of December 31, 2012.
This annual report does not include an attestation report of the Company’s registered public accounting firm regarding internal control over financial reporting. Management’s report was not subject to attestation by the Company’s registered public accounting firm pursuant to rules of the SEC that permit the Company to provide only management’s report in this annual report.
(c) Changes in Internal Control Over Financial Reporting
There were no changes in the Company's internal control over financial reporting during the three months ended December 31, 2012 that materially affected, or are reasonably likely to materially affect, the Company's internal control over financial reporting.
Item 9B. Other Information.
Not applicable.
PART III.
Item 10. Directors, Executive Officers and Corporate Governance.
The information required by this item is incorporated by reference from our definitive proxy statement to be filed with the SEC within 120 days after the Company’s fiscal year end of December 31, 2012 pursuant to Regulation 14A of the Exchange Act.
Item 11. Executive Compensation.
The information required by this item is incorporated by reference from our definitive proxy statement to be filed with the SEC within 120 days after the Company’s fiscal year end of December 31, 2012 pursuant to Regulation 14A of the Exchange Act.
Item 12. Security Ownership of Certain Beneficial Owners and Management and Related Stockholder Matters. Except as provided herein, the information required by this item is incorporated by reference from our definitive proxy statement to be filed with the SEC within 120 days after the Company’s fiscal year end of December 31, 2012 pursuant to Regulation 14A of the Exchange Act.
The following table provides information as of December 31, 2012 with respect to shares of the Company’s common stock that may be issued under equity compensation plans:
| EQUITY COMPENSATION PLAN INFORMATION | |
| Plan Category | | (a) Number of Securities to be Issued Upon Exercise of Outstanding Options, Warrants, and Rights | | | (b) Weighted Average Exercise Price of Outstanding Options, Warrants, and Rights | | | (c) Number of Securities Remaining Available for Future Issuance Under Equity Compensation Plans (Excluding Securities Reflected in Column (a) | |
Equity Compensation Plans Approved by Stockholders | | None | | | | N/A | | | None | |
| Equity Compensation Plans Not Approved by Stockholders | | | 688,583 | | | $ | 2.45 | | | | 324,750 | |
Total | | | 688,583 | | | $ | 2.45 | | | | 324,750 | |
See Item 7. Management’s Discussion and Analysis of Financial Condition and Results of Operations – Stock and Compensation Plans and Item 8. Financial Statements and Supplementary Data Note 15 – Stock Plans, Compensation Plans and Retirement Savings Plan to the audited consolidated financial statements for additional discussion.
Item 13. Certain Relationships and Related Transactions, and Director Independence.
The information required by this item is incorporated by reference from our definitive proxy statement to be filed with the SEC within 120 days after the Company’s fiscal year end of December 31, 2012 pursuant to Regulation 14A of the Exchange Act.
Item 14. Principal Accounting Fees and Services.
The information required by this item is incorporated by reference from our definitive proxy statement to be filed with the SEC within 120 days after the Company’s fiscal year end of December 31, 2012 pursuant to Regulation 14A of the Exchange Act.
PART IV.
Item 15. Exhibits, Financial Statement Schedules.
| (a) | The following documents are filed as part of this Report: |
The following consolidated financial statements of Hampshire Group, Limited for each of the years ended December 31, 2012 and 2011 are submitted in Part II, Item 8. Financial Statements and Supplementary Data of this report:
| Description | | Page | |
| Consolidated Balance Sheets — December 31, 2012 and 2011 | | 28 | |
| Consolidated Statements of Operations — For each of the years ended December 31, 2012 and 2011 | | 29 | |
| Consolidated Statements of Stockholders’ Equity— For each of the years ended December 31, 2012 and 2011 | | 30 | |
| Consolidated Statements of Cash Flows — For each of the years ended December 31, 2012 and 2011 | | 31 | |
| Notes to Consolidated Financial Statements | | 32 | |
| | 2. | Financial Statement Schedules: |
The following consolidated financial statement schedule of Hampshire Group, Limited is included on page 63 of this report.
II — Valuation and Qualifying Accounts and Reserves
All schedules for which provision is made in the applicable accounting regulation of the SEC, but which are excluded from this report, are not required under the related instructions or are inapplicable, and therefore have been omitted.
| | 3. | Exhibits: |
| | | |
| | 3.1 | Restated Certificate of Incorporation of Hampshire Group, Limited (incorporated by reference to the Company’s Annual Report on Form 10-K for the year ended December 31, 2004 (File No. 000-20201) on March 15, 2005). |
| | | |
| | 3.2 | Certificate of Amendment and Restatement of the Certificate of Incorporation of Hampshire Group, Limited (incorporated by reference to the Company’s Annual Report on Form 10-K for the year ended December 31, 2004 (File No. 000-20201) on March 15, 2005). |
| | | |
| | 3.3 | Amended and Restated By-Laws of Hampshire Group, Limited (incorporated by reference to Exhibit 3.2 to the Company’s Current Report (File No. 000-20201) on Form 8-K on August 15, 2008). |
| | | |
| | 3.4 | Certificate of Amendment of Restated Certificate of Incorporation of Hampshire Group, Limited (incorporated by reference to Exhibit 3.1 to the Company’s Quarterly Report (File No. 000-20201) on Form 10-Q filed on November 15, 2011). |
| | | |
| | 3.4 | Certificate of Designation of Series A Junior Participating Preferred Stock (incorporated by reference to Exhibit 3.1 to the Company’s Current Report (File No. 000-20201) on Form 8-K filed on August 15, 2008). |
| | | |
| | 4.1 | Registration statement on Form S-8 filed by Hampshire Group, Limited to register 880,000 shares of the Company’s common stock, par value $0.10 per share, which may be issued under the Company’s 2009 Stock Incentive Plan (incorporated by reference to the Current Report (File No. 000-20201) on Form S-8 on November 4, 2009). |
| | | |
| | 4.2 | Rights Agreement, dated as of August 13, 2008, between Hampshire Group, Limited and Mellon Investor Services LLC, as Rights Agent (incorporated by reference to Exhibit 3.1 to the Company’s Current Report (File No. 000-20201) on Form 8-K on August 15, 2008). |
| | 4.3 | First Amendment to Rights Agreement, dated as of February 23, 2009, by and between Hampshire Group, Limited and Mellon Investor Services LLC, as Rights Agent (incorporated by reference to Exhibit 3.3 to the Company’s Current Report on Form 8-K on February 24, 2009). |
| | | |
| | 4.4 | Second Amendment to Rights Agreement, dated as of June 13, 2011 by and between Hampshire Group, Limited and Mellon Investor Services LLC, as Rights Agent (incorporated by reference to Exhibit 3.1 to the Company’s Current Report on Form 8-K filed on June 17, 2011). |
| | | |
| | 10.1* | Form of Hampshire Group, Limited and Subsidiaries 401(k) Retirement Savings Plan (incorporated by reference to the Company’s Annual Report on Form 10-K for the year ended December 31, 2004 (File No. 000-20201) on March 15, 2005). |
| | | |
| | 10.2* | Form of Hampshire Group, Limited Stock Option Plan Amended and Restated effective June 7, 1995 (incorporated by reference to the Company’s Annual Report on Form 10-K for the year ended December 31, 2004 (File No. 000-20201) on March 15, 2005). |
| | | |
| | 10.3* | Form of Hampshire Group, Limited and Affiliates Common Stock Purchase Plan for Directors and Executives Amended June 7, 1995 (incorporated by reference to the Company’s Annual Report on Form 10-K for the year ended December 31, 2004 (File No. 000-20201) on March 15, 2005). |
| | | |
| | 10.4* | Form of Hampshire Group, Limited Management Incentive Bonus Plan (incorporated by reference to Appendix A to the Company's Proxy Statement filed October 21, 2002). |
| | | |
| | 10.5* | Employment Agreement, dated April 3, 2007, by and between Jonathan Norwood and Hampshire Group, Limited (incorporated by reference to Exhibit 10.1 to the Company’s Current Report (File No. 000-20201) on Form 8-K filed on April 3, 2007). |
| | | |
| | 10.6* | Employment Agreement, dated April 3, 2007, by and between Heath Golden and Hampshire Group, Limited (incorporated by reference to Exhibit 10.2 to the Company’s Current Report (File No. 000-20201) on Form 8-K filed on April 3, 2007). |
| | | |
| | 10.7* | Indemnification Agreement, dated as of August 21, 2006, by and between Jonathan Norwood and Hampshire Group, Limited (incorporated by reference to Exhibit 10.1 to the Company's Current Report (File No. 000-20201) on Form 8-K filed on August 24, 2006). |
| | | |
| | 10.8* | Letter Agreement, dated August 21, 2006, by and between Jonathan Norwood and Hampshire Group, Limited (incorporated by reference to Exhibit 10.2 to the Company's Current Report (File No. 000-20201) on Form 8-K filed on August 24, 2006). |
| | | |
| | 10.9* | Indemnification Agreement, dated as of September 11, 2006, by and between Heath L. Golden and Hampshire Group, Limited (incorporated by reference to Exhibit 10.2 to the Company’s Current Report (File No. 000-20201) on Form 8-K filed on September 12, 2006). |
| | | |
| | 10.10* | Form of Hampshire Group, Limited Stock Option Plan amended and restated effective February 8, 2000 (incorporated by reference to Exhibit 10.5 to the Registrant’s Quarterly Report (File No. 000-20201) on Form 10-Q filed on August 8, 2005). |
| | | |
| | 10.11 | Lease Agreement between CHARNEY-FPG 114 41ST STREET, LLC and Hampshire Group, Limited, dated as of July 11, 2007 (incorporated by reference to Exhibit 10.1 to the Company's Current Report (File No. 000-20201) on Form 8-K filed on July 13, 2007). |
| | | |
| | 10.12 | Lease Agreement between CK Holdings LLC and Hampshire Designers, Inc., dated as of March 20, 2006 (incorporated by reference to Exhibit 10.14 to the Registrant’s Annual Report (File No. 000-20201) on Form 10-K filed on March 13, 2006). |
| | | |
| | 10.13* | Indemnification Agreement, dated as of January 4, 2007, by and between Harvey L. Sperry and Hampshire Group, Limited (incorporated by reference to Exhibit 10.1 to the Company’s Current Report (File No. 000-20201) on Form 8-K filed on January 5, 2007). |
| | 10.14* | Indemnification Agreement, dated as of January 4, 2007, by and between Irwin W. Winter and Hampshire Group, Limited (incorporated by reference to Exhibit 10.1 to the Company’s Current Report (File No. 000-20201) on Form 8-K filed on January 5, 2007). |
| | | |
| | 10.15 | Credit Agreement among HSBC Bank USA, as agent, the Banks named therein and Hampshire Group, Limited, dated February 15, 2008 (incorporated by reference to Exhibit 10.33 to the Company’s Current Report (File No. 000-20201) on Form 10-K filed on March 21, 2011). |
| | | |
| | 10.16* | Hampshire Group, Limited Long-Term Bonus Plan, dated February 28, 2008 (incorporated by reference to Exhibit 10.1 to the Company’s Current Report (File No. 000-20201) on Form 8-K filed on March 4, 2008). |
| | | |
| | 10.17 | Amended and Restated Credit Agreement and Guaranty, dated as of February 15, 2008, among Hampshire Group, Limited, Hampshire Designers, Inc., Item-Eyes, Inc., SB Corporation and Shane Hunter, Inc.; HSBC Bank USA, National Association (“HSBC”), JPMorgan Chase Bank, N.A., Israel Discount Bank of New York, Wachovia Bank, National Association, Bank Leumi USA and Sovereign Bank, as Banks; and HSBC, as Letter of Credit Issuing Bank and as Agent for the Banks (incorporated by reference to Exhibit 10.35 to the Company’s Current Report (File No. 000-20201) on Form 10-K filed on March 21, 2011). |
| | | |
| | 10.18 | Amendment No. 1, dated as of April 15, 2008, to that certain Amended and Restated Credit Agreement and Guaranty, dated as of February 15, 2008, by and among Hampshire Group, Limited, Hampshire Designers, Inc., Item-Eyes, Inc., SB Corporation, and Shane Hunter, Inc.; HSBC Bank USA, National Association (“HSBC”), JPMorgan Chase Bank, N.A., Israel Discount Bank of New York, Wachovia Bank, National Association, Bank Leumi USA and Sovereign Bank, as Banks; and HSBC, as Letter of Credit Issuing Bank and as Agent for the Banks (incorporated by reference to Exhibit 10.1 to the Company's Current Report (File No. 000-20201) on Form 8-K filed on April 22, 2008). |
| | | |
| | 10.19 | Amendment No. 2 to Amended and Restated Credit Agreement and Guaranty, dated as of August 4, 2008, by and among Hampshire Group, Limited, Hampshire Designers, Inc., Item-Eyes, Inc., Shane Hunter, Inc. SB Corporation, the Banks party thereto and HSBC Bank USA, National Association, as Agent for the Banks (incorporated by reference to Exhibit 10.2 to the Company's Current Report (File No. 000-20201) on Form 8-K filed on August 5, 2008). |
| | | |
| | 10.20 | Second Amended and Restated Credit Agreement and Guaranty, dated as of August 7, 2009, by and among Hampshire Group, Limited, Hampshire Designers, Inc., and Item-Eyes, Inc.; HSBC Bank USA, National Association (“HSBC”), JPMorgan Chase Bank, N.A., Wachovia Bank, National Association, Bank Leumi USA and Sovereign Bank, as Banks; and HSBC, as Letter of Credit Issuing Bank and as Agent for the Banks (incorporated by reference to Exhibit 10.38 to the Company’s Current Report (File No. 000-20201) on Form 10-K filed on March 21, 2011). |
| | | |
| | 10.21 | Amendment No. 1, dated as of May 7, 2010, to that certain Second Amended and Restated Credit Agreement and Guaranty, dated as of August 7, 2009, by and among Hampshire Group, Limited, Hampshire Designers, Inc., and Item-Eyes, Inc.; HSBC Bank USA, National Association (“HSBC”), JPMorgan Chase Bank, N.A., Wachovia Bank, National Association, Bank Leumi USA and Sovereign Bank, as Banks; and HSBC, as Letter of Credit Issuing Bank and as Agent for the Banks (incorporated by reference to Exhibit 10.39 to the Company’s Current Report (File No. 000-20201) on Form 10-K filed on March 21, 2011). |
| | | |
| | 10.22+ | Credit Agreement, dated as of October 28, 2010, by and among Hampshire Group, Limited, Hampshire Designers, Inc., Item-Eyes, Inc. and Scott James, LLC and Wells Fargo Capital Finance, LLC, as agent and lender (incorporated by reference to Exhibit 10.3 to the Company’s Quarterly Report (File No. 000-20201) on Form 10-Q filed on November 15, 2011). |
| | | |
| | 10.23* | Indemnification Agreement, dated as of April 29, 2008, by and between Richard A. Mandell and Hampshire Group, Limited (incorporated by reference to Exhibit 10.1 to the Company’s Current Report (File No. 000-20201) on Form 8-K filed on May 5, 2008). |
| | | |
| | 10.24* | Indemnification Agreement, dated as of April 29, 2008, by and between Herbert Elish and Hampshire Group, Limited (incorporated by reference to Exhibit 10.2 to the Company’s Current Report (File No. 000-20201) on Form 8-K filed on May 5, 2008). |
| | 10.25* | Letter Agreement with Richard A. Mandell dated as of April 15, 2009. (incorporated by reference to Exhibit 99.1 to the Company's Current Report (File No. 000-20201) on Form 8-K filed on April 21, 2009). |
| | | |
| | 10.26* | Hampshire Group, Limited Hampshire Group, Limited 2009 Stock Incentive Plan, dated October 21, 2009 (incorporated by reference to Exhibit 10.1 to the Company’s Current Report (File No. 000-20201) on Form 8-K filed on October 27, 2009). |
| | | |
| | 10.27*+ | Hampshire Group, Limited Hampshire Group, Limited 2010 Cash Incentive Bonus Plan, dated October 21, 2009 (incorporated by reference to Exhibit 10.48 to the Company’s Current Report (File No. 000-20201) on Form 10-K/A filed on October 26, 2011). |
| | | |
| | 10.28 | Letter Agreement, dated December 2, 2009, among Hampshire Group, Limited, Peter H. Woodward and MHW Capital Management (incorporated by reference to Exhibit 10.1 to the Company’s Current Report (File No. 000-20201) on Form 8-K filed on December 7, 2009). |
| | | |
| | 10.29 | Indemnification Agreement, dated December 2, 2009, between Hampshire Group, Limited and Peter H. Woodward (incorporated by reference to Exhibit 10.2 to the Company’s Current Report (File No. 000-20201) on Form 8-K filed on December 7, 2009). |
| | | |
| | 10.30* | Indemnification Agreement, dated March 16, 2011, between Hampshire Group, Limited and Janice E. Page (incorporated by reference to Exhibit 10.51 to the Company’s Current Report (File No. 000-20201) on Form 10-K/A filed on April 14, 2011). |
| | | |
| | 10.31* | Indemnification Agreement, dated March 16, 2011, between Hampshire Group, Limited and Robert C. Siegel (incorporated by reference to Exhibit 10.52 to the Company’s Current Report (File No. 000-20201) on Form 10-K/A filed on April 14, 2011). |
| | | |
| | 10.32* | Indemnification Agreement, dated April 13, 2011, between Hampshire Group, Limited and Timothy L. Walsh (incorporated by reference to Exhibit 10.53 to the Company’s Current Report (File No. 000-20201) on Form 10-K/A filed on April 14, 2011). |
| | | |
| | 10.33* | Employment Agreement, dated as of October 12, 2010, by and between Hampshire Group, Limited and Eric G. Prengel (incorporated by reference to Exhibit 10.54 to the Company’s Current Report (File No. 000-20201) on Form 10-K/A filed on April 14, 2011). |
| | | |
| | 10.34* | Letter Agreement, dated July 16, 2009 by and between Howard L. Zwilling and Hampshire Group, Limited (incorporated by reference to Exhibit 10.55 to the Company’s Current Report (File No. 000-20201) on Form 10-K/A filed on April 14, 2011). |
| | | |
| | 10.35 | Asset Purchase Agreement, dated May 5, 2011, by and between Hampshire Group Limited, Hampshire Designers, Inc. and LF USA, Inc. (incorporated by reference to Exhibit 10.1 to the Company’s Current Report (File No. 000-20201) on Form 8-K filed on May 6, 2011). |
| | | |
| | 10.36 | Asset Purchase Agreement, dated May 5, 2011, by and between Hampshire Group Limited, Item-Eyes, Inc. and KBL International Group Ltd. (incorporated by reference to Exhibit 10.2 to the Company’s Current Report (File No. 000-20201) on Form 8-K filed on May 6, 2011). |
| | | |
| | 10.37* | Amended and Restated Employment Agreement with Heath L. Golden, dated May 2, 2011 (incorporated by reference to Exhibit 10.3 to the Company’s Current Report (File No. 000-20201) on Form 8-K filed on May 6, 2011). |
| | | |
| | 10.38* | Equity Award Agreement with Heath L. Golden, dated May 2, 2011 (incorporated by reference to Exhibit 10.4 to the Company’s Current Report (File No. 000-20201) on Form 8-K filed on May 6, 2011). |
| | | |
| | 10.39* | Separation and Release Agreement, dated as of May 11, 2011, by and between Hampshire Group, Limited and Howard L. Zwilling (incorporated by reference to Exhibit 10.1 to the Company’s Quarterly Report (File No. 000-20201) on Form 10-Q filed on May 12, 2011). |
| | 10.40 | Agreement and Plan of Merger, dated June 13, 2011, by and among Hampshire Group, Limited, RG Merger Sub, S.A., Rio Garment S. de R.L., the Equityholders of Rio and BGY II, LLC (incorporated by reference to Exhibit 10.1 to the Company’s Current Report (File No. 000-20201) on Form 8-K filed on June 17, 2011). |
| | | |
| | 10.41 | Form of Voting Agreement (incorporated by reference to Exhibit 10.2 to the Company’s Current Report (File No. 000-20201) on Form 8-K filed on June 17, 2011). |
| | | |
| | 10.42 | Form of Stockholder Rights Agreement (incorporated by reference to Exhibit 10.4 to the Company’s Current Report (File No. 000-20201) on Form 8-K filed on June 17, 2011). |
| | | |
| | 10.43 | Amendment to Agreement and Plan of Merger, dated as of August 15, 2011, between Hampshire Group, Limited, RG Merger Sub, S.A., Rio Garment S. de R.L. and BGY II, LLC (incorporated by reference to Exhibit 10.1 to the Company’s Current Report (File No. 000-20201) on Form 8-K filed on August 17, 2011). |
| | | |
| | 10.44* | Employment Agreement, dated July 17, 2011, by and between Hampshire Group, Limited and Maura M. Langley (incorporated by reference to Exhibit 10.2 to the Company’s Current Report (File No. 000-20201) on Form 8-K filed on August 17, 2011). |
| | | |
| | 10.45 | Amendment No. 2 to Agreement and Plan of Merger by and among Hampshire Group, Limited, RG Merger Sub, S.A., Rio Garment S. de R.L. and BGY II, LLC, dated as of August 25, 2011 (incorporated by reference to Exhibit 10.1 to the Company’s Current Report (File No. 000-20201) on Form 8-K filed on August 30, 2011). |
| | | |
| | 10.46* | Equity Award Agreement with Heath L. Golden, dated August 25, 2011 (incorporated by reference to Exhibit 10.2 to the Company’s Current Report (File No. 000-20201) on Form 8-K filed on August 30, 2011). |
| | | |
| | 10.47+ | First Amendment to Credit Agreement and Consent by and among Hampshire Group, Limited, Hampshire Brands, Inc. (formerly known as Hampshire Designers, Inc.), Hampshire Sub II, Inc. (formerly known as Item-Eyes, Inc.), Scott James, LLC, Hampshire International, LLC and Wells Fargo Capital Finance, LLC, as agent and a lender, and the other financial institutions named therein as lenders (incorporated by reference to Exhibit 10.2 to the Company’s Current Report (File No. 000-20201) on Form 10-Q filed on November 15, 2011). |
| | | |
| | 10.48* | Indemnification Agreement, dated March 7, 2012, between Hampshire Group, Limited and Maura M. Langley (incorporated by reference to Exhibit 10.48 to the Company’s Annual Report (File No. 000-20201) on Form 10-K filed on March 19, 2012). |
| | | |
| | 10.49* | Indemnification Agreement, dated March 15, 2012, between Hampshire Group, Limited and Benjamin C. Yogel (incorporated by reference to Exhibit 10.49 to the Company’s Annual Report (File No. 000-20201) on Form 10-K filed on March 19, 2012). |
| | | |
| | 10.50* | Indemnification Agreement, dated March 13, 2012, between Hampshire Group, Limited and Paul M. Buxbaum (incorporated by reference to Exhibit 10.50 to the Company’s Annual Report (File No. 000-20201) on Form 10-K filed on March 19, 2012). |
| | | |
| | 10.51 | Form of Option Grant Notice and Agreement pursuant to the 2009 Stock Incentive Plan (incorporated by reference to Exhibit 10.51 to the Company’s Annual Report (File No. 000-20201) on Form 10-K filed on March 19, 2012). |
| | | |
| | 10.52 | Second Amendment to Credit Agreement and Amendment to Other Loan Documents by and among Hampshire Group, Limited, Hampshire Brands, Inc. (formerly known as Hampshire Designers, Inc.), Hampshire Sub II, Inc., Scott James, LLC, Hampshire International, LLC and Wells Fargo Capital Finance, LLC, as agent and a lender, and the other financial institutions named therein as lenders (incorporated by reference to Exhibit 10.1to the Company’s Current Report (File No. 000-20201) on Form 8-K filed on May 4, 2012) |
| | | |
| | 10.53 | Separation, Consulting and Release Agreement, dated as of January 18, 2013, by and between Hampshire Group, Limited and Heath L. Golden (incorporated by reference to Exhibit 10.1 to the Company’s Current Report (File No. 000-20201) on Form 8-K filed on January 22, 2013). |
| | 10.54 | Proposal and engagement agreement for advisory services by and among Hampshire Group, Limited and Buxbaum Holdings, Inc. (also known as Buxbaum Group) (incorporated by reference to Exhibit 10.1 to the Company’s Current Report (File No. 000-20201) on Form 8-K filed on February 1, 2013). |
| | | |
| | 11.0 | Hampshire Group, Limited Consolidated Earnings Per Share Computations (incorporated by reference to Note 18 to the consolidated financial statements included in Part II, Item 8. Financial Statements and Supplementary Data of this report). |
| | 14.1 | Code of Ethics and Business Conduct (incorporated by reference to the Company’s Annual Report on Form 10-K for the year ended December 31, 2004 (File No. 000-20201) on March 15, 2005). |
| | | |
| | 14.2 | Complaint Procedures for Accounting and Audit Matters (incorporated by reference to the Company’s Annual Report on Form 10-K for the year ended December 31, 2004 (File No. 000-20201) on March 15, 2005). |
| | | |
| | 21.1 | Subsidiaries of the Company |
| | | |
| | 23.1 | Consent of Elliott Davis, LLC |
| | | |
| | 23.2 | Consent of BDO USA, LLP |
| | | |
| | 31.1 | Certification of Chief Executive Officer pursuant to Item 601(b) (31) of Regulations S-K as adopted pursuant to Section 302 of the Sarbanes-Oxley Act of 2002 |
| | | |
| | 31.2 | Certification of Chief Financial Officer pursuant to Item 601(b) (31) of Regulations S-K as adopted pursuant to Section 302 of the Sarbanes-Oxley Act of 2002 |
| | | |
| | 32.1 | Certification of Chief Executive Officer pursuant to 18 U.S.C. Section 1350, as adopted pursuant to Section 906 of the Sarbanes-Oxley Act of 2002 |
| | | |
| | 32.2 | Certification of Chief Financial Officer pursuant to 18 U.S.C. Section 1350, as adopted pursuant to Section 906 of the Sarbanes-Oxley Act of 2002 |
| | | |
| | 101 | The following materials from our Annual Report on Form 10-K for the year ended December 31, 2012, formatted in XBRL (eXtensible Business Reporting Language): (i) the Consolidated Balance Sheets as of December 31, 2012 and December 31, 2011; (ii) the Consolidated Statements of Operations for the year ended December 31, 2012 and December 31, 2011; (iii) the Consolidated Statements of Stockholders’ Equity for the year ended December 31, 2012 and December 31, 2011; (iv) the Consolidated Statements of Cash Flows for the year ended December 31, 2012 and December 31, 2011; and (v) the Notes to the Consolidated Financial Statements, that have been detail tagged** |
| | |
| 101.INS** | XBRL Instance |
| | | |
| 101.SCH** | XBRL Taxonomy Extension Schema |
| | | |
| 101.CAL** | XBRL Taxonomy Extension Calculation |
| | | |
| 101.DEF** | XBRL Taxonomy Extension Definition |
| | | |
| 101.LAB** | XBRL Taxonomy Extension Labels |
| | | |
| 101.PRE** | XBRL Taxonomy Extension Presentation |
| | | |
| | ** | XBRL information hereto are deemed furnished and not filed or part of a registration statement or prospectus for purposes of Sections 11 or 12 of the Securities Act of 1933, as amended, are deemed not filed for purposes of Section 18 of the Securities Exchange Act of 1934, as amended, and otherwise is not subject to liability under these sections. |
| | | |
| | * | Company compensatory plan or management contract. |
| | | |
| | + | Confidential treatment has been granted with respect to certain portions of this Exhibit, which portions have been omitted and filed separately with the Commission as part of an application for confidential treatment. |
| Schedule II | |
| Hampshire Group, Limited | |
(a) Allowance for Doubtful Accounts, Allowance for Returns, Discounts and Adjustments, Allowance for Inventory Reserves and Deferred Tax Valuation Allowances.
| (In thousands) | | Balance at Beginning of Year | | | Charged to Costs and Expenses | | | Charged to Other Accounts (Acquisitions) | | | Deductions | | | Balance at End of Year | |
| Allowance for doubtful accounts: | | | | | | | | | | | | | | | |
| Year ended December 31, 2011 | | $ | 170 | | | $ | 44 | | | $ | — | | | $ | (204 | ) | | $ | 10 | |
| Year ended December 31, 2012 | | $ | 10 | | | $ | 23 | | | $ | — | | | $ | (10 | ) | | $ | 23 | |
| | | | | | | | | | | | | | | | | | | | | |
| Allowance for returns, discounts and adjustments: | | | | | | | | | | | | | | | | | | | | |
| Year ended December 31, 2011 | | $ | 8,562 | | | $ | 10,256 | | | $ | — | | | $ | (12,724 | ) | | $ | 6,094 | |
| Year ended December 31, 2012 | | $ | 6,094 | | | $ | 7,568 | | | $ | — | | | $ | (8,915 | ) | | $ | 4,747 | |
| | | | | | | | | | | | | | | | | | | | | |
| Inventory reserves: | | | | | | | | | | | | | | | | | | | | |
| Year ended December 31, 2011 | | $ | 334 | | | $ | 747 | | | $ | — | | | $ | 59 | | | $ | 1,140 | |
| Year ended December 31, 2012 | | $ | 1,140 | | | $ | 2,116 | | | $ | — | | | $ | (2,306 | ) | | $ | 950 | |
| | | | | | | | | | | | | | | | | | | | | |
| Deferred tax valuation allowances: | | | | | | | | | | | | | | | | | | | | |
| Year ended December 31, 2011 | | $ | 22,702 | | | $ | 3,125 | | | $ | — | | | $ | — | | | $ | 25,827 | |
| Year ended December 31, 2012 | | $ | 25,827 | | | $ | 3,366 | | | $ | — | | | $ | — | | | $ | 29,193 | |
(b) None.
SIGNATURES
Pursuant to the requirements of Section 13 or 15(d) of the Securities Exchange Act of 1934, the Registrant has duly caused this Report to be signed on its behalf by the undersigned, thereunto duly authorized.
| | | Hampshire Group, Limited |
| | | | |
| Date: March 18, 2013 | | By: | /s/ Paul M. Buxbaum |
| | | | | Paul M. Buxbaum |
| | | | | President and Chief Executive Officer |
Pursuant to the requirements of the Securities Exchange Act of 1934, this Report has been signed below by the following persons in the capacities indicated on March 18, 2013.
| Signature | | Title |
| | | |
/s/ Peter H. Woodward | | Chairman of the Board |
Peter H. Woodward | | |
| | | |
/s/ Paul M. Buxbaum | | President and Chief Executive Officer |
Paul M. Buxbaum | | (principal executive officer) |
| | | |
/s/ Maura M. Langley | | Vice President, Chief Financial Officer, and Treasurer |
Maura M. Langley | | (principal financial officer and principal accounting officer) |
| | | |
/s/ Robert C. Siegel | | Director |
Robert C. Siegel | | |
| | | |
/s/ Richard A. Mandell | | Director |
Richard A. Mandell | | |
| | | |
/s/ Benjamin C. Yogel | | Director |
Benjamin C. Yogel | | |
EXHIBIT INDEX
| | 21.1 | Subsidiaries of the Company |
| | 23.1 | Consent of Elliott Davis, LLC |
| | 23.2 | Consent of BDO USA, LLP |
| | 31.1 | Certification of Chief Executive Officer pursuant to Item 601(b) (31) of Regulations S-K as adopted pursuant to Section 302 of the Sarbanes-Oxley Act of 2002 |
| | 31.2 | Certification of Chief Financial Officer pursuant to Item 601(b) (31) of Regulations S-K as adopted pursuant to Section 302 of the Sarbanes-Oxley Act of 2002 |
| | 32.1 | Certification of Chief Executive Officer pursuant to 18 U.S.C. Section 1350, as adopted pursuant to Section 906 of the Sarbanes-Oxley Act of 2002 |
| | 32.2 | Certification of Chief Financial Officer pursuant to 18 U.S.C. Section 1350, as adopted pursuant to Section 906 of the Sarbanes-Oxley Act of 2002 |
| | 101 | The following materials from our Annual Report on Form 10-K for the year ended December 31, 2012, formatted in XBRL (eXtensible Business Reporting Language): (i) the Consolidated Balance Sheets as of December 31, 2012 and December 31, 2011; (ii) the Consolidated Statements of Operations for the year ended December 31, 2012 and December 31, 2011; (iii) the Consolidated Statements of Stockholders’ Equity for the year ended December 31, 2012 and December 31, 2011; (iv) the Consolidated Statements of Cash Flows for the year ended December 31, 2012 and December 31, 2011; and (v) the Notes to the Consolidated Financial Statements, that have been detail tagged** |
101.INS** XBRL Instance
101.SCH** XBRL Taxonomy Extension Schema
101.CAL** XBRL Taxonomy Extension Calculation
101.DEF** XBRL Taxonomy Extension Definition
101.LAB** XBRL Taxonomy Extension Labels
101.PRE** XBRL Taxonomy Extension Presentation
| | ** | XBRL information hereto are deemed furnished and not filed or part of a registration statement or prospectus for purposes of Sections 11 or 12 of the Securities Act of 1933, as amended, are deemed not filed for purposes of Section 18 of the Securities Exchange Act of 1934, as amended, and otherwise is not subject to liability under these sections. |