UNITED STATES
SECURITIES AND EXCHANGE COMMISSION
Washington, D.C. 20549
FORM N-CSR
CERTIFIED SHAREHOLDER REPORT OF REGISTERED
MANAGEMENT INVESTMENT COMPANIES
Investment Company Act File Number: 811-06650
LORD ABBETT RESEARCH FUND, INC.
(Exact name of Registrant as specified in charter)
30 Hudson Street, Jersey City, New Jersey 07302-4804
(Address of principal executive offices) (Zip code)
Randolph A. Stuzin, Esq.
Vice President and Assistant Secretary
30 Hudson Street, Jersey City, New Jersey 07302-4804
(Name and address of agent for service)
Registrant’s telephone number, including area code: (888) 522-2388
Date of fiscal year end: 11/30
Date of reporting period: 11/30/2024
| Item 1: | Report(s) to Shareholders. |
Lord Abbett Dividend Growth Fund
Annual Shareholder Report
November 30, 2024
lordabbett.com/FundDocuments
This annual shareholder report contains important information about the Lord Abbett Dividend Growth Fund for the period of December 1, 2023 to November 30, 2024, as well as certain changes to the Fund. You can find additional information about the Fund at lordabbett.com/FundDocuments. You can also request this information by contacting us at 888-522-2388.
What were the Fund costs for the last year?
(based on a hypothetical $10,000 investment)
| Class Name | Costs of a $10,000 investment | Costs paid as a percentage of a $10,000 investment |
|---|
| Class A | $104 | 0.89% |
|---|
How did the Fund perform last year and what affected its performance?
For the fiscal year ended November 30, 2024, the Fund returned 33.24%, reflecting performance at the net asset value (NAV) of Class A shares, with all distributions reinvested, compared to its benchmark and broad-based securities market index, S&P 500 Index, which returned 33.89% over the same period.
Positive factors for the markets included momentum around the soft-landing narrative, which was supported by signs of a cooling labor market and a slowing economy. This led to the U.S. Federal Reserve lowering its policy rate by 50 basis points in September and an additional 25 basis points in November. There were also increased expectations in the market for further rate cuts in 2024. Mixed economic data, including softer consumer price index reports and fluctuating job market indicators, contributed to these rate cut expectations, and also sparked recession fears. However, these factors were mostly balanced by strong consumer spending and retail sales.
Top contributors to performance: Security selection within the Consumer Staples sector contributed to relative performance, led by an overweight allocation to Walmart Inc. Security selection within the Information Technology sector also contributed to relative performance, led by an overweight allocation to Nvidia Corporation.
Top detractors from performance: Security selection within the Consumer Discretionary sector detracted from relative performance, led by an overweight allocation to McDonald’s Corporation. Security selection within the Communication Services sector also detracted from relative performance, led by an overweight allocation to Comcast Corporation.
Total Return Based on $10,000 Investment
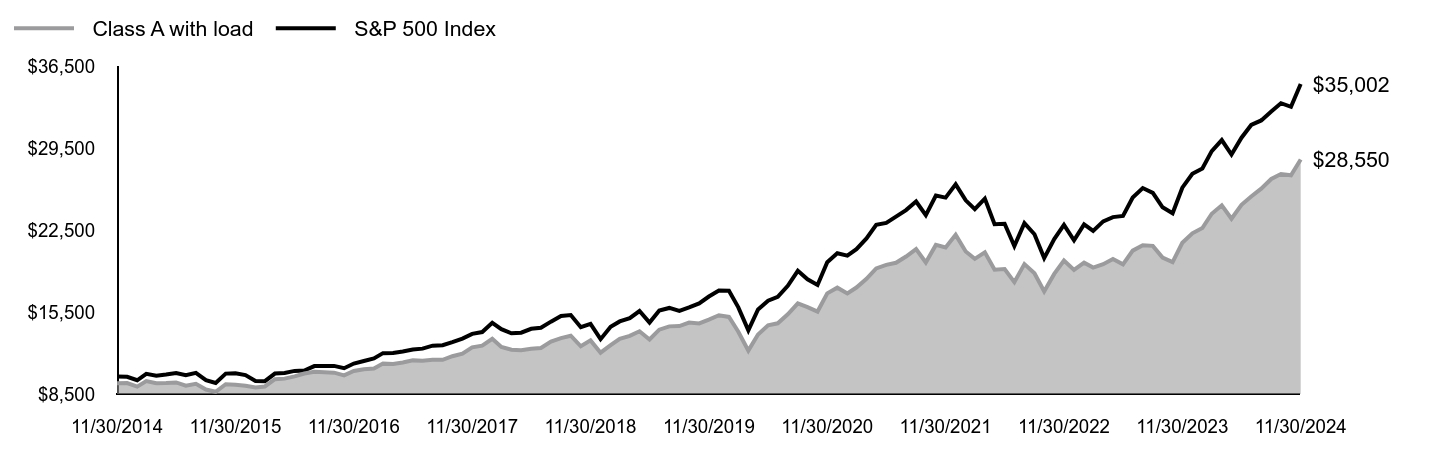
| Class A with load | S&P 500 Index |
|---|
| 11/30/2014 | $9,423 | $10,000 |
|---|
| 12/31/2014 | $9,437 | $9,975 |
|---|
| 1/31/2015 | $9,132 | $9,675 |
|---|
| 2/28/2015 | $9,603 | $10,231 |
|---|
| 3/31/2015 | $9,426 | $10,070 |
|---|
| 4/30/2015 | $9,433 | $10,166 |
|---|
| 5/31/2015 | $9,490 | $10,297 |
|---|
| 6/30/2015 | $9,218 | $10,098 |
|---|
| 7/31/2015 | $9,372 | $10,309 |
|---|
| 8/31/2015 | $8,885 | $9,687 |
|---|
| 9/30/2015 | $8,690 | $9,448 |
|---|
| 10/31/2015 | $9,335 | $10,244 |
|---|
| 11/30/2015 | $9,296 | $10,275 |
|---|
| 12/31/2015 | $9,213 | $10,113 |
|---|
| 1/31/2016 | $9,066 | $9,611 |
|---|
| 2/29/2016 | $9,143 | $9,598 |
|---|
| 3/31/2016 | $9,771 | $10,249 |
|---|
| 4/30/2016 | $9,814 | $10,289 |
|---|
| 5/31/2016 | $10,010 | $10,474 |
|---|
| 6/30/2016 | $10,249 | $10,501 |
|---|
| 7/31/2016 | $10,404 | $10,888 |
|---|
| 8/31/2016 | $10,362 | $10,903 |
|---|
| 9/30/2016 | $10,327 | $10,905 |
|---|
| 10/31/2016 | $10,094 | $10,706 |
|---|
| 11/30/2016 | $10,468 | $11,103 |
|---|
| 12/31/2016 | $10,607 | $11,322 |
|---|
| 1/31/2017 | $10,683 | $11,537 |
|---|
| 2/28/2017 | $11,100 | $11,995 |
|---|
| 3/31/2017 | $11,070 | $12,009 |
|---|
| 4/30/2017 | $11,192 | $12,132 |
|---|
| 5/31/2017 | $11,375 | $12,303 |
|---|
| 6/30/2017 | $11,350 | $12,380 |
|---|
| 7/31/2017 | $11,427 | $12,635 |
|---|
| 8/31/2017 | $11,419 | $12,673 |
|---|
| 9/30/2017 | $11,733 | $12,935 |
|---|
| 10/31/2017 | $11,948 | $13,237 |
|---|
| 11/30/2017 | $12,494 | $13,642 |
|---|
| 12/31/2017 | $12,631 | $13,794 |
|---|
| 1/31/2018 | $13,222 | $14,584 |
|---|
| 2/28/2018 | $12,525 | $14,046 |
|---|
| 3/31/2018 | $12,284 | $13,689 |
|---|
| 4/30/2018 | $12,235 | $13,742 |
|---|
| 5/31/2018 | $12,375 | $14,073 |
|---|
| 6/30/2018 | $12,437 | $14,160 |
|---|
| 7/31/2018 | $12,984 | $14,686 |
|---|
| 8/31/2018 | $13,281 | $15,165 |
|---|
| 9/30/2018 | $13,483 | $15,251 |
|---|
| 10/31/2018 | $12,577 | $14,209 |
|---|
| 11/30/2018 | $13,084 | $14,498 |
|---|
| 12/31/2018 | $12,034 | $13,189 |
|---|
| 1/31/2019 | $12,671 | $14,246 |
|---|
| 2/28/2019 | $13,218 | $14,704 |
|---|
| 3/31/2019 | $13,470 | $14,989 |
|---|
| 4/30/2019 | $13,866 | $15,596 |
|---|
| 5/31/2019 | $13,164 | $14,605 |
|---|
| 6/30/2019 | $14,003 | $15,635 |
|---|
| 7/31/2019 | $14,283 | $15,859 |
|---|
| 8/31/2019 | $14,310 | $15,608 |
|---|
| 9/30/2019 | $14,608 | $15,900 |
|---|
| 10/31/2019 | $14,535 | $16,245 |
|---|
| 11/30/2019 | $14,862 | $16,834 |
|---|
| 12/31/2019 | $15,232 | $17,342 |
|---|
| 1/31/2020 | $15,090 | $17,335 |
|---|
| 2/29/2020 | $13,825 | $15,908 |
|---|
| 3/31/2020 | $12,207 | $13,944 |
|---|
| 4/30/2020 | $13,581 | $15,731 |
|---|
| 5/31/2020 | $14,373 | $16,480 |
|---|
| 6/30/2020 | $14,546 | $16,808 |
|---|
| 7/31/2020 | $15,312 | $17,756 |
|---|
| 8/31/2020 | $16,251 | $19,032 |
|---|
| 9/30/2020 | $15,935 | $18,309 |
|---|
| 10/31/2020 | $15,551 | $17,822 |
|---|
| 11/30/2020 | $17,106 | $19,773 |
|---|
| 12/31/2020 | $17,593 | $20,533 |
|---|
| 1/31/2021 | $17,101 | $20,326 |
|---|
| 2/28/2021 | $17,603 | $20,886 |
|---|
| 3/31/2021 | $18,344 | $21,801 |
|---|
| 4/30/2021 | $19,242 | $22,964 |
|---|
| 5/31/2021 | $19,538 | $23,125 |
|---|
| 6/30/2021 | $19,719 | $23,665 |
|---|
| 7/31/2021 | $20,253 | $24,227 |
|---|
| 8/31/2021 | $20,886 | $24,963 |
|---|
| 9/30/2021 | $19,744 | $23,802 |
|---|
| 10/31/2021 | $21,250 | $25,470 |
|---|
| 11/30/2021 | $21,032 | $25,294 |
|---|
| 12/31/2021 | $22,109 | $26,427 |
|---|
| 1/31/2022 | $20,690 | $25,060 |
|---|
| 2/28/2022 | $20,061 | $24,309 |
|---|
| 3/31/2022 | $20,622 | $25,212 |
|---|
| 4/30/2022 | $19,126 | $23,013 |
|---|
| 5/31/2022 | $19,190 | $23,056 |
|---|
| 6/30/2022 | $18,068 | $21,152 |
|---|
| 7/31/2022 | $19,612 | $23,103 |
|---|
| 8/31/2022 | $18,829 | $22,161 |
|---|
| 9/30/2022 | $17,275 | $20,120 |
|---|
| 10/31/2022 | $18,768 | $21,749 |
|---|
| 11/30/2022 | $19,918 | $22,964 |
|---|
| 12/31/2022 | $19,117 | $21,641 |
|---|
| 1/31/2023 | $19,728 | $23,001 |
|---|
| 2/28/2023 | $19,309 | $22,440 |
|---|
| 3/31/2023 | $19,598 | $23,263 |
|---|
| 4/30/2023 | $20,040 | $23,626 |
|---|
| 5/31/2023 | $19,587 | $23,729 |
|---|
| 6/30/2023 | $20,760 | $25,297 |
|---|
| 7/31/2023 | $21,225 | $26,110 |
|---|
| 8/31/2023 | $21,168 | $25,694 |
|---|
| 9/30/2023 | $20,165 | $24,469 |
|---|
| 10/31/2023 | $19,779 | $23,955 |
|---|
| 11/30/2023 | $21,427 | $26,142 |
|---|
| 12/31/2023 | $22,242 | $27,330 |
|---|
| 1/31/2024 | $22,688 | $27,789 |
|---|
| 2/29/2024 | $23,915 | $29,273 |
|---|
| 3/31/2024 | $24,635 | $30,215 |
|---|
| 4/30/2024 | $23,487 | $28,981 |
|---|
| 5/31/2024 | $24,681 | $30,418 |
|---|
| 6/30/2024 | $25,390 | $31,509 |
|---|
| 7/31/2024 | $26,057 | $31,893 |
|---|
| 8/31/2024 | $26,885 | $32,666 |
|---|
| 9/30/2024 | $27,306 | $33,364 |
|---|
| 10/31/2024 | $27,202 | $33,061 |
|---|
| 11/30/2024 | $28,550 | $35,002 |
|---|
The Fund’s benchmarks are unmanaged indices used as a general measure of market performance. Calculations assume the reinvestment of dividends and capital gains.
Average Annual Total Returns (%)
| AATR | 1 Year | 5 Years | 10 Years |
|---|
| Class A at NAV | 33.24% | 13.95% | 11.72% |
|---|
| Class A with sales charge | 25.58% | 12.61% | 11.06% |
|---|
S&P 500 IndexFootnote Reference* | 33.89% | 15.77% | 13.35% |
|---|
| Footnote | Description |
Footnote* | The Fund has adopted the S&P 500 Index as its broad-based securities market index. |
The Fund's past performance is no guarantee of future results. The returns do not reflect the deduction of taxes that a shareholder would pay on Fund distributions or redemption of Fund shares.
(as of November 30, 2024)
| Total Net Assets | $4,417,827,505 |
|---|
| # of Portfolio Holdings | 56 |
|---|
| Portfolio Turnover Rate | 25% |
|---|
| Total Advisory Fees Paid | $20,526,637 |
|---|
What did the Fund invest in?
(as of November 30, 2024)
Portfolio Holdings Presented by SectorFootnote Reference* | % Footnote Reference** |
|---|
| Consumer Discretionary | 6.44% |
| Consumer Staples | 8.58% |
| Energy | 3.57% |
| Financials | 19.87% |
| Health Care | 12.51% |
| Industrials | 9.64% |
| Information Technology | 28.45% |
| Materials | 5.78% |
| Utilities | 3.62% |
| Repurchase Agreements | 1.54% |
| Total | 100.00% |
| Footnote | Description |
Footnote* | A sector may comprise several industries. |
Footnote** | Represents percent of total investments, which excludes derivatives. |
There were no material fund changes during the period.
Where can I find additional information about the Fund?
For additional information about the Fund, including its Prospectus, Statement of Additional Information, financial statements, holdings and proxy information, please visit lordabbett.com/FundDocuments.
The Fund has adopted a policy that allows it to send only one copy of the Fund's prospectus, proxy material, annual report and semiannual report (or related notice of internet availability of annual report and semiannual report) to certain shareholders residing at the same "household." This reduces Fund expenses, which benefits you and other shareholders.If you need additional copies or do not want your mailings to be "householded," please call Lord Abbett at 888-522-2388.
Lord Abbett Dividend Growth Fund
Annual Shareholder Report
November 30, 2024
lordabbett.com/FundDocuments
TSR-A-573-A
01/25
Lord Abbett Dividend Growth Fund
Annual Shareholder Report
November 30, 2024
lordabbett.com/FundDocuments
This annual shareholder report contains important information about the Lord Abbett Dividend Growth Fund for the period of December 1, 2023 to November 30, 2024, as well as certain changes to the Fund. You can find additional information about the Fund at lordabbett.com/FundDocuments. You can also request this information by contacting us at 888-522-2388.
What were the Fund costs for the last year?
(based on a hypothetical $10,000 investment)
| Class Name | Costs of a $10,000 investment | Costs paid as a percentage of a $10,000 investment |
|---|
| Class C | $190 | 1.64% |
|---|
How did the Fund perform last year and what affected its performance?
For the fiscal year ended November 30, 2024, the Fund returned 32.22%, reflecting performance at the net asset value (NAV) of Class C shares, with all distributions reinvested, compared to its benchmark and broad-based securities market index, S&P 500 Index, which returned 33.89% over the same period.
Positive factors for the markets included momentum around the soft-landing narrative, which was supported by signs of a cooling labor market and a slowing economy. This led to the U.S. Federal Reserve lowering its policy rate by 50 basis points in September and an additional 25 basis points in November. There were also increased expectations in the market for further rate cuts in 2024. Mixed economic data, including softer consumer price index reports and fluctuating job market indicators, contributed to these rate cut expectations, and also sparked recession fears. However, these factors were mostly balanced by strong consumer spending and retail sales.
Top contributors to performance: Security selection within the Consumer Staples sector contributed to relative performance, led by an overweight allocation to Walmart Inc. Security selection within the Information Technology sector also contributed to relative performance, led by an overweight allocation to Nvidia Corporation.
Top detractors from performance: Security selection within the Consumer Discretionary sector detracted from relative performance, led by an overweight allocation to McDonald’s Corporation. Security selection within the Communication Services sector also detracted from relative performance, led by an overweight allocation to Comcast Corporation.
Total Return Based on $10,000 Investment
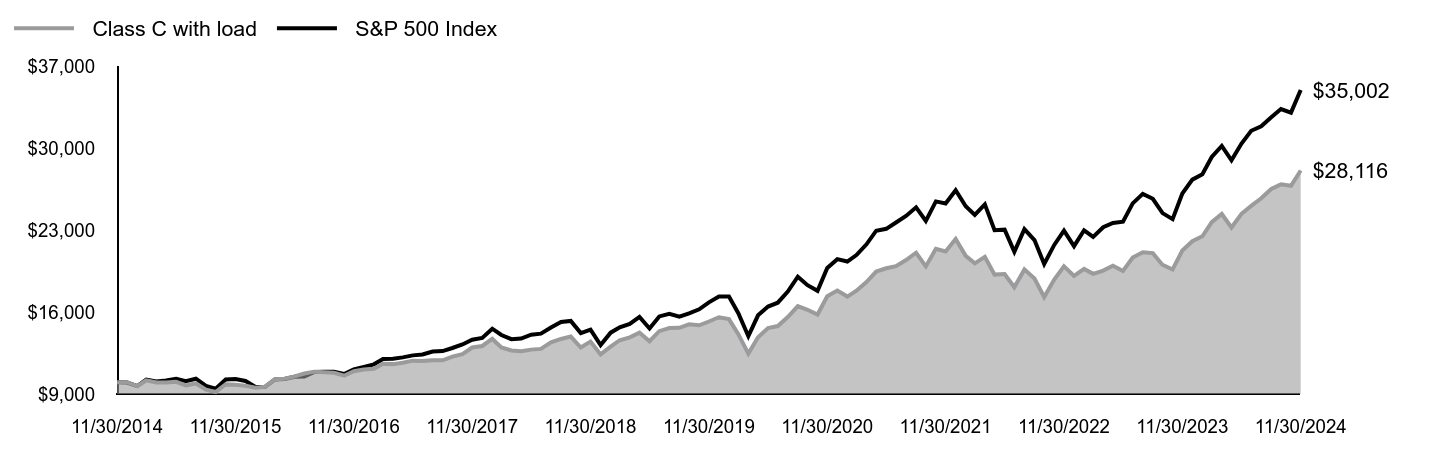
| Class C with load | S&P 500 Index |
|---|
| 11/30/2014 | $10,000 | $10,000 |
|---|
| 12/31/2014 | $10,011 | $9,975 |
|---|
| 1/31/2015 | $9,684 | $9,675 |
|---|
| 2/28/2015 | $10,175 | $10,231 |
|---|
| 3/31/2015 | $9,981 | $10,070 |
|---|
| 4/30/2015 | $9,981 | $10,166 |
|---|
| 5/31/2015 | $10,043 | $10,297 |
|---|
| 6/30/2015 | $9,740 | $10,098 |
|---|
| 7/31/2015 | $9,904 | $10,309 |
|---|
| 8/31/2015 | $9,377 | $9,687 |
|---|
| 9/30/2015 | $9,172 | $9,448 |
|---|
| 10/31/2015 | $9,838 | $10,244 |
|---|
| 11/30/2015 | $9,797 | $10,275 |
|---|
| 12/31/2015 | $9,704 | $10,113 |
|---|
| 1/31/2016 | $9,541 | $9,611 |
|---|
| 2/29/2016 | $9,623 | $9,598 |
|---|
| 3/31/2016 | $10,266 | $10,249 |
|---|
| 4/30/2016 | $10,303 | $10,289 |
|---|
| 5/31/2016 | $10,511 | $10,474 |
|---|
| 6/30/2016 | $10,755 | $10,501 |
|---|
| 7/31/2016 | $10,911 | $10,888 |
|---|
| 8/31/2016 | $10,859 | $10,903 |
|---|
| 9/30/2016 | $10,810 | $10,905 |
|---|
| 10/31/2016 | $10,563 | $10,706 |
|---|
| 11/30/2016 | $10,944 | $11,103 |
|---|
| 12/31/2016 | $11,087 | $11,322 |
|---|
| 1/31/2017 | $11,159 | $11,537 |
|---|
| 2/28/2017 | $11,584 | $11,995 |
|---|
| 3/31/2017 | $11,555 | $12,009 |
|---|
| 4/30/2017 | $11,668 | $12,132 |
|---|
| 5/31/2017 | $11,853 | $12,303 |
|---|
| 6/30/2017 | $11,820 | $12,380 |
|---|
| 7/31/2017 | $11,893 | $12,635 |
|---|
| 8/31/2017 | $11,877 | $12,673 |
|---|
| 9/30/2017 | $12,193 | $12,935 |
|---|
| 10/31/2017 | $12,411 | $13,237 |
|---|
| 11/30/2017 | $12,977 | $13,642 |
|---|
| 12/31/2017 | $13,107 | $13,794 |
|---|
| 1/31/2018 | $13,710 | $14,584 |
|---|
| 2/28/2018 | $12,977 | $14,046 |
|---|
| 3/31/2018 | $12,717 | $13,689 |
|---|
| 4/30/2018 | $12,665 | $13,742 |
|---|
| 5/31/2018 | $12,795 | $14,073 |
|---|
| 6/30/2018 | $12,858 | $14,160 |
|---|
| 7/31/2018 | $13,412 | $14,686 |
|---|
| 8/31/2018 | $13,706 | $15,165 |
|---|
| 9/30/2018 | $13,909 | $15,251 |
|---|
| 10/31/2018 | $12,972 | $14,209 |
|---|
| 11/30/2018 | $13,484 | $14,498 |
|---|
| 12/31/2018 | $12,389 | $13,189 |
|---|
| 1/31/2019 | $13,044 | $14,246 |
|---|
| 2/28/2019 | $13,597 | $14,704 |
|---|
| 3/31/2019 | $13,844 | $14,989 |
|---|
| 4/30/2019 | $14,247 | $15,596 |
|---|
| 5/31/2019 | $13,515 | $14,605 |
|---|
| 6/30/2019 | $14,372 | $15,635 |
|---|
| 7/31/2019 | $14,644 | $15,859 |
|---|
| 8/31/2019 | $14,663 | $15,608 |
|---|
| 9/30/2019 | $14,954 | $15,900 |
|---|
| 10/31/2019 | $14,879 | $16,245 |
|---|
| 11/30/2019 | $15,199 | $16,834 |
|---|
| 12/31/2019 | $15,565 | $17,342 |
|---|
| 1/31/2020 | $15,407 | $17,335 |
|---|
| 2/29/2020 | $14,116 | $15,908 |
|---|
| 3/31/2020 | $12,458 | $13,944 |
|---|
| 4/30/2020 | $13,850 | $15,731 |
|---|
| 5/31/2020 | $14,640 | $16,480 |
|---|
| 6/30/2020 | $14,810 | $16,808 |
|---|
| 7/31/2020 | $15,581 | $17,756 |
|---|
| 8/31/2020 | $16,521 | $19,032 |
|---|
| 9/30/2020 | $16,201 | $18,309 |
|---|
| 10/31/2020 | $15,796 | $17,822 |
|---|
| 11/30/2020 | $17,359 | $19,773 |
|---|
| 12/31/2020 | $17,848 | $20,533 |
|---|
| 1/31/2021 | $17,331 | $20,326 |
|---|
| 2/28/2021 | $17,828 | $20,886 |
|---|
| 3/31/2021 | $18,578 | $21,801 |
|---|
| 4/30/2021 | $19,470 | $22,964 |
|---|
| 5/31/2021 | $19,754 | $23,125 |
|---|
| 6/30/2021 | $19,936 | $23,665 |
|---|
| 7/31/2021 | $20,453 | $24,227 |
|---|
| 8/31/2021 | $21,081 | $24,963 |
|---|
| 9/30/2021 | $19,912 | $23,802 |
|---|
| 10/31/2021 | $21,423 | $25,470 |
|---|
| 11/30/2021 | $21,189 | $25,294 |
|---|
| 12/31/2021 | $22,264 | $26,427 |
|---|
| 1/31/2022 | $20,813 | $25,060 |
|---|
| 2/28/2022 | $20,170 | $24,309 |
|---|
| 3/31/2022 | $20,726 | $25,212 |
|---|
| 4/30/2022 | $19,210 | $23,013 |
|---|
| 5/31/2022 | $19,264 | $23,056 |
|---|
| 6/30/2022 | $18,125 | $21,152 |
|---|
| 7/31/2022 | $19,655 | $23,103 |
|---|
| 8/31/2022 | $18,868 | $22,161 |
|---|
| 9/30/2022 | $17,295 | $20,120 |
|---|
| 10/31/2022 | $18,781 | $21,749 |
|---|
| 11/30/2022 | $19,917 | $22,964 |
|---|
| 12/31/2022 | $19,102 | $21,641 |
|---|
| 1/31/2023 | $19,699 | $23,001 |
|---|
| 2/28/2023 | $19,274 | $22,440 |
|---|
| 3/31/2023 | $19,551 | $23,263 |
|---|
| 4/30/2023 | $19,976 | $23,626 |
|---|
| 5/31/2023 | $19,517 | $23,729 |
|---|
| 6/30/2023 | $20,667 | $25,297 |
|---|
| 7/31/2023 | $21,126 | $26,110 |
|---|
| 8/31/2023 | $21,046 | $25,694 |
|---|
| 9/30/2023 | $20,037 | $24,469 |
|---|
| 10/31/2023 | $19,646 | $23,955 |
|---|
| 11/30/2023 | $21,265 | $26,142 |
|---|
| 12/31/2023 | $22,060 | $27,330 |
|---|
| 1/31/2024 | $22,488 | $27,789 |
|---|
| 2/29/2024 | $23,690 | $29,273 |
|---|
| 3/31/2024 | $24,395 | $30,215 |
|---|
| 4/30/2024 | $23,239 | $28,981 |
|---|
| 5/31/2024 | $24,407 | $30,418 |
|---|
| 6/30/2024 | $25,088 | $31,509 |
|---|
| 7/31/2024 | $25,736 | $31,893 |
|---|
| 8/31/2024 | $26,533 | $32,666 |
|---|
| 9/30/2024 | $26,926 | $33,364 |
|---|
| 10/31/2024 | $26,810 | $33,061 |
|---|
| 11/30/2024 | $28,116 | $35,002 |
|---|
The Fund’s benchmarks are unmanaged indices used as a general measure of market performance. Calculations assume the reinvestment of dividends and capital gains.
Average Annual Total Returns (%)
| AATR | 1 Year | 5 Years | 10 Years |
|---|
| Class C at NAV | 32.22% | 13.09% | 10.89% |
|---|
| Class C with sales charge | 31.22% | 13.09% | 10.89% |
|---|
S&P 500 IndexFootnote Reference* | 33.89% | 15.77% | 13.35% |
|---|
| Footnote | Description |
Footnote* | The Fund has adopted the S&P 500 Index as its broad-based securities market index. |
The Fund's past performance is no guarantee of future results. The returns do not reflect the deduction of taxes that a shareholder would pay on Fund distributions or redemption of Fund shares.
(as of November 30, 2024)
| Total Net Assets | $4,417,827,505 |
|---|
| # of Portfolio Holdings | 56 |
|---|
| Portfolio Turnover Rate | 25% |
|---|
| Total Advisory Fees Paid | $20,526,637 |
|---|
What did the Fund invest in?
(as of November 30, 2024)
Portfolio Holdings Presented by SectorFootnote Reference* | % Footnote Reference** |
|---|
| Consumer Discretionary | 6.44% |
| Consumer Staples | 8.58% |
| Energy | 3.57% |
| Financials | 19.87% |
| Health Care | 12.51% |
| Industrials | 9.64% |
| Information Technology | 28.45% |
| Materials | 5.78% |
| Utilities | 3.62% |
| Repurchase Agreements | 1.54% |
| Total | 100.00% |
| Footnote | Description |
Footnote* | A sector may comprise several industries. |
Footnote** | Represents percent of total investments, which excludes derivatives. |
There were no material fund changes during the period.
Where can I find additional information about the Fund?
For additional information about the Fund, including its Prospectus, Statement of Additional Information, financial statements, holdings and proxy information, please visit lordabbett.com/FundDocuments.
The Fund has adopted a policy that allows it to send only one copy of the Fund's prospectus, proxy material, annual report and semiannual report (or related notice of internet availability of annual report and semiannual report) to certain shareholders residing at the same "household." This reduces Fund expenses, which benefits you and other shareholders.If you need additional copies or do not want your mailings to be "householded," please call Lord Abbett at 888-522-2388.
Lord Abbett Dividend Growth Fund
Annual Shareholder Report
November 30, 2024
lordabbett.com/FundDocuments
TSR-A-575-C
01/25
Lord Abbett Dividend Growth Fund
Annual Shareholder Report
November 30, 2024
lordabbett.com/FundDocuments
This annual shareholder report contains important information about the Lord Abbett Dividend Growth Fund for the period of December 1, 2023 to November 30, 2024, as well as certain changes to the Fund. You can find additional information about the Fund at lordabbett.com/FundDocuments. You can also request this information by contacting us at 888-522-2388.
What were the Fund costs for the last year?
(based on a hypothetical $10,000 investment)
| Class Name | Costs of a $10,000 investment | Costs paid as a percentage of a $10,000 investment |
|---|
| Class F | $75 | 0.64% |
|---|
How did the Fund perform last year and what affected its performance?
For the fiscal year ended November 30, 2024, the Fund returned 33.55%, reflecting performance at the net asset value (NAV) of Class F shares, with all distributions reinvested, compared to its benchmark and broad-based securities market index, S&P 500 Index, which returned 33.89% over the same period.
Positive factors for the markets included momentum around the soft-landing narrative, which was supported by signs of a cooling labor market and a slowing economy. This led to the U.S. Federal Reserve lowering its policy rate by 50 basis points in September and an additional 25 basis points in November. There were also increased expectations in the market for further rate cuts in 2024. Mixed economic data, including softer consumer price index reports and fluctuating job market indicators, contributed to these rate cut expectations, and also sparked recession fears. However, these factors were mostly balanced by strong consumer spending and retail sales.
Top contributors to performance: Security selection within the Consumer Staples sector contributed to relative performance, led by an overweight allocation to Walmart Inc. Security selection within the Information Technology sector also contributed to relative performance, led by an overweight allocation to Nvidia Corporation.
Top detractors from performance: Security selection within the Consumer Discretionary sector detracted from relative performance, led by an overweight allocation to McDonald’s Corporation. Security selection within the Communication Services sector also detracted from relative performance, led by an overweight allocation to Comcast Corporation.
Total Return Based on $10,000 Investment

| Class F | S&P 500 Index |
|---|
| 11/30/2014 | $10,000 | $10,000 |
|---|
| 12/31/2014 | $10,019 | $9,975 |
|---|
| 1/31/2015 | $9,694 | $9,675 |
|---|
| 2/28/2015 | $10,194 | $10,231 |
|---|
| 3/31/2015 | $10,004 | $10,070 |
|---|
| 4/30/2015 | $10,017 | $10,166 |
|---|
| 5/31/2015 | $10,085 | $10,297 |
|---|
| 6/30/2015 | $9,787 | $10,098 |
|---|
| 7/31/2015 | $9,957 | $10,309 |
|---|
| 8/31/2015 | $9,439 | $9,687 |
|---|
| 9/30/2015 | $9,236 | $9,448 |
|---|
| 10/31/2015 | $9,922 | $10,244 |
|---|
| 11/30/2015 | $9,880 | $10,275 |
|---|
| 12/31/2015 | $9,795 | $10,113 |
|---|
| 1/31/2016 | $9,639 | $9,611 |
|---|
| 2/29/2016 | $9,728 | $9,598 |
|---|
| 3/31/2016 | $10,386 | $10,249 |
|---|
| 4/30/2016 | $10,431 | $10,289 |
|---|
| 5/31/2016 | $10,647 | $10,474 |
|---|
| 6/30/2016 | $10,906 | $10,501 |
|---|
| 7/31/2016 | $11,071 | $10,888 |
|---|
| 8/31/2016 | $11,026 | $10,903 |
|---|
| 9/30/2016 | $10,986 | $10,905 |
|---|
| 10/31/2016 | $10,738 | $10,706 |
|---|
| 11/30/2016 | $11,137 | $11,103 |
|---|
| 12/31/2016 | $11,297 | $11,322 |
|---|
| 1/31/2017 | $11,369 | $11,537 |
|---|
| 2/28/2017 | $11,822 | $11,995 |
|---|
| 3/31/2017 | $11,795 | $12,009 |
|---|
| 4/30/2017 | $11,925 | $12,132 |
|---|
| 5/31/2017 | $12,112 | $12,303 |
|---|
| 6/30/2017 | $12,099 | $12,380 |
|---|
| 7/31/2017 | $12,180 | $12,635 |
|---|
| 8/31/2017 | $12,172 | $12,673 |
|---|
| 9/30/2017 | $12,512 | $12,935 |
|---|
| 10/31/2017 | $12,750 | $13,237 |
|---|
| 11/30/2017 | $13,332 | $13,642 |
|---|
| 12/31/2017 | $13,474 | $13,794 |
|---|
| 1/31/2018 | $14,105 | $14,584 |
|---|
| 2/28/2018 | $13,369 | $14,046 |
|---|
| 3/31/2018 | $13,109 | $13,689 |
|---|
| 4/30/2018 | $13,065 | $13,742 |
|---|
| 5/31/2018 | $13,215 | $14,073 |
|---|
| 6/30/2018 | $13,286 | $14,160 |
|---|
| 7/31/2018 | $13,869 | $14,686 |
|---|
| 8/31/2018 | $14,196 | $15,165 |
|---|
| 9/30/2018 | $14,408 | $15,251 |
|---|
| 10/31/2018 | $13,449 | $14,209 |
|---|
| 11/30/2018 | $13,999 | $14,498 |
|---|
| 12/31/2018 | $12,873 | $13,189 |
|---|
| 1/31/2019 | $13,563 | $14,246 |
|---|
| 2/28/2019 | $14,148 | $14,704 |
|---|
| 3/31/2019 | $14,413 | $14,989 |
|---|
| 4/30/2019 | $14,846 | $15,596 |
|---|
| 5/31/2019 | $14,095 | $14,605 |
|---|
| 6/30/2019 | $14,998 | $15,635 |
|---|
| 7/31/2019 | $15,298 | $15,859 |
|---|
| 8/31/2019 | $15,337 | $15,608 |
|---|
| 9/30/2019 | $15,651 | $15,900 |
|---|
| 10/31/2019 | $15,583 | $16,245 |
|---|
| 11/30/2019 | $15,933 | $16,834 |
|---|
| 12/31/2019 | $16,325 | $17,342 |
|---|
| 1/31/2020 | $16,182 | $17,335 |
|---|
| 2/29/2020 | $14,829 | $15,908 |
|---|
| 3/31/2020 | $13,102 | $13,944 |
|---|
| 4/30/2020 | $14,574 | $15,731 |
|---|
| 5/31/2020 | $15,422 | $16,480 |
|---|
| 6/30/2020 | $15,623 | $16,808 |
|---|
| 7/31/2020 | $16,443 | $17,756 |
|---|
| 8/31/2020 | $17,449 | $19,032 |
|---|
| 9/30/2020 | $17,128 | $18,309 |
|---|
| 10/31/2020 | $16,706 | $17,822 |
|---|
| 11/30/2020 | $18,383 | $19,773 |
|---|
| 12/31/2020 | $18,911 | $20,533 |
|---|
| 1/31/2021 | $18,383 | $20,326 |
|---|
| 2/28/2021 | $18,922 | $20,886 |
|---|
| 3/31/2021 | $19,733 | $21,801 |
|---|
| 4/30/2021 | $20,707 | $22,964 |
|---|
| 5/31/2021 | $21,024 | $23,125 |
|---|
| 6/30/2021 | $21,227 | $23,665 |
|---|
| 7/31/2021 | $21,810 | $24,227 |
|---|
| 8/31/2021 | $22,489 | $24,963 |
|---|
| 9/30/2021 | $21,261 | $23,802 |
|---|
| 10/31/2021 | $22,888 | $25,470 |
|---|
| 11/30/2021 | $22,664 | $25,294 |
|---|
| 12/31/2021 | $23,828 | $26,427 |
|---|
| 1/31/2022 | $22,295 | $25,060 |
|---|
| 2/28/2022 | $21,619 | $24,309 |
|---|
| 3/31/2022 | $22,240 | $25,212 |
|---|
| 4/30/2022 | $20,623 | $23,013 |
|---|
| 5/31/2022 | $20,703 | $23,056 |
|---|
| 6/30/2022 | $19,503 | $21,152 |
|---|
| 7/31/2022 | $21,161 | $23,103 |
|---|
| 8/31/2022 | $20,332 | $22,161 |
|---|
| 9/30/2022 | $18,659 | $20,120 |
|---|
| 10/31/2022 | $20,263 | $21,749 |
|---|
| 11/30/2022 | $21,520 | $22,964 |
|---|
| 12/31/2022 | $20,657 | $21,641 |
|---|
| 1/31/2023 | $21,312 | $23,001 |
|---|
| 2/28/2023 | $20,863 | $22,440 |
|---|
| 3/31/2023 | $21,192 | $23,263 |
|---|
| 4/30/2023 | $21,678 | $23,626 |
|---|
| 5/31/2023 | $21,180 | $23,729 |
|---|
| 6/30/2023 | $22,448 | $25,297 |
|---|
| 7/31/2023 | $22,972 | $26,110 |
|---|
| 8/31/2023 | $22,899 | $25,694 |
|---|
| 9/30/2023 | $21,827 | $24,469 |
|---|
| 10/31/2023 | $21,424 | $23,955 |
|---|
| 11/30/2023 | $23,208 | $26,142 |
|---|
| 12/31/2023 | $24,092 | $27,330 |
|---|
| 1/31/2024 | $24,573 | $27,789 |
|---|
| 2/29/2024 | $25,916 | $29,273 |
|---|
| 3/31/2024 | $26,712 | $30,215 |
|---|
| 4/30/2024 | $25,465 | $28,981 |
|---|
| 5/31/2024 | $26,762 | $30,418 |
|---|
| 6/30/2024 | $27,534 | $31,509 |
|---|
| 7/31/2024 | $28,265 | $31,893 |
|---|
| 8/31/2024 | $29,180 | $32,666 |
|---|
| 9/30/2024 | $29,631 | $33,364 |
|---|
| 10/31/2024 | $29,519 | $33,061 |
|---|
| 11/30/2024 | $30,995 | $35,002 |
|---|
The Fund’s benchmarks are unmanaged indices used as a general measure of market performance. Calculations assume the reinvestment of dividends and capital gains.
Average Annual Total Returns (%)
| AATR | 1 Year | 5 Years | 10 Years |
|---|
| Class F at NAV | 33.55% | 14.24% | 11.98% |
|---|
S&P 500 IndexFootnote Reference* | 33.89% | 15.77% | 13.35% |
|---|
| Footnote | Description |
Footnote* | The Fund has adopted the S&P 500 Index as its broad-based securities market index. |
The Fund's past performance is no guarantee of future results. The returns do not reflect the deduction of taxes that a shareholder would pay on Fund distributions or redemption of Fund shares.
(as of November 30, 2024)
| Total Net Assets | $4,417,827,505 |
|---|
| # of Portfolio Holdings | 56 |
|---|
| Portfolio Turnover Rate | 25% |
|---|
| Total Advisory Fees Paid | $20,526,637 |
|---|
What did the Fund invest in?
(as of November 30, 2024)
Portfolio Holdings Presented by SectorFootnote Reference* | % Footnote Reference** |
|---|
| Consumer Discretionary | 6.44% |
| Consumer Staples | 8.58% |
| Energy | 3.57% |
| Financials | 19.87% |
| Health Care | 12.51% |
| Industrials | 9.64% |
| Information Technology | 28.45% |
| Materials | 5.78% |
| Utilities | 3.62% |
| Repurchase Agreements | 1.54% |
| Total | 100.00% |
| Footnote | Description |
Footnote* | A sector may comprise several industries. |
Footnote** | Represents percent of total investments, which excludes derivatives. |
There were no material fund changes during the period.
Where can I find additional information about the Fund?
For additional information about the Fund, including its Prospectus, Statement of Additional Information, financial statements, holdings and proxy information, please visit lordabbett.com/FundDocuments.
The Fund has adopted a policy that allows it to send only one copy of the Fund's prospectus, proxy material, annual report and semiannual report (or related notice of internet availability of annual report and semiannual report) to certain shareholders residing at the same "household." This reduces Fund expenses, which benefits you and other shareholders.If you need additional copies or do not want your mailings to be "householded," please call Lord Abbett at 888-522-2388.
Lord Abbett Dividend Growth Fund
Annual Shareholder Report
November 30, 2024
lordabbett.com/FundDocuments
TSR-A-1020-F
01/25
Lord Abbett Dividend Growth Fund
Annual Shareholder Report
November 30, 2024
lordabbett.com/FundDocuments
This annual shareholder report contains important information about the Lord Abbett Dividend Growth Fund for the period of December 1, 2023 to November 30, 2024, as well as certain changes to the Fund. You can find additional information about the Fund at lordabbett.com/FundDocuments. You can also request this information by contacting us at 888-522-2388.
What were the Fund costs for the last year?
(based on a hypothetical $10,000 investment)
| Class Name | Costs of a $10,000 investment | Costs paid as a percentage of a $10,000 investment |
|---|
| Class F3 | $69 | 0.59% |
|---|
How did the Fund perform last year and what affected its performance?
For the fiscal year ended November 30, 2024, the Fund returned 33.64%, reflecting performance at the net asset value (NAV) of Class F3 shares, with all distributions reinvested, compared to its benchmark and broad-based securities market index, S&P 500 Index, which returned 33.89% over the same period.
Positive factors for the markets included momentum around the soft-landing narrative, which was supported by signs of a cooling labor market and a slowing economy. This led to the U.S. Federal Reserve lowering its policy rate by 50 basis points in September and an additional 25 basis points in November. There were also increased expectations in the market for further rate cuts in 2024. Mixed economic data, including softer consumer price index reports and fluctuating job market indicators, contributed to these rate cut expectations, and also sparked recession fears. However, these factors were mostly balanced by strong consumer spending and retail sales.
Top contributors to performance: Security selection within the Consumer Staples sector contributed to relative performance, led by an overweight allocation to Walmart Inc. Security selection within the Information Technology sector also contributed to relative performance, led by an overweight allocation to Nvidia Corporation.
Top detractors from performance: Security selection within the Consumer Discretionary sector detracted from relative performance, led by an overweight allocation to McDonald’s Corporation. Security selection within the Communication Services sector also detracted from relative performance, led by an overweight allocation to Comcast Corporation.
Total Return Based on $10,000 Investment
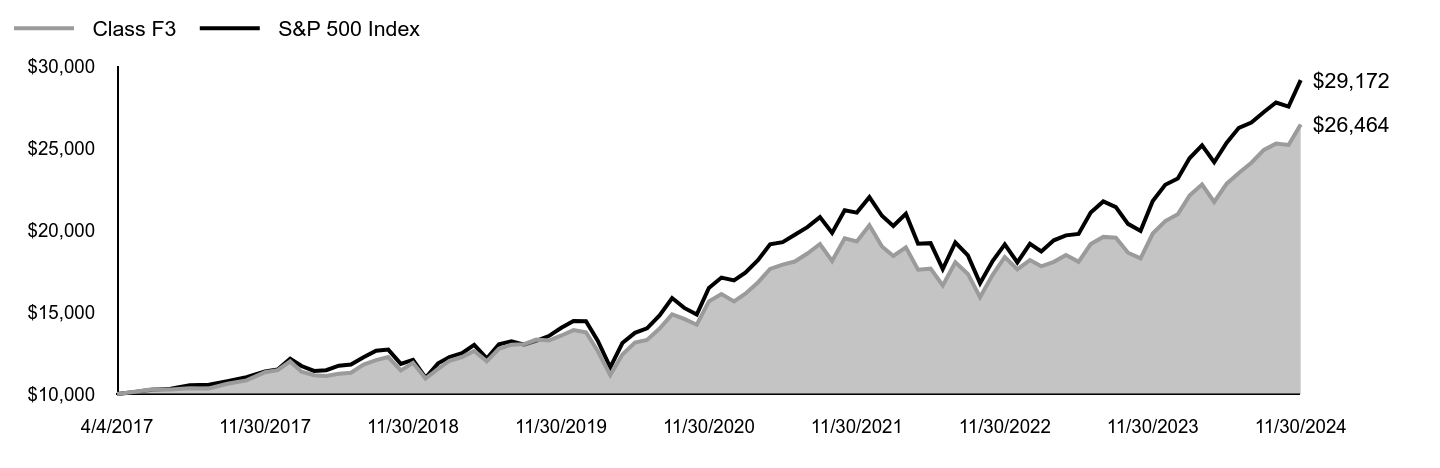
| Class F3 | S&P 500 Index |
|---|
| 4/4/2017 | $10,000 | $10,000 |
|---|
| 4/30/2017 | $10,123 | $10,112 |
|---|
| 5/31/2017 | $10,286 | $10,254 |
|---|
| 6/30/2017 | $10,271 | $10,318 |
|---|
| 7/31/2017 | $10,347 | $10,530 |
|---|
| 8/31/2017 | $10,340 | $10,562 |
|---|
| 9/30/2017 | $10,628 | $10,780 |
|---|
| 10/31/2017 | $10,828 | $11,032 |
|---|
| 11/30/2017 | $11,331 | $11,370 |
|---|
| 12/31/2017 | $11,454 | $11,496 |
|---|
| 1/31/2018 | $11,991 | $12,155 |
|---|
| 2/28/2018 | $11,365 | $11,707 |
|---|
| 3/31/2018 | $11,143 | $11,409 |
|---|
| 4/30/2018 | $11,106 | $11,453 |
|---|
| 5/31/2018 | $11,239 | $11,729 |
|---|
| 6/30/2018 | $11,302 | $11,801 |
|---|
| 7/31/2018 | $11,792 | $12,240 |
|---|
| 8/31/2018 | $12,067 | $12,639 |
|---|
| 9/30/2018 | $12,255 | $12,711 |
|---|
| 10/31/2018 | $11,442 | $11,842 |
|---|
| 11/30/2018 | $11,905 | $12,083 |
|---|
| 12/31/2018 | $10,947 | $10,992 |
|---|
| 1/31/2019 | $11,534 | $11,873 |
|---|
| 2/28/2019 | $12,033 | $12,254 |
|---|
| 3/31/2019 | $12,259 | $12,493 |
|---|
| 4/30/2019 | $12,631 | $12,998 |
|---|
| 5/31/2019 | $11,993 | $12,172 |
|---|
| 6/30/2019 | $12,762 | $13,030 |
|---|
| 7/31/2019 | $13,014 | $13,218 |
|---|
| 8/31/2019 | $13,046 | $13,008 |
|---|
| 9/30/2019 | $13,322 | $13,252 |
|---|
| 10/31/2019 | $13,265 | $13,539 |
|---|
| 11/30/2019 | $13,559 | $14,030 |
|---|
| 12/31/2019 | $13,900 | $14,453 |
|---|
| 1/31/2020 | $13,772 | $14,448 |
|---|
| 2/29/2020 | $12,626 | $13,258 |
|---|
| 3/31/2020 | $11,155 | $11,621 |
|---|
| 4/30/2020 | $12,408 | $13,111 |
|---|
| 5/31/2020 | $13,138 | $13,735 |
|---|
| 6/30/2020 | $13,302 | $14,008 |
|---|
| 7/31/2020 | $14,000 | $14,798 |
|---|
| 8/31/2020 | $14,862 | $15,862 |
|---|
| 9/30/2020 | $14,588 | $15,259 |
|---|
| 10/31/2020 | $14,233 | $14,853 |
|---|
| 11/30/2020 | $15,660 | $16,479 |
|---|
| 12/31/2020 | $16,108 | $17,113 |
|---|
| 1/31/2021 | $15,656 | $16,940 |
|---|
| 2/28/2021 | $16,126 | $17,407 |
|---|
| 3/31/2021 | $16,813 | $18,169 |
|---|
| 4/30/2021 | $17,640 | $19,139 |
|---|
| 5/31/2021 | $17,907 | $19,273 |
|---|
| 6/30/2021 | $18,091 | $19,723 |
|---|
| 7/31/2021 | $18,582 | $20,191 |
|---|
| 8/31/2021 | $19,161 | $20,805 |
|---|
| 9/30/2021 | $18,125 | $19,838 |
|---|
| 10/31/2021 | $19,511 | $21,227 |
|---|
| 11/30/2021 | $19,315 | $21,080 |
|---|
| 12/31/2021 | $20,307 | $22,025 |
|---|
| 1/31/2022 | $19,009 | $20,885 |
|---|
| 2/28/2022 | $18,431 | $20,260 |
|---|
| 3/31/2022 | $18,958 | $21,012 |
|---|
| 4/30/2022 | $17,589 | $19,180 |
|---|
| 5/31/2022 | $17,657 | $19,215 |
|---|
| 6/30/2022 | $16,627 | $17,629 |
|---|
| 7/31/2022 | $18,050 | $19,254 |
|---|
| 8/31/2022 | $17,334 | $18,469 |
|---|
| 9/30/2022 | $15,912 | $16,768 |
|---|
| 10/31/2022 | $17,281 | $18,126 |
|---|
| 11/30/2022 | $18,359 | $19,139 |
|---|
| 12/31/2022 | $17,617 | $18,036 |
|---|
| 1/31/2023 | $18,178 | $19,169 |
|---|
| 2/28/2023 | $17,800 | $18,702 |
|---|
| 3/31/2023 | $18,073 | $19,388 |
|---|
| 4/30/2023 | $18,492 | $19,691 |
|---|
| 5/31/2023 | $18,073 | $19,777 |
|---|
| 6/30/2023 | $19,155 | $21,083 |
|---|
| 7/31/2023 | $19,596 | $21,761 |
|---|
| 8/31/2023 | $19,545 | $21,414 |
|---|
| 9/30/2023 | $18,629 | $20,393 |
|---|
| 10/31/2023 | $18,280 | $19,964 |
|---|
| 11/30/2023 | $19,802 | $21,788 |
|---|
| 12/31/2023 | $20,561 | $22,777 |
|---|
| 1/31/2024 | $20,976 | $23,160 |
|---|
| 2/29/2024 | $22,117 | $24,397 |
|---|
| 3/31/2024 | $22,793 | $25,182 |
|---|
| 4/30/2024 | $21,732 | $24,153 |
|---|
| 5/31/2024 | $22,845 | $25,351 |
|---|
| 6/30/2024 | $23,501 | $26,260 |
|---|
| 7/31/2024 | $24,127 | $26,580 |
|---|
| 8/31/2024 | $24,908 | $27,225 |
|---|
| 9/30/2024 | $25,294 | $27,806 |
|---|
| 10/31/2024 | $25,210 | $27,554 |
|---|
| 11/30/2024 | $26,464 | $29,172 |
|---|
The Fund’s benchmarks are unmanaged indices used as a general measure of market performance. Calculations assume the reinvestment of dividends and capital gains.
Average Annual Total Returns (%)
| AATR | 1 Year | 5 Years | Since Inception 4/4/17 |
|---|
| Class F3 at NAV | 33.64% | 14.31% | 13.55% |
|---|
S&P 500 IndexFootnote Reference* | 33.89% | 15.77% | 15.01% |
|---|
| Footnote | Description |
Footnote* | The Fund has adopted the S&P 500 Index as its broad-based securities market index. |
The Fund's past performance is no guarantee of future results. The returns do not reflect the deduction of taxes that a shareholder would pay on Fund distributions or redemption of Fund shares.
(as of November 30, 2024)
| Total Net Assets | $4,417,827,505 |
|---|
| # of Portfolio Holdings | 56 |
|---|
| Portfolio Turnover Rate | 25% |
|---|
| Total Advisory Fees Paid | $20,526,637 |
|---|
What did the Fund invest in?
(as of November 30, 2024)
Portfolio Holdings Presented by SectorFootnote Reference* | % Footnote Reference** |
|---|
| Consumer Discretionary | 6.44% |
| Consumer Staples | 8.58% |
| Energy | 3.57% |
| Financials | 19.87% |
| Health Care | 12.51% |
| Industrials | 9.64% |
| Information Technology | 28.45% |
| Materials | 5.78% |
| Utilities | 3.62% |
| Repurchase Agreements | 1.54% |
| Total | 100.00% |
| Footnote | Description |
Footnote* | A sector may comprise several industries. |
Footnote** | Represents percent of total investments, which excludes derivatives. |
There were no material fund changes during the period.
Where can I find additional information about the Fund?
For additional information about the Fund, including its Prospectus, Statement of Additional Information, financial statements, holdings and proxy information, please visit lordabbett.com/FundDocuments.
The Fund has adopted a policy that allows it to send only one copy of the Fund's prospectus, proxy material, annual report and semiannual report (or related notice of internet availability of annual report and semiannual report) to certain shareholders residing at the same "household." This reduces Fund expenses, which benefits you and other shareholders.If you need additional copies or do not want your mailings to be "householded," please call Lord Abbett at 888-522-2388.
Lord Abbett Dividend Growth Fund
Annual Shareholder Report
November 30, 2024
lordabbett.com/FundDocuments
TSR-A-8953-F3
01/25
Lord Abbett Dividend Growth Fund
Annual Shareholder Report
November 30, 2024
lordabbett.com/FundDocuments
This annual shareholder report contains important information about the Lord Abbett Dividend Growth Fund for the period of December 1, 2023 to November 30, 2024, as well as certain changes to the Fund. You can find additional information about the Fund at lordabbett.com/FundDocuments. You can also request this information by contacting us at 888-522-2388.
What were the Fund costs for the last year?
(based on a hypothetical $10,000 investment)
| Class Name | Costs of a $10,000 investment | Costs paid as a percentage of a $10,000 investment |
|---|
| Class I | $75 | 0.64% |
|---|
How did the Fund perform last year and what affected its performance?
For the fiscal year ended November 30, 2024, the Fund returned 33.59%, reflecting performance at the net asset value (NAV) of Class I shares, with all distributions reinvested, compared to its benchmark and broad-based securities market index, S&P 500 Index, which returned 33.89% over the same period.
Positive factors for the markets included momentum around the soft-landing narrative, which was supported by signs of a cooling labor market and a slowing economy. This led to the U.S. Federal Reserve lowering its policy rate by 50 basis points in September and an additional 25 basis points in November. There were also increased expectations in the market for further rate cuts in 2024. Mixed economic data, including softer consumer price index reports and fluctuating job market indicators, contributed to these rate cut expectations, and also sparked recession fears. However, these factors were mostly balanced by strong consumer spending and retail sales.
Top contributors to performance: Security selection within the Consumer Staples sector contributed to relative performance, led by an overweight allocation to Walmart Inc. Security selection within the Information Technology sector also contributed to relative performance, led by an overweight allocation to Nvidia Corporation.
Top detractors from performance: Security selection within the Consumer Discretionary sector detracted from relative performance, led by an overweight allocation to McDonald’s Corporation. Security selection within the Communication Services sector also detracted from relative performance, led by an overweight allocation to Comcast Corporation.
Total Return Based on $10,000 Investment
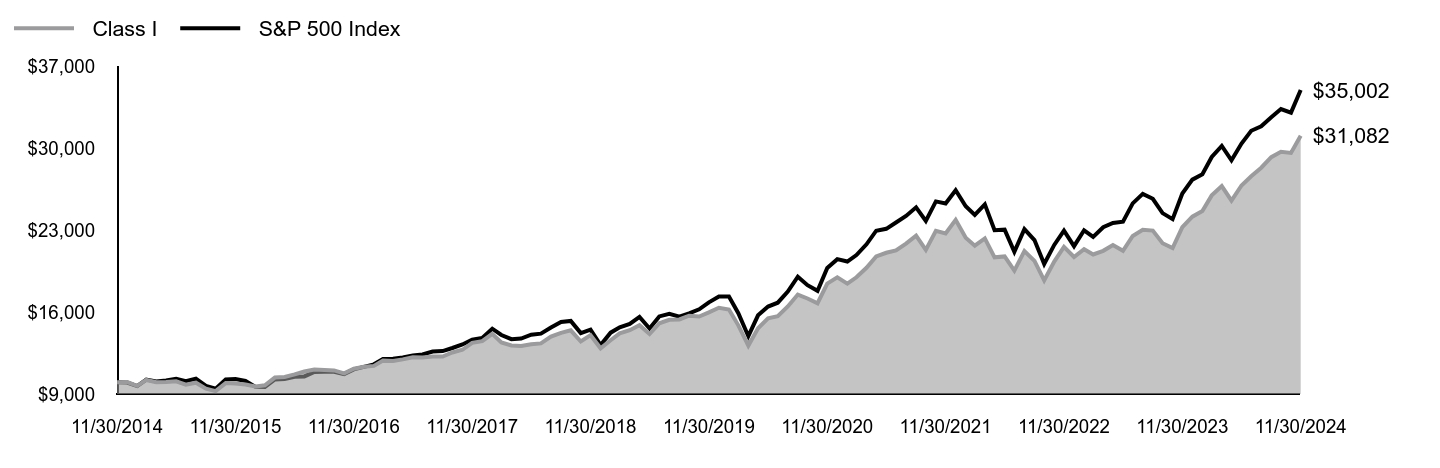
| Class I | S&P 500 Index |
|---|
| 11/30/2014 | $10,000 | $10,000 |
|---|
| 12/31/2014 | $10,021 | $9,975 |
|---|
| 1/31/2015 | $9,699 | $9,675 |
|---|
| 2/28/2015 | $10,202 | $10,231 |
|---|
| 3/31/2015 | $10,015 | $10,070 |
|---|
| 4/30/2015 | $10,029 | $10,166 |
|---|
| 5/31/2015 | $10,090 | $10,297 |
|---|
| 6/30/2015 | $9,796 | $10,098 |
|---|
| 7/31/2015 | $9,965 | $10,309 |
|---|
| 8/31/2015 | $9,450 | $9,687 |
|---|
| 9/30/2015 | $9,244 | $9,448 |
|---|
| 10/31/2015 | $9,932 | $10,244 |
|---|
| 11/30/2015 | $9,891 | $10,275 |
|---|
| 12/31/2015 | $9,809 | $10,113 |
|---|
| 1/31/2016 | $9,647 | $9,611 |
|---|
| 2/29/2016 | $9,743 | $9,598 |
|---|
| 3/31/2016 | $10,406 | $10,249 |
|---|
| 4/30/2016 | $10,450 | $10,289 |
|---|
| 5/31/2016 | $10,672 | $10,474 |
|---|
| 6/30/2016 | $10,925 | $10,501 |
|---|
| 7/31/2016 | $11,096 | $10,888 |
|---|
| 8/31/2016 | $11,051 | $10,903 |
|---|
| 9/30/2016 | $11,014 | $10,905 |
|---|
| 10/31/2016 | $10,767 | $10,706 |
|---|
| 11/30/2016 | $11,163 | $11,103 |
|---|
| 12/31/2016 | $11,324 | $11,322 |
|---|
| 1/31/2017 | $11,404 | $11,537 |
|---|
| 2/28/2017 | $11,854 | $11,995 |
|---|
| 3/31/2017 | $11,821 | $12,009 |
|---|
| 4/30/2017 | $11,958 | $12,132 |
|---|
| 5/31/2017 | $12,144 | $12,303 |
|---|
| 6/30/2017 | $12,125 | $12,380 |
|---|
| 7/31/2017 | $12,214 | $12,635 |
|---|
| 8/31/2017 | $12,206 | $12,673 |
|---|
| 9/30/2017 | $12,547 | $12,935 |
|---|
| 10/31/2017 | $12,783 | $13,237 |
|---|
| 11/30/2017 | $13,370 | $13,642 |
|---|
| 12/31/2017 | $13,515 | $13,794 |
|---|
| 1/31/2018 | $14,150 | $14,584 |
|---|
| 2/28/2018 | $13,402 | $14,046 |
|---|
| 3/31/2018 | $13,147 | $13,689 |
|---|
| 4/30/2018 | $13,103 | $13,742 |
|---|
| 5/31/2018 | $13,252 | $14,073 |
|---|
| 6/30/2018 | $13,326 | $14,160 |
|---|
| 7/31/2018 | $13,906 | $14,686 |
|---|
| 8/31/2018 | $14,231 | $15,165 |
|---|
| 9/30/2018 | $14,444 | $15,251 |
|---|
| 10/31/2018 | $13,491 | $14,209 |
|---|
| 11/30/2018 | $14,029 | $14,498 |
|---|
| 12/31/2018 | $12,905 | $13,189 |
|---|
| 1/31/2019 | $13,600 | $14,246 |
|---|
| 2/28/2019 | $14,181 | $14,704 |
|---|
| 3/31/2019 | $14,457 | $14,989 |
|---|
| 4/30/2019 | $14,888 | $15,596 |
|---|
| 5/31/2019 | $14,132 | $14,605 |
|---|
| 6/30/2019 | $15,042 | $15,635 |
|---|
| 7/31/2019 | $15,340 | $15,859 |
|---|
| 8/31/2019 | $15,379 | $15,608 |
|---|
| 9/30/2019 | $15,695 | $15,900 |
|---|
| 10/31/2019 | $15,627 | $16,245 |
|---|
| 11/30/2019 | $15,975 | $16,834 |
|---|
| 12/31/2019 | $16,378 | $17,342 |
|---|
| 1/31/2020 | $16,226 | $17,335 |
|---|
| 2/29/2020 | $14,871 | $15,908 |
|---|
| 3/31/2020 | $13,139 | $13,944 |
|---|
| 4/30/2020 | $14,622 | $15,731 |
|---|
| 5/31/2020 | $15,466 | $16,480 |
|---|
| 6/30/2020 | $15,659 | $16,808 |
|---|
| 7/31/2020 | $16,485 | $17,756 |
|---|
| 8/31/2020 | $17,506 | $19,032 |
|---|
| 9/30/2020 | $17,170 | $18,309 |
|---|
| 10/31/2020 | $16,761 | $17,822 |
|---|
| 11/30/2020 | $18,439 | $19,773 |
|---|
| 12/31/2020 | $18,969 | $20,533 |
|---|
| 1/31/2021 | $18,433 | $20,326 |
|---|
| 2/28/2021 | $18,979 | $20,886 |
|---|
| 3/31/2021 | $19,791 | $21,801 |
|---|
| 4/30/2021 | $20,760 | $22,964 |
|---|
| 5/31/2021 | $21,076 | $23,125 |
|---|
| 6/30/2021 | $21,282 | $23,665 |
|---|
| 7/31/2021 | $21,863 | $24,227 |
|---|
| 8/31/2021 | $22,548 | $24,963 |
|---|
| 9/30/2021 | $21,322 | $23,802 |
|---|
| 10/31/2021 | $22,951 | $25,470 |
|---|
| 11/30/2021 | $22,729 | $25,294 |
|---|
| 12/31/2021 | $23,892 | $26,427 |
|---|
| 1/31/2022 | $22,355 | $25,060 |
|---|
| 2/28/2022 | $21,683 | $24,309 |
|---|
| 3/31/2022 | $22,306 | $25,212 |
|---|
| 4/30/2022 | $20,685 | $23,013 |
|---|
| 5/31/2022 | $20,765 | $23,056 |
|---|
| 6/30/2022 | $19,557 | $21,152 |
|---|
| 7/31/2022 | $21,231 | $23,103 |
|---|
| 8/31/2022 | $20,382 | $22,161 |
|---|
| 9/30/2022 | $18,710 | $20,120 |
|---|
| 10/31/2022 | $20,319 | $21,749 |
|---|
| 11/30/2022 | $21,584 | $22,964 |
|---|
| 12/31/2022 | $20,716 | $21,641 |
|---|
| 1/31/2023 | $21,381 | $23,001 |
|---|
| 2/28/2023 | $20,934 | $22,440 |
|---|
| 3/31/2023 | $21,244 | $23,263 |
|---|
| 4/30/2023 | $21,741 | $23,626 |
|---|
| 5/31/2023 | $21,244 | $23,729 |
|---|
| 6/30/2023 | $22,513 | $25,297 |
|---|
| 7/31/2023 | $23,036 | $26,110 |
|---|
| 8/31/2023 | $22,975 | $25,694 |
|---|
| 9/30/2023 | $21,890 | $24,469 |
|---|
| 10/31/2023 | $21,476 | $23,955 |
|---|
| 11/30/2023 | $23,267 | $26,142 |
|---|
| 12/31/2023 | $24,166 | $27,330 |
|---|
| 1/31/2024 | $24,645 | $27,789 |
|---|
| 2/29/2024 | $25,984 | $29,273 |
|---|
| 3/31/2024 | $26,784 | $30,215 |
|---|
| 4/30/2024 | $25,541 | $28,981 |
|---|
| 5/31/2024 | $26,834 | $30,418 |
|---|
| 6/30/2024 | $27,611 | $31,509 |
|---|
| 7/31/2024 | $28,351 | $31,893 |
|---|
| 8/31/2024 | $29,252 | $32,666 |
|---|
| 9/30/2024 | $29,709 | $33,364 |
|---|
| 10/31/2024 | $29,610 | $33,061 |
|---|
| 11/30/2024 | $31,082 | $35,002 |
|---|
The Fund’s benchmarks are unmanaged indices used as a general measure of market performance. Calculations assume the reinvestment of dividends and capital gains.
Average Annual Total Returns (%)
| AATR | 1 Year | 5 Years | 10 Years |
|---|
| Class I at NAV | 33.59% | 14.24% | 12.01% |
|---|
S&P 500 IndexFootnote Reference* | 33.89% | 15.77% | 13.35% |
|---|
| Footnote | Description |
Footnote* | The Fund has adopted the S&P 500 Index as its broad-based securities market index. |
The Fund's past performance is no guarantee of future results. The returns do not reflect the deduction of taxes that a shareholder would pay on Fund distributions or redemption of Fund shares.
(as of November 30, 2024)
| Total Net Assets | $4,417,827,505 |
|---|
| # of Portfolio Holdings | 56 |
|---|
| Portfolio Turnover Rate | 25% |
|---|
| Total Advisory Fees Paid | $20,526,637 |
|---|
What did the Fund invest in?
(as of November 30, 2024)
Portfolio Holdings Presented by SectorFootnote Reference* | % Footnote Reference** |
|---|
| Consumer Discretionary | 6.44% |
| Consumer Staples | 8.58% |
| Energy | 3.57% |
| Financials | 19.87% |
| Health Care | 12.51% |
| Industrials | 9.64% |
| Information Technology | 28.45% |
| Materials | 5.78% |
| Utilities | 3.62% |
| Repurchase Agreements | 1.54% |
| Total | 100.00% |
| Footnote | Description |
Footnote* | A sector may comprise several industries. |
Footnote** | Represents percent of total investments, which excludes derivatives. |
There were no material fund changes during the period.
Where can I find additional information about the Fund?
For additional information about the Fund, including its Prospectus, Statement of Additional Information, financial statements, holdings and proxy information, please visit lordabbett.com/FundDocuments.
The Fund has adopted a policy that allows it to send only one copy of the Fund's prospectus, proxy material, annual report and semiannual report (or related notice of internet availability of annual report and semiannual report) to certain shareholders residing at the same "household." This reduces Fund expenses, which benefits you and other shareholders.If you need additional copies or do not want your mailings to be "householded," please call Lord Abbett at 888-522-2388.
Lord Abbett Dividend Growth Fund
Annual Shareholder Report
November 30, 2024
lordabbett.com/FundDocuments
TSR-A-577-I
01/25
Lord Abbett Dividend Growth Fund
Annual Shareholder Report
November 30, 2024
lordabbett.com/FundDocuments
This annual shareholder report contains important information about the Lord Abbett Dividend Growth Fund for the period of December 1, 2023 to November 30, 2024, as well as certain changes to the Fund. You can find additional information about the Fund at lordabbett.com/FundDocuments. You can also request this information by contacting us at 888-522-2388.
What were the Fund costs for the last year?
(based on a hypothetical $10,000 investment)
| Class Name | Costs of a $10,000 investment | Costs paid as a percentage of a $10,000 investment |
|---|
| Class P | $127 | 1.09% |
|---|
How did the Fund perform last year and what affected its performance?
For the fiscal year ended November 30, 2024, the Fund returned 32.94%, reflecting performance at the net asset value (NAV) of Class P shares, with all distributions reinvested, compared to its benchmark and broad-based securities market index, S&P 500 Index, which returned 33.89% over the same period.
Positive factors for the markets included momentum around the soft-landing narrative, which was supported by signs of a cooling labor market and a slowing economy. This led to the U.S. Federal Reserve lowering its policy rate by 50 basis points in September and an additional 25 basis points in November. There were also increased expectations in the market for further rate cuts in 2024. Mixed economic data, including softer consumer price index reports and fluctuating job market indicators, contributed to these rate cut expectations, and also sparked recession fears. However, these factors were mostly balanced by strong consumer spending and retail sales.
Top contributors to performance: Security selection within the Consumer Staples sector contributed to relative performance, led by an overweight allocation to Walmart Inc. Security selection within the Information Technology sector also contributed to relative performance, led by an overweight allocation to Nvidia Corporation.
Top detractors from performance: Security selection within the Consumer Discretionary sector detracted from relative performance, led by an overweight allocation to McDonald’s Corporation. Security selection within the Communication Services sector also detracted from relative performance, led by an overweight allocation to Comcast Corporation.
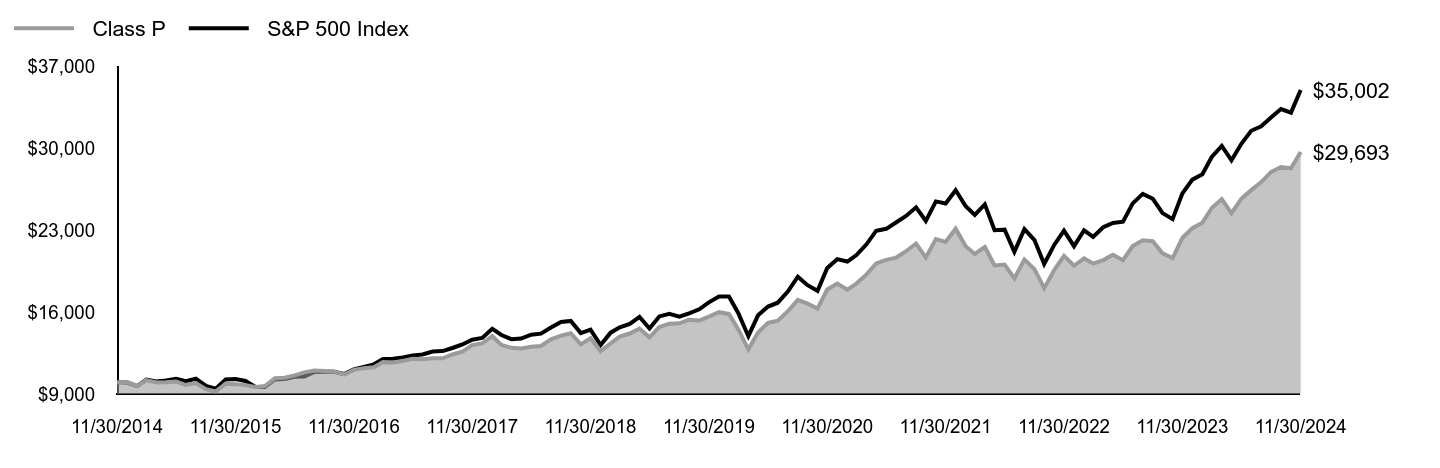
Total Return Based on $10,000 Investment
| Class P | S&P 500 Index |
|---|
| 11/30/2014 | $10,000 | $10,000 |
|---|
| 12/31/2014 | $10,016 | $9,975 |
|---|
| 1/31/2015 | $9,687 | $9,675 |
|---|
| 2/28/2015 | $10,191 | $10,231 |
|---|
| 3/31/2015 | $9,992 | $10,070 |
|---|
| 4/30/2015 | $10,006 | $10,166 |
|---|
| 5/31/2015 | $10,067 | $10,297 |
|---|
| 6/30/2015 | $9,767 | $10,098 |
|---|
| 7/31/2015 | $9,937 | $10,309 |
|---|
| 8/31/2015 | $9,415 | $9,687 |
|---|
| 9/30/2015 | $9,211 | $9,448 |
|---|
| 10/31/2015 | $9,885 | $10,244 |
|---|
| 11/30/2015 | $9,844 | $10,275 |
|---|
| 12/31/2015 | $9,759 | $10,113 |
|---|
| 1/31/2016 | $9,597 | $9,611 |
|---|
| 2/29/2016 | $9,685 | $9,598 |
|---|
| 3/31/2016 | $10,342 | $10,249 |
|---|
| 4/30/2016 | $10,387 | $10,289 |
|---|
| 5/31/2016 | $10,593 | $10,474 |
|---|
| 6/30/2016 | $10,848 | $10,501 |
|---|
| 7/31/2016 | $11,011 | $10,888 |
|---|
| 8/31/2016 | $10,959 | $10,903 |
|---|
| 9/30/2016 | $10,916 | $10,905 |
|---|
| 10/31/2016 | $10,671 | $10,706 |
|---|
| 11/30/2016 | $11,065 | $11,103 |
|---|
| 12/31/2016 | $11,212 | $11,322 |
|---|
| 1/31/2017 | $11,283 | $11,537 |
|---|
| 2/28/2017 | $11,730 | $11,995 |
|---|
| 3/31/2017 | $11,701 | $12,009 |
|---|
| 4/30/2017 | $11,821 | $12,132 |
|---|
| 5/31/2017 | $12,006 | $12,303 |
|---|
| 6/30/2017 | $11,982 | $12,380 |
|---|
| 7/31/2017 | $12,062 | $12,635 |
|---|
| 8/31/2017 | $12,054 | $12,673 |
|---|
| 9/30/2017 | $12,378 | $12,935 |
|---|
| 10/31/2017 | $12,612 | $13,237 |
|---|
| 11/30/2017 | $13,185 | $13,642 |
|---|
| 12/31/2017 | $13,323 | $13,794 |
|---|
| 1/31/2018 | $13,943 | $14,584 |
|---|
| 2/28/2018 | $13,202 | $14,046 |
|---|
| 3/31/2018 | $12,951 | $13,689 |
|---|
| 4/30/2018 | $12,900 | $13,742 |
|---|
| 5/31/2018 | $13,038 | $14,073 |
|---|
| 6/30/2018 | $13,105 | $14,160 |
|---|
| 7/31/2018 | $13,677 | $14,686 |
|---|
| 8/31/2018 | $13,990 | $15,165 |
|---|
| 9/30/2018 | $14,194 | $15,251 |
|---|
| 10/31/2018 | $13,245 | $14,209 |
|---|
| 11/30/2018 | $13,776 | $14,498 |
|---|
| 12/31/2018 | $12,669 | $13,189 |
|---|
| 1/31/2019 | $13,335 | $14,246 |
|---|
| 2/28/2019 | $13,907 | $14,704 |
|---|
| 3/31/2019 | $14,172 | $14,989 |
|---|
| 4/30/2019 | $14,586 | $15,596 |
|---|
| 5/31/2019 | $13,852 | $14,605 |
|---|
| 6/30/2019 | $14,728 | $15,635 |
|---|
| 7/31/2019 | $15,011 | $15,859 |
|---|
| 8/31/2019 | $15,049 | $15,608 |
|---|
| 9/30/2019 | $15,352 | $15,900 |
|---|
| 10/31/2019 | $15,276 | $16,245 |
|---|
| 11/30/2019 | $15,617 | $16,834 |
|---|
| 12/31/2019 | $15,996 | $17,342 |
|---|
| 1/31/2020 | $15,848 | $17,335 |
|---|
| 2/29/2020 | $14,518 | $15,908 |
|---|
| 3/31/2020 | $12,820 | $13,944 |
|---|
| 4/30/2020 | $14,264 | $15,731 |
|---|
| 5/31/2020 | $15,080 | $16,480 |
|---|
| 6/30/2020 | $15,272 | $16,808 |
|---|
| 7/31/2020 | $16,071 | $17,756 |
|---|
| 8/31/2020 | $17,049 | $19,032 |
|---|
| 9/30/2020 | $16,722 | $18,309 |
|---|
| 10/31/2020 | $16,312 | $17,822 |
|---|
| 11/30/2020 | $17,933 | $19,773 |
|---|
| 12/31/2020 | $18,441 | $20,533 |
|---|
| 1/31/2021 | $17,918 | $20,326 |
|---|
| 2/28/2021 | $18,441 | $20,886 |
|---|
| 3/31/2021 | $19,224 | $21,801 |
|---|
| 4/30/2021 | $20,168 | $22,964 |
|---|
| 5/31/2021 | $20,466 | $23,125 |
|---|
| 6/30/2021 | $20,655 | $23,665 |
|---|
| 7/31/2021 | $21,210 | $24,227 |
|---|
| 8/31/2021 | $21,868 | $24,963 |
|---|
| 9/30/2021 | $20,669 | $23,802 |
|---|
| 10/31/2021 | $22,244 | $25,470 |
|---|
| 11/30/2021 | $22,007 | $25,294 |
|---|
| 12/31/2021 | $23,137 | $26,427 |
|---|
| 1/31/2022 | $21,642 | $25,060 |
|---|
| 2/28/2022 | $20,977 | $24,309 |
|---|
| 3/31/2022 | $21,571 | $25,212 |
|---|
| 4/30/2022 | $19,996 | $23,013 |
|---|
| 5/31/2022 | $20,063 | $23,056 |
|---|
| 6/30/2022 | $18,887 | $21,152 |
|---|
| 7/31/2022 | $20,500 | $23,103 |
|---|
| 8/31/2022 | $19,677 | $22,161 |
|---|
| 9/30/2022 | $18,055 | $20,120 |
|---|
| 10/31/2022 | $19,603 | $21,749 |
|---|
| 11/30/2022 | $20,806 | $22,964 |
|---|
| 12/31/2022 | $19,967 | $21,641 |
|---|
| 1/31/2023 | $20,599 | $23,001 |
|---|
| 2/28/2023 | $20,154 | $22,440 |
|---|
| 3/31/2023 | $20,455 | $23,263 |
|---|
| 4/30/2023 | $20,912 | $23,626 |
|---|
| 5/31/2023 | $20,443 | $23,729 |
|---|
| 6/30/2023 | $21,647 | $25,297 |
|---|
| 7/31/2023 | $22,140 | $26,110 |
|---|
| 8/31/2023 | $22,069 | $25,694 |
|---|
| 9/30/2023 | $21,031 | $24,469 |
|---|
| 10/31/2023 | $20,620 | $23,955 |
|---|
| 11/30/2023 | $22,336 | $26,142 |
|---|
| 12/31/2023 | $23,179 | $27,330 |
|---|
| 1/31/2024 | $23,641 | $27,789 |
|---|
| 2/29/2024 | $24,909 | $29,273 |
|---|
| 3/31/2024 | $25,665 | $30,215 |
|---|
| 4/30/2024 | $24,467 | $28,981 |
|---|
| 5/31/2024 | $25,701 | $30,418 |
|---|
| 6/30/2024 | $26,432 | $31,509 |
|---|
| 7/31/2024 | $27,120 | $31,893 |
|---|
| 8/31/2024 | $27,987 | $32,666 |
|---|
| 9/30/2024 | $28,409 | $33,364 |
|---|
| 10/31/2024 | $28,302 | $33,061 |
|---|
| 11/30/2024 | $29,693 | $35,002 |
|---|
The Fund’s benchmarks are unmanaged indices used as a general measure of market performance. Calculations assume the reinvestment of dividends and capital gains.
Average Annual Total Returns (%)
| AATR | 1 Year | 5 Years | 10 Years |
|---|
| Class P at NAV | 32.94% | 13.71% | 11.50% |
|---|
S&P 500 IndexFootnote Reference* | 33.89% | 15.77% | 13.35% |
|---|
| Footnote | Description |
Footnote* | The Fund has adopted the S&P 500 Index as its broad-based securities market index. |
The Fund's past performance is no guarantee of future results. The returns do not reflect the deduction of taxes that a shareholder would pay on Fund distributions or redemption of Fund shares.
(as of November 30, 2024)
| Total Net Assets | $4,417,827,505 |
|---|
| # of Portfolio Holdings | 56 |
|---|
| Portfolio Turnover Rate | 25% |
|---|
| Total Advisory Fees Paid | $20,526,637 |
|---|
What did the Fund invest in?
(as of November 30, 2024)
Portfolio Holdings Presented by SectorFootnote Reference* | % Footnote Reference** |
|---|
| Consumer Discretionary | 6.44% |
| Consumer Staples | 8.58% |
| Energy | 3.57% |
| Financials | 19.87% |
| Health Care | 12.51% |
| Industrials | 9.64% |
| Information Technology | 28.45% |
| Materials | 5.78% |
| Utilities | 3.62% |
| Repurchase Agreements | 1.54% |
| Total | 100.00% |
| Footnote | Description |
Footnote* | A sector may comprise several industries. |
Footnote** | Represents percent of total investments, which excludes derivatives. |
There were no material fund changes during the period.
Where can I find additional information about the Fund?
For additional information about the Fund, including its Prospectus, Statement of Additional Information, financial statements, holdings and proxy information, please visit lordabbett.com/FundDocuments.
The Fund has adopted a policy that allows it to send only one copy of the Fund's prospectus, proxy material, annual report and semiannual report (or related notice of internet availability of annual report and semiannual report) to certain shareholders residing at the same "household." This reduces Fund expenses, which benefits you and other shareholders.If you need additional copies or do not want your mailings to be "householded," please call Lord Abbett at 888-522-2388.
Lord Abbett Dividend Growth Fund
Annual Shareholder Report
November 30, 2024
lordabbett.com/FundDocuments
TSR-A-576-P
01/25
Lord Abbett Dividend Growth Fund
Annual Shareholder Report
November 30, 2024
lordabbett.com/FundDocuments
This annual shareholder report contains important information about the Lord Abbett Dividend Growth Fund for the period of December 1, 2023 to November 30, 2024, as well as certain changes to the Fund. You can find additional information about the Fund at lordabbett.com/FundDocuments. You can also request this information by contacting us at 888-522-2388.
What were the Fund costs for the last year?
(based on a hypothetical $10,000 investment)
| Class Name | Costs of a $10,000 investment | Costs paid as a percentage of a $10,000 investment |
|---|
| Class R2 | $144 | 1.24% |
|---|
How did the Fund perform last year and what affected its performance?
For the fiscal year ended November 30, 2024, the Fund returned 32.77%, reflecting performance at the net asset value (NAV) of Class R2 shares, with all distributions reinvested, compared to its benchmark and broad-based securities market index, S&P 500 Index, which returned 33.89% over the same period.
Positive factors for the markets included momentum around the soft-landing narrative, which was supported by signs of a cooling labor market and a slowing economy. This led to the U.S. Federal Reserve lowering its policy rate by 50 basis points in September and an additional 25 basis points in November. There were also increased expectations in the market for further rate cuts in 2024. Mixed economic data, including softer consumer price index reports and fluctuating job market indicators, contributed to these rate cut expectations, and also sparked recession fears. However, these factors were mostly balanced by strong consumer spending and retail sales.
Top contributors to performance: Security selection within the Consumer Staples sector contributed to relative performance, led by an overweight allocation to Walmart Inc. Security selection within the Information Technology sector also contributed to relative performance, led by an overweight allocation to Nvidia Corporation.
Top detractors from performance: Security selection within the Consumer Discretionary sector detracted from relative performance, led by an overweight allocation to McDonald’s Corporation. Security selection within the Communication Services sector also detracted from relative performance, led by an overweight allocation to Comcast Corporation.
Total Return Based on $10,000 Investment

| Class R2 | S&P 500 Index |
|---|
| 11/30/2014 | $10,000 | $10,000 |
|---|
| 12/31/2014 | $10,012 | $9,975 |
|---|
| 1/31/2015 | $9,684 | $9,675 |
|---|
| 2/28/2015 | $10,186 | $10,231 |
|---|
| 3/31/2015 | $9,987 | $10,070 |
|---|
| 4/30/2015 | $10,000 | $10,166 |
|---|
| 5/31/2015 | $10,054 | $10,297 |
|---|
| 6/30/2015 | $9,759 | $10,098 |
|---|
| 7/31/2015 | $9,927 | $10,309 |
|---|
| 8/31/2015 | $9,401 | $9,687 |
|---|
| 9/30/2015 | $9,195 | $9,448 |
|---|
| 10/31/2015 | $9,872 | $10,244 |
|---|
| 11/30/2015 | $9,831 | $10,275 |
|---|
| 12/31/2015 | $9,743 | $10,113 |
|---|
| 1/31/2016 | $9,582 | $9,611 |
|---|
| 2/29/2016 | $9,663 | $9,598 |
|---|
| 3/31/2016 | $10,320 | $10,249 |
|---|
| 4/30/2016 | $10,357 | $10,289 |
|---|
| 5/31/2016 | $10,570 | $10,474 |
|---|
| 6/30/2016 | $10,816 | $10,501 |
|---|
| 7/31/2016 | $10,978 | $10,888 |
|---|
| 8/31/2016 | $10,933 | $10,903 |
|---|
| 9/30/2016 | $10,886 | $10,905 |
|---|
| 10/31/2016 | $10,635 | $10,706 |
|---|
| 11/30/2016 | $11,027 | $11,103 |
|---|
| 12/31/2016 | $11,178 | $11,322 |
|---|
| 1/31/2017 | $11,249 | $11,537 |
|---|
| 2/28/2017 | $11,685 | $11,995 |
|---|
| 3/31/2017 | $11,660 | $12,009 |
|---|
| 4/30/2017 | $11,780 | $12,132 |
|---|
| 5/31/2017 | $11,963 | $12,303 |
|---|
| 6/30/2017 | $11,934 | $12,380 |
|---|
| 7/31/2017 | $12,014 | $12,635 |
|---|
| 8/31/2017 | $11,998 | $12,673 |
|---|
| 9/30/2017 | $12,331 | $12,935 |
|---|
| 10/31/2017 | $12,555 | $13,237 |
|---|
| 11/30/2017 | $13,123 | $13,642 |
|---|
| 12/31/2017 | $13,264 | $13,794 |
|---|
| 1/31/2018 | $13,878 | $14,584 |
|---|
| 2/28/2018 | $13,144 | $14,046 |
|---|
| 3/31/2018 | $12,883 | $13,689 |
|---|
| 4/30/2018 | $12,832 | $13,742 |
|---|
| 5/31/2018 | $12,977 | $14,073 |
|---|
| 6/30/2018 | $13,039 | $14,160 |
|---|
| 7/31/2018 | $13,606 | $14,686 |
|---|
| 8/31/2018 | $13,915 | $15,165 |
|---|
| 9/30/2018 | $14,120 | $15,251 |
|---|
| 10/31/2018 | $13,172 | $14,209 |
|---|
| 11/30/2018 | $13,698 | $14,498 |
|---|
| 12/31/2018 | $12,589 | $13,189 |
|---|
| 1/31/2019 | $13,258 | $14,246 |
|---|
| 2/28/2019 | $13,824 | $14,704 |
|---|
| 3/31/2019 | $14,082 | $14,989 |
|---|
| 4/30/2019 | $14,492 | $15,596 |
|---|
| 5/31/2019 | $13,756 | $14,605 |
|---|
| 6/30/2019 | $14,626 | $15,635 |
|---|
| 7/31/2019 | $14,907 | $15,859 |
|---|
| 8/31/2019 | $14,944 | $15,608 |
|---|
| 9/30/2019 | $15,238 | $15,900 |
|---|
| 10/31/2019 | $15,164 | $16,245 |
|---|
| 11/30/2019 | $15,501 | $16,834 |
|---|
| 12/31/2019 | $15,879 | $17,342 |
|---|
| 1/31/2020 | $15,723 | $17,335 |
|---|
| 2/29/2020 | $14,409 | $15,908 |
|---|
| 3/31/2020 | $12,713 | $13,944 |
|---|
| 4/30/2020 | $14,148 | $15,731 |
|---|
| 5/31/2020 | $14,963 | $16,480 |
|---|
| 6/30/2020 | $15,137 | $16,808 |
|---|
| 7/31/2020 | $15,935 | $17,756 |
|---|
| 8/31/2020 | $16,900 | $19,032 |
|---|
| 9/30/2020 | $16,571 | $18,309 |
|---|
| 10/31/2020 | $16,166 | $17,822 |
|---|
| 11/30/2020 | $17,774 | $19,773 |
|---|
| 12/31/2020 | $18,279 | $20,533 |
|---|
| 1/31/2021 | $17,754 | $20,326 |
|---|
| 2/28/2021 | $18,279 | $20,886 |
|---|
| 3/31/2021 | $19,044 | $21,801 |
|---|
| 4/30/2021 | $19,974 | $22,964 |
|---|
| 5/31/2021 | $20,268 | $23,125 |
|---|
| 6/30/2021 | $20,456 | $23,665 |
|---|
| 7/31/2021 | $21,003 | $24,227 |
|---|
| 8/31/2021 | $21,641 | $24,963 |
|---|
| 9/30/2021 | $20,455 | $23,802 |
|---|
| 10/31/2021 | $22,017 | $25,470 |
|---|
| 11/30/2021 | $21,784 | $25,294 |
|---|
| 12/31/2021 | $22,888 | $26,427 |
|---|
| 1/31/2022 | $21,406 | $25,060 |
|---|
| 2/28/2022 | $20,752 | $24,309 |
|---|
| 3/31/2022 | $21,339 | $25,212 |
|---|
| 4/30/2022 | $19,779 | $23,013 |
|---|
| 5/31/2022 | $19,844 | $23,056 |
|---|
| 6/30/2022 | $18,682 | $21,152 |
|---|
| 7/31/2022 | $20,257 | $23,103 |
|---|
| 8/31/2022 | $19,448 | $22,161 |
|---|
| 9/30/2022 | $17,840 | $20,120 |
|---|
| 10/31/2022 | $19,373 | $21,749 |
|---|
| 11/30/2022 | $20,555 | $22,964 |
|---|
| 12/31/2022 | $19,723 | $21,641 |
|---|
| 1/31/2023 | $20,344 | $23,001 |
|---|
| 2/28/2023 | $19,907 | $22,440 |
|---|
| 3/31/2023 | $20,206 | $23,263 |
|---|
| 4/30/2023 | $20,654 | $23,626 |
|---|
| 5/31/2023 | $20,183 | $23,729 |
|---|
| 6/30/2023 | $21,380 | $25,297 |
|---|
| 7/31/2023 | $21,852 | $26,110 |
|---|
| 8/31/2023 | $21,783 | $25,694 |
|---|
| 9/30/2023 | $20,746 | $24,469 |
|---|
| 10/31/2023 | $20,354 | $23,955 |
|---|
| 11/30/2023 | $22,038 | $26,142 |
|---|
| 12/31/2023 | $22,869 | $27,330 |
|---|
| 1/31/2024 | $23,310 | $27,789 |
|---|
| 2/29/2024 | $24,576 | $29,273 |
|---|
| 3/31/2024 | $25,308 | $30,215 |
|---|
| 4/30/2024 | $24,122 | $28,981 |
|---|
| 5/31/2024 | $25,332 | $30,418 |
|---|
| 6/30/2024 | $26,052 | $31,509 |
|---|
| 7/31/2024 | $26,738 | $31,893 |
|---|
| 8/31/2024 | $27,576 | $32,666 |
|---|
| 9/30/2024 | $28,002 | $33,364 |
|---|
| 10/31/2024 | $27,886 | $33,061 |
|---|
| 11/30/2024 | $29,260 | $35,002 |
|---|
The Fund’s benchmarks are unmanaged indices used as a general measure of market performance. Calculations assume the reinvestment of dividends and capital gains.
Average Annual Total Returns (%)
| AATR | 1 Year | 5 Years | 10 Years |
|---|
| Class R2 at NAV | 32.77% | 13.55% | 11.33% |
|---|
S&P 500 IndexFootnote Reference* | 33.89% | 15.77% | 13.35% |
|---|
| Footnote | Description |
Footnote* | The Fund has adopted the S&P 500 Index as its broad-based securities market index. |
The Fund's past performance is no guarantee of future results. The returns do not reflect the deduction of taxes that a shareholder would pay on Fund distributions or redemption of Fund shares.
(as of November 30, 2024)
| Total Net Assets | $4,417,827,505 |
|---|
| # of Portfolio Holdings | 56 |
|---|
| Portfolio Turnover Rate | 25% |
|---|
| Total Advisory Fees Paid | $20,526,637 |
|---|
What did the Fund invest in?
(as of November 30, 2024)
Portfolio Holdings Presented by SectorFootnote Reference* | % Footnote Reference** |
|---|
| Consumer Discretionary | 6.44% |
| Consumer Staples | 8.58% |
| Energy | 3.57% |
| Financials | 19.87% |
| Health Care | 12.51% |
| Industrials | 9.64% |
| Information Technology | 28.45% |
| Materials | 5.78% |
| Utilities | 3.62% |
| Repurchase Agreements | 1.54% |
| Total | 100.00% |
| Footnote | Description |
Footnote* | A sector may comprise several industries. |
Footnote** | Represents percent of total investments, which excludes derivatives. |
There were no material fund changes during the period.
Where can I find additional information about the Fund?
For additional information about the Fund, including its Prospectus, Statement of Additional Information, financial statements, holdings and proxy information, please visit lordabbett.com/FundDocuments.
The Fund has adopted a policy that allows it to send only one copy of the Fund's prospectus, proxy material, annual report and semiannual report (or related notice of internet availability of annual report and semiannual report) to certain shareholders residing at the same "household." This reduces Fund expenses, which benefits you and other shareholders.If you need additional copies or do not want your mailings to be "householded," please call Lord Abbett at 888-522-2388.
Lord Abbett Dividend Growth Fund
Annual Shareholder Report
November 30, 2024
lordabbett.com/FundDocuments
TSR-A-1090-R2
01/25
Lord Abbett Dividend Growth Fund
Annual Shareholder Report
November 30, 2024
lordabbett.com/FundDocuments
This annual shareholder report contains important information about the Lord Abbett Dividend Growth Fund for the period of December 1, 2023 to November 30, 2024, as well as certain changes to the Fund. You can find additional information about the Fund at lordabbett.com/FundDocuments. You can also request this information by contacting us at 888-522-2388.
What were the Fund costs for the last year?
(based on a hypothetical $10,000 investment)
| Class Name | Costs of a $10,000 investment | Costs paid as a percentage of a $10,000 investment |
|---|
| Class R3 | $133 | 1.14% |
|---|
How did the Fund perform last year and what affected its performance?
For the fiscal year ended November 30, 2024, the Fund returned 32.87%, reflecting performance at the net asset value (NAV) of Class R3 shares, with all distributions reinvested, compared to its benchmark and broad-based securities market index, S&P 500 Index, which returned 33.89% over the same period.
Positive factors for the markets included momentum around the soft-landing narrative, which was supported by signs of a cooling labor market and a slowing economy. This led to the U.S. Federal Reserve lowering its policy rate by 50 basis points in September and an additional 25 basis points in November. There were also increased expectations in the market for further rate cuts in 2024. Mixed economic data, including softer consumer price index reports and fluctuating job market indicators, contributed to these rate cut expectations, and also sparked recession fears. However, these factors were mostly balanced by strong consumer spending and retail sales.
Top contributors to performance: Security selection within the Consumer Staples sector contributed to relative performance, led by an overweight allocation to Walmart Inc. Security selection within the Information Technology sector also contributed to relative performance, led by an overweight allocation to Nvidia Corporation.
Top detractors from performance: Security selection within the Consumer Discretionary sector detracted from relative performance, led by an overweight allocation to McDonald’s Corporation. Security selection within the Communication Services sector also detracted from relative performance, led by an overweight allocation to Comcast Corporation.
Total Return Based on $10,000 Investment
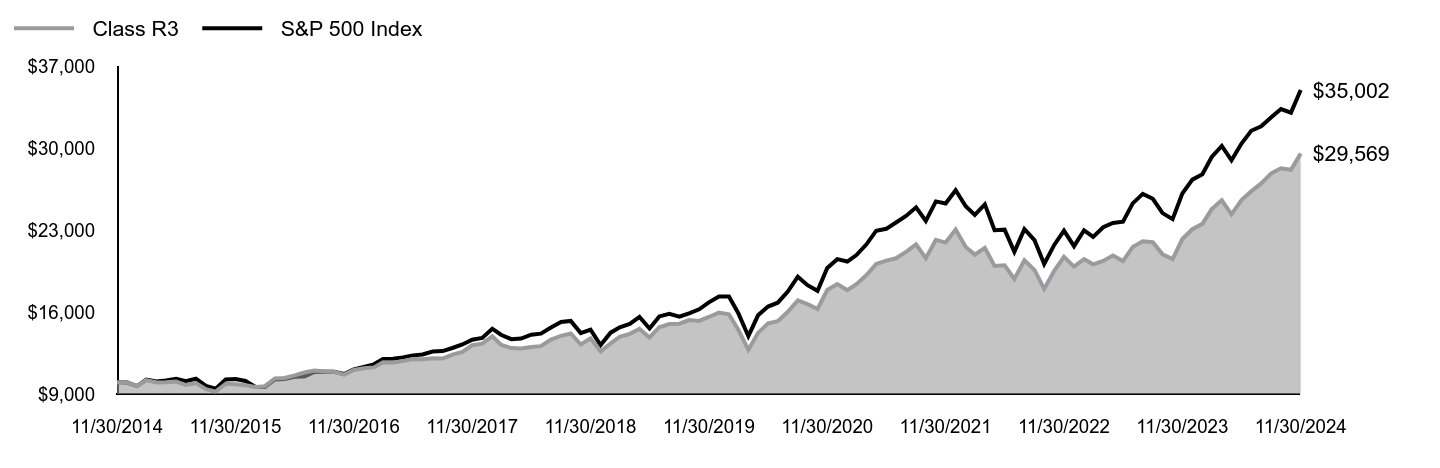
| Class R3 | S&P 500 Index |
|---|
| 11/30/2014 | $10,000 | $10,000 |
|---|
| 12/31/2014 | $10,010 | $9,975 |
|---|
| 1/31/2015 | $9,685 | $9,675 |
|---|
| 2/28/2015 | $10,187 | $10,231 |
|---|
| 3/31/2015 | $9,993 | $10,070 |
|---|
| 4/30/2015 | $10,000 | $10,166 |
|---|
| 5/31/2015 | $10,061 | $10,297 |
|---|
| 6/30/2015 | $9,766 | $10,098 |
|---|
| 7/31/2015 | $9,930 | $10,309 |
|---|
| 8/31/2015 | $9,411 | $9,687 |
|---|
| 9/30/2015 | $9,206 | $9,448 |
|---|
| 10/31/2015 | $9,884 | $10,244 |
|---|
| 11/30/2015 | $9,843 | $10,275 |
|---|
| 12/31/2015 | $9,748 | $10,113 |
|---|
| 1/31/2016 | $9,593 | $9,611 |
|---|
| 2/29/2016 | $9,674 | $9,598 |
|---|
| 3/31/2016 | $10,336 | $10,249 |
|---|
| 4/30/2016 | $10,374 | $10,289 |
|---|
| 5/31/2016 | $10,589 | $10,474 |
|---|
| 6/30/2016 | $10,837 | $10,501 |
|---|
| 7/31/2016 | $11,002 | $10,888 |
|---|
| 8/31/2016 | $10,949 | $10,903 |
|---|
| 9/30/2016 | $10,906 | $10,905 |
|---|
| 10/31/2016 | $10,659 | $10,706 |
|---|
| 11/30/2016 | $11,056 | $11,103 |
|---|
| 12/31/2016 | $11,204 | $11,322 |
|---|
| 1/31/2017 | $11,277 | $11,537 |
|---|
| 2/28/2017 | $11,719 | $11,995 |
|---|
| 3/31/2017 | $11,689 | $12,009 |
|---|
| 4/30/2017 | $11,810 | $12,132 |
|---|
| 5/31/2017 | $11,995 | $12,303 |
|---|
| 6/30/2017 | $11,971 | $12,380 |
|---|
| 7/31/2017 | $12,052 | $12,635 |
|---|
| 8/31/2017 | $12,036 | $12,673 |
|---|
| 9/30/2017 | $12,370 | $12,935 |
|---|
| 10/31/2017 | $12,597 | $13,237 |
|---|
| 11/30/2017 | $13,167 | $13,642 |
|---|
| 12/31/2017 | $13,305 | $13,794 |
|---|
| 1/31/2018 | $13,931 | $14,584 |
|---|
| 2/28/2018 | $13,192 | $14,046 |
|---|
| 3/31/2018 | $12,929 | $13,689 |
|---|
| 4/30/2018 | $12,885 | $13,742 |
|---|
| 5/31/2018 | $13,024 | $14,073 |
|---|
| 6/30/2018 | $13,091 | $14,160 |
|---|
| 7/31/2018 | $13,659 | $14,686 |
|---|
| 8/31/2018 | $13,974 | $15,165 |
|---|
| 9/30/2018 | $14,178 | $15,251 |
|---|
| 10/31/2018 | $13,230 | $14,209 |
|---|
| 11/30/2018 | $13,757 | $14,498 |
|---|
| 12/31/2018 | $12,648 | $13,189 |
|---|
| 1/31/2019 | $13,321 | $14,246 |
|---|
| 2/28/2019 | $13,889 | $14,704 |
|---|
| 3/31/2019 | $14,147 | $14,989 |
|---|
| 4/30/2019 | $14,565 | $15,596 |
|---|
| 5/31/2019 | $13,823 | $14,605 |
|---|
| 6/30/2019 | $14,709 | $15,635 |
|---|
| 7/31/2019 | $14,986 | $15,859 |
|---|
| 8/31/2019 | $15,014 | $15,608 |
|---|
| 9/30/2019 | $15,319 | $15,900 |
|---|
| 10/31/2019 | $15,252 | $16,245 |
|---|
| 11/30/2019 | $15,587 | $16,834 |
|---|
| 12/31/2019 | $15,968 | $17,342 |
|---|
| 1/31/2020 | $15,818 | $17,335 |
|---|
| 2/29/2020 | $14,495 | $15,908 |
|---|
| 3/31/2020 | $12,788 | $13,944 |
|---|
| 4/30/2020 | $14,226 | $15,731 |
|---|
| 5/31/2020 | $15,051 | $16,480 |
|---|
| 6/30/2020 | $15,233 | $16,808 |
|---|
| 7/31/2020 | $16,030 | $17,756 |
|---|
| 8/31/2020 | $17,007 | $19,032 |
|---|
| 9/30/2020 | $16,684 | $18,309 |
|---|
| 10/31/2020 | $16,270 | $17,822 |
|---|
| 11/30/2020 | $17,896 | $19,773 |
|---|
| 12/31/2020 | $18,407 | $20,533 |
|---|
| 1/31/2021 | $17,879 | $20,326 |
|---|
| 2/28/2021 | $18,397 | $20,886 |
|---|
| 3/31/2021 | $19,173 | $21,801 |
|---|
| 4/30/2021 | $20,117 | $22,964 |
|---|
| 5/31/2021 | $20,407 | $23,125 |
|---|
| 6/30/2021 | $20,607 | $23,665 |
|---|
| 7/31/2021 | $21,157 | $24,227 |
|---|
| 8/31/2021 | $21,801 | $24,963 |
|---|
| 9/30/2021 | $20,609 | $23,802 |
|---|
| 10/31/2021 | $22,179 | $25,470 |
|---|
| 11/30/2021 | $21,950 | $25,294 |
|---|
| 12/31/2021 | $23,066 | $26,427 |
|---|
| 1/31/2022 | $21,577 | $25,060 |
|---|
| 2/28/2022 | $20,917 | $24,309 |
|---|
| 3/31/2022 | $21,502 | $25,212 |
|---|
| 4/30/2022 | $19,945 | $23,013 |
|---|
| 5/31/2022 | $20,001 | $23,056 |
|---|
| 6/30/2022 | $18,834 | $21,152 |
|---|
| 7/31/2022 | $20,430 | $23,103 |
|---|
| 8/31/2022 | $19,610 | $22,161 |
|---|
| 9/30/2022 | $17,991 | $20,120 |
|---|
| 10/31/2022 | $19,532 | $21,749 |
|---|
| 11/30/2022 | $20,736 | $22,964 |
|---|
| 12/31/2022 | $19,897 | $21,641 |
|---|
| 1/31/2023 | $20,524 | $23,001 |
|---|
| 2/28/2023 | $20,087 | $22,440 |
|---|
| 3/31/2023 | $20,379 | $23,263 |
|---|
| 4/30/2023 | $20,841 | $23,626 |
|---|
| 5/31/2023 | $20,367 | $23,729 |
|---|
| 6/30/2023 | $21,569 | $25,297 |
|---|
| 7/31/2023 | $22,056 | $26,110 |
|---|
| 8/31/2023 | $21,985 | $25,694 |
|---|
| 9/30/2023 | $20,947 | $24,469 |
|---|
| 10/31/2023 | $20,543 | $23,955 |
|---|
| 11/30/2023 | $22,254 | $26,142 |
|---|
| 12/31/2023 | $23,092 | $27,330 |
|---|
| 1/31/2024 | $23,547 | $27,789 |
|---|
| 2/29/2024 | $24,815 | $29,273 |
|---|
| 3/31/2024 | $25,566 | $30,215 |
|---|
| 4/30/2024 | $24,367 | $28,981 |
|---|
| 5/31/2024 | $25,590 | $30,418 |
|---|
| 6/30/2024 | $26,325 | $31,509 |
|---|
| 7/31/2024 | $27,009 | $31,893 |
|---|
| 8/31/2024 | $27,861 | $32,666 |
|---|
| 9/30/2024 | $28,296 | $33,364 |
|---|
| 10/31/2024 | $28,176 | $33,061 |
|---|
| 11/30/2024 | $29,569 | $35,002 |
|---|
The Fund’s benchmarks are unmanaged indices used as a general measure of market performance. Calculations assume the reinvestment of dividends and capital gains.
Average Annual Total Returns (%)
| AATR | 1 Year | 5 Years | 10 Years |
|---|
| Class R3 at NAV | 32.87% | 13.66% | 11.45% |
|---|
S&P 500 IndexFootnote Reference* | 33.89% | 15.77% | 13.35% |
|---|
| Footnote | Description |
Footnote* | The Fund has adopted the S&P 500 Index as its broad-based securities market index. |
The Fund's past performance is no guarantee of future results. The returns do not reflect the deduction of taxes that a shareholder would pay on Fund distributions or redemption of Fund shares.
(as of November 30, 2024)
| Total Net Assets | $4,417,827,505 |
|---|
| # of Portfolio Holdings | 56 |
|---|
| Portfolio Turnover Rate | 25% |
|---|
| Total Advisory Fees Paid | $20,526,637 |
|---|
What did the Fund invest in?
(as of November 30, 2024)
Portfolio Holdings Presented by SectorFootnote Reference* | % Footnote Reference** |
|---|
| Consumer Discretionary | 6.44% |
| Consumer Staples | 8.58% |
| Energy | 3.57% |
| Financials | 19.87% |
| Health Care | 12.51% |
| Industrials | 9.64% |
| Information Technology | 28.45% |
| Materials | 5.78% |
| Utilities | 3.62% |
| Repurchase Agreements | 1.54% |
| Total | 100.00% |
| Footnote | Description |
Footnote* | A sector may comprise several industries. |
Footnote** | Represents percent of total investments, which excludes derivatives. |
There were no material fund changes during the period.
Where can I find additional information about the Fund?
For additional information about the Fund, including its Prospectus, Statement of Additional Information, financial statements, holdings and proxy information, please visit lordabbett.com/FundDocuments.
The Fund has adopted a policy that allows it to send only one copy of the Fund's prospectus, proxy material, annual report and semiannual report (or related notice of internet availability of annual report and semiannual report) to certain shareholders residing at the same "household." This reduces Fund expenses, which benefits you and other shareholders.If you need additional copies or do not want your mailings to be "householded," please call Lord Abbett at 888-522-2388.
Lord Abbett Dividend Growth Fund
Annual Shareholder Report
November 30, 2024
lordabbett.com/FundDocuments
TSR-A-2064-R3
01/25
Lord Abbett Dividend Growth Fund
Annual Shareholder Report
November 30, 2024
lordabbett.com/FundDocuments
This annual shareholder report contains important information about the Lord Abbett Dividend Growth Fund for the period of December 1, 2023 to November 30, 2024, as well as certain changes to the Fund. You can find additional information about the Fund at lordabbett.com/FundDocuments. You can also request this information by contacting us at 888-522-2388.
What were the Fund costs for the last year?
(based on a hypothetical $10,000 investment)
| Class Name | Costs of a $10,000 investment | Costs paid as a percentage of a $10,000 investment |
|---|
| Class R4 | $104 | 0.89% |
|---|
How did the Fund perform last year and what affected its performance?
For the fiscal year ended November 30, 2024, the Fund returned 33.21%, reflecting performance at the net asset value (NAV) of Class R4 shares, with all distributions reinvested, compared to its benchmark and broad-based securities market index, S&P 500 Index, which returned 33.89% over the same period.
Positive factors for the markets included momentum around the soft-landing narrative, which was supported by signs of a cooling labor market and a slowing economy. This led to the U.S. Federal Reserve lowering its policy rate by 50 basis points in September and an additional 25 basis points in November. There were also increased expectations in the market for further rate cuts in 2024. Mixed economic data, including softer consumer price index reports and fluctuating job market indicators, contributed to these rate cut expectations, and also sparked recession fears. However, these factors were mostly balanced by strong consumer spending and retail sales.
Top contributors to performance: Security selection within the Consumer Staples sector contributed to relative performance, led by an overweight allocation to Walmart Inc. Security selection within the Information Technology sector also contributed to relative performance, led by an overweight allocation to Nvidia Corporation.
Top detractors from performance: Security selection within the Consumer Discretionary sector detracted from relative performance, led by an overweight allocation to McDonald’s Corporation. Security selection within the Communication Services sector also detracted from relative performance, led by an overweight allocation to Comcast Corporation.
Total Return Based on $10,000 Investment
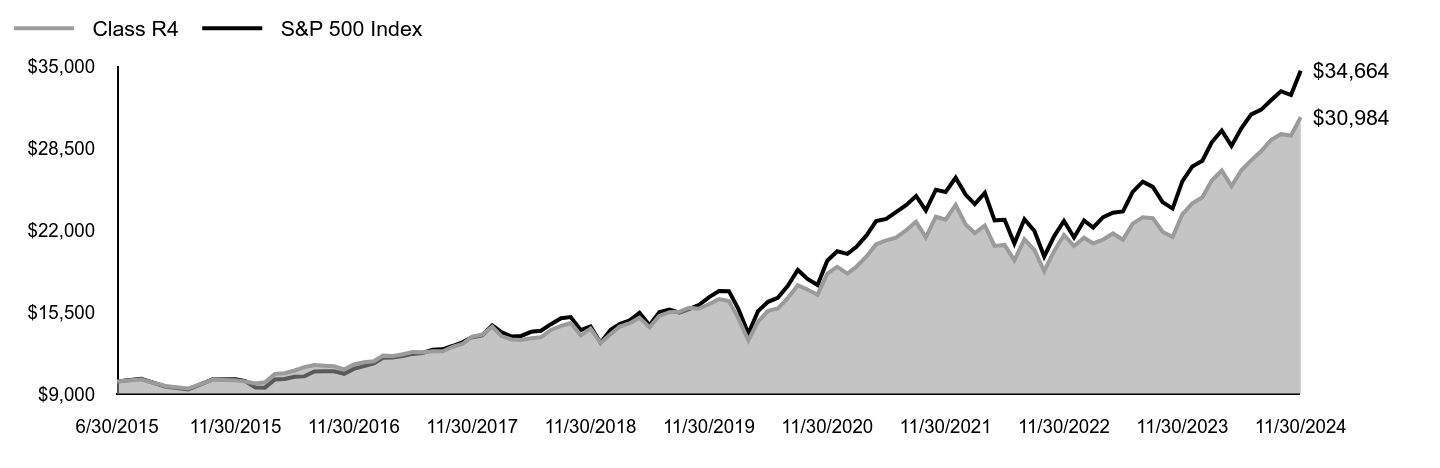
| Class R4 | S&P 500 Index |
|---|
| 6/30/2015 | $10,000 | $10,000 |
|---|
| 7/31/2015 | $10,174 | $10,210 |
|---|
| 8/31/2015 | $9,638 | $9,594 |
|---|
| 9/30/2015 | $9,434 | $9,356 |
|---|
| 10/31/2015 | $10,127 | $10,145 |
|---|
| 11/30/2015 | $10,085 | $10,176 |
|---|
| 12/31/2015 | $9,994 | $10,015 |
|---|
| 1/31/2016 | $9,835 | $9,518 |
|---|
| 2/29/2016 | $9,926 | $9,505 |
|---|
| 3/31/2016 | $10,600 | $10,150 |
|---|
| 4/30/2016 | $10,645 | $10,189 |
|---|
| 5/31/2016 | $10,866 | $10,372 |
|---|
| 6/30/2016 | $11,130 | $10,399 |
|---|
| 7/31/2016 | $11,298 | $10,783 |
|---|
| 8/31/2016 | $11,245 | $10,798 |
|---|
| 9/30/2016 | $11,210 | $10,800 |
|---|
| 10/31/2016 | $10,949 | $10,603 |
|---|
| 11/30/2016 | $11,356 | $10,996 |
|---|
| 12/31/2016 | $11,514 | $11,213 |
|---|
| 1/31/2017 | $11,596 | $11,426 |
|---|
| 2/28/2017 | $12,049 | $11,879 |
|---|
| 3/31/2017 | $12,018 | $11,893 |
|---|
| 4/30/2017 | $12,151 | $12,015 |
|---|
| 5/31/2017 | $12,341 | $12,184 |
|---|
| 6/30/2017 | $12,319 | $12,260 |
|---|
| 7/31/2017 | $12,402 | $12,512 |
|---|
| 8/31/2017 | $12,394 | $12,551 |
|---|
| 9/30/2017 | $12,735 | $12,810 |
|---|
| 10/31/2017 | $12,969 | $13,109 |
|---|
| 11/30/2017 | $13,561 | $13,511 |
|---|
| 12/31/2017 | $13,713 | $13,661 |
|---|
| 1/31/2018 | $14,346 | $14,443 |
|---|
| 2/28/2018 | $13,597 | $13,911 |
|---|
| 3/31/2018 | $13,328 | $13,557 |
|---|
| 4/30/2018 | $13,283 | $13,609 |
|---|
| 5/31/2018 | $13,426 | $13,937 |
|---|
| 6/30/2018 | $13,503 | $14,023 |
|---|
| 7/31/2018 | $14,087 | $14,544 |
|---|
| 8/31/2018 | $14,411 | $15,018 |
|---|
| 9/30/2018 | $14,630 | $15,104 |
|---|
| 10/31/2018 | $13,655 | $14,072 |
|---|
| 11/30/2018 | $14,205 | $14,358 |
|---|
| 12/31/2018 | $13,055 | $13,062 |
|---|
| 1/31/2019 | $13,757 | $14,109 |
|---|
| 2/28/2019 | $14,351 | $14,562 |
|---|
| 3/31/2019 | $14,616 | $14,845 |
|---|
| 4/30/2019 | $15,056 | $15,446 |
|---|
| 5/31/2019 | $14,293 | $14,464 |
|---|
| 6/30/2019 | $15,205 | $15,483 |
|---|
| 7/31/2019 | $15,500 | $15,706 |
|---|
| 8/31/2019 | $15,529 | $15,457 |
|---|
| 9/30/2019 | $15,852 | $15,746 |
|---|
| 10/31/2019 | $15,774 | $16,087 |
|---|
| 11/30/2019 | $16,129 | $16,671 |
|---|
| 12/31/2019 | $16,531 | $17,175 |
|---|
| 1/31/2020 | $16,376 | $17,168 |
|---|
| 2/29/2020 | $15,002 | $15,755 |
|---|
| 3/31/2020 | $13,253 | $13,809 |
|---|
| 4/30/2020 | $14,747 | $15,579 |
|---|
| 5/31/2020 | $15,597 | $16,321 |
|---|
| 6/30/2020 | $15,785 | $16,645 |
|---|
| 7/31/2020 | $16,617 | $17,584 |
|---|
| 8/31/2020 | $17,637 | $18,848 |
|---|
| 9/30/2020 | $17,302 | $18,132 |
|---|
| 10/31/2020 | $16,875 | $17,650 |
|---|
| 11/30/2020 | $18,564 | $19,582 |
|---|
| 12/31/2020 | $19,092 | $20,335 |
|---|
| 1/31/2021 | $18,557 | $20,129 |
|---|
| 2/28/2021 | $19,103 | $20,684 |
|---|
| 3/31/2021 | $19,919 | $21,590 |
|---|
| 4/30/2021 | $20,894 | $22,742 |
|---|
| 5/31/2021 | $21,205 | $22,901 |
|---|
| 6/30/2021 | $21,414 | $23,436 |
|---|
| 7/31/2021 | $21,994 | $23,993 |
|---|
| 8/31/2021 | $22,670 | $24,722 |
|---|
| 9/30/2021 | $21,439 | $23,572 |
|---|
| 10/31/2021 | $23,075 | $25,224 |
|---|
| 11/30/2021 | $22,838 | $25,049 |
|---|
| 12/31/2021 | $24,018 | $26,172 |
|---|
| 1/31/2022 | $22,454 | $24,817 |
|---|
| 2/28/2022 | $21,771 | $24,074 |
|---|
| 3/31/2022 | $22,380 | $24,968 |
|---|
| 4/30/2022 | $20,755 | $22,791 |
|---|
| 5/31/2022 | $20,836 | $22,833 |
|---|
| 6/30/2022 | $19,618 | $20,948 |
|---|
| 7/31/2022 | $21,283 | $22,879 |
|---|
| 8/31/2022 | $20,433 | $21,946 |
|---|
| 9/30/2022 | $18,756 | $19,925 |
|---|
| 10/31/2022 | $20,367 | $21,538 |
|---|
| 11/30/2022 | $21,627 | $22,742 |
|---|
| 12/31/2022 | $20,746 | $21,432 |
|---|
| 1/31/2023 | $21,409 | $22,778 |
|---|
| 2/28/2023 | $20,955 | $22,223 |
|---|
| 3/31/2023 | $21,269 | $23,038 |
|---|
| 4/30/2023 | $21,748 | $23,398 |
|---|
| 5/31/2023 | $21,256 | $23,500 |
|---|
| 6/30/2023 | $22,531 | $25,053 |
|---|
| 7/31/2023 | $23,037 | $25,857 |
|---|
| 8/31/2023 | $22,963 | $25,446 |
|---|
| 9/30/2023 | $21,888 | $24,232 |
|---|
| 10/31/2023 | $21,468 | $23,723 |
|---|
| 11/30/2023 | $23,260 | $25,889 |
|---|
| 12/31/2023 | $24,145 | $27,066 |
|---|
| 1/31/2024 | $24,618 | $27,520 |
|---|
| 2/29/2024 | $25,950 | $28,990 |
|---|
| 3/31/2024 | $26,746 | $29,923 |
|---|
| 4/30/2024 | $25,498 | $28,700 |
|---|
| 5/31/2024 | $26,783 | $30,124 |
|---|
| 6/30/2024 | $27,554 | $31,204 |
|---|
| 7/31/2024 | $28,291 | $31,584 |
|---|
| 8/31/2024 | $29,191 | $32,350 |
|---|
| 9/30/2024 | $29,632 | $33,041 |
|---|
| 10/31/2024 | $29,520 | $32,742 |
|---|
| 11/30/2024 | $30,984 | $34,664 |
|---|
The Fund’s benchmarks are unmanaged indices used as a general measure of market performance. Calculations assume the reinvestment of dividends and capital gains.
Average Annual Total Returns (%)
| AATR | 1 Year | 5 Years | Since Inception 6/30/15 |
|---|
| Class R4 at NAV | 33.21% | 13.95% | 12.76% |
|---|
S&P 500 IndexFootnote Reference* | 33.89% | 15.77% | 14.11% |
|---|
| Footnote | Description |
Footnote* | The Fund has adopted the S&P 500 Index as its broad-based securities market index. |
The Fund's past performance is no guarantee of future results. The returns do not reflect the deduction of taxes that a shareholder would pay on Fund distributions or redemption of Fund shares.
(as of November 30, 2024)
| Total Net Assets | $4,417,827,505 |
|---|
| # of Portfolio Holdings | 56 |
|---|
| Portfolio Turnover Rate | 25% |
|---|
| Total Advisory Fees Paid | $20,526,637 |
|---|
What did the Fund invest in?
(as of November 30, 2024)
Portfolio Holdings Presented by SectorFootnote Reference* | % Footnote Reference** |
|---|
| Consumer Discretionary | 6.44% |
| Consumer Staples | 8.58% |
| Energy | 3.57% |
| Financials | 19.87% |
| Health Care | 12.51% |
| Industrials | 9.64% |
| Information Technology | 28.45% |
| Materials | 5.78% |
| Utilities | 3.62% |
| Repurchase Agreements | 1.54% |
| Total | 100.00% |
| Footnote | Description |
Footnote* | A sector may comprise several industries. |
Footnote** | Represents percent of total investments, which excludes derivatives. |
There were no material fund changes during the period.
Where can I find additional information about the Fund?
For additional information about the Fund, including its Prospectus, Statement of Additional Information, financial statements, holdings and proxy information, please visit lordabbett.com/FundDocuments.
The Fund has adopted a policy that allows it to send only one copy of the Fund's prospectus, proxy material, annual report and semiannual report (or related notice of internet availability of annual report and semiannual report) to certain shareholders residing at the same "household." This reduces Fund expenses, which benefits you and other shareholders.If you need additional copies or do not want your mailings to be "householded," please call Lord Abbett at 888-522-2388.
Lord Abbett Dividend Growth Fund
Annual Shareholder Report
November 30, 2024
lordabbett.com/FundDocuments
TSR-A-8715-R4
01/25
Lord Abbett Dividend Growth Fund
Annual Shareholder Report
November 30, 2024
lordabbett.com/FundDocuments
This annual shareholder report contains important information about the Lord Abbett Dividend Growth Fund for the period of December 1, 2023 to November 30, 2024, as well as certain changes to the Fund. You can find additional information about the Fund at lordabbett.com/FundDocuments. You can also request this information by contacting us at 888-522-2388.
What were the Fund costs for the last year?
(based on a hypothetical $10,000 investment)
| Class Name | Costs of a $10,000 investment | Costs paid as a percentage of a $10,000 investment |
|---|
| Class R5 | $75 | 0.64% |
|---|
How did the Fund perform last year and what affected its performance?
For the fiscal year ended November 30, 2024, the Fund returned 33.54%, reflecting performance at the net asset value (NAV) of Class R5 shares, with all distributions reinvested, compared to its benchmark and broad-based securities market index, S&P 500 Index, which returned 33.89% over the same period.
Positive factors for the markets included momentum around the soft-landing narrative, which was supported by signs of a cooling labor market and a slowing economy. This led to the U.S. Federal Reserve lowering its policy rate by 50 basis points in September and an additional 25 basis points in November. There were also increased expectations in the market for further rate cuts in 2024. Mixed economic data, including softer consumer price index reports and fluctuating job market indicators, contributed to these rate cut expectations, and also sparked recession fears. However, these factors were mostly balanced by strong consumer spending and retail sales.
Top contributors to performance: Security selection within the Consumer Staples sector contributed to relative performance, led by an overweight allocation to Walmart Inc. Security selection within the Information Technology sector also contributed to relative performance, led by an overweight allocation to Nvidia Corporation.
Top detractors from performance: Security selection within the Consumer Discretionary sector detracted from relative performance, led by an overweight allocation to McDonald’s Corporation. Security selection within the Communication Services sector also detracted from relative performance, led by an overweight allocation to Comcast Corporation.
Total Return Based on $10,000 Investment

| Class R5 | S&P 500 Index |
|---|
| 6/30/2015 | $10,000 | $10,000 |
|---|
| 7/31/2015 | $10,173 | $10,210 |
|---|
| 8/31/2015 | $9,640 | $9,594 |
|---|
| 9/30/2015 | $9,437 | $9,356 |
|---|
| 10/31/2015 | $10,133 | $10,145 |
|---|
| 11/30/2015 | $10,098 | $10,176 |
|---|
| 12/31/2015 | $10,006 | $10,015 |
|---|
| 1/31/2016 | $9,848 | $9,518 |
|---|
| 2/29/2016 | $9,939 | $9,505 |
|---|
| 3/31/2016 | $10,623 | $10,150 |
|---|
| 4/30/2016 | $10,668 | $10,189 |
|---|
| 5/31/2016 | $10,887 | $10,372 |
|---|
| 6/30/2016 | $11,153 | $10,399 |
|---|
| 7/31/2016 | $11,320 | $10,783 |
|---|
| 8/31/2016 | $11,274 | $10,798 |
|---|
| 9/30/2016 | $11,236 | $10,800 |
|---|
| 10/31/2016 | $10,984 | $10,603 |
|---|
| 11/30/2016 | $11,396 | $10,996 |
|---|
| 12/31/2016 | $11,553 | $11,213 |
|---|
| 1/31/2017 | $11,635 | $11,426 |
|---|
| 2/28/2017 | $12,094 | $11,879 |
|---|
| 3/31/2017 | $12,069 | $11,893 |
|---|
| 4/30/2017 | $12,201 | $12,015 |
|---|
| 5/31/2017 | $12,399 | $12,184 |
|---|
| 6/30/2017 | $12,380 | $12,260 |
|---|
| 7/31/2017 | $12,463 | $12,512 |
|---|
| 8/31/2017 | $12,454 | $12,551 |
|---|
| 9/30/2017 | $12,802 | $12,810 |
|---|
| 10/31/2017 | $13,044 | $13,109 |
|---|
| 11/30/2017 | $13,643 | $13,511 |
|---|
| 12/31/2017 | $13,791 | $13,661 |
|---|
| 1/31/2018 | $14,439 | $14,443 |
|---|
| 2/28/2018 | $13,684 | $13,911 |
|---|
| 3/31/2018 | $13,415 | $13,557 |
|---|
| 4/30/2018 | $13,370 | $13,609 |
|---|
| 5/31/2018 | $13,522 | $13,937 |
|---|
| 6/30/2018 | $13,598 | $14,023 |
|---|
| 7/31/2018 | $14,199 | $14,544 |
|---|
| 8/31/2018 | $14,531 | $15,018 |
|---|
| 9/30/2018 | $14,748 | $15,104 |
|---|
| 10/31/2018 | $13,766 | $14,072 |
|---|
| 11/30/2018 | $14,325 | $14,358 |
|---|
| 12/31/2018 | $13,167 | $13,062 |
|---|
| 1/31/2019 | $13,877 | $14,109 |
|---|
| 2/28/2019 | $14,480 | $14,562 |
|---|
| 3/31/2019 | $14,752 | $14,845 |
|---|
| 4/30/2019 | $15,192 | $15,446 |
|---|
| 5/31/2019 | $14,430 | $14,464 |
|---|
| 6/30/2019 | $15,349 | $15,483 |
|---|
| 7/31/2019 | $15,653 | $15,706 |
|---|
| 8/31/2019 | $15,693 | $15,457 |
|---|
| 9/30/2019 | $16,016 | $15,746 |
|---|
| 10/31/2019 | $15,947 | $16,087 |
|---|
| 11/30/2019 | $16,311 | $16,671 |
|---|
| 12/31/2019 | $16,713 | $17,175 |
|---|
| 1/31/2020 | $16,558 | $17,168 |
|---|
| 2/29/2020 | $15,184 | $15,755 |
|---|
| 3/31/2020 | $13,406 | $13,809 |
|---|
| 4/30/2020 | $14,920 | $15,579 |
|---|
| 5/31/2020 | $15,782 | $16,321 |
|---|
| 6/30/2020 | $15,989 | $16,645 |
|---|
| 7/31/2020 | $16,823 | $17,584 |
|---|
| 8/31/2020 | $17,864 | $18,848 |
|---|
| 9/30/2020 | $17,522 | $18,132 |
|---|
| 10/31/2020 | $17,104 | $17,650 |
|---|
| 11/30/2020 | $18,817 | $19,582 |
|---|
| 12/31/2020 | $19,358 | $20,335 |
|---|
| 1/31/2021 | $18,811 | $20,129 |
|---|
| 2/28/2021 | $19,369 | $20,684 |
|---|
| 3/31/2021 | $20,198 | $21,590 |
|---|
| 4/30/2021 | $21,198 | $22,742 |
|---|
| 5/31/2021 | $21,520 | $22,901 |
|---|
| 6/30/2021 | $21,731 | $23,436 |
|---|
| 7/31/2021 | $22,324 | $23,993 |
|---|
| 8/31/2021 | $23,024 | $24,722 |
|---|
| 9/30/2021 | $21,772 | $23,572 |
|---|
| 10/31/2021 | $23,436 | $25,224 |
|---|
| 11/30/2021 | $23,209 | $25,049 |
|---|
| 12/31/2021 | $24,408 | $26,172 |
|---|
| 1/31/2022 | $22,827 | $24,817 |
|---|
| 2/28/2022 | $22,140 | $24,074 |
|---|
| 3/31/2022 | $22,765 | $24,968 |
|---|
| 4/30/2022 | $21,110 | $22,791 |
|---|
| 5/31/2022 | $21,192 | $22,833 |
|---|
| 6/30/2022 | $19,958 | $20,948 |
|---|
| 7/31/2022 | $21,667 | $22,879 |
|---|
| 8/31/2022 | $20,800 | $21,946 |
|---|
| 9/30/2022 | $19,093 | $19,925 |
|---|
| 10/31/2022 | $20,748 | $21,538 |
|---|
| 11/30/2022 | $22,027 | $22,742 |
|---|
| 12/31/2022 | $21,141 | $21,432 |
|---|
| 1/31/2023 | $21,820 | $22,778 |
|---|
| 2/28/2023 | $21,363 | $22,223 |
|---|
| 3/31/2023 | $21,692 | $23,038 |
|---|
| 4/30/2023 | $22,187 | $23,398 |
|---|
| 5/31/2023 | $21,680 | $23,500 |
|---|
| 6/30/2023 | $22,988 | $25,053 |
|---|
| 7/31/2023 | $23,509 | $25,857 |
|---|
| 8/31/2023 | $23,447 | $25,446 |
|---|
| 9/30/2023 | $22,340 | $24,232 |
|---|
| 10/31/2023 | $21,929 | $23,723 |
|---|
| 11/30/2023 | $23,758 | $25,889 |
|---|
| 12/31/2023 | $24,663 | $27,066 |
|---|
| 1/31/2024 | $25,152 | $27,520 |
|---|
| 2/29/2024 | $26,520 | $28,990 |
|---|
| 3/31/2024 | $27,337 | $29,923 |
|---|
| 4/30/2024 | $26,067 | $28,700 |
|---|
| 5/31/2024 | $27,387 | $30,124 |
|---|
| 6/30/2024 | $28,181 | $31,204 |
|---|
| 7/31/2024 | $28,937 | $31,584 |
|---|
| 8/31/2024 | $29,857 | $32,350 |
|---|
| 9/30/2024 | $30,323 | $33,041 |
|---|
| 10/31/2024 | $30,222 | $32,742 |
|---|
| 11/30/2024 | $31,725 | $34,664 |
|---|
The Fund’s benchmarks are unmanaged indices used as a general measure of market performance. Calculations assume the reinvestment of dividends and capital gains.
Average Annual Total Returns (%)
| AATR | 1 Year | 5 Years | Since Inception 6/30/15 |
|---|
| Class R5 at NAV | 33.54% | 14.23% | 13.04% |
|---|
S&P 500 IndexFootnote Reference* | 33.89% | 15.77% | 14.11% |
|---|
| Footnote | Description |
Footnote* | The Fund has adopted the S&P 500 Index as its broad-based securities market index. |
The Fund's past performance is no guarantee of future results. The returns do not reflect the deduction of taxes that a shareholder would pay on Fund distributions or redemption of Fund shares.
(as of November 30, 2024)
| Total Net Assets | $4,417,827,505 |
|---|
| # of Portfolio Holdings | 56 |
|---|
| Portfolio Turnover Rate | 25% |
|---|
| Total Advisory Fees Paid | $20,526,637 |
|---|
What did the Fund invest in?
(as of November 30, 2024)
Portfolio Holdings Presented by SectorFootnote Reference* | % Footnote Reference** |
|---|
| Consumer Discretionary | 6.44% |
| Consumer Staples | 8.58% |
| Energy | 3.57% |
| Financials | 19.87% |
| Health Care | 12.51% |
| Industrials | 9.64% |
| Information Technology | 28.45% |
| Materials | 5.78% |
| Utilities | 3.62% |
| Repurchase Agreements | 1.54% |
| Total | 100.00% |
| Footnote | Description |
Footnote* | A sector may comprise several industries. |
Footnote** | Represents percent of total investments, which excludes derivatives. |
There were no material fund changes during the period.
Where can I find additional information about the Fund?
For additional information about the Fund, including its Prospectus, Statement of Additional Information, financial statements, holdings and proxy information, please visit lordabbett.com/FundDocuments.
The Fund has adopted a policy that allows it to send only one copy of the Fund's prospectus, proxy material, annual report and semiannual report (or related notice of internet availability of annual report and semiannual report) to certain shareholders residing at the same "household." This reduces Fund expenses, which benefits you and other shareholders.If you need additional copies or do not want your mailings to be "householded," please call Lord Abbett at 888-522-2388.
Lord Abbett Dividend Growth Fund
Annual Shareholder Report
November 30, 2024
lordabbett.com/FundDocuments
TSR-A-8747-R5
01/25
Lord Abbett Dividend Growth Fund
Annual Shareholder Report
November 30, 2024
lordabbett.com/FundDocuments
This annual shareholder report contains important information about the Lord Abbett Dividend Growth Fund for the period of December 1, 2023 to November 30, 2024, as well as certain changes to the Fund. You can find additional information about the Fund at lordabbett.com/FundDocuments. You can also request this information by contacting us at 888-522-2388.
What were the Fund costs for the last year?
(based on a hypothetical $10,000 investment)
| Class Name | Costs of a $10,000 investment | Costs paid as a percentage of a $10,000 investment |
|---|
| Class R6 | $69 | 0.59% |
|---|
How did the Fund perform last year and what affected its performance?
For the fiscal year ended November 30, 2024, the Fund returned 33.66%, reflecting performance at the net asset value (NAV) of Class R6 shares, with all distributions reinvested, compared to its benchmark and broad-based securities market index, S&P 500 Index, which returned 33.89% over the same period.
Positive factors for the markets included momentum around the soft-landing narrative, which was supported by signs of a cooling labor market and a slowing economy. This led to the U.S. Federal Reserve lowering its policy rate by 50 basis points in September and an additional 25 basis points in November. There were also increased expectations in the market for further rate cuts in 2024. Mixed economic data, including softer consumer price index reports and fluctuating job market indicators, contributed to these rate cut expectations, and also sparked recession fears. However, these factors were mostly balanced by strong consumer spending and retail sales.
Top contributors to performance: Security selection within the Consumer Staples sector contributed to relative performance, led by an overweight allocation to Walmart Inc. Security selection within the Information Technology sector also contributed to relative performance, led by an overweight allocation to Nvidia Corporation.
Top detractors from performance: Security selection within the Consumer Discretionary sector detracted from relative performance, led by an overweight allocation to McDonald’s Corporation. Security selection within the Communication Services sector also detracted from relative performance, led by an overweight allocation to Comcast Corporation.
Total Return Based on $10,000 Investment
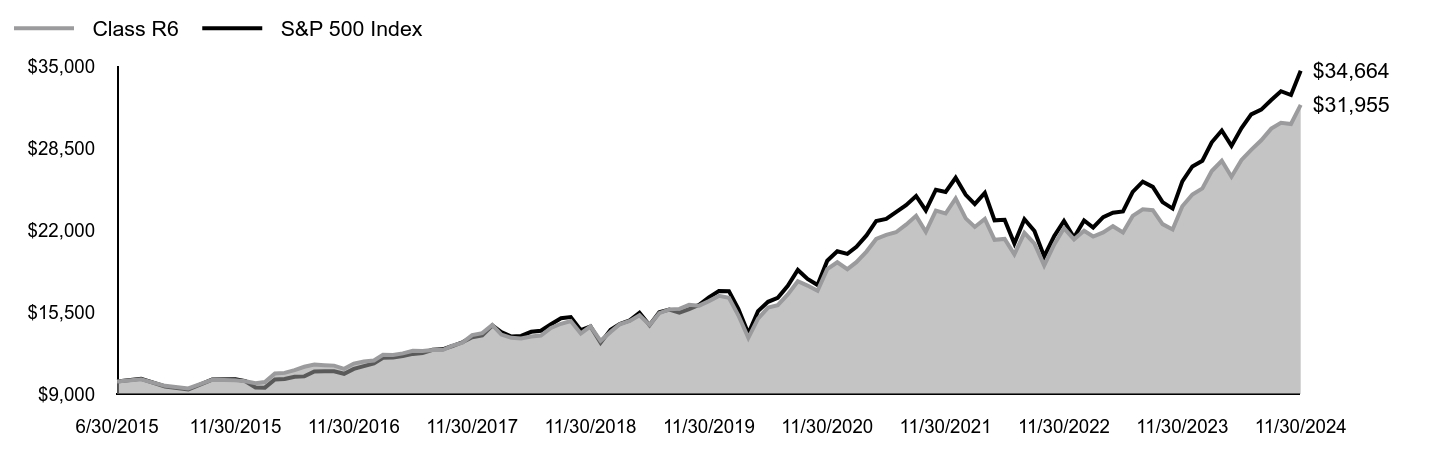
| Class R6 | S&P 500 Index |
|---|
| 6/30/2015 | $10,000 | $10,000 |
|---|
| 7/31/2015 | $10,173 | $10,210 |
|---|
| 8/31/2015 | $9,647 | $9,594 |
|---|
| 9/30/2015 | $9,437 | $9,356 |
|---|
| 10/31/2015 | $10,140 | $10,145 |
|---|
| 11/30/2015 | $10,098 | $10,176 |
|---|
| 12/31/2015 | $10,015 | $10,015 |
|---|
| 1/31/2016 | $9,857 | $9,518 |
|---|
| 2/29/2016 | $9,947 | $9,505 |
|---|
| 3/31/2016 | $10,631 | $10,150 |
|---|
| 4/30/2016 | $10,677 | $10,189 |
|---|
| 5/31/2016 | $10,896 | $10,372 |
|---|
| 6/30/2016 | $11,162 | $10,399 |
|---|
| 7/31/2016 | $11,337 | $10,783 |
|---|
| 8/31/2016 | $11,291 | $10,798 |
|---|
| 9/30/2016 | $11,253 | $10,800 |
|---|
| 10/31/2016 | $11,001 | $10,603 |
|---|
| 11/30/2016 | $11,414 | $10,996 |
|---|
| 12/31/2016 | $11,578 | $11,213 |
|---|
| 1/31/2017 | $11,660 | $11,426 |
|---|
| 2/28/2017 | $12,120 | $11,879 |
|---|
| 3/31/2017 | $12,095 | $11,893 |
|---|
| 4/30/2017 | $12,227 | $12,015 |
|---|
| 5/31/2017 | $12,425 | $12,184 |
|---|
| 6/30/2017 | $12,406 | $12,260 |
|---|
| 7/31/2017 | $12,498 | $12,512 |
|---|
| 8/31/2017 | $12,489 | $12,551 |
|---|
| 9/30/2017 | $12,838 | $12,810 |
|---|
| 10/31/2017 | $13,079 | $13,109 |
|---|
| 11/30/2017 | $13,678 | $13,511 |
|---|
| 12/31/2017 | $13,835 | $13,661 |
|---|
| 1/31/2018 | $14,483 | $14,443 |
|---|
| 2/28/2018 | $13,719 | $13,911 |
|---|
| 3/31/2018 | $13,459 | $13,557 |
|---|
| 4/30/2018 | $13,415 | $13,609 |
|---|
| 5/31/2018 | $13,566 | $13,937 |
|---|
| 6/30/2018 | $13,643 | $14,023 |
|---|
| 7/31/2018 | $14,244 | $14,544 |
|---|
| 8/31/2018 | $14,576 | $15,018 |
|---|
| 9/30/2018 | $14,794 | $15,104 |
|---|
| 10/31/2018 | $13,812 | $14,072 |
|---|
| 11/30/2018 | $14,371 | $14,358 |
|---|
| 12/31/2018 | $13,223 | $13,062 |
|---|
| 1/31/2019 | $13,932 | $14,109 |
|---|
| 2/28/2019 | $14,535 | $14,562 |
|---|
| 3/31/2019 | $14,808 | $14,845 |
|---|
| 4/30/2019 | $15,258 | $15,446 |
|---|
| 5/31/2019 | $14,486 | $14,464 |
|---|
| 6/30/2019 | $15,415 | $15,483 |
|---|
| 7/31/2019 | $15,720 | $15,706 |
|---|
| 8/31/2019 | $15,759 | $15,457 |
|---|
| 9/30/2019 | $16,082 | $15,746 |
|---|
| 10/31/2019 | $16,013 | $16,087 |
|---|
| 11/30/2019 | $16,378 | $16,671 |
|---|
| 12/31/2019 | $16,790 | $17,175 |
|---|
| 1/31/2020 | $16,635 | $17,168 |
|---|
| 2/29/2020 | $15,251 | $15,755 |
|---|
| 3/31/2020 | $13,463 | $13,809 |
|---|
| 4/30/2020 | $14,988 | $15,579 |
|---|
| 5/31/2020 | $15,859 | $16,321 |
|---|
| 6/30/2020 | $16,057 | $16,645 |
|---|
| 7/31/2020 | $16,911 | $17,584 |
|---|
| 8/31/2020 | $17,953 | $18,848 |
|---|
| 9/30/2020 | $17,611 | $18,132 |
|---|
| 10/31/2020 | $17,193 | $17,650 |
|---|
| 11/30/2020 | $18,916 | $19,582 |
|---|
| 12/31/2020 | $19,458 | $20,335 |
|---|
| 1/31/2021 | $18,911 | $20,129 |
|---|
| 2/28/2021 | $19,469 | $20,684 |
|---|
| 3/31/2021 | $20,309 | $21,590 |
|---|
| 4/30/2021 | $21,308 | $22,742 |
|---|
| 5/31/2021 | $21,631 | $22,901 |
|---|
| 6/30/2021 | $21,842 | $23,436 |
|---|
| 7/31/2021 | $22,445 | $23,993 |
|---|
| 8/31/2021 | $23,145 | $24,722 |
|---|
| 9/30/2021 | $21,883 | $23,572 |
|---|
| 10/31/2021 | $23,558 | $25,224 |
|---|
| 11/30/2021 | $23,331 | $25,049 |
|---|
| 12/31/2021 | $24,530 | $26,172 |
|---|
| 1/31/2022 | $22,949 | $24,817 |
|---|
| 2/28/2022 | $22,264 | $24,074 |
|---|
| 3/31/2022 | $22,901 | $24,968 |
|---|
| 4/30/2022 | $21,247 | $22,791 |
|---|
| 5/31/2022 | $21,316 | $22,833 |
|---|
| 6/30/2022 | $20,084 | $20,948 |
|---|
| 7/31/2022 | $21,792 | $22,879 |
|---|
| 8/31/2022 | $20,938 | $21,946 |
|---|
| 9/30/2022 | $19,209 | $19,925 |
|---|
| 10/31/2022 | $20,874 | $21,538 |
|---|
| 11/30/2022 | $22,164 | $22,742 |
|---|
| 12/31/2022 | $21,280 | $21,432 |
|---|
| 1/31/2023 | $21,958 | $22,778 |
|---|
| 2/28/2023 | $21,502 | $22,223 |
|---|
| 3/31/2023 | $21,832 | $23,038 |
|---|
| 4/30/2023 | $22,326 | $23,398 |
|---|
| 5/31/2023 | $21,832 | $23,500 |
|---|
| 6/30/2023 | $23,139 | $25,053 |
|---|
| 7/31/2023 | $23,672 | $25,857 |
|---|
| 8/31/2023 | $23,598 | $25,446 |
|---|
| 9/30/2023 | $22,491 | $24,232 |
|---|
| 10/31/2023 | $22,069 | $23,723 |
|---|
| 11/30/2023 | $23,908 | $25,889 |
|---|
| 12/31/2023 | $24,837 | $27,066 |
|---|
| 1/31/2024 | $25,326 | $27,520 |
|---|
| 2/29/2024 | $26,704 | $28,990 |
|---|
| 3/31/2024 | $27,521 | $29,923 |
|---|
| 4/30/2024 | $26,252 | $28,700 |
|---|
| 5/31/2024 | $27,584 | $30,124 |
|---|
| 6/30/2024 | $28,389 | $31,204 |
|---|
| 7/31/2024 | $29,145 | $31,584 |
|---|
| 8/31/2024 | $30,076 | $32,350 |
|---|
| 9/30/2024 | $30,542 | $33,041 |
|---|
| 10/31/2024 | $30,441 | $32,742 |
|---|
| 11/30/2024 | $31,955 | $34,664 |
|---|
The Fund’s benchmarks are unmanaged indices used as a general measure of market performance. Calculations assume the reinvestment of dividends and capital gains.
Average Annual Total Returns (%)
| AATR | 1 Year | 5 Years | Since Inception 6/30/15 |
|---|
| Class R6 at NAV | 33.66% | 14.30% | 13.13% |
|---|
S&P 500 IndexFootnote Reference* | 33.89% | 15.77% | 14.11% |
|---|
| Footnote | Description |
Footnote* | The Fund has adopted the S&P 500 Index as its broad-based securities market index. |
The Fund's past performance is no guarantee of future results. The returns do not reflect the deduction of taxes that a shareholder would pay on Fund distributions or redemption of Fund shares.
(as of November 30, 2024)
| Total Net Assets | $4,417,827,505 |
|---|
| # of Portfolio Holdings | 56 |
|---|
| Portfolio Turnover Rate | 25% |
|---|
| Total Advisory Fees Paid | $20,526,637 |
|---|
What did the Fund invest in?
(as of November 30, 2024)
Portfolio Holdings Presented by SectorFootnote Reference* | % Footnote Reference** |
|---|
| Consumer Discretionary | 6.44% |
| Consumer Staples | 8.58% |
| Energy | 3.57% |
| Financials | 19.87% |
| Health Care | 12.51% |
| Industrials | 9.64% |
| Information Technology | 28.45% |
| Materials | 5.78% |
| Utilities | 3.62% |
| Repurchase Agreements | 1.54% |
| Total | 100.00% |
| Footnote | Description |
Footnote* | A sector may comprise several industries. |
Footnote** | Represents percent of total investments, which excludes derivatives. |
There were no material fund changes during the period.
Where can I find additional information about the Fund?
For additional information about the Fund, including its Prospectus, Statement of Additional Information, financial statements, holdings and proxy information, please visit lordabbett.com/FundDocuments.
The Fund has adopted a policy that allows it to send only one copy of the Fund's prospectus, proxy material, annual report and semiannual report (or related notice of internet availability of annual report and semiannual report) to certain shareholders residing at the same "household." This reduces Fund expenses, which benefits you and other shareholders.If you need additional copies or do not want your mailings to be "householded," please call Lord Abbett at 888-522-2388.
Lord Abbett Dividend Growth Fund
Annual Shareholder Report
November 30, 2024
lordabbett.com/FundDocuments
TSR-A-8779-R6
01/25
Lord Abbett Growth Opportunities Fund
Annual Shareholder Report
November 30, 2024
lordabbett.com/FundDocuments
This annual shareholder report contains important information about the Lord Abbett Growth Opportunities Fund for the period of December 1, 2023 to November 30, 2024, as well as certain changes to the Fund. You can find additional information about the Fund at lordabbett.com/FundDocuments. You can also request this information by contacting us at 888-522-2388.
What were the Fund costs for the last year?
(based on a hypothetical $10,000 investment)
| Class Name | Costs of a $10,000 investment | Costs paid as a percentage of a $10,000 investment |
|---|
| Class A | $119 | 0.96% |
|---|
How did the Fund perform last year and what affected its performance?
For the fiscal year ended November 30, 2024, the Fund returned 46.97%, reflecting performance at the net asset value (NAV) of Class A shares, with all distributions reinvested, compared to the 40.07% return of a securities market index with investment characteristics similar to those of the Fund, the Russell Mid Cap Growth Index. The Fund's broad-based securities market index, the S&P 500 Index, returned 33.89% over the same period.
Positive factors for the markets included momentum around the soft-landing narrative, which was supported by signs of a cooling labor market and a slowing economy. This led to the U.S. Federal Reserve lowering its policy rate by 50 basis points in September and 25 basis points in November. There were also increased expectations for further rate cuts in 2024. Mixed economic data, including softer consumer price index reports and fluctuating job market indicators, contributed to these rate cut expectations, and also sparked recession fears. However, these factors were mostly balanced by strong consumer spending and retail sales. Against this backdrop, global equity markets delivered strong return.
Top contributors to performance: Security selection within the Health Care sector contributed to relative performance, led by an overweight allocation to Natera, Inc. Security selection within the Industrials sector also contributed to relative performance, led by an overweight allocation to Vertiv Holdings Co.
Top detractors from performance: Security selection within the Financials sector detracted from relative performance, led by an overweight allocation to Coinbase Global, Inc. Within the Communication Services sector, an overweight allocation to Roku, Inc., also detracted from relative performance.
Total Return Based on $10,000 Investment
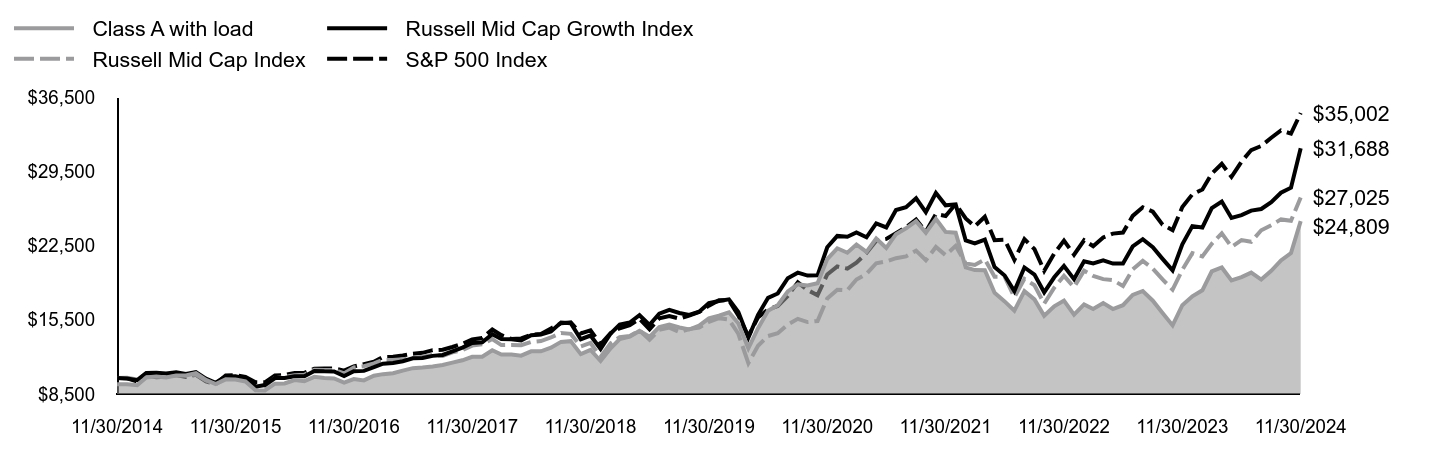
| Class A with load | Russell Mid Cap Growth Index | Russell Mid Cap Index | S&P 500 Index |
|---|
| 11/30/2014 | $9,425 | $10,000 | $10,000 | $10,000 |
|---|
| 12/31/2014 | $9,429 | $9,972 | $10,021 | $9,975 |
|---|
| 1/31/2015 | $9,324 | $9,804 | $9,865 | $9,675 |
|---|
| 2/28/2015 | $10,055 | $10,478 | $10,411 | $10,231 |
|---|
| 3/31/2015 | $10,147 | $10,508 | $10,417 | $10,070 |
|---|
| 4/30/2015 | $10,059 | $10,434 | $10,323 | $10,166 |
|---|
| 5/31/2015 | $10,252 | $10,558 | $10,474 | $10,297 |
|---|
| 6/30/2015 | $10,239 | $10,388 | $10,257 | $10,098 |
|---|
| 7/31/2015 | $10,459 | $10,556 | $10,333 | $10,309 |
|---|
| 8/31/2015 | $9,825 | $9,942 | $9,788 | $9,687 |
|---|
| 9/30/2015 | $9,439 | $9,558 | $9,436 | $9,448 |
|---|
| 10/31/2015 | $9,885 | $10,160 | $10,021 | $10,244 |
|---|
| 11/30/2015 | $9,875 | $10,182 | $10,046 | $10,275 |
|---|
| 12/31/2015 | $9,682 | $9,952 | $9,777 | $10,113 |
|---|
| 1/31/2016 | $8,859 | $9,198 | $9,136 | $9,611 |
|---|
| 2/29/2016 | $8,838 | $9,343 | $9,239 | $9,598 |
|---|
| 3/31/2016 | $9,477 | $10,009 | $9,996 | $10,249 |
|---|
| 4/30/2016 | $9,493 | $10,003 | $10,102 | $10,289 |
|---|
| 5/31/2016 | $9,813 | $10,167 | $10,268 | $10,474 |
|---|
| 6/30/2016 | $9,713 | $10,166 | $10,314 | $10,501 |
|---|
| 7/31/2016 | $10,122 | $10,669 | $10,785 | $10,888 |
|---|
| 8/31/2016 | $10,017 | $10,638 | $10,758 | $10,903 |
|---|
| 9/30/2016 | $9,965 | $10,633 | $10,780 | $10,905 |
|---|
| 10/31/2016 | $9,582 | $10,201 | $10,438 | $10,706 |
|---|
| 11/30/2016 | $9,912 | $10,644 | $11,001 | $11,103 |
|---|
| 12/31/2016 | $9,783 | $10,681 | $11,126 | $11,322 |
|---|
| 1/31/2017 | $10,221 | $11,037 | $11,394 | $11,537 |
|---|
| 2/28/2017 | $10,372 | $11,355 | $11,717 | $11,995 |
|---|
| 3/31/2017 | $10,458 | $11,417 | $11,698 | $12,009 |
|---|
| 4/30/2017 | $10,707 | $11,587 | $11,789 | $12,132 |
|---|
| 5/31/2017 | $10,940 | $11,864 | $11,896 | $12,303 |
|---|
| 6/30/2017 | $10,999 | $11,899 | $12,015 | $12,380 |
|---|
| 7/31/2017 | $11,102 | $12,097 | $12,191 | $12,635 |
|---|
| 8/31/2017 | $11,232 | $12,183 | $12,097 | $12,673 |
|---|
| 9/30/2017 | $11,464 | $12,527 | $12,432 | $12,935 |
|---|
| 10/31/2017 | $11,681 | $12,878 | $12,639 | $13,237 |
|---|
| 11/30/2017 | $12,010 | $13,308 | $13,065 | $13,642 |
|---|
| 12/31/2017 | $12,017 | $13,380 | $13,186 | $13,794 |
|---|
| 1/31/2018 | $12,624 | $14,137 | $13,682 | $14,584 |
|---|
| 2/28/2018 | $12,223 | $13,693 | $13,117 | $14,046 |
|---|
| 3/31/2018 | $12,229 | $13,671 | $13,125 | $13,689 |
|---|
| 4/30/2018 | $12,117 | $13,542 | $13,105 | $13,742 |
|---|
| 5/31/2018 | $12,524 | $14,048 | $13,403 | $14,073 |
|---|
| 6/30/2018 | $12,530 | $14,103 | $13,495 | $14,160 |
|---|
| 7/31/2018 | $12,866 | $14,405 | $13,832 | $14,686 |
|---|
| 8/31/2018 | $13,415 | $15,236 | $14,261 | $15,165 |
|---|
| 9/30/2018 | $13,486 | $15,171 | $14,170 | $15,251 |
|---|
| 10/31/2018 | $12,259 | $13,668 | $12,993 | $14,209 |
|---|
| 11/30/2018 | $12,660 | $14,016 | $13,312 | $14,498 |
|---|
| 12/31/2018 | $11,613 | $12,744 | $11,992 | $13,189 |
|---|
| 1/31/2019 | $12,815 | $14,209 | $13,285 | $14,246 |
|---|
| 2/28/2019 | $13,672 | $15,042 | $13,856 | $14,704 |
|---|
| 3/31/2019 | $13,917 | $15,245 | $13,975 | $14,989 |
|---|
| 4/30/2019 | $14,449 | $15,930 | $14,506 | $15,596 |
|---|
| 5/31/2019 | $13,892 | $15,014 | $13,616 | $14,605 |
|---|
| 6/30/2019 | $14,806 | $16,068 | $14,552 | $15,635 |
|---|
| 7/31/2019 | $15,043 | $16,444 | $14,759 | $15,859 |
|---|
| 8/31/2019 | $14,768 | $16,144 | $14,339 | $15,608 |
|---|
| 9/30/2019 | $14,580 | $15,960 | $14,621 | $15,900 |
|---|
| 10/31/2019 | $14,943 | $16,256 | $14,775 | $16,245 |
|---|
| 11/30/2019 | $15,632 | $17,065 | $15,303 | $16,834 |
|---|
| 12/31/2019 | $15,881 | $17,265 | $15,654 | $17,342 |
|---|
| 1/31/2020 | $16,205 | $17,426 | $15,529 | $17,335 |
|---|
| 2/29/2020 | $15,166 | $16,225 | $14,180 | $15,908 |
|---|
| 3/31/2020 | $12,804 | $13,805 | $11,416 | $13,944 |
|---|
| 4/30/2020 | $14,710 | $15,967 | $13,056 | $15,731 |
|---|
| 5/31/2020 | $16,351 | $17,570 | $13,974 | $16,480 |
|---|
| 6/30/2020 | $16,873 | $17,982 | $14,226 | $16,808 |
|---|
| 7/31/2020 | $18,184 | $19,419 | $15,061 | $17,756 |
|---|
| 8/31/2020 | $18,845 | $19,947 | $15,590 | $19,032 |
|---|
| 9/30/2020 | $18,739 | $19,668 | $15,287 | $18,309 |
|---|
| 10/31/2020 | $18,951 | $19,692 | $15,384 | $17,822 |
|---|
| 11/30/2020 | $21,221 | $22,337 | $17,511 | $19,773 |
|---|
| 12/31/2020 | $22,243 | $23,409 | $18,331 | $20,533 |
|---|
| 1/31/2021 | $21,823 | $23,330 | $18,283 | $20,326 |
|---|
| 2/28/2021 | $22,602 | $23,729 | $19,301 | $20,886 |
|---|
| 3/31/2021 | $21,900 | $23,276 | $19,823 | $21,801 |
|---|
| 4/30/2021 | $23,167 | $24,584 | $20,833 | $22,964 |
|---|
| 5/31/2021 | $22,274 | $24,208 | $21,001 | $23,125 |
|---|
| 6/30/2021 | $23,572 | $25,853 | $21,310 | $23,665 |
|---|
| 7/31/2021 | $24,129 | $26,120 | $21,474 | $24,227 |
|---|
| 8/31/2021 | $24,801 | $26,963 | $22,020 | $24,963 |
|---|
| 9/30/2021 | $23,717 | $25,657 | $21,112 | $23,802 |
|---|
| 10/31/2021 | $25,023 | $27,456 | $22,368 | $25,470 |
|---|
| 11/30/2021 | $23,786 | $26,296 | $21,589 | $25,294 |
|---|
| 12/31/2021 | $23,713 | $26,388 | $22,471 | $26,427 |
|---|
| 1/31/2022 | $20,434 | $22,983 | $20,816 | $25,060 |
|---|
| 2/28/2022 | $20,187 | $22,704 | $20,666 | $24,309 |
|---|
| 3/31/2022 | $20,178 | $23,068 | $21,195 | $25,212 |
|---|
| 4/30/2022 | $18,040 | $20,471 | $19,562 | $23,013 |
|---|
| 5/31/2022 | $17,236 | $19,678 | $19,578 | $23,056 |
|---|
| 6/30/2022 | $16,350 | $18,207 | $17,624 | $21,152 |
|---|
| 7/31/2022 | $18,205 | $20,436 | $19,364 | $23,103 |
|---|
| 8/31/2022 | $17,419 | $19,766 | $18,756 | $22,161 |
|---|
| 9/30/2022 | $15,875 | $18,089 | $17,018 | $20,120 |
|---|
| 10/31/2022 | $16,762 | $19,510 | $18,528 | $21,749 |
|---|
| 11/30/2022 | $17,310 | $20,572 | $19,642 | $22,964 |
|---|
| 12/31/2022 | $15,985 | $19,337 | $18,580 | $21,641 |
|---|
| 1/31/2023 | $16,953 | $21,024 | $20,123 | $23,001 |
|---|
| 2/28/2023 | $16,515 | $20,817 | $19,635 | $22,440 |
|---|
| 3/31/2023 | $17,072 | $21,104 | $19,334 | $23,263 |
|---|
| 4/30/2023 | $16,515 | $20,798 | $19,232 | $23,626 |
|---|
| 5/31/2023 | $16,871 | $20,811 | $18,694 | $23,729 |
|---|
| 6/30/2023 | $17,839 | $22,419 | $20,254 | $25,297 |
|---|
| 7/31/2023 | $18,214 | $23,098 | $21,058 | $26,110 |
|---|
| 8/31/2023 | $17,300 | $22,336 | $20,327 | $25,694 |
|---|
| 9/30/2023 | $16,150 | $21,248 | $19,306 | $24,469 |
|---|
| 10/31/2023 | $14,971 | $20,164 | $18,342 | $23,955 |
|---|
| 11/30/2023 | $16,880 | $22,624 | $20,218 | $26,142 |
|---|
| 12/31/2023 | $17,711 | $24,339 | $21,781 | $27,330 |
|---|
| 1/31/2024 | $18,278 | $24,208 | $21,471 | $27,789 |
|---|
| 2/29/2024 | $20,077 | $26,028 | $22,670 | $29,273 |
|---|
| 3/31/2024 | $20,434 | $26,650 | $23,654 | $30,215 |
|---|
| 4/30/2024 | $19,210 | $25,102 | $22,376 | $28,981 |
|---|
| 5/31/2024 | $19,520 | $25,370 | $23,015 | $30,418 |
|---|
| 6/30/2024 | $19,949 | $25,794 | $22,862 | $31,509 |
|---|
| 7/31/2024 | $19,292 | $25,950 | $23,940 | $31,893 |
|---|
| 8/31/2024 | $20,114 | $26,595 | $24,425 | $32,666 |
|---|
| 9/30/2024 | $21,091 | $27,481 | $24,968 | $33,364 |
|---|
| 10/31/2024 | $21,785 | $27,961 | $24,834 | $33,061 |
|---|
| 11/30/2024 | $24,809 | $31,688 | $27,025 | $35,002 |
|---|
The Fund’s benchmarks are unmanaged indices used as a general measure of market performance. Calculations assume the reinvestment of dividends and capital gains.
Average Annual Total Returns (%)
| AATR | 1 Year | 5 Years | 10 Years |
|---|
| Class A at NAV | 46.97% | 9.68% | 10.16% |
|---|
| Class A with sales charge | 38.50% | 8.39% | 9.51% |
|---|
| Russell Mid Cap Growth Index | 40.07% | 13.18% | 12.22% |
|---|
| Russell Mid Cap Index | 33.66% | 12.05% | 10.45% |
|---|
S&P 500 IndexFootnote Reference* | 33.89% | 15.77% | 13.35% |
|---|
| Footnote | Description |
Footnote* | The Fund has adopted the S&P 500 Index as its broad-based securities market index. |
The Fund's past performance is no guarantee of future results. The returns do not reflect the deduction of taxes that a shareholder would pay on Fund distributions or redemption of Fund shares.
(as of November 30, 2024)
| Total Net Assets | $565,343,784 |
|---|
| # of Portfolio Holdings | 69 |
|---|
| Portfolio Turnover Rate | 117% |
|---|
| Total Advisory Fees Paid | $2,165,888 |
|---|
What did the Fund invest in?
(as of November 30, 2024)
Portfolio Holdings Presented by SectorFootnote Reference* | % Footnote Reference** |
|---|
| Communication Services | 10.01% |
| Consumer Discretionary | 15.72% |
| Consumer Staples | 1.84% |
| Financials | 12.46% |
| Health Care | 13.70% |
| Industrials | 18.74% |
| Information Technology | 25.52% |
| Repurchase Agreements | 2.01% |
| Total | 100.00% |
| Footnote | Description |
Footnote* | A sector may comprise several industries. |
Footnote** | Represents percent of total investments, which excludes derivatives. |
There were no material fund changes during the period.
Where can I find additional information about the Fund?
For additional information about the Fund, including its Prospectus, Statement of Additional Information, financial statements, holdings and proxy information, please visit lordabbett.com/FundDocuments.
The Fund has adopted a policy that allows it to send only one copy of the Fund's prospectus, proxy material, annual report and semiannual report (or related notice of internet availability of annual report and semiannual report) to certain shareholders residing at the same "household." This reduces Fund expenses, which benefits you and other shareholders.If you need additional copies or do not want your mailings to be "householded," please call Lord Abbett at 888-522-2388.
Lord Abbett Growth Opportunities Fund
Annual Shareholder Report
November 30, 2024
lordabbett.com/FundDocuments
TSR-A-260-A
01/25
Lord Abbett Growth Opportunities Fund
Annual Shareholder Report
November 30, 2024
lordabbett.com/FundDocuments
This annual shareholder report contains important information about the Lord Abbett Growth Opportunities Fund for the period of December 1, 2023 to November 30, 2024, as well as certain changes to the Fund. You can find additional information about the Fund at lordabbett.com/FundDocuments. You can also request this information by contacting us at 888-522-2388.
What were the Fund costs for the last year?
(based on a hypothetical $10,000 investment)
| Class Name | Costs of a $10,000 investment | Costs paid as a percentage of a $10,000 investment |
|---|
| Class C | $210 | 1.71% |
|---|
How did the Fund perform last year and what affected its performance?
For the fiscal year ended November 30, 2024, the Fund returned 45.88%, reflecting performance at the net asset value (NAV) of Class C shares, with all distributions reinvested, compared to the 40.07% return of a securities market index with investment characteristics similar to those of the Fund, the Russell Mid Cap Growth Index. The Fund's broad-based securities market index, the S&P 500 Index, returned 33.89% over the same period.
Positive factors for the markets included momentum around the soft-landing narrative, which was supported by signs of a cooling labor market and a slowing economy. This led to the U.S. Federal Reserve lowering its policy rate by 50 basis points in September and 25 basis points in November. There were also increased expectations for further rate cuts in 2024. Mixed economic data, including softer consumer price index reports and fluctuating job market indicators, contributed to these rate cut expectations, and also sparked recession fears. However, these factors were mostly balanced by strong consumer spending and retail sales. Against this backdrop, global equity markets delivered strong return.
Top contributors to performance: Security selection within the Health Care sector contributed to relative performance, led by an overweight allocation to Natera, Inc. Security selection within the Industrials sector also contributed to relative performance, led by an overweight allocation to Vertiv Holdings Co.
Top detractors from performance: Security selection within the Financials sector detracted from relative performance, led by an overweight allocation to Coinbase Global, Inc. Within the Communication Services sector, an overweight allocation to Roku, Inc., also detracted from relative performance.
Total Return Based on $10,000 Investment
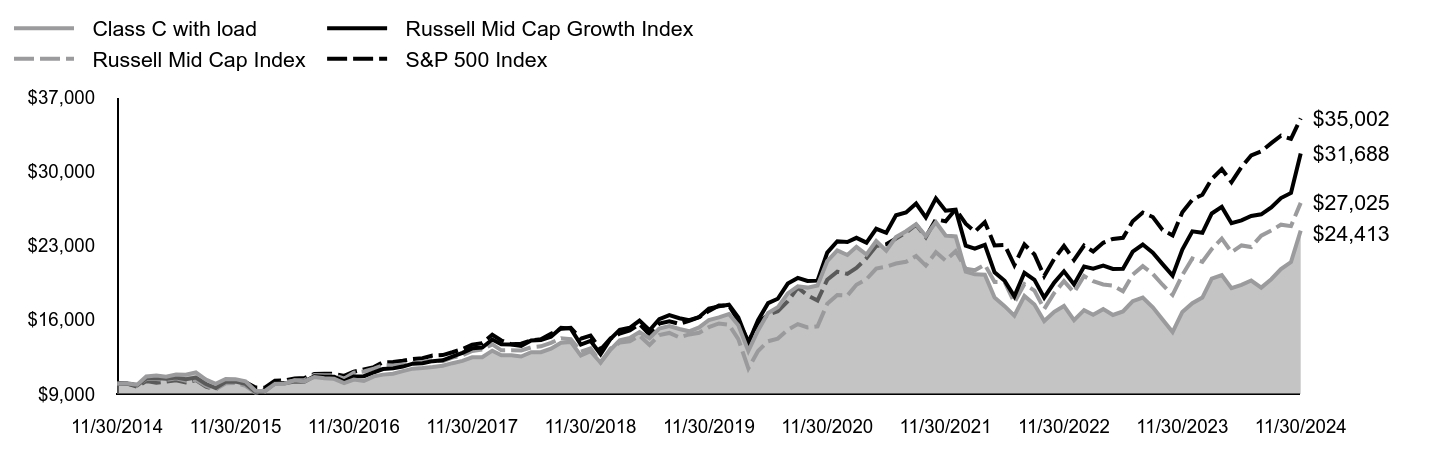
| Class C with load | Russell Mid Cap Growth Index | Russell Mid Cap Index | S&P 500 Index |
|---|
| 11/30/2014 | $10,000 | $10,000 | $10,000 | $10,000 |
|---|
| 12/31/2014 | $9,996 | $9,972 | $10,021 | $9,975 |
|---|
| 1/31/2015 | $9,877 | $9,804 | $9,865 | $9,675 |
|---|
| 2/28/2015 | $10,650 | $10,478 | $10,411 | $10,231 |
|---|
| 3/31/2015 | $10,739 | $10,508 | $10,417 | $10,070 |
|---|
| 4/30/2015 | $10,638 | $10,434 | $10,323 | $10,166 |
|---|
| 5/31/2015 | $10,840 | $10,558 | $10,474 | $10,297 |
|---|
| 6/30/2015 | $10,817 | $10,388 | $10,257 | $10,098 |
|---|
| 7/31/2015 | $11,043 | $10,556 | $10,333 | $10,309 |
|---|
| 8/31/2015 | $10,364 | $9,942 | $9,788 | $9,687 |
|---|
| 9/30/2015 | $9,954 | $9,558 | $9,436 | $9,448 |
|---|
| 10/31/2015 | $10,418 | $10,160 | $10,021 | $10,244 |
|---|
| 11/30/2015 | $10,400 | $10,182 | $10,046 | $10,275 |
|---|
| 12/31/2015 | $10,192 | $9,952 | $9,777 | $10,113 |
|---|
| 1/31/2016 | $9,315 | $9,198 | $9,136 | $9,611 |
|---|
| 2/29/2016 | $9,287 | $9,343 | $9,239 | $9,598 |
|---|
| 3/31/2016 | $9,953 | $10,009 | $9,996 | $10,249 |
|---|
| 4/30/2016 | $9,967 | $10,003 | $10,102 | $10,289 |
|---|
| 5/31/2016 | $10,297 | $10,167 | $10,268 | $10,474 |
|---|
| 6/30/2016 | $10,185 | $10,166 | $10,314 | $10,501 |
|---|
| 7/31/2016 | $10,605 | $10,669 | $10,785 | $10,888 |
|---|
| 8/31/2016 | $10,493 | $10,638 | $10,758 | $10,903 |
|---|
| 9/30/2016 | $10,430 | $10,633 | $10,780 | $10,905 |
|---|
| 10/31/2016 | $10,023 | $10,201 | $10,438 | $10,706 |
|---|
| 11/30/2016 | $10,360 | $10,644 | $11,001 | $11,103 |
|---|
| 12/31/2016 | $10,221 | $10,681 | $11,126 | $11,322 |
|---|
| 1/31/2017 | $10,667 | $11,037 | $11,394 | $11,537 |
|---|
| 2/28/2017 | $10,827 | $11,355 | $11,717 | $11,995 |
|---|
| 3/31/2017 | $10,907 | $11,417 | $11,698 | $12,009 |
|---|
| 4/30/2017 | $11,163 | $11,587 | $11,789 | $12,132 |
|---|
| 5/31/2017 | $11,389 | $11,864 | $11,896 | $12,303 |
|---|
| 6/30/2017 | $11,447 | $11,899 | $12,015 | $12,380 |
|---|
| 7/31/2017 | $11,549 | $12,097 | $12,191 | $12,635 |
|---|
| 8/31/2017 | $11,673 | $12,183 | $12,097 | $12,673 |
|---|
| 9/30/2017 | $11,907 | $12,527 | $12,432 | $12,935 |
|---|
| 10/31/2017 | $12,126 | $12,878 | $12,639 | $13,237 |
|---|
| 11/30/2017 | $12,461 | $13,308 | $13,065 | $13,642 |
|---|
| 12/31/2017 | $12,462 | $13,380 | $13,186 | $13,794 |
|---|
| 1/31/2018 | $13,084 | $14,137 | $13,682 | $14,584 |
|---|
| 2/28/2018 | $12,659 | $13,693 | $13,117 | $14,046 |
|---|
| 3/31/2018 | $12,651 | $13,671 | $13,125 | $13,689 |
|---|
| 4/30/2018 | $12,536 | $13,542 | $13,105 | $13,742 |
|---|
| 5/31/2018 | $12,945 | $14,048 | $13,403 | $14,073 |
|---|
| 6/30/2018 | $12,945 | $14,103 | $13,495 | $14,160 |
|---|
| 7/31/2018 | $13,281 | $14,405 | $13,832 | $14,686 |
|---|
| 8/31/2018 | $13,837 | $15,236 | $14,261 | $15,165 |
|---|
| 9/30/2018 | $13,911 | $15,171 | $14,170 | $15,251 |
|---|
| 10/31/2018 | $12,634 | $13,668 | $12,993 | $14,209 |
|---|
| 11/30/2018 | $13,035 | $14,016 | $13,312 | $14,498 |
|---|
| 12/31/2018 | $11,951 | $12,744 | $11,992 | $13,189 |
|---|
| 1/31/2019 | $13,184 | $14,209 | $13,285 | $14,246 |
|---|
| 2/28/2019 | $14,054 | $15,042 | $13,856 | $14,704 |
|---|
| 3/31/2019 | $14,293 | $15,245 | $13,975 | $14,989 |
|---|
| 4/30/2019 | $14,835 | $15,930 | $14,506 | $15,596 |
|---|
| 5/31/2019 | $14,258 | $15,014 | $13,616 | $14,605 |
|---|
| 6/30/2019 | $15,181 | $16,068 | $14,552 | $15,635 |
|---|
| 7/31/2019 | $15,411 | $16,444 | $14,759 | $15,859 |
|---|
| 8/31/2019 | $15,127 | $16,144 | $14,339 | $15,608 |
|---|
| 9/30/2019 | $14,914 | $15,960 | $14,621 | $15,900 |
|---|
| 10/31/2019 | $15,278 | $16,256 | $14,775 | $16,245 |
|---|
| 11/30/2019 | $15,979 | $17,065 | $15,303 | $16,834 |
|---|
| 12/31/2019 | $16,225 | $17,265 | $15,654 | $17,342 |
|---|
| 1/31/2020 | $16,542 | $17,426 | $15,529 | $17,335 |
|---|
| 2/29/2020 | $15,478 | $16,225 | $14,180 | $15,908 |
|---|
| 3/31/2020 | $13,051 | $13,805 | $11,416 | $13,944 |
|---|
| 4/30/2020 | $14,988 | $15,967 | $13,056 | $15,731 |
|---|
| 5/31/2020 | $16,647 | $17,570 | $13,974 | $16,480 |
|---|
| 6/30/2020 | $17,175 | $17,982 | $14,226 | $16,808 |
|---|
| 7/31/2020 | $18,489 | $19,419 | $15,061 | $17,756 |
|---|
| 8/31/2020 | $19,150 | $19,947 | $15,590 | $19,032 |
|---|
| 9/30/2020 | $19,035 | $19,668 | $15,287 | $18,309 |
|---|
| 10/31/2020 | $19,237 | $19,692 | $15,384 | $17,822 |
|---|
| 11/30/2020 | $21,529 | $22,337 | $17,511 | $19,773 |
|---|
| 12/31/2020 | $22,549 | $23,409 | $18,331 | $20,533 |
|---|
| 1/31/2021 | $22,111 | $23,330 | $18,283 | $20,326 |
|---|
| 2/28/2021 | $22,881 | $23,729 | $19,301 | $20,886 |
|---|
| 3/31/2021 | $22,158 | $23,276 | $19,823 | $21,801 |
|---|
| 4/30/2021 | $23,426 | $24,584 | $20,833 | $22,964 |
|---|
| 5/31/2021 | $22,514 | $24,208 | $21,001 | $23,125 |
|---|
| 6/30/2021 | $23,805 | $25,853 | $21,310 | $23,665 |
|---|
| 7/31/2021 | $24,351 | $26,120 | $21,474 | $24,227 |
|---|
| 8/31/2021 | $25,014 | $26,963 | $22,020 | $24,963 |
|---|
| 9/30/2021 | $23,900 | $25,657 | $21,112 | $23,802 |
|---|
| 10/31/2021 | $25,204 | $27,456 | $22,368 | $25,470 |
|---|
| 11/30/2021 | $23,948 | $26,296 | $21,589 | $25,294 |
|---|
| 12/31/2021 | $23,857 | $26,388 | $22,471 | $26,427 |
|---|
| 1/31/2022 | $20,542 | $22,983 | $20,816 | $25,060 |
|---|
| 2/28/2022 | $20,288 | $22,704 | $20,666 | $24,309 |
|---|
| 3/31/2022 | $20,257 | $23,068 | $21,195 | $25,212 |
|---|
| 4/30/2022 | $18,099 | $20,471 | $19,562 | $23,013 |
|---|
| 5/31/2022 | $17,290 | $19,678 | $19,578 | $23,056 |
|---|
| 6/30/2022 | $16,386 | $18,207 | $17,624 | $21,152 |
|---|
| 7/31/2022 | $18,242 | $20,436 | $19,364 | $23,103 |
|---|
| 8/31/2022 | $17,433 | $19,766 | $18,756 | $22,161 |
|---|
| 9/30/2022 | $15,878 | $18,089 | $17,018 | $20,120 |
|---|
| 10/31/2022 | $16,751 | $19,510 | $18,528 | $21,749 |
|---|
| 11/30/2022 | $17,306 | $20,572 | $19,642 | $22,964 |
|---|
| 12/31/2022 | $15,958 | $19,337 | $18,580 | $21,641 |
|---|
| 1/31/2023 | $16,910 | $21,024 | $20,123 | $23,001 |
|---|
| 2/28/2023 | $16,481 | $20,817 | $19,635 | $22,440 |
|---|
| 3/31/2023 | $17,005 | $21,104 | $19,334 | $23,263 |
|---|
| 4/30/2023 | $16,450 | $20,798 | $19,232 | $23,626 |
|---|
| 5/31/2023 | $16,783 | $20,811 | $18,694 | $23,729 |
|---|
| 6/30/2023 | $17,750 | $22,419 | $20,254 | $25,297 |
|---|
| 7/31/2023 | $18,099 | $23,098 | $21,058 | $26,110 |
|---|
| 8/31/2023 | $17,179 | $22,336 | $20,327 | $25,694 |
|---|
| 9/30/2023 | $16,037 | $21,248 | $19,306 | $24,469 |
|---|
| 10/31/2023 | $14,847 | $20,164 | $18,342 | $23,955 |
|---|
| 11/30/2023 | $16,735 | $22,624 | $20,218 | $26,142 |
|---|
| 12/31/2023 | $17,560 | $24,339 | $21,781 | $27,330 |
|---|
| 1/31/2024 | $18,099 | $24,208 | $21,471 | $27,789 |
|---|
| 2/29/2024 | $19,876 | $26,028 | $22,670 | $29,273 |
|---|
| 3/31/2024 | $20,209 | $26,650 | $23,654 | $30,215 |
|---|
| 4/30/2024 | $18,988 | $25,102 | $22,376 | $28,981 |
|---|
| 5/31/2024 | $19,289 | $25,370 | $23,015 | $30,418 |
|---|
| 6/30/2024 | $19,701 | $25,794 | $22,862 | $31,509 |
|---|
| 7/31/2024 | $19,035 | $25,950 | $23,940 | $31,893 |
|---|
| 8/31/2024 | $19,828 | $26,595 | $24,425 | $32,666 |
|---|
| 9/30/2024 | $20,780 | $27,481 | $24,968 | $33,364 |
|---|
| 10/31/2024 | $21,446 | $27,961 | $24,834 | $33,061 |
|---|
| 11/30/2024 | $24,413 | $31,688 | $27,025 | $35,002 |
|---|
The Fund’s benchmarks are unmanaged indices used as a general measure of market performance. Calculations assume the reinvestment of dividends and capital gains.
Average Annual Total Returns (%)
| AATR | 1 Year | 5 Years | 10 Years |
|---|
| Class C at NAV | 45.88% | 8.85% | 9.34% |
|---|
| Class C with sales charge | 44.88% | 8.85% | 9.34% |
|---|
| Russell Mid Cap Growth Index | 40.07% | 13.18% | 12.22% |
|---|
| Russell Mid Cap Index | 33.66% | 12.05% | 10.45% |
|---|
S&P 500 IndexFootnote Reference* | 33.89% | 15.77% | 13.35% |
|---|
| Footnote | Description |
Footnote* | The Fund has adopted the S&P 500 Index as its broad-based securities market index. |
The Fund's past performance is no guarantee of future results. The returns do not reflect the deduction of taxes that a shareholder would pay on Fund distributions or redemption of Fund shares.
(as of November 30, 2024)
| Total Net Assets | $565,343,784 |
|---|
| # of Portfolio Holdings | 69 |
|---|
| Portfolio Turnover Rate | 117% |
|---|
| Total Advisory Fees Paid | $2,165,888 |
|---|
What did the Fund invest in?
(as of November 30, 2024)
Portfolio Holdings Presented by SectorFootnote Reference* | % Footnote Reference** |
|---|
| Communication Services | 10.01% |
| Consumer Discretionary | 15.72% |
| Consumer Staples | 1.84% |
| Financials | 12.46% |
| Health Care | 13.70% |
| Industrials | 18.74% |
| Information Technology | 25.52% |
| Repurchase Agreements | 2.01% |
| Total | 100.00% |
| Footnote | Description |
Footnote* | A sector may comprise several industries. |
Footnote** | Represents percent of total investments, which excludes derivatives. |
There were no material fund changes during the period.
Where can I find additional information about the Fund?
For additional information about the Fund, including its Prospectus, Statement of Additional Information, financial statements, holdings and proxy information, please visit lordabbett.com/FundDocuments.
The Fund has adopted a policy that allows it to send only one copy of the Fund's prospectus, proxy material, annual report and semiannual report (or related notice of internet availability of annual report and semiannual report) to certain shareholders residing at the same "household." This reduces Fund expenses, which benefits you and other shareholders.If you need additional copies or do not want your mailings to be "householded," please call Lord Abbett at 888-522-2388.
Lord Abbett Growth Opportunities Fund
Annual Shareholder Report
November 30, 2024
lordabbett.com/FundDocuments
TSR-A-680-C
01/25
Lord Abbett Growth Opportunities Fund
Annual Shareholder Report
November 30, 2024
lordabbett.com/FundDocuments
This annual shareholder report contains important information about the Lord Abbett Growth Opportunities Fund for the period of December 1, 2023 to November 30, 2024, as well as certain changes to the Fund. You can find additional information about the Fund at lordabbett.com/FundDocuments. You can also request this information by contacting us at 888-522-2388.
What were the Fund costs for the last year?
(based on a hypothetical $10,000 investment)
| Class Name | Costs of a $10,000 investment | Costs paid as a percentage of a $10,000 investment |
|---|
| Class F | $100 | 0.81% |
|---|
How did the Fund perform last year and what affected its performance?
For the fiscal year ended November 30, 2024, the Fund returned 47.17%, reflecting performance at the net asset value (NAV) of Class F shares, with all distributions reinvested, compared to the 40.07% return of a securities market index with investment characteristics similar to those of the Fund, the Russell Mid Cap Growth Index. The Fund's broad-based securities market index, the S&P 500 Index, returned 33.89% over the same period.
Positive factors for the markets included momentum around the soft-landing narrative, which was supported by signs of a cooling labor market and a slowing economy. This led to the U.S. Federal Reserve lowering its policy rate by 50 basis points in September and 25 basis points in November. There were also increased expectations for further rate cuts in 2024. Mixed economic data, including softer consumer price index reports and fluctuating job market indicators, contributed to these rate cut expectations, and also sparked recession fears. However, these factors were mostly balanced by strong consumer spending and retail sales. Against this backdrop, global equity markets delivered strong return.
Top contributors to performance: Security selection within the Health Care sector contributed to relative performance, led by an overweight allocation to Natera, Inc. Security selection within the Industrials sector also contributed to relative performance, led by an overweight allocation to Vertiv Holdings Co.
Top detractors from performance: Security selection within the Financials sector detracted from relative performance, led by an overweight allocation to Coinbase Global, Inc. Within the Communication Services sector, an overweight allocation to Roku, Inc., also detracted from relative performance.
Total Return Based on $10,000 Investment
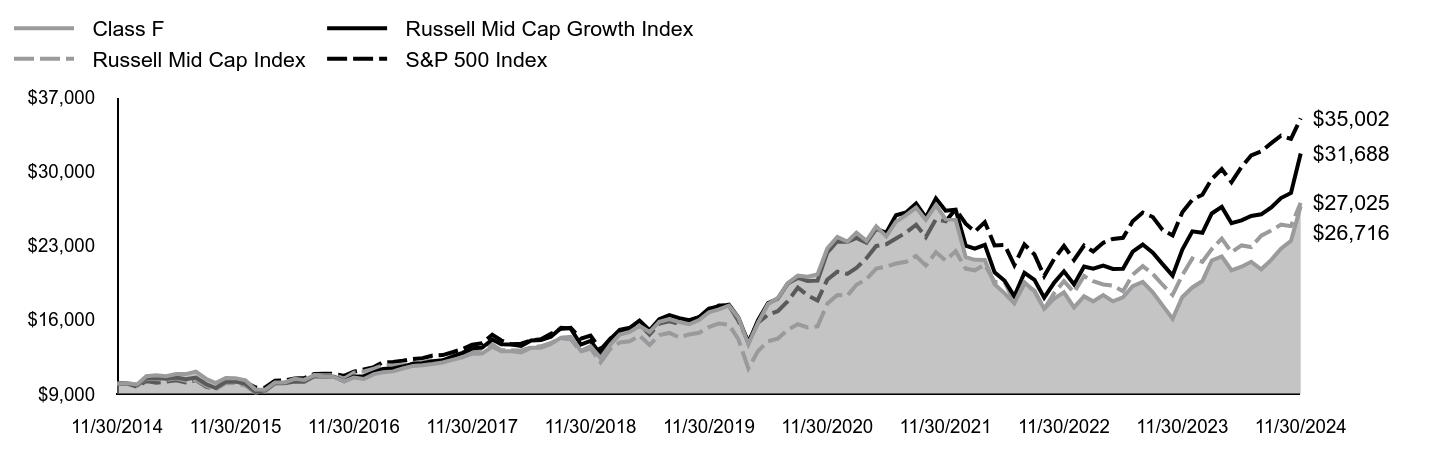
| Class F | Russell Mid Cap Growth Index | Russell Mid Cap Index | S&P 500 Index |
|---|
| 11/30/2014 | $10,000 | $10,000 | $10,000 | $10,000 |
|---|
| 12/31/2014 | $10,005 | $9,972 | $10,021 | $9,975 |
|---|
| 1/31/2015 | $9,896 | $9,804 | $9,865 | $9,675 |
|---|
| 2/28/2015 | $10,675 | $10,478 | $10,411 | $10,231 |
|---|
| 3/31/2015 | $10,770 | $10,508 | $10,417 | $10,070 |
|---|
| 4/30/2015 | $10,680 | $10,434 | $10,323 | $10,166 |
|---|
| 5/31/2015 | $10,889 | $10,558 | $10,474 | $10,297 |
|---|
| 6/30/2015 | $10,875 | $10,388 | $10,257 | $10,098 |
|---|
| 7/31/2015 | $11,108 | $10,556 | $10,333 | $10,309 |
|---|
| 8/31/2015 | $10,438 | $9,942 | $9,788 | $9,687 |
|---|
| 9/30/2015 | $10,029 | $9,558 | $9,436 | $9,448 |
|---|
| 10/31/2015 | $10,504 | $10,160 | $10,021 | $10,244 |
|---|
| 11/30/2015 | $10,495 | $10,182 | $10,046 | $10,275 |
|---|
| 12/31/2015 | $10,290 | $9,952 | $9,777 | $10,113 |
|---|
| 1/31/2016 | $9,416 | $9,198 | $9,136 | $9,611 |
|---|
| 2/29/2016 | $9,394 | $9,343 | $9,239 | $9,598 |
|---|
| 3/31/2016 | $10,074 | $10,009 | $9,996 | $10,249 |
|---|
| 4/30/2016 | $10,090 | $10,003 | $10,102 | $10,289 |
|---|
| 5/31/2016 | $10,436 | $10,167 | $10,268 | $10,474 |
|---|
| 6/30/2016 | $10,328 | $10,166 | $10,314 | $10,501 |
|---|
| 7/31/2016 | $10,765 | $10,669 | $10,785 | $10,888 |
|---|
| 8/31/2016 | $10,657 | $10,638 | $10,758 | $10,903 |
|---|
| 9/30/2016 | $10,603 | $10,633 | $10,780 | $10,905 |
|---|
| 10/31/2016 | $10,198 | $10,201 | $10,438 | $10,706 |
|---|
| 11/30/2016 | $10,549 | $10,644 | $11,001 | $11,103 |
|---|
| 12/31/2016 | $10,410 | $10,681 | $11,126 | $11,322 |
|---|
| 1/31/2017 | $10,878 | $11,037 | $11,394 | $11,537 |
|---|
| 2/28/2017 | $11,045 | $11,355 | $11,717 | $11,995 |
|---|
| 3/31/2017 | $11,134 | $11,417 | $11,698 | $12,009 |
|---|
| 4/30/2017 | $11,406 | $11,587 | $11,789 | $12,132 |
|---|
| 5/31/2017 | $11,651 | $11,864 | $11,896 | $12,303 |
|---|
| 6/30/2017 | $11,718 | $11,899 | $12,015 | $12,380 |
|---|
| 7/31/2017 | $11,824 | $12,097 | $12,191 | $12,635 |
|---|
| 8/31/2017 | $11,968 | $12,183 | $12,097 | $12,673 |
|---|
| 9/30/2017 | $12,219 | $12,527 | $12,432 | $12,935 |
|---|
| 10/31/2017 | $12,447 | $12,878 | $12,639 | $13,237 |
|---|
| 11/30/2017 | $12,803 | $13,308 | $13,065 | $13,642 |
|---|
| 12/31/2017 | $12,810 | $13,380 | $13,186 | $13,794 |
|---|
| 1/31/2018 | $13,463 | $14,137 | $13,682 | $14,584 |
|---|
| 2/28/2018 | $13,033 | $13,693 | $13,117 | $14,046 |
|---|
| 3/31/2018 | $13,040 | $13,671 | $13,125 | $13,689 |
|---|
| 4/30/2018 | $12,925 | $13,542 | $13,105 | $13,742 |
|---|
| 5/31/2018 | $13,360 | $14,048 | $13,403 | $14,073 |
|---|
| 6/30/2018 | $13,366 | $14,103 | $13,495 | $14,160 |
|---|
| 7/31/2018 | $13,723 | $14,405 | $13,832 | $14,686 |
|---|
| 8/31/2018 | $14,316 | $15,236 | $14,261 | $15,165 |
|---|
| 9/30/2018 | $14,395 | $15,171 | $14,170 | $15,251 |
|---|
| 10/31/2018 | $13,082 | $13,668 | $12,993 | $14,209 |
|---|
| 11/30/2018 | $13,511 | $14,016 | $13,312 | $14,498 |
|---|
| 12/31/2018 | $12,395 | $12,744 | $11,992 | $13,189 |
|---|
| 1/31/2019 | $13,683 | $14,209 | $13,285 | $14,246 |
|---|
| 2/28/2019 | $14,599 | $15,042 | $13,856 | $14,704 |
|---|
| 3/31/2019 | $14,862 | $15,245 | $13,975 | $14,989 |
|---|
| 4/30/2019 | $15,432 | $15,930 | $14,506 | $15,596 |
|---|
| 5/31/2019 | $14,842 | $15,014 | $13,616 | $14,605 |
|---|
| 6/30/2019 | $15,816 | $16,068 | $14,552 | $15,635 |
|---|
| 7/31/2019 | $16,072 | $16,444 | $14,759 | $15,859 |
|---|
| 8/31/2019 | $15,784 | $16,144 | $14,339 | $15,608 |
|---|
| 9/30/2019 | $15,579 | $15,960 | $14,621 | $15,900 |
|---|
| 10/31/2019 | $15,970 | $16,256 | $14,775 | $16,245 |
|---|
| 11/30/2019 | $16,713 | $17,065 | $15,303 | $16,834 |
|---|
| 12/31/2019 | $16,980 | $17,265 | $15,654 | $17,342 |
|---|
| 1/31/2020 | $17,325 | $17,426 | $15,529 | $17,335 |
|---|
| 2/29/2020 | $16,224 | $16,225 | $14,180 | $15,908 |
|---|
| 3/31/2020 | $13,691 | $13,805 | $11,416 | $13,944 |
|---|
| 4/30/2020 | $15,737 | $15,967 | $13,056 | $15,731 |
|---|
| 5/31/2020 | $17,494 | $17,570 | $13,974 | $16,480 |
|---|
| 6/30/2020 | $18,054 | $17,982 | $14,226 | $16,808 |
|---|
| 7/31/2020 | $19,459 | $19,419 | $15,061 | $17,756 |
|---|
| 8/31/2020 | $20,168 | $19,947 | $15,590 | $19,032 |
|---|
| 9/30/2020 | $20,060 | $19,668 | $15,287 | $18,309 |
|---|
| 10/31/2020 | $20,283 | $19,692 | $15,384 | $17,822 |
|---|
| 11/30/2020 | $22,721 | $22,337 | $17,511 | $19,773 |
|---|
| 12/31/2020 | $23,820 | $23,409 | $18,331 | $20,533 |
|---|
| 1/31/2021 | $23,371 | $23,330 | $18,283 | $20,326 |
|---|
| 2/28/2021 | $24,206 | $23,729 | $19,301 | $20,886 |
|---|
| 3/31/2021 | $23,456 | $23,276 | $19,823 | $21,801 |
|---|
| 4/30/2021 | $24,818 | $24,584 | $20,833 | $22,964 |
|---|
| 5/31/2021 | $23,866 | $24,208 | $21,001 | $23,125 |
|---|
| 6/30/2021 | $25,251 | $25,853 | $21,310 | $23,665 |
|---|
| 7/31/2021 | $25,863 | $26,120 | $21,474 | $24,227 |
|---|
| 8/31/2021 | $26,582 | $26,963 | $22,020 | $24,963 |
|---|
| 9/30/2021 | $25,421 | $25,657 | $21,112 | $23,802 |
|---|
| 10/31/2021 | $26,822 | $27,456 | $22,368 | $25,470 |
|---|
| 11/30/2021 | $25,499 | $26,296 | $21,589 | $25,294 |
|---|
| 12/31/2021 | $25,424 | $26,388 | $22,471 | $26,427 |
|---|
| 1/31/2022 | $21,917 | $22,983 | $20,816 | $25,060 |
|---|
| 2/28/2022 | $21,651 | $22,704 | $20,666 | $24,309 |
|---|
| 3/31/2022 | $21,642 | $23,068 | $21,195 | $25,212 |
|---|
| 4/30/2022 | $19,352 | $20,471 | $19,562 | $23,013 |
|---|
| 5/31/2022 | $18,491 | $19,678 | $19,578 | $23,056 |
|---|
| 6/30/2022 | $17,548 | $18,207 | $17,624 | $21,152 |
|---|
| 7/31/2022 | $19,535 | $20,436 | $19,364 | $23,103 |
|---|
| 8/31/2022 | $18,693 | $19,766 | $18,756 | $22,161 |
|---|
| 9/30/2022 | $17,035 | $18,089 | $17,018 | $20,120 |
|---|
| 10/31/2022 | $17,997 | $19,510 | $18,528 | $21,749 |
|---|
| 11/30/2022 | $18,592 | $20,572 | $19,642 | $22,964 |
|---|
| 12/31/2022 | $17,163 | $19,337 | $18,580 | $21,641 |
|---|
| 1/31/2023 | $18,207 | $21,024 | $20,123 | $23,001 |
|---|
| 2/28/2023 | $17,740 | $20,817 | $19,635 | $22,440 |
|---|
| 3/31/2023 | $18,336 | $21,104 | $19,334 | $23,263 |
|---|
| 4/30/2023 | $17,740 | $20,798 | $19,232 | $23,626 |
|---|
| 5/31/2023 | $18,125 | $20,811 | $18,694 | $23,729 |
|---|
| 6/30/2023 | $19,169 | $22,419 | $20,254 | $25,297 |
|---|
| 7/31/2023 | $19,572 | $23,098 | $21,058 | $26,110 |
|---|
| 8/31/2023 | $18,592 | $22,336 | $20,327 | $25,694 |
|---|
| 9/30/2023 | $17,356 | $21,248 | $19,306 | $24,469 |
|---|
| 10/31/2023 | $16,092 | $20,164 | $18,342 | $23,955 |
|---|
| 11/30/2023 | $18,152 | $22,624 | $20,218 | $26,142 |
|---|
| 12/31/2023 | $19,050 | $24,339 | $21,781 | $27,330 |
|---|
| 1/31/2024 | $19,654 | $24,208 | $21,471 | $27,789 |
|---|
| 2/29/2024 | $21,596 | $26,028 | $22,670 | $29,273 |
|---|
| 3/31/2024 | $21,981 | $26,650 | $23,654 | $30,215 |
|---|
| 4/30/2024 | $20,671 | $25,102 | $22,376 | $28,981 |
|---|
| 5/31/2024 | $21,010 | $25,370 | $23,015 | $30,418 |
|---|
| 6/30/2024 | $21,468 | $25,794 | $22,862 | $31,509 |
|---|
| 7/31/2024 | $20,763 | $25,950 | $23,940 | $31,893 |
|---|
| 8/31/2024 | $21,651 | $26,595 | $24,425 | $32,666 |
|---|
| 9/30/2024 | $22,704 | $27,481 | $24,968 | $33,364 |
|---|
| 10/31/2024 | $23,455 | $27,961 | $24,834 | $33,061 |
|---|
| 11/30/2024 | $26,716 | $31,688 | $27,025 | $35,002 |
|---|
The Fund’s benchmarks are unmanaged indices used as a general measure of market performance. Calculations assume the reinvestment of dividends and capital gains.
Average Annual Total Returns (%)
| AATR | 1 Year | 5 Years | 10 Years |
|---|
| Class F at NAV | 47.17% | 9.84% | 10.33% |
|---|
| Russell Mid Cap Growth Index | 40.07% | 13.18% | 12.22% |
|---|
| Russell Mid Cap Index | 33.66% | 12.05% | 10.45% |
|---|
S&P 500 IndexFootnote Reference* | 33.89% | 15.77% | 13.35% |
|---|
| Footnote | Description |
Footnote* | The Fund has adopted the S&P 500 Index as its broad-based securities market index. |
The Fund's past performance is no guarantee of future results. The returns do not reflect the deduction of taxes that a shareholder would pay on Fund distributions or redemption of Fund shares.
(as of November 30, 2024)
| Total Net Assets | $565,343,784 |
|---|
| # of Portfolio Holdings | 69 |
|---|
| Portfolio Turnover Rate | 117% |
|---|
| Total Advisory Fees Paid | $2,165,888 |
|---|
What did the Fund invest in?
(as of November 30, 2024)
Portfolio Holdings Presented by SectorFootnote Reference* | % Footnote Reference** |
|---|
| Communication Services | 10.01% |
| Consumer Discretionary | 15.72% |
| Consumer Staples | 1.84% |
| Financials | 12.46% |
| Health Care | 13.70% |
| Industrials | 18.74% |
| Information Technology | 25.52% |
| Repurchase Agreements | 2.01% |
| Total | 100.00% |
| Footnote | Description |
Footnote* | A sector may comprise several industries. |
Footnote** | Represents percent of total investments, which excludes derivatives. |
There were no material fund changes during the period.
Where can I find additional information about the Fund?
For additional information about the Fund, including its Prospectus, Statement of Additional Information, financial statements, holdings and proxy information, please visit lordabbett.com/FundDocuments.
The Fund has adopted a policy that allows it to send only one copy of the Fund's prospectus, proxy material, annual report and semiannual report (or related notice of internet availability of annual report and semiannual report) to certain shareholders residing at the same "household." This reduces Fund expenses, which benefits you and other shareholders.If you need additional copies or do not want your mailings to be "householded," please call Lord Abbett at 888-522-2388.
Lord Abbett Growth Opportunities Fund
Annual Shareholder Report
November 30, 2024
lordabbett.com/FundDocuments
TSR-A-1021-F
01/25
Lord Abbett Growth Opportunities Fund
Annual Shareholder Report
November 30, 2024
lordabbett.com/FundDocuments
This annual shareholder report contains important information about the Lord Abbett Growth Opportunities Fund for the period of December 1, 2023 to November 30, 2024, as well as certain changes to the Fund. You can find additional information about the Fund at lordabbett.com/FundDocuments. You can also request this information by contacting us at 888-522-2388.
What were the Fund costs for the last year?
(based on a hypothetical $10,000 investment)
| Class Name | Costs of a $10,000 investment | Costs paid as a percentage of a $10,000 investment |
|---|
| Class F3 | $78 | 0.63% |
|---|
How did the Fund perform last year and what affected its performance?
For the fiscal year ended November 30, 2024, the Fund returned 47.46%, reflecting performance at the net asset value (NAV) of Class F3 shares, with all distributions reinvested, compared to the 40.07% return of a securities market index with investment characteristics similar to those of the Fund, the Russell Mid Cap Growth Index. The Fund's broad-based securities market index, the S&P 500 Index, returned 33.89% over the same period.
Positive factors for the markets included momentum around the soft-landing narrative, which was supported by signs of a cooling labor market and a slowing economy. This led to the U.S. Federal Reserve lowering its policy rate by 50 basis points in September and 25 basis points in November. There were also increased expectations for further rate cuts in 2024. Mixed economic data, including softer consumer price index reports and fluctuating job market indicators, contributed to these rate cut expectations, and also sparked recession fears. However, these factors were mostly balanced by strong consumer spending and retail sales. Against this backdrop, global equity markets delivered strong return.
Top contributors to performance: Security selection within the Health Care sector contributed to relative performance, led by an overweight allocation to Natera, Inc. Security selection within the Industrials sector also contributed to relative performance, led by an overweight allocation to Vertiv Holdings Co.
Top detractors from performance: Security selection within the Financials sector detracted from relative performance, led by an overweight allocation to Coinbase Global, Inc. Within the Communication Services sector, an overweight allocation to Roku, Inc., also detracted from relative performance.
Total Return Based on $10,000 Investment
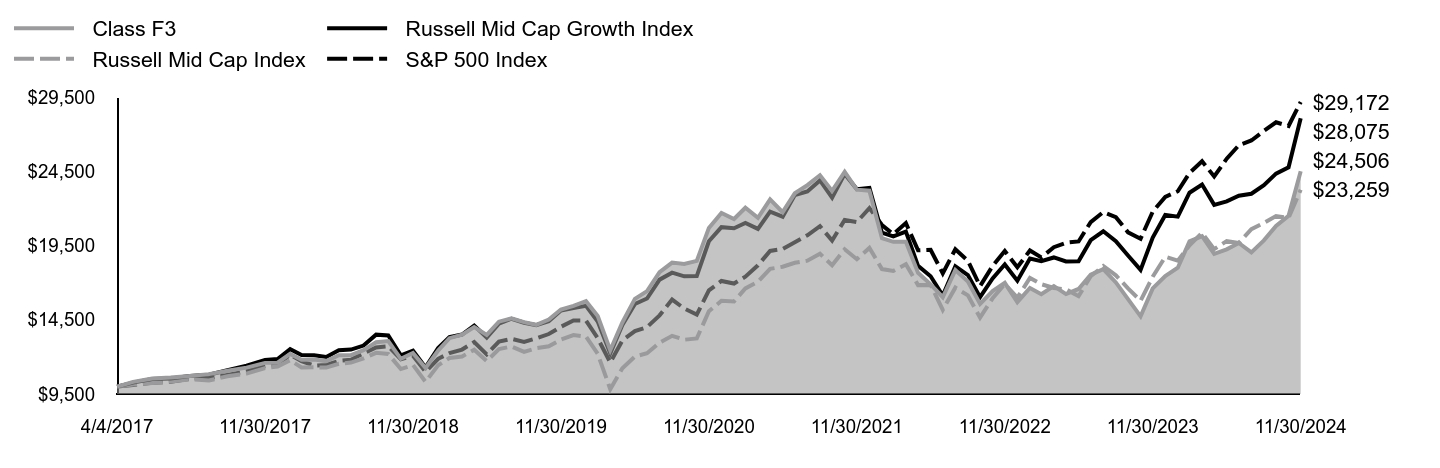
| Class F3 | Russell Mid Cap Growth Index | Russell Mid Cap Index | S&P 500 Index |
|---|
| 4/4/2017 | $10,000 | $10,000 | $10,000 | $10,000 |
|---|
| 4/30/2017 | $10,319 | $10,266 | $10,146 | $10,112 |
|---|
| 5/31/2017 | $10,542 | $10,511 | $10,238 | $10,254 |
|---|
| 6/30/2017 | $10,606 | $10,542 | $10,340 | $10,318 |
|---|
| 7/31/2017 | $10,708 | $10,718 | $10,493 | $10,530 |
|---|
| 8/31/2017 | $10,838 | $10,794 | $10,411 | $10,562 |
|---|
| 9/30/2017 | $11,065 | $11,099 | $10,699 | $10,780 |
|---|
| 10/31/2017 | $11,278 | $11,410 | $10,878 | $11,032 |
|---|
| 11/30/2017 | $11,597 | $11,791 | $11,244 | $11,370 |
|---|
| 12/31/2017 | $11,607 | $11,854 | $11,349 | $11,496 |
|---|
| 1/31/2018 | $12,202 | $12,525 | $11,776 | $12,155 |
|---|
| 2/28/2018 | $11,812 | $12,132 | $11,289 | $11,707 |
|---|
| 3/31/2018 | $11,822 | $12,112 | $11,296 | $11,409 |
|---|
| 4/30/2018 | $11,717 | $11,998 | $11,279 | $11,453 |
|---|
| 5/31/2018 | $12,112 | $12,447 | $11,535 | $11,729 |
|---|
| 6/30/2018 | $12,127 | $12,495 | $11,615 | $11,801 |
|---|
| 7/31/2018 | $12,452 | $12,763 | $11,904 | $12,240 |
|---|
| 8/31/2018 | $12,987 | $13,499 | $12,274 | $12,639 |
|---|
| 9/30/2018 | $13,062 | $13,441 | $12,195 | $12,711 |
|---|
| 10/31/2018 | $11,872 | $12,110 | $11,182 | $11,842 |
|---|
| 11/30/2018 | $12,262 | $12,418 | $11,457 | $12,083 |
|---|
| 12/31/2018 | $11,250 | $11,291 | $10,321 | $10,992 |
|---|
| 1/31/2019 | $12,424 | $12,589 | $11,434 | $11,873 |
|---|
| 2/28/2019 | $13,261 | $13,327 | $11,925 | $12,254 |
|---|
| 3/31/2019 | $13,498 | $13,507 | $12,027 | $12,493 |
|---|
| 4/30/2019 | $14,014 | $14,114 | $12,485 | $12,998 |
|---|
| 5/31/2019 | $13,482 | $13,302 | $11,719 | $12,172 |
|---|
| 6/30/2019 | $14,372 | $14,236 | $12,524 | $13,030 |
|---|
| 7/31/2019 | $14,603 | $14,569 | $12,702 | $13,218 |
|---|
| 8/31/2019 | $14,340 | $14,303 | $12,341 | $13,008 |
|---|
| 9/30/2019 | $14,161 | $14,141 | $12,584 | $13,252 |
|---|
| 10/31/2019 | $14,519 | $14,403 | $12,716 | $13,539 |
|---|
| 11/30/2019 | $15,193 | $15,119 | $13,170 | $14,030 |
|---|
| 12/31/2019 | $15,439 | $15,296 | $13,473 | $14,453 |
|---|
| 1/31/2020 | $15,754 | $15,439 | $13,365 | $14,448 |
|---|
| 2/29/2020 | $14,754 | $14,375 | $12,204 | $13,258 |
|---|
| 3/31/2020 | $12,452 | $12,231 | $9,825 | $11,621 |
|---|
| 4/30/2020 | $14,318 | $14,146 | $11,237 | $13,111 |
|---|
| 5/31/2020 | $15,914 | $15,567 | $12,026 | $13,735 |
|---|
| 6/30/2020 | $16,433 | $15,932 | $12,243 | $14,008 |
|---|
| 7/31/2020 | $17,709 | $17,205 | $12,962 | $14,798 |
|---|
| 8/31/2020 | $18,355 | $17,673 | $13,418 | $15,862 |
|---|
| 9/30/2020 | $18,261 | $17,426 | $13,157 | $15,259 |
|---|
| 10/31/2020 | $18,471 | $17,447 | $13,240 | $14,853 |
|---|
| 11/30/2020 | $20,690 | $19,790 | $15,071 | $16,479 |
|---|
| 12/31/2020 | $21,693 | $20,740 | $15,777 | $17,113 |
|---|
| 1/31/2021 | $21,288 | $20,670 | $15,735 | $16,940 |
|---|
| 2/28/2021 | $22,049 | $21,023 | $16,611 | $17,407 |
|---|
| 3/31/2021 | $21,369 | $20,623 | $17,061 | $18,169 |
|---|
| 4/30/2021 | $22,616 | $21,781 | $17,930 | $19,139 |
|---|
| 5/31/2021 | $21,749 | $21,448 | $18,074 | $19,273 |
|---|
| 6/30/2021 | $23,021 | $22,906 | $18,340 | $19,723 |
|---|
| 7/31/2021 | $23,576 | $23,142 | $18,481 | $20,191 |
|---|
| 8/31/2021 | $24,237 | $23,889 | $18,951 | $20,805 |
|---|
| 9/30/2021 | $23,183 | $22,732 | $18,170 | $19,838 |
|---|
| 10/31/2021 | $24,461 | $24,326 | $19,251 | $21,227 |
|---|
| 11/30/2021 | $23,264 | $23,298 | $18,581 | $21,080 |
|---|
| 12/31/2021 | $23,199 | $23,380 | $19,340 | $22,025 |
|---|
| 1/31/2022 | $19,992 | $20,363 | $17,915 | $20,885 |
|---|
| 2/28/2022 | $19,754 | $20,115 | $17,786 | $20,260 |
|---|
| 3/31/2022 | $19,754 | $20,438 | $18,241 | $21,012 |
|---|
| 4/30/2022 | $17,667 | $18,137 | $16,836 | $19,180 |
|---|
| 5/31/2022 | $16,886 | $17,435 | $16,850 | $19,215 |
|---|
| 6/30/2022 | $16,020 | $16,132 | $15,168 | $17,629 |
|---|
| 7/31/2022 | $17,847 | $18,106 | $16,665 | $19,254 |
|---|
| 8/31/2022 | $17,074 | $17,513 | $16,142 | $18,469 |
|---|
| 9/30/2022 | $15,565 | $16,026 | $14,646 | $16,768 |
|---|
| 10/31/2022 | $16,439 | $17,286 | $15,946 | $18,126 |
|---|
| 11/30/2022 | $16,988 | $18,226 | $16,905 | $19,139 |
|---|
| 12/31/2022 | $15,688 | $17,132 | $15,991 | $18,036 |
|---|
| 1/31/2023 | $16,641 | $18,627 | $17,319 | $19,169 |
|---|
| 2/28/2023 | $16,222 | $18,443 | $16,899 | $18,702 |
|---|
| 3/31/2023 | $16,771 | $18,698 | $16,639 | $19,388 |
|---|
| 4/30/2023 | $16,229 | $18,427 | $16,552 | $19,691 |
|---|
| 5/31/2023 | $16,576 | $18,438 | $16,089 | $19,777 |
|---|
| 6/30/2023 | $17,537 | $19,863 | $17,432 | $21,083 |
|---|
| 7/31/2023 | $17,905 | $20,464 | $18,123 | $21,761 |
|---|
| 8/31/2023 | $17,016 | $19,790 | $17,495 | $21,414 |
|---|
| 9/30/2023 | $15,890 | $18,826 | $16,616 | $20,393 |
|---|
| 10/31/2023 | $14,734 | $17,865 | $15,786 | $19,964 |
|---|
| 11/30/2023 | $16,619 | $20,044 | $17,401 | $21,788 |
|---|
| 12/31/2023 | $17,443 | $21,564 | $18,746 | $22,777 |
|---|
| 1/31/2024 | $18,006 | $21,448 | $18,479 | $23,160 |
|---|
| 2/29/2024 | $19,783 | $23,060 | $19,511 | $24,397 |
|---|
| 3/31/2024 | $20,137 | $23,612 | $20,358 | $25,182 |
|---|
| 4/30/2024 | $18,938 | $22,240 | $19,258 | $24,153 |
|---|
| 5/31/2024 | $19,248 | $22,478 | $19,807 | $25,351 |
|---|
| 6/30/2024 | $19,674 | $22,853 | $19,676 | $26,260 |
|---|
| 7/31/2024 | $19,039 | $22,992 | $20,603 | $26,580 |
|---|
| 8/31/2024 | $19,848 | $23,563 | $21,021 | $27,225 |
|---|
| 9/30/2024 | $20,823 | $24,348 | $21,489 | $27,806 |
|---|
| 10/31/2024 | $21,509 | $24,773 | $21,373 | $27,554 |
|---|
| 11/30/2024 | $24,506 | $28,075 | $23,259 | $29,172 |
|---|
The Fund’s benchmarks are unmanaged indices used as a general measure of market performance. Calculations assume the reinvestment of dividends and capital gains.
Average Annual Total Returns (%)
| AATR | 1 Year | 5 Years | Since Inception 4/4/17 |
|---|
| Class F3 at NAV | 47.46% | 10.03% | 12.42% |
|---|
| Russell Mid Cap Growth Index | 40.07% | 13.18% | 14.43% |
|---|
| Russell Mid Cap Index | 33.66% | 12.05% | 11.65% |
|---|
S&P 500 IndexFootnote Reference* | 33.89% | 15.77% | 15.01% |
|---|
| Footnote | Description |
Footnote* | The Fund has adopted the S&P 500 Index as its broad-based securities market index. |
The Fund's past performance is no guarantee of future results. The returns do not reflect the deduction of taxes that a shareholder would pay on Fund distributions or redemption of Fund shares.
(as of November 30, 2024)
| Total Net Assets | $565,343,784 |
|---|
| # of Portfolio Holdings | 69 |
|---|
| Portfolio Turnover Rate | 117% |
|---|
| Total Advisory Fees Paid | $2,165,888 |
|---|
What did the Fund invest in?
(as of November 30, 2024)
Portfolio Holdings Presented by SectorFootnote Reference* | % Footnote Reference** |
|---|
| Communication Services | 10.01% |
| Consumer Discretionary | 15.72% |
| Consumer Staples | 1.84% |
| Financials | 12.46% |
| Health Care | 13.70% |
| Industrials | 18.74% |
| Information Technology | 25.52% |
| Repurchase Agreements | 2.01% |
| Total | 100.00% |
| Footnote | Description |
Footnote* | A sector may comprise several industries. |
Footnote** | Represents percent of total investments, which excludes derivatives. |
There were no material fund changes during the period.
Where can I find additional information about the Fund?
For additional information about the Fund, including its Prospectus, Statement of Additional Information, financial statements, holdings and proxy information, please visit lordabbett.com/FundDocuments.
The Fund has adopted a policy that allows it to send only one copy of the Fund's prospectus, proxy material, annual report and semiannual report (or related notice of internet availability of annual report and semiannual report) to certain shareholders residing at the same "household." This reduces Fund expenses, which benefits you and other shareholders.If you need additional copies or do not want your mailings to be "householded," please call Lord Abbett at 888-522-2388.
Lord Abbett Growth Opportunities Fund
Annual Shareholder Report
November 30, 2024
lordabbett.com/FundDocuments
TSR-A-8957-F3
01/25
Lord Abbett Growth Opportunities Fund
Annual Shareholder Report
November 30, 2024
lordabbett.com/FundDocuments
This annual shareholder report contains important information about the Lord Abbett Growth Opportunities Fund for the period of December 1, 2023 to November 30, 2024, as well as certain changes to the Fund. You can find additional information about the Fund at lordabbett.com/FundDocuments. You can also request this information by contacting us at 888-522-2388.
What were the Fund costs for the last year?
(based on a hypothetical $10,000 investment)
| Class Name | Costs of a $10,000 investment | Costs paid as a percentage of a $10,000 investment |
|---|
| Class I | $88 | 0.71% |
|---|
How did the Fund perform last year and what affected its performance?
For the fiscal year ended November 30, 2024, the Fund returned 47.34%, reflecting performance at the net asset value (NAV) of Class I shares, with all distributions reinvested, compared to the 40.07% return of a securities market index with investment characteristics similar to those of the Fund, the Russell Mid Cap Growth Index. The Fund's broad-based securities market index, the S&P 500 Index, returned 33.89% over the same period.
Positive factors for the markets included momentum around the soft-landing narrative, which was supported by signs of a cooling labor market and a slowing economy. This led to the U.S. Federal Reserve lowering its policy rate by 50 basis points in September and 25 basis points in November. There were also increased expectations for further rate cuts in 2024. Mixed economic data, including softer consumer price index reports and fluctuating job market indicators, contributed to these rate cut expectations, and also sparked recession fears. However, these factors were mostly balanced by strong consumer spending and retail sales. Against this backdrop, global equity markets delivered strong return.
Top contributors to performance: Security selection within the Health Care sector contributed to relative performance, led by an overweight allocation to Natera, Inc. Security selection within the Industrials sector also contributed to relative performance, led by an overweight allocation to Vertiv Holdings Co.
Top detractors from performance: Security selection within the Financials sector detracted from relative performance, led by an overweight allocation to Coinbase Global, Inc. Within the Communication Services sector, an overweight allocation to Roku, Inc., also detracted from relative performance.
Total Return Based on $10,000 Investment
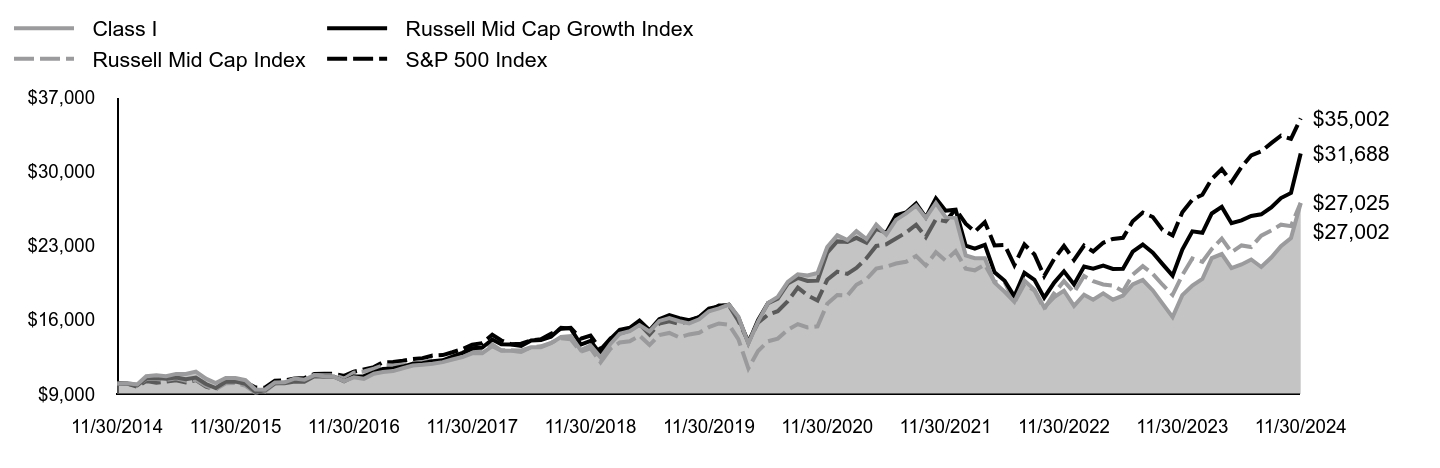
| Class I | Russell Mid Cap Growth Index | Russell Mid Cap Index | S&P 500 Index |
|---|
| 11/30/2014 | $10,000 | $10,000 | $10,000 | $10,000 |
|---|
| 12/31/2014 | $10,009 | $9,972 | $10,021 | $9,975 |
|---|
| 1/31/2015 | $9,898 | $9,804 | $9,865 | $9,675 |
|---|
| 2/28/2015 | $10,676 | $10,478 | $10,411 | $10,231 |
|---|
| 3/31/2015 | $10,778 | $10,508 | $10,417 | $10,070 |
|---|
| 4/30/2015 | $10,685 | $10,434 | $10,323 | $10,166 |
|---|
| 5/31/2015 | $10,894 | $10,558 | $10,474 | $10,297 |
|---|
| 6/30/2015 | $10,885 | $10,388 | $10,257 | $10,098 |
|---|
| 7/31/2015 | $11,116 | $10,556 | $10,333 | $10,309 |
|---|
| 8/31/2015 | $10,445 | $9,942 | $9,788 | $9,687 |
|---|
| 9/30/2015 | $10,040 | $9,558 | $9,436 | $9,448 |
|---|
| 10/31/2015 | $10,516 | $10,160 | $10,021 | $10,244 |
|---|
| 11/30/2015 | $10,507 | $10,182 | $10,046 | $10,275 |
|---|
| 12/31/2015 | $10,302 | $9,952 | $9,777 | $10,113 |
|---|
| 1/31/2016 | $9,426 | $9,198 | $9,136 | $9,611 |
|---|
| 2/29/2016 | $9,411 | $9,343 | $9,239 | $9,598 |
|---|
| 3/31/2016 | $10,092 | $10,009 | $9,996 | $10,249 |
|---|
| 4/30/2016 | $10,107 | $10,003 | $10,102 | $10,289 |
|---|
| 5/31/2016 | $10,452 | $10,167 | $10,268 | $10,474 |
|---|
| 6/30/2016 | $10,347 | $10,166 | $10,314 | $10,501 |
|---|
| 7/31/2016 | $10,782 | $10,669 | $10,785 | $10,888 |
|---|
| 8/31/2016 | $10,677 | $10,638 | $10,758 | $10,903 |
|---|
| 9/30/2016 | $10,622 | $10,633 | $10,780 | $10,905 |
|---|
| 10/31/2016 | $10,222 | $10,201 | $10,438 | $10,706 |
|---|
| 11/30/2016 | $10,572 | $10,644 | $11,001 | $11,103 |
|---|
| 12/31/2016 | $10,433 | $10,681 | $11,126 | $11,322 |
|---|
| 1/31/2017 | $10,907 | $11,037 | $11,394 | $11,537 |
|---|
| 2/28/2017 | $11,071 | $11,355 | $11,717 | $11,995 |
|---|
| 3/31/2017 | $11,164 | $11,417 | $11,698 | $12,009 |
|---|
| 4/30/2017 | $11,432 | $11,587 | $11,789 | $12,132 |
|---|
| 5/31/2017 | $11,684 | $11,864 | $11,896 | $12,303 |
|---|
| 6/30/2017 | $11,751 | $11,899 | $12,015 | $12,380 |
|---|
| 7/31/2017 | $11,859 | $12,097 | $12,191 | $12,635 |
|---|
| 8/31/2017 | $12,003 | $12,183 | $12,097 | $12,673 |
|---|
| 9/30/2017 | $12,255 | $12,527 | $12,432 | $12,935 |
|---|
| 10/31/2017 | $12,487 | $12,878 | $12,639 | $13,237 |
|---|
| 11/30/2017 | $12,842 | $13,308 | $13,065 | $13,642 |
|---|
| 12/31/2017 | $12,853 | $13,380 | $13,186 | $13,794 |
|---|
| 1/31/2018 | $13,509 | $14,137 | $13,682 | $14,584 |
|---|
| 2/28/2018 | $13,081 | $13,693 | $13,117 | $14,046 |
|---|
| 3/31/2018 | $13,087 | $13,671 | $13,125 | $13,689 |
|---|
| 4/30/2018 | $12,970 | $13,542 | $13,105 | $13,742 |
|---|
| 5/31/2018 | $13,409 | $14,048 | $13,403 | $14,073 |
|---|
| 6/30/2018 | $13,420 | $14,103 | $13,495 | $14,160 |
|---|
| 7/31/2018 | $13,782 | $14,405 | $13,832 | $14,686 |
|---|
| 8/31/2018 | $14,371 | $15,236 | $14,261 | $15,165 |
|---|
| 9/30/2018 | $14,454 | $15,171 | $14,170 | $15,251 |
|---|
| 10/31/2018 | $13,137 | $13,668 | $12,993 | $14,209 |
|---|
| 11/30/2018 | $13,571 | $14,016 | $13,312 | $14,498 |
|---|
| 12/31/2018 | $12,451 | $12,744 | $11,992 | $13,189 |
|---|
| 1/31/2019 | $13,745 | $14,209 | $13,285 | $14,246 |
|---|
| 2/28/2019 | $14,670 | $15,042 | $13,856 | $14,704 |
|---|
| 3/31/2019 | $14,934 | $15,245 | $13,975 | $14,989 |
|---|
| 4/30/2019 | $15,502 | $15,930 | $14,506 | $15,596 |
|---|
| 5/31/2019 | $14,910 | $15,014 | $13,616 | $14,605 |
|---|
| 6/30/2019 | $15,894 | $16,068 | $14,552 | $15,635 |
|---|
| 7/31/2019 | $16,152 | $16,444 | $14,759 | $15,859 |
|---|
| 8/31/2019 | $15,865 | $16,144 | $14,339 | $15,608 |
|---|
| 9/30/2019 | $15,660 | $15,960 | $14,621 | $15,900 |
|---|
| 10/31/2019 | $16,052 | $16,256 | $14,775 | $16,245 |
|---|
| 11/30/2019 | $16,802 | $17,065 | $15,303 | $16,834 |
|---|
| 12/31/2019 | $17,070 | $17,265 | $15,654 | $17,342 |
|---|
| 1/31/2020 | $17,420 | $17,426 | $15,529 | $17,335 |
|---|
| 2/29/2020 | $16,314 | $16,225 | $14,180 | $15,908 |
|---|
| 3/31/2020 | $13,770 | $13,805 | $11,416 | $13,944 |
|---|
| 4/30/2020 | $15,829 | $15,967 | $13,056 | $15,731 |
|---|
| 5/31/2020 | $17,592 | $17,570 | $13,974 | $16,480 |
|---|
| 6/30/2020 | $18,164 | $17,982 | $14,226 | $16,808 |
|---|
| 7/31/2020 | $19,571 | $19,419 | $15,061 | $17,756 |
|---|
| 8/31/2020 | $20,290 | $19,947 | $15,590 | $19,032 |
|---|
| 9/30/2020 | $20,179 | $19,668 | $15,287 | $18,309 |
|---|
| 10/31/2020 | $20,413 | $19,692 | $15,384 | $17,822 |
|---|
| 11/30/2020 | $22,864 | $22,337 | $17,511 | $19,773 |
|---|
| 12/31/2020 | $23,974 | $23,409 | $18,331 | $20,533 |
|---|
| 1/31/2021 | $23,523 | $23,330 | $18,283 | $20,326 |
|---|
| 2/28/2021 | $24,363 | $23,729 | $19,301 | $20,886 |
|---|
| 3/31/2021 | $23,613 | $23,276 | $19,823 | $21,801 |
|---|
| 4/30/2021 | $24,981 | $24,584 | $20,833 | $22,964 |
|---|
| 5/31/2021 | $24,030 | $24,208 | $21,001 | $23,125 |
|---|
| 6/30/2021 | $25,425 | $25,853 | $21,310 | $23,665 |
|---|
| 7/31/2021 | $26,043 | $26,120 | $21,474 | $24,227 |
|---|
| 8/31/2021 | $26,772 | $26,963 | $22,020 | $24,963 |
|---|
| 9/30/2021 | $25,606 | $25,657 | $21,112 | $23,802 |
|---|
| 10/31/2021 | $27,015 | $27,456 | $22,368 | $25,470 |
|---|
| 11/30/2021 | $25,689 | $26,296 | $21,589 | $25,294 |
|---|
| 12/31/2021 | $25,617 | $26,388 | $22,471 | $26,427 |
|---|
| 1/31/2022 | $22,080 | $22,983 | $20,816 | $25,060 |
|---|
| 2/28/2022 | $21,814 | $22,704 | $20,666 | $24,309 |
|---|
| 3/31/2022 | $21,806 | $23,068 | $21,195 | $25,212 |
|---|
| 4/30/2022 | $19,502 | $20,471 | $19,562 | $23,013 |
|---|
| 5/31/2022 | $18,640 | $19,678 | $19,578 | $23,056 |
|---|
| 6/30/2022 | $17,690 | $18,207 | $17,624 | $21,152 |
|---|
| 7/31/2022 | $19,696 | $20,436 | $19,364 | $23,103 |
|---|
| 8/31/2022 | $18,842 | $19,766 | $18,756 | $22,161 |
|---|
| 9/30/2022 | $17,174 | $18,089 | $17,018 | $20,120 |
|---|
| 10/31/2022 | $18,141 | $19,510 | $18,528 | $21,749 |
|---|
| 11/30/2022 | $18,745 | $20,572 | $19,642 | $22,964 |
|---|
| 12/31/2022 | $17,311 | $19,337 | $18,580 | $21,641 |
|---|
| 1/31/2023 | $18,359 | $21,024 | $20,123 | $23,001 |
|---|
| 2/28/2023 | $17,899 | $20,817 | $19,635 | $22,440 |
|---|
| 3/31/2023 | $18,495 | $21,104 | $19,334 | $23,263 |
|---|
| 4/30/2023 | $17,899 | $20,798 | $19,232 | $23,626 |
|---|
| 5/31/2023 | $18,286 | $20,811 | $18,694 | $23,729 |
|---|
| 6/30/2023 | $19,341 | $22,419 | $20,254 | $25,297 |
|---|
| 7/31/2023 | $19,752 | $23,098 | $21,058 | $26,110 |
|---|
| 8/31/2023 | $18,769 | $22,336 | $20,327 | $25,694 |
|---|
| 9/30/2023 | $17,521 | $21,248 | $19,306 | $24,469 |
|---|
| 10/31/2023 | $16,248 | $20,164 | $18,342 | $23,955 |
|---|
| 11/30/2023 | $18,326 | $22,624 | $20,218 | $26,142 |
|---|
| 12/31/2023 | $19,237 | $24,339 | $21,781 | $27,330 |
|---|
| 1/31/2024 | $19,849 | $24,208 | $21,471 | $27,789 |
|---|
| 2/29/2024 | $21,814 | $26,028 | $22,670 | $29,273 |
|---|
| 3/31/2024 | $22,201 | $26,650 | $23,654 | $30,215 |
|---|
| 4/30/2024 | $20,872 | $25,102 | $22,376 | $28,981 |
|---|
| 5/31/2024 | $21,218 | $25,370 | $23,015 | $30,418 |
|---|
| 6/30/2024 | $21,685 | $25,794 | $22,862 | $31,509 |
|---|
| 7/31/2024 | $20,977 | $25,950 | $23,940 | $31,893 |
|---|
| 8/31/2024 | $21,871 | $26,595 | $24,425 | $32,666 |
|---|
| 9/30/2024 | $22,942 | $27,481 | $24,968 | $33,364 |
|---|
| 10/31/2024 | $23,699 | $27,961 | $24,834 | $33,061 |
|---|
| 11/30/2024 | $27,002 | $31,688 | $27,025 | $35,002 |
|---|
The Fund’s benchmarks are unmanaged indices used as a general measure of market performance. Calculations assume the reinvestment of dividends and capital gains.
Average Annual Total Returns (%)
| AATR | 1 Year | 5 Years | 10 Years |
|---|
| Class I at NAV | 47.34% | 9.95% | 10.44% |
|---|
| Russell Mid Cap Growth Index | 40.07% | 13.18% | 12.22% |
|---|
| Russell Mid Cap Index | 33.66% | 12.05% | 10.45% |
|---|
S&P 500 IndexFootnote Reference* | 33.89% | 15.77% | 13.35% |
|---|
| Footnote | Description |
Footnote* | The Fund has adopted the S&P 500 Index as its broad-based securities market index. |
The Fund's past performance is no guarantee of future results. The returns do not reflect the deduction of taxes that a shareholder would pay on Fund distributions or redemption of Fund shares.
(as of November 30, 2024)
| Total Net Assets | $565,343,784 |
|---|
| # of Portfolio Holdings | 69 |
|---|
| Portfolio Turnover Rate | 117% |
|---|
| Total Advisory Fees Paid | $2,165,888 |
|---|
What did the Fund invest in?
(as of November 30, 2024)
Portfolio Holdings Presented by SectorFootnote Reference* | % Footnote Reference** |
|---|
| Communication Services | 10.01% |
| Consumer Discretionary | 15.72% |
| Consumer Staples | 1.84% |
| Financials | 12.46% |
| Health Care | 13.70% |
| Industrials | 18.74% |
| Information Technology | 25.52% |
| Repurchase Agreements | 2.01% |
| Total | 100.00% |
| Footnote | Description |
Footnote* | A sector may comprise several industries. |
Footnote** | Represents percent of total investments, which excludes derivatives. |
There were no material fund changes during the period.
Where can I find additional information about the Fund?
For additional information about the Fund, including its Prospectus, Statement of Additional Information, financial statements, holdings and proxy information, please visit lordabbett.com/FundDocuments.
The Fund has adopted a policy that allows it to send only one copy of the Fund's prospectus, proxy material, annual report and semiannual report (or related notice of internet availability of annual report and semiannual report) to certain shareholders residing at the same "household." This reduces Fund expenses, which benefits you and other shareholders.If you need additional copies or do not want your mailings to be "householded," please call Lord Abbett at 888-522-2388.
Lord Abbett Growth Opportunities Fund
Annual Shareholder Report
November 30, 2024
lordabbett.com/FundDocuments
TSR-A-692-I
01/25
Lord Abbett Growth Opportunities Fund
Annual Shareholder Report
November 30, 2024
lordabbett.com/FundDocuments
This annual shareholder report contains important information about the Lord Abbett Growth Opportunities Fund for the period of December 1, 2023 to November 30, 2024, as well as certain changes to the Fund. You can find additional information about the Fund at lordabbett.com/FundDocuments. You can also request this information by contacting us at 888-522-2388.
What were the Fund costs for the last year?
(based on a hypothetical $10,000 investment)
| Class Name | Costs of a $10,000 investment | Costs paid as a percentage of a $10,000 investment |
|---|
| Class P | $143 | 1.16% |
|---|
How did the Fund perform last year and what affected its performance?
For the fiscal year ended November 30, 2024, the Fund returned 46.69%, reflecting performance at the net asset value (NAV) of Class P shares, with all distributions reinvested, compared to the 40.07% return of a securities market index with investment characteristics similar to those of the Fund, the Russell Mid Cap Growth Index. The Fund's broad-based securities market index, the S&P 500 Index, returned 33.89% over the same period.
Positive factors for the markets included momentum around the soft-landing narrative, which was supported by signs of a cooling labor market and a slowing economy. This led to the U.S. Federal Reserve lowering its policy rate by 50 basis points in September and 25 basis points in November. There were also increased expectations for further rate cuts in 2024. Mixed economic data, including softer consumer price index reports and fluctuating job market indicators, contributed to these rate cut expectations, and also sparked recession fears. However, these factors were mostly balanced by strong consumer spending and retail sales. Against this backdrop, global equity markets delivered strong return.
Top contributors to performance: Security selection within the Health Care sector contributed to relative performance, led by an overweight allocation to Natera, Inc. Security selection within the Industrials sector also contributed to relative performance, led by an overweight allocation to Vertiv Holdings Co.
Top detractors from performance: Security selection within the Financials sector detracted from relative performance, led by an overweight allocation to Coinbase Global, Inc. Within the Communication Services sector, an overweight allocation to Roku, Inc., also detracted from relative performance.
Total Return Based on $10,000 Investment
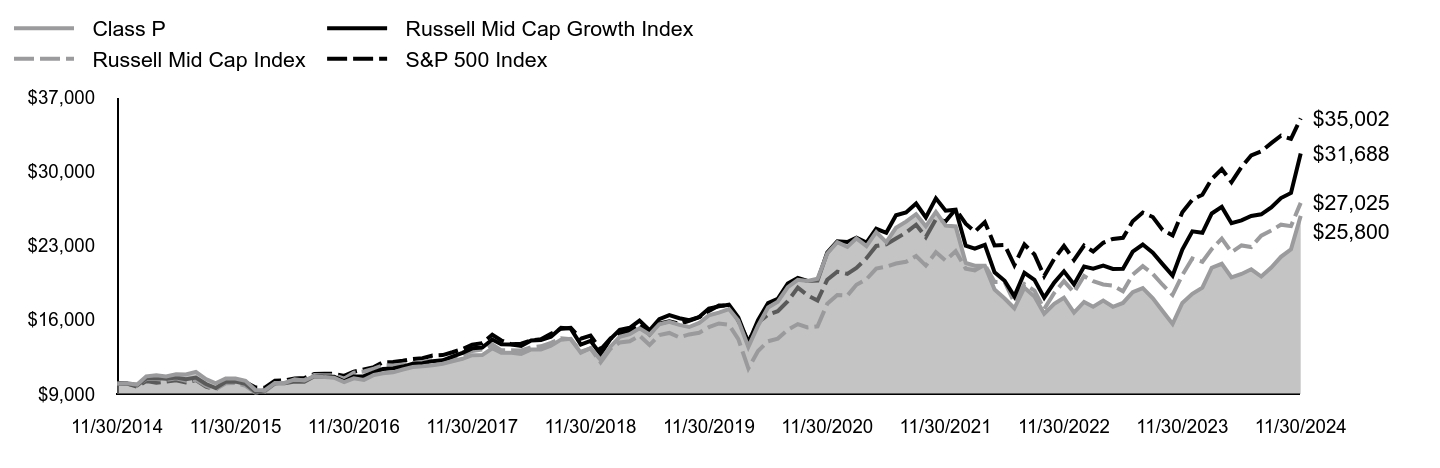
| Class P | Russell Mid Cap Growth Index | Russell Mid Cap Index | S&P 500 Index |
|---|
| 11/30/2014 | $10,000 | $10,000 | $10,000 | $10,000 |
|---|
| 12/31/2014 | $10,001 | $9,972 | $10,021 | $9,975 |
|---|
| 1/31/2015 | $9,887 | $9,804 | $9,865 | $9,675 |
|---|
| 2/28/2015 | $10,663 | $10,478 | $10,411 | $10,231 |
|---|
| 3/31/2015 | $10,757 | $10,508 | $10,417 | $10,070 |
|---|
| 4/30/2015 | $10,663 | $10,434 | $10,323 | $10,166 |
|---|
| 5/31/2015 | $10,866 | $10,558 | $10,474 | $10,297 |
|---|
| 6/30/2015 | $10,851 | $10,388 | $10,257 | $10,098 |
|---|
| 7/31/2015 | $11,083 | $10,556 | $10,333 | $10,309 |
|---|
| 8/31/2015 | $10,406 | $9,942 | $9,788 | $9,687 |
|---|
| 9/30/2015 | $10,001 | $9,558 | $9,436 | $9,448 |
|---|
| 10/31/2015 | $10,470 | $10,160 | $10,021 | $10,244 |
|---|
| 11/30/2015 | $10,456 | $10,182 | $10,046 | $10,275 |
|---|
| 12/31/2015 | $10,247 | $9,952 | $9,777 | $10,113 |
|---|
| 1/31/2016 | $9,377 | $9,198 | $9,136 | $9,611 |
|---|
| 2/29/2016 | $9,355 | $9,343 | $9,239 | $9,598 |
|---|
| 3/31/2016 | $10,027 | $10,009 | $9,996 | $10,249 |
|---|
| 4/30/2016 | $10,038 | $10,003 | $10,102 | $10,289 |
|---|
| 5/31/2016 | $10,377 | $10,167 | $10,268 | $10,474 |
|---|
| 6/30/2016 | $10,270 | $10,166 | $10,314 | $10,501 |
|---|
| 7/31/2016 | $10,699 | $10,669 | $10,785 | $10,888 |
|---|
| 8/31/2016 | $10,592 | $10,638 | $10,758 | $10,903 |
|---|
| 9/30/2016 | $10,535 | $10,633 | $10,780 | $10,905 |
|---|
| 10/31/2016 | $10,128 | $10,201 | $10,438 | $10,706 |
|---|
| 11/30/2016 | $10,473 | $10,644 | $11,001 | $11,103 |
|---|
| 12/31/2016 | $10,333 | $10,681 | $11,126 | $11,322 |
|---|
| 1/31/2017 | $10,794 | $11,037 | $11,394 | $11,537 |
|---|
| 2/28/2017 | $10,957 | $11,355 | $11,717 | $11,995 |
|---|
| 3/31/2017 | $11,044 | $11,417 | $11,698 | $12,009 |
|---|
| 4/30/2017 | $11,307 | $11,587 | $11,789 | $12,132 |
|---|
| 5/31/2017 | $11,546 | $11,864 | $11,896 | $12,303 |
|---|
| 6/30/2017 | $11,610 | $11,899 | $12,015 | $12,380 |
|---|
| 7/31/2017 | $11,715 | $12,097 | $12,191 | $12,635 |
|---|
| 8/31/2017 | $11,849 | $12,183 | $12,097 | $12,673 |
|---|
| 9/30/2017 | $12,094 | $12,527 | $12,432 | $12,935 |
|---|
| 10/31/2017 | $12,322 | $12,878 | $12,639 | $13,237 |
|---|
| 11/30/2017 | $12,666 | $13,308 | $13,065 | $13,642 |
|---|
| 12/31/2017 | $12,673 | $13,380 | $13,186 | $13,794 |
|---|
| 1/31/2018 | $13,310 | $14,137 | $13,682 | $14,584 |
|---|
| 2/28/2018 | $12,883 | $13,693 | $13,117 | $14,046 |
|---|
| 3/31/2018 | $12,883 | $13,671 | $13,125 | $13,689 |
|---|
| 4/30/2018 | $12,768 | $13,542 | $13,105 | $13,742 |
|---|
| 5/31/2018 | $13,195 | $14,048 | $13,403 | $14,073 |
|---|
| 6/30/2018 | $13,202 | $14,103 | $13,495 | $14,160 |
|---|
| 7/31/2018 | $13,546 | $14,405 | $13,832 | $14,686 |
|---|
| 8/31/2018 | $14,126 | $15,236 | $14,261 | $15,165 |
|---|
| 9/30/2018 | $14,202 | $15,171 | $14,170 | $15,251 |
|---|
| 10/31/2018 | $12,902 | $13,668 | $12,993 | $14,209 |
|---|
| 11/30/2018 | $13,323 | $14,016 | $13,312 | $14,498 |
|---|
| 12/31/2018 | $12,217 | $12,744 | $11,992 | $13,189 |
|---|
| 1/31/2019 | $13,484 | $14,209 | $13,285 | $14,246 |
|---|
| 2/28/2019 | $14,385 | $15,042 | $13,856 | $14,704 |
|---|
| 3/31/2019 | $14,636 | $15,245 | $13,975 | $14,989 |
|---|
| 4/30/2019 | $15,191 | $15,930 | $14,506 | $15,596 |
|---|
| 5/31/2019 | $14,609 | $15,014 | $13,616 | $14,605 |
|---|
| 6/30/2019 | $15,564 | $16,068 | $14,552 | $15,635 |
|---|
| 7/31/2019 | $15,815 | $16,444 | $14,759 | $15,859 |
|---|
| 8/31/2019 | $15,523 | $16,144 | $14,339 | $15,608 |
|---|
| 9/30/2019 | $15,320 | $15,960 | $14,621 | $15,900 |
|---|
| 10/31/2019 | $15,700 | $16,256 | $14,775 | $16,245 |
|---|
| 11/30/2019 | $16,418 | $17,065 | $15,303 | $16,834 |
|---|
| 12/31/2019 | $16,681 | $17,265 | $15,654 | $17,342 |
|---|
| 1/31/2020 | $17,011 | $17,426 | $15,529 | $17,335 |
|---|
| 2/29/2020 | $15,927 | $16,225 | $14,180 | $15,908 |
|---|
| 3/31/2020 | $13,438 | $13,805 | $11,416 | $13,944 |
|---|
| 4/30/2020 | $15,439 | $15,967 | $13,056 | $15,731 |
|---|
| 5/31/2020 | $17,154 | $17,570 | $13,974 | $16,480 |
|---|
| 6/30/2020 | $17,706 | $17,982 | $14,226 | $16,808 |
|---|
| 7/31/2020 | $19,070 | $19,419 | $15,061 | $17,756 |
|---|
| 8/31/2020 | $19,766 | $19,947 | $15,590 | $19,032 |
|---|
| 9/30/2020 | $19,651 | $19,668 | $15,287 | $18,309 |
|---|
| 10/31/2020 | $19,866 | $19,692 | $15,384 | $17,822 |
|---|
| 11/30/2020 | $22,248 | $22,337 | $17,511 | $19,773 |
|---|
| 12/31/2020 | $23,312 | $23,409 | $18,331 | $20,533 |
|---|
| 1/31/2021 | $22,871 | $23,330 | $18,283 | $20,326 |
|---|
| 2/28/2021 | $23,679 | $23,729 | $19,301 | $20,886 |
|---|
| 3/31/2021 | $22,946 | $23,276 | $19,823 | $21,801 |
|---|
| 4/30/2021 | $24,261 | $24,584 | $20,833 | $22,964 |
|---|
| 5/31/2021 | $23,329 | $24,208 | $21,001 | $23,125 |
|---|
| 6/30/2021 | $24,677 | $25,853 | $21,310 | $23,665 |
|---|
| 7/31/2021 | $25,260 | $26,120 | $21,474 | $24,227 |
|---|
| 8/31/2021 | $25,959 | $26,963 | $22,020 | $24,963 |
|---|
| 9/30/2021 | $24,819 | $25,657 | $21,112 | $23,802 |
|---|
| 10/31/2021 | $26,176 | $27,456 | $22,368 | $25,470 |
|---|
| 11/30/2021 | $24,885 | $26,296 | $21,589 | $25,294 |
|---|
| 12/31/2021 | $24,806 | $26,388 | $22,471 | $26,427 |
|---|
| 1/31/2022 | $21,373 | $22,983 | $20,816 | $25,060 |
|---|
| 2/28/2022 | $21,102 | $22,704 | $20,666 | $24,309 |
|---|
| 3/31/2022 | $21,092 | $23,068 | $21,195 | $25,212 |
|---|
| 4/30/2022 | $18,853 | $20,471 | $19,562 | $23,013 |
|---|
| 5/31/2022 | $18,010 | $19,678 | $19,578 | $23,056 |
|---|
| 6/30/2022 | $17,086 | $18,207 | $17,624 | $21,152 |
|---|
| 7/31/2022 | $19,024 | $20,436 | $19,364 | $23,103 |
|---|
| 8/31/2022 | $18,191 | $19,766 | $18,756 | $22,161 |
|---|
| 9/30/2022 | $16,574 | $18,089 | $17,018 | $20,120 |
|---|
| 10/31/2022 | $17,498 | $19,510 | $18,528 | $21,749 |
|---|
| 11/30/2022 | $18,080 | $20,572 | $19,642 | $22,964 |
|---|
| 12/31/2022 | $16,685 | $19,337 | $18,580 | $21,641 |
|---|
| 1/31/2023 | $17,689 | $21,024 | $20,123 | $23,001 |
|---|
| 2/28/2023 | $17,237 | $20,817 | $19,635 | $22,440 |
|---|
| 3/31/2023 | $17,809 | $21,104 | $19,334 | $23,263 |
|---|
| 4/30/2023 | $17,227 | $20,798 | $19,232 | $23,626 |
|---|
| 5/31/2023 | $17,588 | $20,811 | $18,694 | $23,729 |
|---|
| 6/30/2023 | $18,602 | $22,419 | $20,254 | $25,297 |
|---|
| 7/31/2023 | $18,984 | $23,098 | $21,058 | $26,110 |
|---|
| 8/31/2023 | $18,030 | $22,336 | $20,327 | $25,694 |
|---|
| 9/30/2023 | $16,835 | $21,248 | $19,306 | $24,469 |
|---|
| 10/31/2023 | $15,601 | $20,164 | $18,342 | $23,955 |
|---|
| 11/30/2023 | $17,588 | $22,624 | $20,218 | $26,142 |
|---|
| 12/31/2023 | $18,452 | $24,339 | $21,781 | $27,330 |
|---|
| 1/31/2024 | $19,034 | $24,208 | $21,471 | $27,789 |
|---|
| 2/29/2024 | $20,911 | $26,028 | $22,670 | $29,273 |
|---|
| 3/31/2024 | $21,283 | $26,650 | $23,654 | $30,215 |
|---|
| 4/30/2024 | $19,998 | $25,102 | $22,376 | $28,981 |
|---|
| 5/31/2024 | $20,319 | $25,370 | $23,015 | $30,418 |
|---|
| 6/30/2024 | $20,761 | $25,794 | $22,862 | $31,509 |
|---|
| 7/31/2024 | $20,078 | $25,950 | $23,940 | $31,893 |
|---|
| 8/31/2024 | $20,921 | $26,595 | $24,425 | $32,666 |
|---|
| 9/30/2024 | $21,935 | $27,481 | $24,968 | $33,364 |
|---|
| 10/31/2024 | $22,648 | $27,961 | $24,834 | $33,061 |
|---|
| 11/30/2024 | $25,800 | $31,688 | $27,025 | $35,002 |
|---|
The Fund’s benchmarks are unmanaged indices used as a general measure of market performance. Calculations assume the reinvestment of dividends and capital gains.
Average Annual Total Returns (%)
| AATR | 1 Year | 5 Years | 10 Years |
|---|
| Class P at NAV | 46.69% | 9.46% | 9.94% |
|---|
| Russell Mid Cap Growth Index | 40.07% | 13.18% | 12.22% |
|---|
| Russell Mid Cap Index | 33.66% | 12.05% | 10.45% |
|---|
S&P 500 IndexFootnote Reference* | 33.89% | 15.77% | 13.35% |
|---|
| Footnote | Description |
Footnote* | The Fund has adopted the S&P 500 Index as its broad-based securities market index. |
The Fund's past performance is no guarantee of future results. The returns do not reflect the deduction of taxes that a shareholder would pay on Fund distributions or redemption of Fund shares.
(as of November 30, 2024)
| Total Net Assets | $565,343,784 |
|---|
| # of Portfolio Holdings | 69 |
|---|
| Portfolio Turnover Rate | 117% |
|---|
| Total Advisory Fees Paid | $2,165,888 |
|---|
What did the Fund invest in?
(as of November 30, 2024)
Portfolio Holdings Presented by SectorFootnote Reference* | % Footnote Reference** |
|---|
| Communication Services | 10.01% |
| Consumer Discretionary | 15.72% |
| Consumer Staples | 1.84% |
| Financials | 12.46% |
| Health Care | 13.70% |
| Industrials | 18.74% |
| Information Technology | 25.52% |
| Repurchase Agreements | 2.01% |
| Total | 100.00% |
| Footnote | Description |
Footnote* | A sector may comprise several industries. |
Footnote** | Represents percent of total investments, which excludes derivatives. |
There were no material fund changes during the period.
Where can I find additional information about the Fund?
For additional information about the Fund, including its Prospectus, Statement of Additional Information, financial statements, holdings and proxy information, please visit lordabbett.com/FundDocuments.
The Fund has adopted a policy that allows it to send only one copy of the Fund's prospectus, proxy material, annual report and semiannual report (or related notice of internet availability of annual report and semiannual report) to certain shareholders residing at the same "household." This reduces Fund expenses, which benefits you and other shareholders.If you need additional copies or do not want your mailings to be "householded," please call Lord Abbett at 888-522-2388.
Lord Abbett Growth Opportunities Fund
Annual Shareholder Report
November 30, 2024
lordabbett.com/FundDocuments
TSR-A-606-P
01/25
Lord Abbett Growth Opportunities Fund
Annual Shareholder Report
November 30, 2024
lordabbett.com/FundDocuments
This annual shareholder report contains important information about the Lord Abbett Growth Opportunities Fund for the period of December 1, 2023 to November 30, 2024, as well as certain changes to the Fund. You can find additional information about the Fund at lordabbett.com/FundDocuments. You can also request this information by contacting us at 888-522-2388.
What were the Fund costs for the last year?
(based on a hypothetical $10,000 investment)
| Class Name | Costs of a $10,000 investment | Costs paid as a percentage of a $10,000 investment |
|---|
| Class R2 | $161 | 1.31% |
|---|
How did the Fund perform last year and what affected its performance?
For the fiscal year ended November 30, 2024, the Fund returned 46.43%, reflecting performance at the net asset value (NAV) of Class R2 shares, with all distributions reinvested, compared to the 40.07% return of a securities market index with investment characteristics similar to those of the Fund, the Russell Mid Cap Growth Index. The Fund's broad-based securities market index, the S&P 500 Index, returned 33.89% over the same period.
Positive factors for the markets included momentum around the soft-landing narrative, which was supported by signs of a cooling labor market and a slowing economy. This led to the U.S. Federal Reserve lowering its policy rate by 50 basis points in September and 25 basis points in November. There were also increased expectations for further rate cuts in 2024. Mixed economic data, including softer consumer price index reports and fluctuating job market indicators, contributed to these rate cut expectations, and also sparked recession fears. However, these factors were mostly balanced by strong consumer spending and retail sales. Against this backdrop, global equity markets delivered strong return.
Top contributors to performance: Security selection within the Health Care sector contributed to relative performance, led by an overweight allocation to Natera, Inc. Security selection within the Industrials sector also contributed to relative performance, led by an overweight allocation to Vertiv Holdings Co.
Top detractors from performance: Security selection within the Financials sector detracted from relative performance, led by an overweight allocation to Coinbase Global, Inc. Within the Communication Services sector, an overweight allocation to Roku, Inc., also detracted from relative performance.
Total Return Based on $10,000 Investment

| Class R2 | Russell Mid Cap Growth Index | Russell Mid Cap Index | S&P 500 Index |
|---|
| 11/30/2014 | $10,000 | $10,000 | $10,000 | $10,000 |
|---|
| 12/31/2014 | $10,001 | $9,972 | $10,021 | $9,975 |
|---|
| 1/31/2015 | $9,885 | $9,804 | $9,865 | $9,675 |
|---|
| 2/28/2015 | $10,657 | $10,478 | $10,411 | $10,231 |
|---|
| 3/31/2015 | $10,753 | $10,508 | $10,417 | $10,070 |
|---|
| 4/30/2015 | $10,652 | $10,434 | $10,323 | $10,166 |
|---|
| 5/31/2015 | $10,858 | $10,558 | $10,474 | $10,297 |
|---|
| 6/30/2015 | $10,843 | $10,388 | $10,257 | $10,098 |
|---|
| 7/31/2015 | $11,068 | $10,556 | $10,333 | $10,309 |
|---|
| 8/31/2015 | $10,397 | $9,942 | $9,788 | $9,687 |
|---|
| 9/30/2015 | $9,986 | $9,558 | $9,436 | $9,448 |
|---|
| 10/31/2015 | $10,452 | $10,160 | $10,021 | $10,244 |
|---|
| 11/30/2015 | $10,442 | $10,182 | $10,046 | $10,275 |
|---|
| 12/31/2015 | $10,231 | $9,952 | $9,777 | $10,113 |
|---|
| 1/31/2016 | $9,358 | $9,198 | $9,136 | $9,611 |
|---|
| 2/29/2016 | $9,335 | $9,343 | $9,239 | $9,598 |
|---|
| 3/31/2016 | $10,007 | $10,009 | $9,996 | $10,249 |
|---|
| 4/30/2016 | $10,018 | $10,003 | $10,102 | $10,289 |
|---|
| 5/31/2016 | $10,357 | $10,167 | $10,268 | $10,474 |
|---|
| 6/30/2016 | $10,248 | $10,166 | $10,314 | $10,501 |
|---|
| 7/31/2016 | $10,673 | $10,669 | $10,785 | $10,888 |
|---|
| 8/31/2016 | $10,564 | $10,638 | $10,758 | $10,903 |
|---|
| 9/30/2016 | $10,506 | $10,633 | $10,780 | $10,905 |
|---|
| 10/31/2016 | $10,099 | $10,201 | $10,438 | $10,706 |
|---|
| 11/30/2016 | $10,443 | $10,644 | $11,001 | $11,103 |
|---|
| 12/31/2016 | $10,301 | $10,681 | $11,126 | $11,322 |
|---|
| 1/31/2017 | $10,758 | $11,037 | $11,394 | $11,537 |
|---|
| 2/28/2017 | $10,918 | $11,355 | $11,717 | $11,995 |
|---|
| 3/31/2017 | $11,001 | $11,417 | $11,698 | $12,009 |
|---|
| 4/30/2017 | $11,268 | $11,587 | $11,789 | $12,132 |
|---|
| 5/31/2017 | $11,505 | $11,864 | $11,896 | $12,303 |
|---|
| 6/30/2017 | $11,564 | $11,899 | $12,015 | $12,380 |
|---|
| 7/31/2017 | $11,665 | $12,097 | $12,191 | $12,635 |
|---|
| 8/31/2017 | $11,801 | $12,183 | $12,097 | $12,673 |
|---|
| 9/30/2017 | $12,045 | $12,527 | $12,432 | $12,935 |
|---|
| 10/31/2017 | $12,264 | $12,878 | $12,639 | $13,237 |
|---|
| 11/30/2017 | $12,608 | $13,308 | $13,065 | $13,642 |
|---|
| 12/31/2017 | $12,615 | $13,380 | $13,186 | $13,794 |
|---|
| 1/31/2018 | $13,245 | $14,137 | $13,682 | $14,584 |
|---|
| 2/28/2018 | $12,823 | $13,693 | $13,117 | $14,046 |
|---|
| 3/31/2018 | $12,823 | $13,671 | $13,125 | $13,689 |
|---|
| 4/30/2018 | $12,700 | $13,542 | $13,105 | $13,742 |
|---|
| 5/31/2018 | $13,122 | $14,048 | $13,403 | $14,073 |
|---|
| 6/30/2018 | $13,128 | $14,103 | $13,495 | $14,160 |
|---|
| 7/31/2018 | $13,473 | $14,405 | $13,832 | $14,686 |
|---|
| 8/31/2018 | $14,044 | $15,236 | $14,261 | $15,165 |
|---|
| 9/30/2018 | $14,116 | $15,171 | $14,170 | $15,251 |
|---|
| 10/31/2018 | $12,830 | $13,668 | $12,993 | $14,209 |
|---|
| 11/30/2018 | $13,239 | $14,016 | $13,312 | $14,498 |
|---|
| 12/31/2018 | $12,144 | $12,744 | $11,992 | $13,189 |
|---|
| 1/31/2019 | $13,396 | $14,209 | $13,285 | $14,246 |
|---|
| 2/28/2019 | $14,295 | $15,042 | $13,856 | $14,704 |
|---|
| 3/31/2019 | $14,544 | $15,245 | $13,975 | $14,989 |
|---|
| 4/30/2019 | $15,090 | $15,930 | $14,506 | $15,596 |
|---|
| 5/31/2019 | $14,510 | $15,014 | $13,616 | $14,605 |
|---|
| 6/30/2019 | $15,457 | $16,068 | $14,552 | $15,635 |
|---|
| 7/31/2019 | $15,699 | $16,444 | $14,759 | $15,859 |
|---|
| 8/31/2019 | $15,409 | $16,144 | $14,339 | $15,608 |
|---|
| 9/30/2019 | $15,208 | $15,960 | $14,621 | $15,900 |
|---|
| 10/31/2019 | $15,582 | $16,256 | $14,775 | $16,245 |
|---|
| 11/30/2019 | $16,301 | $17,065 | $15,303 | $16,834 |
|---|
| 12/31/2019 | $16,555 | $17,265 | $15,654 | $17,342 |
|---|
| 1/31/2020 | $16,885 | $17,426 | $15,529 | $17,335 |
|---|
| 2/29/2020 | $15,799 | $16,225 | $14,180 | $15,908 |
|---|
| 3/31/2020 | $13,328 | $13,805 | $11,416 | $13,944 |
|---|
| 4/30/2020 | $15,315 | $15,967 | $13,056 | $15,731 |
|---|
| 5/31/2020 | $17,017 | $17,570 | $13,974 | $16,480 |
|---|
| 6/30/2020 | $17,560 | $17,982 | $14,226 | $16,808 |
|---|
| 7/31/2020 | $18,909 | $19,419 | $15,061 | $17,756 |
|---|
| 8/31/2020 | $19,592 | $19,947 | $15,590 | $19,032 |
|---|
| 9/30/2020 | $19,482 | $19,668 | $15,287 | $18,309 |
|---|
| 10/31/2020 | $19,694 | $19,692 | $15,384 | $17,822 |
|---|
| 11/30/2020 | $22,049 | $22,337 | $17,511 | $19,773 |
|---|
| 12/31/2020 | $23,101 | $23,409 | $18,331 | $20,533 |
|---|
| 1/31/2021 | $22,656 | $23,330 | $18,283 | $20,326 |
|---|
| 2/28/2021 | $23,460 | $23,729 | $19,301 | $20,886 |
|---|
| 3/31/2021 | $22,724 | $23,276 | $19,823 | $21,801 |
|---|
| 4/30/2021 | $24,033 | $24,584 | $20,833 | $22,964 |
|---|
| 5/31/2021 | $23,101 | $24,208 | $21,001 | $23,125 |
|---|
| 6/30/2021 | $24,435 | $25,853 | $21,310 | $23,665 |
|---|
| 7/31/2021 | $25,008 | $26,120 | $21,474 | $24,227 |
|---|
| 8/31/2021 | $25,701 | $26,963 | $22,020 | $24,963 |
|---|
| 9/30/2021 | $24,563 | $25,657 | $21,112 | $23,802 |
|---|
| 10/31/2021 | $25,906 | $27,456 | $22,368 | $25,470 |
|---|
| 11/30/2021 | $24,623 | $26,296 | $21,589 | $25,294 |
|---|
| 12/31/2021 | $24,542 | $26,388 | $22,471 | $26,427 |
|---|
| 1/31/2022 | $21,141 | $22,983 | $20,816 | $25,060 |
|---|
| 2/28/2022 | $20,881 | $22,704 | $20,666 | $24,309 |
|---|
| 3/31/2022 | $20,860 | $23,068 | $21,195 | $25,212 |
|---|
| 4/30/2022 | $18,645 | $20,471 | $19,562 | $23,013 |
|---|
| 5/31/2022 | $17,813 | $19,678 | $19,578 | $23,056 |
|---|
| 6/30/2022 | $16,898 | $18,207 | $17,624 | $21,152 |
|---|
| 7/31/2022 | $18,801 | $20,436 | $19,364 | $23,103 |
|---|
| 8/31/2022 | $17,980 | $19,766 | $18,756 | $22,161 |
|---|
| 9/30/2022 | $16,389 | $18,089 | $17,018 | $20,120 |
|---|
| 10/31/2022 | $17,294 | $19,510 | $18,528 | $21,749 |
|---|
| 11/30/2022 | $17,865 | $20,572 | $19,642 | $22,964 |
|---|
| 12/31/2022 | $16,482 | $19,337 | $18,580 | $21,641 |
|---|
| 1/31/2023 | $17,481 | $21,024 | $20,123 | $23,001 |
|---|
| 2/28/2023 | $17,023 | $20,817 | $19,635 | $22,440 |
|---|
| 3/31/2023 | $17,595 | $21,104 | $19,334 | $23,263 |
|---|
| 4/30/2023 | $17,013 | $20,798 | $19,232 | $23,626 |
|---|
| 5/31/2023 | $17,366 | $20,811 | $18,694 | $23,729 |
|---|
| 6/30/2023 | $18,365 | $22,419 | $20,254 | $25,297 |
|---|
| 7/31/2023 | $18,739 | $23,098 | $21,058 | $26,110 |
|---|
| 8/31/2023 | $17,803 | $22,336 | $20,327 | $25,694 |
|---|
| 9/30/2023 | $16,607 | $21,248 | $19,306 | $24,469 |
|---|
| 10/31/2023 | $15,391 | $20,164 | $18,342 | $23,955 |
|---|
| 11/30/2023 | $17,356 | $22,624 | $20,218 | $26,142 |
|---|
| 12/31/2023 | $18,209 | $24,339 | $21,781 | $27,330 |
|---|
| 1/31/2024 | $18,781 | $24,208 | $21,471 | $27,789 |
|---|
| 2/29/2024 | $20,621 | $26,028 | $22,670 | $29,273 |
|---|
| 3/31/2024 | $20,985 | $26,650 | $23,654 | $30,215 |
|---|
| 4/30/2024 | $19,717 | $25,102 | $22,376 | $28,981 |
|---|
| 5/31/2024 | $20,028 | $25,370 | $23,015 | $30,418 |
|---|
| 6/30/2024 | $20,465 | $25,794 | $22,862 | $31,509 |
|---|
| 7/31/2024 | $19,789 | $25,950 | $23,940 | $31,893 |
|---|
| 8/31/2024 | $20,621 | $26,595 | $24,425 | $32,666 |
|---|
| 9/30/2024 | $21,620 | $27,481 | $24,968 | $33,364 |
|---|
| 10/31/2024 | $22,316 | $27,961 | $24,834 | $33,061 |
|---|
| 11/30/2024 | $25,415 | $31,688 | $27,025 | $35,002 |
|---|
The Fund’s benchmarks are unmanaged indices used as a general measure of market performance. Calculations assume the reinvestment of dividends and capital gains.
Average Annual Total Returns (%)
| AATR | 1 Year | 5 Years | 10 Years |
|---|
| Class R2 at NAV | 46.43% | 9.29% | 9.78% |
|---|
| Russell Mid Cap Growth Index | 40.07% | 13.18% | 12.22% |
|---|
| Russell Mid Cap Index | 33.66% | 12.05% | 10.45% |
|---|
S&P 500 IndexFootnote Reference* | 33.89% | 15.77% | 13.35% |
|---|
| Footnote | Description |
Footnote* | The Fund has adopted the S&P 500 Index as its broad-based securities market index. |
The Fund's past performance is no guarantee of future results. The returns do not reflect the deduction of taxes that a shareholder would pay on Fund distributions or redemption of Fund shares.
(as of November 30, 2024)
| Total Net Assets | $565,343,784 |
|---|
| # of Portfolio Holdings | 69 |
|---|
| Portfolio Turnover Rate | 117% |
|---|
| Total Advisory Fees Paid | $2,165,888 |
|---|
What did the Fund invest in?
(as of November 30, 2024)
Portfolio Holdings Presented by SectorFootnote Reference* | % Footnote Reference** |
|---|
| Communication Services | 10.01% |
| Consumer Discretionary | 15.72% |
| Consumer Staples | 1.84% |
| Financials | 12.46% |
| Health Care | 13.70% |
| Industrials | 18.74% |
| Information Technology | 25.52% |
| Repurchase Agreements | 2.01% |
| Total | 100.00% |
| Footnote | Description |
Footnote* | A sector may comprise several industries. |
Footnote** | Represents percent of total investments, which excludes derivatives. |
There were no material fund changes during the period.
Where can I find additional information about the Fund?
For additional information about the Fund, including its Prospectus, Statement of Additional Information, financial statements, holdings and proxy information, please visit lordabbett.com/FundDocuments.
The Fund has adopted a policy that allows it to send only one copy of the Fund's prospectus, proxy material, annual report and semiannual report (or related notice of internet availability of annual report and semiannual report) to certain shareholders residing at the same "household." This reduces Fund expenses, which benefits you and other shareholders.If you need additional copies or do not want your mailings to be "householded," please call Lord Abbett at 888-522-2388.
Lord Abbett Growth Opportunities Fund
Annual Shareholder Report
November 30, 2024
lordabbett.com/FundDocuments
TSR-A-1091-R2
01/25
Lord Abbett Growth Opportunities Fund
Annual Shareholder Report
November 30, 2024
lordabbett.com/FundDocuments
This annual shareholder report contains important information about the Lord Abbett Growth Opportunities Fund for the period of December 1, 2023 to November 30, 2024, as well as certain changes to the Fund. You can find additional information about the Fund at lordabbett.com/FundDocuments. You can also request this information by contacting us at 888-522-2388.
What were the Fund costs for the last year?
(based on a hypothetical $10,000 investment)
| Class Name | Costs of a $10,000 investment | Costs paid as a percentage of a $10,000 investment |
|---|
| Class R3 | $149 | 1.21% |
|---|
How did the Fund perform last year and what affected its performance?
For the fiscal year ended November 30, 2024, the Fund returned 46.63%, reflecting performance at the net asset value (NAV) of Class R3 shares, with all distributions reinvested, compared to the 40.07% return of a securities market index with investment characteristics similar to those of the Fund, the Russell Mid Cap Growth Index. The Fund's broad-based securities market index, the S&P 500 Index, returned 33.89% over the same period.
Positive factors for the markets included momentum around the soft-landing narrative, which was supported by signs of a cooling labor market and a slowing economy. This led to the U.S. Federal Reserve lowering its policy rate by 50 basis points in September and 25 basis points in November. There were also increased expectations for further rate cuts in 2024. Mixed economic data, including softer consumer price index reports and fluctuating job market indicators, contributed to these rate cut expectations, and also sparked recession fears. However, these factors were mostly balanced by strong consumer spending and retail sales. Against this backdrop, global equity markets delivered strong return.
Top contributors to performance: Security selection within the Health Care sector contributed to relative performance, led by an overweight allocation to Natera, Inc. Security selection within the Industrials sector also contributed to relative performance, led by an overweight allocation to Vertiv Holdings Co.
Top detractors from performance: Security selection within the Financials sector detracted from relative performance, led by an overweight allocation to Coinbase Global, Inc. Within the Communication Services sector, an overweight allocation to Roku, Inc., also detracted from relative performance.
Total Return Based on $10,000 Investment

| Class R3 | Russell Mid Cap Growth Index | Russell Mid Cap Index | S&P 500 Index |
|---|
| 11/30/2014 | $10,000 | $10,000 | $10,000 | $10,000 |
|---|
| 12/31/2014 | $10,005 | $9,972 | $10,021 | $9,975 |
|---|
| 1/31/2015 | $9,891 | $9,804 | $9,865 | $9,675 |
|---|
| 2/28/2015 | $10,664 | $10,478 | $10,411 | $10,231 |
|---|
| 3/31/2015 | $10,758 | $10,508 | $10,417 | $10,070 |
|---|
| 4/30/2015 | $10,659 | $10,434 | $10,323 | $10,166 |
|---|
| 5/31/2015 | $10,867 | $10,558 | $10,474 | $10,297 |
|---|
| 6/30/2015 | $10,852 | $10,388 | $10,257 | $10,098 |
|---|
| 7/31/2015 | $11,080 | $10,556 | $10,333 | $10,309 |
|---|
| 8/31/2015 | $10,406 | $9,942 | $9,788 | $9,687 |
|---|
| 9/30/2015 | $9,995 | $9,558 | $9,436 | $9,448 |
|---|
| 10/31/2015 | $10,466 | $10,160 | $10,021 | $10,244 |
|---|
| 11/30/2015 | $10,456 | $10,182 | $10,046 | $10,275 |
|---|
| 12/31/2015 | $10,248 | $9,952 | $9,777 | $10,113 |
|---|
| 1/31/2016 | $9,370 | $9,198 | $9,136 | $9,611 |
|---|
| 2/29/2016 | $9,347 | $9,343 | $9,239 | $9,598 |
|---|
| 3/31/2016 | $10,021 | $10,009 | $9,996 | $10,249 |
|---|
| 4/30/2016 | $10,038 | $10,003 | $10,102 | $10,289 |
|---|
| 5/31/2016 | $10,372 | $10,167 | $10,268 | $10,474 |
|---|
| 6/30/2016 | $10,265 | $10,166 | $10,314 | $10,501 |
|---|
| 7/31/2016 | $10,695 | $10,669 | $10,785 | $10,888 |
|---|
| 8/31/2016 | $10,582 | $10,638 | $10,758 | $10,903 |
|---|
| 9/30/2016 | $10,525 | $10,633 | $10,780 | $10,905 |
|---|
| 10/31/2016 | $10,123 | $10,201 | $10,438 | $10,706 |
|---|
| 11/30/2016 | $10,468 | $10,644 | $11,001 | $11,103 |
|---|
| 12/31/2016 | $10,328 | $10,681 | $11,126 | $11,322 |
|---|
| 1/31/2017 | $10,784 | $11,037 | $11,394 | $11,537 |
|---|
| 2/28/2017 | $10,948 | $11,355 | $11,717 | $11,995 |
|---|
| 3/31/2017 | $11,036 | $11,417 | $11,698 | $12,009 |
|---|
| 4/30/2017 | $11,299 | $11,587 | $11,789 | $12,132 |
|---|
| 5/31/2017 | $11,538 | $11,864 | $11,896 | $12,303 |
|---|
| 6/30/2017 | $11,597 | $11,899 | $12,015 | $12,380 |
|---|
| 7/31/2017 | $11,702 | $12,097 | $12,191 | $12,635 |
|---|
| 8/31/2017 | $11,842 | $12,183 | $12,097 | $12,673 |
|---|
| 9/30/2017 | $12,082 | $12,527 | $12,432 | $12,935 |
|---|
| 10/31/2017 | $12,310 | $12,878 | $12,639 | $13,237 |
|---|
| 11/30/2017 | $12,649 | $13,308 | $13,065 | $13,642 |
|---|
| 12/31/2017 | $12,655 | $13,380 | $13,186 | $13,794 |
|---|
| 1/31/2018 | $13,294 | $14,137 | $13,682 | $14,584 |
|---|
| 2/28/2018 | $12,866 | $13,693 | $13,117 | $14,046 |
|---|
| 3/31/2018 | $12,866 | $13,671 | $13,125 | $13,689 |
|---|
| 4/30/2018 | $12,751 | $13,542 | $13,105 | $13,742 |
|---|
| 5/31/2018 | $13,179 | $14,048 | $13,403 | $14,073 |
|---|
| 6/30/2018 | $13,179 | $14,103 | $13,495 | $14,160 |
|---|
| 7/31/2018 | $13,531 | $14,405 | $13,832 | $14,686 |
|---|
| 8/31/2018 | $14,106 | $15,236 | $14,261 | $15,165 |
|---|
| 9/30/2018 | $14,176 | $15,171 | $14,170 | $15,251 |
|---|
| 10/31/2018 | $12,885 | $13,668 | $12,993 | $14,209 |
|---|
| 11/30/2018 | $13,301 | $14,016 | $13,312 | $14,498 |
|---|
| 12/31/2018 | $12,198 | $12,744 | $11,992 | $13,189 |
|---|
| 1/31/2019 | $13,462 | $14,209 | $13,285 | $14,246 |
|---|
| 2/28/2019 | $14,359 | $15,042 | $13,856 | $14,704 |
|---|
| 3/31/2019 | $14,611 | $15,245 | $13,975 | $14,989 |
|---|
| 4/30/2019 | $15,168 | $15,930 | $14,506 | $15,596 |
|---|
| 5/31/2019 | $14,584 | $15,014 | $13,616 | $14,605 |
|---|
| 6/30/2019 | $15,535 | $16,068 | $14,552 | $15,635 |
|---|
| 7/31/2019 | $15,780 | $16,444 | $14,759 | $15,859 |
|---|
| 8/31/2019 | $15,487 | $16,144 | $14,339 | $15,608 |
|---|
| 9/30/2019 | $15,284 | $15,960 | $14,621 | $15,900 |
|---|
| 10/31/2019 | $15,664 | $16,256 | $14,775 | $16,245 |
|---|
| 11/30/2019 | $16,385 | $17,065 | $15,303 | $16,834 |
|---|
| 12/31/2019 | $16,641 | $17,265 | $15,654 | $17,342 |
|---|
| 1/31/2020 | $16,979 | $17,426 | $15,529 | $17,335 |
|---|
| 2/29/2020 | $15,892 | $16,225 | $14,180 | $15,908 |
|---|
| 3/31/2020 | $13,409 | $13,805 | $11,416 | $13,944 |
|---|
| 4/30/2020 | $15,403 | $15,967 | $13,056 | $15,731 |
|---|
| 5/31/2020 | $17,116 | $17,570 | $13,974 | $16,480 |
|---|
| 6/30/2020 | $17,663 | $17,982 | $14,226 | $16,808 |
|---|
| 7/31/2020 | $19,023 | $19,419 | $15,061 | $17,756 |
|---|
| 8/31/2020 | $19,714 | $19,947 | $15,590 | $19,032 |
|---|
| 9/30/2020 | $19,599 | $19,668 | $15,287 | $18,309 |
|---|
| 10/31/2020 | $19,815 | $19,692 | $15,384 | $17,822 |
|---|
| 11/30/2020 | $22,190 | $22,337 | $17,511 | $19,773 |
|---|
| 12/31/2020 | $23,251 | $23,409 | $18,331 | $20,533 |
|---|
| 1/31/2021 | $22,808 | $23,330 | $18,283 | $20,326 |
|---|
| 2/28/2021 | $23,619 | $23,729 | $19,301 | $20,886 |
|---|
| 3/31/2021 | $22,883 | $23,276 | $19,823 | $21,801 |
|---|
| 4/30/2021 | $24,195 | $24,584 | $20,833 | $22,964 |
|---|
| 5/31/2021 | $23,259 | $24,208 | $21,001 | $23,125 |
|---|
| 6/30/2021 | $24,605 | $25,853 | $21,310 | $23,665 |
|---|
| 7/31/2021 | $25,190 | $26,120 | $21,474 | $24,227 |
|---|
| 8/31/2021 | $25,883 | $26,963 | $22,020 | $24,963 |
|---|
| 9/30/2021 | $24,747 | $25,657 | $21,112 | $23,802 |
|---|
| 10/31/2021 | $26,101 | $27,456 | $22,368 | $25,470 |
|---|
| 11/30/2021 | $24,805 | $26,296 | $21,589 | $25,294 |
|---|
| 12/31/2021 | $24,726 | $26,388 | $22,471 | $26,427 |
|---|
| 1/31/2022 | $21,303 | $22,983 | $20,816 | $25,060 |
|---|
| 2/28/2022 | $21,040 | $22,704 | $20,666 | $24,309 |
|---|
| 3/31/2022 | $21,030 | $23,068 | $21,195 | $25,212 |
|---|
| 4/30/2022 | $18,799 | $20,471 | $19,562 | $23,013 |
|---|
| 5/31/2022 | $17,951 | $19,678 | $19,578 | $23,056 |
|---|
| 6/30/2022 | $17,032 | $18,207 | $17,624 | $21,152 |
|---|
| 7/31/2022 | $18,951 | $20,436 | $19,364 | $23,103 |
|---|
| 8/31/2022 | $18,133 | $19,766 | $18,756 | $22,161 |
|---|
| 9/30/2022 | $16,517 | $18,089 | $17,018 | $20,120 |
|---|
| 10/31/2022 | $17,436 | $19,510 | $18,528 | $21,749 |
|---|
| 11/30/2022 | $18,012 | $20,572 | $19,642 | $22,964 |
|---|
| 12/31/2022 | $16,628 | $19,337 | $18,580 | $21,641 |
|---|
| 1/31/2023 | $17,628 | $21,024 | $20,123 | $23,001 |
|---|
| 2/28/2023 | $17,174 | $20,817 | $19,635 | $22,440 |
|---|
| 3/31/2023 | $17,739 | $21,104 | $19,334 | $23,263 |
|---|
| 4/30/2023 | $17,163 | $20,798 | $19,232 | $23,626 |
|---|
| 5/31/2023 | $17,527 | $20,811 | $18,694 | $23,729 |
|---|
| 6/30/2023 | $18,526 | $22,419 | $20,254 | $25,297 |
|---|
| 7/31/2023 | $18,910 | $23,098 | $21,058 | $26,110 |
|---|
| 8/31/2023 | $17,961 | $22,336 | $20,327 | $25,694 |
|---|
| 9/30/2023 | $16,760 | $21,248 | $19,306 | $24,469 |
|---|
| 10/31/2023 | $15,538 | $20,164 | $18,342 | $23,955 |
|---|
| 11/30/2023 | $17,517 | $22,624 | $20,218 | $26,142 |
|---|
| 12/31/2023 | $18,375 | $24,339 | $21,781 | $27,330 |
|---|
| 1/31/2024 | $18,961 | $24,208 | $21,471 | $27,789 |
|---|
| 2/29/2024 | $20,828 | $26,028 | $22,670 | $29,273 |
|---|
| 3/31/2024 | $21,182 | $26,650 | $23,654 | $30,215 |
|---|
| 4/30/2024 | $19,920 | $25,102 | $22,376 | $28,981 |
|---|
| 5/31/2024 | $20,233 | $25,370 | $23,015 | $30,418 |
|---|
| 6/30/2024 | $20,667 | $25,794 | $22,862 | $31,509 |
|---|
| 7/31/2024 | $19,990 | $25,950 | $23,940 | $31,893 |
|---|
| 8/31/2024 | $20,828 | $26,595 | $24,425 | $32,666 |
|---|
| 9/30/2024 | $21,838 | $27,481 | $24,968 | $33,364 |
|---|
| 10/31/2024 | $22,555 | $27,961 | $24,834 | $33,061 |
|---|
| 11/30/2024 | $25,685 | $31,688 | $27,025 | $35,002 |
|---|
The Fund’s benchmarks are unmanaged indices used as a general measure of market performance. Calculations assume the reinvestment of dividends and capital gains.
Average Annual Total Returns (%)
| AATR | 1 Year | 5 Years | 10 Years |
|---|
| Class R3 at NAV | 46.63% | 9.41% | 9.89% |
|---|
| Russell Mid Cap Growth Index | 40.07% | 13.18% | 12.22% |
|---|
| Russell Mid Cap Index | 33.66% | 12.05% | 10.45% |
|---|
S&P 500 IndexFootnote Reference* | 33.89% | 15.77% | 13.35% |
|---|
| Footnote | Description |
Footnote* | The Fund has adopted the S&P 500 Index as its broad-based securities market index. |
The Fund's past performance is no guarantee of future results. The returns do not reflect the deduction of taxes that a shareholder would pay on Fund distributions or redemption of Fund shares.
(as of November 30, 2024)
| Total Net Assets | $565,343,784 |
|---|
| # of Portfolio Holdings | 69 |
|---|
| Portfolio Turnover Rate | 117% |
|---|
| Total Advisory Fees Paid | $2,165,888 |
|---|
What did the Fund invest in?
(as of November 30, 2024)
Portfolio Holdings Presented by SectorFootnote Reference* | % Footnote Reference** |
|---|
| Communication Services | 10.01% |
| Consumer Discretionary | 15.72% |
| Consumer Staples | 1.84% |
| Financials | 12.46% |
| Health Care | 13.70% |
| Industrials | 18.74% |
| Information Technology | 25.52% |
| Repurchase Agreements | 2.01% |
| Total | 100.00% |
| Footnote | Description |
Footnote* | A sector may comprise several industries. |
Footnote** | Represents percent of total investments, which excludes derivatives. |
There were no material fund changes during the period.
Where can I find additional information about the Fund?
For additional information about the Fund, including its Prospectus, Statement of Additional Information, financial statements, holdings and proxy information, please visit lordabbett.com/FundDocuments.
The Fund has adopted a policy that allows it to send only one copy of the Fund's prospectus, proxy material, annual report and semiannual report (or related notice of internet availability of annual report and semiannual report) to certain shareholders residing at the same "household." This reduces Fund expenses, which benefits you and other shareholders.If you need additional copies or do not want your mailings to be "householded," please call Lord Abbett at 888-522-2388.
Lord Abbett Growth Opportunities Fund
Annual Shareholder Report
November 30, 2024
lordabbett.com/FundDocuments
TSR-A-2065-R3
01/25
Lord Abbett Growth Opportunities Fund
Annual Shareholder Report
November 30, 2024
lordabbett.com/FundDocuments
This annual shareholder report contains important information about the Lord Abbett Growth Opportunities Fund for the period of December 1, 2023 to November 30, 2024, as well as certain changes to the Fund. You can find additional information about the Fund at lordabbett.com/FundDocuments. You can also request this information by contacting us at 888-522-2388.
What were the Fund costs for the last year?
(based on a hypothetical $10,000 investment)
| Class Name | Costs of a $10,000 investment | Costs paid as a percentage of a $10,000 investment |
|---|
| Class R4 | $119 | 0.96% |
|---|
How did the Fund perform last year and what affected its performance?
For the fiscal year ended November 30, 2024, the Fund returned 47.02%, reflecting performance at the net asset value (NAV) of Class R4 shares, with all distributions reinvested, compared to the 40.07% return of a securities market index with investment characteristics similar to those of the Fund, the Russell Mid Cap Growth Index. The Fund's broad-based securities market index, the S&P 500 Index, returned 33.89% over the same period.
Positive factors for the markets included momentum around the soft-landing narrative, which was supported by signs of a cooling labor market and a slowing economy. This led to the U.S. Federal Reserve lowering its policy rate by 50 basis points in September and 25 basis points in November. There were also increased expectations for further rate cuts in 2024. Mixed economic data, including softer consumer price index reports and fluctuating job market indicators, contributed to these rate cut expectations, and also sparked recession fears. However, these factors were mostly balanced by strong consumer spending and retail sales. Against this backdrop, global equity markets delivered strong return.
Top contributors to performance: Security selection within the Health Care sector contributed to relative performance, led by an overweight allocation to Natera, Inc. Security selection within the Industrials sector also contributed to relative performance, led by an overweight allocation to Vertiv Holdings Co.
Top detractors from performance: Security selection within the Financials sector detracted from relative performance, led by an overweight allocation to Coinbase Global, Inc. Within the Communication Services sector, an overweight allocation to Roku, Inc., also detracted from relative performance.
Total Return Based on $10,000 Investment
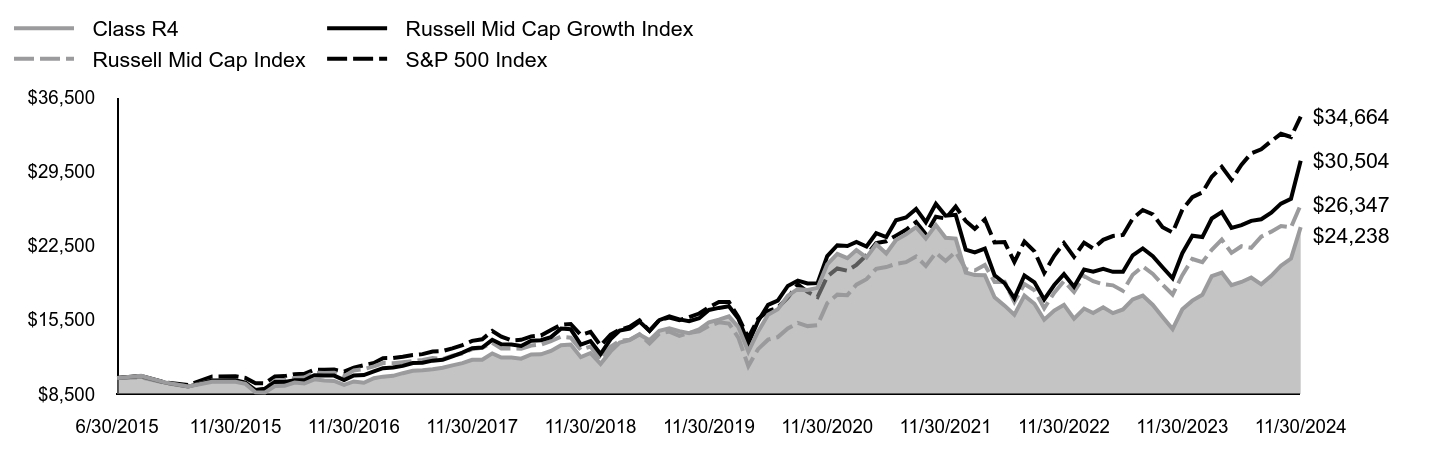
| Class R4 | Russell Mid Cap Growth Index | Russell Mid Cap Index | S&P 500 Index |
|---|
| 6/30/2015 | $10,000 | $10,000 | $10,000 | $10,000 |
|---|
| 7/31/2015 | $10,216 | $10,162 | $10,074 | $10,210 |
|---|
| 8/31/2015 | $9,596 | $9,571 | $9,543 | $9,594 |
|---|
| 9/30/2015 | $9,219 | $9,201 | $9,199 | $9,356 |
|---|
| 10/31/2015 | $9,654 | $9,780 | $9,769 | $10,145 |
|---|
| 11/30/2015 | $9,645 | $9,801 | $9,794 | $10,176 |
|---|
| 12/31/2015 | $9,456 | $9,580 | $9,532 | $10,015 |
|---|
| 1/31/2016 | $8,652 | $8,855 | $8,907 | $9,518 |
|---|
| 2/29/2016 | $8,632 | $8,994 | $9,008 | $9,505 |
|---|
| 3/31/2016 | $9,256 | $9,635 | $9,746 | $10,150 |
|---|
| 4/30/2016 | $9,272 | $9,630 | $9,849 | $10,189 |
|---|
| 5/31/2016 | $9,584 | $9,787 | $10,010 | $10,372 |
|---|
| 6/30/2016 | $9,487 | $9,786 | $10,056 | $10,399 |
|---|
| 7/31/2016 | $9,886 | $10,271 | $10,515 | $10,783 |
|---|
| 8/31/2016 | $9,784 | $10,240 | $10,489 | $10,798 |
|---|
| 9/30/2016 | $9,733 | $10,235 | $10,510 | $10,800 |
|---|
| 10/31/2016 | $9,364 | $9,820 | $10,176 | $10,603 |
|---|
| 11/30/2016 | $9,681 | $10,246 | $10,725 | $10,996 |
|---|
| 12/31/2016 | $9,555 | $10,282 | $10,847 | $11,213 |
|---|
| 1/31/2017 | $9,982 | $10,625 | $11,109 | $11,426 |
|---|
| 2/28/2017 | $10,136 | $10,930 | $11,423 | $11,879 |
|---|
| 3/31/2017 | $10,215 | $10,991 | $11,405 | $11,893 |
|---|
| 4/30/2017 | $10,463 | $11,154 | $11,493 | $12,015 |
|---|
| 5/31/2017 | $10,685 | $11,420 | $11,598 | $12,184 |
|---|
| 6/30/2017 | $10,743 | $11,454 | $11,713 | $12,260 |
|---|
| 7/31/2017 | $10,843 | $11,646 | $11,886 | $12,512 |
|---|
| 8/31/2017 | $10,970 | $11,728 | $11,793 | $12,551 |
|---|
| 9/30/2017 | $11,197 | $12,059 | $12,120 | $12,810 |
|---|
| 10/31/2017 | $11,409 | $12,397 | $12,322 | $13,109 |
|---|
| 11/30/2017 | $11,731 | $12,811 | $12,737 | $13,511 |
|---|
| 12/31/2017 | $11,737 | $12,880 | $12,856 | $13,661 |
|---|
| 1/31/2018 | $12,330 | $13,609 | $13,339 | $14,443 |
|---|
| 2/28/2018 | $11,938 | $13,182 | $12,788 | $13,911 |
|---|
| 3/31/2018 | $11,944 | $13,160 | $12,796 | $13,557 |
|---|
| 4/30/2018 | $11,835 | $13,036 | $12,777 | $13,609 |
|---|
| 5/31/2018 | $12,232 | $13,523 | $13,067 | $13,937 |
|---|
| 6/30/2018 | $12,238 | $13,576 | $13,157 | $14,023 |
|---|
| 7/31/2018 | $12,567 | $13,867 | $13,485 | $14,544 |
|---|
| 8/31/2018 | $13,102 | $14,666 | $13,904 | $15,018 |
|---|
| 9/30/2018 | $13,172 | $14,604 | $13,815 | $15,104 |
|---|
| 10/31/2018 | $11,973 | $13,158 | $12,667 | $14,072 |
|---|
| 11/30/2018 | $12,365 | $13,493 | $12,978 | $14,358 |
|---|
| 12/31/2018 | $11,342 | $12,268 | $11,691 | $13,062 |
|---|
| 1/31/2019 | $12,516 | $13,678 | $12,952 | $14,109 |
|---|
| 2/28/2019 | $13,354 | $14,480 | $13,509 | $14,562 |
|---|
| 3/31/2019 | $13,592 | $14,675 | $13,624 | $14,845 |
|---|
| 4/30/2019 | $14,112 | $15,335 | $14,143 | $15,446 |
|---|
| 5/31/2019 | $13,568 | $14,453 | $13,275 | $14,464 |
|---|
| 6/30/2019 | $14,461 | $15,468 | $14,187 | $15,483 |
|---|
| 7/31/2019 | $14,693 | $15,829 | $14,389 | $15,706 |
|---|
| 8/31/2019 | $14,424 | $15,541 | $13,979 | $15,457 |
|---|
| 9/30/2019 | $14,241 | $15,364 | $14,255 | $15,746 |
|---|
| 10/31/2019 | $14,595 | $15,649 | $14,405 | $16,087 |
|---|
| 11/30/2019 | $15,268 | $16,427 | $14,919 | $16,671 |
|---|
| 12/31/2019 | $15,511 | $16,620 | $15,262 | $17,175 |
|---|
| 1/31/2020 | $15,827 | $16,775 | $15,139 | $17,168 |
|---|
| 2/29/2020 | $14,819 | $15,618 | $13,824 | $15,755 |
|---|
| 3/31/2020 | $12,505 | $13,289 | $11,130 | $13,809 |
|---|
| 4/30/2020 | $14,373 | $15,370 | $12,729 | $15,579 |
|---|
| 5/31/2020 | $15,969 | $16,914 | $13,624 | $16,321 |
|---|
| 6/30/2020 | $16,486 | $17,311 | $13,869 | $16,645 |
|---|
| 7/31/2020 | $17,760 | $18,693 | $14,683 | $17,584 |
|---|
| 8/31/2020 | $18,406 | $19,202 | $15,200 | $18,848 |
|---|
| 9/30/2020 | $18,302 | $18,933 | $14,904 | $18,132 |
|---|
| 10/31/2020 | $18,509 | $18,956 | $14,999 | $17,650 |
|---|
| 11/30/2020 | $20,726 | $21,503 | $17,072 | $19,582 |
|---|
| 12/31/2020 | $21,724 | $22,534 | $17,872 | $20,335 |
|---|
| 1/31/2021 | $21,314 | $22,459 | $17,824 | $20,129 |
|---|
| 2/28/2021 | $22,074 | $22,842 | $18,817 | $20,684 |
|---|
| 3/31/2021 | $21,388 | $22,407 | $19,326 | $21,590 |
|---|
| 4/30/2021 | $22,626 | $23,666 | $20,311 | $22,742 |
|---|
| 5/31/2021 | $21,754 | $23,304 | $20,474 | $22,901 |
|---|
| 6/30/2021 | $23,021 | $24,888 | $20,776 | $23,436 |
|---|
| 7/31/2021 | $23,566 | $25,144 | $20,935 | $23,993 |
|---|
| 8/31/2021 | $24,229 | $25,955 | $21,468 | $24,722 |
|---|
| 9/30/2021 | $23,163 | $24,698 | $20,583 | $23,572 |
|---|
| 10/31/2021 | $24,438 | $26,430 | $21,807 | $25,224 |
|---|
| 11/30/2021 | $23,230 | $25,313 | $21,048 | $25,049 |
|---|
| 12/31/2021 | $23,159 | $25,402 | $21,908 | $26,172 |
|---|
| 1/31/2022 | $19,956 | $22,124 | $20,294 | $24,817 |
|---|
| 2/28/2022 | $19,715 | $21,856 | $20,148 | $24,074 |
|---|
| 3/31/2022 | $19,706 | $22,207 | $20,664 | $24,968 |
|---|
| 4/30/2022 | $17,619 | $19,706 | $19,072 | $22,791 |
|---|
| 5/31/2022 | $16,834 | $18,943 | $19,087 | $22,833 |
|---|
| 6/30/2022 | $15,968 | $17,527 | $17,182 | $20,948 |
|---|
| 7/31/2022 | $17,779 | $19,672 | $18,878 | $22,879 |
|---|
| 8/31/2022 | $17,012 | $19,028 | $18,286 | $21,946 |
|---|
| 9/30/2022 | $15,505 | $17,413 | $16,591 | $19,925 |
|---|
| 10/31/2022 | $16,370 | $18,781 | $18,064 | $21,538 |
|---|
| 11/30/2022 | $16,914 | $19,803 | $19,149 | $22,742 |
|---|
| 12/31/2022 | $15,612 | $18,615 | $18,114 | $21,432 |
|---|
| 1/31/2023 | $16,557 | $20,239 | $19,619 | $22,778 |
|---|
| 2/28/2023 | $16,138 | $20,039 | $19,143 | $22,223 |
|---|
| 3/31/2023 | $16,673 | $20,315 | $18,849 | $23,038 |
|---|
| 4/30/2023 | $16,129 | $20,021 | $18,750 | $23,398 |
|---|
| 5/31/2023 | $16,477 | $20,033 | $18,226 | $23,500 |
|---|
| 6/30/2023 | $17,423 | $21,582 | $19,746 | $25,053 |
|---|
| 7/31/2023 | $17,788 | $22,235 | $20,530 | $25,857 |
|---|
| 8/31/2023 | $16,896 | $21,502 | $19,818 | $25,446 |
|---|
| 9/30/2023 | $15,772 | $20,454 | $18,822 | $24,232 |
|---|
| 10/31/2023 | $14,621 | $19,410 | $17,882 | $23,723 |
|---|
| 11/30/2023 | $16,486 | $21,778 | $19,711 | $25,889 |
|---|
| 12/31/2023 | $17,307 | $23,429 | $21,235 | $27,066 |
|---|
| 1/31/2024 | $17,851 | $23,303 | $20,933 | $27,520 |
|---|
| 2/29/2024 | $19,617 | $25,055 | $22,102 | $28,990 |
|---|
| 3/31/2024 | $19,956 | $25,655 | $23,061 | $29,923 |
|---|
| 4/30/2024 | $18,761 | $24,165 | $21,815 | $28,700 |
|---|
| 5/31/2024 | $19,064 | $24,422 | $22,438 | $30,124 |
|---|
| 6/30/2024 | $19,483 | $24,830 | $22,289 | $31,204 |
|---|
| 7/31/2024 | $18,841 | $24,981 | $23,339 | $31,584 |
|---|
| 8/31/2024 | $19,644 | $25,601 | $23,812 | $32,350 |
|---|
| 9/30/2024 | $20,598 | $26,454 | $24,342 | $33,041 |
|---|
| 10/31/2024 | $21,276 | $26,916 | $24,211 | $32,742 |
|---|
| 11/30/2024 | $24,238 | $30,504 | $26,347 | $34,664 |
|---|
The Fund’s benchmarks are unmanaged indices used as a general measure of market performance. Calculations assume the reinvestment of dividends and capital gains.
Average Annual Total Returns (%)
| AATR | 1 Year | 5 Years | Since Inception 6/30/15 |
|---|
| Class R4 at NAV | 47.02% | 9.68% | 9.86% |
|---|
| Russell Mid Cap Growth Index | 40.07% | 13.18% | 12.57% |
|---|
| Russell Mid Cap Index | 33.66% | 12.05% | 10.83% |
|---|
S&P 500 IndexFootnote Reference* | 33.89% | 15.77% | 14.11% |
|---|
| Footnote | Description |
Footnote* | The Fund has adopted the S&P 500 Index as its broad-based securities market index. |
The Fund's past performance is no guarantee of future results. The returns do not reflect the deduction of taxes that a shareholder would pay on Fund distributions or redemption of Fund shares.
(as of November 30, 2024)
| Total Net Assets | $565,343,784 |
|---|
| # of Portfolio Holdings | 69 |
|---|
| Portfolio Turnover Rate | 117% |
|---|
| Total Advisory Fees Paid | $2,165,888 |
|---|
What did the Fund invest in?
(as of November 30, 2024)
Portfolio Holdings Presented by SectorFootnote Reference* | % Footnote Reference** |
|---|
| Communication Services | 10.01% |
| Consumer Discretionary | 15.72% |
| Consumer Staples | 1.84% |
| Financials | 12.46% |
| Health Care | 13.70% |
| Industrials | 18.74% |
| Information Technology | 25.52% |
| Repurchase Agreements | 2.01% |
| Total | 100.00% |
| Footnote | Description |
Footnote* | A sector may comprise several industries. |
Footnote** | Represents percent of total investments, which excludes derivatives. |
There were no material fund changes during the period.
Where can I find additional information about the Fund?
For additional information about the Fund, including its Prospectus, Statement of Additional Information, financial statements, holdings and proxy information, please visit lordabbett.com/FundDocuments.
The Fund has adopted a policy that allows it to send only one copy of the Fund's prospectus, proxy material, annual report and semiannual report (or related notice of internet availability of annual report and semiannual report) to certain shareholders residing at the same "household." This reduces Fund expenses, which benefits you and other shareholders.If you need additional copies or do not want your mailings to be "householded," please call Lord Abbett at 888-522-2388.
Lord Abbett Growth Opportunities Fund
Annual Shareholder Report
November 30, 2024
lordabbett.com/FundDocuments
TSR-A-8716-R4
01/25
Lord Abbett Growth Opportunities Fund
Annual Shareholder Report
November 30, 2024
lordabbett.com/FundDocuments
This annual shareholder report contains important information about the Lord Abbett Growth Opportunities Fund for the period of December 1, 2023 to November 30, 2024, as well as certain changes to the Fund. You can find additional information about the Fund at lordabbett.com/FundDocuments. You can also request this information by contacting us at 888-522-2388.
What were the Fund costs for the last year?
(based on a hypothetical $10,000 investment)
| Class Name | Costs of a $10,000 investment | Costs paid as a percentage of a $10,000 investment |
|---|
| Class R5 | $88 | 0.71% |
|---|
How did the Fund perform last year and what affected its performance?
For the fiscal year ended November 30, 2024, the Fund returned 47.43%, reflecting performance at the net asset value (NAV) of Class R5 shares, with all distributions reinvested, compared to the 40.07% return of a securities market index with investment characteristics similar to those of the Fund, the Russell Mid Cap Growth Index. The Fund's broad-based securities market index, the S&P 500 Index, returned 33.89% over the same period.
Positive factors for the markets included momentum around the soft-landing narrative, which was supported by signs of a cooling labor market and a slowing economy. This led to the U.S. Federal Reserve lowering its policy rate by 50 basis points in September and 25 basis points in November. There were also increased expectations for further rate cuts in 2024. Mixed economic data, including softer consumer price index reports and fluctuating job market indicators, contributed to these rate cut expectations, and also sparked recession fears. However, these factors were mostly balanced by strong consumer spending and retail sales. Against this backdrop, global equity markets delivered strong return.
Top contributors to performance: Security selection within the Health Care sector contributed to relative performance, led by an overweight allocation to Natera, Inc. Security selection within the Industrials sector also contributed to relative performance, led by an overweight allocation to Vertiv Holdings Co.
Top detractors from performance: Security selection within the Financials sector detracted from relative performance, led by an overweight allocation to Coinbase Global, Inc. Within the Communication Services sector, an overweight allocation to Roku, Inc., also detracted from relative performance.
Total Return Based on $10,000 Investment
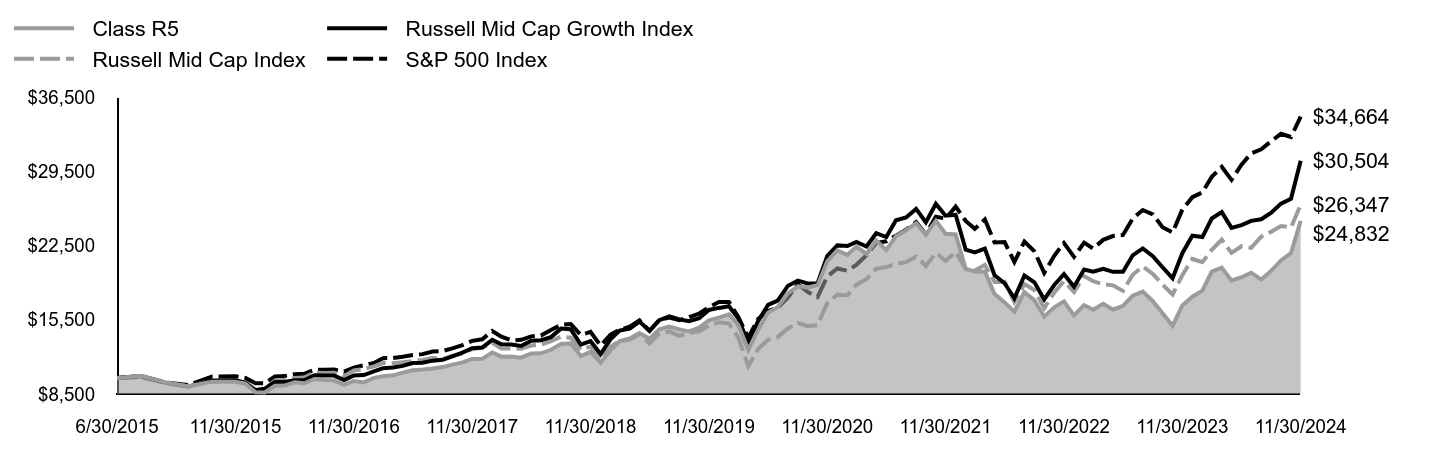
| Class R5 | Russell Mid Cap Growth Index | Russell Mid Cap Index | S&P 500 Index |
|---|
| 6/30/2015 | $10,000 | $10,000 | $10,000 | $10,000 |
|---|
| 7/31/2015 | $10,217 | $10,162 | $10,074 | $10,210 |
|---|
| 8/31/2015 | $9,600 | $9,571 | $9,543 | $9,594 |
|---|
| 9/30/2015 | $9,228 | $9,201 | $9,199 | $9,356 |
|---|
| 10/31/2015 | $9,665 | $9,780 | $9,769 | $10,145 |
|---|
| 11/30/2015 | $9,657 | $9,801 | $9,794 | $10,176 |
|---|
| 12/31/2015 | $9,469 | $9,580 | $9,532 | $10,015 |
|---|
| 1/31/2016 | $8,664 | $8,855 | $8,907 | $9,518 |
|---|
| 2/29/2016 | $8,646 | $8,994 | $9,008 | $9,505 |
|---|
| 3/31/2016 | $9,276 | $9,635 | $9,746 | $10,150 |
|---|
| 4/30/2016 | $9,290 | $9,630 | $9,849 | $10,189 |
|---|
| 5/31/2016 | $9,607 | $9,787 | $10,010 | $10,372 |
|---|
| 6/30/2016 | $9,510 | $9,786 | $10,056 | $10,399 |
|---|
| 7/31/2016 | $9,915 | $10,271 | $10,515 | $10,783 |
|---|
| 8/31/2016 | $9,814 | $10,240 | $10,489 | $10,798 |
|---|
| 9/30/2016 | $9,768 | $10,235 | $10,510 | $10,800 |
|---|
| 10/31/2016 | $9,395 | $9,820 | $10,176 | $10,603 |
|---|
| 11/30/2016 | $9,717 | $10,246 | $10,725 | $10,996 |
|---|
| 12/31/2016 | $9,594 | $10,282 | $10,847 | $11,213 |
|---|
| 1/31/2017 | $10,025 | $10,625 | $11,109 | $11,426 |
|---|
| 2/28/2017 | $10,181 | $10,930 | $11,423 | $11,879 |
|---|
| 3/31/2017 | $10,261 | $10,991 | $11,405 | $11,893 |
|---|
| 4/30/2017 | $10,512 | $11,154 | $11,493 | $12,015 |
|---|
| 5/31/2017 | $10,739 | $11,420 | $11,598 | $12,184 |
|---|
| 6/30/2017 | $10,805 | $11,454 | $11,713 | $12,260 |
|---|
| 7/31/2017 | $10,904 | $11,646 | $11,886 | $12,512 |
|---|
| 8/31/2017 | $11,037 | $11,728 | $11,793 | $12,551 |
|---|
| 9/30/2017 | $11,268 | $12,059 | $12,120 | $12,810 |
|---|
| 10/31/2017 | $11,481 | $12,397 | $12,322 | $13,109 |
|---|
| 11/30/2017 | $11,807 | $12,811 | $12,737 | $13,511 |
|---|
| 12/31/2017 | $11,818 | $12,880 | $12,856 | $13,661 |
|---|
| 1/31/2018 | $12,420 | $13,609 | $13,339 | $14,443 |
|---|
| 2/28/2018 | $12,022 | $13,182 | $12,788 | $13,911 |
|---|
| 3/31/2018 | $12,032 | $13,160 | $12,796 | $13,557 |
|---|
| 4/30/2018 | $11,925 | $13,036 | $12,777 | $13,609 |
|---|
| 5/31/2018 | $12,328 | $13,523 | $13,067 | $13,937 |
|---|
| 6/30/2018 | $12,339 | $13,576 | $13,157 | $14,023 |
|---|
| 7/31/2018 | $12,671 | $13,867 | $13,485 | $14,544 |
|---|
| 8/31/2018 | $13,212 | $14,666 | $13,904 | $15,018 |
|---|
| 9/30/2018 | $13,288 | $14,604 | $13,815 | $15,104 |
|---|
| 10/31/2018 | $12,078 | $13,158 | $12,667 | $14,072 |
|---|
| 11/30/2018 | $12,476 | $13,493 | $12,978 | $14,358 |
|---|
| 12/31/2018 | $11,448 | $12,268 | $11,691 | $13,062 |
|---|
| 1/31/2019 | $12,637 | $13,678 | $12,952 | $14,109 |
|---|
| 2/28/2019 | $13,487 | $14,480 | $13,509 | $14,562 |
|---|
| 3/31/2019 | $13,729 | $14,675 | $13,624 | $14,845 |
|---|
| 4/30/2019 | $14,256 | $15,335 | $14,143 | $15,446 |
|---|
| 5/31/2019 | $13,713 | $14,453 | $13,275 | $14,464 |
|---|
| 6/30/2019 | $14,611 | $15,468 | $14,187 | $15,483 |
|---|
| 7/31/2019 | $14,853 | $15,829 | $14,389 | $15,706 |
|---|
| 8/31/2019 | $14,584 | $15,541 | $13,979 | $15,457 |
|---|
| 9/30/2019 | $14,396 | $15,364 | $14,255 | $15,746 |
|---|
| 10/31/2019 | $14,762 | $15,649 | $14,405 | $16,087 |
|---|
| 11/30/2019 | $15,445 | $16,427 | $14,919 | $16,671 |
|---|
| 12/31/2019 | $15,696 | $16,620 | $15,262 | $17,175 |
|---|
| 1/31/2020 | $16,018 | $16,775 | $15,139 | $17,168 |
|---|
| 2/29/2020 | $14,996 | $15,618 | $13,824 | $15,755 |
|---|
| 3/31/2020 | $12,660 | $13,289 | $11,130 | $13,809 |
|---|
| 4/30/2020 | $14,551 | $15,370 | $12,729 | $15,579 |
|---|
| 5/31/2020 | $16,176 | $16,914 | $13,624 | $16,321 |
|---|
| 6/30/2020 | $16,701 | $17,311 | $13,869 | $16,645 |
|---|
| 7/31/2020 | $17,994 | $18,693 | $14,683 | $17,584 |
|---|
| 8/31/2020 | $18,654 | $19,202 | $15,200 | $18,848 |
|---|
| 9/30/2020 | $18,552 | $18,933 | $14,904 | $18,132 |
|---|
| 10/31/2020 | $18,767 | $18,956 | $14,999 | $17,650 |
|---|
| 11/30/2020 | $21,019 | $21,503 | $17,072 | $19,582 |
|---|
| 12/31/2020 | $22,038 | $22,534 | $17,872 | $20,335 |
|---|
| 1/31/2021 | $21,624 | $22,459 | $17,824 | $20,129 |
|---|
| 2/28/2021 | $22,402 | $22,842 | $18,817 | $20,684 |
|---|
| 3/31/2021 | $21,706 | $22,407 | $19,326 | $21,590 |
|---|
| 4/30/2021 | $22,969 | $23,666 | $20,311 | $22,742 |
|---|
| 5/31/2021 | $22,089 | $23,304 | $20,474 | $22,901 |
|---|
| 6/30/2021 | $23,377 | $24,888 | $20,776 | $23,436 |
|---|
| 7/31/2021 | $23,938 | $25,144 | $20,935 | $23,993 |
|---|
| 8/31/2021 | $24,614 | $25,955 | $21,468 | $24,722 |
|---|
| 9/30/2021 | $23,537 | $24,698 | $20,583 | $23,572 |
|---|
| 10/31/2021 | $24,837 | $26,430 | $21,807 | $25,224 |
|---|
| 11/30/2021 | $23,613 | $25,313 | $21,048 | $25,049 |
|---|
| 12/31/2021 | $23,545 | $25,402 | $21,908 | $26,172 |
|---|
| 1/31/2022 | $20,298 | $22,124 | $20,294 | $24,817 |
|---|
| 2/28/2022 | $20,054 | $21,856 | $20,148 | $24,074 |
|---|
| 3/31/2022 | $20,046 | $22,207 | $20,664 | $24,968 |
|---|
| 4/30/2022 | $17,931 | $19,706 | $19,072 | $22,791 |
|---|
| 5/31/2022 | $17,139 | $18,943 | $19,087 | $22,833 |
|---|
| 6/30/2022 | $16,259 | $17,527 | $17,182 | $20,948 |
|---|
| 7/31/2022 | $18,108 | $19,672 | $18,878 | $22,879 |
|---|
| 8/31/2022 | $17,324 | $19,028 | $18,286 | $21,946 |
|---|
| 9/30/2022 | $15,793 | $17,413 | $16,591 | $19,925 |
|---|
| 10/31/2022 | $16,681 | $18,781 | $18,064 | $21,538 |
|---|
| 11/30/2022 | $17,236 | $19,803 | $19,149 | $22,742 |
|---|
| 12/31/2022 | $15,911 | $18,615 | $18,114 | $21,432 |
|---|
| 1/31/2023 | $16,880 | $20,239 | $19,619 | $22,778 |
|---|
| 2/28/2023 | $16,451 | $20,039 | $19,143 | $22,223 |
|---|
| 3/31/2023 | $17,006 | $20,315 | $18,849 | $23,038 |
|---|
| 4/30/2023 | $16,459 | $20,021 | $18,750 | $23,398 |
|---|
| 5/31/2023 | $16,807 | $20,033 | $18,226 | $23,500 |
|---|
| 6/30/2023 | $17,783 | $21,582 | $19,746 | $25,053 |
|---|
| 7/31/2023 | $18,160 | $22,235 | $20,530 | $25,857 |
|---|
| 8/31/2023 | $17,250 | $21,502 | $19,818 | $25,446 |
|---|
| 9/30/2023 | $16,111 | $20,454 | $18,822 | $24,232 |
|---|
| 10/31/2023 | $14,935 | $19,410 | $17,882 | $23,723 |
|---|
| 11/30/2023 | $16,843 | $21,778 | $19,711 | $25,889 |
|---|
| 12/31/2023 | $17,679 | $23,429 | $21,235 | $27,066 |
|---|
| 1/31/2024 | $18,249 | $23,303 | $20,933 | $27,520 |
|---|
| 2/29/2024 | $20,054 | $25,055 | $22,102 | $28,990 |
|---|
| 3/31/2024 | $20,416 | $25,655 | $23,061 | $29,923 |
|---|
| 4/30/2024 | $19,196 | $24,165 | $21,815 | $28,700 |
|---|
| 5/31/2024 | $19,514 | $24,422 | $22,438 | $30,124 |
|---|
| 6/30/2024 | $19,943 | $24,830 | $22,289 | $31,204 |
|---|
| 7/31/2024 | $19,292 | $24,981 | $23,339 | $31,584 |
|---|
| 8/31/2024 | $20,113 | $25,601 | $23,812 | $32,350 |
|---|
| 9/30/2024 | $21,097 | $26,454 | $24,342 | $33,041 |
|---|
| 10/31/2024 | $21,792 | $26,916 | $24,211 | $32,742 |
|---|
| 11/30/2024 | $24,832 | $30,504 | $26,347 | $34,664 |
|---|
The Fund’s benchmarks are unmanaged indices used as a general measure of market performance. Calculations assume the reinvestment of dividends and capital gains.
Average Annual Total Returns (%)
| AATR | 1 Year | 5 Years | Since Inception 6/30/15 |
|---|
| Class R5 at NAV | 47.43% | 9.96% | 10.14% |
|---|
| Russell Mid Cap Growth Index | 40.07% | 13.18% | 12.57% |
|---|
| Russell Mid Cap Index | 33.66% | 12.05% | 10.83% |
|---|
S&P 500 IndexFootnote Reference* | 33.89% | 15.77% | 14.11% |
|---|
| Footnote | Description |
Footnote* | The Fund has adopted the S&P 500 Index as its broad-based securities market index. |
The Fund's past performance is no guarantee of future results. The returns do not reflect the deduction of taxes that a shareholder would pay on Fund distributions or redemption of Fund shares.
(as of November 30, 2024)
| Total Net Assets | $565,343,784 |
|---|
| # of Portfolio Holdings | 69 |
|---|
| Portfolio Turnover Rate | 117% |
|---|
| Total Advisory Fees Paid | $2,165,888 |
|---|
What did the Fund invest in?
(as of November 30, 2024)
Portfolio Holdings Presented by SectorFootnote Reference* | % Footnote Reference** |
|---|
| Communication Services | 10.01% |
| Consumer Discretionary | 15.72% |
| Consumer Staples | 1.84% |
| Financials | 12.46% |
| Health Care | 13.70% |
| Industrials | 18.74% |
| Information Technology | 25.52% |
| Repurchase Agreements | 2.01% |
| Total | 100.00% |
| Footnote | Description |
Footnote* | A sector may comprise several industries. |
Footnote** | Represents percent of total investments, which excludes derivatives. |
There were no material fund changes during the period.
Where can I find additional information about the Fund?
For additional information about the Fund, including its Prospectus, Statement of Additional Information, financial statements, holdings and proxy information, please visit lordabbett.com/FundDocuments.
The Fund has adopted a policy that allows it to send only one copy of the Fund's prospectus, proxy material, annual report and semiannual report (or related notice of internet availability of annual report and semiannual report) to certain shareholders residing at the same "household." This reduces Fund expenses, which benefits you and other shareholders.If you need additional copies or do not want your mailings to be "householded," please call Lord Abbett at 888-522-2388.
Lord Abbett Growth Opportunities Fund
Annual Shareholder Report
November 30, 2024
lordabbett.com/FundDocuments
TSR-A-8748-R5
01/25
Lord Abbett Growth Opportunities Fund
Annual Shareholder Report
November 30, 2024
lordabbett.com/FundDocuments
This annual shareholder report contains important information about the Lord Abbett Growth Opportunities Fund for the period of December 1, 2023 to November 30, 2024, as well as certain changes to the Fund. You can find additional information about the Fund at lordabbett.com/FundDocuments. You can also request this information by contacting us at 888-522-2388.
What were the Fund costs for the last year?
(based on a hypothetical $10,000 investment)
| Class Name | Costs of a $10,000 investment | Costs paid as a percentage of a $10,000 investment |
|---|
| Class R6 | $78 | 0.63% |
|---|
How did the Fund perform last year and what affected its performance?
For the fiscal year ended November 30, 2024, the Fund returned 47.48%, reflecting performance at the net asset value (NAV) of Class R6 shares, with all distributions reinvested, compared to the 40.07% return of a securities market index with investment characteristics similar to those of the Fund, the Russell Mid Cap Growth Index. The Fund's broad-based securities market index, the S&P 500 Index, returned 33.89% over the same period.
Positive factors for the markets included momentum around the soft-landing narrative, which was supported by signs of a cooling labor market and a slowing economy. This led to the U.S. Federal Reserve lowering its policy rate by 50 basis points in September and 25 basis points in November. There were also increased expectations for further rate cuts in 2024. Mixed economic data, including softer consumer price index reports and fluctuating job market indicators, contributed to these rate cut expectations, and also sparked recession fears. However, these factors were mostly balanced by strong consumer spending and retail sales. Against this backdrop, global equity markets delivered strong return.
Top contributors to performance: Security selection within the Health Care sector contributed to relative performance, led by an overweight allocation to Natera, Inc. Security selection within the Industrials sector also contributed to relative performance, led by an overweight allocation to Vertiv Holdings Co.
Top detractors from performance: Security selection within the Financials sector detracted from relative performance, led by an overweight allocation to Coinbase Global, Inc. Within the Communication Services sector, an overweight allocation to Roku, Inc., also detracted from relative performance.
Total Return Based on $10,000 Investment

| Class R6 | Russell Mid Cap Growth Index | Russell Mid Cap Index | S&P 500 Index |
|---|
| 6/30/2015 | $10,000 | $10,000 | $10,000 | $10,000 |
|---|
| 7/31/2015 | $10,217 | $10,162 | $10,074 | $10,210 |
|---|
| 8/31/2015 | $9,600 | $9,571 | $9,543 | $9,594 |
|---|
| 9/30/2015 | $9,228 | $9,201 | $9,199 | $9,356 |
|---|
| 10/31/2015 | $9,669 | $9,780 | $9,769 | $10,145 |
|---|
| 11/30/2015 | $9,661 | $9,801 | $9,794 | $10,176 |
|---|
| 12/31/2015 | $9,477 | $9,580 | $9,532 | $10,015 |
|---|
| 1/31/2016 | $8,672 | $8,855 | $8,907 | $9,518 |
|---|
| 2/29/2016 | $8,654 | $8,994 | $9,008 | $9,505 |
|---|
| 3/31/2016 | $9,284 | $9,635 | $9,746 | $10,150 |
|---|
| 4/30/2016 | $9,302 | $9,630 | $9,849 | $10,189 |
|---|
| 5/31/2016 | $9,620 | $9,787 | $10,010 | $10,372 |
|---|
| 6/30/2016 | $9,523 | $9,786 | $10,056 | $10,399 |
|---|
| 7/31/2016 | $9,928 | $10,271 | $10,515 | $10,783 |
|---|
| 8/31/2016 | $9,831 | $10,240 | $10,489 | $10,798 |
|---|
| 9/30/2016 | $9,785 | $10,235 | $10,510 | $10,800 |
|---|
| 10/31/2016 | $9,413 | $9,820 | $10,176 | $10,603 |
|---|
| 11/30/2016 | $9,739 | $10,246 | $10,725 | $10,996 |
|---|
| 12/31/2016 | $9,612 | $10,282 | $10,847 | $11,213 |
|---|
| 1/31/2017 | $10,042 | $10,625 | $11,109 | $11,426 |
|---|
| 2/28/2017 | $10,198 | $10,930 | $11,423 | $11,879 |
|---|
| 3/31/2017 | $10,288 | $10,991 | $11,405 | $11,893 |
|---|
| 4/30/2017 | $10,538 | $11,154 | $11,493 | $12,015 |
|---|
| 5/31/2017 | $10,765 | $11,420 | $11,598 | $12,184 |
|---|
| 6/30/2017 | $10,831 | $11,454 | $11,713 | $12,260 |
|---|
| 7/31/2017 | $10,931 | $11,646 | $11,886 | $12,512 |
|---|
| 8/31/2017 | $11,068 | $11,728 | $11,793 | $12,551 |
|---|
| 9/30/2017 | $11,299 | $12,059 | $12,120 | $12,810 |
|---|
| 10/31/2017 | $11,512 | $12,397 | $12,322 | $13,109 |
|---|
| 11/30/2017 | $11,843 | $12,811 | $12,737 | $13,511 |
|---|
| 12/31/2017 | $11,853 | $12,880 | $12,856 | $13,661 |
|---|
| 1/31/2018 | $12,456 | $13,609 | $13,339 | $14,443 |
|---|
| 2/28/2018 | $12,063 | $13,182 | $12,788 | $13,911 |
|---|
| 3/31/2018 | $12,068 | $13,160 | $12,796 | $13,557 |
|---|
| 4/30/2018 | $11,966 | $13,036 | $12,777 | $13,609 |
|---|
| 5/31/2018 | $12,369 | $13,523 | $13,067 | $13,937 |
|---|
| 6/30/2018 | $12,379 | $13,576 | $13,157 | $14,023 |
|---|
| 7/31/2018 | $12,711 | $13,867 | $13,485 | $14,544 |
|---|
| 8/31/2018 | $13,262 | $14,666 | $13,904 | $15,018 |
|---|
| 9/30/2018 | $13,334 | $14,604 | $13,815 | $15,104 |
|---|
| 10/31/2018 | $12,124 | $13,158 | $12,667 | $14,072 |
|---|
| 11/30/2018 | $12,522 | $13,493 | $12,978 | $14,358 |
|---|
| 12/31/2018 | $11,488 | $12,268 | $11,691 | $13,062 |
|---|
| 1/31/2019 | $12,682 | $13,678 | $12,952 | $14,109 |
|---|
| 2/28/2019 | $13,537 | $14,480 | $13,509 | $14,562 |
|---|
| 3/31/2019 | $13,779 | $14,675 | $13,624 | $14,845 |
|---|
| 4/30/2019 | $14,311 | $15,335 | $14,143 | $15,446 |
|---|
| 5/31/2019 | $13,762 | $14,453 | $13,275 | $14,464 |
|---|
| 6/30/2019 | $14,671 | $15,468 | $14,187 | $15,483 |
|---|
| 7/31/2019 | $14,913 | $15,829 | $14,389 | $15,706 |
|---|
| 8/31/2019 | $14,644 | $15,541 | $13,979 | $15,457 |
|---|
| 9/30/2019 | $14,456 | $15,364 | $14,255 | $15,746 |
|---|
| 10/31/2019 | $14,822 | $15,649 | $14,405 | $16,087 |
|---|
| 11/30/2019 | $15,510 | $16,427 | $14,919 | $16,671 |
|---|
| 12/31/2019 | $15,761 | $16,620 | $15,262 | $17,175 |
|---|
| 1/31/2020 | $16,088 | $16,775 | $15,139 | $17,168 |
|---|
| 2/29/2020 | $15,062 | $15,618 | $13,824 | $15,755 |
|---|
| 3/31/2020 | $12,716 | $13,289 | $11,130 | $13,809 |
|---|
| 4/30/2020 | $14,616 | $15,370 | $12,729 | $15,579 |
|---|
| 5/31/2020 | $16,252 | $16,914 | $13,624 | $16,321 |
|---|
| 6/30/2020 | $16,776 | $17,311 | $13,869 | $16,645 |
|---|
| 7/31/2020 | $18,079 | $18,693 | $14,683 | $17,584 |
|---|
| 8/31/2020 | $18,744 | $19,202 | $15,200 | $18,848 |
|---|
| 9/30/2020 | $18,643 | $18,933 | $14,904 | $18,132 |
|---|
| 10/31/2020 | $18,857 | $18,956 | $14,999 | $17,650 |
|---|
| 11/30/2020 | $21,124 | $21,503 | $17,072 | $19,582 |
|---|
| 12/31/2020 | $22,147 | $22,534 | $17,872 | $20,335 |
|---|
| 1/31/2021 | $21,733 | $22,459 | $17,824 | $20,129 |
|---|
| 2/28/2021 | $22,510 | $22,842 | $18,817 | $20,684 |
|---|
| 3/31/2021 | $21,823 | $22,407 | $19,326 | $21,590 |
|---|
| 4/30/2021 | $23,089 | $23,666 | $20,311 | $22,742 |
|---|
| 5/31/2021 | $22,204 | $23,304 | $20,474 | $22,901 |
|---|
| 6/30/2021 | $23,503 | $24,888 | $20,776 | $23,436 |
|---|
| 7/31/2021 | $24,070 | $25,144 | $20,935 | $23,993 |
|---|
| 8/31/2021 | $24,744 | $25,955 | $21,468 | $24,722 |
|---|
| 9/30/2021 | $23,669 | $24,698 | $20,583 | $23,572 |
|---|
| 10/31/2021 | $24,974 | $26,430 | $21,807 | $25,224 |
|---|
| 11/30/2021 | $23,751 | $25,313 | $21,048 | $25,049 |
|---|
| 12/31/2021 | $23,685 | $25,402 | $21,908 | $26,172 |
|---|
| 1/31/2022 | $20,417 | $22,124 | $20,294 | $24,817 |
|---|
| 2/28/2022 | $20,174 | $21,856 | $20,148 | $24,074 |
|---|
| 3/31/2022 | $20,166 | $22,207 | $20,664 | $24,968 |
|---|
| 4/30/2022 | $18,042 | $19,706 | $19,072 | $22,791 |
|---|
| 5/31/2022 | $17,238 | $18,943 | $19,087 | $22,833 |
|---|
| 6/30/2022 | $16,360 | $17,527 | $17,182 | $20,948 |
|---|
| 7/31/2022 | $18,219 | $19,672 | $18,878 | $22,879 |
|---|
| 8/31/2022 | $17,437 | $19,028 | $18,286 | $21,946 |
|---|
| 9/30/2022 | $15,896 | $17,413 | $16,591 | $19,925 |
|---|
| 10/31/2022 | $16,788 | $18,781 | $18,064 | $21,538 |
|---|
| 11/30/2022 | $17,349 | $19,803 | $19,149 | $22,742 |
|---|
| 12/31/2022 | $16,021 | $18,615 | $18,114 | $21,432 |
|---|
| 1/31/2023 | $16,995 | $20,239 | $19,619 | $22,778 |
|---|
| 2/28/2023 | $16,559 | $20,039 | $19,143 | $22,223 |
|---|
| 3/31/2023 | $17,120 | $20,315 | $18,849 | $23,038 |
|---|
| 4/30/2023 | $16,567 | $20,021 | $18,750 | $23,398 |
|---|
| 5/31/2023 | $16,928 | $20,033 | $18,226 | $23,500 |
|---|
| 6/30/2023 | $17,909 | $21,582 | $19,746 | $25,053 |
|---|
| 7/31/2023 | $18,285 | $22,235 | $20,530 | $25,857 |
|---|
| 8/31/2023 | $17,371 | $21,502 | $19,818 | $25,446 |
|---|
| 9/30/2023 | $16,220 | $20,454 | $18,822 | $24,232 |
|---|
| 10/31/2023 | $15,047 | $19,410 | $17,882 | $23,723 |
|---|
| 11/30/2023 | $16,965 | $21,778 | $19,711 | $25,889 |
|---|
| 12/31/2023 | $17,813 | $23,429 | $21,235 | $27,066 |
|---|
| 1/31/2024 | $18,381 | $23,303 | $20,933 | $27,520 |
|---|
| 2/29/2024 | $20,203 | $25,055 | $22,102 | $28,990 |
|---|
| 3/31/2024 | $20,565 | $25,655 | $23,061 | $29,923 |
|---|
| 4/30/2024 | $19,340 | $24,165 | $21,815 | $28,700 |
|---|
| 5/31/2024 | $19,657 | $24,422 | $22,438 | $30,124 |
|---|
| 6/30/2024 | $20,093 | $24,830 | $22,289 | $31,204 |
|---|
| 7/31/2024 | $19,436 | $24,981 | $23,339 | $31,584 |
|---|
| 8/31/2024 | $20,270 | $25,601 | $23,812 | $32,350 |
|---|
| 9/30/2024 | $21,258 | $26,454 | $24,342 | $33,041 |
|---|
| 10/31/2024 | $21,959 | $26,916 | $24,211 | $32,742 |
|---|
| 11/30/2024 | $25,020 | $30,504 | $26,347 | $34,664 |
|---|
The Fund’s benchmarks are unmanaged indices used as a general measure of market performance. Calculations assume the reinvestment of dividends and capital gains.
Average Annual Total Returns (%)
| AATR | 1 Year | 5 Years | Since Inception 6/30/15 |
|---|
| Class R6 at NAV | 47.48% | 10.04% | 10.23% |
|---|
| Russell Mid Cap Growth Index | 40.07% | 13.18% | 12.57% |
|---|
| Russell Mid Cap Index | 33.66% | 12.05% | 10.83% |
|---|
S&P 500 IndexFootnote Reference* | 33.89% | 15.77% | 14.11% |
|---|
| Footnote | Description |
Footnote* | The Fund has adopted the S&P 500 Index as its broad-based securities market index. |
The Fund's past performance is no guarantee of future results. The returns do not reflect the deduction of taxes that a shareholder would pay on Fund distributions or redemption of Fund shares.
(as of November 30, 2024)
| Total Net Assets | $565,343,784 |
|---|
| # of Portfolio Holdings | 69 |
|---|
| Portfolio Turnover Rate | 117% |
|---|
| Total Advisory Fees Paid | $2,165,888 |
|---|
What did the Fund invest in?
(as of November 30, 2024)
Portfolio Holdings Presented by SectorFootnote Reference* | % Footnote Reference** |
|---|
| Communication Services | 10.01% |
| Consumer Discretionary | 15.72% |
| Consumer Staples | 1.84% |
| Financials | 12.46% |
| Health Care | 13.70% |
| Industrials | 18.74% |
| Information Technology | 25.52% |
| Repurchase Agreements | 2.01% |
| Total | 100.00% |
| Footnote | Description |
Footnote* | A sector may comprise several industries. |
Footnote** | Represents percent of total investments, which excludes derivatives. |
There were no material fund changes during the period.
Where can I find additional information about the Fund?
For additional information about the Fund, including its Prospectus, Statement of Additional Information, financial statements, holdings and proxy information, please visit lordabbett.com/FundDocuments.
The Fund has adopted a policy that allows it to send only one copy of the Fund's prospectus, proxy material, annual report and semiannual report (or related notice of internet availability of annual report and semiannual report) to certain shareholders residing at the same "household." This reduces Fund expenses, which benefits you and other shareholders.If you need additional copies or do not want your mailings to be "householded," please call Lord Abbett at 888-522-2388.
Lord Abbett Growth Opportunities Fund
Annual Shareholder Report
November 30, 2024
lordabbett.com/FundDocuments
TSR-A-8780-R6
01/25
Lord Abbett Small Cap Value Fund
Annual Shareholder Report
November 30, 2024
lordabbett.com/FundDocuments
This annual shareholder report contains important information about the Lord Abbett Small Cap Value Fund for the period of December 1, 2023 to November 30, 2024, as well as certain changes to the Fund. You can find additional information about the Fund at lordabbett.com/FundDocuments. You can also request this information by contacting us at 888-522-2388.
What were the Fund costs for the last year?
(based on a hypothetical $10,000 investment)
| Class Name | Costs of a $10,000 investment | Costs paid as a percentage of a $10,000 investment |
|---|
| Class A | $142 | 1.21% |
|---|
How did the Fund perform last year and what affected its performance?
For the fiscal year ended November 30, 2024, the Fund returned 34.47%, reflecting performance at the net asset value (NAV) of Class A shares, with all distributions reinvested, compared to the 32.55% return of a securities market index with investment characteristics similar to those of the Fund, the Russell 2000 Value Index. The Fund's broad-based securities market index, the S&P 500 Index, returned 33.89% over the same period.
Positive factors for the markets included momentum around the soft-landing narrative, which was supported by signs of a cooling labor market and a slowing economy. This led to the U.S. Federal Reserve lowering its policy rate by 50 basis points in September and an additional 25 basis points in November. There were also increased expectations in the market for further rate cuts in 2024. Mixed economic data, including softer consumer price index reports and fluctuating job market indicators, contributed to these rate cut expectations, and also sparked recession fears. However, these factors were mostly balanced by strong consumer spending and retail sales.
Top contributors to performance: Security selection within the Financials sector contributed to relative performance, led by an overweight allocation to CI Financial Corp. Security selection within the Information Technology sector also contributed to relative performance, led by an overweight allocation to Commvault Systems, Inc.
Top detractors from performance: Security selection within the Consumer Discretionary sector detracted from relative performance, led by an overweight allocation to Malibu Boats, Inc. Security selection within the Real Estate sector also detracted from relative performance, led by an overweight allocation to Marcus & Millichap, Inc.
Total Return Based on $10,000 Investment
| Class A with load | Russell 2000 Value Index | S&P 500 Index |
|---|
| 11/30/2014 | $9,425 | $10,000 | $10,000 |
|---|
| 12/31/2014 | $9,547 | $10,273 | $9,975 |
|---|
| 1/31/2015 | $9,278 | $9,846 | $9,675 |
|---|
| 2/28/2015 | $9,794 | $10,303 | $10,231 |
|---|
| 3/31/2015 | $9,990 | $10,477 | $10,070 |
|---|
| 4/30/2015 | $9,783 | $10,253 | $10,166 |
|---|
| 5/31/2015 | $9,837 | $10,338 | $10,297 |
|---|
| 6/30/2015 | $9,961 | $10,351 | $10,098 |
|---|
| 7/31/2015 | $9,870 | $10,066 | $10,309 |
|---|
| 8/31/2015 | $9,249 | $9,572 | $9,687 |
|---|
| 9/30/2015 | $9,060 | $9,240 | $9,448 |
|---|
| 10/31/2015 | $9,688 | $9,758 | $10,244 |
|---|
| 11/30/2015 | $9,874 | $10,035 | $10,275 |
|---|
| 12/31/2015 | $9,435 | $9,506 | $10,113 |
|---|
| 1/31/2016 | $8,873 | $8,867 | $9,611 |
|---|
| 2/29/2016 | $8,882 | $8,928 | $9,598 |
|---|
| 3/31/2016 | $9,544 | $9,668 | $10,249 |
|---|
| 4/30/2016 | $9,630 | $9,873 | $10,289 |
|---|
| 5/31/2016 | $9,875 | $10,054 | $10,474 |
|---|
| 6/30/2016 | $9,911 | $10,084 | $10,501 |
|---|
| 7/31/2016 | $10,301 | $10,628 | $10,888 |
|---|
| 8/31/2016 | $10,478 | $10,892 | $10,903 |
|---|
| 9/30/2016 | $10,509 | $10,978 | $10,905 |
|---|
| 10/31/2016 | $10,124 | $10,617 | $10,706 |
|---|
| 11/30/2016 | $11,171 | $12,027 | $11,103 |
|---|
| 12/31/2016 | $11,366 | $12,523 | $11,322 |
|---|
| 1/31/2017 | $11,340 | $12,434 | $11,537 |
|---|
| 2/28/2017 | $11,423 | $12,614 | $11,995 |
|---|
| 3/31/2017 | $11,418 | $12,507 | $12,009 |
|---|
| 4/30/2017 | $11,459 | $12,556 | $12,132 |
|---|
| 5/31/2017 | $11,258 | $12,165 | $12,303 |
|---|
| 6/30/2017 | $11,397 | $12,591 | $12,380 |
|---|
| 7/31/2017 | $11,402 | $12,670 | $12,635 |
|---|
| 8/31/2017 | $11,139 | $12,359 | $12,673 |
|---|
| 9/30/2017 | $11,625 | $13,234 | $12,935 |
|---|
| 10/31/2017 | $11,878 | $13,251 | $13,237 |
|---|
| 11/30/2017 | $12,225 | $13,635 | $13,642 |
|---|
| 12/31/2017 | $12,083 | $13,505 | $13,794 |
|---|
| 1/31/2018 | $12,415 | $13,671 | $14,584 |
|---|
| 2/28/2018 | $11,882 | $12,988 | $14,046 |
|---|
| 3/31/2018 | $11,930 | $13,148 | $13,689 |
|---|
| 4/30/2018 | $12,042 | $13,376 | $13,742 |
|---|
| 5/31/2018 | $12,651 | $14,154 | $14,073 |
|---|
| 6/30/2018 | $12,740 | $14,240 | $14,160 |
|---|
| 7/31/2018 | $12,977 | $14,492 | $14,686 |
|---|
| 8/31/2018 | $13,722 | $14,837 | $15,165 |
|---|
| 9/30/2018 | $13,545 | $14,469 | $15,251 |
|---|
| 10/31/2018 | $12,101 | $13,173 | $14,209 |
|---|
| 11/30/2018 | $12,107 | $13,386 | $14,498 |
|---|
| 12/31/2018 | $10,648 | $11,768 | $13,189 |
|---|
| 1/31/2019 | $11,735 | $13,055 | $14,246 |
|---|
| 2/28/2019 | $12,253 | $13,562 | $14,704 |
|---|
| 3/31/2019 | $11,969 | $13,171 | $14,989 |
|---|
| 4/30/2019 | $12,552 | $13,669 | $15,596 |
|---|
| 5/31/2019 | $11,245 | $12,553 | $14,605 |
|---|
| 6/30/2019 | $12,033 | $13,352 | $15,635 |
|---|
| 7/31/2019 | $12,040 | $13,374 | $15,859 |
|---|
| 8/31/2019 | $11,514 | $12,627 | $15,608 |
|---|
| 9/30/2019 | $12,054 | $13,276 | $15,900 |
|---|
| 10/31/2019 | $12,090 | $13,597 | $16,245 |
|---|
| 11/30/2019 | $12,417 | $13,916 | $16,834 |
|---|
| 12/31/2019 | $12,806 | $14,403 | $17,342 |
|---|
| 1/31/2020 | $12,304 | $13,626 | $17,335 |
|---|
| 2/29/2020 | $10,970 | $12,302 | $15,908 |
|---|
| 3/31/2020 | $7,979 | $9,267 | $13,944 |
|---|
| 4/30/2020 | $9,041 | $10,410 | $15,731 |
|---|
| 5/31/2020 | $9,577 | $10,709 | $16,480 |
|---|
| 6/30/2020 | $9,831 | $11,019 | $16,808 |
|---|
| 7/31/2020 | $10,052 | $11,246 | $17,756 |
|---|
| 8/31/2020 | $10,299 | $11,852 | $19,032 |
|---|
| 9/30/2020 | $9,721 | $11,300 | $18,309 |
|---|
| 10/31/2020 | $10,069 | $11,704 | $17,822 |
|---|
| 11/30/2020 | $11,871 | $13,964 | $19,773 |
|---|
| 12/31/2020 | $12,617 | $15,070 | $20,533 |
|---|
| 1/31/2021 | $12,934 | $15,863 | $20,326 |
|---|
| 2/28/2021 | $14,317 | $17,353 | $20,886 |
|---|
| 3/31/2021 | $14,901 | $18,260 | $21,801 |
|---|
| 4/30/2021 | $15,511 | $18,630 | $22,964 |
|---|
| 5/31/2021 | $15,717 | $19,209 | $23,125 |
|---|
| 6/30/2021 | $15,330 | $19,093 | $23,665 |
|---|
| 7/31/2021 | $14,841 | $18,410 | $24,227 |
|---|
| 8/31/2021 | $15,047 | $18,902 | $24,963 |
|---|
| 9/30/2021 | $14,807 | $18,524 | $23,802 |
|---|
| 10/31/2021 | $15,511 | $19,230 | $25,470 |
|---|
| 11/30/2021 | $15,133 | $18,573 | $25,294 |
|---|
| 12/31/2021 | $15,951 | $19,331 | $26,427 |
|---|
| 1/31/2022 | $15,090 | $18,204 | $25,060 |
|---|
| 2/28/2022 | $15,171 | $18,505 | $24,309 |
|---|
| 3/31/2022 | $14,918 | $18,867 | $25,212 |
|---|
| 4/30/2022 | $13,723 | $17,403 | $23,013 |
|---|
| 5/31/2022 | $13,926 | $17,737 | $23,056 |
|---|
| 6/30/2022 | $12,376 | $15,985 | $21,152 |
|---|
| 7/31/2022 | $13,450 | $17,532 | $23,103 |
|---|
| 8/31/2022 | $13,105 | $16,978 | $22,161 |
|---|
| 9/30/2022 | $11,768 | $15,248 | $20,120 |
|---|
| 10/31/2022 | $13,186 | $17,167 | $21,749 |
|---|
| 11/30/2022 | $13,743 | $17,692 | $22,964 |
|---|
| 12/31/2022 | $13,161 | $16,531 | $21,641 |
|---|
| 1/31/2023 | $14,434 | $18,108 | $23,001 |
|---|
| 2/28/2023 | $14,444 | $17,691 | $22,440 |
|---|
| 3/31/2023 | $13,845 | $16,422 | $23,263 |
|---|
| 4/30/2023 | $13,761 | $16,013 | $23,626 |
|---|
| 5/31/2023 | $13,498 | $15,698 | $23,729 |
|---|
| 6/30/2023 | $14,634 | $16,945 | $25,297 |
|---|
| 7/31/2023 | $15,339 | $18,224 | $26,110 |
|---|
| 8/31/2023 | $14,907 | $17,347 | $25,694 |
|---|
| 9/30/2023 | $14,097 | $16,443 | $24,469 |
|---|
| 10/31/2023 | $13,319 | $15,463 | $23,955 |
|---|
| 11/30/2023 | $14,350 | $16,854 | $26,142 |
|---|
| 12/31/2023 | $15,768 | $18,952 | $27,330 |
|---|
| 1/31/2024 | $15,505 | $18,091 | $27,789 |
|---|
| 2/29/2024 | $16,052 | $18,683 | $29,273 |
|---|
| 3/31/2024 | $16,684 | $19,502 | $30,215 |
|---|
| 4/30/2024 | $15,684 | $18,259 | $28,981 |
|---|
| 5/31/2024 | $16,674 | $19,113 | $30,418 |
|---|
| 6/30/2024 | $16,431 | $18,791 | $31,509 |
|---|
| 7/31/2024 | $17,990 | $21,081 | $31,893 |
|---|
| 8/31/2024 | $17,811 | $20,686 | $32,666 |
|---|
| 9/30/2024 | $17,601 | $20,699 | $33,364 |
|---|
| 10/31/2024 | $17,358 | $20,375 | $33,061 |
|---|
| 11/30/2024 | $19,296 | $22,340 | $35,002 |
|---|
The Fund’s benchmarks are unmanaged indices used as a general measure of market performance. Calculations assume the reinvestment of dividends and capital gains.
Average Annual Total Returns (%)
| AATR | 1 Year | 5 Years | 10 Years |
|---|
| Class A at NAV | 34.47% | 9.22% | 7.43% |
|---|
| Class A with sales charge | 26.76% | 7.93% | 6.79% |
|---|
| Russell 2000 Value Index | 32.55% | 9.93% | 8.37% |
|---|
S&P 500 IndexFootnote Reference* | 33.89% | 15.77% | 13.35% |
|---|
| Footnote | Description |
Footnote* | The Fund has adopted the S&P 500 Index as its broad-based securities market index. |
The Fund's past performance is no guarantee of future results. The returns do not reflect the deduction of taxes that a shareholder would pay on Fund distributions or redemption of Fund shares.
(as of November 30, 2024)
| Total Net Assets | $437,043,647 |
|---|
| # of Portfolio Holdings | 65 |
|---|
| Portfolio Turnover Rate | 42% |
|---|
| Total Advisory Fees Paid | $3,001,837 |
|---|
What did the Fund invest in?
(as of November 30, 2024)
Portfolio Holdings Presented by SectorFootnote Reference* | % Footnote Reference** |
|---|
| Communication Services | 3.64% |
| Consumer Discretionary | 7.18% |
| Consumer Staples | 2.61% |
| Energy | 8.23% |
| Financials | 27.19% |
| Health Care | 6.60% |
| Industrials | 17.24% |
| Information Technology | 15.18% |
| Materials | 5.99% |
| Real Estate | 3.92% |
| Utilities | 1.47% |
| Repurchase Agreements | 0.75% |
| Total | 100.00% |
| Footnote | Description |
Footnote* | A sector may comprise several industries. |
Footnote** | Represents percent of total investments, which excludes derivatives. |
There were no material fund changes during the period.
Where can I find additional information about the Fund?
For additional information about the Fund, including its Prospectus, Statement of Additional Information, financial statements, holdings and proxy information, please visit lordabbett.com/FundDocuments.
The Fund has adopted a policy that allows it to send only one copy of the Fund's prospectus, proxy material, annual report and semiannual report (or related notice of internet availability of annual report and semiannual report) to certain shareholders residing at the same "household." This reduces Fund expenses, which benefits you and other shareholders.If you need additional copies or do not want your mailings to be "householded," please call Lord Abbett at 888-522-2388.
Lord Abbett Small Cap Value Fund
Annual Shareholder Report
November 30, 2024
lordabbett.com/FundDocuments
TSR-A-261-A
01/25
Lord Abbett Small Cap Value Fund
Annual Shareholder Report
November 30, 2024
lordabbett.com/FundDocuments
This annual shareholder report contains important information about the Lord Abbett Small Cap Value Fund for the period of December 1, 2023 to November 30, 2024, as well as certain changes to the Fund. You can find additional information about the Fund at lordabbett.com/FundDocuments. You can also request this information by contacting us at 888-522-2388.
What were the Fund costs for the last year?
(based on a hypothetical $10,000 investment)
| Class Name | Costs of a $10,000 investment | Costs paid as a percentage of a $10,000 investment |
|---|
| Class C | $229 | 1.96% |
|---|
How did the Fund perform last year and what affected its performance?
For the fiscal year ended November 30, 2024, the Fund returned 33.45%, reflecting performance at the net asset value (NAV) of Class C shares, with all distributions reinvested, compared to the 32.55% return of a securities market index with investment characteristics similar to those of the Fund, the Russell 2000 Value Index. The Fund's broad-based securities market index, the S&P 500 Index, returned 33.89% over the same period.
Positive factors for the markets included momentum around the soft-landing narrative, which was supported by signs of a cooling labor market and a slowing economy. This led to the U.S. Federal Reserve lowering its policy rate by 50 basis points in September and an additional 25 basis points in November. There were also increased expectations in the market for further rate cuts in 2024. Mixed economic data, including softer consumer price index reports and fluctuating job market indicators, contributed to these rate cut expectations, and also sparked recession fears. However, these factors were mostly balanced by strong consumer spending and retail sales.
Top contributors to performance: Security selection within the Financials sector contributed to relative performance, led by an overweight allocation to CI Financial Corp. Security selection within the Information Technology sector also contributed to relative performance, led by an overweight allocation to Commvault Systems, Inc.
Top detractors from performance: Security selection within the Consumer Discretionary sector detracted from relative performance, led by an overweight allocation to Malibu Boats, Inc. Security selection within the Real Estate sector also detracted from relative performance, led by an overweight allocation to Marcus & Millichap, Inc.
Total Return Based on $10,000 Investment
| Class C with load | Russell 2000 Value Index | S&P 500 Index |
|---|
| 11/30/2014 | $10,000 | $10,000 | $10,000 |
|---|
| 12/31/2014 | $10,123 | $10,273 | $9,975 |
|---|
| 1/31/2015 | $9,829 | $9,846 | $9,675 |
|---|
| 2/28/2015 | $10,371 | $10,303 | $10,231 |
|---|
| 3/31/2015 | $10,573 | $10,477 | $10,070 |
|---|
| 4/30/2015 | $10,345 | $10,253 | $10,166 |
|---|
| 5/31/2015 | $10,402 | $10,338 | $10,297 |
|---|
| 6/30/2015 | $10,521 | $10,351 | $10,098 |
|---|
| 7/31/2015 | $10,423 | $10,066 | $10,309 |
|---|
| 8/31/2015 | $9,762 | $9,572 | $9,687 |
|---|
| 9/30/2015 | $9,555 | $9,240 | $9,448 |
|---|
| 10/31/2015 | $10,211 | $9,758 | $10,244 |
|---|
| 11/30/2015 | $10,397 | $10,035 | $10,275 |
|---|
| 12/31/2015 | $9,928 | $9,506 | $10,113 |
|---|
| 1/31/2016 | $9,328 | $8,867 | $9,611 |
|---|
| 2/29/2016 | $9,335 | $8,928 | $9,598 |
|---|
| 3/31/2016 | $10,026 | $9,668 | $10,249 |
|---|
| 4/30/2016 | $10,111 | $9,873 | $10,289 |
|---|
| 5/31/2016 | $10,358 | $10,054 | $10,474 |
|---|
| 6/30/2016 | $10,393 | $10,084 | $10,501 |
|---|
| 7/31/2016 | $10,796 | $10,628 | $10,888 |
|---|
| 8/31/2016 | $10,972 | $10,892 | $10,903 |
|---|
| 9/30/2016 | $10,993 | $10,978 | $10,905 |
|---|
| 10/31/2016 | $10,591 | $10,617 | $10,706 |
|---|
| 11/30/2016 | $11,677 | $12,027 | $11,103 |
|---|
| 12/31/2016 | $11,874 | $12,523 | $11,322 |
|---|
| 1/31/2017 | $11,839 | $12,434 | $11,537 |
|---|
| 2/28/2017 | $11,917 | $12,614 | $11,995 |
|---|
| 3/31/2017 | $11,900 | $12,507 | $12,009 |
|---|
| 4/30/2017 | $11,943 | $12,556 | $12,132 |
|---|
| 5/31/2017 | $11,727 | $12,165 | $12,303 |
|---|
| 6/30/2017 | $11,865 | $12,591 | $12,380 |
|---|
| 7/31/2017 | $11,865 | $12,670 | $12,635 |
|---|
| 8/31/2017 | $11,580 | $12,359 | $12,673 |
|---|
| 9/30/2017 | $12,081 | $13,234 | $12,935 |
|---|
| 10/31/2017 | $12,341 | $13,251 | $13,237 |
|---|
| 11/30/2017 | $12,687 | $13,635 | $13,642 |
|---|
| 12/31/2017 | $12,536 | $13,505 | $13,794 |
|---|
| 1/31/2018 | $12,872 | $13,671 | $14,584 |
|---|
| 2/28/2018 | $12,309 | $12,988 | $14,046 |
|---|
| 3/31/2018 | $12,352 | $13,148 | $13,689 |
|---|
| 4/30/2018 | $12,460 | $13,376 | $13,742 |
|---|
| 5/31/2018 | $13,089 | $14,154 | $14,073 |
|---|
| 6/30/2018 | $13,165 | $14,240 | $14,160 |
|---|
| 7/31/2018 | $13,404 | $14,492 | $14,686 |
|---|
| 8/31/2018 | $14,163 | $14,837 | $15,165 |
|---|
| 9/30/2018 | $13,979 | $14,469 | $15,251 |
|---|
| 10/31/2018 | $12,482 | $13,173 | $14,209 |
|---|
| 11/30/2018 | $12,471 | $13,386 | $14,498 |
|---|
| 12/31/2018 | $10,969 | $11,768 | $13,189 |
|---|
| 1/31/2019 | $12,080 | $13,055 | $14,246 |
|---|
| 2/28/2019 | $12,605 | $13,562 | $14,704 |
|---|
| 3/31/2019 | $12,296 | $13,171 | $14,989 |
|---|
| 4/30/2019 | $12,898 | $13,669 | $15,596 |
|---|
| 5/31/2019 | $11,540 | $12,553 | $14,605 |
|---|
| 6/30/2019 | $12,342 | $13,352 | $15,635 |
|---|
| 7/31/2019 | $12,342 | $13,374 | $15,859 |
|---|
| 8/31/2019 | $11,802 | $12,627 | $15,608 |
|---|
| 9/30/2019 | $12,342 | $13,276 | $15,900 |
|---|
| 10/31/2019 | $12,373 | $13,597 | $16,245 |
|---|
| 11/30/2019 | $12,697 | $13,916 | $16,834 |
|---|
| 12/31/2019 | $13,093 | $14,403 | $17,342 |
|---|
| 1/31/2020 | $12,552 | $13,626 | $17,335 |
|---|
| 2/29/2020 | $11,189 | $12,302 | $15,908 |
|---|
| 3/31/2020 | $8,133 | $9,267 | $13,944 |
|---|
| 4/30/2020 | $9,214 | $10,410 | $15,731 |
|---|
| 5/31/2020 | $9,755 | $10,709 | $16,480 |
|---|
| 6/30/2020 | $10,013 | $11,019 | $16,808 |
|---|
| 7/31/2020 | $10,225 | $11,246 | $17,756 |
|---|
| 8/31/2020 | $10,460 | $11,852 | $19,032 |
|---|
| 9/30/2020 | $9,872 | $11,300 | $18,309 |
|---|
| 10/31/2020 | $10,225 | $11,704 | $17,822 |
|---|
| 11/30/2020 | $12,035 | $13,964 | $19,773 |
|---|
| 12/31/2020 | $12,780 | $15,070 | $20,533 |
|---|
| 1/31/2021 | $13,093 | $15,863 | $20,326 |
|---|
| 2/28/2021 | $14,492 | $17,353 | $20,886 |
|---|
| 3/31/2021 | $15,070 | $18,260 | $21,801 |
|---|
| 4/30/2021 | $15,673 | $18,630 | $22,964 |
|---|
| 5/31/2021 | $15,890 | $19,209 | $23,125 |
|---|
| 6/30/2021 | $15,480 | $19,093 | $23,665 |
|---|
| 7/31/2021 | $14,974 | $18,410 | $24,227 |
|---|
| 8/31/2021 | $15,167 | $18,902 | $24,963 |
|---|
| 9/30/2021 | $14,926 | $18,524 | $23,802 |
|---|
| 10/31/2021 | $15,625 | $19,230 | $25,470 |
|---|
| 11/30/2021 | $15,239 | $18,573 | $25,294 |
|---|
| 12/31/2021 | $16,045 | $19,331 | $26,427 |
|---|
| 1/31/2022 | $15,170 | $18,204 | $25,060 |
|---|
| 2/28/2022 | $15,254 | $18,505 | $24,309 |
|---|
| 3/31/2022 | $14,962 | $18,867 | $25,212 |
|---|
| 4/30/2022 | $13,753 | $17,403 | $23,013 |
|---|
| 5/31/2022 | $13,962 | $17,737 | $23,056 |
|---|
| 6/30/2022 | $12,378 | $15,985 | $21,152 |
|---|
| 7/31/2022 | $13,461 | $17,532 | $23,103 |
|---|
| 8/31/2022 | $13,128 | $16,978 | $22,161 |
|---|
| 9/30/2022 | $11,753 | $15,248 | $20,120 |
|---|
| 10/31/2022 | $13,170 | $17,167 | $21,749 |
|---|
| 11/30/2022 | $13,711 | $17,692 | $22,964 |
|---|
| 12/31/2022 | $13,155 | $16,531 | $21,641 |
|---|
| 1/31/2023 | $14,387 | $18,108 | $23,001 |
|---|
| 2/28/2023 | $14,387 | $17,691 | $22,440 |
|---|
| 3/31/2023 | $13,796 | $16,422 | $23,263 |
|---|
| 4/30/2023 | $13,697 | $16,013 | $23,626 |
|---|
| 5/31/2023 | $13,451 | $15,698 | $23,729 |
|---|
| 6/30/2023 | $14,535 | $16,945 | $25,297 |
|---|
| 7/31/2023 | $15,225 | $18,224 | $26,110 |
|---|
| 8/31/2023 | $14,781 | $17,347 | $25,694 |
|---|
| 9/30/2023 | $13,993 | $16,443 | $24,469 |
|---|
| 10/31/2023 | $13,205 | $15,463 | $23,955 |
|---|
| 11/30/2023 | $14,239 | $16,854 | $26,142 |
|---|
| 12/31/2023 | $15,629 | $18,952 | $27,330 |
|---|
| 1/31/2024 | $15,331 | $18,091 | $27,789 |
|---|
| 2/29/2024 | $15,877 | $18,683 | $29,273 |
|---|
| 3/31/2024 | $16,522 | $19,502 | $30,215 |
|---|
| 4/30/2024 | $15,480 | $18,259 | $28,981 |
|---|
| 5/31/2024 | $16,472 | $19,113 | $30,418 |
|---|
| 6/30/2024 | $16,224 | $18,791 | $31,509 |
|---|
| 7/31/2024 | $17,762 | $21,081 | $31,893 |
|---|
| 8/31/2024 | $17,564 | $20,686 | $32,666 |
|---|
| 9/30/2024 | $17,366 | $20,699 | $33,364 |
|---|
| 10/31/2024 | $17,068 | $20,375 | $33,061 |
|---|
| 11/30/2024 | $19,003 | $22,340 | $35,002 |
|---|
The Fund’s benchmarks are unmanaged indices used as a general measure of market performance. Calculations assume the reinvestment of dividends and capital gains.
Average Annual Total Returns (%)
| AATR | 1 Year | 5 Years | 10 Years |
|---|
| Class C at NAV | 33.45% | 8.40% | 6.63% |
|---|
| Class C with sales charge | 32.45% | 8.40% | 6.63% |
|---|
| Russell 2000 Value Index | 32.55% | 9.93% | 8.37% |
|---|
S&P 500 IndexFootnote Reference* | 33.89% | 15.77% | 13.35% |
|---|
| Footnote | Description |
Footnote* | The Fund has adopted the S&P 500 Index as its broad-based securities market index. |
The Fund's past performance is no guarantee of future results. The returns do not reflect the deduction of taxes that a shareholder would pay on Fund distributions or redemption of Fund shares.
(as of November 30, 2024)
| Total Net Assets | $437,043,647 |
|---|
| # of Portfolio Holdings | 65 |
|---|
| Portfolio Turnover Rate | 42% |
|---|
| Total Advisory Fees Paid | $3,001,837 |
|---|
What did the Fund invest in?
(as of November 30, 2024)
Portfolio Holdings Presented by SectorFootnote Reference* | % Footnote Reference** |
|---|
| Communication Services | 3.64% |
| Consumer Discretionary | 7.18% |
| Consumer Staples | 2.61% |
| Energy | 8.23% |
| Financials | 27.19% |
| Health Care | 6.60% |
| Industrials | 17.24% |
| Information Technology | 15.18% |
| Materials | 5.99% |
| Real Estate | 3.92% |
| Utilities | 1.47% |
| Repurchase Agreements | 0.75% |
| Total | 100.00% |
| Footnote | Description |
Footnote* | A sector may comprise several industries. |
Footnote** | Represents percent of total investments, which excludes derivatives. |
There were no material fund changes during the period.
Where can I find additional information about the Fund?
For additional information about the Fund, including its Prospectus, Statement of Additional Information, financial statements, holdings and proxy information, please visit lordabbett.com/FundDocuments.
The Fund has adopted a policy that allows it to send only one copy of the Fund's prospectus, proxy material, annual report and semiannual report (or related notice of internet availability of annual report and semiannual report) to certain shareholders residing at the same "household." This reduces Fund expenses, which benefits you and other shareholders.If you need additional copies or do not want your mailings to be "householded," please call Lord Abbett at 888-522-2388.
Lord Abbett Small Cap Value Fund
Annual Shareholder Report
November 30, 2024
lordabbett.com/FundDocuments
TSR-A-674-C
01/25
Lord Abbett Small Cap Value Fund
Annual Shareholder Report
November 30, 2024
lordabbett.com/FundDocuments
This annual shareholder report contains important information about the Lord Abbett Small Cap Value Fund for the period of December 1, 2023 to November 30, 2024, as well as certain changes to the Fund. You can find additional information about the Fund at lordabbett.com/FundDocuments. You can also request this information by contacting us at 888-522-2388.
What were the Fund costs for the last year?
(based on a hypothetical $10,000 investment)
| Class Name | Costs of a $10,000 investment | Costs paid as a percentage of a $10,000 investment |
|---|
| Class F | $124 | 1.06% |
|---|
How did the Fund perform last year and what affected its performance?
For the fiscal year ended November 30, 2024, the Fund returned 34.69%, reflecting performance at the net asset value (NAV) of Class F shares, with all distributions reinvested, compared to the 32.55% return of a securities market index with investment characteristics similar to those of the Fund, the Russell 2000 Value Index. The Fund's broad-based securities market index, the S&P 500 Index, returned 33.89% over the same period.
Positive factors for the markets included momentum around the soft-landing narrative, which was supported by signs of a cooling labor market and a slowing economy. This led to the U.S. Federal Reserve lowering its policy rate by 50 basis points in September and an additional 25 basis points in November. There were also increased expectations in the market for further rate cuts in 2024. Mixed economic data, including softer consumer price index reports and fluctuating job market indicators, contributed to these rate cut expectations, and also sparked recession fears. However, these factors were mostly balanced by strong consumer spending and retail sales.
Top contributors to performance: Security selection within the Financials sector contributed to relative performance, led by an overweight allocation to CI Financial Corp. Security selection within the Information Technology sector also contributed to relative performance, led by an overweight allocation to Commvault Systems, Inc.
Top detractors from performance: Security selection within the Consumer Discretionary sector detracted from relative performance, led by an overweight allocation to Malibu Boats, Inc. Security selection within the Real Estate sector also detracted from relative performance, led by an overweight allocation to Marcus & Millichap, Inc.
Total Return Based on $10,000 Investment

| Class F | Russell 2000 Value Index | S&P 500 Index |
|---|
| 11/30/2014 | $10,000 | $10,000 | $10,000 |
|---|
| 12/31/2014 | $10,132 | $10,273 | $9,975 |
|---|
| 1/31/2015 | $9,846 | $9,846 | $9,675 |
|---|
| 2/28/2015 | $10,394 | $10,303 | $10,231 |
|---|
| 3/31/2015 | $10,606 | $10,477 | $10,070 |
|---|
| 4/30/2015 | $10,386 | $10,253 | $10,166 |
|---|
| 5/31/2015 | $10,448 | $10,338 | $10,297 |
|---|
| 6/30/2015 | $10,579 | $10,351 | $10,098 |
|---|
| 7/31/2015 | $10,483 | $10,066 | $10,309 |
|---|
| 8/31/2015 | $9,827 | $9,572 | $9,687 |
|---|
| 9/30/2015 | $9,627 | $9,240 | $9,448 |
|---|
| 10/31/2015 | $10,294 | $9,758 | $10,244 |
|---|
| 11/30/2015 | $10,490 | $10,035 | $10,275 |
|---|
| 12/31/2015 | $10,030 | $9,506 | $10,113 |
|---|
| 1/31/2016 | $9,428 | $8,867 | $9,611 |
|---|
| 2/29/2016 | $9,438 | $8,928 | $9,598 |
|---|
| 3/31/2016 | $10,150 | $9,668 | $10,249 |
|---|
| 4/30/2016 | $10,241 | $9,873 | $10,289 |
|---|
| 5/31/2016 | $10,501 | $10,054 | $10,474 |
|---|
| 6/30/2016 | $10,539 | $10,084 | $10,501 |
|---|
| 7/31/2016 | $10,958 | $10,628 | $10,888 |
|---|
| 8/31/2016 | $11,146 | $10,892 | $10,903 |
|---|
| 9/30/2016 | $11,179 | $10,978 | $10,905 |
|---|
| 10/31/2016 | $10,775 | $10,617 | $10,706 |
|---|
| 11/30/2016 | $11,891 | $12,027 | $11,103 |
|---|
| 12/31/2016 | $12,098 | $12,523 | $11,322 |
|---|
| 1/31/2017 | $12,076 | $12,434 | $11,537 |
|---|
| 2/28/2017 | $12,158 | $12,614 | $11,995 |
|---|
| 3/31/2017 | $12,153 | $12,507 | $12,009 |
|---|
| 4/30/2017 | $12,202 | $12,556 | $12,132 |
|---|
| 5/31/2017 | $11,994 | $12,165 | $12,303 |
|---|
| 6/30/2017 | $12,142 | $12,591 | $12,380 |
|---|
| 7/31/2017 | $12,147 | $12,670 | $12,635 |
|---|
| 8/31/2017 | $11,868 | $12,359 | $12,673 |
|---|
| 9/30/2017 | $12,389 | $13,234 | $12,935 |
|---|
| 10/31/2017 | $12,658 | $13,251 | $13,237 |
|---|
| 11/30/2017 | $13,031 | $13,635 | $13,642 |
|---|
| 12/31/2017 | $12,881 | $13,505 | $13,794 |
|---|
| 1/31/2018 | $13,239 | $13,671 | $14,584 |
|---|
| 2/28/2018 | $12,668 | $12,988 | $14,046 |
|---|
| 3/31/2018 | $12,718 | $13,148 | $13,689 |
|---|
| 4/30/2018 | $12,837 | $13,376 | $13,742 |
|---|
| 5/31/2018 | $13,496 | $14,154 | $14,073 |
|---|
| 6/30/2018 | $13,590 | $14,240 | $14,160 |
|---|
| 7/31/2018 | $13,847 | $14,492 | $14,686 |
|---|
| 8/31/2018 | $14,637 | $14,837 | $15,165 |
|---|
| 9/30/2018 | $14,455 | $14,469 | $15,251 |
|---|
| 10/31/2018 | $12,919 | $13,173 | $14,209 |
|---|
| 11/30/2018 | $12,925 | $13,386 | $14,498 |
|---|
| 12/31/2018 | $11,365 | $11,768 | $13,189 |
|---|
| 1/31/2019 | $12,530 | $13,055 | $14,246 |
|---|
| 2/28/2019 | $13,079 | $13,562 | $14,704 |
|---|
| 3/31/2019 | $12,778 | $13,171 | $14,989 |
|---|
| 4/30/2019 | $13,410 | $13,669 | $15,596 |
|---|
| 5/31/2019 | $12,012 | $12,553 | $14,605 |
|---|
| 6/30/2019 | $12,854 | $13,352 | $15,635 |
|---|
| 7/31/2019 | $12,861 | $13,374 | $15,859 |
|---|
| 8/31/2019 | $12,305 | $12,627 | $15,608 |
|---|
| 9/30/2019 | $12,884 | $13,276 | $15,900 |
|---|
| 10/31/2019 | $12,921 | $13,597 | $16,245 |
|---|
| 11/30/2019 | $13,275 | $13,916 | $16,834 |
|---|
| 12/31/2019 | $13,692 | $14,403 | $17,342 |
|---|
| 1/31/2020 | $13,153 | $13,626 | $17,335 |
|---|
| 2/29/2020 | $11,732 | $12,302 | $15,908 |
|---|
| 3/31/2020 | $8,532 | $9,267 | $13,944 |
|---|
| 4/30/2020 | $9,674 | $10,410 | $15,731 |
|---|
| 5/31/2020 | $10,240 | $10,709 | $16,480 |
|---|
| 6/30/2020 | $10,519 | $11,019 | $16,808 |
|---|
| 7/31/2020 | $10,761 | $11,246 | $17,756 |
|---|
| 8/31/2020 | $11,022 | $11,852 | $19,032 |
|---|
| 9/30/2020 | $10,411 | $11,300 | $18,309 |
|---|
| 10/31/2020 | $10,779 | $11,704 | $17,822 |
|---|
| 11/30/2020 | $12,712 | $13,964 | $19,773 |
|---|
| 12/31/2020 | $13,513 | $15,070 | $20,533 |
|---|
| 1/31/2021 | $13,859 | $15,863 | $20,326 |
|---|
| 2/28/2021 | $15,342 | $17,353 | $20,886 |
|---|
| 3/31/2021 | $15,961 | $18,260 | $21,801 |
|---|
| 4/30/2021 | $16,616 | $18,630 | $22,964 |
|---|
| 5/31/2021 | $16,844 | $19,209 | $23,125 |
|---|
| 6/30/2021 | $16,425 | $19,093 | $23,665 |
|---|
| 7/31/2021 | $15,906 | $18,410 | $24,227 |
|---|
| 8/31/2021 | $16,134 | $18,902 | $24,963 |
|---|
| 9/30/2021 | $15,879 | $18,524 | $23,802 |
|---|
| 10/31/2021 | $16,625 | $19,230 | $25,470 |
|---|
| 11/30/2021 | $16,225 | $18,573 | $25,294 |
|---|
| 12/31/2021 | $17,104 | $19,331 | $26,427 |
|---|
| 1/31/2022 | $16,182 | $18,204 | $25,060 |
|---|
| 2/28/2022 | $16,268 | $18,505 | $24,309 |
|---|
| 3/31/2022 | $16,000 | $18,867 | $25,212 |
|---|
| 4/30/2022 | $14,724 | $17,403 | $23,013 |
|---|
| 5/31/2022 | $14,949 | $17,737 | $23,056 |
|---|
| 6/30/2022 | $13,276 | $15,985 | $21,152 |
|---|
| 7/31/2022 | $14,434 | $17,532 | $23,103 |
|---|
| 8/31/2022 | $14,070 | $16,978 | $22,161 |
|---|
| 9/30/2022 | $12,633 | $15,248 | $20,120 |
|---|
| 10/31/2022 | $14,166 | $17,167 | $21,749 |
|---|
| 11/30/2022 | $14,767 | $17,692 | $22,964 |
|---|
| 12/31/2022 | $14,132 | $16,531 | $21,641 |
|---|
| 1/31/2023 | $15,502 | $18,108 | $23,001 |
|---|
| 2/28/2023 | $15,514 | $17,691 | $22,440 |
|---|
| 3/31/2023 | $14,867 | $16,422 | $23,263 |
|---|
| 4/30/2023 | $14,789 | $16,013 | $23,626 |
|---|
| 5/31/2023 | $14,511 | $15,698 | $23,729 |
|---|
| 6/30/2023 | $15,725 | $16,945 | $25,297 |
|---|
| 7/31/2023 | $16,494 | $18,224 | $26,110 |
|---|
| 8/31/2023 | $16,026 | $17,347 | $25,694 |
|---|
| 9/30/2023 | $15,157 | $16,443 | $24,469 |
|---|
| 10/31/2023 | $14,321 | $15,463 | $23,955 |
|---|
| 11/30/2023 | $15,436 | $16,854 | $26,142 |
|---|
| 12/31/2023 | $16,959 | $18,952 | $27,330 |
|---|
| 1/31/2024 | $16,679 | $18,091 | $27,789 |
|---|
| 2/29/2024 | $17,272 | $18,683 | $29,273 |
|---|
| 3/31/2024 | $17,953 | $19,502 | $30,215 |
|---|
| 4/30/2024 | $16,869 | $18,259 | $28,981 |
|---|
| 5/31/2024 | $17,942 | $19,113 | $30,418 |
|---|
| 6/30/2024 | $17,685 | $18,791 | $31,509 |
|---|
| 7/31/2024 | $19,372 | $21,081 | $31,893 |
|---|
| 8/31/2024 | $19,182 | $20,686 | $32,666 |
|---|
| 9/30/2024 | $18,947 | $20,699 | $33,364 |
|---|
| 10/31/2024 | $18,690 | $20,375 | $33,061 |
|---|
| 11/30/2024 | $20,791 | $22,340 | $35,002 |
|---|
The Fund’s benchmarks are unmanaged indices used as a general measure of market performance. Calculations assume the reinvestment of dividends and capital gains.
Average Annual Total Returns (%)
| AATR | 1 Year | 5 Years | 10 Years |
|---|
| Class F at NAV | 34.69% | 9.39% | 7.59% |
|---|
| Russell 2000 Value Index | 32.55% | 9.93% | 8.37% |
|---|
S&P 500 IndexFootnote Reference* | 33.89% | 15.77% | 13.35% |
|---|
| Footnote | Description |
Footnote* | The Fund has adopted the S&P 500 Index as its broad-based securities market index. |
The Fund's past performance is no guarantee of future results. The returns do not reflect the deduction of taxes that a shareholder would pay on Fund distributions or redemption of Fund shares.
(as of November 30, 2024)
| Total Net Assets | $437,043,647 |
|---|
| # of Portfolio Holdings | 65 |
|---|
| Portfolio Turnover Rate | 42% |
|---|
| Total Advisory Fees Paid | $3,001,837 |
|---|
What did the Fund invest in?
(as of November 30, 2024)
Portfolio Holdings Presented by SectorFootnote Reference* | % Footnote Reference** |
|---|
| Communication Services | 3.64% |
| Consumer Discretionary | 7.18% |
| Consumer Staples | 2.61% |
| Energy | 8.23% |
| Financials | 27.19% |
| Health Care | 6.60% |
| Industrials | 17.24% |
| Information Technology | 15.18% |
| Materials | 5.99% |
| Real Estate | 3.92% |
| Utilities | 1.47% |
| Repurchase Agreements | 0.75% |
| Total | 100.00% |
| Footnote | Description |
Footnote* | A sector may comprise several industries. |
Footnote** | Represents percent of total investments, which excludes derivatives. |
There were no material fund changes during the period.
Where can I find additional information about the Fund?
For additional information about the Fund, including its Prospectus, Statement of Additional Information, financial statements, holdings and proxy information, please visit lordabbett.com/FundDocuments.
The Fund has adopted a policy that allows it to send only one copy of the Fund's prospectus, proxy material, annual report and semiannual report (or related notice of internet availability of annual report and semiannual report) to certain shareholders residing at the same "household." This reduces Fund expenses, which benefits you and other shareholders.If you need additional copies or do not want your mailings to be "householded," please call Lord Abbett at 888-522-2388.
Lord Abbett Small Cap Value Fund
Annual Shareholder Report
November 30, 2024
lordabbett.com/FundDocuments
TSR-A-1023-F
01/25
Lord Abbett Small Cap Value Fund
Annual Shareholder Report
November 30, 2024
lordabbett.com/FundDocuments
This annual shareholder report contains important information about the Lord Abbett Small Cap Value Fund for the period of December 1, 2023 to November 30, 2024, as well as certain changes to the Fund. You can find additional information about the Fund at lordabbett.com/FundDocuments. You can also request this information by contacting us at 888-522-2388.
What were the Fund costs for the last year?
(based on a hypothetical $10,000 investment)
| Class Name | Costs of a $10,000 investment | Costs paid as a percentage of a $10,000 investment |
|---|
| Class F3 | $103 | 0.88% |
|---|
How did the Fund perform last year and what affected its performance?
For the fiscal year ended November 30, 2024, the Fund returned 34.88%, reflecting performance at the net asset value (NAV) of Class F3 shares, with all distributions reinvested, compared to the 32.55% return of a securities market index with investment characteristics similar to those of the Fund, the Russell 2000 Value Index. The Fund's broad-based securities market index, the S&P 500 Index, returned 33.89% over the same period.
Positive factors for the markets included momentum around the soft-landing narrative, which was supported by signs of a cooling labor market and a slowing economy. This led to the U.S. Federal Reserve lowering its policy rate by 50 basis points in September and an additional 25 basis points in November. There were also increased expectations in the market for further rate cuts in 2024. Mixed economic data, including softer consumer price index reports and fluctuating job market indicators, contributed to these rate cut expectations, and also sparked recession fears. However, these factors were mostly balanced by strong consumer spending and retail sales.
Top contributors to performance: Security selection within the Financials sector contributed to relative performance, led by an overweight allocation to CI Financial Corp. Security selection within the Information Technology sector also contributed to relative performance, led by an overweight allocation to Commvault Systems, Inc.
Top detractors from performance: Security selection within the Consumer Discretionary sector detracted from relative performance, led by an overweight allocation to Malibu Boats, Inc. Security selection within the Real Estate sector also detracted from relative performance, led by an overweight allocation to Marcus & Millichap, Inc.
Total Return Based on $10,000 Investment
| Class F3 | Russell 2000 Value Index | S&P 500 Index |
|---|
| 4/4/2017 | $10,000 | $10,000 | $10,000 |
|---|
| 4/30/2017 | $10,138 | $10,153 | $10,112 |
|---|
| 5/31/2017 | $9,965 | $9,837 | $10,254 |
|---|
| 6/30/2017 | $10,091 | $10,181 | $10,318 |
|---|
| 7/31/2017 | $10,098 | $10,245 | $10,530 |
|---|
| 8/31/2017 | $9,862 | $9,993 | $10,562 |
|---|
| 9/30/2017 | $10,299 | $10,701 | $10,780 |
|---|
| 10/31/2017 | $10,527 | $10,715 | $11,032 |
|---|
| 11/30/2017 | $10,838 | $11,025 | $11,370 |
|---|
| 12/31/2017 | $10,714 | $10,920 | $11,496 |
|---|
| 1/31/2018 | $11,014 | $11,054 | $12,155 |
|---|
| 2/28/2018 | $10,542 | $10,502 | $11,707 |
|---|
| 3/31/2018 | $10,586 | $10,631 | $11,409 |
|---|
| 4/30/2018 | $10,687 | $10,816 | $11,453 |
|---|
| 5/31/2018 | $11,235 | $11,445 | $11,729 |
|---|
| 6/30/2018 | $11,314 | $11,514 | $11,801 |
|---|
| 7/31/2018 | $11,531 | $11,718 | $12,240 |
|---|
| 8/31/2018 | $12,193 | $11,997 | $12,639 |
|---|
| 9/30/2018 | $12,039 | $11,699 | $12,711 |
|---|
| 10/31/2018 | $10,762 | $10,652 | $11,842 |
|---|
| 11/30/2018 | $10,771 | $10,823 | $12,083 |
|---|
| 12/31/2018 | $9,475 | $9,515 | $10,992 |
|---|
| 1/31/2019 | $10,445 | $10,556 | $11,873 |
|---|
| 2/28/2019 | $10,907 | $10,966 | $12,254 |
|---|
| 3/31/2019 | $10,656 | $10,650 | $12,493 |
|---|
| 4/30/2019 | $11,185 | $11,053 | $12,998 |
|---|
| 5/31/2019 | $10,019 | $10,150 | $12,172 |
|---|
| 6/30/2019 | $10,722 | $10,796 | $13,030 |
|---|
| 7/31/2019 | $10,733 | $10,814 | $13,218 |
|---|
| 8/31/2019 | $10,270 | $10,210 | $13,008 |
|---|
| 9/30/2019 | $10,753 | $10,734 | $13,252 |
|---|
| 10/31/2019 | $10,784 | $10,994 | $13,539 |
|---|
| 11/30/2019 | $11,082 | $11,252 | $14,030 |
|---|
| 12/31/2019 | $11,436 | $11,646 | $14,453 |
|---|
| 1/31/2020 | $10,985 | $11,018 | $14,448 |
|---|
| 2/29/2020 | $9,803 | $9,947 | $13,258 |
|---|
| 3/31/2020 | $7,125 | $7,493 | $11,621 |
|---|
| 4/30/2020 | $8,081 | $8,417 | $13,111 |
|---|
| 5/31/2020 | $8,556 | $8,659 | $13,735 |
|---|
| 6/30/2020 | $8,788 | $8,909 | $14,008 |
|---|
| 7/31/2020 | $8,996 | $9,093 | $14,798 |
|---|
| 8/31/2020 | $9,216 | $9,583 | $15,862 |
|---|
| 9/30/2020 | $8,699 | $9,137 | $15,259 |
|---|
| 10/31/2020 | $9,020 | $9,464 | $14,853 |
|---|
| 11/30/2020 | $10,629 | $11,291 | $16,479 |
|---|
| 12/31/2020 | $11,302 | $12,186 | $17,113 |
|---|
| 1/31/2021 | $11,590 | $12,827 | $16,940 |
|---|
| 2/28/2021 | $12,832 | $14,032 | $17,407 |
|---|
| 3/31/2021 | $13,354 | $14,765 | $18,169 |
|---|
| 4/30/2021 | $13,905 | $15,064 | $19,139 |
|---|
| 5/31/2021 | $14,097 | $15,532 | $19,273 |
|---|
| 6/30/2021 | $13,749 | $15,438 | $19,723 |
|---|
| 7/31/2021 | $13,318 | $14,886 | $20,191 |
|---|
| 8/31/2021 | $13,509 | $15,284 | $20,805 |
|---|
| 9/30/2021 | $13,294 | $14,978 | $19,838 |
|---|
| 10/31/2021 | $13,923 | $15,549 | $21,227 |
|---|
| 11/30/2021 | $13,593 | $15,018 | $21,080 |
|---|
| 12/31/2021 | $14,333 | $15,630 | $22,025 |
|---|
| 1/31/2022 | $13,563 | $14,719 | $20,885 |
|---|
| 2/28/2022 | $13,638 | $14,963 | $20,260 |
|---|
| 3/31/2022 | $13,413 | $15,255 | $21,012 |
|---|
| 4/30/2022 | $12,349 | $14,072 | $19,180 |
|---|
| 5/31/2022 | $12,533 | $14,342 | $19,215 |
|---|
| 6/30/2022 | $11,135 | $12,925 | $17,629 |
|---|
| 7/31/2022 | $12,110 | $14,176 | $19,254 |
|---|
| 8/31/2022 | $11,803 | $13,728 | $18,469 |
|---|
| 9/30/2022 | $10,603 | $12,329 | $16,768 |
|---|
| 10/31/2022 | $11,885 | $13,881 | $18,126 |
|---|
| 11/30/2022 | $12,390 | $14,305 | $19,139 |
|---|
| 12/31/2022 | $11,868 | $13,367 | $18,036 |
|---|
| 1/31/2023 | $13,014 | $14,642 | $19,169 |
|---|
| 2/28/2023 | $13,028 | $14,305 | $18,702 |
|---|
| 3/31/2023 | $12,487 | $13,279 | $19,388 |
|---|
| 4/30/2023 | $12,423 | $12,948 | $19,691 |
|---|
| 5/31/2023 | $12,191 | $12,693 | $19,777 |
|---|
| 6/30/2023 | $13,211 | $13,701 | $21,083 |
|---|
| 7/31/2023 | $13,858 | $14,735 | $21,761 |
|---|
| 8/31/2023 | $13,471 | $14,026 | $21,414 |
|---|
| 9/30/2023 | $12,740 | $13,296 | $20,393 |
|---|
| 10/31/2023 | $12,044 | $12,503 | $19,964 |
|---|
| 11/30/2023 | $12,979 | $13,628 | $21,788 |
|---|
| 12/31/2023 | $14,255 | $15,324 | $22,777 |
|---|
| 1/31/2024 | $14,029 | $14,628 | $23,160 |
|---|
| 2/29/2024 | $14,523 | $15,107 | $24,397 |
|---|
| 3/31/2024 | $15,101 | $15,769 | $25,182 |
|---|
| 4/30/2024 | $14,199 | $14,764 | $24,153 |
|---|
| 5/31/2024 | $15,094 | $15,455 | $25,351 |
|---|
| 6/30/2024 | $14,883 | $15,194 | $26,260 |
|---|
| 7/31/2024 | $16,307 | $17,046 | $26,580 |
|---|
| 8/31/2024 | $16,144 | $16,726 | $27,225 |
|---|
| 9/30/2024 | $15,961 | $16,737 | $27,806 |
|---|
| 10/31/2024 | $15,736 | $16,475 | $27,554 |
|---|
| 11/30/2024 | $17,505 | $18,064 | $29,172 |
|---|
The Fund’s benchmarks are unmanaged indices used as a general measure of market performance. Calculations assume the reinvestment of dividends and capital gains.
Average Annual Total Returns (%)
| AATR | 1 Year | 5 Years | Since Inception 4/4/17 |
|---|
| Class F3 at NAV | 34.88% | 9.57% | 7.59% |
|---|
| Russell 2000 Value Index | 32.55% | 9.93% | 8.03% |
|---|
S&P 500 IndexFootnote Reference* | 33.89% | 15.77% | 15.01% |
|---|
| Footnote | Description |
Footnote* | The Fund has adopted the S&P 500 Index as its broad-based securities market index. |
The Fund's past performance is no guarantee of future results. The returns do not reflect the deduction of taxes that a shareholder would pay on Fund distributions or redemption of Fund shares.
(as of November 30, 2024)
| Total Net Assets | $437,043,647 |
|---|
| # of Portfolio Holdings | 65 |
|---|
| Portfolio Turnover Rate | 42% |
|---|
| Total Advisory Fees Paid | $3,001,837 |
|---|
What did the Fund invest in?
(as of November 30, 2024)
Portfolio Holdings Presented by SectorFootnote Reference* | % Footnote Reference** |
|---|
| Communication Services | 3.64% |
| Consumer Discretionary | 7.18% |
| Consumer Staples | 2.61% |
| Energy | 8.23% |
| Financials | 27.19% |
| Health Care | 6.60% |
| Industrials | 17.24% |
| Information Technology | 15.18% |
| Materials | 5.99% |
| Real Estate | 3.92% |
| Utilities | 1.47% |
| Repurchase Agreements | 0.75% |
| Total | 100.00% |
| Footnote | Description |
Footnote* | A sector may comprise several industries. |
Footnote** | Represents percent of total investments, which excludes derivatives. |
There were no material fund changes during the period.
Where can I find additional information about the Fund?
For additional information about the Fund, including its Prospectus, Statement of Additional Information, financial statements, holdings and proxy information, please visit lordabbett.com/FundDocuments.
The Fund has adopted a policy that allows it to send only one copy of the Fund's prospectus, proxy material, annual report and semiannual report (or related notice of internet availability of annual report and semiannual report) to certain shareholders residing at the same "household." This reduces Fund expenses, which benefits you and other shareholders.If you need additional copies or do not want your mailings to be "householded," please call Lord Abbett at 888-522-2388.
Lord Abbett Small Cap Value Fund
Annual Shareholder Report
November 30, 2024
lordabbett.com/FundDocuments
TSR-A-8960-F3
01/25
Lord Abbett Small Cap Value Fund
Annual Shareholder Report
November 30, 2024
lordabbett.com/FundDocuments
This annual shareholder report contains important information about the Lord Abbett Small Cap Value Fund for the period of December 1, 2023 to November 30, 2024, as well as certain changes to the Fund. You can find additional information about the Fund at lordabbett.com/FundDocuments. You can also request this information by contacting us at 888-522-2388.
What were the Fund costs for the last year?
(based on a hypothetical $10,000 investment)
| Class Name | Costs of a $10,000 investment | Costs paid as a percentage of a $10,000 investment |
|---|
| Class I | $113 | 0.96% |
|---|
How did the Fund perform last year and what affected its performance?
For the fiscal year ended November 30, 2024, the Fund returned 34.82%, reflecting performance at the net asset value (NAV) of Class I shares, with all distributions reinvested, compared to the 32.55% return of a securities market index with investment characteristics similar to those of the Fund, the Russell 2000 Value Index. The Fund's broad-based securities market index, the S&P 500 Index, returned 33.89% over the same period.
Positive factors for the markets included momentum around the soft-landing narrative, which was supported by signs of a cooling labor market and a slowing economy. This led to the U.S. Federal Reserve lowering its policy rate by 50 basis points in September and an additional 25 basis points in November. There were also increased expectations in the market for further rate cuts in 2024. Mixed economic data, including softer consumer price index reports and fluctuating job market indicators, contributed to these rate cut expectations, and also sparked recession fears. However, these factors were mostly balanced by strong consumer spending and retail sales.
Top contributors to performance: Security selection within the Financials sector contributed to relative performance, led by an overweight allocation to CI Financial Corp. Security selection within the Information Technology sector also contributed to relative performance, led by an overweight allocation to Commvault Systems, Inc.
Top detractors from performance: Security selection within the Consumer Discretionary sector detracted from relative performance, led by an overweight allocation to Malibu Boats, Inc. Security selection within the Real Estate sector also detracted from relative performance, led by an overweight allocation to Marcus & Millichap, Inc.
Total Return Based on $10,000 Investment

| Class I | Russell 2000 Value Index | S&P 500 Index |
|---|
| 11/30/2014 | $10,000 | $10,000 | $10,000 |
|---|
| 12/31/2014 | $10,132 | $10,273 | $9,975 |
|---|
| 1/31/2015 | $9,846 | $9,846 | $9,675 |
|---|
| 2/28/2015 | $10,396 | $10,303 | $10,231 |
|---|
| 3/31/2015 | $10,609 | $10,477 | $10,070 |
|---|
| 4/30/2015 | $10,389 | $10,253 | $10,166 |
|---|
| 5/31/2015 | $10,452 | $10,338 | $10,297 |
|---|
| 6/30/2015 | $10,585 | $10,351 | $10,098 |
|---|
| 7/31/2015 | $10,491 | $10,066 | $10,309 |
|---|
| 8/31/2015 | $9,832 | $9,572 | $9,687 |
|---|
| 9/30/2015 | $9,633 | $9,240 | $9,448 |
|---|
| 10/31/2015 | $10,302 | $9,758 | $10,244 |
|---|
| 11/30/2015 | $10,501 | $10,035 | $10,275 |
|---|
| 12/31/2015 | $10,039 | $9,506 | $10,113 |
|---|
| 1/31/2016 | $9,440 | $8,867 | $9,611 |
|---|
| 2/29/2016 | $9,453 | $8,928 | $9,598 |
|---|
| 3/31/2016 | $10,162 | $9,668 | $10,249 |
|---|
| 4/30/2016 | $10,251 | $9,873 | $10,289 |
|---|
| 5/31/2016 | $10,514 | $10,054 | $10,474 |
|---|
| 6/30/2016 | $10,557 | $10,084 | $10,501 |
|---|
| 7/31/2016 | $10,977 | $10,628 | $10,888 |
|---|
| 8/31/2016 | $11,164 | $10,892 | $10,903 |
|---|
| 9/30/2016 | $11,198 | $10,978 | $10,905 |
|---|
| 10/31/2016 | $10,795 | $10,617 | $10,706 |
|---|
| 11/30/2016 | $11,911 | $12,027 | $11,103 |
|---|
| 12/31/2016 | $12,118 | $12,523 | $11,322 |
|---|
| 1/31/2017 | $12,099 | $12,434 | $11,537 |
|---|
| 2/28/2017 | $12,185 | $12,614 | $11,995 |
|---|
| 3/31/2017 | $12,180 | $12,507 | $12,009 |
|---|
| 4/30/2017 | $12,233 | $12,556 | $12,132 |
|---|
| 5/31/2017 | $12,018 | $12,165 | $12,303 |
|---|
| 6/30/2017 | $12,171 | $12,591 | $12,380 |
|---|
| 7/31/2017 | $12,180 | $12,670 | $12,635 |
|---|
| 8/31/2017 | $11,899 | $12,359 | $12,673 |
|---|
| 9/30/2017 | $12,423 | $13,234 | $12,935 |
|---|
| 10/31/2017 | $12,694 | $13,251 | $13,237 |
|---|
| 11/30/2017 | $13,066 | $13,635 | $13,642 |
|---|
| 12/31/2017 | $12,919 | $13,505 | $13,794 |
|---|
| 1/31/2018 | $13,277 | $13,671 | $14,584 |
|---|
| 2/28/2018 | $12,710 | $12,988 | $14,046 |
|---|
| 3/31/2018 | $12,764 | $13,148 | $13,689 |
|---|
| 4/30/2018 | $12,881 | $13,376 | $13,742 |
|---|
| 5/31/2018 | $13,539 | $14,154 | $14,073 |
|---|
| 6/30/2018 | $13,635 | $14,240 | $14,160 |
|---|
| 7/31/2018 | $13,897 | $14,492 | $14,686 |
|---|
| 8/31/2018 | $14,693 | $14,837 | $15,165 |
|---|
| 9/30/2018 | $14,511 | $14,469 | $15,251 |
|---|
| 10/31/2018 | $12,967 | $13,173 | $14,209 |
|---|
| 11/30/2018 | $12,972 | $13,386 | $14,498 |
|---|
| 12/31/2018 | $11,413 | $11,768 | $13,189 |
|---|
| 1/31/2019 | $12,576 | $13,055 | $14,246 |
|---|
| 2/28/2019 | $13,136 | $13,562 | $14,704 |
|---|
| 3/31/2019 | $12,831 | $13,171 | $14,989 |
|---|
| 4/30/2019 | $13,466 | $13,669 | $15,596 |
|---|
| 5/31/2019 | $12,066 | $12,553 | $14,605 |
|---|
| 6/30/2019 | $12,912 | $13,352 | $15,635 |
|---|
| 7/31/2019 | $12,925 | $13,374 | $15,859 |
|---|
| 8/31/2019 | $12,365 | $12,627 | $15,608 |
|---|
| 9/30/2019 | $12,943 | $13,276 | $15,900 |
|---|
| 10/31/2019 | $12,987 | $13,597 | $16,245 |
|---|
| 11/30/2019 | $13,341 | $13,916 | $16,834 |
|---|
| 12/31/2019 | $13,762 | $14,403 | $17,342 |
|---|
| 1/31/2020 | $13,222 | $13,626 | $17,335 |
|---|
| 2/29/2020 | $11,797 | $12,302 | $15,908 |
|---|
| 3/31/2020 | $8,573 | $9,267 | $13,944 |
|---|
| 4/30/2020 | $9,724 | $10,410 | $15,731 |
|---|
| 5/31/2020 | $10,300 | $10,709 | $16,480 |
|---|
| 6/30/2020 | $10,574 | $11,019 | $16,808 |
|---|
| 7/31/2020 | $10,818 | $11,246 | $17,756 |
|---|
| 8/31/2020 | $11,085 | $11,852 | $19,032 |
|---|
| 9/30/2020 | $10,466 | $11,300 | $18,309 |
|---|
| 10/31/2020 | $10,847 | $11,704 | $17,822 |
|---|
| 11/30/2020 | $12,783 | $13,964 | $19,773 |
|---|
| 12/31/2020 | $13,590 | $15,070 | $20,533 |
|---|
| 1/31/2021 | $13,939 | $15,863 | $20,326 |
|---|
| 2/28/2021 | $15,430 | $17,353 | $20,886 |
|---|
| 3/31/2021 | $16,056 | $18,260 | $21,801 |
|---|
| 4/30/2021 | $16,717 | $18,630 | $22,964 |
|---|
| 5/31/2021 | $16,950 | $19,209 | $23,125 |
|---|
| 6/30/2021 | $16,528 | $19,093 | $23,665 |
|---|
| 7/31/2021 | $16,012 | $18,410 | $24,227 |
|---|
| 8/31/2021 | $16,237 | $18,902 | $24,963 |
|---|
| 9/30/2021 | $15,983 | $18,524 | $23,802 |
|---|
| 10/31/2021 | $16,739 | $19,230 | $25,470 |
|---|
| 11/30/2021 | $16,339 | $18,573 | $25,294 |
|---|
| 12/31/2021 | $17,226 | $19,331 | $26,427 |
|---|
| 1/31/2022 | $16,299 | $18,204 | $25,060 |
|---|
| 2/28/2022 | $16,390 | $18,505 | $24,309 |
|---|
| 3/31/2022 | $16,117 | $18,867 | $25,212 |
|---|
| 4/30/2022 | $14,835 | $17,403 | $23,013 |
|---|
| 5/31/2022 | $15,058 | $17,737 | $23,056 |
|---|
| 6/30/2022 | $13,379 | $15,985 | $21,152 |
|---|
| 7/31/2022 | $14,545 | $17,532 | $23,103 |
|---|
| 8/31/2022 | $14,173 | $16,978 | $22,161 |
|---|
| 9/30/2022 | $12,733 | $15,248 | $20,120 |
|---|
| 10/31/2022 | $14,272 | $17,167 | $21,749 |
|---|
| 11/30/2022 | $14,876 | $17,692 | $22,964 |
|---|
| 12/31/2022 | $14,248 | $16,531 | $21,641 |
|---|
| 1/31/2023 | $15,621 | $18,108 | $23,001 |
|---|
| 2/28/2023 | $15,638 | $17,691 | $22,440 |
|---|
| 3/31/2023 | $14,990 | $16,422 | $23,263 |
|---|
| 4/30/2023 | $14,913 | $16,013 | $23,626 |
|---|
| 5/31/2023 | $14,632 | $15,698 | $23,729 |
|---|
| 6/30/2023 | $15,860 | $16,945 | $25,297 |
|---|
| 7/31/2023 | $16,637 | $18,224 | $26,110 |
|---|
| 8/31/2023 | $16,167 | $17,347 | $25,694 |
|---|
| 9/30/2023 | $15,289 | $16,443 | $24,469 |
|---|
| 10/31/2023 | $14,453 | $15,463 | $23,955 |
|---|
| 11/30/2023 | $15,570 | $16,854 | $26,142 |
|---|
| 12/31/2023 | $17,109 | $18,952 | $27,330 |
|---|
| 1/31/2024 | $16,835 | $18,091 | $27,789 |
|---|
| 2/29/2024 | $17,425 | $18,683 | $29,273 |
|---|
| 3/31/2024 | $18,118 | $19,502 | $30,215 |
|---|
| 4/30/2024 | $17,032 | $18,259 | $28,981 |
|---|
| 5/31/2024 | $18,109 | $19,113 | $30,418 |
|---|
| 6/30/2024 | $17,853 | $18,791 | $31,509 |
|---|
| 7/31/2024 | $19,555 | $21,081 | $31,893 |
|---|
| 8/31/2024 | $19,367 | $20,686 | $32,666 |
|---|
| 9/30/2024 | $19,136 | $20,699 | $33,364 |
|---|
| 10/31/2024 | $18,871 | $20,375 | $33,061 |
|---|
| 11/30/2024 | $20,992 | $22,340 | $35,002 |
|---|
The Fund’s benchmarks are unmanaged indices used as a general measure of market performance. Calculations assume the reinvestment of dividends and capital gains.
Average Annual Total Returns (%)
| AATR | 1 Year | 5 Years | 10 Years |
|---|
| Class I at NAV | 34.82% | 9.49% | 7.70% |
|---|
| Russell 2000 Value Index | 32.55% | 9.93% | 8.37% |
|---|
S&P 500 IndexFootnote Reference* | 33.89% | 15.77% | 13.35% |
|---|
| Footnote | Description |
Footnote* | The Fund has adopted the S&P 500 Index as its broad-based securities market index. |
The Fund's past performance is no guarantee of future results. The returns do not reflect the deduction of taxes that a shareholder would pay on Fund distributions or redemption of Fund shares.
(as of November 30, 2024)
| Total Net Assets | $437,043,647 |
|---|
| # of Portfolio Holdings | 65 |
|---|
| Portfolio Turnover Rate | 42% |
|---|
| Total Advisory Fees Paid | $3,001,837 |
|---|
What did the Fund invest in?
(as of November 30, 2024)
Portfolio Holdings Presented by SectorFootnote Reference* | % Footnote Reference** |
|---|
| Communication Services | 3.64% |
| Consumer Discretionary | 7.18% |
| Consumer Staples | 2.61% |
| Energy | 8.23% |
| Financials | 27.19% |
| Health Care | 6.60% |
| Industrials | 17.24% |
| Information Technology | 15.18% |
| Materials | 5.99% |
| Real Estate | 3.92% |
| Utilities | 1.47% |
| Repurchase Agreements | 0.75% |
| Total | 100.00% |
| Footnote | Description |
Footnote* | A sector may comprise several industries. |
Footnote** | Represents percent of total investments, which excludes derivatives. |
There were no material fund changes during the period.
Where can I find additional information about the Fund?
For additional information about the Fund, including its Prospectus, Statement of Additional Information, financial statements, holdings and proxy information, please visit lordabbett.com/FundDocuments.
The Fund has adopted a policy that allows it to send only one copy of the Fund's prospectus, proxy material, annual report and semiannual report (or related notice of internet availability of annual report and semiannual report) to certain shareholders residing at the same "household." This reduces Fund expenses, which benefits you and other shareholders.If you need additional copies or do not want your mailings to be "householded," please call Lord Abbett at 888-522-2388.
Lord Abbett Small Cap Value Fund
Annual Shareholder Report
November 30, 2024
lordabbett.com/FundDocuments
TSR-A-687-I
01/25
Lord Abbett Small Cap Value Fund
Annual Shareholder Report
November 30, 2024
lordabbett.com/FundDocuments
This annual shareholder report contains important information about the Lord Abbett Small Cap Value Fund for the period of December 1, 2023 to November 30, 2024, as well as certain changes to the Fund. You can find additional information about the Fund at lordabbett.com/FundDocuments. You can also request this information by contacting us at 888-522-2388.
What were the Fund costs for the last year?
(based on a hypothetical $10,000 investment)
| Class Name | Costs of a $10,000 investment | Costs paid as a percentage of a $10,000 investment |
|---|
| Class P | $165 | 1.41% |
|---|
How did the Fund perform last year and what affected its performance?
For the fiscal year ended November 30, 2024, the Fund returned 34.22%, reflecting performance at the net asset value (NAV) of Class P shares, with all distributions reinvested, compared to the 32.55% return of a securities market index with investment characteristics similar to those of the Fund, the Russell 2000 Value Index. The Fund's broad-based securities market index, the S&P 500 Index, returned 33.89% over the same period.
Positive factors for the markets included momentum around the soft-landing narrative, which was supported by signs of a cooling labor market and a slowing economy. This led to the U.S. Federal Reserve lowering its policy rate by 50 basis points in September and an additional 25 basis points in November. There were also increased expectations in the market for further rate cuts in 2024. Mixed economic data, including softer consumer price index reports and fluctuating job market indicators, contributed to these rate cut expectations, and also sparked recession fears. However, these factors were mostly balanced by strong consumer spending and retail sales.
Top contributors to performance: Security selection within the Financials sector contributed to relative performance, led by an overweight allocation to CI Financial Corp. Security selection within the Information Technology sector also contributed to relative performance, led by an overweight allocation to Commvault Systems, Inc.
Top detractors from performance: Security selection within the Consumer Discretionary sector detracted from relative performance, led by an overweight allocation to Malibu Boats, Inc. Security selection within the Real Estate sector also detracted from relative performance, led by an overweight allocation to Marcus & Millichap, Inc.
Total Return Based on $10,000 Investment

| Class P | Russell 2000 Value Index | S&P 500 Index |
|---|
| 11/30/2014 | $10,000 | $10,000 | $10,000 |
|---|
| 12/31/2014 | $10,129 | $10,273 | $9,975 |
|---|
| 1/31/2015 | $9,840 | $9,846 | $9,675 |
|---|
| 2/28/2015 | $10,386 | $10,303 | $10,231 |
|---|
| 3/31/2015 | $10,592 | $10,477 | $10,070 |
|---|
| 4/30/2015 | $10,370 | $10,253 | $10,166 |
|---|
| 5/31/2015 | $10,429 | $10,338 | $10,297 |
|---|
| 6/30/2015 | $10,556 | $10,351 | $10,098 |
|---|
| 7/31/2015 | $10,461 | $10,066 | $10,309 |
|---|
| 8/31/2015 | $9,800 | $9,572 | $9,687 |
|---|
| 9/30/2015 | $9,599 | $9,240 | $9,448 |
|---|
| 10/31/2015 | $10,263 | $9,758 | $10,244 |
|---|
| 11/30/2015 | $10,457 | $10,035 | $10,275 |
|---|
| 12/31/2015 | $9,992 | $9,506 | $10,113 |
|---|
| 1/31/2016 | $9,390 | $8,867 | $9,611 |
|---|
| 2/29/2016 | $9,400 | $8,928 | $9,598 |
|---|
| 3/31/2016 | $10,101 | $9,668 | $10,249 |
|---|
| 4/30/2016 | $10,191 | $9,873 | $10,289 |
|---|
| 5/31/2016 | $10,444 | $10,054 | $10,474 |
|---|
| 6/30/2016 | $10,484 | $10,084 | $10,501 |
|---|
| 7/31/2016 | $10,896 | $10,628 | $10,888 |
|---|
| 8/31/2016 | $11,080 | $10,892 | $10,903 |
|---|
| 9/30/2016 | $11,110 | $10,978 | $10,905 |
|---|
| 10/31/2016 | $10,703 | $10,617 | $10,706 |
|---|
| 11/30/2016 | $11,806 | $12,027 | $11,103 |
|---|
| 12/31/2016 | $12,009 | $12,523 | $11,322 |
|---|
| 1/31/2017 | $11,981 | $12,434 | $11,537 |
|---|
| 2/28/2017 | $12,066 | $12,614 | $11,995 |
|---|
| 3/31/2017 | $12,055 | $12,507 | $12,009 |
|---|
| 4/30/2017 | $12,100 | $12,556 | $12,132 |
|---|
| 5/31/2017 | $11,889 | $12,165 | $12,303 |
|---|
| 6/30/2017 | $12,032 | $12,591 | $12,380 |
|---|
| 7/31/2017 | $12,038 | $12,670 | $12,635 |
|---|
| 8/31/2017 | $11,752 | $12,359 | $12,673 |
|---|
| 9/30/2017 | $12,266 | $13,234 | $12,935 |
|---|
| 10/31/2017 | $12,534 | $13,251 | $13,237 |
|---|
| 11/30/2017 | $12,893 | $13,635 | $13,642 |
|---|
| 12/31/2017 | $12,743 | $13,505 | $13,794 |
|---|
| 1/31/2018 | $13,091 | $13,671 | $14,584 |
|---|
| 2/28/2018 | $12,526 | $12,988 | $14,046 |
|---|
| 3/31/2018 | $12,572 | $13,148 | $13,689 |
|---|
| 4/30/2018 | $12,690 | $13,376 | $13,742 |
|---|
| 5/31/2018 | $13,334 | $14,154 | $14,073 |
|---|
| 6/30/2018 | $13,419 | $14,240 | $14,160 |
|---|
| 7/31/2018 | $13,668 | $14,492 | $14,686 |
|---|
| 8/31/2018 | $14,450 | $14,837 | $15,165 |
|---|
| 9/30/2018 | $14,266 | $14,469 | $15,251 |
|---|
| 10/31/2018 | $12,743 | $13,173 | $14,209 |
|---|
| 11/30/2018 | $12,743 | $13,386 | $14,498 |
|---|
| 12/31/2018 | $11,209 | $11,768 | $13,189 |
|---|
| 1/31/2019 | $12,349 | $13,055 | $14,246 |
|---|
| 2/28/2019 | $12,890 | $13,562 | $14,704 |
|---|
| 3/31/2019 | $12,588 | $13,171 | $14,989 |
|---|
| 4/30/2019 | $13,201 | $13,669 | $15,596 |
|---|
| 5/31/2019 | $11,831 | $12,553 | $14,605 |
|---|
| 6/30/2019 | $12,651 | $13,352 | $15,635 |
|---|
| 7/31/2019 | $12,659 | $13,374 | $15,859 |
|---|
| 8/31/2019 | $12,102 | $12,627 | $15,608 |
|---|
| 9/30/2019 | $12,667 | $13,276 | $15,900 |
|---|
| 10/31/2019 | $12,699 | $13,597 | $16,245 |
|---|
| 11/30/2019 | $13,050 | $13,916 | $16,834 |
|---|
| 12/31/2019 | $13,457 | $14,403 | $17,342 |
|---|
| 1/31/2020 | $12,917 | $13,626 | $17,335 |
|---|
| 2/29/2020 | $11,521 | $12,302 | $15,908 |
|---|
| 3/31/2020 | $8,371 | $9,267 | $13,944 |
|---|
| 4/30/2020 | $9,488 | $10,410 | $15,731 |
|---|
| 5/31/2020 | $10,047 | $10,709 | $16,480 |
|---|
| 6/30/2020 | $10,317 | $11,019 | $16,808 |
|---|
| 7/31/2020 | $10,548 | $11,246 | $17,756 |
|---|
| 8/31/2020 | $10,798 | $11,852 | $19,032 |
|---|
| 9/30/2020 | $10,201 | $11,300 | $18,309 |
|---|
| 10/31/2020 | $10,567 | $11,704 | $17,822 |
|---|
| 11/30/2020 | $12,445 | $13,964 | $19,773 |
|---|
| 12/31/2020 | $13,226 | $15,070 | $20,533 |
|---|
| 1/31/2021 | $13,557 | $15,863 | $20,326 |
|---|
| 2/28/2021 | $15,006 | $17,353 | $20,886 |
|---|
| 3/31/2021 | $15,609 | $18,260 | $21,801 |
|---|
| 4/30/2021 | $16,251 | $18,630 | $22,964 |
|---|
| 5/31/2021 | $16,465 | $19,209 | $23,125 |
|---|
| 6/30/2021 | $16,056 | $19,093 | $23,665 |
|---|
| 7/31/2021 | $15,541 | $18,410 | $24,227 |
|---|
| 8/31/2021 | $15,755 | $18,902 | $24,963 |
|---|
| 9/30/2021 | $15,502 | $18,524 | $23,802 |
|---|
| 10/31/2021 | $16,231 | $19,230 | $25,470 |
|---|
| 11/30/2021 | $15,833 | $18,573 | $25,294 |
|---|
| 12/31/2021 | $16,693 | $19,331 | $26,427 |
|---|
| 1/31/2022 | $15,786 | $18,204 | $25,060 |
|---|
| 2/28/2022 | $15,867 | $18,505 | $24,309 |
|---|
| 3/31/2022 | $15,600 | $18,867 | $25,212 |
|---|
| 4/30/2022 | $14,356 | $17,403 | $23,013 |
|---|
| 5/31/2022 | $14,565 | $17,737 | $23,056 |
|---|
| 6/30/2022 | $12,926 | $15,985 | $21,152 |
|---|
| 7/31/2022 | $14,054 | $17,532 | $23,103 |
|---|
| 8/31/2022 | $13,693 | $16,978 | $22,161 |
|---|
| 9/30/2022 | $12,299 | $15,248 | $20,120 |
|---|
| 10/31/2022 | $13,775 | $17,167 | $21,749 |
|---|
| 11/30/2022 | $14,356 | $17,692 | $22,964 |
|---|
| 12/31/2022 | $13,744 | $16,531 | $21,641 |
|---|
| 1/31/2023 | $15,062 | $18,108 | $23,001 |
|---|
| 2/28/2023 | $15,074 | $17,691 | $22,440 |
|---|
| 3/31/2023 | $14,445 | $16,422 | $23,263 |
|---|
| 4/30/2023 | $14,361 | $16,013 | $23,626 |
|---|
| 5/31/2023 | $14,082 | $15,698 | $23,729 |
|---|
| 6/30/2023 | $15,256 | $16,945 | $25,297 |
|---|
| 7/31/2023 | $16,006 | $18,224 | $26,110 |
|---|
| 8/31/2023 | $15,546 | $17,347 | $25,694 |
|---|
| 9/30/2023 | $14,699 | $16,443 | $24,469 |
|---|
| 10/31/2023 | $13,889 | $15,463 | $23,955 |
|---|
| 11/30/2023 | $14,953 | $16,854 | $26,142 |
|---|
| 12/31/2023 | $16,429 | $18,952 | $27,330 |
|---|
| 1/31/2024 | $16,163 | $18,091 | $27,789 |
|---|
| 2/29/2024 | $16,720 | $18,683 | $29,273 |
|---|
| 3/31/2024 | $17,373 | $19,502 | $30,215 |
|---|
| 4/30/2024 | $16,333 | $18,259 | $28,981 |
|---|
| 5/31/2024 | $17,349 | $19,113 | $30,418 |
|---|
| 6/30/2024 | $17,107 | $18,791 | $31,509 |
|---|
| 7/31/2024 | $18,728 | $21,081 | $31,893 |
|---|
| 8/31/2024 | $18,534 | $20,686 | $32,666 |
|---|
| 9/30/2024 | $18,317 | $20,699 | $33,364 |
|---|
| 10/31/2024 | $18,050 | $20,375 | $33,061 |
|---|
| 11/30/2024 | $20,071 | $22,340 | $35,002 |
|---|
The Fund’s benchmarks are unmanaged indices used as a general measure of market performance. Calculations assume the reinvestment of dividends and capital gains.
Average Annual Total Returns (%)
| AATR | 1 Year | 5 Years | 10 Years |
|---|
| Class P at NAV | 34.22% | 8.99% | 7.22% |
|---|
| Russell 2000 Value Index | 32.55% | 9.93% | 8.37% |
|---|
S&P 500 IndexFootnote Reference* | 33.89% | 15.77% | 13.35% |
|---|
| Footnote | Description |
Footnote* | The Fund has adopted the S&P 500 Index as its broad-based securities market index. |
The Fund's past performance is no guarantee of future results. The returns do not reflect the deduction of taxes that a shareholder would pay on Fund distributions or redemption of Fund shares.
(as of November 30, 2024)
| Total Net Assets | $437,043,647 |
|---|
| # of Portfolio Holdings | 65 |
|---|
| Portfolio Turnover Rate | 42% |
|---|
| Total Advisory Fees Paid | $3,001,837 |
|---|
What did the Fund invest in?
(as of November 30, 2024)
Portfolio Holdings Presented by SectorFootnote Reference* | % Footnote Reference** |
|---|
| Communication Services | 3.64% |
| Consumer Discretionary | 7.18% |
| Consumer Staples | 2.61% |
| Energy | 8.23% |
| Financials | 27.19% |
| Health Care | 6.60% |
| Industrials | 17.24% |
| Information Technology | 15.18% |
| Materials | 5.99% |
| Real Estate | 3.92% |
| Utilities | 1.47% |
| Repurchase Agreements | 0.75% |
| Total | 100.00% |
| Footnote | Description |
Footnote* | A sector may comprise several industries. |
Footnote** | Represents percent of total investments, which excludes derivatives. |
There were no material fund changes during the period.
Where can I find additional information about the Fund?
For additional information about the Fund, including its Prospectus, Statement of Additional Information, financial statements, holdings and proxy information, please visit lordabbett.com/FundDocuments.
The Fund has adopted a policy that allows it to send only one copy of the Fund's prospectus, proxy material, annual report and semiannual report (or related notice of internet availability of annual report and semiannual report) to certain shareholders residing at the same "household." This reduces Fund expenses, which benefits you and other shareholders.If you need additional copies or do not want your mailings to be "householded," please call Lord Abbett at 888-522-2388.
Lord Abbett Small Cap Value Fund
Annual Shareholder Report
November 30, 2024
lordabbett.com/FundDocuments
TSR-A-605-P
01/25
Lord Abbett Small Cap Value Fund
Annual Shareholder Report
November 30, 2024
lordabbett.com/FundDocuments
This annual shareholder report contains important information about the Lord Abbett Small Cap Value Fund for the period of December 1, 2023 to November 30, 2024, as well as certain changes to the Fund. You can find additional information about the Fund at lordabbett.com/FundDocuments. You can also request this information by contacting us at 888-522-2388.
What were the Fund costs for the last year?
(based on a hypothetical $10,000 investment)
| Class Name | Costs of a $10,000 investment | Costs paid as a percentage of a $10,000 investment |
|---|
| Class R2 | $183 | 1.56% |
|---|
How did the Fund perform last year and what affected its performance?
For the fiscal year ended November 30, 2024, the Fund returned 34.02%, reflecting performance at the net asset value (NAV) of Class R2 shares, with all distributions reinvested, compared to the 32.55% return of a securities market index with investment characteristics similar to those of the Fund, the Russell 2000 Value Index. The Fund's broad-based securities market index, the S&P 500 Index, returned 33.89% over the same period.
Positive factors for the markets included momentum around the soft-landing narrative, which was supported by signs of a cooling labor market and a slowing economy. This led to the U.S. Federal Reserve lowering its policy rate by 50 basis points in September and an additional 25 basis points in November. There were also increased expectations in the market for further rate cuts in 2024. Mixed economic data, including softer consumer price index reports and fluctuating job market indicators, contributed to these rate cut expectations, and also sparked recession fears. However, these factors were mostly balanced by strong consumer spending and retail sales.
Top contributors to performance: Security selection within the Financials sector contributed to relative performance, led by an overweight allocation to CI Financial Corp. Security selection within the Information Technology sector also contributed to relative performance, led by an overweight allocation to Commvault Systems, Inc.
Top detractors from performance: Security selection within the Consumer Discretionary sector detracted from relative performance, led by an overweight allocation to Malibu Boats, Inc. Security selection within the Real Estate sector also detracted from relative performance, led by an overweight allocation to Marcus & Millichap, Inc.
Total Return Based on $10,000 Investment

| Class R2 | Russell 2000 Value Index | S&P 500 Index |
|---|
| 11/30/2014 | $10,000 | $10,000 | $10,000 |
|---|
| 12/31/2014 | $10,125 | $10,273 | $9,975 |
|---|
| 1/31/2015 | $9,840 | $9,846 | $9,675 |
|---|
| 2/28/2015 | $10,383 | $10,303 | $10,231 |
|---|
| 3/31/2015 | $10,589 | $10,477 | $10,070 |
|---|
| 4/30/2015 | $10,367 | $10,253 | $10,166 |
|---|
| 5/31/2015 | $10,422 | $10,338 | $10,297 |
|---|
| 6/30/2015 | $10,549 | $10,351 | $10,098 |
|---|
| 7/31/2015 | $10,450 | $10,066 | $10,309 |
|---|
| 8/31/2015 | $9,788 | $9,572 | $9,687 |
|---|
| 9/30/2015 | $9,586 | $9,240 | $9,448 |
|---|
| 10/31/2015 | $10,248 | $9,758 | $10,244 |
|---|
| 11/30/2015 | $10,438 | $10,035 | $10,275 |
|---|
| 12/31/2015 | $9,976 | $9,506 | $10,113 |
|---|
| 1/31/2016 | $9,373 | $8,867 | $9,611 |
|---|
| 2/29/2016 | $9,383 | $8,928 | $9,598 |
|---|
| 3/31/2016 | $10,081 | $9,668 | $10,249 |
|---|
| 4/30/2016 | $10,170 | $9,873 | $10,289 |
|---|
| 5/31/2016 | $10,425 | $10,054 | $10,474 |
|---|
| 6/30/2016 | $10,460 | $10,084 | $10,501 |
|---|
| 7/31/2016 | $10,868 | $10,628 | $10,888 |
|---|
| 8/31/2016 | $11,048 | $10,892 | $10,903 |
|---|
| 9/30/2016 | $11,078 | $10,978 | $10,905 |
|---|
| 10/31/2016 | $10,674 | $10,617 | $10,706 |
|---|
| 11/30/2016 | $11,776 | $12,027 | $11,103 |
|---|
| 12/31/2016 | $11,975 | $12,523 | $11,322 |
|---|
| 1/31/2017 | $11,946 | $12,434 | $11,537 |
|---|
| 2/28/2017 | $12,026 | $12,614 | $11,995 |
|---|
| 3/31/2017 | $12,015 | $12,507 | $12,009 |
|---|
| 4/30/2017 | $12,061 | $12,556 | $12,132 |
|---|
| 5/31/2017 | $11,843 | $12,165 | $12,303 |
|---|
| 6/30/2017 | $11,986 | $12,591 | $12,380 |
|---|
| 7/31/2017 | $11,992 | $12,670 | $12,635 |
|---|
| 8/31/2017 | $11,706 | $12,359 | $12,673 |
|---|
| 9/30/2017 | $12,215 | $13,234 | $12,935 |
|---|
| 10/31/2017 | $12,479 | $13,251 | $13,237 |
|---|
| 11/30/2017 | $12,839 | $13,635 | $13,642 |
|---|
| 12/31/2017 | $12,689 | $13,505 | $13,794 |
|---|
| 1/31/2018 | $13,032 | $13,671 | $14,584 |
|---|
| 2/28/2018 | $12,464 | $12,988 | $14,046 |
|---|
| 3/31/2018 | $12,510 | $13,148 | $13,689 |
|---|
| 4/30/2018 | $12,629 | $13,376 | $13,742 |
|---|
| 5/31/2018 | $13,263 | $14,154 | $14,073 |
|---|
| 6/30/2018 | $13,355 | $14,240 | $14,160 |
|---|
| 7/31/2018 | $13,599 | $14,492 | $14,686 |
|---|
| 8/31/2018 | $14,371 | $14,837 | $15,165 |
|---|
| 9/30/2018 | $14,186 | $14,469 | $15,251 |
|---|
| 10/31/2018 | $12,669 | $13,173 | $14,209 |
|---|
| 11/30/2018 | $12,669 | $13,386 | $14,498 |
|---|
| 12/31/2018 | $11,140 | $11,768 | $13,189 |
|---|
| 1/31/2019 | $12,272 | $13,055 | $14,246 |
|---|
| 2/28/2019 | $12,810 | $13,562 | $14,704 |
|---|
| 3/31/2019 | $12,513 | $13,171 | $14,989 |
|---|
| 4/30/2019 | $13,123 | $13,669 | $15,596 |
|---|
| 5/31/2019 | $11,750 | $12,553 | $14,605 |
|---|
| 6/30/2019 | $12,561 | $13,352 | $15,635 |
|---|
| 7/31/2019 | $12,569 | $13,374 | $15,859 |
|---|
| 8/31/2019 | $12,023 | $12,627 | $15,608 |
|---|
| 9/30/2019 | $12,577 | $13,276 | $15,900 |
|---|
| 10/31/2019 | $12,609 | $13,597 | $16,245 |
|---|
| 11/30/2019 | $12,954 | $13,916 | $16,834 |
|---|
| 12/31/2019 | $13,352 | $14,403 | $17,342 |
|---|
| 1/31/2020 | $12,817 | $13,626 | $17,335 |
|---|
| 2/29/2020 | $11,436 | $12,302 | $15,908 |
|---|
| 3/31/2020 | $8,305 | $9,267 | $13,944 |
|---|
| 4/30/2020 | $9,413 | $10,410 | $15,731 |
|---|
| 5/31/2020 | $9,968 | $10,709 | $16,480 |
|---|
| 6/30/2020 | $10,230 | $11,019 | $16,808 |
|---|
| 7/31/2020 | $10,464 | $11,246 | $17,756 |
|---|
| 8/31/2020 | $10,716 | $11,852 | $19,032 |
|---|
| 9/30/2020 | $10,113 | $11,300 | $18,309 |
|---|
| 10/31/2020 | $10,473 | $11,704 | $17,822 |
|---|
| 11/30/2020 | $12,340 | $13,964 | $19,773 |
|---|
| 12/31/2020 | $13,112 | $15,070 | $20,533 |
|---|
| 1/31/2021 | $13,436 | $15,863 | $20,326 |
|---|
| 2/28/2021 | $14,868 | $17,353 | $20,886 |
|---|
| 3/31/2021 | $15,466 | $18,260 | $21,801 |
|---|
| 4/30/2021 | $16,094 | $18,630 | $22,964 |
|---|
| 5/31/2021 | $16,309 | $19,209 | $23,125 |
|---|
| 6/30/2021 | $15,898 | $19,093 | $23,665 |
|---|
| 7/31/2021 | $15,388 | $18,410 | $24,227 |
|---|
| 8/31/2021 | $15,603 | $18,902 | $24,963 |
|---|
| 9/30/2021 | $15,348 | $18,524 | $23,802 |
|---|
| 10/31/2021 | $16,064 | $19,230 | $25,470 |
|---|
| 11/30/2021 | $15,672 | $18,573 | $25,294 |
|---|
| 12/31/2021 | $16,518 | $19,331 | $26,427 |
|---|
| 1/31/2022 | $15,624 | $18,204 | $25,060 |
|---|
| 2/28/2022 | $15,695 | $18,505 | $24,309 |
|---|
| 3/31/2022 | $15,436 | $18,867 | $25,212 |
|---|
| 4/30/2022 | $14,201 | $17,403 | $23,013 |
|---|
| 5/31/2022 | $14,401 | $17,737 | $23,056 |
|---|
| 6/30/2022 | $12,789 | $15,985 | $21,152 |
|---|
| 7/31/2022 | $13,895 | $17,532 | $23,103 |
|---|
| 8/31/2022 | $13,530 | $16,978 | $22,161 |
|---|
| 9/30/2022 | $12,154 | $15,248 | $20,120 |
|---|
| 10/31/2022 | $13,612 | $17,167 | $21,749 |
|---|
| 11/30/2022 | $14,189 | $17,692 | $22,964 |
|---|
| 12/31/2022 | $13,583 | $16,531 | $21,641 |
|---|
| 1/31/2023 | $14,882 | $18,108 | $23,001 |
|---|
| 2/28/2023 | $14,894 | $17,691 | $22,440 |
|---|
| 3/31/2023 | $14,269 | $16,422 | $23,263 |
|---|
| 4/30/2023 | $14,184 | $16,013 | $23,626 |
|---|
| 5/31/2023 | $13,914 | $15,698 | $23,729 |
|---|
| 6/30/2023 | $15,065 | $16,945 | $25,297 |
|---|
| 7/31/2023 | $15,800 | $18,224 | $26,110 |
|---|
| 8/31/2023 | $15,347 | $17,347 | $25,694 |
|---|
| 9/30/2023 | $14,514 | $16,443 | $24,469 |
|---|
| 10/31/2023 | $13,706 | $15,463 | $23,955 |
|---|
| 11/30/2023 | $14,759 | $16,854 | $26,142 |
|---|
| 12/31/2023 | $16,204 | $18,952 | $27,330 |
|---|
| 1/31/2024 | $15,935 | $18,091 | $27,789 |
|---|
| 2/29/2024 | $16,486 | $18,683 | $29,273 |
|---|
| 3/31/2024 | $17,135 | $19,502 | $30,215 |
|---|
| 4/30/2024 | $16,106 | $18,259 | $28,981 |
|---|
| 5/31/2024 | $17,111 | $19,113 | $30,418 |
|---|
| 6/30/2024 | $16,866 | $18,791 | $31,509 |
|---|
| 7/31/2024 | $18,470 | $21,081 | $31,893 |
|---|
| 8/31/2024 | $18,274 | $20,686 | $32,666 |
|---|
| 9/30/2024 | $18,054 | $20,699 | $33,364 |
|---|
| 10/31/2024 | $17,797 | $20,375 | $33,061 |
|---|
| 11/30/2024 | $19,781 | $22,340 | $35,002 |
|---|
The Fund’s benchmarks are unmanaged indices used as a general measure of market performance. Calculations assume the reinvestment of dividends and capital gains.
Average Annual Total Returns (%)
| AATR | 1 Year | 5 Years | 10 Years |
|---|
| Class R2 at NAV | 34.02% | 8.83% | 7.06% |
|---|
| Russell 2000 Value Index | 32.55% | 9.93% | 8.37% |
|---|
S&P 500 IndexFootnote Reference* | 33.89% | 15.77% | 13.35% |
|---|
| Footnote | Description |
Footnote* | The Fund has adopted the S&P 500 Index as its broad-based securities market index. |
The Fund's past performance is no guarantee of future results. The returns do not reflect the deduction of taxes that a shareholder would pay on Fund distributions or redemption of Fund shares.
(as of November 30, 2024)
| Total Net Assets | $437,043,647 |
|---|
| # of Portfolio Holdings | 65 |
|---|
| Portfolio Turnover Rate | 42% |
|---|
| Total Advisory Fees Paid | $3,001,837 |
|---|
What did the Fund invest in?
(as of November 30, 2024)
Portfolio Holdings Presented by SectorFootnote Reference* | % Footnote Reference** |
|---|
| Communication Services | 3.64% |
| Consumer Discretionary | 7.18% |
| Consumer Staples | 2.61% |
| Energy | 8.23% |
| Financials | 27.19% |
| Health Care | 6.60% |
| Industrials | 17.24% |
| Information Technology | 15.18% |
| Materials | 5.99% |
| Real Estate | 3.92% |
| Utilities | 1.47% |
| Repurchase Agreements | 0.75% |
| Total | 100.00% |
| Footnote | Description |
Footnote* | A sector may comprise several industries. |
Footnote** | Represents percent of total investments, which excludes derivatives. |
There were no material fund changes during the period.
Where can I find additional information about the Fund?
For additional information about the Fund, including its Prospectus, Statement of Additional Information, financial statements, holdings and proxy information, please visit lordabbett.com/FundDocuments.
The Fund has adopted a policy that allows it to send only one copy of the Fund's prospectus, proxy material, annual report and semiannual report (or related notice of internet availability of annual report and semiannual report) to certain shareholders residing at the same "household." This reduces Fund expenses, which benefits you and other shareholders.If you need additional copies or do not want your mailings to be "householded," please call Lord Abbett at 888-522-2388.
Lord Abbett Small Cap Value Fund
Annual Shareholder Report
November 30, 2024
lordabbett.com/FundDocuments
TSR-A-1093-R2
01/25
Lord Abbett Small Cap Value Fund
Annual Shareholder Report
November 30, 2024
lordabbett.com/FundDocuments
This annual shareholder report contains important information about the Lord Abbett Small Cap Value Fund for the period of December 1, 2023 to November 30, 2024, as well as certain changes to the Fund. You can find additional information about the Fund at lordabbett.com/FundDocuments. You can also request this information by contacting us at 888-522-2388.
What were the Fund costs for the last year?
(based on a hypothetical $10,000 investment)
| Class Name | Costs of a $10,000 investment | Costs paid as a percentage of a $10,000 investment |
|---|
| Class R3 | $171 | 1.46% |
|---|
How did the Fund perform last year and what affected its performance?
For the fiscal year ended November 30, 2024, the Fund returned 34.16%, reflecting performance at the net asset value (NAV) of Class R3 shares, with all distributions reinvested, compared to the 32.55% return of a securities market index with investment characteristics similar to those of the Fund, the Russell 2000 Value Index. The Fund's broad-based securities market index, the S&P 500 Index, returned 33.89% over the same period.
Positive factors for the markets included momentum around the soft-landing narrative, which was supported by signs of a cooling labor market and a slowing economy. This led to the U.S. Federal Reserve lowering its policy rate by 50 basis points in September and an additional 25 basis points in November. There were also increased expectations in the market for further rate cuts in 2024. Mixed economic data, including softer consumer price index reports and fluctuating job market indicators, contributed to these rate cut expectations, and also sparked recession fears. However, these factors were mostly balanced by strong consumer spending and retail sales.
Top contributors to performance: Security selection within the Financials sector contributed to relative performance, led by an overweight allocation to CI Financial Corp. Security selection within the Information Technology sector also contributed to relative performance, led by an overweight allocation to Commvault Systems, Inc.
Top detractors from performance: Security selection within the Consumer Discretionary sector detracted from relative performance, led by an overweight allocation to Malibu Boats, Inc. Security selection within the Real Estate sector also detracted from relative performance, led by an overweight allocation to Marcus & Millichap, Inc.
Total Return Based on $10,000 Investment

| Class R3 | Russell 2000 Value Index | S&P 500 Index |
|---|
| 11/30/2014 | $10,000 | $10,000 | $10,000 |
|---|
| 12/31/2014 | $10,128 | $10,273 | $9,975 |
|---|
| 1/31/2015 | $9,841 | $9,846 | $9,675 |
|---|
| 2/28/2015 | $10,385 | $10,303 | $10,231 |
|---|
| 3/31/2015 | $10,594 | $10,477 | $10,070 |
|---|
| 4/30/2015 | $10,369 | $10,253 | $10,166 |
|---|
| 5/31/2015 | $10,428 | $10,338 | $10,297 |
|---|
| 6/30/2015 | $10,554 | $10,351 | $10,098 |
|---|
| 7/31/2015 | $10,459 | $10,066 | $10,309 |
|---|
| 8/31/2015 | $9,797 | $9,572 | $9,687 |
|---|
| 9/30/2015 | $9,596 | $9,240 | $9,448 |
|---|
| 10/31/2015 | $10,258 | $9,758 | $10,244 |
|---|
| 11/30/2015 | $10,452 | $10,035 | $10,275 |
|---|
| 12/31/2015 | $9,988 | $9,506 | $10,113 |
|---|
| 1/31/2016 | $9,389 | $8,867 | $9,611 |
|---|
| 2/29/2016 | $9,394 | $8,928 | $9,598 |
|---|
| 3/31/2016 | $10,097 | $9,668 | $10,249 |
|---|
| 4/30/2016 | $10,186 | $9,873 | $10,289 |
|---|
| 5/31/2016 | $10,443 | $10,054 | $10,474 |
|---|
| 6/30/2016 | $10,478 | $10,084 | $10,501 |
|---|
| 7/31/2016 | $10,888 | $10,628 | $10,888 |
|---|
| 8/31/2016 | $11,072 | $10,892 | $10,903 |
|---|
| 9/30/2016 | $11,101 | $10,978 | $10,905 |
|---|
| 10/31/2016 | $10,695 | $10,617 | $10,706 |
|---|
| 11/30/2016 | $11,799 | $12,027 | $11,103 |
|---|
| 12/31/2016 | $12,001 | $12,523 | $11,322 |
|---|
| 1/31/2017 | $11,978 | $12,434 | $11,537 |
|---|
| 2/28/2017 | $12,058 | $12,614 | $11,995 |
|---|
| 3/31/2017 | $12,047 | $12,507 | $12,009 |
|---|
| 4/30/2017 | $12,092 | $12,556 | $12,132 |
|---|
| 5/31/2017 | $11,882 | $12,165 | $12,303 |
|---|
| 6/30/2017 | $12,024 | $12,591 | $12,380 |
|---|
| 7/31/2017 | $12,030 | $12,670 | $12,635 |
|---|
| 8/31/2017 | $11,746 | $12,359 | $12,673 |
|---|
| 9/30/2017 | $12,257 | $13,234 | $12,935 |
|---|
| 10/31/2017 | $12,523 | $13,251 | $13,237 |
|---|
| 11/30/2017 | $12,881 | $13,635 | $13,642 |
|---|
| 12/31/2017 | $12,731 | $13,505 | $13,794 |
|---|
| 1/31/2018 | $13,077 | $13,671 | $14,584 |
|---|
| 2/28/2018 | $12,509 | $12,988 | $14,046 |
|---|
| 3/31/2018 | $12,561 | $13,148 | $13,689 |
|---|
| 4/30/2018 | $12,672 | $13,376 | $13,742 |
|---|
| 5/31/2018 | $13,319 | $14,154 | $14,073 |
|---|
| 6/30/2018 | $13,410 | $14,240 | $14,160 |
|---|
| 7/31/2018 | $13,658 | $14,492 | $14,686 |
|---|
| 8/31/2018 | $14,435 | $14,837 | $15,165 |
|---|
| 9/30/2018 | $14,246 | $14,469 | $15,251 |
|---|
| 10/31/2018 | $12,731 | $13,173 | $14,209 |
|---|
| 11/30/2018 | $12,731 | $13,386 | $14,498 |
|---|
| 12/31/2018 | $11,192 | $11,768 | $13,189 |
|---|
| 1/31/2019 | $12,332 | $13,055 | $14,246 |
|---|
| 2/28/2019 | $12,878 | $13,562 | $14,704 |
|---|
| 3/31/2019 | $12,569 | $13,171 | $14,989 |
|---|
| 4/30/2019 | $13,187 | $13,669 | $15,596 |
|---|
| 5/31/2019 | $11,809 | $12,553 | $14,605 |
|---|
| 6/30/2019 | $12,633 | $13,352 | $15,635 |
|---|
| 7/31/2019 | $12,641 | $13,374 | $15,859 |
|---|
| 8/31/2019 | $12,087 | $12,627 | $15,608 |
|---|
| 9/30/2019 | $12,649 | $13,276 | $15,900 |
|---|
| 10/31/2019 | $12,688 | $13,597 | $16,245 |
|---|
| 11/30/2019 | $13,028 | $13,916 | $16,834 |
|---|
| 12/31/2019 | $13,433 | $14,403 | $17,342 |
|---|
| 1/31/2020 | $12,898 | $13,626 | $17,335 |
|---|
| 2/29/2020 | $11,502 | $12,302 | $15,908 |
|---|
| 3/31/2020 | $8,356 | $9,267 | $13,944 |
|---|
| 4/30/2020 | $9,475 | $10,410 | $15,731 |
|---|
| 5/31/2020 | $10,029 | $10,709 | $16,480 |
|---|
| 6/30/2020 | $10,297 | $11,019 | $16,808 |
|---|
| 7/31/2020 | $10,527 | $11,246 | $17,756 |
|---|
| 8/31/2020 | $10,785 | $11,852 | $19,032 |
|---|
| 9/30/2020 | $10,173 | $11,300 | $18,309 |
|---|
| 10/31/2020 | $10,546 | $11,704 | $17,822 |
|---|
| 11/30/2020 | $12,420 | $13,964 | $19,773 |
|---|
| 12/31/2020 | $13,200 | $15,070 | $20,533 |
|---|
| 1/31/2021 | $13,528 | $15,863 | $20,326 |
|---|
| 2/28/2021 | $14,975 | $17,353 | $20,886 |
|---|
| 3/31/2021 | $15,573 | $18,260 | $21,801 |
|---|
| 4/30/2021 | $16,210 | $18,630 | $22,964 |
|---|
| 5/31/2021 | $16,423 | $19,209 | $23,125 |
|---|
| 6/30/2021 | $16,008 | $19,093 | $23,665 |
|---|
| 7/31/2021 | $15,506 | $18,410 | $24,227 |
|---|
| 8/31/2021 | $15,718 | $18,902 | $24,963 |
|---|
| 9/30/2021 | $15,458 | $18,524 | $23,802 |
|---|
| 10/31/2021 | $16,191 | $19,230 | $25,470 |
|---|
| 11/30/2021 | $15,795 | $18,573 | $25,294 |
|---|
| 12/31/2021 | $16,648 | $19,331 | $26,427 |
|---|
| 1/31/2022 | $15,738 | $18,204 | $25,060 |
|---|
| 2/28/2022 | $15,818 | $18,505 | $24,309 |
|---|
| 3/31/2022 | $15,553 | $18,867 | $25,212 |
|---|
| 4/30/2022 | $14,309 | $17,403 | $23,013 |
|---|
| 5/31/2022 | $14,516 | $17,737 | $23,056 |
|---|
| 6/30/2022 | $12,892 | $15,985 | $21,152 |
|---|
| 7/31/2022 | $14,009 | $17,532 | $23,103 |
|---|
| 8/31/2022 | $13,652 | $16,978 | $22,161 |
|---|
| 9/30/2022 | $12,258 | $15,248 | $20,120 |
|---|
| 10/31/2022 | $13,733 | $17,167 | $21,749 |
|---|
| 11/30/2022 | $14,309 | $17,692 | $22,964 |
|---|
| 12/31/2022 | $13,693 | $16,531 | $21,641 |
|---|
| 1/31/2023 | $15,010 | $18,108 | $23,001 |
|---|
| 2/28/2023 | $15,022 | $17,691 | $22,440 |
|---|
| 3/31/2023 | $14,399 | $16,422 | $23,263 |
|---|
| 4/30/2023 | $14,315 | $16,013 | $23,626 |
|---|
| 5/31/2023 | $14,040 | $15,698 | $23,729 |
|---|
| 6/30/2023 | $15,202 | $16,945 | $25,297 |
|---|
| 7/31/2023 | $15,945 | $18,224 | $26,110 |
|---|
| 8/31/2023 | $15,489 | $17,347 | $25,694 |
|---|
| 9/30/2023 | $14,651 | $16,443 | $24,469 |
|---|
| 10/31/2023 | $13,836 | $15,463 | $23,955 |
|---|
| 11/30/2023 | $14,902 | $16,854 | $26,142 |
|---|
| 12/31/2023 | $16,364 | $18,952 | $27,330 |
|---|
| 1/31/2024 | $16,100 | $18,091 | $27,789 |
|---|
| 2/29/2024 | $16,651 | $18,683 | $29,273 |
|---|
| 3/31/2024 | $17,310 | $19,502 | $30,215 |
|---|
| 4/30/2024 | $16,268 | $18,259 | $28,981 |
|---|
| 5/31/2024 | $17,286 | $19,113 | $30,418 |
|---|
| 6/30/2024 | $17,035 | $18,791 | $31,509 |
|---|
| 7/31/2024 | $18,652 | $21,081 | $31,893 |
|---|
| 8/31/2024 | $18,460 | $20,686 | $32,666 |
|---|
| 9/30/2024 | $18,245 | $20,699 | $33,364 |
|---|
| 10/31/2024 | $17,981 | $20,375 | $33,061 |
|---|
| 11/30/2024 | $19,994 | $22,340 | $35,002 |
|---|
The Fund’s benchmarks are unmanaged indices used as a general measure of market performance. Calculations assume the reinvestment of dividends and capital gains.
Average Annual Total Returns (%)
| AATR | 1 Year | 5 Years | 10 Years |
|---|
| Class R3 at NAV | 34.16% | 8.94% | 7.17% |
|---|
| Russell 2000 Value Index | 32.55% | 9.93% | 8.37% |
|---|
S&P 500 IndexFootnote Reference* | 33.89% | 15.77% | 13.35% |
|---|
| Footnote | Description |
Footnote* | The Fund has adopted the S&P 500 Index as its broad-based securities market index. |
The Fund's past performance is no guarantee of future results. The returns do not reflect the deduction of taxes that a shareholder would pay on Fund distributions or redemption of Fund shares.
(as of November 30, 2024)
| Total Net Assets | $437,043,647 |
|---|
| # of Portfolio Holdings | 65 |
|---|
| Portfolio Turnover Rate | 42% |
|---|
| Total Advisory Fees Paid | $3,001,837 |
|---|
What did the Fund invest in?
(as of November 30, 2024)
Portfolio Holdings Presented by SectorFootnote Reference* | % Footnote Reference** |
|---|
| Communication Services | 3.64% |
| Consumer Discretionary | 7.18% |
| Consumer Staples | 2.61% |
| Energy | 8.23% |
| Financials | 27.19% |
| Health Care | 6.60% |
| Industrials | 17.24% |
| Information Technology | 15.18% |
| Materials | 5.99% |
| Real Estate | 3.92% |
| Utilities | 1.47% |
| Repurchase Agreements | 0.75% |
| Total | 100.00% |
| Footnote | Description |
Footnote* | A sector may comprise several industries. |
Footnote** | Represents percent of total investments, which excludes derivatives. |
There were no material fund changes during the period.
Where can I find additional information about the Fund?
For additional information about the Fund, including its Prospectus, Statement of Additional Information, financial statements, holdings and proxy information, please visit lordabbett.com/FundDocuments.
The Fund has adopted a policy that allows it to send only one copy of the Fund's prospectus, proxy material, annual report and semiannual report (or related notice of internet availability of annual report and semiannual report) to certain shareholders residing at the same "household." This reduces Fund expenses, which benefits you and other shareholders.If you need additional copies or do not want your mailings to be "householded," please call Lord Abbett at 888-522-2388.
Lord Abbett Small Cap Value Fund
Annual Shareholder Report
November 30, 2024
lordabbett.com/FundDocuments
TSR-A-2067-R3
01/25
Lord Abbett Small Cap Value Fund
Annual Shareholder Report
November 30, 2024
lordabbett.com/FundDocuments
This annual shareholder report contains important information about the Lord Abbett Small Cap Value Fund for the period of December 1, 2023 to November 30, 2024, as well as certain changes to the Fund. You can find additional information about the Fund at lordabbett.com/FundDocuments. You can also request this information by contacting us at 888-522-2388.
What were the Fund costs for the last year?
(based on a hypothetical $10,000 investment)
| Class Name | Costs of a $10,000 investment | Costs paid as a percentage of a $10,000 investment |
|---|
| Class R4 | $142 | 1.21% |
|---|
How did the Fund perform last year and what affected its performance?
For the fiscal year ended November 30, 2024, the Fund returned 34.53%, reflecting performance at the net asset value (NAV) of Class R4 shares, with all distributions reinvested, compared to the 32.55% return of a securities market index with investment characteristics similar to those of the Fund, the Russell 2000 Value Index. The Fund's broad-based securities market index, the S&P 500 Index, returned 33.89% over the same period.
Positive factors for the markets included momentum around the soft-landing narrative, which was supported by signs of a cooling labor market and a slowing economy. This led to the U.S. Federal Reserve lowering its policy rate by 50 basis points in September and an additional 25 basis points in November. There were also increased expectations in the market for further rate cuts in 2024. Mixed economic data, including softer consumer price index reports and fluctuating job market indicators, contributed to these rate cut expectations, and also sparked recession fears. However, these factors were mostly balanced by strong consumer spending and retail sales.
Top contributors to performance: Security selection within the Financials sector contributed to relative performance, led by an overweight allocation to CI Financial Corp. Security selection within the Information Technology sector also contributed to relative performance, led by an overweight allocation to Commvault Systems, Inc.
Top detractors from performance: Security selection within the Consumer Discretionary sector detracted from relative performance, led by an overweight allocation to Malibu Boats, Inc. Security selection within the Real Estate sector also detracted from relative performance, led by an overweight allocation to Marcus & Millichap, Inc.
Total Return Based on $10,000 Investment
| Class R4 | Russell 2000 Value Index | S&P 500 Index |
|---|
| 6/30/2015 | $10,000 | $10,000 | $10,000 |
|---|
| 7/31/2015 | $9,909 | $9,724 | $10,210 |
|---|
| 8/31/2015 | $9,289 | $9,247 | $9,594 |
|---|
| 9/30/2015 | $9,099 | $8,927 | $9,356 |
|---|
| 10/31/2015 | $9,726 | $9,426 | $10,145 |
|---|
| 11/30/2015 | $9,912 | $9,694 | $10,176 |
|---|
| 12/31/2015 | $9,477 | $9,183 | $10,015 |
|---|
| 1/31/2016 | $8,908 | $8,566 | $9,518 |
|---|
| 2/29/2016 | $8,917 | $8,625 | $9,505 |
|---|
| 3/31/2016 | $9,586 | $9,340 | $10,150 |
|---|
| 4/30/2016 | $9,668 | $9,537 | $10,189 |
|---|
| 5/31/2016 | $9,914 | $9,712 | $10,372 |
|---|
| 6/30/2016 | $9,950 | $9,742 | $10,399 |
|---|
| 7/31/2016 | $10,346 | $10,267 | $10,783 |
|---|
| 8/31/2016 | $10,519 | $10,523 | $10,798 |
|---|
| 9/30/2016 | $10,551 | $10,606 | $10,800 |
|---|
| 10/31/2016 | $10,168 | $10,257 | $10,603 |
|---|
| 11/30/2016 | $11,220 | $11,618 | $10,996 |
|---|
| 12/31/2016 | $11,410 | $12,098 | $11,213 |
|---|
| 1/31/2017 | $11,390 | $12,012 | $11,426 |
|---|
| 2/28/2017 | $11,473 | $12,186 | $11,879 |
|---|
| 3/31/2017 | $11,462 | $12,082 | $11,893 |
|---|
| 4/30/2017 | $11,509 | $12,130 | $12,015 |
|---|
| 5/31/2017 | $11,307 | $11,752 | $12,184 |
|---|
| 6/30/2017 | $11,447 | $12,163 | $12,260 |
|---|
| 7/31/2017 | $11,452 | $12,240 | $12,512 |
|---|
| 8/31/2017 | $11,182 | $11,939 | $12,551 |
|---|
| 9/30/2017 | $11,675 | $12,785 | $12,810 |
|---|
| 10/31/2017 | $11,930 | $12,802 | $13,109 |
|---|
| 11/30/2017 | $12,278 | $13,172 | $13,511 |
|---|
| 12/31/2017 | $12,136 | $13,046 | $13,661 |
|---|
| 1/31/2018 | $12,469 | $13,207 | $14,443 |
|---|
| 2/28/2018 | $11,928 | $12,547 | $13,911 |
|---|
| 3/31/2018 | $11,976 | $12,702 | $13,557 |
|---|
| 4/30/2018 | $12,089 | $12,922 | $13,609 |
|---|
| 5/31/2018 | $12,706 | $13,674 | $13,937 |
|---|
| 6/30/2018 | $12,796 | $13,757 | $14,023 |
|---|
| 7/31/2018 | $13,033 | $14,000 | $14,544 |
|---|
| 8/31/2018 | $13,776 | $14,333 | $15,018 |
|---|
| 9/30/2018 | $13,603 | $13,977 | $15,104 |
|---|
| 10/31/2018 | $12,154 | $12,726 | $14,072 |
|---|
| 11/30/2018 | $12,160 | $12,931 | $14,358 |
|---|
| 12/31/2018 | $10,695 | $11,368 | $13,062 |
|---|
| 1/31/2019 | $11,786 | $12,611 | $14,109 |
|---|
| 2/28/2019 | $12,299 | $13,102 | $14,562 |
|---|
| 3/31/2019 | $12,014 | $12,724 | $14,845 |
|---|
| 4/30/2019 | $12,606 | $13,205 | $15,446 |
|---|
| 5/31/2019 | $11,294 | $12,127 | $14,464 |
|---|
| 6/30/2019 | $12,078 | $12,899 | $15,483 |
|---|
| 7/31/2019 | $12,093 | $12,920 | $15,706 |
|---|
| 8/31/2019 | $11,565 | $12,199 | $15,457 |
|---|
| 9/30/2019 | $12,107 | $12,825 | $15,746 |
|---|
| 10/31/2019 | $12,143 | $13,136 | $16,087 |
|---|
| 11/30/2019 | $12,471 | $13,443 | $16,671 |
|---|
| 12/31/2019 | $12,863 | $13,914 | $17,175 |
|---|
| 1/31/2020 | $12,352 | $13,163 | $17,168 |
|---|
| 2/29/2020 | $11,016 | $11,884 | $15,755 |
|---|
| 3/31/2020 | $8,011 | $8,952 | $13,809 |
|---|
| 4/30/2020 | $9,083 | $10,056 | $15,579 |
|---|
| 5/31/2020 | $9,611 | $10,345 | $16,321 |
|---|
| 6/30/2020 | $9,875 | $10,645 | $16,645 |
|---|
| 7/31/2020 | $10,096 | $10,864 | $17,584 |
|---|
| 8/31/2020 | $10,343 | $11,449 | $18,848 |
|---|
| 9/30/2020 | $9,764 | $10,917 | $18,132 |
|---|
| 10/31/2020 | $10,113 | $11,307 | $17,650 |
|---|
| 11/30/2020 | $11,918 | $13,490 | $19,582 |
|---|
| 12/31/2020 | $12,675 | $14,559 | $20,335 |
|---|
| 1/31/2021 | $12,994 | $15,325 | $20,129 |
|---|
| 2/28/2021 | $14,379 | $16,764 | $20,684 |
|---|
| 3/31/2021 | $14,956 | $17,640 | $21,590 |
|---|
| 4/30/2021 | $15,575 | $17,997 | $22,742 |
|---|
| 5/31/2021 | $15,782 | $18,557 | $22,901 |
|---|
| 6/30/2021 | $15,386 | $18,445 | $23,436 |
|---|
| 7/31/2021 | $14,904 | $17,785 | $23,993 |
|---|
| 8/31/2021 | $15,111 | $18,261 | $24,722 |
|---|
| 9/30/2021 | $14,870 | $17,895 | $23,572 |
|---|
| 10/31/2021 | $15,567 | $18,577 | $25,224 |
|---|
| 11/30/2021 | $15,197 | $17,943 | $25,049 |
|---|
| 12/31/2021 | $16,019 | $18,674 | $26,172 |
|---|
| 1/31/2022 | $15,156 | $17,586 | $24,817 |
|---|
| 2/28/2022 | $15,237 | $17,877 | $24,074 |
|---|
| 3/31/2022 | $14,984 | $18,226 | $24,968 |
|---|
| 4/30/2022 | $13,787 | $16,812 | $22,791 |
|---|
| 5/31/2022 | $13,990 | $17,135 | $22,833 |
|---|
| 6/30/2022 | $12,417 | $15,442 | $20,948 |
|---|
| 7/31/2022 | $13,503 | $16,937 | $22,879 |
|---|
| 8/31/2022 | $13,158 | $16,401 | $21,946 |
|---|
| 9/30/2022 | $11,819 | $14,730 | $19,925 |
|---|
| 10/31/2022 | $13,249 | $16,584 | $21,538 |
|---|
| 11/30/2022 | $13,807 | $17,091 | $22,742 |
|---|
| 12/31/2022 | $13,209 | $15,970 | $21,432 |
|---|
| 1/31/2023 | $14,483 | $17,494 | $22,778 |
|---|
| 2/28/2023 | $14,504 | $17,090 | $22,223 |
|---|
| 3/31/2023 | $13,894 | $15,865 | $23,038 |
|---|
| 4/30/2023 | $13,820 | $15,469 | $23,398 |
|---|
| 5/31/2023 | $13,556 | $15,165 | $23,500 |
|---|
| 6/30/2023 | $14,694 | $16,370 | $25,053 |
|---|
| 7/31/2023 | $15,410 | $17,605 | $25,857 |
|---|
| 8/31/2023 | $14,968 | $16,758 | $25,446 |
|---|
| 9/30/2023 | $14,157 | $15,885 | $24,232 |
|---|
| 10/31/2023 | $13,377 | $14,938 | $23,723 |
|---|
| 11/30/2023 | $14,410 | $16,282 | $25,889 |
|---|
| 12/31/2023 | $15,831 | $18,309 | $27,066 |
|---|
| 1/31/2024 | $15,578 | $17,477 | $27,520 |
|---|
| 2/29/2024 | $16,115 | $18,049 | $28,990 |
|---|
| 3/31/2024 | $16,748 | $18,840 | $29,923 |
|---|
| 4/30/2024 | $15,746 | $17,639 | $28,700 |
|---|
| 5/31/2024 | $16,738 | $18,464 | $30,124 |
|---|
| 6/30/2024 | $16,495 | $18,153 | $31,204 |
|---|
| 7/31/2024 | $18,067 | $20,366 | $31,584 |
|---|
| 8/31/2024 | $17,887 | $19,983 | $32,350 |
|---|
| 9/30/2024 | $17,676 | $19,996 | $33,041 |
|---|
| 10/31/2024 | $17,423 | $19,683 | $32,742 |
|---|
| 11/30/2024 | $19,385 | $21,582 | $34,664 |
|---|
The Fund’s benchmarks are unmanaged indices used as a general measure of market performance. Calculations assume the reinvestment of dividends and capital gains.
Average Annual Total Returns (%)
| AATR | 1 Year | 5 Years | Since Inception 6/30/15 |
|---|
| Class R4 at NAV | 34.53% | 9.22% | 7.28% |
|---|
| Russell 2000 Value Index | 32.55% | 9.93% | 8.51% |
|---|
S&P 500 IndexFootnote Reference* | 33.89% | 15.77% | 14.11% |
|---|
| Footnote | Description |
Footnote* | The Fund has adopted the S&P 500 Index as its broad-based securities market index. |
The Fund's past performance is no guarantee of future results. The returns do not reflect the deduction of taxes that a shareholder would pay on Fund distributions or redemption of Fund shares.
(as of November 30, 2024)
| Total Net Assets | $437,043,647 |
|---|
| # of Portfolio Holdings | 65 |
|---|
| Portfolio Turnover Rate | 42% |
|---|
| Total Advisory Fees Paid | $3,001,837 |
|---|
What did the Fund invest in?
(as of November 30, 2024)
Portfolio Holdings Presented by SectorFootnote Reference* | % Footnote Reference** |
|---|
| Communication Services | 3.64% |
| Consumer Discretionary | 7.18% |
| Consumer Staples | 2.61% |
| Energy | 8.23% |
| Financials | 27.19% |
| Health Care | 6.60% |
| Industrials | 17.24% |
| Information Technology | 15.18% |
| Materials | 5.99% |
| Real Estate | 3.92% |
| Utilities | 1.47% |
| Repurchase Agreements | 0.75% |
| Total | 100.00% |
| Footnote | Description |
Footnote* | A sector may comprise several industries. |
Footnote** | Represents percent of total investments, which excludes derivatives. |
There were no material fund changes during the period.
Where can I find additional information about the Fund?
For additional information about the Fund, including its Prospectus, Statement of Additional Information, financial statements, holdings and proxy information, please visit lordabbett.com/FundDocuments.
The Fund has adopted a policy that allows it to send only one copy of the Fund's prospectus, proxy material, annual report and semiannual report (or related notice of internet availability of annual report and semiannual report) to certain shareholders residing at the same "household." This reduces Fund expenses, which benefits you and other shareholders.If you need additional copies or do not want your mailings to be "householded," please call Lord Abbett at 888-522-2388.
Lord Abbett Small Cap Value Fund
Annual Shareholder Report
November 30, 2024
lordabbett.com/FundDocuments
TSR-A-8717-R4
01/25
Lord Abbett Small Cap Value Fund
Annual Shareholder Report
November 30, 2024
lordabbett.com/FundDocuments
This annual shareholder report contains important information about the Lord Abbett Small Cap Value Fund for the period of December 1, 2023 to November 30, 2024, as well as certain changes to the Fund. You can find additional information about the Fund at lordabbett.com/FundDocuments. You can also request this information by contacting us at 888-522-2388.
What were the Fund costs for the last year?
(based on a hypothetical $10,000 investment)
| Class Name | Costs of a $10,000 investment | Costs paid as a percentage of a $10,000 investment |
|---|
| Class R5 | $113 | 0.96% |
|---|
How did the Fund perform last year and what affected its performance?
For the fiscal year ended November 30, 2024, the Fund returned 34.82%, reflecting performance at the net asset value (NAV) of Class R5 shares, with all distributions reinvested, compared to the 32.55% return of a securities market index with investment characteristics similar to those of the Fund, the Russell 2000 Value Index. The Fund's broad-based securities market index, the S&P 500 Index, returned 33.89% over the same period.
Positive factors for the markets included momentum around the soft-landing narrative, which was supported by signs of a cooling labor market and a slowing economy. This led to the U.S. Federal Reserve lowering its policy rate by 50 basis points in September and an additional 25 basis points in November. There were also increased expectations in the market for further rate cuts in 2024. Mixed economic data, including softer consumer price index reports and fluctuating job market indicators, contributed to these rate cut expectations, and also sparked recession fears. However, these factors were mostly balanced by strong consumer spending and retail sales.
Top contributors to performance: Security selection within the Financials sector contributed to relative performance, led by an overweight allocation to CI Financial Corp. Security selection within the Information Technology sector also contributed to relative performance, led by an overweight allocation to Commvault Systems, Inc.
Top detractors from performance: Security selection within the Consumer Discretionary sector detracted from relative performance, led by an overweight allocation to Malibu Boats, Inc. Security selection within the Real Estate sector also detracted from relative performance, led by an overweight allocation to Marcus & Millichap, Inc.
Total Return Based on $10,000 Investment

| Class R5 | Russell 2000 Value Index | S&P 500 Index |
|---|
| 6/30/2015 | $10,000 | $10,000 | $10,000 |
|---|
| 7/31/2015 | $9,911 | $9,724 | $10,210 |
|---|
| 8/31/2015 | $9,292 | $9,247 | $9,594 |
|---|
| 9/30/2015 | $9,104 | $8,927 | $9,356 |
|---|
| 10/31/2015 | $9,737 | $9,426 | $10,145 |
|---|
| 11/30/2015 | $9,924 | $9,694 | $10,176 |
|---|
| 12/31/2015 | $9,488 | $9,183 | $10,015 |
|---|
| 1/31/2016 | $8,922 | $8,566 | $9,518 |
|---|
| 2/29/2016 | $8,930 | $8,625 | $9,505 |
|---|
| 3/31/2016 | $9,604 | $9,340 | $10,150 |
|---|
| 4/30/2016 | $9,692 | $9,537 | $10,189 |
|---|
| 5/31/2016 | $9,937 | $9,712 | $10,372 |
|---|
| 6/30/2016 | $9,977 | $9,742 | $10,399 |
|---|
| 7/31/2016 | $10,374 | $10,267 | $10,783 |
|---|
| 8/31/2016 | $10,554 | $10,523 | $10,798 |
|---|
| 9/30/2016 | $10,586 | $10,606 | $10,800 |
|---|
| 10/31/2016 | $10,202 | $10,257 | $10,603 |
|---|
| 11/30/2016 | $11,260 | $11,618 | $10,996 |
|---|
| 12/31/2016 | $11,456 | $12,098 | $11,213 |
|---|
| 1/31/2017 | $11,438 | $12,012 | $11,426 |
|---|
| 2/28/2017 | $11,519 | $12,186 | $11,879 |
|---|
| 3/31/2017 | $11,515 | $12,082 | $11,893 |
|---|
| 4/30/2017 | $11,564 | $12,130 | $12,015 |
|---|
| 5/31/2017 | $11,362 | $11,752 | $12,184 |
|---|
| 6/30/2017 | $11,506 | $12,163 | $12,260 |
|---|
| 7/31/2017 | $11,515 | $12,240 | $12,512 |
|---|
| 8/31/2017 | $11,249 | $11,939 | $12,551 |
|---|
| 9/30/2017 | $11,744 | $12,785 | $12,810 |
|---|
| 10/31/2017 | $12,000 | $12,802 | $13,109 |
|---|
| 11/30/2017 | $12,356 | $13,172 | $13,511 |
|---|
| 12/31/2017 | $12,213 | $13,046 | $13,661 |
|---|
| 1/31/2018 | $12,551 | $13,207 | $14,443 |
|---|
| 2/28/2018 | $12,011 | $12,547 | $13,911 |
|---|
| 3/31/2018 | $12,067 | $12,702 | $13,557 |
|---|
| 4/30/2018 | $12,178 | $12,922 | $13,609 |
|---|
| 5/31/2018 | $12,799 | $13,674 | $13,937 |
|---|
| 6/30/2018 | $12,895 | $13,757 | $14,023 |
|---|
| 7/31/2018 | $13,137 | $14,000 | $14,544 |
|---|
| 8/31/2018 | $13,889 | $14,333 | $15,018 |
|---|
| 9/30/2018 | $13,718 | $13,977 | $15,104 |
|---|
| 10/31/2018 | $12,259 | $12,726 | $14,072 |
|---|
| 11/30/2018 | $12,264 | $12,931 | $14,358 |
|---|
| 12/31/2018 | $10,792 | $11,368 | $13,062 |
|---|
| 1/31/2019 | $11,891 | $12,611 | $14,109 |
|---|
| 2/28/2019 | $12,419 | $13,102 | $14,562 |
|---|
| 3/31/2019 | $12,131 | $12,724 | $14,845 |
|---|
| 4/30/2019 | $12,731 | $13,205 | $15,446 |
|---|
| 5/31/2019 | $11,409 | $12,127 | $14,464 |
|---|
| 6/30/2019 | $12,208 | $12,899 | $15,483 |
|---|
| 7/31/2019 | $12,220 | $12,920 | $15,706 |
|---|
| 8/31/2019 | $11,691 | $12,199 | $15,457 |
|---|
| 9/30/2019 | $12,243 | $12,825 | $15,746 |
|---|
| 10/31/2019 | $12,278 | $13,136 | $16,087 |
|---|
| 11/30/2019 | $12,613 | $13,443 | $16,671 |
|---|
| 12/31/2019 | $13,012 | $13,914 | $17,175 |
|---|
| 1/31/2020 | $12,502 | $13,163 | $17,168 |
|---|
| 2/29/2020 | $11,156 | $11,884 | $15,755 |
|---|
| 3/31/2020 | $8,110 | $8,952 | $13,809 |
|---|
| 4/30/2020 | $9,198 | $10,056 | $15,579 |
|---|
| 5/31/2020 | $9,735 | $10,345 | $16,321 |
|---|
| 6/30/2020 | $10,000 | $10,645 | $16,645 |
|---|
| 7/31/2020 | $10,231 | $10,864 | $17,584 |
|---|
| 8/31/2020 | $10,483 | $11,449 | $18,848 |
|---|
| 9/30/2020 | $9,898 | $10,917 | $18,132 |
|---|
| 10/31/2020 | $10,259 | $11,307 | $17,650 |
|---|
| 11/30/2020 | $12,087 | $13,490 | $19,582 |
|---|
| 12/31/2020 | $12,855 | $14,559 | $20,335 |
|---|
| 1/31/2021 | $13,185 | $15,325 | $20,129 |
|---|
| 2/28/2021 | $14,592 | $16,764 | $20,684 |
|---|
| 3/31/2021 | $15,190 | $17,640 | $21,590 |
|---|
| 4/30/2021 | $15,815 | $17,997 | $22,742 |
|---|
| 5/31/2021 | $16,027 | $18,557 | $22,901 |
|---|
| 6/30/2021 | $15,636 | $18,445 | $23,436 |
|---|
| 7/31/2021 | $15,148 | $17,785 | $23,993 |
|---|
| 8/31/2021 | $15,361 | $18,261 | $24,722 |
|---|
| 9/30/2021 | $15,114 | $17,895 | $23,572 |
|---|
| 10/31/2021 | $15,828 | $18,577 | $25,224 |
|---|
| 11/30/2021 | $15,451 | $17,943 | $25,049 |
|---|
| 12/31/2021 | $16,297 | $18,674 | $26,172 |
|---|
| 1/31/2022 | $15,414 | $17,586 | $24,817 |
|---|
| 2/28/2022 | $15,500 | $17,877 | $24,074 |
|---|
| 3/31/2022 | $15,242 | $18,226 | $24,968 |
|---|
| 4/30/2022 | $14,031 | $16,812 | $22,791 |
|---|
| 5/31/2022 | $14,242 | $17,135 | $22,833 |
|---|
| 6/30/2022 | $12,648 | $15,442 | $20,948 |
|---|
| 7/31/2022 | $13,758 | $16,937 | $22,879 |
|---|
| 8/31/2022 | $13,406 | $16,401 | $21,946 |
|---|
| 9/30/2022 | $12,047 | $14,730 | $19,925 |
|---|
| 10/31/2022 | $13,500 | $16,584 | $21,538 |
|---|
| 11/30/2022 | $14,070 | $17,091 | $22,742 |
|---|
| 12/31/2022 | $13,477 | $15,970 | $21,432 |
|---|
| 1/31/2023 | $14,774 | $17,494 | $22,778 |
|---|
| 2/28/2023 | $14,790 | $17,090 | $22,223 |
|---|
| 3/31/2023 | $14,178 | $15,865 | $23,038 |
|---|
| 4/30/2023 | $14,106 | $15,469 | $23,398 |
|---|
| 5/31/2023 | $13,840 | $15,165 | $23,500 |
|---|
| 6/30/2023 | $15,000 | $16,370 | $25,053 |
|---|
| 7/31/2023 | $15,733 | $17,605 | $25,857 |
|---|
| 8/31/2023 | $15,290 | $16,758 | $25,446 |
|---|
| 9/30/2023 | $14,460 | $15,885 | $24,232 |
|---|
| 10/31/2023 | $13,671 | $14,938 | $23,723 |
|---|
| 11/30/2023 | $14,726 | $16,282 | $25,889 |
|---|
| 12/31/2023 | $16,179 | $18,309 | $27,066 |
|---|
| 1/31/2024 | $15,920 | $17,477 | $27,520 |
|---|
| 2/29/2024 | $16,486 | $18,049 | $28,990 |
|---|
| 3/31/2024 | $17,132 | $18,840 | $29,923 |
|---|
| 4/30/2024 | $16,106 | $17,639 | $28,700 |
|---|
| 5/31/2024 | $17,132 | $18,464 | $30,124 |
|---|
| 6/30/2024 | $16,890 | $18,153 | $31,204 |
|---|
| 7/31/2024 | $18,497 | $20,366 | $31,584 |
|---|
| 8/31/2024 | $18,319 | $19,983 | $32,350 |
|---|
| 9/30/2024 | $18,101 | $19,996 | $33,041 |
|---|
| 10/31/2024 | $17,851 | $19,683 | $32,742 |
|---|
| 11/30/2024 | $19,854 | $21,582 | $34,664 |
|---|
The Fund’s benchmarks are unmanaged indices used as a general measure of market performance. Calculations assume the reinvestment of dividends and capital gains.
Average Annual Total Returns (%)
| AATR | 1 Year | 5 Years | Since Inception 6/30/15 |
|---|
| Class R5 at NAV | 34.82% | 9.50% | 7.55% |
|---|
| Russell 2000 Value Index | 32.55% | 9.93% | 8.51% |
|---|
S&P 500 IndexFootnote Reference* | 33.89% | 15.77% | 14.11% |
|---|
| Footnote | Description |
Footnote* | The Fund has adopted the S&P 500 Index as its broad-based securities market index. |
The Fund's past performance is no guarantee of future results. The returns do not reflect the deduction of taxes that a shareholder would pay on Fund distributions or redemption of Fund shares.
(as of November 30, 2024)
| Total Net Assets | $437,043,647 |
|---|
| # of Portfolio Holdings | 65 |
|---|
| Portfolio Turnover Rate | 42% |
|---|
| Total Advisory Fees Paid | $3,001,837 |
|---|
What did the Fund invest in?
(as of November 30, 2024)
Portfolio Holdings Presented by SectorFootnote Reference* | % Footnote Reference** |
|---|
| Communication Services | 3.64% |
| Consumer Discretionary | 7.18% |
| Consumer Staples | 2.61% |
| Energy | 8.23% |
| Financials | 27.19% |
| Health Care | 6.60% |
| Industrials | 17.24% |
| Information Technology | 15.18% |
| Materials | 5.99% |
| Real Estate | 3.92% |
| Utilities | 1.47% |
| Repurchase Agreements | 0.75% |
| Total | 100.00% |
| Footnote | Description |
Footnote* | A sector may comprise several industries. |
Footnote** | Represents percent of total investments, which excludes derivatives. |
There were no material fund changes during the period.
Where can I find additional information about the Fund?
For additional information about the Fund, including its Prospectus, Statement of Additional Information, financial statements, holdings and proxy information, please visit lordabbett.com/FundDocuments.
The Fund has adopted a policy that allows it to send only one copy of the Fund's prospectus, proxy material, annual report and semiannual report (or related notice of internet availability of annual report and semiannual report) to certain shareholders residing at the same "household." This reduces Fund expenses, which benefits you and other shareholders.If you need additional copies or do not want your mailings to be "householded," please call Lord Abbett at 888-522-2388.
Lord Abbett Small Cap Value Fund
Annual Shareholder Report
November 30, 2024
lordabbett.com/FundDocuments
TSR-A-8749-R5
01/25
Lord Abbett Small Cap Value Fund
Annual Shareholder Report
November 30, 2024
lordabbett.com/FundDocuments
This annual shareholder report contains important information about the Lord Abbett Small Cap Value Fund for the period of December 1, 2023 to November 30, 2024, as well as certain changes to the Fund. You can find additional information about the Fund at lordabbett.com/FundDocuments. You can also request this information by contacting us at 888-522-2388.
What were the Fund costs for the last year?
(based on a hypothetical $10,000 investment)
| Class Name | Costs of a $10,000 investment | Costs paid as a percentage of a $10,000 investment |
|---|
| Class R6 | $103 | 0.88% |
|---|
How did the Fund perform last year and what affected its performance?
For the fiscal year ended November 30, 2024, the Fund returned 34.89%, reflecting performance at the net asset value (NAV) of Class R6 shares, with all distributions reinvested, compared to the 32.55% return of a securities market index with investment characteristics similar to those of the Fund, the Russell 2000 Value Index. The Fund's broad-based securities market index, the S&P 500 Index, returned 33.89% over the same period.
Positive factors for the markets included momentum around the soft-landing narrative, which was supported by signs of a cooling labor market and a slowing economy. This led to the U.S. Federal Reserve lowering its policy rate by 50 basis points in September and an additional 25 basis points in November. There were also increased expectations in the market for further rate cuts in 2024. Mixed economic data, including softer consumer price index reports and fluctuating job market indicators, contributed to these rate cut expectations, and also sparked recession fears. However, these factors were mostly balanced by strong consumer spending and retail sales.
Top contributors to performance: Security selection within the Financials sector contributed to relative performance, led by an overweight allocation to CI Financial Corp. Security selection within the Information Technology sector also contributed to relative performance, led by an overweight allocation to Commvault Systems, Inc.
Top detractors from performance: Security selection within the Consumer Discretionary sector detracted from relative performance, led by an overweight allocation to Malibu Boats, Inc. Security selection within the Real Estate sector also detracted from relative performance, led by an overweight allocation to Marcus & Millichap, Inc.
Total Return Based on $10,000 Investment

| Class R6 | Russell 2000 Value Index | S&P 500 Index |
|---|
| 6/30/2015 | $10,000 | $10,000 | $10,000 |
|---|
| 7/31/2015 | $9,914 | $9,724 | $10,210 |
|---|
| 8/31/2015 | $9,292 | $9,247 | $9,594 |
|---|
| 9/30/2015 | $9,104 | $8,927 | $9,356 |
|---|
| 10/31/2015 | $9,740 | $9,426 | $10,145 |
|---|
| 11/30/2015 | $9,928 | $9,694 | $10,176 |
|---|
| 12/31/2015 | $9,491 | $9,183 | $10,015 |
|---|
| 1/31/2016 | $8,926 | $8,566 | $9,518 |
|---|
| 2/29/2016 | $8,938 | $8,625 | $9,505 |
|---|
| 3/31/2016 | $9,611 | $9,340 | $10,150 |
|---|
| 4/30/2016 | $9,700 | $9,537 | $10,189 |
|---|
| 5/31/2016 | $9,948 | $9,712 | $10,372 |
|---|
| 6/30/2016 | $9,988 | $9,742 | $10,399 |
|---|
| 7/31/2016 | $10,385 | $10,267 | $10,783 |
|---|
| 8/31/2016 | $10,566 | $10,523 | $10,798 |
|---|
| 9/30/2016 | $10,602 | $10,606 | $10,800 |
|---|
| 10/31/2016 | $10,217 | $10,257 | $10,603 |
|---|
| 11/30/2016 | $11,275 | $11,618 | $10,996 |
|---|
| 12/31/2016 | $11,476 | $12,098 | $11,213 |
|---|
| 1/31/2017 | $11,453 | $12,012 | $11,426 |
|---|
| 2/28/2017 | $11,539 | $12,186 | $11,879 |
|---|
| 3/31/2017 | $11,534 | $12,082 | $11,893 |
|---|
| 4/30/2017 | $11,584 | $12,130 | $12,015 |
|---|
| 5/31/2017 | $11,386 | $11,752 | $12,184 |
|---|
| 6/30/2017 | $11,525 | $12,163 | $12,260 |
|---|
| 7/31/2017 | $11,534 | $12,240 | $12,512 |
|---|
| 8/31/2017 | $11,269 | $11,939 | $12,551 |
|---|
| 9/30/2017 | $11,768 | $12,785 | $12,810 |
|---|
| 10/31/2017 | $12,029 | $12,802 | $13,109 |
|---|
| 11/30/2017 | $12,380 | $13,172 | $13,511 |
|---|
| 12/31/2017 | $12,242 | $13,046 | $13,661 |
|---|
| 1/31/2018 | $12,580 | $13,207 | $14,443 |
|---|
| 2/28/2018 | $12,040 | $12,547 | $13,911 |
|---|
| 3/31/2018 | $12,095 | $12,702 | $13,557 |
|---|
| 4/30/2018 | $12,212 | $12,922 | $13,609 |
|---|
| 5/31/2018 | $12,832 | $13,674 | $13,937 |
|---|
| 6/30/2018 | $12,928 | $13,757 | $14,023 |
|---|
| 7/31/2018 | $13,170 | $14,000 | $14,544 |
|---|
| 8/31/2018 | $13,927 | $14,333 | $15,018 |
|---|
| 9/30/2018 | $13,756 | $13,977 | $15,104 |
|---|
| 10/31/2018 | $12,297 | $12,726 | $14,072 |
|---|
| 11/30/2018 | $12,302 | $12,931 | $14,358 |
|---|
| 12/31/2018 | $10,827 | $11,368 | $13,062 |
|---|
| 1/31/2019 | $11,930 | $12,611 | $14,109 |
|---|
| 2/28/2019 | $12,458 | $13,102 | $14,562 |
|---|
| 3/31/2019 | $12,176 | $12,724 | $14,845 |
|---|
| 4/30/2019 | $12,775 | $13,205 | $15,446 |
|---|
| 5/31/2019 | $11,449 | $12,127 | $14,464 |
|---|
| 6/30/2019 | $12,247 | $12,899 | $15,483 |
|---|
| 7/31/2019 | $12,258 | $12,920 | $15,706 |
|---|
| 8/31/2019 | $11,730 | $12,199 | $15,457 |
|---|
| 9/30/2019 | $12,282 | $12,825 | $15,746 |
|---|
| 10/31/2019 | $12,323 | $13,136 | $16,087 |
|---|
| 11/30/2019 | $12,658 | $13,443 | $16,671 |
|---|
| 12/31/2019 | $13,062 | $13,914 | $17,175 |
|---|
| 1/31/2020 | $12,546 | $13,163 | $17,168 |
|---|
| 2/29/2020 | $11,196 | $11,884 | $15,755 |
|---|
| 3/31/2020 | $8,142 | $8,952 | $13,809 |
|---|
| 4/30/2020 | $9,235 | $10,056 | $15,579 |
|---|
| 5/31/2020 | $9,778 | $10,345 | $16,321 |
|---|
| 6/30/2020 | $10,042 | $10,645 | $16,645 |
|---|
| 7/31/2020 | $10,273 | $10,864 | $17,584 |
|---|
| 8/31/2020 | $10,524 | $11,449 | $18,848 |
|---|
| 9/30/2020 | $9,940 | $10,917 | $18,132 |
|---|
| 10/31/2020 | $10,300 | $11,307 | $17,650 |
|---|
| 11/30/2020 | $12,139 | $13,490 | $19,582 |
|---|
| 12/31/2020 | $12,908 | $14,559 | $20,335 |
|---|
| 1/31/2021 | $13,237 | $15,325 | $20,129 |
|---|
| 2/28/2021 | $14,656 | $16,764 | $20,684 |
|---|
| 3/31/2021 | $15,252 | $17,640 | $21,590 |
|---|
| 4/30/2021 | $15,883 | $17,997 | $22,742 |
|---|
| 5/31/2021 | $16,102 | $18,557 | $22,901 |
|---|
| 6/30/2021 | $15,705 | $18,445 | $23,436 |
|---|
| 7/31/2021 | $15,211 | $17,785 | $23,993 |
|---|
| 8/31/2021 | $15,431 | $18,261 | $24,722 |
|---|
| 9/30/2021 | $15,191 | $17,895 | $23,572 |
|---|
| 10/31/2021 | $15,911 | $18,577 | $25,224 |
|---|
| 11/30/2021 | $15,527 | $17,943 | $25,049 |
|---|
| 12/31/2021 | $16,380 | $18,674 | $26,172 |
|---|
| 1/31/2022 | $15,492 | $17,586 | $24,817 |
|---|
| 2/28/2022 | $15,577 | $17,877 | $24,074 |
|---|
| 3/31/2022 | $15,328 | $18,226 | $24,968 |
|---|
| 4/30/2022 | $14,104 | $16,812 | $22,791 |
|---|
| 5/31/2022 | $14,315 | $17,135 | $22,833 |
|---|
| 6/30/2022 | $12,717 | $15,442 | $20,948 |
|---|
| 7/31/2022 | $13,840 | $16,937 | $22,879 |
|---|
| 8/31/2022 | $13,481 | $16,401 | $21,946 |
|---|
| 9/30/2022 | $12,117 | $14,730 | $19,925 |
|---|
| 10/31/2022 | $13,582 | $16,584 | $21,538 |
|---|
| 11/30/2022 | $14,159 | $17,091 | $22,742 |
|---|
| 12/31/2022 | $13,555 | $15,970 | $21,432 |
|---|
| 1/31/2023 | $14,864 | $17,494 | $22,778 |
|---|
| 2/28/2023 | $14,880 | $17,090 | $22,223 |
|---|
| 3/31/2023 | $14,262 | $15,865 | $23,038 |
|---|
| 4/30/2023 | $14,189 | $15,469 | $23,398 |
|---|
| 5/31/2023 | $13,924 | $15,165 | $23,500 |
|---|
| 6/30/2023 | $15,089 | $16,370 | $25,053 |
|---|
| 7/31/2023 | $15,828 | $17,605 | $25,857 |
|---|
| 8/31/2023 | $15,387 | $16,758 | $25,446 |
|---|
| 9/30/2023 | $14,559 | $15,885 | $24,232 |
|---|
| 10/31/2023 | $13,755 | $14,938 | $23,723 |
|---|
| 11/30/2023 | $14,824 | $16,282 | $25,889 |
|---|
| 12/31/2023 | $16,283 | $18,309 | $27,066 |
|---|
| 1/31/2024 | $16,025 | $17,477 | $27,520 |
|---|
| 2/29/2024 | $16,589 | $18,049 | $28,990 |
|---|
| 3/31/2024 | $17,250 | $18,840 | $29,923 |
|---|
| 4/30/2024 | $16,218 | $17,639 | $28,700 |
|---|
| 5/31/2024 | $17,242 | $18,464 | $30,124 |
|---|
| 6/30/2024 | $17,000 | $18,153 | $31,204 |
|---|
| 7/31/2024 | $18,627 | $20,366 | $31,584 |
|---|
| 8/31/2024 | $18,442 | $19,983 | $32,350 |
|---|
| 9/30/2024 | $18,233 | $19,996 | $33,041 |
|---|
| 10/31/2024 | $17,975 | $19,683 | $32,742 |
|---|
| 11/30/2024 | $19,997 | $21,582 | $34,664 |
|---|
The Fund’s benchmarks are unmanaged indices used as a general measure of market performance. Calculations assume the reinvestment of dividends and capital gains.
Average Annual Total Returns (%)
| AATR | 1 Year | 5 Years | Since Inception 6/30/15 |
|---|
| Class R6 at NAV | 34.89% | 9.58% | 7.63% |
|---|
| Russell 2000 Value Index | 32.55% | 9.93% | 8.51% |
|---|
S&P 500 IndexFootnote Reference* | 33.89% | 15.77% | 14.11% |
|---|
| Footnote | Description |
Footnote* | The Fund has adopted the S&P 500 Index as its broad-based securities market index. |
The Fund's past performance is no guarantee of future results. The returns do not reflect the deduction of taxes that a shareholder would pay on Fund distributions or redemption of Fund shares.
(as of November 30, 2024)
| Total Net Assets | $437,043,647 |
|---|
| # of Portfolio Holdings | 65 |
|---|
| Portfolio Turnover Rate | 42% |
|---|
| Total Advisory Fees Paid | $3,001,837 |
|---|
What did the Fund invest in?
(as of November 30, 2024)
Portfolio Holdings Presented by SectorFootnote Reference* | % Footnote Reference** |
|---|
| Communication Services | 3.64% |
| Consumer Discretionary | 7.18% |
| Consumer Staples | 2.61% |
| Energy | 8.23% |
| Financials | 27.19% |
| Health Care | 6.60% |
| Industrials | 17.24% |
| Information Technology | 15.18% |
| Materials | 5.99% |
| Real Estate | 3.92% |
| Utilities | 1.47% |
| Repurchase Agreements | 0.75% |
| Total | 100.00% |
| Footnote | Description |
Footnote* | A sector may comprise several industries. |
Footnote** | Represents percent of total investments, which excludes derivatives. |
There were no material fund changes during the period.
Where can I find additional information about the Fund?
For additional information about the Fund, including its Prospectus, Statement of Additional Information, financial statements, holdings and proxy information, please visit lordabbett.com/FundDocuments.
The Fund has adopted a policy that allows it to send only one copy of the Fund's prospectus, proxy material, annual report and semiannual report (or related notice of internet availability of annual report and semiannual report) to certain shareholders residing at the same "household." This reduces Fund expenses, which benefits you and other shareholders.If you need additional copies or do not want your mailings to be "householded," please call Lord Abbett at 888-522-2388.
Lord Abbett Small Cap Value Fund
Annual Shareholder Report
November 30, 2024
lordabbett.com/FundDocuments
TSR-A-8781-R6
01/25
Item 1(b): Not applicable.
| | (a) | In accordance with applicable requirements, the Registrant adopted a Sarbanes-Oxley Code of Ethics on June 19, 2003 that applies to the principal executive officer and senior financial officers of the Registrant (“Code of Ethics”). The Code of Ethics was in effect during the fiscal year ended November 30, 2024 (the “Period”). |
| | | |
| | (b) | Not applicable. |
| | | |
| | (c) | The Registrant has not amended the Code of Ethics as described in Form N-CSR during the Period. |
| | | |
| | (d) | The Registrant has not granted any waiver, including an implicit waiver, from a provision of the Code of Ethics as described in Form N-CSR during the Period. |
| | | |
| | (e) | Not applicable. |
| | | |
| | (f) | See Item 19(a)(1) concerning the filing of the Code of Ethics. |
| Item 3: | Audit Committee Financial Expert. |
| | The Registrant’s board of directors has determined that each of the following independent directors who are members of the audit committee is an audit committee financial expert: Evelyn E. Guernsey, Karla M. Rabusch, and Peter J. McNamara. Each of these persons is independent within the meaning of the Form N-CSR. |
| Item 4: | Principal Accountant Fees and Services. |
| | In response to sections (a), (b), (c) and (d) of Item 4, the aggregate fees billed to the Registrant for the fiscal years ended November 30, 2024 and 2023 by the Registrant’s principal accounting firm, Deloitte & Touche LLP, the member firms of Deloitte Touche Tohmatsu and their respective affiliates (collectively, “Deloitte”) were as follows: |
| | Fiscal year ended: |
| | 2024 | 2023 |
| Audit Fees {a} | $130,000 | $127,000 |
| Audit-Related Fees | - 0 - | - 0 - |
| Total audit and audit-related fees | 130,000 | 127,000 |
| | | |
| Tax Fees | - 0 - | - 0 - |
| All Other Fees {b} | - 0 - | - 0 - |
| | | |
| Total Fees | $130,000 | $127,000 |
{a} Consists of fees for audits of the Registrant’s annual financial statements.
{b} Fees for the fiscal year ended November 30, 2024 and 2023 consist of fees for services related to the recovery of excess dividend withholding taxes in certain jurisdictions.
(e) (1) Pursuant to Rule 2-01(c) (7) of Regulation S-X, the Registrant’s Audit Committee has adopted pre-approval policies and procedures. Such policies and procedures generally provide that the Audit Committee must pre-approve:
| · | any audit, audit-related, tax, and other services to be provided to the Lord Abbett Funds, including the Registrant, and |
| · | any audit-related, tax, and other services to be provided to the Registrant’s investment adviser and any entity controlling, controlled by or under common control with the investment adviser that provides ongoing services to one or more Funds comprising the Registrant if the engagement relates directly to operations and financial reporting of a Fund, by the independent auditor to assure that the provision of such services does not impair the auditor’s independence. |
The Audit Committee has delegated pre-approval authority to its Chair, subject to a fee limit of $10,000 per event, and not to exceed $25,000 annually. The Chair will report any pre-approval decisions to the Audit Committee at its next scheduled meeting. Unless a type of service to be provided by the independent auditor has received general pre-approval, it must be pre-approved by the Audit Committee. Any proposed services exceeding pre-approved cost levels will require specific pre-approval by the Audit Committee.
(e) (2) The Registrant’s Audit Committee has approved 100% of the services described in paragraphs (b) through (d) of this Item 4, no amount was approved by the Audit Committee pursuant to paragraph (c)(7)(i)(C) of Rule 2-01 of Regulation S-X.
(f) Not applicable.
(g) The aggregate non-audit fees billed by Deloitte for services rendered to the Registrant are shown above in the response to Item 4 (a), (b), (c) and (d) as “All Other Fees”.
The aggregate non-audit fees billed by Deloitte for services rendered to the Registrant’s investment adviser, Lord, Abbett & Co. LLC (“Lord Abbett”), for the fiscal years ended November 30, 2024 and 2023 were:
| | Fiscal year ended: |
| | 2024 | 2023 |
| All Other Fees {a} | $250,000 | $230,000 |
{a} Consist of fees for Independent Services Auditors’ Report on Controls Placed in Operation and Tests of Operating Effectiveness related to Lord Abbett’s Asset Management Services (“SOC-1 Report”).
The aggregate non-audit fees billed by Deloitte for services rendered to entities under the common control of Lord Abbett for the fiscal years ended November 30, 2024 and 2023 were:
| | Fiscal year ended: |
| | 2024 | 2023 |
| All Other Fees | $ - 0 - | $ - 0- |
(h) The Registrant’s Audit Committee has considered the provision of non-audit services that were rendered to the Registrant’s investment adviser, and any entity controlling, controlled by or under common control with the investment adviser that provides ongoing services to the Registrant, that were not pre-approved pursuant to Rule 2-01 (c)(7)(ii) of Regulation S-X and has determined that the provision of such services is compatible with maintaining Deloitte’s independence.
(i) Not Applicable.
(j) Not Applicable.
| Item 5: | Audit Committee of Listed Registrants. |
| | Not applicable. |
| | |
| Item 6: | Investments. |
| | The Registrant’s “Schedule I – Investments in securities of unaffiliated issuers” as of the close of the reporting period is included under Item 7 of this Form N-CSR. |
| Item 7: | Financial Statements and Financial Highlights for Open-End Management Investment Companies. |
| | |
| Item 8: | Changes in and Disagreements with Accountants for Open-End Management Investment Companies. |
| | |
| Item 9: | Proxy Disclosures for Open-End Management Investment Companies. |
| | |
| Item 10: | Remuneration Paid to Directors, Officers, and Others for Open-End Management Investment Companies. |
| | |
| Item 11: | Statement Regarding Basis for Approval of Investment Advisory Contract. |

LORD ABBETT
FINANCIAL STATEMENTS
AND OTHER IMPORTANT
INFORMATION
Lord Abbett
Dividend Growth Fund
Growth Opportunities Fund
Small Cap Value Fund
For the fiscal year ended November 30, 2024
Table of Contents
Schedule of Investments
DIVIDEND GROWTH FUND November 30, 2024
| Investments | | Shares | | | Fair
Value | |
| LONG-TERM INVESTMENTS 98.43% | | | |
| | | | | | | | | |
| COMMON STOCKS 98.43% | | | | | | | | |
| | | | | | | | | |
| Aerospace & Defense 1.46% | | | | | | | | |
| Northrop Grumman Corp. | | | 132,013 | | | $ | 64,640,165 | |
| | | | | | | | | |
| Banks 5.10% | | | | | | | | |
| Bank of America Corp. | | | 2,234,121 | | | | 106,143,089 | |
| JPMorgan Chase & Co. | | | 477,663 | | | | 119,282,004 | |
| Total | | | | | | | 225,425,093 | |
| | | | | | | | | |
| Beverages 1.52% | | | | | | | | |
| Coca-Cola Co. | | | 1,051,068 | | | | 67,352,437 | |
| | | | | | | | | |
| Biotechnology 1.85% | | | | | | | | |
| AbbVie, Inc. | | | 445,994 | | | | 81,585,682 | |
| | | | | | | | | |
| Building Products 1.33% | | | | | | | | |
| Allegion PLC (Ireland)(a) | | | 416,867 | | | | 58,711,548 | |
| | | | | | | | | |
| Capital Markets 7.96% | | | | | | | | |
| Ameriprise Financial, Inc. | | | 95,116 | | | | 54,593,731 | |
| Charles Schwab Corp. | | | 1,075,432 | | | | 89,002,752 | |
| Evercore, Inc. Class A | | | 152,423 | | | | 46,931,042 | |
| Morgan Stanley | | | 724,223 | | | | 95,314,989 | |
| S&P Global, Inc. | | | 125,944 | | | | 65,806,999 | |
| Total | | | | | | | 351,649,513 | |
| | | | | | | | | |
| Chemicals 1.77% | | | | | | | | |
| Linde PLC | | | 57,630 | | | | 26,566,854 | |
| Sherwin-Williams Co. | | | 130,445 | | | | 51,838,843 | |
| Total | | | | | | | 78,405,697 | |
| | | | | | | | | |
| Construction Materials 2.23% | | | | | | | | |
| CRH PLC | | | 962,302 | | | | 98,414,626 | |
| | | | | | | | | |
| Consumer Staples Distribution & Retail 4.38% | | | |
| Costco Wholesale Corp. | | | 69,087 | | | | 67,144,274 | |
| Walmart, Inc. | | | 1,367,839 | | | | 126,525,107 | |
| Total | | | | | | | 193,669,381 | |
| | | | | | | | | |
| Distributors 0.55% | | | | | | | | |
| Pool Corp. | | | 63,860 | | | | 24,080,967 | |
| Investments | | Shares | | | Fair
Value | |
| Electric: Utilities 2.12% | | | | | | | | |
| NextEra Energy, Inc. | | | 1,188,465 | | | $ | 93,496,542 | |
| | | | | | | | | |
| Electrical Equipment 1.34% | | | | | | | | |
| Eaton Corp. PLC | | | 158,059 | | | | 59,338,510 | |
| | | | | | | | | |
| Financial Services 2.65% | | | | | | | | |
| Jack Henry & Associates, Inc. | | | 76,119 | | | | 13,410,645 | |
| Mastercard, Inc. Class A | | | 194,442 | | | | 103,625,920 | |
| Total | | | | | | | 117,036,565 | |
| | | | | | | | | |
| Ground Transportation 1.40% | | | | | | | | |
| Old Dominion Freight Line, Inc. | | | 224,471 | | | | 50,537,401 | |
| Union Pacific Corp. | | | 46,077 | | | | 11,273,199 | |
| Total | | | | | | | 61,810,600 | |
| | | | | | | | | |
| Health Care Equipment & Supplies 1.67% | | | |
| Abbott Laboratories | | | 619,872 | | | | 73,622,197 | |
| | | | | | | | | |
| Health Care Providers & Services 3.88% | | | |
| UnitedHealth Group, Inc. | | | 280,813 | | | | 171,352,093 | |
| | | | | | | | | |
| Hotels, Restaurants & Leisure 1.31% | | | |
| McDonald’s Corp. | | | 194,796 | | | | 57,661,564 | |
| | | | | | | | | |
| Information Technology Services 1.47% | | | |
| Accenture PLC Class A (Ireland)(a) | | | 179,816 | | | | 65,159,924 | |
| | | | | | | | | |
| Insurance 4.16% | | | | | | | | |
| Allstate Corp. | | | 194,219 | | | | 40,279,079 | |
| Arthur J Gallagher & Co. | | | 251,746 | | | | 78,605,171 | |
| Chubb Ltd. (Switzerland)(a) | | | 224,370 | | | | 64,782,350 | |
| Total | | | | | | | 183,666,600 | |
| | | | | | | | | |
| Life Sciences Tools & Services 2.42% | | | |
| Danaher Corp. | | | 291,568 | | | | 69,885,934 | |
| West Pharmaceutical Services, Inc. | | | 113,054 | | | | 36,819,427 | |
| Total | | | | | | | 106,705,361 | |
| | See Notes to Financial Statements. | 1 |
Schedule of Investments (continued)
DIVIDEND GROWTH FUND November 30, 2024
| Investments | | Shares | | | Fair
Value | |
| Machinery 2.48% | | | | | | | | |
| Parker-Hannifin Corp. | | | 156,136 | | | $ | 109,747,994 | |
| | | | | | | | | |
| Metals & Mining 1.77% | | | | | | | | |
| Reliance, Inc. | | | 120,142 | | | | 38,594,416 | |
| Steel Dynamics, Inc. | | | 273,650 | | | | 39,753,136 | |
| Total | | | | | | | 78,347,552 | |
| | | | | | | | | |
| Multi-Utilities 1.50% | | | | | | | | |
| CMS Energy Corp. | | | 949,502 | | | | 66,189,784 | |
| | | | |
| Oil, Gas & Consumable Fuels 3.57% | | | |
| Exxon Mobil Corp. | | | 1,162,475 | | | | 137,125,551 | |
| Marathon Petroleum Corp. | | | 131,608 | | | | 20,550,589 | |
| Total | | | | | | | 157,676,140 | |
| | | | | | | | | |
| Pharmaceuticals 2.70% | | | | | | | | |
| Eli Lilly & Co. | | | 69,386 | | | | 55,186,155 | |
| Johnson & Johnson | | | 412,057 | | | | 63,872,956 | |
| Total | | | | | | | 119,059,111 | |
| | | | | | | | | |
| Professional Services 0.67% | | | | | | | | |
| Verisk Analytics, Inc. | | | 99,921 | | | | 29,397,757 | |
| |
| Semiconductors & Semiconductor Equipment 12.64% |
| Analog Devices, Inc. | | | 324,746 | | | | 70,810,865 | |
| Broadcom, Inc. | | | 667,771 | | | | 108,232,324 | |
| Lam Research Corp. | | | 347,330 | | | | 25,660,740 | |
| NVIDIA Corp. | | | 2,095,641 | | | | 289,722,368 | |
| Taiwan Semiconductor Manufacturing Co. Ltd. ADR | | | 345,822 | | | | 63,859,491 | |
| Total | | | | | | | 558,285,788 | |
| | | | | | | | | |
| Software 11.24% | | | | | | | | |
| Microsoft Corp. | | | 791,566 | | | | 335,196,538 | |
| Oracle Corp. | | | 451,402 | | | | 83,437,146 | |
| Roper Technologies, Inc. | | | 137,867 | | | | 78,093,383 | |
| Total | | | | | | | 496,727,067 | |
| Investments | | Shares | | | Fair
Value | |
| Specialty Retail 4.59% | | | | | | | | |
| Home Depot, Inc. | | | 107,778 | | | $ | 46,250,773 | |
| Lowe’s Cos., Inc. | | | 243,628 | | | | 66,371,576 | |
| TJX Cos., Inc. | | | 716,977 | | | | 90,116,839 | |
| Total | | | | | | | 202,739,188 | |
| | | | | | | | | |
| Technology Hardware, Storage & Peripherals 3.08% |
| Apple, Inc. | | | 574,182 | | | | 136,270,614 | |
| | | | | | | | | |
| Tobacco 2.66% | | | | | | | | |
| Philip Morris International, Inc. | | | 884,812 | | | | 117,733,085 | |
| | | | | | | | | |
| Trading Companies & Distributors 0.96% |
| Watsco, Inc. | | | 77,253 | | | | 42,612,755 | |
Total Common Stocks
(cost $2,604,787,764) | | | | | | | 4,348,571,900 | |
| | | | | | | | | |
| | | | Principal
Amount | | | | | |
| SHORT-TERM INVESTMENTS 1.54% |
| |
| Repurchase Agreements 1.54% |
Repurchase Agreement dated 11/29/2024, 2.200% due 12/2/2024 with Fixed Income Clearing Corp. collateralized by $68,078,300 of U.S. Treasury Note at 4.250% due 12/31/2025; value: $69,167,089; proceeds: $67,823,125
(cost $67,810,693) | | $ | 67,810,693 | | | | 67,810,693 | |
Total Investments in Securities 99.97%
(cost $2,672,598,457) | | | | | | | 4,416,382,593 | |
| Other Assets and Liabilities – Net 0.03% | | | | | | | 1,444,912 | |
| Net Assets 100.00% | | | | | | $ | 4,417,827,505 | |
| | | |
| ADR | | American Depositary Receipt. |
| (a) | | Foreign security traded in U.S. dollars. |
| | |
| 2 | See Notes to Financial Statements. |
Schedule of Investments (concluded)
DIVIDEND GROWTH FUND November 30, 2024
The following is a summary of the inputs used as of November 30, 2024 in valuing the Fund’s investments carried at fair value(1):
| Investment Type(2) | | Level 1 | | | Level 2 | | | Level 3 | | | Total | |
| Long-Term Investments | | | | | | | | | | | | | | | | |
| Common Stocks | | $ | 4,348,571,900 | | | $ | – | | | $ | – | | | $ | 4,348,571,900 | |
| Short-Term Investments | | | | | | | | | | | | | | | | |
| Repurchase Agreements | | | – | | | | 67,810,693 | | | | – | | | | 67,810,693 | |
| Total | | $ | 4,348,571,900 | | | $ | 67,810,693 | | | $ | – | | | $ | 4,416,382,593 | |
| | | |
| (1) | | Refer to Note 2(i) for a description of fair value measurements and the three-tier hierarchy of inputs. |
| (2) | | See Schedule of Investments for fair values in each industry and identification of foreign issuers and/or geography. The table above is presented by Investment Type. Industries are presented within an Investment Type should such Investment Type include securities classified as two or more levels within the three-tier fair value hierarchy. When applicable, each Level 3 security is identified on the Schedule of Investments along with the valuation technique utilized. |
A reconciliation of Level 3 investments is presented when the Fund has a material amount of Level 3 investments at the beginning or end of the year in relation to the Fund’s net assets.
| | See Notes to Financial Statements. | 3 |
Schedule of Investments
GROWTH OPPORTUNITIES FUND November 30, 2024
| Investments | | Shares | | | Fair
Value | |
| LONG-TERM INVESTMENTS 98.13% | | | | | | | | |
| | | | | | | | | |
| COMMON STOCKS 98.13% | | | | | | | | |
| | | | | | | | | |
| Aerospace & Defense 5.46% | | | | | | | | |
| AeroVironment, Inc.* | | | 30,152 | | | $ | 5,864,564 | |
| Axon Enterprise, Inc.* | | | 18,096 | | | | 11,707,388 | |
| HEICO Corp. | | | 20,350 | | | | 5,563,080 | |
| Loar Holdings, Inc.* | | | 46,811 | | | | 4,310,357 | |
| TransDigm Group, Inc. | | | 2,723 | | | | 3,411,837 | |
| Total | | | | | | | 30,857,226 | |
| | | | | | | | | |
| Banks 0.91% | | | | | | | | |
| NU Holdings Ltd. Class A (Brazil)*(a) | | | 411,751 | | | | 5,159,240 | |
| | | | | | | | | |
| Biotechnology 9.71% | | | | | | | | |
| Arcellx, Inc.* | | | 76,098 | | | | 6,701,951 | |
| Argenx SE ADR* | | | 13,654 | | | | 8,418,374 | |
| Blueprint Medicines Corp.* | | | 53,932 | | | | 5,197,966 | |
| Insmed, Inc.* | | | 90,628 | | | | 6,811,600 | |
| Krystal Biotech, Inc.* | | | 28,985 | | | | 5,722,219 | |
| Natera, Inc.* | | | 96,721 | | | | 16,227,849 | |
| REVOLUTION Medicines, Inc.* | | | 100,096 | | | | 5,790,554 | |
| Total | | | | | | | 54,870,513 | |
| | | | | | | | | |
| Broadline Retail 2.46% | | | | | | | | |
| Coupang, Inc.* | | | 221,670 | | | | 5,621,551 | |
| MercadoLibre, Inc. (Uruguay)*(a) | | | 4,179 | | | | 8,296,025 | |
| Total | | | | | | | 13,917,576 | |
| | | | | | | | | |
| Capital Markets 8.51% | | | | | | | | |
| ARES Management Corp. Class A | | | 60,872 | | | | 10,757,909 | |
| Coinbase Global, Inc. Class A* | | | 17,311 | | | | 5,127,518 | |
| Evercore, Inc. Class A | | | 18,774 | | | | 5,780,515 | |
| Jefferies Financial Group, Inc. | | | 87,088 | | | | 6,892,144 | |
| Piper Sandler Cos. | | | 17,294 | | | | 5,931,669 | |
| Investments | | Shares | | | Fair
Value | |
| Capital Markets (continued) | | | | | | | | |
| Raymond James Financial, Inc. | | | 25,734 | | | $ | 4,356,252 | |
| Tradeweb Markets, Inc. Class A | | | 68,543 | | | | 9,287,576 | |
| Total | | | | | | | 48,133,583 | |
| | | | | | | | | |
| Communications Equipment 0.90% |
| Arista Networks, Inc.* | | | 12,573 | | | | 5,102,375 | |
| | | | | | | | | |
| Construction & Engineering 5.16% | | | | | | | | |
| Comfort Systems USA, Inc. | | | 20,689 | | | | 10,205,263 | |
| EMCOR Group, Inc. | | | 22,775 | | | | 11,617,983 | |
| Quanta Services, Inc. | | | 21,395 | | | | 7,371,005 | |
| Total | | | | | | | 29,194,251 | |
| | | | | | | | | |
| Consumer Staples Distribution & Retail 1.14% |
| Maplebear, Inc.* | | | 148,020 | | | | 6,464,033 | |
| | | | | | | | | |
| Diversified Consumer Services 1.13% |
| Duolingo, Inc.* | | | 18,376 | | | | 6,399,809 | |
| | | | | | | | | |
| Electrical Equipment 2.40% | | | | | | | | |
| Vertiv Holdings Co. Class A | | | 106,462 | | | | 13,584,551 | |
| | | | | | | | | |
| Electronic Equipment, Instruments & Components 0.52% |
| Fabrinet (Thailand)*(a) | | | 12,417 | | | | 2,912,780 | |
| | | | | | | | | |
| Entertainment 4.73% | | | | | | | | |
| Liberty Media Corp.- Liberty Formula One Class A* | | | 63,782 | | | | 5,159,964 | |
| Sea Ltd. ADR* | | | 58,920 | | | | 6,705,096 | |
| Spotify Technology SA (Sweden)*(a) | | | 31,179 | | | | 14,871,136 | |
| Total | | | | | | | 26,736,196 | |
| | | | | | | | | |
| Financial Services 3.05% | | | | | | | | |
| Affirm Holdings, Inc.* | | | 89,002 | | | | 6,231,030 | |
| Toast, Inc. Class A* | | | 253,496 | | | | 11,037,216 | |
| Total | | | | | | | 17,268,246 | |
| 4 | See Notes to Financial Statements. |
Schedule of Investments (continued)
GROWTH OPPORTUNITIES FUND November 30, 2024
| Investments | | Shares | | | Fair
Value | |
| Food Products 0.70% | | | | | | | | |
| Freshpet, Inc.* | | | 25,698 | | | $ | 3,933,079 | |
| | | | | | | | | |
| Ground Transportation 1.08% | | | | | | | | |
| Saia, Inc.* | | | 10,771 | | | | 6,129,561 | |
| | | | | | | | | |
| Health Care Equipment & Supplies 3.34% |
| Glaukos Corp.* | | | 60,421 | | | | 8,679,477 | |
| Insulet Corp.* | | | 21,801 | | | | 5,816,071 | |
| PROCEPT BioRobotics Corp.* | | | 46,028 | | | | 4,399,816 | |
| Total | | | | | | | 18,895,364 | |
| |
| Hotels, Restaurants & Leisure 6.74% |
| Cava Group, Inc.* | | | 81,947 | | | | 11,546,332 | |
| DoorDash, Inc. Class A* | | | 62,721 | | | | 11,319,886 | |
| MakeMyTrip Ltd. (India)*(a) | | | 46,761 | | | | 5,365,357 | |
| Royal Caribbean Cruises Ltd. | | | 40,422 | | | | 9,865,394 | |
| Total | | | | | | | 38,096,969 | |
| | | | | | | | | |
| Information Technology Services 1.55% |
| Wix.com Ltd. (Israel)*(a) | | | 39,088 | | | | 8,745,549 | |
| | | | | | | | | |
| Interactive Media & Services 2.75% |
| Reddit, Inc. Class A* | | | 110,394 | | | | 15,531,332 | |
| | | | | | | | | |
| Machinery 1.03% | | | | | | | | |
| Crane Co. | | | 32,094 | | | | 5,843,675 | |
| | | | | | | | | |
| Media 2.55% | | | | | | | | |
| Trade Desk, Inc. Class A* | | | 112,133 | | | | 14,414,697 | |
| | | | | | | | | |
| Pharmaceuticals 0.67% | | | | | | | | |
| Intra-Cellular Therapies, Inc.* | | | 44,255 | | | | 3,790,441 | |
| | | | | | | | | |
| Professional Services 2.03% | | | | | | | | |
| Booz Allen Hamilton Holding Corp. | | | 38,196 | | | | 5,659,883 | |
| Parsons Corp.* | | | 60,412 | | | | 5,794,115 | |
| Total | | | | | | | 11,453,998 | |
| Investments | | Shares | | | Fair
Value | |
| Semiconductors & Semiconductor Equipment 0.98% |
| Astera Labs, Inc.* | | | 53,468 | | | $ | 5,520,571 | |
| | | | | | | | | |
| Software 21.61% | | | | | | | | |
| Agilysys, Inc.* | | | 29,908 | | | | 4,016,644 | |
| AppLovin Corp. Class A* | | | 63,485 | | | | 21,378,574 | |
| CyberArk Software Ltd. (Israel)*(a) | | | 46,030 | | | | 14,891,165 | |
| Datadog, Inc. Class A* | | | 50,821 | | | | 7,762,908 | |
| Fair Isaac Corp.* | | | 4,581 | | | | 10,880,012 | |
| Guidewire Software, Inc.* | | | 41,418 | | | | 8,403,298 | |
| HubSpot, Inc.* | | | 9,859 | | | | 7,108,832 | |
| Monday.com Ltd. (Israel)*(a) | | | 20,675 | | | | 5,899,818 | |
| Palantir Technologies, Inc. Class A* | | | 336,757 | | | | 22,589,660 | |
| Samsara, Inc. Class A* | | | 136,746 | | | | 7,314,544 | |
| Tyler Technologies, Inc.* | | | 9,896 | | | | 6,226,266 | |
| Varonis Systems, Inc.* | | | 113,829 | | | | 5,686,897 | |
| Total | | | | | | | 122,158,618 | |
| | | | | | | | | |
| Specialty Retail 2.18% | | | | | | | | |
| Carvana Co.* | | | 47,272 | | | | 12,310,574 | |
| | | | | | | | | |
| Textiles, Apparel & Luxury Goods 3.24% |
| Deckers Outdoor Corp.* | | | 51,012 | | | | 9,996,311 | |
| On Holding AG Class A (Switzerland)*(a) | | | 142,311 | | | | 8,301,001 | |
| Total | | | | | | | 18,297,312 | |
| | | | | | | | | |
| Trading Companies & Distributors 1.60% |
| FTAI Aviation Ltd. | | | 53,551 | | | | 9,040,480 | |
Total Common Stocks
(cost $349,809,664) | | | | | | | 554,762,599 | |
| | See Notes to Financial Statements. | 5 |
Schedule of Investments (concluded)
GROWTH OPPORTUNITIES FUND November 30, 2024
| Investments | | Principal
Amount | | | Fair
Value | |
| SHORT-TERM INVESTMENTS 2.01% |
| | | | | | | | | |
| Repurchase Agreements 2.01% |
Repurchase Agreement dated 11/29/2024, 2.200% due 12/2/2024 with Fixed Income Clearing Corp. collateralized by $11,515,100 of U.S. Treasury Note at 3.875% due 1/15/2026; value: $11,621,402; proceeds: $11,395,600
(cost $11,393,512) | | $ | 11,393,512 | | | $ | 11,393,512 | |
Total Investments in Securities 100.14%
(cost $361,203,176) | | | | | | | 566,156,111 | |
| Other Assets and Liabilities – Net (0.14)% | | | | | | | (812,327 | ) |
| Net Assets 100.00% | | | | | | $ | 565,343,784 | |
| | | |
| ADR | | American Depositary Receipt. |
| * | | Non-income producing security. |
| (a) | | Foreign security traded in U.S. dollars. |
The following is a summary of the inputs used as of November 30, 2024 in valuing the Fund’s investments carried at fair value(1):
| Investment Type(2) | | Level 1 | | | Level 2 | | | Level 3 | | | Total | |
| Long-Term Investments | | | | | | | | | | | | | | | | |
| Common Stocks | | $ | 554,762,599 | | | $ | – | | | $ | – | | | $ | 554,762,599 | |
| Short-Term Investments | | | | | | | | | | | | | | | | |
| Repurchase Agreements | | | – | | | | 11,393,512 | | | | – | | | | 11,393,512 | |
| Total | | $ | 554,762,599 | | | $ | 11,393,512 | | | $ | – | | | $ | 566,156,111 | |
| | | |
| (1) | | Refer to Note 2(i) for a description of fair value measurements and the three-tier hierarchy of inputs. |
| (2) | | See Schedule of Investments for fair values in each industry and identification of foreign issuers and/or geography. The table above is presented by Investment Type. Industries are presented within an Investment Type should such Investment Type include securities classified as two or more levels within the three-tier fair value hierarchy. When applicable, each Level 3 security is identified on the Schedule of Investments along with the valuation technique utilized. |
A reconciliation of Level 3 investments is presented when the Fund has a material amount of Level 3 investments at the beginning or end of the year in relation to the Fund’s net assets.
| 6 | See Notes to Financial Statements. |
Schedule of Investments
SMALL CAP VALUE FUND November 30, 2024
| Investments | | Shares | | | Fair
Value | |
| LONG-TERM INVESTMENTS 99.31% | | | | | | | | |
| | | | | | | | | |
| COMMON STOCKS 99.31% | | | | | | | | |
| | | | | | | | | |
| Aerospace & Defense 3.63% | | | | | | | | |
| Curtiss-Wright Corp. | | | 15,971 | | | $ | 5,967,245 | |
| Leonardo DRS, Inc.* | | | 285,225 | | | | 9,917,273 | |
| Total | | | | | | | 15,884,518 | |
| | | | | | | | | |
| Air Freight & Logistics 1.58% | | | | | | | | |
| Radiant Logistics, Inc.* | | | 925,451 | | | | 6,922,373 | |
| | | | | | | | | |
| Automobile Components 0.96% | | | | | | | | |
| Dorman Products, Inc.* | | | 29,835 | | | | 4,176,303 | |
| | | | | | | | | |
| Banks 14.24% | | | | | | | | |
| Axos Financial, Inc.* | | | 87,616 | | | | 7,258,986 | |
| Bancorp, Inc.* | | | 126,530 | | | | 7,393,148 | |
| Bank of Hawaii Corp. | | | 66,542 | | | | 5,255,487 | |
| First BanCorp | | | 359,895 | | | | 7,442,628 | |
| Heritage Financial Corp. | | | 317,381 | | | | 8,394,727 | |
| Prosperity Bancshares, Inc. | | | 76,831 | | | | 6,433,060 | |
| Seacoast Banking Corp. of Florida | | | 114,417 | | | | 3,427,933 | |
| Wintrust Financial Corp. | | | 65,793 | | | | 9,080,092 | |
| WSFS Financial Corp. | | | 125,739 | | | | 7,546,855 | |
| Total | | | | | | | 62,232,916 | |
| | | | | | | | | |
| Capital Markets 4.14% | | | | | | | | |
| Bridge Investment Group Holdings, Inc. Class A | | | 710,254 | | | | 7,024,412 | |
| CI Financial Corp.(a) | | | 220,572 | | | | 4,891,797 | |
| Moelis & Co. Class A | | | 80,244 | | | | 6,177,183 | |
| Total | | | | | | | 18,093,392 | |
| | | | | | | | | |
| Chemicals 5.99% | | | | | | | | |
| Avient Corp. | | | 172,384 | | | | 8,834,680 | |
| Element Solutions, Inc. | | | 208,745 | | | | 5,986,806 | |
| HB Fuller Co. | | | 72,929 | | | | 5,607,511 | |
| Quaker Chemical Corp. | | | 36,561 | | | | 5,765,670 | |
| Total | | | | | | | 26,194,667 | |
| Investments | | Shares | | | Fair
Value | |
| Commercial Services & Supplies 3.09% |
| Brady Corp. Class A | | | 124,144 | | | $ | 9,297,144 | |
| Vestis Corp. | | | 261,909 | | | | 4,211,497 | |
| Total | | | | | | | 13,508,641 | |
| | | | | | | | | |
| Electric: Utilities 1.47% | | | | | | | | |
| Portland General Electric Co. | | | 133,701 | | | | 6,406,952 | |
| | | | | | | | | |
| Electronic Equipment, Instruments & Components 9.78% |
| Advanced Energy Industries, Inc. | | | 85,536 | | | | 9,840,061 | |
| Belden, Inc. | | | 96,062 | | | | 11,757,989 | |
| Crane NXT Co. | | | 105,661 | | | | 6,622,832 | |
| Mirion Technologies, Inc.* | | | 562,059 | | | | 9,481,935 | |
| Vishay Precision Group, Inc.* | | | 218,736 | | | | 5,024,366 | |
| Total | | | | | | | 42,727,183 | |
| | | | | | | | | |
| Energy Equipment & Services 1.15% |
| Liberty Energy, Inc. | | | 271,889 | | | | 5,002,758 | |
| | | | | | | | | |
| Financial Services 2.81% | | | | | | | | |
| Compass Diversified Holdings | | | 273,006 | | | | 6,470,242 | |
| International Money Express, Inc.* | | | 275,228 | | | | 5,799,054 | |
| Total | | | | | | | 12,269,296 | |
| | | | | | | | | |
| Health Care Equipment & Supplies 4.02% |
| Integer Holdings Corp.* | | | 47,690 | | | | 6,700,445 | |
| Integra LifeSciences Holdings Corp.* | | | 271,509 | | | | 6,673,691 | |
| UFP Technologies, Inc.* | | | 12,943 | | | | 4,179,554 | |
| Total | | | | | | | 17,553,690 | |
| | | | | | | | | |
| Health Care Providers & Services 2.59% |
| Addus HomeCare Corp.* | | | 56,731 | | | | 6,968,836 | |
| Tenet Healthcare Corp.* | | | 30,450 | | | | 4,344,606 | |
| Total | | | | | | | 11,313,442 | |
| | See Notes to Financial Statements. | 7 |
Schedule of Investments (continued)
SMALL CAP VALUE FUND November 30, 2024
| Investments | | Shares | | | Fair
Value | |
| Household Durables 2.76% | | | | | | | | |
| Taylor Morrison Home Corp.* | | | 80,145 | | | $ | 5,920,311 | |
| Worthington Enterprises, Inc. | | | 150,207 | | | | 6,146,471 | |
| Total | | | | | | | 12,066,782 | |
| | | | | | | | | |
| Industrial REITS 1.29% | | | | | | | | |
| STAG Industrial, Inc. | | | 152,859 | | | | 5,623,683 | |
| | | | | | | | | |
| Insurance 6.02% | | | | | | | | |
| Bowhead Specialty Holdings, Inc.* | | | 195,973 | | | | 7,219,645 | |
| Kemper Corp. | | | 115,256 | | | | 8,239,652 | |
| TWFG, Inc.* | | | 88,794 | | | | 3,135,316 | |
| White Mountains Insurance Group Ltd. | | | 3,839 | | | | 7,716,352 | |
| Total | | | | | | | 26,310,965 | |
| | | | | | | | | |
| Interactive Media & Services 1.62% |
| Cars.com, Inc.* | | | 356,544 | | | | 7,084,529 | |
| | | | | | | | | |
| Leisure Products 2.96% | | | | | | | | |
| Brunswick Corp. | | | 86,170 | | | | 6,937,547 | |
| YETI Holdings, Inc.* | | | 148,765 | | | | 6,005,643 | |
| Total | | | | | | | 12,943,190 | |
| | | | | | | | | |
| Machinery 3.32% | | | | | | | | |
| Columbus McKinnon Corp. | | | 185,327 | | | | 7,281,498 | |
| Crane Co. | | | 39,702 | | | | 7,228,940 | |
| Total | | | | | | | 14,510,438 | |
| | | | | | | | | |
| Media 2.02% | | | | | | | | |
| Criteo SA ADR* | | | 216,064 | | | | 8,811,090 | |
| | | | | | | | | |
| Oil, Gas & Consumable Fuels 7.09% |
| Expand Energy Corp. | | | 60,068 | | | | 5,944,329 | |
| MEG Energy Corp.(a) | | | 284,610 | | | | 5,132,961 | |
| Northern Oil & Gas, Inc. | | | 187,930 | | | | 8,173,076 | |
| Permian Resources Corp. | | | 750,684 | | | | 11,755,712 | |
| Total | | | | | | | 31,006,078 | |
| Investments | | Shares | | | Fair
Value | |
| Professional Services 2.38% | | | | | | | | |
| Genpact Ltd. | | | 129,455 | | | $ | 5,975,643 | |
| ICF International, Inc. | | | 32,037 | | | | 4,439,367 | |
| Total | | | | | | | 10,415,010 | |
| | | | | | | | | |
| Real Estate Management & Development 2.64% |
| Cushman & Wakefield PLC* | | | 293,569 | | | | 4,491,606 | |
| Marcus & Millichap, Inc. | | | 169,135 | | | | 7,037,707 | |
| Total | | | | | | | 11,529,313 | |
| |
| Semiconductors & Semiconductor Equipment 1.38% |
| Silicon Motion Technology Corp. ADR | | | 113,463 | | | | 6,021,481 | |
| | | | | | | | | |
| Software 4.03% | | | | | | | | |
| Commvault Systems, Inc.* | | | 81,024 | | | | 13,902,908 | |
| Sapiens International Corp. NV (Israel)(b) | | | 136,030 | | | | 3,717,700 | |
| Total | | | | | | | 17,620,608 | |
| | | | | | | | | |
| Specialty Retail 0.50% | | | | | | | | |
| Academy Sports & Outdoors, Inc. | | | 44,636 | | | | 2,198,323 | |
| | | | | | | | | |
| Tobacco 2.61% | | | | | | | | |
| Turning Point Brands, Inc. | | | 184,535 | | | | 11,422,716 | |
| | | | | | | | | |
| Trading Companies & Distributors 3.24% |
| BlueLinx Holdings, Inc.* | | | 57,400 | | | | 7,215,180 | |
| GMS, Inc.* | | | 69,295 | | | | 6,953,753 | |
| Total | | | | | | | 14,168,933 | |
Total Common Stocks
(cost $317,697,709) | | | | | | | 434,019,270 | |
| 8 | See Notes to Financial Statements. |
Schedule of Investments (concluded)
SMALL CAP VALUE FUND November 30, 2024
| Investments | | Principal
Amount | | | Fair
Value | |
| SHORT-TERM INVESTMENTS 0.75% |
| | | | | | | | | |
| Repurchase Agreements 0.75% |
Repurchase Agreement dated 11/29/2024, 2.200% due 12/2/2024 with Fixed Income Clearing Corp. collateralized by $3,304,600 of U.S. Treasury Note at 3.875% due 1/15/2026; value: $3,335,189; proceeds: $3,270,225
(cost $3,269,626) | | $ | 3,269,626 | | | $ | 3,269,626 | |
Total Investments in Securities 100.06%
(cost $320,967,335) | | | | | | | 437,288,896 | |
| Other Assets and Liabilities – Net (0.06)% | | | | | | | (245,249 | ) |
| Net Assets 100.00% | | | | | | $ | 437,043,647 | |
| | | |
| ADR | | American Depositary Receipt. |
| REITS | | Real Estate Investment Trusts. |
| * | | Non-income producing security. |
| (a) | | Investment in non-U.S. dollar denominated securities. |
| (b) | | Foreign security traded in U.S. dollars. |
The following is a summary of the inputs used as of November 30, 2024 in valuing the Fund’s investments carried at fair value(1):
| Investment Type(2) | | Level 1 | | | Level 2 | | | Level 3 | | | Total | |
| Long-Term Investments | | | | | | | | | | | | | | | | |
| Common Stocks | | $ | 434,019,270 | | | $ | – | | | $ | – | | | $ | 434,019,270 | |
| Short-Term Investments | | | | | | | | | | | | | | | | |
| Repurchase Agreements | | | – | | | | 3,269,626 | | | | – | | | | 3,269,626 | |
| Total | | $ | 434,019,270 | | | $ | 3,269,626 | | | $ | – | | | $ | 437,288,896 | |
| | | |
| (1) | | Refer to Note 2(i) for a description of fair value measurements and the three-tier hierarchy of inputs. |
| (2) | | See Schedule of Investments for fair values in each industry and identification of foreign issuers and/or geography. The table above is presented by Investment Type. Industries are presented within an Investment Type should such Investment Type include securities classified as two or more levels within the three-tier fair value hierarchy. When applicable, each Level 3 security is identified on the Schedule of Investments along with the valuation technique utilized. |
A reconciliation of Level 3 investments is presented when the Fund has a material amount of Level 3 investments at the beginning or end of the year in relation to the Fund’s net assets.
| | See Notes to Financial Statements. | 9 |
Statements of Assets and Liabilities
November 30, 2024
| | | Dividend
Growth Fund | | Growth
Opportunities
Fund | | Small Cap
Value Fund | |
| ASSETS: | | | | | | | | | | | | |
| Investments in securities, at cost | | $ | 2,672,598,457 | | | $ | 361,203,176 | | | $ | 320,967,335 | |
| Investments in securities, at fair value | | $ | 4,416,382,593 | | | $ | 566,156,111 | | | $ | 437,288,896 | |
| Cash | | | 32 | | | | – | | | | 5 | |
| Receivables: | | | | | | | | | | | | |
| Interest and dividends | | | 5,837,978 | | | | 53,668 | | | | 319,113 | |
| Capital shares sold | | | 867,710 | | | | 86,376 | | | | 94,716 | |
| From advisor (See Note 3) | | | 5,345 | | | | 76,905 | | | | – | |
| Securities lending income | | | – | | | | 344 | | | | 457 | |
| Prepaid expenses and other assets | | | 92,082 | | | | 61,506 | | | | 60,530 | |
| Total assets | | | 4,423,185,740 | | | | 566,434,910 | | | | 437,763,717 | |
| LIABILITIES: | | | | | | | | | | | | |
| Payables: | | | | | | | | | | | | |
| Capital shares reacquired | | | 1,885,804 | | | | 400,897 | | | | 15,591 | |
| Management fee | | | 1,845,144 | | | | 284,943 | | | | 261,168 | |
| 12b-1 distribution plan | | | 655,043 | | | | 97,161 | | | | 69,825 | |
| Directors’ fees | | | 370,423 | | | | 95,253 | | | | 200,307 | |
| Fund administration | | | 142,594 | | | | 17,535 | | | | 13,929 | |
| Accrued expenses | | | 459,227 | | | | 195,337 | | | | 159,250 | |
| Total liabilities | | | 5,358,235 | | | | 1,091,126 | | | | 720,070 | |
| NET ASSETS | | $ | 4,417,827,505 | | | $ | 565,343,784 | | | $ | 437,043,647 | |
| COMPOSITION OF NET ASSETS: | | | | | | | | | | | | |
| Paid-in capital | | $ | 2,502,460,198 | | | $ | 383,718,529 | | | $ | 285,273,615 | |
| Total distributable earnings (loss) | | | 1,915,367,307 | | | | 181,625,255 | | | | 151,770,032 | |
| Net Assets | | $ | 4,417,827,505 | | | $ | 565,343,784 | | | $ | 437,043,647 | |
| 10 | See Notes to Financial Statements. |
Statements of Assets and Liabilities (concluded)
November 30, 2024
| | Dividend
Growth Fund | | Growth
Opportunities
Fund | | Small Cap
Value Fund | |
| | | | | | | | | | |
| Net Assets by class: | | | | | | | | | | | | |
| Class A Shares | | $ | 2,785,298,589 | | | $ | 408,013,922 | | | $ | 210,244,970 | |
| Class C Shares | | $ | 139,302,930 | | | $ | 8,453,599 | | | $ | 3,326,153 | |
| Class F Shares | | $ | 66,139,911 | | | $ | 4,872,009 | | | $ | 2,768,511 | |
| Class F3 Shares | | $ | 377,366,062 | | | $ | 75,989,257 | | | $ | 33,175,028 | |
| Class I Shares | | $ | 1,003,984,067 | | | $ | 38,335,503 | | | $ | 164,679,429 | |
| Class P Shares | | $ | 1,156,188 | | | $ | 3,485,081 | | | $ | 10,507,263 | |
| Class R2 Shares | | $ | 1,186,297 | | | $ | 438,515 | | | $ | 943,440 | |
| Class R3 Shares | | $ | 15,577,908 | | | $ | 11,993,711 | | | $ | 2,578,058 | |
| Class R4 Shares | | $ | 6,351,600 | | | $ | 2,323,497 | | | $ | 599,183 | |
| Class R5 Shares | | $ | 255,046 | | | $ | 14,728 | | | $ | 328,308 | |
| Class R6 Shares | | $ | 21,208,907 | | | $ | 11,423,962 | | | $ | 7,893,304 | |
| Outstanding shares by class: | | | | | | | | | | | | |
| Class A Shares (538.13, 198 and 378 million shares of common stock authorized, $.001 par value) | | | 112,360,725 | | | | 15,020,395 | | | | 11,473,502 | |
| Class C Shares (40, 40 and 30 million shares of common stock authorized, $.001 par value) | | | 5,724,491 | | | | 549,118 | | | | 868,987 | |
| Class F Shares (144.38, 66 and 63 million shares of common stock authorized, $.001 par value) | | | 2,645,703 | | | | 166,998 | | | | 148,790 | |
| Class F3 Shares (88.13, 66 and 63 million shares of common stock authorized, $.001 par value) | | | 14,892,898 | | | | 2,239,428 | | | | 1,335,830 | |
| Class I Shares (144.38, 131 and 315 million shares of common stock authorized, $.001 par value) | | | 39,952,701 | | | | 1,143,721 | | | | 6,709,684 | |
| Class P Shares (20, 20 and 50 million shares of common stock authorized, $.001 par value) | | | 46,279 | | | | 135,610 | | | | 633,208 | |
| Class R2 Shares (30, 30 and 30 million shares of common stock authorized, $.001 par value) | | | 47,212 | | | | 17,942 | | | | 58,411 | |
| Class R3 Shares (30, 43.5 and 82.75 million shares of common stock authorized, $.001 par value) | | | 632,762 | | | | 471,480 | | | | 154,500 | |
| Class R4 Shares (30, 43.5 and 82.75 million shares of common stock authorized, $.001 par value) | | | 256,515 | | | | 85,530 | | | | 32,605 | |
| Class R5 Shares (30, 43.5 and 82.75 million shares of common stock authorized, $.001 par value) | | | 10,154 | | | | 439 | | | | 13,355 | |
| Class R6 Shares (30, 43.5 and 82.75 million shares of common stock authorized, $.001 par value) | | | 837,294 | | | | 336,761 | | | | 317,958 | |
| Net Asset Value, offering and redemption price per share (Net assets divided by outstanding shares): | | | | | | | | | | | | |
| Class A Shares-Net asset value | | | $24.79 | | | | $27.16 | | | | $18.32 | |
| Class A Shares-Maximum offering price (Net asset value plus sales charge of 5.75%) | | | $26.30 | | | | $28.82 | | | | $19.44 | |
| Class C Shares-Net asset value | | | $24.33 | | | | $15.39 | | | | $ 3.83 | |
| Class F Shares-Net asset value | | | $25.00 | | | | $29.17 | | | | $18.61 | |
| Class F3 Shares-Net asset value | | | $25.34 | | | | $33.93 | | | | $24.83 | |
| Class I Shares-Net asset value | | | $25.13 | | | | $33.52 | | | | $24.54 | |
| Class P Shares-Net asset value | | | $24.98 | | | | $25.70 | | | | $16.59 | |
| Class R2 Shares-Net asset value | | | $25.13 | | | | $24.44 | | | | $16.15 | |
| Class R3 Shares-Net asset value | | | $24.62 | | | | $25.44 | | | | $16.69 | |
| Class R4 Shares-Net asset value | | | $24.76 | | | | $27.17 | | | | $18.38 | |
| Class R5 Shares-Net asset value* | | | $25.12 | | | | $33.57 | | | | $24.58 | |
| Class R6 Shares-Net asset value | | | $25.33 | | | | $33.92 | | | | $24.82 | |
| * | Net asset value may not recalculate due to rounding of fractional shares. |
| | See Notes to Financial Statements. | 11 |
Statements of Operations
For the Year Ended November 30, 2024
| | Dividend
Growth Fund | | Growth
Opportunities
Fund | | Small Cap
Value Fund | |
| Investment income: | | | | | | | | | | | | |
| Dividends (net of foreign withholding taxes of $119,348, $0 and $69,620, respectively) | | $ | 61,100,836 | | | $ | 1,068,967 | | | $ | 5,201,851 | |
| Securities lending net income | | | 4,401 | | | | 37,461 | | | | 4,204 | |
| Interest and other | | | 1,099,694 | | | | 278,125 | | | | 100,164 | |
| Interest earned from Interfund Lending (See Note 9) | | | 2,393 | | | | – | | | | – | |
| Total investment income | | | 62,207,324 | | | | 1,384,553 | | | | 5,306,219 | |
| Expenses: | | | | | | | | | | | | |
| Management fee | | | 20,526,637 | | | | 3,015,349 | | | | 3,001,837 | |
| 12b-1 distribution plan–Class A | | | 6,259,306 | | | | 857,786 | | | | 481,067 | |
| 12b-1 distribution plan–Class C | | | 1,403,516 | | | | 76,139 | | | | 34,140 | |
| 12b-1 distribution plan–Class F | | | 63,282 | | | | 4,073 | | | | 2,681 | |
| 12b-1 distribution plan–Class P | | | 4,455 | | | | 12,998 | | | | 46,694 | |
| 12b-1 distribution plan–Class R2 | | | 8,644 | | | | 3,183 | | | | 4,349 | |
| 12b-1 distribution plan–Class R3 | | | 74,196 | | | | 50,720 | | | | 14,263 | |
| 12b-1 distribution plan–Class R4 | | | 17,053 | | | | 4,701 | | | | 1,220 | |
| Shareholder servicing | | | 2,153,216 | | | | 523,993 | | | | 334,479 | |
| Fund administration | | | 1,577,685 | | | | 185,560 | | | | 160,098 | |
| Registration | | | 202,490 | | | | 162,695 | | | | 157,629 | |
| Reports to shareholders | | | 188,523 | | | | 52,071 | | | | 25,863 | |
| Directors’ fees | | | 187,066 | | | | 21,551 | | | | 19,232 | |
| Professional | | | 98,155 | | | | 55,773 | | | | 52,444 | |
| Custody | | | 42,176 | | | | 10,932 | | | | 14,691 | |
| Other | | | 159,303 | | | | 72,311 | | | | 64,843 | |
| Gross expenses | | | 32,965,703 | | | | 5,109,835 | | | | 4,415,530 | |
| Fees waived and expenses reimbursed (See Note 3) | | | (105,458 | ) | | | (860,393 | ) | | | (14,691 | ) |
| Net expenses | | | 32,860,245 | | | | 4,249,442 | | | | 4,400,839 | |
| Net investment income (loss) | | | 29,347,079 | | | | (2,864,889 | ) | | | 905,380 | |
| Net realized and unrealized gain (loss): | | | | | | | | | | | | |
| Net realized gain (loss) on investments | | | 192,911,599 | | | | 69,571,904 | | | | 38,690,688 | |
| Net realized gain (loss) on foreign currency related transactions | | | 2,052 | | | | – | | | | (2,826 | ) |
| Net change in unrealized appreciation/depreciation on investments | | | 906,846,467 | | | | 117,564,310 | | | | 79,891,461 | |
| Net change in unrealized appreciation/depreciation on translation of assets and liabilities denominated in foreign currencies | | | 1,845 | | | | (4 | ) | | | – | |
| Net realized and unrealized gain (loss) | | | 1,099,761,963 | | | | 187,136,210 | | | | 118,579,323 | |
| Net Increase in Net Assets Resulting From Operations | | $ | 1,129,109,042 | | | $ | 184,271,321 | | | $ | 119,484,703 | |
| 12 | See Notes to Financial Statements. |
This page is intentionally left blank.
13
Statements of Changes in Net Assets
| | | | Dividend Growth Fund | |
| INCREASE (DECREASE) IN NET ASSETS | | For the Year Ended
November 30, 2024 | | | For the Year Ended
November 30, 2023 | |
| Operations: | | | | | | | | | | |
| Net investment income (loss) | | | $ | 29,347,079 | | | | $ | 31,235,317 | |
| Net realized gain (loss) on investments, futures contracts and foreign currency related transactions | | | | 192,913,651 | | | | | 33,495,306 | |
| Net change in unrealized appreciation/depreciation on investments, futures contracts and translation of assets and liabilities denominated in foreign currencies | | | | 906,848,312 | | | | | 192,892,751 | |
| Net increase (decrease) in net assets resulting from operations | | | | 1,129,109,042 | | | | | 257,623,374 | |
| Distributions to Shareholders | | | | | | | | | | |
| Class A | | | | (31,254,265 | ) | | | | (115,891,096 | ) |
| Class C | | | | (890,764 | ) | | | | (7,327,812 | ) |
| Class F | | | | (910,693 | ) | | | | (9,201,697 | ) |
| Class F3 | | | | (4,806,147 | ) | | | | (15,991,836 | ) |
| Class I | | | | (13,007,855 | ) | | | | (44,519,339 | ) |
| Class P | | | | (10,190 | ) | | | | (45,894 | ) |
| Class R2 | | | | (13,395 | ) | | | | (58,895 | ) |
| Class R3 | | | | (154,545 | ) | | | | (560,244 | ) |
| Class R4 | | | | (89,718 | ) | | | | (227,844 | ) |
| Class R5 | | | | (4,794 | ) | | | | (13,874 | ) |
| Class R6 | | | | (261,539 | ) | | | | (886,856 | ) |
| Total distribution to shareholders | | | | (51,403,905 | ) | | | | (194,725,387 | ) |
| Capital share transactions (See Note 13): | | | | | | | | | | |
| Net proceeds from sales of shares | | | | 472,381,040 | | | | | 484,252,301 | |
| Reinvestment of distributions | | | | 49,101,000 | | | | | 186,549,086 | |
| Cost of shares reacquired | | | | (811,677,636 | ) | | | | (802,698,819 | ) |
| Net decrease in net assets resulting from capital share transactions | | | | (290,195,596 | ) | | | | (131,897,432 | ) |
| Net increase (decrease) in net assets | | | | 787,509,541 | | | | | (68,999,445 | ) |
| NET ASSETS: | | | | | | | | | | |
| Beginning of year | | | $ | 3,630,317,964 | | | | $ | 3,699,317,409 | |
| End of year | | | $ | 4,417,827,505 | | | | $ | 3,630,317,964 | |
| 14 | See Notes to Financial Statements. |
| | Growth Opportunities Fund | | | | Small Cap Value Fund | |
For the Year Ended
November 30, 2024 | | | For the Year Ended
November 30, 2023 | | | For the Year Ended
November 30, 2024 | | | For the Year Ended
November 30, 2023 | |
| | | | | | | | | | | | | | | | | | | |
| | $ | (2,864,889 | ) | | | $ | (2,528,428 | ) | | | $ | 905,380 | | | | $ | 1,548,462 | |
| | | | | | | | | | | | | | | | | | | |
| | | 69,571,904 | | | | | (18,405,462 | ) | | | | 38,687,862 | | | | | (1,866,545 | ) |
| | | | | | | | | | | | | | | | | | | |
| | | 117,564,306 | | | | | 8,080,506 | | | | | 79,891,461 | | | | | 17,551,836 | |
| | | | | | | | | | | | | | | | | | | |
| | | 184,271,321 | | | | | (12,853,384 | ) | | | | 119,484,703 | | | | | 17,233,753 | |
| | | | | | | | | | | | | | | | | | | |
| | | – | | | | | – | | | | | (233,061 | ) | | | | (6,623,856 | ) |
| | | – | | | | | – | | | | | (27,671 | ) | | | | (716,290 | ) |
| | | – | | | | | – | | | | | (7,213 | ) | | | | (198,561 | ) |
| | | – | | | | | – | | | | | (83,678 | ) | | | | (788,836 | ) |
| | | – | | | | | – | | | | | (395,798 | ) | | | | (4,430,653 | ) |
| | | – | | | | | – | | | | | – | | | | | (444,303 | ) |
| | | – | | | | | – | | | | | – | | | | | (19,262 | ) |
| | | – | | | | | – | | | | | – | | | | | (94,985 | ) |
| | | – | | | | | – | | | | | (559 | ) | | | | (15,935 | ) |
| | | – | | | | | – | | | | | (827 | ) | | | | (8,029 | ) |
| | | – | | | | | – | | | | | (15,659 | ) | | | | (167,000 | ) |
| | | – | | | | | – | | | | | (764,466 | ) | | | | (13,507,710 | ) |
| | | | | | | | | | | | | | | | | | | |
| | | 64,633,138 | | | | | 87,450,199 | | | | | 24,381,927 | | | | | 32,915,003 | |
| | | – | | | | | – | | | | | 736,504 | | | | | 12,991,119 | |
| | | (101,264,350 | ) | | | | (133,294,147 | ) | | | | (78,259,362 | ) | | | | (86,954,732 | ) |
| | | | | | | | | | | | | | | | | | | |
| | | (36,631,212 | ) | | | | (45,843,948 | ) | | | | (53,140,931 | ) | | | | (41,048,610 | ) |
| | | 147,640,109 | | | | | (58,697,332 | ) | | | | 65,579,306 | | | | | (37,322,567 | ) |
| | | | | | | | | | | | | | | | | | | |
| | $ | 417,703,675 | | | | $ | 476,401,007 | | | | $ | 371,464,341 | | | | $ | 408,786,908 | |
| | $ | 565,343,784 | | | | $ | 417,703,675 | | | | $ | 437,043,647 | | | | $ | 371,464,341 | |
| | See Notes to Financial Statements. | 15 |
Financial Highlights
DIVIDEND GROWTH FUND
| | | | | Per Share Operating Performance: |
| | | | | Investment Operations: | | Distributions to
shareholders from: |
| | | Net asset
value,
beginning
of period | | Net
invest-
ment
income
(loss)(a) | | Net
realized
and
unrealized
gain (loss) | | Total
from
invest-
ment
opera-
tions | | Net
investment
income | | Net
realized
gain | | Total
distri-
butions |
| Class A | | | | | | | | | | | | | | | | | | | | | | | | | | | | |
| 11/30/2024 | | $ | 18.85 | | | $ | 0.15 | | | $ | 6.06 | | | $ | 6.21 | | | $ | (0.16 | ) | | $ | (0.11 | ) | | $ | (0.27 | ) |
| 11/30/2023 | | | 18.54 | | | | 0.15 | | | | 1.14 | | | | 1.29 | | | | (0.15 | ) | | | (0.83 | ) | | | (0.98 | ) |
| 11/30/2022 | | | 21.23 | | | | 0.17 | | | | (1.20 | ) | | | (1.03 | ) | | | (0.18 | ) | | | (1.48 | ) | | | (1.66 | ) |
| 11/30/2021 | | | 17.82 | | | | 0.16 | | | | 3.83 | | | | 3.99 | | | | (0.15 | ) | | | (0.43 | ) | | | (0.58 | ) |
| 11/30/2020 | | | 16.38 | | | | 0.17 | | | | 2.17 | | | | 2.34 | | | | (0.20 | ) | | | (0.70 | ) | | | (0.90 | ) |
| Class C | | | | | | | | | | | | | | | | | | | | | | | | | | | | |
| 11/30/2024 | | | 18.52 | | | | (0.01 | ) | | | 5.94 | | | | 5.93 | | | | (0.01 | ) | | | (0.11 | ) | | | (0.12 | ) |
| 11/30/2023 | | | 18.23 | | | | 0.01 | | | | 1.12 | | | | 1.13 | | | | (0.01 | ) | | | (0.83 | ) | | | (0.84 | ) |
| 11/30/2022 | | | 20.90 | | | | 0.03 | | | | (1.17 | ) | | | (1.14 | ) | | | (0.05 | ) | | | (1.48 | ) | | | (1.53 | ) |
| 11/30/2021 | | | 17.55 | | | | 0.01 | | | | 3.78 | | | | 3.79 | | | | (0.01 | ) | | | (0.43 | ) | | | (0.44 | ) |
| 11/30/2020 | | | 16.14 | | | | 0.06 | | | | 2.13 | | | | 2.19 | | | | (0.08 | ) | | | (0.70 | ) | | | (0.78 | ) |
| Class F | | | | | | | | | | | | | | | | | | | | | | | | | | | | |
| 11/30/2024 | | | 18.99 | | | | 0.20 | | | | 6.11 | | | | 6.31 | | | | (0.19 | ) | | | (0.11 | ) | | | (0.30 | ) |
| 11/30/2023 | | | 18.65 | | | | 0.18 | | | | 1.16 | | | | 1.34 | | | | (0.17 | ) | | | (0.83 | ) | | | (1.00 | ) |
| 11/30/2022 | | | 21.32 | | | | 0.22 | | | | (1.20 | ) | | | (0.98 | ) | | | (0.21 | ) | | | (1.48 | ) | | | (1.69 | ) |
| 11/30/2021 | | | 17.87 | | | | 0.21 | | | | 3.84 | | | | 4.05 | | | | (0.17 | ) | | | (0.43 | ) | | | (0.60 | ) |
| 11/30/2020 | | | 16.41 | | | | 0.21 | | | | 2.18 | | | | 2.39 | | | | (0.23 | ) | | | (0.70 | ) | | | (0.93 | ) |
| Class F3 | | | | | | | | | | | | | | | | | | | | | | | | | | | | |
| 11/30/2024 | | | 19.25 | | | | 0.22 | | | | 6.19 | | | | 6.41 | | | | (0.21 | ) | | | (0.11 | ) | | | (0.32 | ) |
| 11/30/2023 | | | 18.91 | | | | 0.20 | | | | 1.16 | | | | 1.36 | | | | (0.19 | ) | | | (0.83 | ) | | | (1.02 | ) |
| 11/30/2022 | | | 21.60 | | | | 0.24 | | | | (1.22 | ) | | | (0.98 | ) | | | (0.23 | ) | | | (1.48 | ) | | | (1.71 | ) |
| 11/30/2021 | | | 18.11 | | | | 0.23 | | | | 3.89 | | | | 4.12 | | | | (0.20 | ) | | | (0.43 | ) | | | (0.63 | ) |
| 11/30/2020 | | | 16.62 | | | | 0.23 | | | | 2.20 | | | | 2.43 | | | | (0.24 | ) | | | (0.70 | ) | | | (0.94 | ) |
| Class I | | | | | | | | | | | | | | | | | | | | | | | | | | | | |
| 11/30/2024 | | | 19.10 | | | | 0.21 | | | | 6.14 | | | | 6.35 | | | | (0.21 | ) | | | (0.11 | ) | | | (0.32 | ) |
| 11/30/2023 | | | 18.78 | | | | 0.19 | | | | 1.15 | | | | 1.34 | | | | (0.19 | ) | | | (0.83 | ) | | | (1.02 | ) |
| 11/30/2022 | | | 21.48 | | | | 0.25 | | | | (1.24 | ) | | | (0.99 | ) | | | (0.23 | ) | | | (1.48 | ) | | | (1.71 | ) |
| 11/30/2021 | | | 18.02 | | | | 0.22 | | | | 3.86 | | | | 4.08 | | | | (0.19 | ) | | | (0.43 | ) | | | (0.62 | ) |
| 11/30/2020 | | | 16.55 | | | | 0.21 | | | | 2.20 | | | | 2.41 | | | | (0.24 | ) | | | (0.70 | ) | | | (0.94 | ) |
| Class P | | | | | | | | | | | | | | | | | | | | | | | | | | | | |
| 11/30/2024 | | | 19.00 | | | | 0.11 | | | | 6.10 | | | | 6.21 | | | | (0.12 | ) | | | (0.11 | ) | | | (0.23 | ) |
| 11/30/2023 | | | 18.68 | | | | 0.11 | | | | 1.15 | | | | 1.26 | | | | (0.11 | ) | | | (0.83 | ) | | | (0.94 | ) |
| 11/30/2022 | | | 21.37 | | | | 0.14 | | | | (1.20 | ) | | | (1.06 | ) | | | (0.15 | ) | | | (1.48 | ) | | | (1.63 | ) |
| 11/30/2021 | | | 17.93 | | | | 0.12 | | | | 3.86 | | | | 3.98 | | | | (0.11 | ) | | | (0.43 | ) | | | (0.54 | ) |
| 11/30/2020 | | | 16.48 | | | | 0.14 | | | | 2.18 | | | | 2.32 | | | | (0.17 | ) | | | (0.70 | ) | | | (0.87 | ) |
| 16 | See Notes to Financial Statements. |
| | | | | Ratios to Average Net Assets: | | Supplemental Data: |
| | | | | | | | | | | | | |
Net
asset
value,
end of
period | | Total
return(b)
(%) | | Total
expenses
after
waivers
and/or
reimbursements
(%) | | Total
expenses
(%) | | Net
invest-
ment
income (loss)
(%) | | Net
assets,
end of
period
(000) | | Portfolio
turnover
rate
(%) |
| | | | | | | | | | | |
| $ | 24.79 | | | | 33.24 | | | | 0.89 | | | | 0.89 | | | | 0.69 | | | $ | 2,785,299 | | | | 25 | |
| | 18.85 | | | | 7.58 | | | | 0.90 | | | | 0.90 | | | | 0.82 | | | | 2,215,523 | | | | 35 | |
| | 18.54 | | | | (5.30 | ) | | | 0.92 | | | | 0.92 | | | | 0.95 | | | | 2,213,259 | | | | 47 | |
| | 21.23 | | | | 22.95 | | | | 0.91 | | | | 0.91 | | | | 0.82 | | | | 2,368,031 | | | | 39 | |
| | 17.82 | | | | 15.10 | | | | 0.95 | | | | 0.95 | | | | 1.10 | | | | 1,925,498 | | | | 59 | |
| | | | | | | | | | | | | | | | | | | | | | | | | | | |
| | 24.33 | | | | 32.22 | | | | 1.64 | | | | 1.64 | | | | (0.06 | ) | | | 139,303 | | | | 25 | |
| | 18.52 | | | | 6.77 | | | | 1.65 | | | | 1.65 | | | | 0.06 | | | | 135,085 | | | | 35 | |
| | 18.23 | | | | (6.00 | ) | | | 1.67 | | | | 1.67 | | | | 0.19 | | | | 158,789 | | | | 47 | |
| | 20.90 | | | | 22.07 | | | | 1.66 | | | | 1.66 | | | | 0.07 | | | | 193,493 | | | | 39 | |
| | 17.55 | | | | 14.21 | | | | 1.70 | | | | 1.70 | | | | 0.37 | | | | 176,775 | | | | 59 | |
| | | | | | | | | | | | | | | | | | | | | | | | | | | |
| | 25.00 | | | | 33.55 | | | | 0.64 | | | | 0.74 | | | | 0.93 | | | | 66,140 | | | | 25 | |
| | 18.99 | | | | 7.84 | | | | 0.65 | | | | 0.75 | | | | 0.99 | | | | 60,941 | | | | 35 | |
| | 18.65 | | | | (5.05 | ) | | | 0.67 | | | | 0.77 | | | | 1.16 | | | | 184,824 | | | | 47 | |
| | 21.32 | | | | 23.29 | | | | 0.66 | | | | 0.76 | | | | 1.07 | | | | 467,768 | | | | 39 | |
| | 17.87 | | | | 15.38 | | | | 0.70 | | | | 0.80 | | | | 1.35 | | | | 330,470 | | | | 59 | |
| | | | | | | | | | | | | | | | | | | | | | | | | | | |
| | 25.34 | | | | 33.64 | | | | 0.59 | | | | 0.59 | | | | 0.99 | | | | 377,366 | | | | 25 | |
| | 19.25 | | | | 7.86 | | | | 0.59 | | | | 0.59 | | | | 1.12 | | | | 291,252 | | | | 35 | |
| | 18.91 | | | | (4.95 | ) | | | 0.60 | | | | 0.60 | | | | 1.26 | | | | 295,542 | | | | 47 | |
| | 21.60 | | | | 23.34 | | | | 0.60 | | | | 0.60 | | | | 1.14 | | | | 314,607 | | | | 39 | |
| | 18.11 | | | | 15.50 | | | | 0.62 | | | | 0.62 | | | | 1.43 | | | | 240,767 | | | | 59 | |
| | | | | | | | | | | | | | | | | | | | | | | | | | | |
| | 25.13 | | | | 33.59 | | | | 0.64 | | | | 0.64 | | | | 0.94 | | | | 1,003,984 | | | | 25 | |
| | 19.10 | | | | 7.80 | | | | 0.65 | | | | 0.65 | | | | 1.07 | | | | 889,207 | | | | 35 | |
| | 18.78 | | | | (5.04 | ) | | | 0.67 | | | | 0.67 | | | | 1.39 | | | | 812,893 | | | | 47 | |
| | 21.48 | | | | 23.27 | | | | 0.66 | | | | 0.66 | | | | 1.08 | | | | 70,953 | | | | 39 | |
| | 18.02 | | | | 15.42 | | | | 0.70 | | | | 0.70 | | | | 1.35 | | | | 44,354 | | | | 59 | |
| | | | | | | | | | | | | | | | | | | | | | | | | | | |
| | 24.98 | | | | 32.94 | | | | 1.09 | | | | 1.09 | | | | 0.49 | | | | 1,156 | | | | 25 | |
| | 19.00 | | | | 7.36 | | | | 1.10 | | | | 1.10 | | | | 0.61 | | | | 850 | | | | 35 | |
| | 18.68 | | | | (5.46 | ) | | | 1.12 | | | | 1.12 | | | | 0.74 | | | | 913 | | | | 47 | |
| | 21.37 | | | | 22.72 | | | | 1.12 | | | | 1.12 | | | | 0.61 | | | | 1,074 | | | | 39 | |
| | 17.93 | | | | 14.83 | | | | 1.15 | | | | 1.15 | | | | 0.90 | | | | 1,092 | | | | 59 | |
| | See Notes to Financial Statements. | 17 |
Financial Highlights (concluded)
DIVIDEND GROWTH FUND
| | | | | Per Share Operating Performance: |
| | | | | Investment Operations: | | Distributions to
shareholders from: |
| | | Net asset
value,
beginning
of period | | Net
invest-
ment
income
(loss)(a) | | Net
realized
and
unrealized
gain (loss) | | Total
from
invest-
ment
opera-
tions | | Net
investment
income | | Net
realized
gain | | Total
distri-
butions |
| Class R2 | | | | | | | | | | | | | | | | | | | | | | | | | | | | |
| 11/30/2024 | | $ | 19.11 | | | $ | 0.07 | | | $ | 6.15 | | | $ | 6.22 | | | $ | (0.09 | ) | | $ | (0.11 | ) | | $ | (0.20 | ) |
| 11/30/2023 | | | 18.78 | | | | 0.08 | | | | 1.16 | | | | 1.24 | | | | (0.08 | ) | | | (0.83 | ) | | | (0.91 | ) |
| 11/30/2022 | | | 21.48 | | | | 0.11 | | | | (1.22 | ) | | | (1.11 | ) | | | (0.11 | ) | | | (1.48 | ) | | | (1.59 | ) |
| 11/30/2021 | | | 18.02 | | | | 0.10 | | | | 3.87 | | | | 3.97 | | | | (0.08 | ) | | | (0.43 | ) | | | (0.51 | ) |
| 11/30/2020 | | | 16.55 | | | | 0.12 | | | | 2.19 | | | | 2.31 | | | | (0.14 | ) | | | (0.70 | ) | | | (0.84 | ) |
| Class R3 | | | | | | | | | | | | | | | | | | | | | | | | | | | | |
| 11/30/2024 | | | 18.72 | | | | 0.09 | | | | 6.03 | | | | 6.12 | | | | (0.11 | ) | | | (0.11 | ) | | | (0.22 | ) |
| 11/30/2023 | | | 18.43 | | | | 0.10 | | | | 1.13 | | | | 1.23 | | | | (0.11 | ) | | | (0.83 | ) | | | (0.94 | ) |
| 11/30/2022 | | | 21.11 | | | | 0.13 | | | | (1.19 | ) | | | (1.06 | ) | | | (0.14 | ) | | | (1.48 | ) | | | (1.62 | ) |
| 11/30/2021 | | | 17.72 | | | | 0.11 | | | | 3.81 | | | | 3.92 | | | | (0.10 | ) | | | (0.43 | ) | | | (0.53 | ) |
| 11/30/2020 | | | 16.29 | | | | 0.13 | | | | 2.16 | | | | 2.29 | | | | (0.16 | ) | | | (0.70 | ) | | | (0.86 | ) |
| Class R4 | | | | | | | | | | | | | | | | | | | | | | | | | | | | |
| 11/30/2024 | | | 18.83 | | | | 0.15 | | | | 6.05 | | | | 6.20 | | | | (0.16 | ) | | | (0.11 | ) | | | (0.27 | ) |
| 11/30/2023 | | | 18.53 | | | | 0.15 | | | | 1.13 | | | | 1.28 | | | | (0.15 | ) | | | (0.83 | ) | | | (0.98 | ) |
| 11/30/2022 | | | 21.21 | | | | 0.17 | | | | (1.18 | ) | | | (1.01 | ) | | | (0.19 | ) | | | (1.48 | ) | | | (1.67 | ) |
| 11/30/2021 | | | 17.80 | | | | 0.16 | | | | 3.82 | | | | 3.98 | | | | (0.14 | ) | | | (0.43 | ) | | | (0.57 | ) |
| 11/30/2020 | | | 16.36 | | | | 0.18 | | | | 2.16 | | | | 2.34 | | | | (0.20 | ) | | | (0.70 | ) | | | (0.90 | ) |
| Class R5 | | | | | | | | | | | | | | | | | | | | | | | | | | | | |
| 11/30/2024 | | | 19.10 | | | | 0.20 | | | | 6.14 | | | | 6.34 | | | | (0.21 | ) | | | (0.11 | ) | | | (0.32 | ) |
| 11/30/2023 | | | 18.77 | | | | 0.19 | | | | 1.16 | | | | 1.35 | | | | (0.19 | ) | | | (0.83 | ) | | | (1.02 | ) |
| 11/30/2022 | | | 21.47 | | | | 0.21 | | | | (1.20 | ) | | | (0.99 | ) | | | (0.23 | ) | | | (1.48 | ) | | | (1.71 | ) |
| 11/30/2021 | | | 18.01 | | | | 0.22 | | | | 3.86 | | | | 4.08 | | | | (0.19 | ) | | | (0.43 | ) | | | (0.62 | ) |
| 11/30/2020 | | | 16.55 | | | | 0.21 | | | | 2.19 | | | | 2.40 | | | | (0.24 | ) | | | (0.70 | ) | | | (0.94 | ) |
| Class R6 | | | | | | | | | | | | | | | | | | | | | | | | | | | | |
| 11/30/2024 | | | 19.24 | | | | 0.22 | | | | 6.19 | | | | 6.41 | | | | (0.21 | ) | | | (0.11 | ) | | | (0.32 | ) |
| 11/30/2023 | | | 18.90 | | | | 0.20 | | | | 1.16 | | | | 1.36 | | | | (0.19 | ) | | | (0.83 | ) | | | (1.02 | ) |
| 11/30/2022 | | | 21.59 | | | | 0.23 | | | | (1.21 | ) | | | (0.98 | ) | | | (0.23 | ) | | | (1.48 | ) | | | (1.71 | ) |
| 11/30/2021 | | | 18.11 | | | | 0.22 | | | | 3.89 | | | | 4.11 | | | | (0.20 | ) | | | (0.43 | ) | | | (0.63 | ) |
| 11/30/2020 | | | 16.62 | | | | 0.23 | | | | 2.20 | | | | 2.43 | | | | (0.24 | ) | | | (0.70 | ) | | | (0.94 | ) |
| (a) | Calculated using average shares outstanding during the period. |
| (b) | Total return for Classes A and C does not consider the effects of sales loads and assumes the reinvestment of all distributions. Total return for all other classes assumes the reinvestment of all distributions. |
| 18 | See Notes to Financial Statements. |
| | | | | Ratios to Average Net Assets: | | Supplemental Data: |
| | | | | | | | | | | | | |
Net
asset
value,
end of
period | | Total
return(b)
(%) | | Total
expenses
after
waivers
and/or
reimbursements
(%) | | Total
expenses
(%) | | Net
invest-
ment
income (loss)
(%) | | Net
assets,
end of
period
(000) | | Portfolio
turnover
rate
(%) |
| | | | | | | | | | | | | |
| $ | 25.13 | | | | 32.77 | | | | 1.24 | | | | 1.24 | | | | 0.34 | | | $ | 1,186 | | | | 25 | |
| | 19.11 | | | | 7.21 | | | | 1.25 | | | | 1.25 | | | | 0.47 | | | | 1,282 | | | | 35 | |
| | 18.78 | | | | (5.64 | ) | | | 1.27 | | | | 1.27 | | | | 0.60 | | | | 1,207 | | | | 47 | |
| | 21.48 | | | | 22.56 | | | | 1.26 | | | | 1.26 | | | | 0.49 | | | | 1,427 | | | | 39 | |
| | 18.02 | | | | 14.67 | | | | 1.30 | | | | 1.30 | | | | 0.76 | | | | 951 | | | | 59 | |
| | | | | | | | | | | | | | | | | | | | | | | | | | | |
| | 24.62 | | | | 32.87 | | | | 1.14 | | | | 1.14 | | | | 0.43 | | | | 15,578 | | | | 25 | |
| | 18.72 | | | | 7.32 | | | | 1.15 | | | | 1.15 | | | | 0.58 | | | | 13,539 | | | | 35 | |
| | 18.43 | | | | (5.53 | ) | | | 1.17 | | | | 1.17 | | | | 0.69 | | | | 10,852 | | | | 47 | |
| | 21.11 | | | | 22.66 | | | | 1.16 | | | | 1.16 | | | | 0.56 | | | | 13,953 | | | | 39 | |
| | 17.72 | | | | 14.81 | | | | 1.20 | | | | 1.20 | | | | 0.86 | | | | 13,802 | | | | 59 | |
| | | | | | | | | | | | | | | | | | | | | | | | | | | |
| | 24.76 | | | | 33.21 | | | | 0.89 | | | | 0.89 | | | | 0.69 | | | | 6,352 | | | | 25 | |
| | 18.83 | | | | 7.55 | | | | 0.90 | | | | 0.90 | | | | 0.82 | | | | 6,633 | | | | 35 | |
| | 18.53 | | | | (5.30 | ) | | | 0.92 | | | | 0.92 | | | | 0.94 | | | | 4,194 | | | | 47 | |
| | 21.21 | | | | 22.96 | | | | 0.91 | | | | 0.91 | | | | 0.80 | | | | 4,441 | | | | 39 | |
| | 17.80 | | | | 15.10 | | | | 0.95 | | | | 0.95 | | | | 1.12 | | | | 4,144 | | | | 59 | |
| | | | | | | | | | | | | | | | | | | | | | | | | | | |
| | 25.12 | | | | 33.54 | | | | 0.64 | | | | 0.64 | | | | 0.93 | | | | 255 | | | | 25 | |
| | 19.10 | | | | 7.86 | | | | 0.65 | | | | 0.65 | | | | 1.07 | | | | 257 | | | | 35 | |
| | 18.77 | | | | (5.09 | ) | | | 0.67 | | | | 0.67 | | | | 1.14 | | | | 291 | | | | 47 | |
| | 21.47 | | | | 23.28 | | | | 0.66 | | | | 0.66 | | | | 1.09 | | | | 620 | | | | 39 | |
| | 18.01 | | | | 15.36 | | | | 0.70 | | | | 0.70 | | | | 1.34 | | | | 395 | | | | 59 | |
| | | | | | | | | | | | | | | | | | | | | | | | | | | |
| | 25.33 | | | | 33.66 | | | | 0.59 | | | | 0.59 | | | | 0.99 | | | | 21,209 | | | | 25 | |
| | 19.24 | | | | 7.87 | | | | 0.59 | | | | 0.59 | | | | 1.12 | | | | 15,748 | | | | 35 | |
| | 18.90 | | | | (5.00 | ) | | | 0.60 | | | | 0.60 | | | | 1.26 | | | | 16,552 | | | | 47 | |
| | 21.59 | | | | 23.34 | | | | 0.60 | | | | 0.60 | | | | 1.13 | | | | 18,992 | | | | 39 | |
| | 18.11 | | | | 15.50 | | | | 0.62 | | | | 0.62 | | | | 1.43 | | | | 16,977 | | | | 59 | |
| | See Notes to Financial Statements. | 19 |
Financial Highlights
GROWTH OPPORTUNITIES FUND
| | | | | Per Share Operating Performance: | | |
| | | | | Investment Operations: | | Distributions to
shareholders
from: | | |
| | | Net asset
value,
beginning
of period | | Net
investment
income
(loss)(a) | | Net
realized and
unrealized
gain (loss) | | Total from
investment
operations | | Net
realized
gain | | Net asset
value,
end of
period |
| Class A | | | | | | | | | | | | | | | | | | | | | | | | |
| 11/30/2024 | | $ | 18.47 | | | $ | (0.14 | ) | | $ | 8.83 | | | $ | 8.69 | | | $ | – | | | $ | 27.16 | |
| 11/30/2023 | | | 18.95 | | | | (0.11 | ) | | | (0.37 | ) | | | (0.48 | ) | | | – | | | | 18.47 | |
| 11/30/2022 | | | 31.15 | | | | (0.08 | ) | | | (7.20 | ) | | | (7.28 | ) | | | (4.92 | ) | | | 18.95 | |
| 11/30/2021 | | | 32.07 | | | | (0.22 | ) | | | 3.82 | | | | 3.60 | | | | (4.52 | ) | | | 31.15 | |
| 11/30/2020 | | | 24.97 | | | | (0.11 | ) | | | 8.56 | | | | 8.45 | | | | (1.35 | ) | | | 32.07 | |
| Class C | | | | | | | | | | | | | | | | | | | | | | | | |
| 11/30/2024 | | | 10.55 | | | | (0.17 | ) | | | 5.01 | | | | 4.84 | | | | – | | | | 15.39 | |
| 11/30/2023 | | | 10.91 | | | | (0.14 | ) | | | (0.22 | ) | | | (0.36 | ) | | | – | | | | 10.55 | |
| 11/30/2022 | | | 20.21 | | | | (0.14 | ) | | | (4.24 | ) | | | (4.38 | ) | | | (4.92 | ) | | | 10.91 | |
| 11/30/2021 | | | 22.45 | | | | (0.30 | ) | | | 2.58 | | | | 2.28 | | | | (4.52 | ) | | | 20.21 | |
| 11/30/2020 | | | 18.01 | | | | (0.20 | ) | | | 5.99 | | | | 5.79 | | | | (1.35 | ) | | | 22.45 | |
| Class F | | | | | | | | | | | | | | | | | | | | | | | | |
| 11/30/2024 | | | 19.81 | | | | (0.12 | ) | | | 9.48 | | | | 9.36 | | | | – | | | | 29.17 | |
| 11/30/2023 | | | 20.30 | | | | (0.10 | ) | | | (0.39 | ) | | | (0.49 | ) | | | – | | | | 19.81 | |
| 11/30/2022 | | | 32.95 | | | | (0.06 | ) | | | (7.67 | ) | | | (7.73 | ) | | | (4.92 | ) | | | 20.30 | |
| 11/30/2021 | | | 33.64 | | | | (0.18 | ) | | | 4.01 | | | | 3.83 | | | | (4.52 | ) | | | 32.95 | |
| 11/30/2020 | | | 26.09 | | | | (0.08 | ) | | | 8.98 | | | | 8.90 | | | | (1.35 | ) | | | 33.64 | |
| Class F3 | | | | | | | | | | | | | | | | | | | | | | | | |
| 11/30/2024 | | | 23.00 | | | | (0.09 | ) | | | 11.02 | | | | 10.93 | | | | – | | | | 33.93 | |
| 11/30/2023 | | | 23.52 | | | | (0.06 | ) | | | (0.46 | ) | | | (0.52 | ) | | | – | | | | 23.00 | |
| 11/30/2022 | | | 37.32 | | | | (0.02 | ) | | | (8.86 | ) | | | (8.88 | ) | | | (4.92 | ) | | | 23.52 | |
| 11/30/2021 | | | 37.47 | | | | (0.14 | ) | | | 4.51 | | | | 4.37 | | | | (4.52 | ) | | | 37.32 | |
| 11/30/2020 | | | 28.86 | | | | (0.05 | ) | | | 10.01 | | | | 9.96 | | | | (1.35 | ) | | | 37.47 | |
| Class I | | | | | | | | | | | | | | | | | | | | | | | | |
| 11/30/2024 | | | 22.73 | | | | (0.11 | ) | | | 10.90 | | | | 10.79 | | | | – | | | | 33.52 | |
| 11/30/2023 | | | 23.27 | | | | (0.08 | ) | | | (0.46 | ) | | | (0.54 | ) | | | – | | | | 22.73 | |
| 11/30/2022 | | | 37.00 | | | | (0.02 | ) | | | (8.79 | ) | | | (8.81 | ) | | | (4.92 | ) | | | 23.27 | |
| 11/30/2021 | | | 37.21 | | | | (0.17 | ) | | | 4.48 | | | | 4.31 | | | | (4.52 | ) | | | 37.00 | |
| 11/30/2020 | | | 28.69 | | | | (0.02 | ) | | | 9.89 | | | | 9.87 | | | | (1.35 | ) | | | 37.21 | |
| Class P | | | | | | | | | | | | | | | | | | | | | | | | |
| 11/30/2024 | | | 17.51 | | | | (0.18 | ) | | | 8.37 | | | | 8.19 | | | | – | | | | 25.70 | |
| 11/30/2023 | | | 18.01 | | | | (0.14 | ) | | | (0.36 | ) | | | (0.50 | ) | | | – | | | | 17.51 | |
| 11/30/2022 | | | 29.90 | | | | (0.12 | ) | | | (6.85 | ) | | | (6.97 | ) | | | (4.92 | ) | | | 18.01 | |
| 11/30/2021 | | | 31.01 | | | | (0.27 | ) | | | 3.68 | | | | 3.41 | | | | (4.52 | ) | | | 29.90 | |
| 11/30/2020 | | | 24.24 | | | | (0.15 | ) | | | 8.27 | | | | 8.12 | | | | (1.35 | ) | | | 31.01 | |
| 20 | See Notes to Financial Statements. |
| | | Ratios to Average Net Assets: | | Supplemental Data: |
| | | | | | | | | | | |
Total
return(b)
(%) | | Total expenses after
waivers and/or
reimbursements
(%) | | Total
expenses
(%) | | Net
investment
income (loss)
(%) | | Net assets,
end of
period
(000) | | Portfolio
turnover
rate
(%) |
| | | | | | | | | | | | | | | | | | | | | | | |
| | 46.97 | | | | 0.96 | | | | 1.15 | | | | (0.66 | ) | | $ | 408,014 | | | | 117 | |
| | (2.48 | ) | | | 0.96 | | | | 1.16 | | | | (0.61 | ) | | | 307,288 | | | | 149 | |
| | (27.23 | ) | | | 1.05 | | | | 1.19 | | | | (0.40 | ) | | | 356,219 | | | | 118 | |
| | 12.09 | | | | 1.06 | | | | 1.17 | | | | (0.71 | ) | | | 531,845 | | | | 68 | |
| | 35.75 | | | | 1.10 | | | | 1.19 | | | | (0.42 | ) | | | 492,772 | | | | 50 | |
| | | | | | | | | | | | | | | | | | | | | | | |
| | 45.88 | | | | 1.71 | | | | 1.90 | | | | (1.41 | ) | | | 8,454 | | | | 117 | |
| | (3.30 | ) | | | 1.71 | | | | 1.91 | | | | (1.38 | ) | | | 7,907 | | | | 149 | |
| | (27.73 | ) | | | 1.80 | | | | 1.94 | | | | (1.16 | ) | | | 15,434 | | | | 118 | |
| | 11.24 | | | | 1.81 | | | | 1.92 | | | | (1.47 | ) | | | 25,235 | | | | 68 | |
| | 34.73 | | | | 1.85 | | | | 1.94 | | | | (1.15 | ) | | | 26,782 | | | | 50 | |
| | | | | | | | | | | | | | | | | | | | | | | |
| | 47.17 | | | | 0.81 | | | | 1.00 | | | | (0.51 | ) | | | 4,872 | | | | 117 | |
| | (2.36 | ) | | | 0.81 | | | | 1.01 | | | | (0.51 | ) | | | 3,825 | | | | 149 | |
| | (27.09 | ) | | | 0.90 | | | | 1.04 | | | | (0.29 | ) | | | 16,775 | | | | 118 | |
| | 12.22 | | | | 0.91 | | | | 1.02 | | | | (0.57 | ) | | | 48,943 | | | | 68 | |
| | 35.95 | | | | 0.94 | | | | 1.04 | | | | (0.28 | ) | | | 42,530 | | | | 50 | |
| | | | | | | | | | | | | | | | | | | | | | | |
| | 47.46 | | | | 0.63 | | | | 0.79 | | | | (0.33 | ) | | | 75,989 | | | | 117 | |
| | (2.17 | ) | | | 0.63 | | | | 0.78 | | | | (0.28 | ) | | | 47,318 | | | | 149 | |
| | (26.98 | ) | | | 0.71 | | | | 0.85 | | | | (0.06 | ) | | | 48,091 | | | | 118 | |
| | 12.44 | | | | 0.73 | | | | 0.84 | | | | (0.39 | ) | | | 59,660 | | | | 68 | |
| | 36.18 | | | | 0.77 | | | | 0.86 | | | | (0.15 | ) | | | 26,711 | | | | 50 | |
| | | | | | | | | | | | | | | | | | | | | | | |
| | 47.34 | | | | 0.71 | | | | 0.90 | | | | (0.41 | ) | | | 38,336 | | | | 117 | |
| | (2.23 | ) | | | 0.71 | | | | 0.90 | | | | (0.34 | ) | | | 28,362 | | | | 149 | |
| | (27.03 | ) | | | 0.81 | | | | 0.94 | | | | (0.06 | ) | | | 14,742 | | | | 118 | |
| | 12.35 | | | | 0.81 | | | | 0.92 | | | | (0.48 | ) | | | 217,472 | | | | 68 | |
| | 36.08 | | | | 0.86 | | | | 0.94 | | | | (0.05 | ) | | | 193,878 | | | | 50 | |
| | | | | | | | | | | | | | | | | | | | | | | |
| | 46.69 | | | | 1.16 | | | | 1.35 | | | | (0.86 | ) | | | 3,485 | | | | 117 | |
| | (2.72 | ) | | | 1.16 | | | | 1.36 | | | | (0.81 | ) | | | 2,754 | | | | 149 | |
| | (27.35 | ) | | | 1.25 | | | | 1.39 | | | | (0.60 | ) | | | 2,643 | | | | 118 | |
| | 11.86 | | | | 1.26 | | | | 1.37 | | | | (0.92 | ) | | | 3,657 | | | | 68 | |
| | 35.51 | | | | 1.30 | | | | 1.39 | | | | (0.60 | ) | | | 3,432 | | | | 50 | |
| | See Notes to Financial Statements. | 21 |
Financial Highlights (concluded)
GROWTH OPPORTUNITIES FUND
| | | | | Per Share Operating Performance: | | |
| | | | | Investment Operations: | | Distributions to
shareholders
from: | | |
| | | Net asset
value,
beginning
of period | | Net
investment
income
(loss)(a) | | Net
realized and
unrealized
gain (loss) | | Total from
investment
operations | | Net
realized
gain | | Net asset
value,
end of
period |
| Class R2 | | | | | | | | | | | | | | | | | | | | | | | | |
| 11/30/2024 | | $ | 16.68 | | | $ | (0.20 | ) | | $ | 7.96 | | | $ | 7.76 | | | $ | – | | | $ | 24.44 | |
| 11/30/2023 | | | 17.18 | | | | (0.16 | ) | | | (0.34 | ) | | | (0.50 | ) | | | – | | | | 16.68 | |
| 11/30/2022 | | | 28.79 | | | | (0.14 | ) | | | (6.55 | ) | | | (6.69 | ) | | | (4.92 | ) | | | 17.18 | |
| 11/30/2021 | | | 30.06 | | | | (0.31 | ) | | | 3.56 | | | | 3.25 | | | | (4.52 | ) | | | 28.79 | |
| 11/30/2020 | | | 23.57 | | | | (0.18 | ) | | | 8.02 | | | | 7.84 | | | | (1.35 | ) | | | 30.06 | |
| Class R3 | | | | | | | | | | | | | | | | | | | | | | | | |
| 11/30/2024 | | | 17.34 | | | | (0.19 | ) | | | 8.29 | | | | 8.10 | | | | – | | | | 25.44 | |
| 11/30/2023 | | | 17.84 | | | | (0.15 | ) | | | (0.35 | ) | | | (0.50 | ) | | | – | | | | 17.34 | |
| 11/30/2022 | | | 29.68 | | | | (0.13 | ) | | | (6.79 | ) | | | (6.92 | ) | | | (4.92 | ) | | | 17.84 | |
| 11/30/2021 | | | 30.83 | | | | (0.28 | ) | | | 3.65 | | | | 3.37 | | | | (4.52 | ) | | | 29.68 | |
| 11/30/2020 | | | 24.11 | | | | (0.16 | ) | | | 8.23 | | | | 8.07 | | | | (1.35 | ) | | | 30.83 | |
| Class R4 | | | | | | | | | | | | | | | | | | | | | | | | |
| 11/30/2024 | | | 18.47 | | | | (0.14 | ) | | | 8.84 | | | | 8.70 | | | | – | | | | 27.17 | |
| 11/30/2023 | | | 18.96 | | | | (0.11 | ) | | | (0.38 | ) | | | (0.49 | ) | | | – | | | | 18.47 | |
| 11/30/2022 | | | 31.15 | | | | (0.08 | ) | | | (7.19 | ) | | | (7.27 | ) | | | (4.92 | ) | | | 18.96 | |
| 11/30/2021 | | | 32.07 | | | | (0.22 | ) | | | 3.82 | | | | 3.60 | | | | (4.52 | ) | | | 31.15 | |
| 11/30/2020 | | | 24.97 | | | | (0.11 | ) | | | 8.56 | | | | 8.45 | | | | (1.35 | ) | | | 32.07 | |
| Class R5 | | | | | | | | | | | | | | | | | | | | | | | | |
| 11/30/2024 | | | 22.76 | | | | (0.11 | ) | | | 10.92 | | | | 10.81 | | | | – | | | | 33.57 | |
| 11/30/2023 | | | 23.30 | | | | (0.08 | ) | | | (0.46 | ) | | | (0.54 | ) | | | – | | | | 22.76 | |
| 11/30/2022 | | | 37.03 | | | | (0.06 | ) | | | (8.75 | ) | | | (8.81 | ) | | | (4.92 | ) | | | 23.30 | |
| 11/30/2021 | | | 37.24 | | | | (0.17 | ) | | | 4.48 | | | | 4.31 | | | | (4.52 | ) | | | 37.03 | |
| 11/30/2020 | | | 28.71 | | | | (0.05 | ) | | | 9.93 | | | | 9.88 | | | | (1.35 | ) | | | 37.24 | |
| Class R6 | | | | | | | | | | | | | | | | | | | | | | | | |
| 11/30/2024 | | | 22.99 | | | | (0.09 | ) | | | 11.02 | | | | 10.93 | | | | – | | | | 33.92 | |
| 11/30/2023 | | | 23.52 | | | | (0.06 | ) | | | (0.47 | ) | | | (0.53 | ) | | | – | | | | 22.99 | |
| 11/30/2022 | | | 37.31 | | | | (0.02 | ) | | | (8.85 | ) | | | (8.87 | ) | | | (4.92 | ) | | | 23.52 | |
| 11/30/2021 | | | 37.46 | | | | (0.15 | ) | | | 4.52 | | | | 4.37 | | | | (4.52 | ) | | | 37.31 | |
| 11/30/2020 | | | 28.86 | | | | (0.03 | ) | | | 9.98 | | | | 9.95 | | | | (1.35 | ) | | | 37.46 | |
| (a) | Calculated using average shares outstanding during the period. |
| (b) | Total return for Classes A and C does not consider the effects of sales loads and assumes the reinvestment of all distributions. Total return for all other classes assumes the reinvestment of all distributions. |
| 22 | See Notes to Financial Statements. |
| | Ratios to Average Net Assets: | | Supplemental Data: |
| | | | | | | | | | | |
Total
return(b)
(%) | | Total expenses after
waivers and/or
reimbursements
(%) | | Total
expenses
(%) | | Net
investment
income (loss)
(%) | | Net assets,
end of
period
(000) | | Portfolio
turnover
rate
(%) |
| | | | | | | | | |
| | 46.43 | | | | 1.31 | | | | 1.50 | | | | (1.03 | ) | | $ | 439 | | | | 117 | |
| | (2.85 | ) | | | 1.31 | | | | 1.51 | | | | (0.97 | ) | | | 683 | | | | 149 | |
| | (27.44 | ) | | | 1.40 | | | | 1.54 | | | | (0.77 | ) | | | 858 | | | | 118 | |
| | 11.68 | | | | 1.41 | | | | 1.52 | | | | (1.07 | ) | | | 1,257 | | | | 68 | |
| | 35.26 | | | | 1.45 | | | | 1.54 | | | | (0.76 | ) | | | 987 | | | | 50 | |
| | | | | | | | | | | | | | | | | | | | | | | |
| | 46.63 | | | | 1.21 | | | | 1.40 | | | | (0.91 | ) | | | 11,994 | | | | 117 | |
| | (2.75 | ) | | | 1.21 | | | | 1.41 | | | | (0.86 | ) | | | 9,340 | | | | 149 | |
| | (27.39 | ) | | | 1.30 | | | | 1.44 | | | | (0.65 | ) | | | 10,319 | | | | 118 | |
| | 11.79 | | | | 1.31 | | | | 1.42 | | | | (0.97 | ) | | | 15,075 | | | | 68 | |
| | 35.43 | | | | 1.35 | | | | 1.44 | | | | (0.65 | ) | | | 16,868 | | | | 50 | |
| | | | | | | | | | | | | | | | | | | | | | | |
| | 47.02 | | | | 0.96 | | | | 1.15 | | | | (0.66 | ) | | | 2,323 | | | | 117 | |
| | (2.53 | ) | | | 0.96 | | | | 1.16 | | | | (0.61 | ) | | | 1,695 | | | | 149 | |
| | (27.19 | ) | | | 1.04 | | | | 1.19 | | | | (0.40 | ) | | | 2,038 | | | | 118 | |
| | 12.08 | | | | 1.06 | | | | 1.17 | | | | (0.72 | ) | | | 2,643 | | | | 68 | |
| | 35.75 | | | | 1.09 | | | | 1.19 | | | | (0.45 | ) | | | 1,948 | | | | 50 | |
| | | | | | | | | | | | | | | | | | | | | | | |
| | 47.43 | | | | 0.71 | | | | 0.87 | | | | (0.41 | ) | | | 15 | | | | 117 | |
| | (2.27 | ) | | | 0.71 | | | | 0.90 | | | | (0.37 | ) | | | 47 | | | | 149 | |
| | (27.01 | ) | | | 0.80 | | | | 0.94 | | | | (0.23 | ) | | | 65 | | | | 118 | |
| | 12.34 | | | | 0.81 | | | | 0.92 | | | | (0.46 | ) | | | 194 | | | | 68 | |
| | 36.09 | | | | 0.85 | | | | 0.94 | | | | (0.16 | ) | | | 100 | | | | 50 | |
| | | | | | | | | | | | | | | | | | | | | | | |
| | 47.48 | | | | 0.63 | | | | 0.79 | | | | (0.33 | ) | | | 11,424 | | | | 117 | |
| | (2.21 | ) | | | 0.63 | | | | 0.78 | | | | (0.28 | ) | | | 8,484 | | | | 149 | |
| | (26.96 | ) | | | 0.71 | | | | 0.85 | | | | (0.07 | ) | | | 9,216 | | | | 118 | |
| | 12.44 | | | | 0.74 | | | | 0.84 | | | | (0.40 | ) | | | 12,593 | | | | 68 | |
| | 36.20 | | | | 0.78 | | | | 0.86 | | | | (0.11 | ) | | | 11,488 | | | | 50 | |
| | | | | | | | | | | | | | | | | | | | | | | |
| | See Notes to Financial Statements. | 23 |
Financial Highlights
SMALL CAP VALUE FUND
| | | | | Per Share Operating Performance: |
| | | | | Investment Operations: | | Distributions to
shareholders from: |
| | | Net asset
value,
beginning
of period | | Net
invest-
ment
income
(loss)(a) | | Net
realized
and
unrealized
gain (loss) | | Total
from
invest-
ment
opera-
tions | | Net
investment
income | | Net
realized
gain | | Total
distri-
butions |
| Class A | | | | | | | | | | | | | | | | | | | | | | | | | | | | |
| 11/30/2024 | | | $13.64 | | | | $0.02 | | | | $4.68 | | | | $4.70 | | | | $(0.02 | ) | | $ | – | | | | $(0.02 | ) |
| 11/30/2023 | | | 13.57 | | | | 0.04 | | | | 0.51 | | | | 0.55 | | | | (0.03 | ) | | | (0.45 | ) | | | (0.48 | ) |
| 11/30/2022 | | | 17.62 | | | | 0.04 | | | | (1.40 | ) | | | (1.36 | ) | | | (0.02 | ) | | | (2.67 | ) | | | (2.69 | ) |
| 11/30/2021 | | | 13.97 | | | | 0.05 | | | | 3.76 | | | | 3.81 | | | | (0.16 | ) | | | – | | | | (0.16 | ) |
| 11/30/2020 | | | 17.48 | | | | 0.11 | | | | (0.68 | ) | | | (0.57 | ) | | | (0.05 | ) | | | (2.89 | ) | | | (2.94 | ) |
| Class C | | | | | | | | | | | | | | | | | | | | | | | | | | | | |
| 11/30/2024 | | | 2.89 | | | | (0.02 | ) | | | 0.98 | | | | 0.96 | | | | (0.02 | ) | | | – | | | | (0.02 | ) |
| 11/30/2023 | | | 3.29 | | | | (0.01 | ) | | | 0.09 | | | | 0.08 | | | | (0.03 | ) | | | (0.45 | ) | | | (0.48 | ) |
| 11/30/2022 | | | 6.32 | | | | (0.02 | ) | | | (0.34 | ) | | | (0.36 | ) | | | – | (c) | | | (2.67 | ) | | | (2.67 | ) |
| 11/30/2021 | | | 5.12 | | | | (0.03 | ) | | | 1.37 | | | | 1.34 | | | | (0.14 | ) | | | – | | | | (0.14 | ) |
| 11/30/2020 | | | 8.23 | | | | 0.01 | | | | (0.22 | ) | | | (0.21 | ) | | | (0.01 | ) | | | (2.89 | ) | | | (2.90 | ) |
| Class F | | | | | | | | | | | | | | | | | | | | | | | | | | | | |
| 11/30/2024 | | | 13.85 | | | | 0.04 | | | | 4.76 | | | | 4.80 | | | | (0.04 | ) | | | – | | | | (0.04 | ) |
| 11/30/2023 | | | 13.77 | | | | 0.06 | | | | 0.51 | | | | 0.57 | | | | (0.04 | ) | | | (0.45 | ) | | | (0.49 | ) |
| 11/30/2022 | | | 17.83 | | | | 0.06 | | | | (1.41 | ) | | | (1.35 | ) | | | (0.04 | ) | | | (2.67 | ) | | | (2.71 | ) |
| 11/30/2021 | | | 14.14 | | | | 0.05 | | | | 3.82 | | | | 3.87 | | | | (0.18 | ) | | | – | | | | (0.18 | ) |
| 11/30/2020 | | | 17.66 | | | | 0.13 | | | | (0.68 | ) | | | (0.55 | ) | | | (0.08 | ) | | | (2.89 | ) | | | (2.97 | ) |
| Class F3 | | | | | | | | | | | | | | | | | | | | | | | | | | | | |
| 11/30/2024 | | | 18.46 | | | | 0.09 | | | | 6.34 | | | | 6.43 | | | | (0.06 | ) | | | – | | | | (0.06 | ) |
| 11/30/2023 | | | 18.17 | | | | 0.11 | | | | 0.70 | | | | 0.81 | | | | (0.07 | ) | | | (0.45 | ) | | | (0.52 | ) |
| 11/30/2022 | | | 22.66 | | | | 0.12 | | | | (1.87 | ) | | | (1.75 | ) | | | (0.07 | ) | | | (2.67 | ) | | | (2.74 | ) |
| 11/30/2021 | | | 17.90 | | | | 0.13 | | | | 4.82 | | | | 4.95 | | | | (0.19 | ) | | | – | | | | (0.19 | ) |
| 11/30/2020 | | | 21.58 | | | | 0.19 | | | | (0.88 | ) | | | (0.69 | ) | | | (0.10 | ) | | | (2.89 | ) | | | (2.99 | ) |
| Class I | | | | | | | | | | | | | | | | | | | | | | | | | | | | |
| 11/30/2024 | | | 18.25 | | | | 0.08 | | | | 6.26 | | | | 6.34 | | | | (0.05 | ) | | | – | | | | (0.05 | ) |
| 11/30/2023 | | | 17.98 | | | | 0.10 | | | | 0.68 | | | | 0.78 | | | | (0.06 | ) | | | (0.45 | ) | | | (0.51 | ) |
| 11/30/2022 | | | 22.47 | | | | 0.08 | | | | (1.84 | ) | | | (1.76 | ) | | | (0.06 | ) | | | (2.67 | ) | | | (2.73 | ) |
| 11/30/2021 | | | 17.76 | | | | 0.12 | | | | 4.78 | | | | 4.90 | | | | (0.19 | ) | | | – | | | | (0.19 | ) |
| 11/30/2020 | | | 21.45 | | | | 0.18 | | | | (0.88 | ) | | | (0.70 | ) | | | (0.10 | ) | | | (2.89 | ) | | | (2.99 | ) |
| Class P | | | | | | | | | | | | | | | | | | | | | | | | | | | | |
| 11/30/2024 | | | 12.36 | | | | (0.01 | ) | | | 4.24 | | | | 4.23 | | | | – | | | | – | | | | – | |
| 11/30/2023 | | | 12.35 | | | | 0.01 | | | | 0.46 | | | | 0.47 | | | | (0.01 | ) | | | (0.45 | ) | | | (0.46 | ) |
| 11/30/2022 | | | 16.28 | | | | 0.01 | | | | (1.27 | ) | | | (1.26 | ) | | | – | (c) | | | (2.67 | ) | | | (2.67 | ) |
| 11/30/2021 | | | 12.92 | | | | 0.01 | | | | 3.48 | | | | 3.49 | | | | (0.13 | ) | | | – | | | | (0.13 | ) |
| 11/30/2020 | | | 16.38 | | | | 0.08 | | | | (0.63 | ) | | | (0.55 | ) | | | (0.02 | ) | | | (2.89 | ) | | | (2.91 | ) |
| 24 | See Notes to Financial Statements. |
| | | | | Ratios to Average Net Assets: | | Supplemental Data: |
| | | | | | | | | | | | | |
Net
asset
value,
end of
period | | Total
return(b)
(%) | | Total expenses
after waivers
and/or
reimbursements
(%) | | Total
expenses
(%) | | Net
investment
income (loss)
(%) | | Net
assets,
end of
period
(000) | | Portfolio
turnover
rate
(%) |
| | | | | | | | | | | | | | | | | | | | | | | | | | | |
| | $18.32 | | | | 34.47 | | | | 1.21 | | | | 1.21 | | | | 0.11 | | | $ | 210,245 | | | | 42 | |
| | 13.64 | | | | 4.41 | | | | 1.19 | | | | 1.19 | | | | 0.29 | | | | 178,084 | | | | 34 | |
| | 13.57 | | | | (9.18 | ) | | | 1.22 | | | | 1.23 | | | | 0.31 | | | | 191,440 | | | | 54 | |
| | 17.62 | | | | 27.48 | | | | 1.17 | | | | 1.17 | | | | 0.27 | | | | 235,845 | | | | 78 | |
| | 13.97 | | | | (4.40 | ) | | | 1.19 | | | | 1.19 | | | | 0.87 | | | | 200,419 | | | | 72 | |
| | | | | | | | | | | | | | | | | | | | | | | | | | | |
| | 3.83 | | | | 33.45 | | | | 1.96 | | | | 1.96 | | | | (0.65 | ) | | | 3,326 | | | | 42 | |
| | 2.89 | | | | 3.85 | | | | 1.94 | | | | 1.94 | | | | (0.46 | ) | | | 3,635 | | | | 34 | |
| | 3.29 | | | | (10.03 | ) | | | 1.98 | | | | 1.99 | | | | (0.45 | ) | | | 4,974 | | | | 54 | |
| | 6.32 | | | | 26.62 | | | | 1.92 | | | | 1.92 | | | | (0.54 | ) | | | 7,246 | | | | 78 | |
| | 5.12 | | | | (5.22 | ) | | | 1.94 | | | | 1.94 | | | | 0.13 | | | | 5,484 | | | | 72 | |
| | | | | | | | | | | | | | | | | | | | | | | | | | | |
| | 18.61 | | | | 34.69 | | | | 1.06 | | | | 1.06 | | | | 0.26 | | | | 2,769 | | | | 42 | |
| | 13.85 | | | | 4.53 | | | | 1.05 | | | | 1.05 | | | | 0.42 | | | | 2,732 | | | | 34 | |
| | 13.77 | | | | (8.99 | ) | | | 1.08 | | | | 1.08 | | | | 0.39 | | | | 5,667 | | | | 54 | |
| | 17.83 | | | | 27.63 | | | | 1.02 | | | | 1.02 | | | | 0.31 | | | | 15,604 | | | | 78 | |
| | 14.14 | | | | (4.24 | ) | | | 1.04 | | | | 1.04 | | | | 1.03 | | | | 9,219 | | | | 72 | |
| | | | | | | | | | | | | | | | | | | | | | | | | | | |
| | 24.83 | | | | 34.88 | | | | 0.88 | | | | 0.88 | | | | 0.44 | | | | 33,175 | | | | 42 | |
| | 18.46 | | | | 4.75 | | | | 0.88 | | | | 0.88 | | | | 0.60 | | | | 28,053 | | | | 34 | |
| | 18.17 | | | | (8.85 | ) | | | 0.88 | | | | 0.88 | | | | 0.67 | | | | 27,967 | | | | 54 | |
| | 22.66 | | | | 27.89 | | | | 0.84 | | | | 0.84 | | | | 0.60 | | | | 30,482 | | | | 78 | |
| | 17.90 | | | | (4.09 | ) | | | 0.86 | | | | 0.86 | | | | 1.18 | | | | 25,733 | | | | 72 | |
| | | | | | | | | | | | | | | | | | | | | | | | | | | |
| | 24.54 | | | | 34.82 | | | | 0.96 | | | | 0.96 | | | | 0.36 | | | | 164,679 | | | | 42 | |
| | 18.25 | | | | 4.66 | | | | 0.94 | | | | 0.94 | | | | 0.54 | | | | 138,027 | | | | 34 | |
| | 17.98 | | | | (8.95 | ) | | | 0.97 | | | | 0.97 | | | | 0.42 | | | | 157,173 | | | | 54 | |
| | 22.47 | | | | 27.81 | | | | 0.92 | | | | 0.92 | | | | 0.53 | | | | 372,878 | | | | 78 | |
| | 17.76 | | | | (4.18 | ) | | | 0.94 | | | | 0.94 | | | | 1.12 | | | | 332,301 | | | | 72 | |
| | | | | | | | | | | | | | | | | | | | | | | | | | | |
| | 16.59 | | | | 34.22 | | | | 1.41 | | | | 1.41 | | | | (0.09 | ) | | | 10,507 | | | | 42 | |
| | 12.36 | | | | 4.16 | | | | 1.39 | | | | 1.39 | | | | 0.09 | | | | 11,877 | | | | 34 | |
| | 12.35 | | | | (9.33 | ) | | | 1.42 | | | | 1.43 | | | | 0.11 | | | | 12,171 | | | | 54 | |
| | 16.28 | | | | 27.22 | | | | 1.37 | | | | 1.37 | | | | 0.09 | | | | 14,393 | | | | 78 | |
| | 12.92 | | | | (4.63 | ) | | | 1.39 | | | | 1.39 | | | | 0.67 | | | | 14,958 | | | | 72 | |
| | See Notes to Financial Statements. | 25 |
Financial Highlights (concluded)
SMALL CAP VALUE FUND
| | | | | Per Share Operating Performance: |
| | | | | Investment Operations: | | Distributions to
shareholders from: |
| | | Net asset
value,
beginning
of period | | Net
invest-
ment
income
(loss)(a) | | Net
realized
and
unrealized
gain (loss) | | Total
from
invest-
ment
opera-
tions | | Net
investment
income | | Net
realized
gain | | Total
distri-
butions |
| Class R2 | | | | | | | | | | | | | | | | | | | | | | | | | | | | |
| 11/30/2024 | | | $12.05 | | | | $(0.03 | ) | | | $4.13 | | | | $4.10 | | | $ | – | | | $ | – | | | $ | – | |
| 11/30/2023 | | | 12.06 | | | | (0.01 | ) | | | 0.45 | | | | 0.44 | | | | – | | | | (0.45 | ) | | | (0.45 | ) |
| 11/30/2022 | | | 15.98 | | | | – | (c) | | | (1.25 | ) | | | (1.25 | ) | | | – | (c) | | | (2.67 | ) | | | (2.67 | ) |
| 11/30/2021 | | | 12.69 | | | | (0.01 | ) | | | 3.41 | | | | 3.40 | | | | (0.11 | ) | | | – | | | | (0.11 | ) |
| 11/30/2020 | | | 16.14 | | | | 0.06 | | | | (0.62 | ) | | | (0.56 | ) | | | – | | | | (2.89 | ) | | | (2.89 | ) |
| Class R3 | | | | | | | | | | | | | | | | | | | | | | | | | | | | |
| 11/30/2024 | | | 12.44 | | | | (0.02 | ) | | | 4.27 | | | | 4.25 | | | | – | | | | – | | | | – | |
| 11/30/2023 | | | 12.42 | | | | 0.01 | | | | 0.46 | | | | 0.47 | | | | – | | | | (0.45 | ) | | | (0.45 | ) |
| 11/30/2022 | | | 16.37 | | | | – | (c) | | | (1.28 | ) | | | (1.28 | ) | | | – | (c) | | | (2.67 | ) | | | (2.67 | ) |
| 11/30/2021 | | | 12.99 | | | | – | (c) | | | 3.50 | | | | 3.50 | | | | (0.12 | ) | | | – | | | | (0.12 | ) |
| 11/30/2020 | | | 16.46 | | | | 0.07 | | | | (0.63 | ) | | | (0.56 | ) | | | (0.02 | ) | | | (2.89 | ) | | | (2.91 | ) |
| Class R4 | | | | | | | | | | | | | | | | | | | | | | | | | | | | |
| 11/30/2024 | | | 13.68 | | | | 0.02 | | | | 4.70 | | | | 4.72 | | | | (0.02 | ) | | | – | | | | (0.02 | ) |
| 11/30/2023 | | | 13.61 | | | | 0.04 | | | | 0.50 | | | | 0.54 | | | | (0.02 | ) | | | (0.45 | ) | | | (0.47 | ) |
| 11/30/2022 | | | 17.66 | | | | 0.01 | | | | (1.37 | ) | | | (1.36 | ) | | | (0.02 | ) | | | (2.67 | ) | | | (2.69 | ) |
| 11/30/2021 | | | 14.00 | | | | 0.05 | | | | 3.77 | | | | 3.82 | | | | (0.16 | ) | | | – | | | | (0.16 | ) |
| 11/30/2020 | | | 17.49 | | | | 0.11 | | | | (0.69 | ) | | | (0.58 | ) | | | (0.02 | ) | | | (2.89 | ) | | | (2.91 | ) |
| Class R5 | | | | | | | | | | | | | | | | | | | | | | | | | | | | |
| 11/30/2024 | | | 18.28 | | | | 0.08 | | | | 6.27 | | | | 6.35 | | | | (0.05 | ) | | | – | | | | (0.05 | ) |
| 11/30/2023 | | | 18.01 | | | | 0.10 | | | | 0.68 | | | | 0.78 | | | | (0.06 | ) | | | (0.45 | ) | | | (0.51 | ) |
| 11/30/2022 | | | 22.50 | | | | 0.10 | | | | (1.86 | ) | | | (1.76 | ) | | | (0.06 | ) | | | (2.67 | ) | | | (2.73 | ) |
| 11/30/2021 | | | 17.78 | | | | 0.07 | | | | 4.84 | | | | 4.91 | | | | (0.19 | ) | | | – | | | | (0.19 | ) |
| 11/30/2020 | | | 21.47 | | | | 0.18 | | | | (0.88 | ) | | | (0.70 | ) | | | (0.10 | ) | | | (2.89 | ) | | | (2.99 | ) |
| Class R6 | | | | | | | | | | | | | | | | | | | | | | | | | | | | |
| 11/30/2024 | | | 18.45 | | | | 0.10 | | | | 6.33 | | | | 6.43 | | | | (0.06 | ) | | | – | | | | (0.06 | ) |
| 11/30/2023 | | | 18.17 | | | | 0.11 | | | | 0.69 | | | | 0.80 | | | | (0.07 | ) | | | (0.45 | ) | | | (0.52 | ) |
| 11/30/2022 | | | 22.65 | | | | 0.12 | | | | (1.86 | ) | | | (1.74 | ) | | | (0.07 | ) | | | (2.67 | ) | | | (2.74 | ) |
| 11/30/2021 | | | 17.89 | | | | 0.13 | | | | 4.82 | | | | 4.95 | | | | (0.19 | ) | | | – | | | | (0.19 | ) |
| 11/30/2020 | | | 21.57 | | | | 0.18 | | | | (0.87 | ) | | | (0.69 | ) | | | (0.10 | ) | | | (2.89 | ) | | | (2.99 | ) |
| (a) | Calculated using average shares outstanding during the period. |
| (b) | Total return for Classes A and C does not consider the effects of sales loads and assumes the reinvestment of all distributions. Total return for all other classes assumes the reinvestment of all distributions. |
| (c) | Amount less than $0.01. |
| 26 | See Notes to Financial Statements. |
| | | | | Ratios to Average Net Assets: | | Supplemental Data: |
| | | | | | | |
Net
asset
value,
end of
period | | Total
return(b)
(%) | | Total expenses
after waivers
and/or
reimbursements
(%) | | Total
expenses
(%) | | Net
investment
income (loss)
(%) | | Net
assets,
end of
period
(000) | | Portfolio
turnover
rate
(%) |
| | | | | | | | | | | | | | | | | | | | | | | | | | | |
| | $16.15 | | | | 34.02 | | | | 1.56 | | | | 1.56 | | | | (0.23 | ) | | | $ 943 | | | | 42 | |
| | 12.05 | | | | 4.02 | | | | 1.54 | | | | 1.54 | | | | (0.06 | ) | | | 520 | | | | 34 | |
| | 12.06 | | | | (9.46 | ) | | | 1.58 | | | | 1.58 | | | | (0.02 | ) | | | 521 | | | | 54 | |
| | 15.98 | | | | 27.00 | | | | 1.52 | | | | 1.52 | | | | (0.08 | ) | | | 607 | | | | 78 | |
| | 12.69 | | | | (4.74 | ) | | | 1.54 | | | | 1.54 | | | | 0.52 | | | | 441 | | | | 72 | |
| | | | | | | | | | | | | | | | | | | | | | | | | | | |
| | 16.69 | | | | 34.16 | | | | 1.46 | | | | 1.46 | | | | (0.12 | ) | | | 2,578 | | | | 42 | |
| | 12.44 | | | | 4.15 | | | | 1.44 | | | | 1.44 | | | | 0.05 | | | | 2,816 | | | | 34 | |
| | 12.42 | | | | (9.41 | ) | | | 1.48 | | | | 1.48 | | | | 0.03 | | | | 2,663 | | | | 54 | |
| | 16.37 | | | | 27.18 | | | | 1.42 | | | | 1.42 | | | | 0.02 | | | | 4,829 | | | | 78 | |
| | 12.99 | | | | (4.67 | ) | | | 1.44 | | | | 1.44 | | | | 0.62 | | | | 4,354 | | | | 72 | |
| | | | | | | | | | | | | | | | | | | | | | | | | | | |
| | 18.38 | | | | 34.53 | | | | 1.21 | | | | 1.21 | | | | 0.12 | | | | 599 | | | | 42 | |
| | 13.68 | | | | 4.37 | | | | 1.19 | | | | 1.19 | | | | 0.28 | | | | 398 | | | | 34 | |
| | 13.61 | | | | (9.14 | ) | | | 1.21 | | | | 1.22 | | | | 0.07 | | | | 458 | | | | 54 | |
| | 17.66 | | | | 27.51 | | | | 1.17 | | | | 1.17 | | | | 0.27 | | | | 1,564 | | | | 78 | |
| | 14.00 | | | | (4.43 | ) | | | 1.19 | | | | 1.19 | | | | 0.84 | | | | 1,218 | | | | 72 | |
| | | | | | | | | | | | | | | | | | | | | | | | | | | |
| | 24.58 | | | | 34.82 | | | | 0.96 | | | | 0.96 | | | | 0.37 | | | | 328 | | | | 42 | |
| | 18.28 | | | | 4.66 | | | | 0.94 | | | | 0.94 | | | | 0.54 | | | | 284 | | | | 34 | |
| | 18.01 | | | | (8.93 | ) | | | 0.97 | | | | 0.98 | | | | 0.56 | | | | 283 | | | | 54 | |
| | 22.50 | | | | 27.83 | | | | 0.92 | | | | 0.92 | | | | 0.33 | | | | 326 | | | | 78 | |
| | 17.78 | | | | (4.17 | ) | | | 0.94 | | | | 0.94 | | | | 1.15 | | | | 26 | | | | 72 | |
| | | | | | | | | | | | | | | | | | | | | | | | | | | |
| | 24.82 | | | | 34.89 | | | | 0.88 | | | | 0.88 | | | | 0.46 | | | | 7,893 | | | | 42 | |
| | 18.45 | | | | 4.70 | | | | 0.88 | | | | 0.88 | | | | 0.60 | | | | 5,039 | | | | 34 | |
| | 18.17 | | | | (8.81 | ) | | | 0.88 | | | | 0.88 | | | | 0.64 | | | | 5,470 | | | | 54 | |
| | 22.65 | | | | 27.91 | | | | 0.84 | | | | 0.84 | | | | 0.60 | | | | 8,311 | | | | 78 | |
| | 17.89 | | | | (4.10 | ) | | | 0.86 | | | | 0.86 | | | | 1.18 | | | | 7,798 | | | | 72 | |
| | See Notes to Financial Statements. | 27 |
Notes to Financial Statements
Lord Abbett Research Fund, Inc. (the “Company”) is registered under the Investment Company Act of 1940, as amended (the “Act”), as a diversified, open-end management investment company and was incorporated under Maryland law on April 6, 1992. The Company consists of the following three funds (separately, a “Fund” and collectively, the “Funds”) and their respective classes: Lord Abbett Dividend Growth Fund (“Dividend Growth Fund”), Lord Abbett Growth Opportunities Fund (“Growth Opportunities Fund”) and Lord Abbett Small-Cap Value Series (“Small Cap Value Fund”).
Dividend Growth Fund’s investment objective is to seek current income and capital appreciation. Growth Opportunities Fund’s investment objective is capital appreciation. Small Cap Value Fund’s investment objective is long-term capital appreciation. Each Fund has eleven active share classes at November 30, 2024: Class A, C, F, F3, I, P, R2, R3, R4, R5 and R6, each with different expenses and dividends. A front-end sales charge is normally added to the net asset value (“NAV”) for Class A shares. There is no front-end sales charge in the case of Class C, F, F3, I, P, R2, R3, R4, R5 and R6 shares, although there may be a contingent deferred sales charge (“CDSC”) in certain cases as follows: Class A shares purchased without a sales charge and redeemed before the first day of the month in which the one-year anniversary of the purchase falls (subject to certain exceptions as set forth in each Fund’s prospectus); and Class C shares redeemed before the first anniversary of purchase. Class C shares automatically convert to Class A shares on the 25th day of the month (or, if the 25th day is not a business day, the next business day thereafter) following the eighth anniversary of the month on which the purchase order was accepted, provided that the Funds or financial intermediary through which a shareholder purchased Class C shares have records verifying that the C shares have been held at least eight years. The Funds’ Class P shares are closed to substantially all new investors, with certain exceptions as set forth in the Funds’ prospectus.
The Funds are investment companies and apply the accounting and reporting guidance of the Financial Accounting Standards Board (“FASB”) Accounting Standards Codification Topic 946 Financial Services - Investment Companies. The preparation of the financial statements in conformity with accounting principles generally accepted in the United States of America (“U.S. GAAP”) requires management to make certain estimates and assumptions that affect the reported amounts of assets and liabilities and disclosure of contingent assets and liabilities at the date of the financial statements and the reported amounts of increases and decreases in net assets from operations during the reporting period. Actual results could differ from those estimates.
| 2. | SIGNIFICANT ACCOUNTING POLICIES |
| (a) | Investment Valuation–Under procedures approved by the Funds’ Board of Directors (the “Board”), the Board has designated the determination of fair value of the Funds’ portfolio investments to Lord, Abbett & Co. LLC (“Lord Abbett”) as its valuation designee. Accordingly, Lord Abbett is responsible for, among other things, assessing and managing valuation risks, establishing, applying and testing fair value methodologies, and evaluating pricing services. Lord Abbett has formed a Pricing Committee that performs these responsibilities on behalf of Lord Abbett, administers the pricing and valuation of portfolio investments and ensures that prices utilized reasonably reflect fair value. Among other things, these procedures allow Lord Abbett, subject to Board oversight, to utilize independent pricing services, quotations from securities and financial instrument dealers and other market sources to determine fair value. |
28
Notes to Financial Statements (continued)
| | Securities actively traded on any recognized U.S. or non-U.S. exchange or on The NASDAQ Stock Market LLC are valued at the last sale price or official closing price on the exchange or system on which they are principally traded. Events occurring after the close of trading on non-U.S. exchanges may result in adjustments to the valuation of foreign securities to reflect their fair value as of the close of regular trading on the New York Stock Exchange. When valuing foreign equity securities that meet certain criteria, the Pricing Committee uses a third-party fair valuation service that values such securities to reflect market trading that occurs after the close of the applicable foreign markets of comparable securities or other instruments that correlate to the fair-valued securities. Unlisted equity securities are valued at the last quoted sale price or, if no sale price is available, at the mean between the most recently quoted bid and ask prices. Exchange traded options and futures contracts are valued at the last quoted sale price in the market where they are principally traded. If no sale has occurred, the mean between the most recently quoted bid and ask prices is used. |
| | |
| | Securities for which prices are not readily available are valued at fair value as determined by the Pricing Committee. The Pricing Committee considers a number of factors, including observable and unobservable inputs, when arriving at fair value. The Pricing Committee may use related or comparable assets or liabilities, recent transactions, market multiples, book values, and other relevant information to determine the fair value of portfolio investments. The Board or a designated committee thereof periodically reviews reports that may include fair value determinations made by the Pricing Committee, related market activity, inputs and assumptions, and retrospective comparison of prices of subsequent purchases and sales transactions to fair value determinations made by the Pricing Committee. |
| | |
| | Short-term securities with 60 days or less remaining to maturity are valued using the amortized cost method, which approximates fair value. Investments in open-end money market mutual funds are valued at their NAV as of the close of each business day. |
| | |
| (b) | Security Transactions–Security transactions are recorded as of the date that the securities are purchased or sold (trade date). Realized gains and losses on sales of portfolio securities are calculated using the identified-cost method. Realized and unrealized gains (losses) are allocated to each class of shares based upon the relative proportion of net assets at the beginning of the day. |
| | |
| (c) | Investment Income–Dividend income is recorded on the ex-dividend date. Interest income is recorded on the accrual basis as earned. Discounts are accreted and premiums are amortized using the effective interest method and are included in Interest and other, if applicable, in the Statements of Operations. Withholding taxes on foreign dividends have been provided for in accordance with the applicable country’s tax rules and rates. Investment income is allocated to each class of shares based upon the relative proportion of net assets at the beginning of the day. |
| | |
| (d) | Income Taxes–It is the policy of each Fund to meet the requirements of Subchapter M of the Internal Revenue Code applicable to regulated investment companies and to distribute substantially all taxable income and capital gains to its shareholders. Therefore, no income tax provision is required. |
| | |
| | Each Fund files U.S. federal and various state and local tax returns. No income tax returns are currently under examination. The statute of limitations on each Fund’s filed U.S. federal tax returns remains open for the fiscal years ended November 30, 2021 through November 30, 2024. The statutes of limitations on the Company’s state and local tax returns may remain open for an additional year depending upon each Fund’s jurisdiction. |
29
Notes to Financial Statements (continued)
| (e) | Expenses–Expenses incurred by the Company that do not specifically relate to an individual fund are generally allocated to the Funds within the Company on a pro rata basis by relative net assets. Expenses, excluding class-specific expenses, are allocated to each class of shares based upon the relative proportion of net assets at the beginning of the day. In addition, Class F3 and R6 shares bear only their class-specific shareholder servicing expenses. Class A, C, F, P, R2, R3 and R4 shares bear their class-specific share of all expenses and fees relating to the Funds’ 12b-1 Distribution Plan. |
| | |
| (f) | Foreign Transactions–The books and records of each Fund are maintained in U.S. dollars and transactions denominated in foreign currencies are recorded in each Fund’s records at the rate prevailing when earned or recorded. Asset and liability accounts that are denominated in foreign currencies are adjusted daily to reflect current exchange rates and any unrealized gain (loss), if applicable, is included in Net change in unrealized appreciation/depreciation on translation of assets and liabilities denominated in foreign currencies in each Fund’s Statement of Operations. The resultant exchange gains and losses upon settlement of such transactions, if applicable, are included in Net realized gain (loss) on foreign currency related transactions in each Fund’s Statement of Operations. The Funds do not isolate that portion of the results of operations arising as a result of changes in the foreign exchange rates from the changes in market prices of the securities. |
| | |
| | Each Fund uses foreign currency exchange contracts to facilitate transactions in foreign-denominated securities. Losses from these transactions may arise from changes in the value of the foreign currency or if the counterparties do not perform under the contracts’ terms. |
| | |
| (g) | Futures Contracts–Each Fund may purchase and sell index futures contracts to enhance returns, to attempt to economically hedge some of its investment risk, or as a substitute position in lieu of holding the underlying asset on which the instrument is based. At the time of entering into a futures transaction, an investor is required to deposit and maintain a specified amount of cash or eligible securities called “initial margin.” Subsequent payments made or received by the Funds called “variation margin” are made on a daily basis as the market price of the futures contract fluctuates. Each Fund will record an unrealized gain (loss) based on the amount of variation margin. When a contract is closed, a realized gain (loss) is recorded equal to the difference between the opening and closing value of the contract. |
| | |
| (h) | Repurchase Agreements–Each Fund may enter into repurchase agreements with respect to securities. A repurchase agreement is a transaction in which a fund acquires a security and simultaneously commits to resell that security to the seller (a bank or securities dealer) at an agreed-upon price on an agreed-upon date. Each Fund requires at all times that the repurchase agreement be collateralized by cash, or by securities of the U.S. Government, its agencies, its instrumentalities, or U.S. Government sponsored enterprises having a value equal to, or in excess of, the value of the repurchase agreement (including accrued interest). If the seller of the agreement defaults on its obligation to repurchase the underlying securities at a time when the fair value of these securities has declined, a Fund may incur a loss upon disposition of the securities. |
| | |
| (i) | Fair Value Measurements–Fair value is defined as the price that each Fund would receive upon selling an investment or transferring a liability in an orderly transaction to an independent buyer in the principal or most advantageous market of the investment. A three-tier hierarchy is used to maximize the use of observable market data and minimize the use of unobservable inputs and to establish classification of fair value measurements for |
30
Notes to Financial Statements (continued)
| | disclosure purposes. Inputs refer broadly to the assumptions that market participants would use in pricing the asset or liability, including assumptions about risk - for example, the risk inherent in a particular valuation technique used to measure fair value (such as a pricing model) and/or the risk inherent in the inputs to the valuation technique. Inputs may be observable or unobservable. Observable inputs reflect the assumptions market participants would use in pricing the asset or liability. Observable inputs are based on market data obtained from sources independent of the reporting entity. Unobservable inputs reflect the reporting entity’s own assumptions about the assumptions market participants would use in pricing the asset or liability. Unobservable inputs are based on the best information available in the circumstances. The three-tier hierarchy classification is determined based on the lowest level of inputs that is significant to the fair value measurement, and is summarized in the three broad Levels listed below: |
| | • | Level 1 – | unadjusted quoted prices in active markets for identical investments; |
| | | | |
| | • | Level 2 – | other significant observable inputs (including quoted prices for similar investments, interest rates, prepayment speeds, credit risk, etc.); and |
| | | | |
| | • | Level 3 – | significant unobservable inputs (including each Fund’s own assumptions in determining the fair value of investments). |
| | A summary of inputs used in valuing each Fund’s investments as of November 30, 2024 and, if applicable, Level 3 rollforwards for the fiscal year then ended is included in each Fund’s Schedule of Investments. |
| | |
| | Changes in valuation techniques may result in transfers into or out of an assigned level within the three-tier hierarchy. The inputs or methodology used for valuing securities are not necessarily an indication of the risk associated with investing in those securities. |
| 3. | MANAGEMENT FEE AND OTHER TRANSACTIONS WITH AFFILIATES |
Management Fee
The Company has a management agreement with Lord Abbett, pursuant to which Lord Abbett provides each Fund with investment management services and executive and other personnel, provides office space and pays for ordinary and necessary office and clerical expenses relating to research and statistical work and supervision of each Fund’s investment portfolio. The management fee is accrued daily and payable monthly.
The management fee is based on each Fund’s average daily net assets at the following annual rates:
| Dividend Growth Fund | |
| | |
| First $2 billion | .55% |
| Over $2 billion | .49% |
| | |
| Growth Opportunities Fund |
| | |
| First $1 billion | .65% |
| Next $3 billion | .63% |
| Next $1 billion | .60% |
| Over $5 billion | .58% |
| | |
| Small Cap Value Fund | |
| | |
| First $2 billion | .75% |
| Over $2 billion | .70% |
31
Notes to Financial Statements (continued)
For the fiscal year ended November 30, 2024, the effective management fee, net of any applicable waivers, was at the following annualized rate of each Fund’s average daily net assets:
| | Net Effective
Management Fee | |
| Dividend Growth Fund | .52% | |
| Growth Opportunities Fund | .47% | |
| Small Cap Value Fund | .75% | |
In addition, Lord Abbett provides certain administrative services to each Fund pursuant to an Administrative Services Agreement in return for a fee at an annual rate of .04% of each Fund’s average daily net assets. The fund administration fee is accrued daily and payable monthly. Lord Abbett voluntarily waived the following fund administration fees for the fiscal year ended November 30, 2024:
| Fund | Fund
Administration Fee | |
| Dividend Growth Fund | | $42,176 | |
| Growth Opportunities Fund | | 10,932 | |
| Small Cap Value Fund | | 14,691 | |
For the fiscal year ended November 30, 2024 and continuing through March 31, 2025, Lord Abbett has contractually agreed to waive its fees and reimburse expenses to the extent necessary to limit total net annual operating expenses, excluding certain of the Funds’ expenses to the following annual rates:
| | | Classes |
| Fund | | A, C, F, I, P, R2, R3, R4 and R5 | | F3 and R6 |
| Growth Opportunities Fund | | .71% | | .63% |
All contractual fee waivers and expense reimbursement agreements between the Funds and Lord Abbett may be terminated only upon the approval of the Board.
12b-1 Distribution Plan
Each Fund has adopted a distribution plan with respect to Class A, C, F, P, R2, R3 and R4 shares pursuant to Rule 12b-1 under the Act, which provides for the payment of ongoing distribution and service fees to Lord Abbett Distributor LLC (the “Distributor”), an affiliate of Lord Abbett. The distribution and service fees are accrued daily and payable monthly. The following annual rates have been authorized by the Board pursuant to the plan:
| Fees* | | Class A | | Class C | | Class F(1)(2) | | Class P | | Class R2 | | Class R3 | | Class R4 |
| Service | | .25% | | .25% | | – | | .25% | | .25% | | .25% | | .25% |
| Distribution | | – | | .75% | | .10% | | .20% | | .35% | | .25% | | – |
| * | | The Funds may designate a portion of the aggregate fees attributable to service activities for purposes of calculating Financial Industry Regulatory Authority, Inc. sales charge limitations. |
| (1) | | The Class F shares Rule 12b-1 fee may be designated as a service fee in limited circumstances as described in the Funds’ prospectus. |
| (2) | | For the fiscal year ended November 30, 2024 and continuing through March 31, 2025, the Distributor has contractually agreed to waive Dividend Growth Fund’s 0.10% Rule 12b-1 fee for Class F shares. This agreement may be terminated only by the Funds’ Board. |
Class F3, Class I, Class R5 and Class R6 shares do not have a distribution plan.
32
Notes to Financial Statements (continued)
Commissions
The Distributor received the following commissions on sales of shares of the Funds, after concessions were paid to authorized dealers, for the fiscal year ended November 30, 2024:
| | | Distributor
Commissions | | | Dealers’
Concessions | |
| Dividend Growth Fund | | | $242,676 | | | $ | 1,490,433 | |
| Growth Opportunities Fund | | | 34,248 | | | | 192,976 | |
| Small Cap Value Fund | | | 12,032 | | | | 73,068 | |
The Distributor received the following amounts of CDSCs for the fiscal year ended November 30, 2024:
| | | Class A | | | Class C | |
| Dividend Growth Fund | | $ | 2,266 | | | $ | 6,775 | |
| Growth Opportunities Fund | | | 194 | | | | 112 | |
| Small Cap Value Fund | | | – | | | | 108 | |
Other Related Parties
As of November 30, 2024, the percentages of Dividend Growth Fund’s and Small Cap Value Fund’s outstanding shares owned by each Fund that invests principally in affiliated mutual funds managed by Lord Abbett (“Fund of Funds”) were as follows:
| Fund of Funds | | Dividend
Growth Fund | | | Small Cap
Value Fund | |
| Alpha Strategy Fund | | | – | | | | 25.68% | |
| Multi-Asset Balanced Opportunity Fund | | | 7.03% | | | | – | |
| Multi-Asset Income Fund | | | 1.55% | | | | – | |
One Director and certain of the Funds’ officers have an interest in Lord Abbett.
| 4. | DISTRIBUTIONS AND TAX INFORMATION |
Dividends are paid from net investment income, if any. Capital gain distributions are paid from taxable net realized gains from investments transactions, reduced by allowable capital loss carryforwards, if any. The capital loss carryforward amount, if any, is available to offset future net capital gains. Dividends and distributions to shareholders are recorded on the ex-dividend date. The amounts of dividends and distributions from net investment income and net realized capital gains are determined in accordance with federal income tax regulations, which may differ from U.S. GAAP. These book/tax differences are either considered temporary or permanent in nature. To the extent these differences are permanent in nature, such amounts are reclassified within the components of net assets based on their federal tax basis treatment; temporary differences do not require reclassification. Dividends and distributions, which exceed earnings and profits for tax purposes, are reported as a tax return of capital.
The tax character of distributions paid during the fiscal year ended November 30, 2024 was as follows:
| Fund | | Tax-Exempt
Income | | | Ordinary
Income | | | Net
Long-Term
Capital Gains | | | Return of
Capital | | | Total
Distributions
Paid | |
| Dividend Growth Fund | | $ | – | | | $ | 30,815,822 | | | | $20,588,083 | | | $ | – | | | | $51,403,905 | |
| Growth Opportunities Fund | | | – | | | | – | | | | – | | | | – | | | | – | |
| Small Cap Value Fund | | | – | | | | 764,466 | | | | – | | | | – | | | | 764,466 | |
33
Notes to Financial Statements (continued)
The tax character of distributions paid during the fiscal year ended November 30, 2023 was as follows:
| Fund | | Tax-Exempt
Income | | | Ordinary
Income | | | Net
Long-Term
Capital Gains | | | Return of
Capital | | | Total
Distributions
Paid | |
| Dividend Growth Fund | | $ | – | | | $ | 31,193,274 | | | | $163,532,113 | | | $ | – | | | $ | 194,725,387 | |
| Growth Opportunities Fund | | | – | | | | – | | | | – | | | | – | | | | – | |
| Small Cap Value Fund | | | – | | | | 1,076,186 | | | | 12,431,524 | | | | – | | | | 13,507,710 | |
As of November 30, 2024, the components of distributable earnings (loss) on a tax basis were as follows:
| Fund | | Undistributed
Tax-Exempt
Income | | | Undistributed
Ordinary
Income | | | Undistributed
Net
Long-Term
Capital Gains | | | Accumulated
Capital and
Other Losses | | | Unrealized
Appreciation/
(Depreciation) | | | Temporary
Differences | | | Total
Distributable
Earnings
(Loss) - Net | |
| Dividend Growth Fund | | $ | – | | | | $8,788,258 | | | | $176,761,384 | | | $ | – | | | | $1,730,188,088 | | | | $(370,423 | ) | | $ | 1,915,367,307 | |
| Growth Opportunities Fund | | | – | | | | – | | | | – | | | | (17,505,763 | ) | | | 199,226,271 | | | | (95,253 | ) | | | 181,625,255 | |
| Small Cap Value Fund | | | – | | | | 318,886 | | | | 36,407,410 | | | | – | | | | 115,244,043 | | | | (200,307 | ) | | | 151,770,032 | |
Net capital losses recognized by the Funds may be carried forward indefinitely and retain their character as short-term and/or long-term losses. Capital losses incurred that will be carried forward are as follows:
| Fund | | Short-Term
Losses | | | Long-Term
Losses | | | Net Capital
Losses | |
| Dividend Growth Fund | | $ | – | | | $ | – | | | $ | – | |
| Growth Opportunities Fund | | | (14,664,659 | ) | | | – | | | | (14,664,659 | ) |
| Small Cap Value Fund | | | – | | | | – | | | | – | |
At each Fund’s election, certain losses incurred within the taxable year are deemed to arise on the first business day of the Fund’s next taxable year. The Funds incurred and will elect to defer qualified late-year ordinary losses and/or post-October capital losses as follows:
| Fund | | Late-Year
Ordinary Losses | | | Short-Term
Losses | | | Long-Term
Losses | |
| Dividend Growth Fund | | $ | – | | | $ | – | | | $ | – | |
| Growth Opportunities Fund | | | (2,841,104 | ) | | | – | | | | – | |
| Small Cap Value Fund | | | – | | | | – | | | | – | |
As of October 31, 2024, the tax cost of investments and the breakdown of unrealized appreciation/(depreciation) for each Fund are shown below. The difference between book-basis and tax basis unrealized appreciation/(depreciation) is attributable to the tax treatment of certain securities, other financial instruments, and wash sales.
| Fund | | Tax Cost of
Investments | | | Gross
Unrealized
Appreciation | | | Gross
Unrealized
Depreciation | | | Net
Unrealized
Appreciation/
(Depreciation) | |
| Dividend Growth Fund | | $ | 2,686,213,252 | | | $ | 1,733,760,551 | | | | $(3,591,210 | ) | | $ | 1,730,169,341 | |
| Growth Opportunities Fund | | | 366,929,650 | | | | 199,797,583 | | | | (571,122 | ) | | | 199,226,461 | |
| Small Cap Value Fund | | | 322,044,853 | | | | 125,225,573 | | | | (9,981,530 | ) | | | 115,244,043 | |
34
Notes to Financial Statements (continued)
Permanent items identified, as shown below, have been reclassified among the components of net assets based on their tax treatment. The permanent differences are primarily attributable to tax treatment of certain distributions and net operating loss.
| Fund | | Total
Distributable
Earnings (Loss) | | | Paid-in
Capital | |
| Dividend Growth Fund | | $ | (9,717,748 | ) | | $ | 9,717,748 | |
| Growth Opportunities Fund | | | 56,026 | | | | (56,026 | ) |
| Small Cap Value Fund | | | (1,143,840 | ) | | | 1,143,840 | |
| 5. | PORTFOLIO SECURITIES TRANSACTIONS |
Purchases and sales of investment securities (excluding short-term investments) during the fiscal year ended November 30, 2024 were as follows:
| | | Purchases | | | Sales | |
| Dividend Growth Fund | | $ | 978,155,189 | | | $ | 1,321,132,712 | |
| Growth Opportunities Fund | | | 534,890,556 | | | | 578,405,680 | |
| Small Cap Value Fund | | | 168,315,755 | | | | 219,423,034 | |
There were no purchases or sales of U.S. Government securities during the fiscal year ended November 30, 2024.
Each Fund is permitted to purchase and sell securities (“cross-trade”) from and to other Lord Abbett funds or client accounts pursuant to procedures approved by the Board in compliance with Rule 17a-7 under the Act (the “Rule”). Each cross-trade is executed at a fair market price in compliance with provisions of the Rule. For the fiscal year ended November 30, 2024, the following Funds engaged in cross-trades:
| Fund | | Purchases | | | Sales | | | Gain (Loss) | |
| Dividend Growth Fund | | $ | 9,320,145 | | | $ | 40,898,418 | | | | $6,941,096 | |
| Growth Opportunities Fund | | | 4,221,148 | | | | – | | | | – | |
| 6. | DISCLOSURES ABOUT OFFSETTING ASSETS AND LIABILITIES |
The FASB requires disclosures intended to help better assess the effect or potential effect of offsetting arrangements on a fund’s financial position. The following tables illustrate gross and net information about recognized assets and liabilities eligible for offset in the Statements of Assets and Liabilities; and disclose such amounts subject to an enforceable master netting agreement or similar agreement, by the counterparty. A master netting agreement is an agreement between a fund and the counterparty which provides for the net settlement of amounts owed under all contracts traded under that agreement, as well as cash collateral, through a single payment by one party to the other in the event of default on or termination of any one contract. The Funds’ accounting policy with respect to balance sheet offsetting is that, absent an event of default by the counterparty or a termination of the agreement, the master netting agreement does not result in an offset of reported amounts of financial assets and liabilities in the Statements of Assets and Liabilities across transactions between the Funds and the applicable counterparty:
35
Notes to Financial Statements (continued)
| | | | | | Dividend Growth Fund |
| Description | | Gross Amounts of
Recognized Assets | | | Gross Amounts
Offset in the
Statement of Assets
and Liabilities | | | Net Amounts of
Assets Presented
in the Statement of
Assets and Liabilities |
| Repurchase Agreements | | | $67,810,693 | | | $ | – | | | | $67,810,693 |
| Total | | | $67,810,693 | | | $ | – | | | | $67,810,693 |
| | | Net Amounts of
Assets Presented
in the Statement of
Assets and Liabilities | | | Amounts Not Offset in the
Statement of Assets and Liabilities | | | |
| Counterparty | | | | Financial
Instruments | | | Cash
Collateral
Received(a) | | | Securities
Collateral
Received(a) | | | Net
Amount(b) |
| Fixed Income Clearing Corp. | | | $67,810,693 | | | $ | – | | | $ | – | | | $ | (67,810,693 | ) | | $ | – |
| Total | | | $67,810,693 | | | $ | – | | | $ | – | | | $ | (67,810,693 | ) | | $ | – |
| | | Growth Opportunities Fund |
| Description | | Gross Amounts of
Recognized Assets | | | Gross Amounts
Offset in the
Statement of Assets
and Liabilities | | | Net Amounts of
Assets Presented
in the Statement of
Assets and Liabilities |
| Repurchase Agreements | | | $11,393,512 | | | $ | – | | | | $11,393,512 |
| Total | | | $11,393,512 | | | $ | – | | | | $11,393,512 |
| | | Net Amounts of
Assets Presented
in the Statement of
Assets and Liabilities | | | Amounts Not Offset in the
Statement of Assets and Liabilities | | | |
| Counterparty | | | | Financial
Instruments | | | Cash
Collateral
Received(a) | | | Securities
Collateral
Received(a) | | | Net
Amount(b) |
| Fixed Income Clearing Corp. | | | $11,393,512 | | | $ | – | | | $ | – | | | $ | (11,393,512 | ) | | $ | – |
| Total | | | $11,393,512 | | | $ | – | | | $ | – | | | $ | (11,393,512 | ) | | $ | – |
| | | | | | Small Cap Value Fund |
| Description | | Gross Amounts of
Recognized Assets | | | Gross Amounts
Offset in the
Statement of Assets
and Liabilities | | | Net Amounts of
Assets Presented
in the Statement of
Assets and Liabilities |
| Repurchase Agreements | | | $3,269,626 | | | $ | – | | | | $3,269,626 |
| Total | | | $3,269,626 | | | $ | – | | | | $3,269,626 |
| | | Net Amounts of
Assets Presented
in the Statement of
Assets and Liabilities | | | Amounts Not Offset in the
Statement of Assets and Liabilities | | | |
| Counterparty | | | | Financial
Instruments | | | Cash
Collateral
Received(a) | | | Securities
Collateral
Received(a) | | | Net
Amount(b) |
| Fixed Income Clearing Corp. | | | $3,269,626 | | | $ | – | | | $ | – | | | $ | (3,269,626 | ) | | $ | – |
| Total | | | $3,269,626 | | | $ | – | | | $ | – | | | $ | (3,269,626 | ) | | $ | – |
| (a) | Collateral disclosed is limited to an amount not to exceed 100% of the net amount of assets (liabilities) presented in the Statement of Assets and Liabilities, for each respective counterparty. |
| (b) | Net amount represents the amount owed to the Fund by the counterparty as of November 30, 2024. |
| 7. | DIRECTORS’ REMUNERATION |
The Company’s officers and one Director, who are associated with Lord Abbett, do not receive any compensation from the Company for serving in such capacities. Independent Directors’ fees are allocated among all Lord Abbett-sponsored funds primarily based on the relative net assets of each
36
Notes to Financial Statements (continued)
fund. There is an equity-based plan available to all Independent Directors under which Independent Directors may elect to defer receipt of a portion of Directors’ fees. The deferred amounts are treated as though equivalent dollar amounts had been invested in the Funds. Such amounts and earnings accrued thereon are included in Directors’ fees in the Statements of Operations and in Directors’ fees payable in the Statements of Assets and Liabilities and are not deductible for U.S. federal income tax purposes until such amounts are paid.
For the period ended July 31, 2024, the Funds and certain other funds managed by Lord Abbett (collectively, the “Participating Funds”) were party to a syndicated line of credit facility with various lenders for $1.6 billion (the “Syndicated Facility”) under which State Street Bank and Trust Company (“SSB”) participated as a lender and as agent for the lenders. The Participating Funds were subject to graduated borrowing limits of one-third of fund net assets (if fund net assets are less than $750 million), $250 million, $300 million, $700 million, or $1 billion, based on past borrowings and likelihood of future borrowings, among other factors.
Effective August 1, 2024, the Participating Funds renewed the Syndicated Facility for $1.6 billion. The Participating Funds are subject to graduated borrowing limits of one-third of fund net assets (if fund net assets are less than $750 million), $250 million, $700 million, or $1 billion, based on past borrowings and likelihood of future borrowings, among other factors.
For the period ended July 31, 2024, the Participating Funds were also party to an additional uncommitted line of credit facility with SSB for $330 million (the “Bilateral Facility”). Under the Bilateral Facility, the Participating Funds were subject to graduated borrowing limits of one-third of fund net assets (if fund net assets are less than $750 million), or $250 million based on past borrowings and likelihood of future borrowings, among other factors.
Effective August 1, 2024, the Participating Funds renewed the Bilateral Facility in the same amount. The Participating Funds remain subject to the same borrowing limits as were in place prior to the renewal. These credit facilities are to be used for short-term working capital purposes as additional sources of liquidity to satisfy redemptions.
For the fiscal year ended November 30, 2024, the Funds did not utilize the Syndicated Facility or Bilateral Facility.
| 9. | INTERFUND LENDING PROGRAM |
Pursuant to an exemptive order issued by the U.S. Securities and Exchange Commission (“SEC exemptive order”), certain registered open-end management investment companies managed by Lord Abbett, including each Fund, participate in a joint lending and borrowing program (the “Interfund Lending Program”). The SEC exemptive order allows the funds that participate in the Interfund Lending Program to borrow money from and lend money to each other for temporary or emergency purposes subject to the limitations and conditions.
For the fiscal year ended November 30, 2024, the following Fund participated as a lender in the Interfund Lending Program. For the period in which the loan was outstanding, the average amount loaned, average interest rate and interest income were as follows:
| Fund | | Average
Amount Loaned | | Average
Interest Rate | | Interest
Income(1) | |
| Dividend Growth Fund | | $19,131,424 | | 4.57% | | $2,393 | |
| (1) | Statements of Operations location: Interest earned from Interfund Lending. |
37
Notes to Financial Statements (continued)
| 10. | CUSTODIAN AND ACCOUNTING AGENT |
SSB is the Company’s custodian and accounting agent. SSB performs custodial, accounting and recordkeeping functions relating to portfolio transactions and calculating each Fund’s NAV.
| 11. | SECURITIES LENDING AGREEMENT |
The Funds have established a securities lending agreement with Citibank, N.A. for the lending of securities to qualified brokers in exchange for securities or cash collateral equal to at least the market value of securities loaned, plus interest, if applicable. Cash collateral is invested in an approved money market fund. In accordance with the Funds’ securities lending agreement, the market value of securities on loan is determined each day at the close of business and any additional collateral required to cover the value of securities on loan is delivered to the Funds on the next business day. As with other extensions of credit, the Funds may experience a delay in the recovery of their securities or incur a loss should the borrower of the securities breach its agreement with the Funds or the borrower becomes insolvent at a time when the collateral is insufficient to cover the cost of repurchasing securities on loan. Any income earned from securities lending is included in Securities lending net income in each Fund’s Statement of Operations.
The initial collateral received by the Funds is required to have a value equal to at least 100% of the market value of the securities loaned. The collateral must be marked-to-market daily to cover increases in the market value of the securities loaned (or potentially a decline in the value of the collateral). In general, the risk of borrower default will be borne by Citibank, N.A.; the Funds will bear the risk of loss with respect to the investment of the cash collateral. The advantage of such loans is that the Funds continue to receive income on loaned securities while receiving a portion of any securities lending fees and earning returns on the cash amounts which may be reinvested for the purchase of investments in securities.
As of November 30, 2024, the Funds did not have any securities on loan.
Each Fund is subject to the general risks and considerations associated with equity investing. The value of the Funds’ investments will fluctuate in response to movements in the equity securities markets in general and to the changing prospects of individual companies and/or sectors in which the Funds invest.
Dividend Growth Fund invests primarily in equity securities of large and mid-sized company stocks that have a history of growing their dividends, but there is no guarantee that a company will pay a dividend. Also, equity securities may experience significant volatility. Such securities may fall sharply in response to adverse events affecting overall markets, a particular industry or sector, or an individual company’s financial condition. If the Fund’s fundamental research and quantitative analysis fail to produce the intended result, the Fund may suffer losses or underperform its benchmark or other funds with the same investment objective or similar strategies, even in a favorable market. Large and mid-sized company stocks each may perform differently than the market as a whole and other types of stocks. This is because different types of stocks tend to shift in and out of favor depending on market and economic conditions. Mid-sized company stocks may be less able to weather economic shifts or other adverse developments than those of larger, more established companies. Securities of mid-sized companies tend to be more sensitive to changing economic, market, and industry conditions and tend to be less liquid than equity securities of larger
38
Notes to Financial Statements (continued)
companies, especially over the short term. The securities of mid-sized companies may be less well-known and less widely held and trade less frequently and in more limited volume than the securities of large cap company stocks. Mid-sized companies also may fall out of favor relative to larger companies in certain market cycles, causing the Fund to incur losses or underperform.
Growth Opportunities Fund has particular risks associated with growth stocks. Growth companies may grow faster than other companies, which may result in more volatility in their stock prices. In addition, if the Fund’s assessment of a company’s potential for growth or market conditions is wrong, it could suffer losses or produce poor performance relative to other funds, even in a favorable market. Growth stocks often are more sensitive to market fluctuations than other securities because their market prices are highly sensitive to future earnings expectations. The Fund invests largely in mid-sized company stocks, which may be less able to weather economic shifts or other adverse developments than those of larger, more established companies. Due to the Fund’s investment exposure to American Depositary Receipts, foreign companies and emerging markets, the Fund may experience increased market, liquidity, currency, political, information, and other risks. As compared with companies organized and operated in the U.S., these companies may be more vulnerable to economic, political and social instability and subject to less government supervision, lack of transparency, inadequate regulatory and accounting standards, and foreign taxes. The securities of foreign companies also may be subject to inadequate exchange control regulations, the imposition of economic sanctions or threat thereof or other government restrictions, higher transaction and other costs, and delays in settlement to the extent they are traded on non-U.S. exchanges or markets.
Small Cap Value Fund has particular risks associated with small company value stocks. Small company value stocks may perform differently than the market as a whole and from other types of stocks, such as large company stocks or growth stocks. The market may fail to recognize the intrinsic value of particular value stocks for a long time. In addition, small cap company stocks may be more volatile and less liquid than large cap company stocks, especially over the short term. The securities of small companies may be less well-known and less widely held and trade less frequently and in more limited volume than the securities of large cap company stocks. Small companies also may fall out of favor relative to larger companies in certain market cycles, causing the Fund to incur losses or underperform. Also, if the Fund’s assessment of a company’s value or prospects for exceeding earnings expectations or market conditions is wrong, the Fund could suffer losses or produce poor performance relative to other funds, even in a favorable market.
Geopolitical and other events (e.g., wars, terrorism, natural disasters, infectious illness outbreaks, epidemics or pandemics) may disrupt securities markets and adversely affect global economies and markets, thereby decreasing the value of each Fund’s investments. Market disruptions can also prevent the Funds from implementing their investment strategies and achieving their investment objectives.
Adverse developments that affect financial institutions or the financial services industry generally, or concerns or rumors about any events of these kinds or other similar risks, may reduce liquidity in the market generally or have other adverse effects on the economy, each Fund or issuers in which each Fund invests. In addition, issuers in which each Fund invests and each Fund may not be able to identify all potential solvency or stress concerns with respect to a financial institution or to transfer assets from one bank or financial institution to another in a timely manner in the event such bank or financial institution comes under stress or fails.
39
Notes to Financial Statements (continued)
The impacts and effects of infectious illness outbreaks, epidemics or pandemics (such as the COVID-19 outbreak), may be short term or may continue for an extended period of time. For example, a global pandemic or other widespread health crises could negatively affect the global economy, the economies of individual countries, and the financial performance of individual issuers, sectors, industries, asset classes, and markets in significant and unforeseen ways. Health crises caused by outbreaks of disease may also exacerbate other pre-existing political, social, and economic risks in certain countries or globally. The foregoing could disrupt the operations of each Fund and its service providers, adversely affect the value and liquidity of each Fund’s investments, and negatively impact each Fund’s performance and your investment in each Fund.
Advancements in technology may also adversely impact markets and the overall performance of the Funds. For instance, the economy may be significantly impacted by the advanced development and increased regulation of technology. As the use of technology grows, liquidity and market movements may be affected. As technology is used more widely in the asset management industry, the profitability and growth of each Fund’s holdings may be impacted, which could significantly impact the overall performance of each Fund.
| 13. | SUMMARY OF CAPITAL TRANSACTIONS |
Transactions in shares of capital stock were as follows:
| Dividend Growth Fund | | Year Ended
November 30, 2024 | | | Year Ended
November 30, 2023 | |
| Class A Shares | | Shares | | | Amount | | | Shares | | | Amount | |
| Shares sold | | | 7,942,418 | | | $ | 171,733,225 | | | | 10,677,245 | | | $ | 188,678,921 | |
| Reinvestment of distributions | | | 1,479,396 | | | | 30,359,890 | | | | 6,670,604 | | | | 112,605,690 | |
| Shares reacquired | | | (14,594,700 | ) | | | (315,825,501 | ) | | | (19,162,009 | ) | | | (338,919,072 | ) |
| Decrease | | | (5,172,886 | ) | | $ | (113,732,386 | ) | | | (1,814,160 | ) | | $ | (37,634,461 | ) |
| | | | | | | | | | | | | | | | | |
| Class C Shares | | | | | | | | | | | | | | | | |
| Shares sold | | | 810,475 | | | $ | 17,202,574 | | | | 1,222,741 | | | $ | 21,189,925 | |
| Reinvestment of distributions | | | 43,700 | | | | 835,362 | | | | 416,951 | | | | 6,877,111 | |
| Shares reacquired | | | (2,423,642 | ) | | | (52,051,079 | ) | | | (3,054,272 | ) | | | (52,932,246 | ) |
| Decrease | | | (1,569,467 | ) | | $ | (34,013,143 | ) | | | (1,414,580 | ) | | $ | (24,865,210 | ) |
| | | | | | | | | | | | | | | | | |
| Class F Shares | | | | | | | | | | | | | | | | |
| Shares sold | | | 253,072 | | | $ | 5,633,494 | | | | 722,786 | | | $ | 12,893,398 | |
| Reinvestment of distributions | | | 42,890 | | | | 888,362 | | | | 537,743 | | | | 9,113,225 | |
| Shares reacquired | | | (859,901 | ) | | | (18,795,480 | ) | | | (7,961,273 | ) | | | (142,808,942 | ) |
| Decrease | | | (563,939 | ) | | $ | (12,273,624 | ) | | | (6,700,744 | ) | | $ | (120,802,319 | ) |
| | | | | | | | | | | | | | | | | |
| Class F3 Shares | | | | | | | | | | | | | | | | |
| Shares sold | | | 2,826,669 | | | $ | 63,260,986 | | | | 2,191,018 | | | $ | 39,548,182 | |
| Reinvestment of distributions | | | 227,348 | | | | 4,805,653 | | | | 926,703 | | | | 15,990,267 | |
| Shares reacquired | | | (3,292,029 | ) | | | (73,011,380 | ) | | | (3,619,205 | ) | | | (65,552,023 | ) |
| Decrease | | | (238,012 | ) | | $ | (4,944,741 | ) | | | (501,484 | ) | | $ | (10,013,574 | ) |
| | | | | | | | | | | | | | | | | |
| Class I Shares | | | | | | | | | | | | | | | | |
| Shares sold | | | 9,137,188 | | | $ | 207,549,524 | | | | 11,768,738 | | | $ | 212,182,107 | |
| Reinvestment of distributions | | | 570,112 | | | | 11,900,964 | | | | 2,381,279 | | | | 40,816,261 | |
| Shares reacquired | | | (16,304,246 | ) | | | (340,478,791 | ) | | | (10,888,590 | ) | | | (195,057,892 | ) |
| Increase (decrease) | | | (6,596,946 | ) | | $ | (121,028,303 | ) | | | 3,261,427 | | | $ | 57,940,476 | |
40
Notes to Financial Statements (continued)
| Dividend Growth Fund | | Year Ended
November 30, 2024 | | | Year Ended
November 30, 2023 | |
| Class P Shares | | Shares | | | Amount | | | Shares | | | Amount | |
| Shares sold | | | 5,455 | | | $ | 120,984 | | | | 5,658 | | | $ | 100,111 | |
| Reinvestment of distributions | | | 496 | | | | 10,189 | | | | 2,702 | | | | 45,894 | |
| Shares reacquired | | | (4,398 | ) | | | (95,200 | ) | | | (12,506 | ) | | | (223,559 | ) |
| Increase (decrease) | | | 1,553 | | | $ | 35,973 | | | | (4,146 | ) | | $ | (77,554 | ) |
| | | | | | | | | | | | | | | | | |
| Class R2 Shares | | | | | | | | | | | | | | | | |
| Shares sold | | | 5,918 | | | $ | 129,094 | | | | 3,307 | | | $ | 59,434 | |
| Reinvestment of distributions | | | 654 | | | | 13,395 | | | | 3,449 | | | | 58,895 | |
| Shares reacquired | | | (26,467 | ) | | | (626,142 | ) | | | (3,880 | ) | | | (68,267 | ) |
| Increase (decrease) | | | (19,895 | ) | | $ | (483,653 | ) | | | 2,876 | | | $ | 50,062 | |
| | | | | | | | | | | | | | | | | |
| Class R3 Shares | | | | | | | | | | | | | | | | |
| Shares sold | | | 91,639 | | | $ | 1,955,074 | | | | 265,132 | | | $ | 4,652,843 | |
| Reinvestment of distributions | | | 7,673 | | | | 154,544 | | | | 33,427 | | | | 560,244 | |
| Shares reacquired | | | (189,594 | ) | | | (4,057,183 | ) | | | (164,327 | ) | | | (2,880,576 | ) |
| Increase (decrease) | | | (90,282 | ) | | $ | (1,947,565 | ) | | | 134,232 | | | $ | 2,332,511 | |
| | | | | | | | | | | | | | | | | |
| Class R4 Shares | | | | | | | | | | | | | | | | |
| Shares sold | | | 53,840 | | | $ | 1,174,842 | | | | 168,002 | | | $ | 3,075,981 | |
| Reinvestment of distributions | | | 2,120 | | | | 43,425 | | | | 8,311 | | | | 140,244 | |
| Shares reacquired | | | (151,770 | ) | | | (3,371,577 | ) | | | (50,402 | ) | | | (908,270 | ) |
| Increase (decrease) | | | (95,810 | ) | | $ | (2,153,310 | ) | | | 125,911 | | | $ | 2,307,955 | |
| | | | | | | | | | | | | | | | | |
| Class R5 Shares | | | | | | | | | | | | | | | | |
| Shares sold | | | 4,869 | | | $ | 98,377 | | | | 7,141 | | | $ | 125,580 | |
| Reinvestment of distributions | | | 229 | | | | 4,794 | | | | 809 | | | | 13,874 | |
| Shares reacquired | | | (8,421 | ) | | | (188,892 | ) | | | (9,981 | ) | | | (182,420 | ) |
| Decrease | | | (3,323 | ) | | $ | (85,721 | ) | | | (2,031 | ) | | $ | (42,966 | ) |
| | | | | | | | | | | | | | | | | |
| Class R6 Shares | | | | | | | | | | | | | | | | |
| Shares sold | | | 161,924 | | | $ | 3,522,866 | | | | 97,203 | | | $ | 1,745,819 | |
| Reinvestment of distributions | | | 3,995 | | | | 84,422 | | | | 18,982 | | | | 327,381 | |
| Shares reacquired | | | (146,994 | ) | | | (3,176,411 | ) | | | (173,555 | ) | | | (3,165,552 | ) |
| Increase (decrease) | | | 18,925 | | | $ | 430,877 | | | | (57,370 | ) | | $ | (1,092,352 | ) |
| | | | | | | |
| Growth Opportunities Fund | | Year Ended
November 30, 2024 | | | Year Ended
November 30, 2023 | |
| Class A Shares | | Shares | | | Amount | | | Shares | | | Amount | |
| Shares sold | | | 983,798 | | | $ | 21,459,523 | | | | 2,190,571 | | | $ | 40,600,648 | |
| Shares reacquired | | | (2,600,434 | ) | | | (56,158,599 | ) | | | (4,346,989 | ) | | | (79,849,057 | ) |
| Decrease | | | (1,616,636 | ) | | $ | (34,699,076 | ) | | | (2,156,418 | ) | | $ | (39,248,409 | ) |
| | | | | | | | | | | | | | | | | |
| Class C Shares | | | | | | | | | | | | | | | | |
| Shares sold | | | 68,934 | | | $ | 848,093 | | | | 217,475 | | | $ | 2,328,679 | |
| Shares reacquired | | | (269,483 | ) | | | (3,278,205 | ) | | | (883,021 | ) | | | (9,281,371 | ) |
| Decrease | | | (200,549 | ) | | $ | (2,430,112 | ) | | | (665,546 | ) | | $ | (6,952,692 | ) |
| | | | | | | | | | | | | | | | | |
| Class F Shares | | | | | | | | | | | | | | | | |
| Shares sold | | | 7,423 | | | $ | 201,336 | | | | 103,435 | | | $ | 1,977,776 | |
| Shares reacquired | | | (33,559 | ) | | | (769,009 | ) | | | (736,780 | ) | | | (14,441,971 | ) |
| Decrease | | | (26,136 | ) | | $ | (567,673 | ) | | | (633,345 | ) | | $ | (12,464,195 | ) |
41
Notes to Financial Statements (continued)
| Growth Opportunities Fund | | Year Ended
November 30, 2024 | | | Year Ended
November 30, 2023 | |
| Class F3 Shares | | Shares | | | Amount | | | Shares | | | Amount | |
| Shares sold | | | 867,561 | | | $ | 23,625,680 | | | | 651,716 | | | $ | 14,791,256 | |
| Shares reacquired | | | (685,773 | ) | | | (18,475,627 | ) | | | (638,676 | ) | | | (14,447,201 | ) |
| Increase | | | 181,788 | | | $ | 5,150,053 | | | | 13,040 | | | $ | 344,055 | |
| | | | | | | | | | | | | | | | | |
| Class I Shares | | | | | | | | | | | | | | | | |
| Shares sold | | | 546,998 | | | $ | 15,698,864 | | | | 1,017,333 | | | $ | 23,016,141 | |
| Shares reacquired | | | (650,875 | ) | | | (16,560,352 | ) | | | (403,304 | ) | | | (9,066,379 | ) |
| Increase (decrease) | | | (103,877 | ) | | $ | (861,488 | ) | | | 614,029 | | | $ | 13,949,762 | |
| | | | | | | | | | | | | | | | | |
| Class P Shares | | | | | | | | | | | | | | | | |
| Shares sold | | | 14,513 | | | $ | 288,434 | | | | 21,986 | | | $ | 375,774 | |
| Shares reacquired | | | (36,192 | ) | | | (715,133 | ) | | | (11,505 | ) | | | (199,306 | ) |
| Increase (decrease) | | | (21,679 | ) | | $ | (426,699 | ) | | | 10,481 | | | $ | 176,468 | |
| | | | | | | | | | | | | | | | | |
| Class R2 Shares | | | | | | | | | | | | | | | | |
| Shares sold | | | 13,568 | | | $ | 257,793 | | | | 9,380 | | | $ | 154,064 | |
| Shares reacquired | | | (36,606 | ) | | | (691,081 | ) | | | (18,340 | ) | | | (293,258 | ) |
| Decrease | | | (23,038 | ) | | $ | (433,288 | ) | | | (8,960 | ) | | $ | (139,194 | ) |
| | | | | | | | | | | | | | | | | |
| Class R3 Shares | | | | | | | | | | | | | | | | |
| Shares sold | | | 51,947 | | | $ | 1,043,711 | | | | 154,576 | | | $ | 2,698,543 | |
| Shares reacquired | | | (119,101 | ) | | | (2,367,818 | ) | | | (194,382 | ) | | | (3,326,484 | ) |
| Decrease | | | (67,154 | ) | | $ | (1,324,107 | ) | | | (39,806 | ) | | $ | (627,941 | ) |
| | | | | | | | | | | | | | | | | |
| Class R4 Shares | | | | | | | | | | | | | | | | |
| Shares sold | | | 13,930 | | | $ | 300,035 | | | | 14,628 | | | $ | 266,808 | |
| Shares reacquired | | | (20,189 | ) | | | (426,196 | ) | | | (30,347 | ) | | | (548,054 | ) |
| Decrease | | | (6,259 | ) | | $ | (126,161 | ) | | | (15,719 | ) | | $ | (281,246 | ) |
| | | | | | | | | | | | | | | | | |
| Class R5 Shares | | | | | | | | | | | | | | | | |
| Shares sold | | | 442 | | | $ | 10,074 | | | | 314 | | | $ | 7,048 | |
| Shares reacquired | | | (2,076 | ) | | | (48,286 | ) | | | (1,048 | ) | | | (24,144 | ) |
| Decrease | | | (1,634 | ) | | $ | (38,212 | ) | | | (734 | ) | | $ | (17,096 | ) |
| | | | | | | | | | | | | | | | | |
| Class R6 Shares | | | | | | | | | | | | | | | | |
| Shares sold | | | 34,328 | | | $ | 899,595 | | | | 54,125 | | | $ | 1,233,462 | |
| Shares reacquired | | | (66,600 | ) | | | (1,774,044 | ) | | | (77,010 | ) | | | (1,816,922 | ) |
| Decrease | | | (32,272 | ) | | $ | (874,449 | ) | | | (22,885 | ) | | $ | (583,460 | ) |
| | | | | | | |
| Small Cap Value Fund | | Year Ended
November 30, 2024 | | | Year Ended
November 30, 2023 | |
| Class A Shares | | Shares | | | Amount | | | Shares | | | Amount | |
| Shares sold | | | 595,730 | | | $ | 9,324,885 | | | | 1,329,250 | | | $ | 17,960,443 | |
| Reinvestment of distributions | | | 14,747 | | | | 220,475 | | | | 512,362 | | | | 6,271,310 | |
| Shares reacquired | | | (2,190,814 | ) | | | (34,276,509 | ) | | | (2,890,442 | ) | | | (38,903,916 | ) |
| Decrease | | | (1,580,337 | ) | | $ | (24,731,149 | ) | | | (1,048,830 | ) | | $ | (14,672,163 | ) |
| | | | | | | | | | | | | | | | | |
| Class C Shares | | | | | | | | | | | | | | | | |
| Shares sold | | | 63,752 | | | $ | 206,901 | | | | 172,512 | | | $ | 510,034 | |
| Reinvestment of distributions | | | 8,797 | | | | 27,622 | | | | 273,188 | | | | 713,021 | |
| Shares reacquired | | | (462,342 | ) | | | (1,509,068 | ) | | | (696,579 | ) | | | (1,975,991 | ) |
| Decrease | | | (389,793 | ) | | $ | (1,274,545 | ) | | | (250,879 | ) | | $ | (752,936 | ) |
42
Notes to Financial Statements (concluded)
| Small Cap Value Fund | | Year Ended
November 30, 2024 | | | Year Ended
November 30, 2023 | |
| Class F Shares | | Shares | | | Amount | | | Shares | | | Amount | |
| Shares sold | | | 13,768 | | | $ | 228,049 | | | | 101,298 | | | $ | 1,347,637 | |
| Reinvestment of distributions | | | 370 | | | | 5,614 | | | | 14,254 | | | | 176,897 | |
| Shares reacquired | | | (62,635 | ) | | | (991,728 | ) | | | (329,893 | ) | | | (4,476,815 | ) |
| Decrease | | | (48,497 | ) | | $ | (758,065 | ) | | | (214,341 | ) | | $ | (2,952,281 | ) |
| | | | | | | | | | | | | | | | | |
| Class F3 Shares | | | | | | | | | | | | | | | | |
| Shares sold | | | 161,127 | | | $ | 3,419,810 | | | | 253,515 | | | $ | 4,566,371 | |
| Reinvestment of distributions | | | 4,145 | | | | 83,678 | | | | 47,779 | | | | 788,836 | |
| Shares reacquired | | | (349,387 | ) | | | (7,440,485 | ) | | | (320,310 | ) | | | (5,818,157 | ) |
| Decrease | | | (184,115 | ) | | $ | (3,936,997 | ) | | | (19,016 | ) | | $ | (462,950 | ) |
| | | | | | | | | | | | | | | | | |
| Class I Shares | | | | | | | | | | | | | | | | |
| Shares sold | | | 326,323 | | | $ | 7,000,912 | | | | 294,821 | | | $ | 5,280,192 | |
| Reinvestment of distributions | | | 19,767 | | | | 394,751 | | | | 270,536 | | | | 4,420,553 | |
| Shares reacquired | | | (1,198,240 | ) | | | (25,350,959 | ) | | | (1,742,680 | ) | | | (31,095,347 | ) |
| Decrease | | | (852,150 | ) | | $ | (17,955,296 | ) | | | (1,177,323 | ) | | $ | (21,394,602 | ) |
| | | | | | | | | | | | | | | | | |
| Class P Shares | | | | | | | | | | | | | | | | |
| Shares sold | | | 84,990 | | | $ | 1,225,300 | | | | 91,057 | | | $ | 1,095,171 | |
| Reinvestment of distributions | | | – | | | | – | | | | 39,991 | | | | 444,295 | |
| Shares reacquired | | | (412,402 | ) | | | (5,773,513 | ) | | | (155,875 | ) | | | (1,933,156 | ) |
| Decrease | | | (327,412 | ) | | $ | (4,548,213 | ) | | | (24,827 | ) | | $ | (393,690 | ) |
| | | | | | | | | | | | | | | | | |
| Class R2 Shares | | | | | | | | | | | | | | | | |
| Shares sold | | | 26,290 | | | $ | 361,896 | | | | 17,041 | | | $ | 195,957 | |
| Reinvestment of distributions | | | – | | | | – | | | | 1,775 | | | | 19,259 | |
| Shares reacquired | | | (10,993 | ) | | | (147,827 | ) | | | (18,875 | ) | | | (222,280 | ) |
| Increase (decrease) | | | 15,297 | | | $ | 214,069 | | | | (59 | ) | | $ | (7,064 | ) |
| | | | | | | | | | | | | | | | | |
| Class R3 Shares | | | | | | | | | | | | | | | | |
| Shares sold | | | 48,130 | | | $ | 759,817 | | | | 71,450 | | | $ | 897,197 | |
| Reinvestment of distributions | | | – | | | | – | | | | 8,488 | | | | 94,985 | |
| Shares reacquired | | | (119,982 | ) | | | (1,773,890 | ) | | | (67,934 | ) | | | (836,904 | ) |
| Increase (decrease) | | | (71,852 | ) | | $ | (1,014,073 | ) | | | 12,004 | | | $ | 155,278 | |
| | | | | | | | | | | | | | | | | |
| Class R4 Shares | | | | | | | | | | | | | | | | |
| Shares sold | | | 4,848 | | | $ | 75,731 | | | | 4,766 | | | $ | 63,222 | |
| Reinvestment of distributions | | | 29 | | | | 429 | | | | 895 | | | | 10,978 | |
| Shares reacquired | | | (1,395 | ) | | | (21,586 | ) | | | (10,209 | ) | | | (140,412 | ) |
| Increase (decrease) | | | 3,482 | | | $ | 54,574 | | | | (4,548 | ) | | $ | (66,212 | ) |
| | | | | | | | | | | | | | | | | |
| Class R5 Shares | | | | | | | | | | | | | | | | |
| Shares sold | | | 221 | | | $ | 4,526 | | | | 352 | | | $ | 6,282 | |
| Reinvestment of distributions | | | 41 | | | | 827 | | | | 491 | | | | 8,029 | |
| Shares reacquired | | | (2,418 | ) | | | (52,504 | ) | | | (1,065 | ) | | | (18,773 | ) |
| Decrease | | | (2,156 | ) | | $ | (47,151 | ) | | | (222 | ) | | $ | (4,462 | ) |
| | | | | | | | | | | | | | | | | |
| Class R6 Shares | | | | | | | | | | | | | | | | |
| Shares sold | | | 87,297 | | | $ | 1,774,100 | | | | 54,857 | | | $ | 992,497 | |
| Reinvestment of distributions | | | 154 | | | | 3,108 | | | | 2,603 | | | | 42,956 | |
| Shares reacquired | | | (42,616 | ) | | | (921,293 | ) | | | (85,433 | ) | | | (1,532,981 | ) |
| Increase (decrease) | | | 44,835 | | | $ | 855,915 | | | | (27,973 | ) | | $ | (497,528 | ) |
43
Report of Independent Registered Public Accounting Firm
To the shareholders and the Board of Directors of Lord Abbett Research Fund, Inc.
Opinion on the Financial Statements and Financial Highlights
We have audited the accompanying statements of assets and liabilities of Lord Abbett Research Fund, Inc. (the “Company”) comprising the Lord Abbett Dividend Growth Fund, Lord Abbett Growth Opportunities Fund, and Lord Abbett Small-Cap Value Series, including the schedules of investments, as of November 30, 2024, the related statements of operations for the year then ended, the statements of changes in net assets for each of the two years in the period then ended, the financial highlights for each of the five years in the period then ended, and the related notes. In our opinion, the financial statements and financial highlights present fairly, in all material respects, the financial position of each of the funds constituting the Lord Abbett Research Fund, Inc. as of November 30, 2024, and the results of their operations for the year then ended, the changes in their net assets for each of the two years in the period then ended, and the financial highlights for each of the five years in the period then ended in conformity with accounting principles generally accepted in the United States of America.
Basis for Opinion
These financial statements and financial highlights are the responsibility of the Company’s management. Our responsibility is to express an opinion on the Company’s financial statements and financial highlights based on our audits. We are a public accounting firm registered with the Public Company Accounting Oversight Board (United States) (PCAOB) and are required to be independent with respect to the Company in accordance with the U.S. federal securities laws and the applicable rules and regulations of the Securities and Exchange Commission and the PCAOB.
We conducted our audits in accordance with the standards of the PCAOB. Those standards require that we plan and perform the audit to obtain reasonable assurance about whether the financial statements and financial highlights are free of material misstatement, whether due to error or fraud. The Company is not required to have, nor were we engaged to perform, an audit of its internal control over financial reporting. As part of our audits we are required to obtain an understanding of internal control over financial reporting but not for the purpose of expressing an opinion on the effectiveness of the Company’s internal control over financial reporting. Accordingly, we express no such opinion.
Our audits included performing procedures to assess the risks of material misstatement of the financial statements and financial highlights, whether due to error or fraud, and performing procedures that respond to those risks. Such procedures included examining, on a test basis, evidence regarding the amounts and disclosures in the financial statements and financial highlights. Our audits also included evaluating the accounting principles used and significant estimates made by management, as well as evaluating the overall presentation of the financial statements and financial highlights. Our procedures included confirmation of securities owned as of November 30, 2024, by correspondence with the custodian or counterparties; when replies were not received from counterparties, we performed other auditing procedures. We believe that our audits provide a reasonable basis for our opinion.
/s/ Deloitte & Touche LLP
New York, New York
January 24, 2025
We have served as the auditor of one or more Lord Abbett Family of Funds’ investment companies since 1932.
44
Changes in and Disagreements with Accountants
There were no changes in or disagreements with accountants during the period.
Proxy Disclosures
There were no matters submitted to a vote of shareholders during the period.
Remuneration Paid to Directors, Officers, and Others
Remuneration paid to directors, officers, and others is included in “Directors’ Remuneration” under Item 7 of this Form N-CSR.
45
Tax Information (unaudited)
The percentages below reflect the portion of ordinary income distributions that are eligible for the corporate dividend received deduction (DRD) and qualified dividend income (QDI) for individual shareholders:
| Fund Name | | DRD | | QDI |
| Dividend Growth Fund | | 100% | | 100% |
| Small Cap Value Fund | | 100% | | 100% |
Of the distributions paid to the shareholders during the most recently ended fiscal year, the following amounts represent long-term capital gains:
| | | Long-Term |
| Fund Name | | Capital Gains |
| Dividend Growth Fund | | $20,588,083 |
46
 | | | | |
 |
| | | | | |
| | | | | |
| | | | | |
| | | | | |
| | | | | |
| | | | | |
| | | | | |
| | | | | |
| | | | | |
| | | | | |
| | | | | |
| | | | | |

| | | | |
| | | | | |
This report, when not used for the general information of shareholders of the Fund, is to be distributed only if preceded or accompanied by a current fund prospectus. Lord Abbett mutual fund shares are distributed by
LORD ABBETT DISTRIBUTOR LLC. | | Lord Abbett Research Fund, Inc. Lord Abbett Dividend Growth Fund Lord Abbett Growth Opportunities Fund Lord Abbett Small-Cap Value Series | | LARF-2 (01/25) |
| Item 12: | Disclosure of Proxy Voting Policies and Procedures for Closed-End Management Investment Companies. |
| | Not applicable. |
| | |
| Item 13: | Portfolio Managers of Closed-End Management Investment Companies. |
| | Not applicable. |
| Item 14: | Purchases of Equity Securities by Closed-End Management Investment Company and Affiliated Purchasers. |
| | Not applicable. |
| | |
| Item 15: | Submission of Matters to a Vote of Security Holders. |
| | Not applicable. |
| Item 16: | Controls and Procedures. |
| | (a) | The principal executive officer and principal financial & accounting officer have concluded as of a date within 90 days of the filing date of this report, based on their evaluation of the Registrant’s disclosure controls and procedures (as defined in Rule 30a-3(c) under the Investment Company Act of 1940), that the design of such procedures is effective to provide reasonable assurance that material information required to be disclosed by the Registrant on Form N-CSR is recorded, processed, summarized and reported within the time periods specified in the Commission’s rules and forms. |
| | | |
| | (b) | There were no changes in the Registrant’s internal control over financial reporting (as defined in Rule 30a-3(d) under the Investment Company Act of 1940) that occurred during the period covered by this report that have materially affected, or are reasonably likely to materially affect, the Registrant’s internal control over financial reporting. |
| Item 17: | Disclosure of Securities Lending Activities for Closed-End Management Investment Companies. |
| | Not applicable. |
| | |
| Item 18: | Recovery of Erroneously Awarded Compensation. |
| | Not applicable. |
| | |
| Item 19: | Exhibits. |
SIGNATURES
Pursuant to the requirements of the Securities Exchange Act of 1934 and the Investment Company Act of 1940, the Registrant has duly caused this report to be signed on its behalf by the undersigned, thereunto duly authorized.
| | LORD ABBETT RESEARCH FUND, INC. |
| | |
| | | By: | /s/Douglas B. Sieg |
| | | | Douglas B. Sieg President and Chief Executive Officer (Principal Executive Officer) |
Date: January 24, 2025
Pursuant to the requirements of the Securities Exchange Act of 1934 and the Investment Company Act of 1940, this report has been signed below by the following persons on behalf of the Registrant and in the capacities and on the dates indicated.
| | | By: | /s/Douglas B. Sieg |
| | | | Douglas B. Sieg President and Chief Executive Officer (Principal Executive Officer) |
Date: January 24, 2025
| | | By: | /s/Michael J. Hebert |
| | | | Michael J. Hebert Chief Financial Officer and Treasurer (Principal Financial Officer) |
Date: January 24, 2025
0000887194lordabbett:C000019092Member2018-11-300000887194lordabbett:C000156654Member2017-08-310000887194lordabbett:C000019097Member2023-12-012024-11-300000887194lordabbett:LordAbbettIndexRussellMidCapGrowthIndex16974BroadBasedIndexMember2017-12-310000887194lordabbett:LordAbbettIndexSP500Index16988AdditionalIndexMember2015-09-300000887194lordabbett:LordAbbettIndexRussell2000ValueIndex16994BroadBasedIndexMember2018-10-310000887194lordabbett:LordAbbettIndexRussell2000ValueIndex16985BroadBasedIndexMember2019-08-310000887194lordabbett:LordAbbettIndexRussell2000ValueIndex16992BroadBasedIndexMember2021-08-31iso4217:USDxbrli:shares