Exhibit 99.2
RBC Capital Markets
2005 Financial Institutions Conference
September 21, 2005
Forward Looking Statement
• This material includes forward looking statements, which management believes are a benefit to shareholders. These forward looking statements describe Columbia’s management’s expectations regarding future events and developments such as future operating results, growth in loans and deposits, continued success of Columbia’s style of banking and the strength of the local economy. The words “will,” “believe,” “expect,” “should,” and “anticipate” and words of similar construction are intended in part to help identify forward looking statements. Future events are difficult to predict, and the expectations described above are necessarily subject to risk and uncertainty that may cause actual results to differ materially and adversely. In addition to discussions about risks and uncertainties set forth from time to time in Columbia’s filings with the SEC, factors that may cause actual results to differ materially from those contemplated by such forward looking statements include, among others, the following possibilities: (1) local and national general and economic conditions are less favorable than expected or have a more direct and pronounced effect on Columbia than expected and adversely affect Columbia’s ability to continue its internal growth at historical rates and maintain the quality of its earning assets; (2) changes in interest rates reduce interest margins more than expected and negatively affect funding sources; (3) projected business increases following strategic expansion or opening or acquiring new branches are lower than expected; (4) costs or difficulties related to the integration of acquisitions are greater than expected; (5) competitive pressure among financial institutions increases significantly; (6) legislation or regulatory requirements or changes adversely affect the businesses in which Columbia is engaged; (7) the Company’s ability to realize the efficiencies it expects to receive from its investments in personnel and infrastructure.
Discussion Outline
History
Financial Performance Summary
Our Strategic Vision
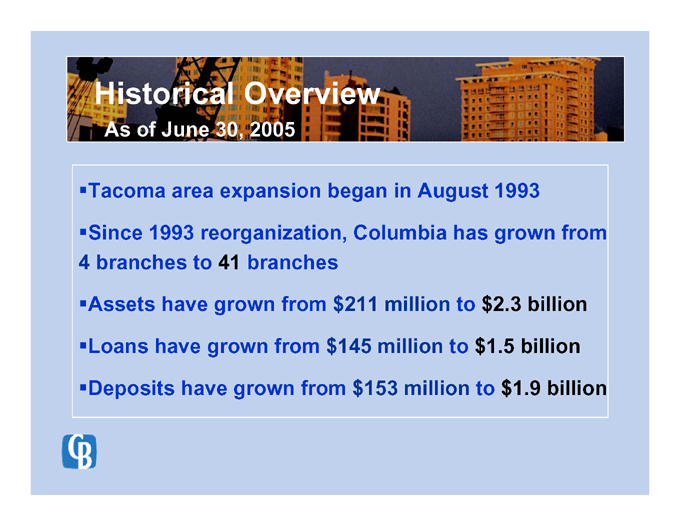
Historical Overview
As of June 30, 2005
Tacoma area expansion began in August 1993
Since 1993 reorganization, Columbia has grown from 4 branches to 41 branches
Assets have grown from $211 million to $2.3 billion
Loans have grown from $145 million to $1.5 billion
Deposits have grown from $153 million to $1.9 billion
Financial Performance
Gary Schminkey
EVP, Chief Financial Officer
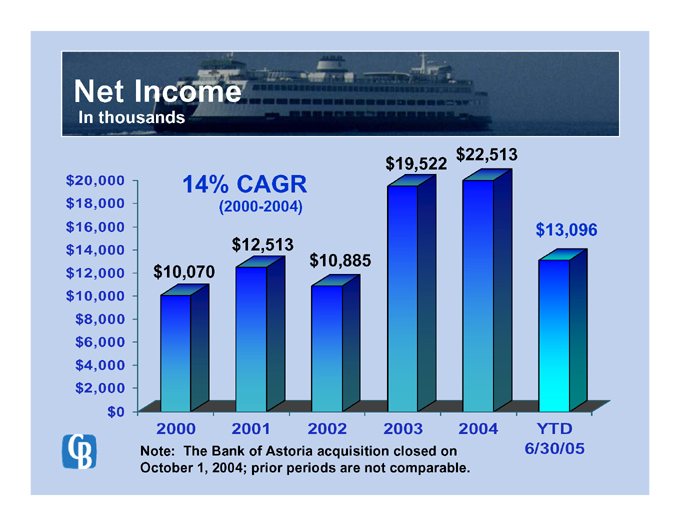
Net Income
In thousands $22,513 $19,522 $20,000 14% CAGR $18,000 (2000-2004)
$16,000 $13,096 $12,513 $10,885 $14,000 $10,070 $12,000 $10,000 $8,000 $6,000 $4,000 $2,000 $0
2004 2003 2002 2001 2000 YTD
Note: The Bank of Astoria acquisition closed on October 1, 2004; prior periods are not comparable.
6/30/05
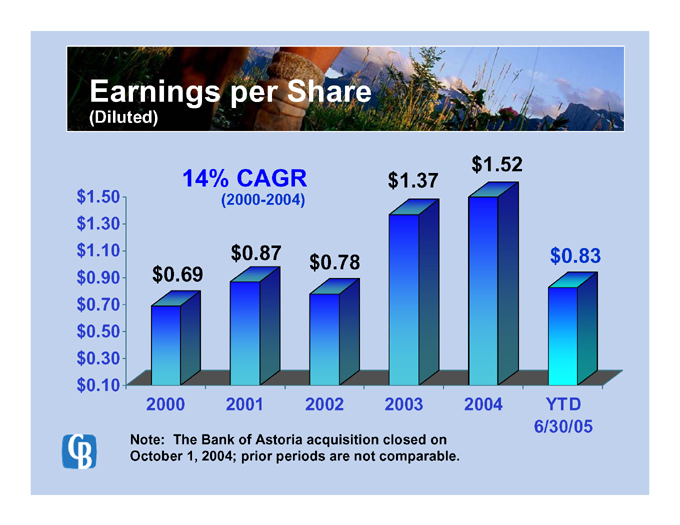
Earnings per Share
(Diluted)
$1.52
$1.37
14% CAGR
$1.50
(2000-2004)
$1.30
$0.83
$1.10
$0.87
$0.78
$0.69
$0.90
$0.70
$0.50
$0.30
$0.10
2004
2003
2002
2001
2000
YTD
6/30/05
Note: The Bank of Astoria acquisition closed on October 1, 2004; prior periods are not comparable.
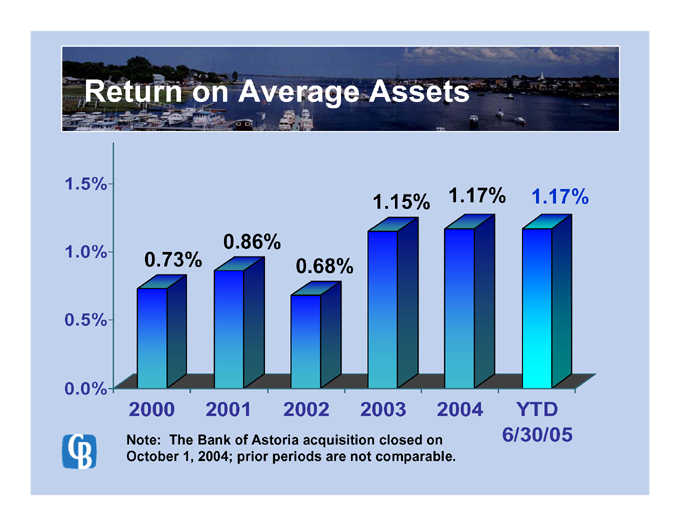
Return on Average Assets
1.17%
1.15%
1.17%
0.86%
0.68%
0.73%
2004
2003
2002
2001
2000
1.5%
1.0%
0.5%
0.0%
YTD
Note: The Bank of Astoria acquisition closed on October 1, 2004; prior periods are not comparable.
6/30/05
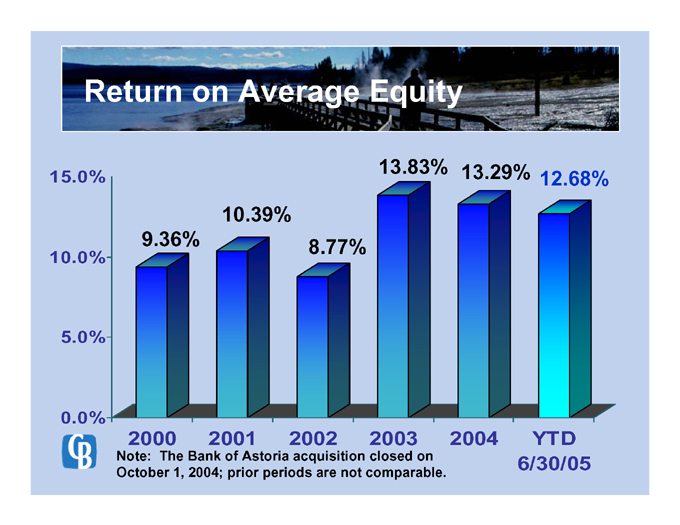
Return on Average Equity
13.83%
12.68%
13.29%
15.0%
10.39%
9.36%
8.77%
10.0%
5.0%
0.0%
2004
2003
2002
2001
2000
YTD
Note: The Bank of Astoria acquisition closed on October 1, 2004; prior periods are not comparable.
6/30/05
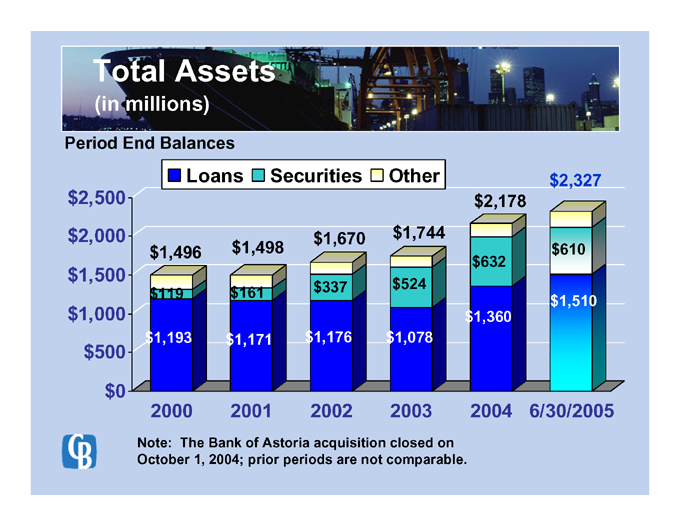
Total Assets
(in millions)
Period End Balances
Other
Securities
Loans
$2,327
$2,178
$2,500
$1,744
$1,670
$2,000
$610
$1,496
$1,498
$632
$1,500
$524
$337
$119
$161
$1,510
$1,360
$1,000
$1,078
$1,193
$1,171
$1,176
$500
$0
2004
2003
2002
2001
2000
6/30/2005
Note: The Bank of Astoria acquisition closed on October 1, 2004; prior periods are not comparable.
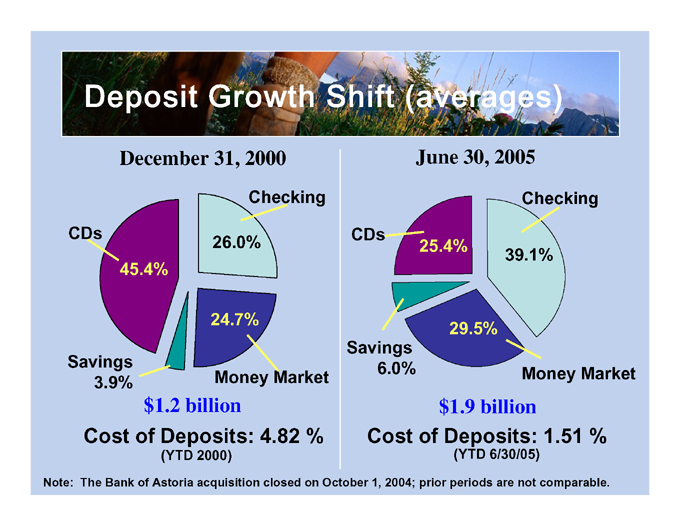
Deposit Growth Shift (averages)
December 31, 2000
June 30, 2005
Checking
Checking
CDs
CDs
25.4%
26.0%
39.1%
45.4%
24.7%
29.5%
Savings
6.0%
Savings
Money Market
Money Market
3.9%
$1.9 billion
$1.2 billion
Cost of Deposits: 4.82 %
Cost of Deposits: 1.51 %
(YTD 2000)
(YTD 6/30/05)
Note: The Bank of Astoria acquisition closed on October 1, 2004; prior periods are not comparable.
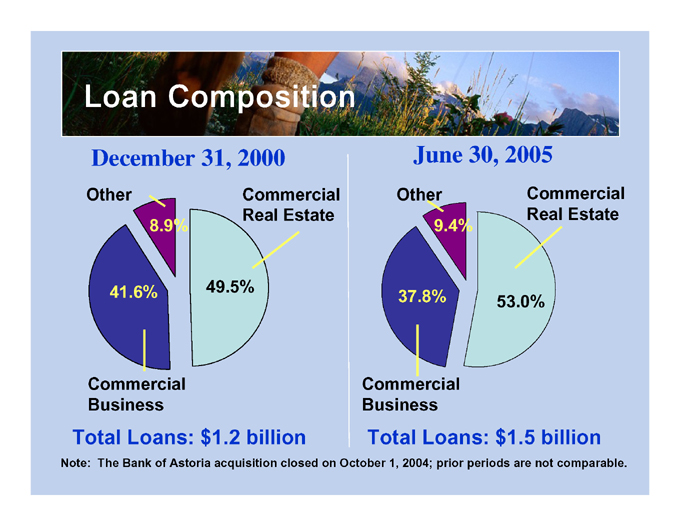
Loan Composition
December 31, 2000
June 30, 2005
Commercial Real Estate
Other
Other
Commercial Real Estate
9.4%
8.9%
41.6%
49.5%
53.0%
37.8%
Commercial Business
Commercial Business
Total Loans: $1.2 billion
Total Loans: $1.5 billion
Note: The Bank of Astoria acquisition closed on October 1, 2004; prior periods are not comparable.
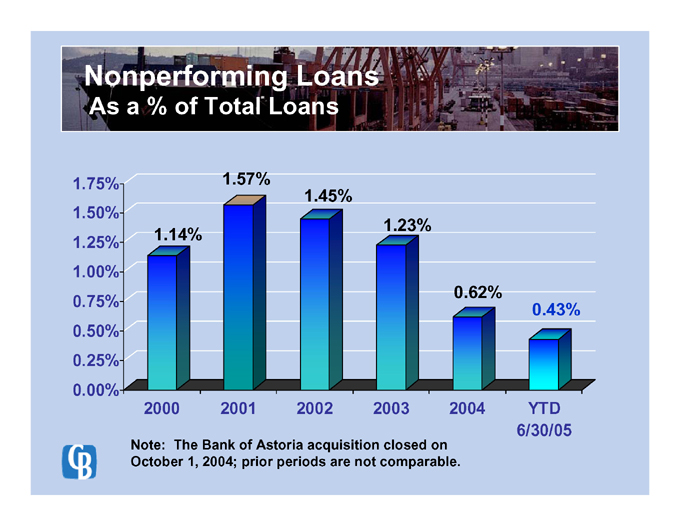
Nonperforming Loans
As a % of Total Loans
1.57%
1.75%
1.45%
1.50%
1.23%
1.14%
1.25%
1.00%
0.62%
0.43%
0.75%
0.50%
0.25%
0.00%
2004
2003
2002
2001
2000
YTD
6/30/05
Note: The Bank of Astoria acquisition closed on October 1, 2004; prior periods are not comparable.
Building on our Strengths
Shareholders are also customers
Broad base of products & services
Decision-making kept as close to the client as possible
Strong branch network
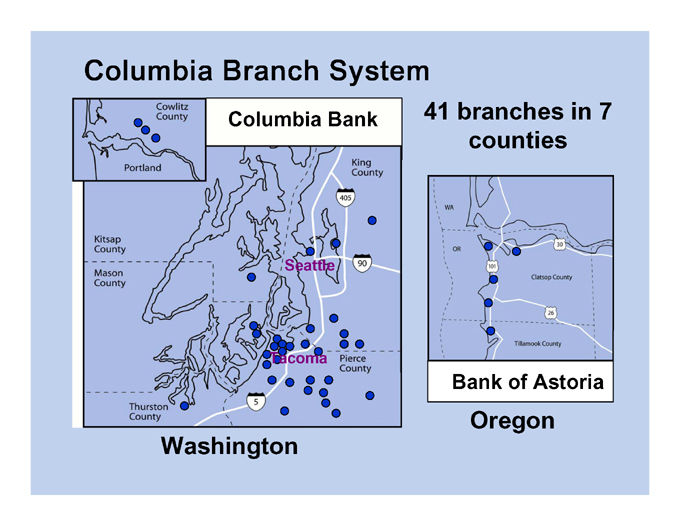
Columbia Branch System
41 branches in 7 counties
Columbia Bank
Seattle
Tacoma
Bank of Astoria
Oregon
Washington
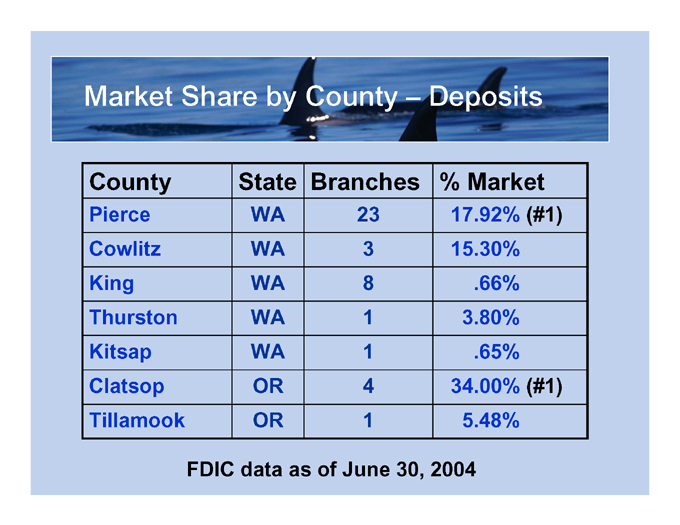
Market Share by County - Deposits
County State Branches % Market
Pierce WA 23 17.92% (#1)
Cowlitz WA 3 15.30%
King WA 8 .66%
Thurston WA 1 3.80%
Kitsap WA 1 .65%
Clatsop OR 4 34.00% (#1)
Tillamook OR 1 5.48%
FDIC data as of June 30, 2004
Building on our Strengths
Commitment to customer service
Strive to be the community bank in all the communities we serve
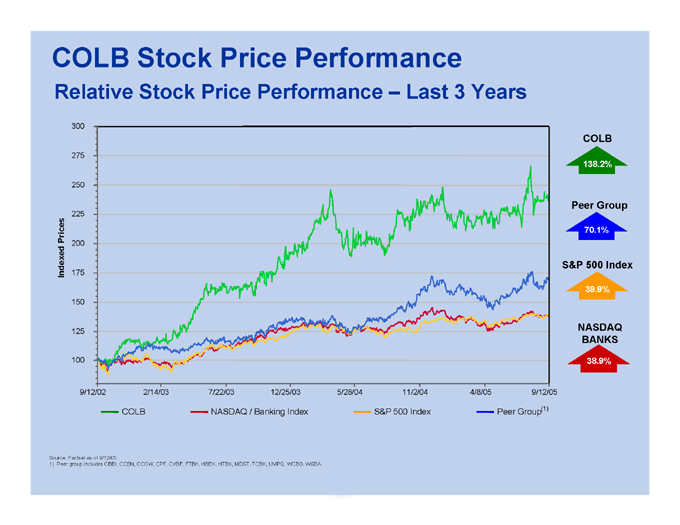
COLB Stock Price Performance
Relative Stock Price Performance - Last 3 Years
300
COLB
275
138.2%
250
Peer Group
225
70.1%
200
Indexed Prices
S&P 500 Index
175
39.9%
150
NASDAQ BANKS
125
100
38.9%
9/12/05
4/8/05
11/2/04
5/28/04
12/25/03
7/22/03
2/14/03
9/12/02
Source: Factset as of 9/12/05.
1) Peer group includes CBBI, CCBN, CCOW, CPF, CVBF, FTBK, HBEK, HTBK, MDST, TCBK, UMPQ, WCBO, WSBA.
Strategic Direction
Build value for our shareholders
Foundation for continued growth in market share by leveraging strong retail branch system
Continue to extend footprint of existing branch network - selective branching in Washington & Oregon
Consider strategic acquisition opportunities
Financial Targets
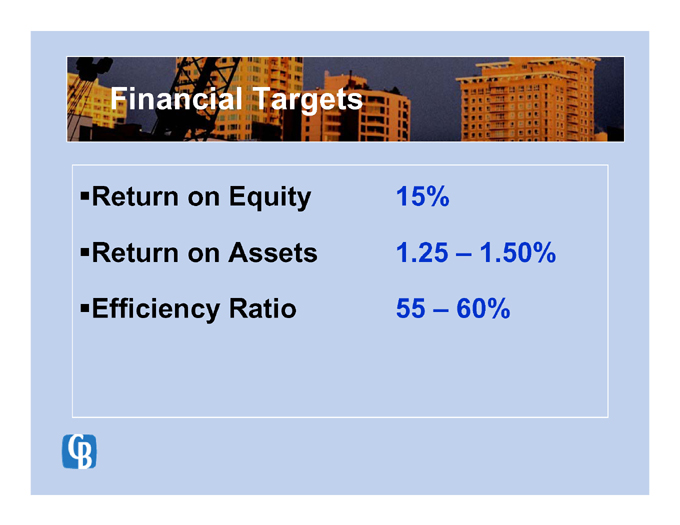
Financial Targets
Return on Equity 15%
Return on Assets 1.25 - 1.50%
Efficiency Ratio 55 - 60%
Melanie J. Dressel
President & Chief Executive Officer
P.O. Box 2156
Tacoma, WA 98401-2156
253-305-1911
mdressel@columbiabank.com
Gary R. Schminkey
EVP & Chief Financial Officer
P.O. Box 2156
Tacoma, WA 98401-2156
253-305-1966
garys@columbiabank.com