|
Exhibit 99.6 
|
Filed by Columbia Banking System, Inc.
pursuant to Rule 425 under the Securities
Act of 1933 and deemed filed pursuant to
Rule 14a-12 under the Securities
Exchange Act of 1934
Subject Company: Intermountain
Community Bancorp
Commission File No.: 001-35775
Acquisition of
Intermountain Community Bancorp/
Panhandle State Bank
Investor Presentation
July 24, 2014
Cautionary Note: Forward Looking Statements
This presentation includes forward-looking statements within the meaning of the Private Securities Litigation Reform Act of 1995. All statements
other than statements of historical fact are forward-looking statements. These forward-looking statements involve known and unknown risks,
uncertainties and other factors which may cause Columbia’s or Intermountain Community Bancorp’s (“Intermountain”) performance or
achievements to be materially different from any expected future results, performance, or achievements.
Forward-looking statements speak only as of the date they are made and neither Columbia nor Intermountain assumes any duty to update forward
looking statements. Such forward-looking statements include, but are not limited to, statements about the benefits of the business combination
transaction involving Columbia and Intermountain, including future financial and operating results, the combined company’s plans, objectives,
expectations and intentions and other statements that are not historical facts. The following factors, among others, could cause actual results to
differ from those set forth in the forward-looking statements: (i) the possibility that the merger does not close when expected or at all because
required regulatory, shareholder or other approvals and other conditions to closing are not received or satisfied on a timely basis or at all; (ii)
changes in Columbia’s stock price before closing, including as a result of the financial performance of Intermountain prior to closing, or more
generally due to broader stock market movements, and the performance of financial companies and peer group companies; (iii) the risk that the
realized or may take longer to benefits from the transaction may not be fully realize than expected, including as a result of changes in general
economic and market conditions, interest and exchange rates, monetary policy, laws and regulations and their enforcement, and the degree of
competition in the geographic and business areas in which Columbia and Intermountain operate; (iv) the ability to promptly and effectively integrate
the businesses of Columbia and Intermountain; (v) the reaction to the transaction of the companies’ customers, employees and counterparties; (vi)
diversion of management time on merger-related issues; (vii) lower than expected revenues, credit quality deterioration or a reduction in real estate
values or a reduction in net earnings; and (viii) other risks that are described in Columbia’s and Intermountain’s public filings with the Securities and
Exchange Commission (the “SEC”). For more information, see the risk factors described in each of Columbia’s and Intermountain’s Annual Reports
on Form 10-K, Quarterly Reports on Form 10-Q and other filings with the SEC.
Annualized, pro forma, projected and estimated numbers and percentages are used for illustrative purposes only, are not forecasts and may not
reflect actual results.
2
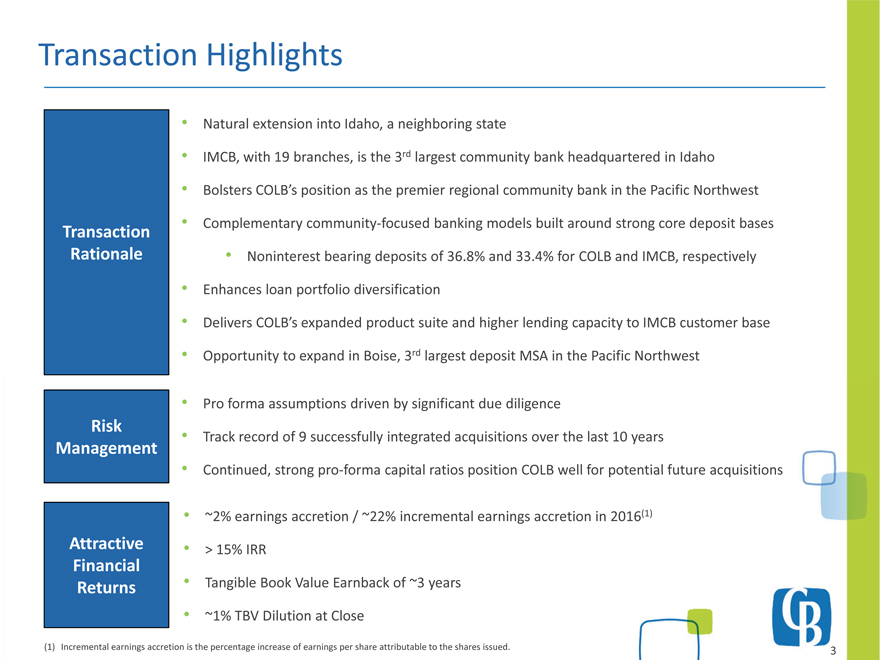
Transaction Highlights
Natural extension into Idaho, a neighboring state
IMCB, with 19 branches, is the 3rd largest community bank headquartered in Idaho
COLB’s Transaction
Rationale
Bolsters COLB s position as the premier regional community bank in the Pacific Northwest
Complementary community-focused banking models built around strong core deposit bases
Noninterest bearing deposits of 36.8% and 33.4% for COLB and IMCB, respectively
Enhances loan portfolio diversification
Delivers COLB’s expanded product suite and higher lending capacity to IMCB customer base
Opportunity to expand in Boise, 3rd largest deposit MSA in the Pacific Northwest
Risk
Management
Pro forma assumptions driven by significant due diligence
Track record of 9 successfully integrated acquisitions over the last 10 years
Continued pro-Attractive
Financial
~2% earnings accretion / ~22% incremental earnings accretion in 2016(1)
> 15% IRR
Continued, strong pro forma capital ratios position COLB well for potential future acquisitions
Returns Tangible Book Value Earnback of ~3 years
~1% TBV Dilution at Close
(1) Incremental earnings accretion is the percentage increase of earnings per share attributable to the shares issued.
3
Transaction Overview
Transaction Value(1) $121.5 million
Price per Share(1) $18.22
Consideration(2)
Pro Forma Ownership
Exchange ratio of 0.6426x + $2.2930 cash per share
86% stock / 14% cash (1)
92.6% COLB / 7.4% IMCB
Board
Management
One current community-based member from IMCB to join COLB
Board of Directors, pro forma board will have 12 members
IMCB CEO joining COLB to assist with integration and Idaho
Due Diligence
Termination Fee
expansion
Completed; including an extensive loan and fixed asset review
$5 5 million Required Approval
Targeted Closing
5.5 for superior offer and other customary events
Customary regulatory and IMCB shareholder approvals
Fourth quarter of 2014
(1) Based on COLB’s closing stock price as of 7/23/2014 and IMCB’s diluted share count of 6.7 million. Transaction value, price per share, and
relative value of consideration mix will change based on the fluctuation in COLB’s stock price. Please see Appendix.
(1) Aggregate consideration mix is 4,233,707 COLB shares issued and $16.5 million of cash including $1.4 million in cash to warrant holders.
4
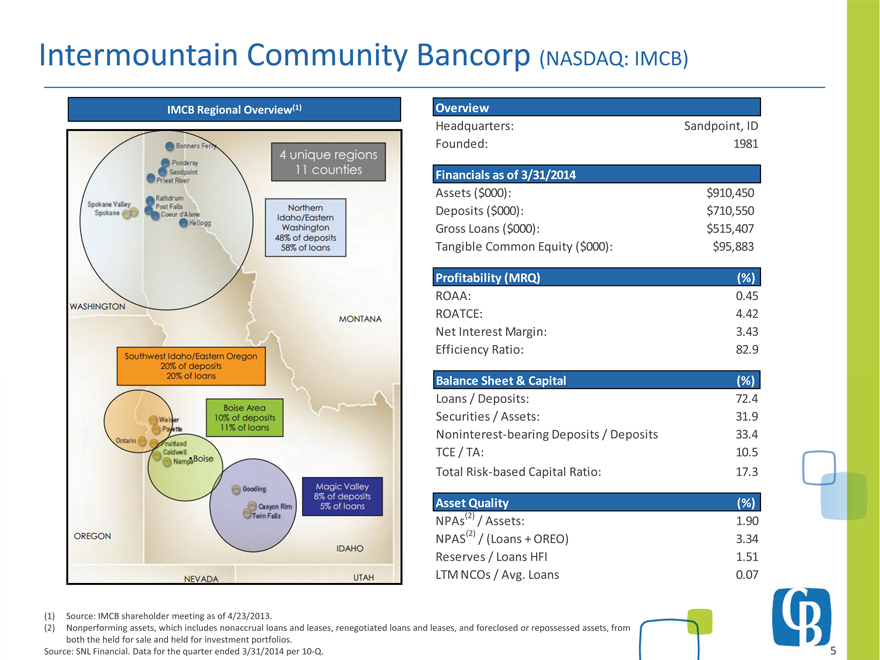
Intermountain Community Bancorp (NASDAQ: IMCB)
Financials as of 3/31/2014
A ($000) $910 450
IMCB Regional Overview(1) Overview
Headquarters: Sandpoint, ID
Founded: 1981
Profitability MRQ) (%)
Assets 000): 910,450
Deposits ($000): $710,550
Gross Loans ($000): $515,407
Tangible Common Equity ($000): $95,883
y ( Q) ( )
ROAA: 0.45
ROATCE: 4.42
Net Interest Margin: 3.43
Efficiency Ratio: 82.9
Balance Sheet & Capital (%)
Loans / Deposits: 72.4
Securities / Assets: 31.9
Noninterest-bearing Deposits / Deposits 33.4
TCE / TA: 10.5
Total 17 3
Asset Quality (%)
NPAs(2) / Assets: 1.90
NPAS(2) / (Loans + OREO) 3.34
Reserves / Loans HFI 1.51
Risk-based Capital Ratio: 17.3
LTM NCOs / Avg. Loans 0.07
(1) Source: IMCB shareholder meeting as of 4/23/2013.
(2) Nonperforming assets, which includes nonaccrual loans and leases, renegotiated loans and leases, and foreclosed or repossessed assets, from
both the held for sale and held for investment portfolios.
Source: SNL Financial. Data for the quarter ended 3/31/2014 per 10-Q.
5
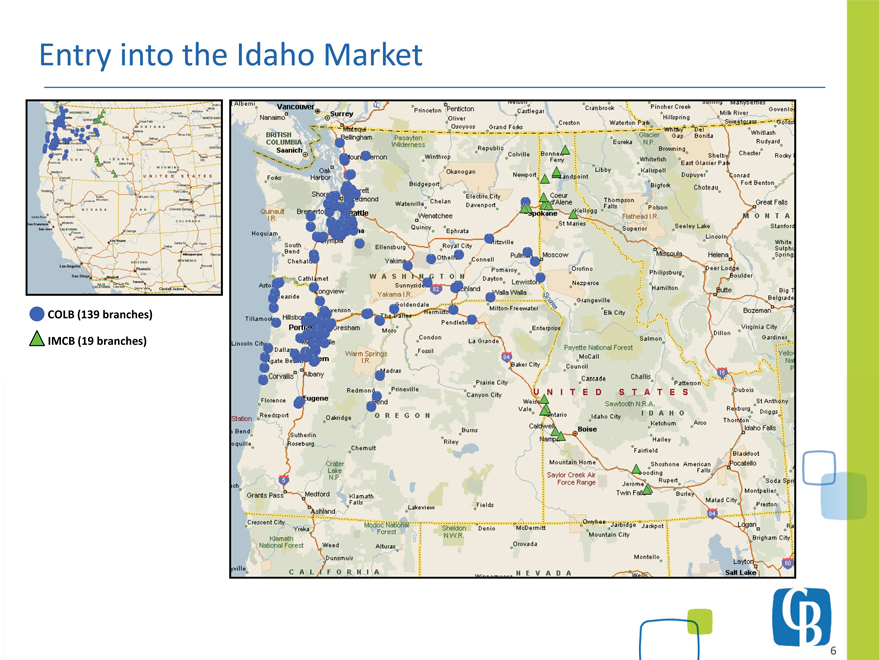
Entry into the Idaho Market
IMCB (19 branches)
6
Idaho Market Overview: Expanding COLB’s Pacific Northwest Presence
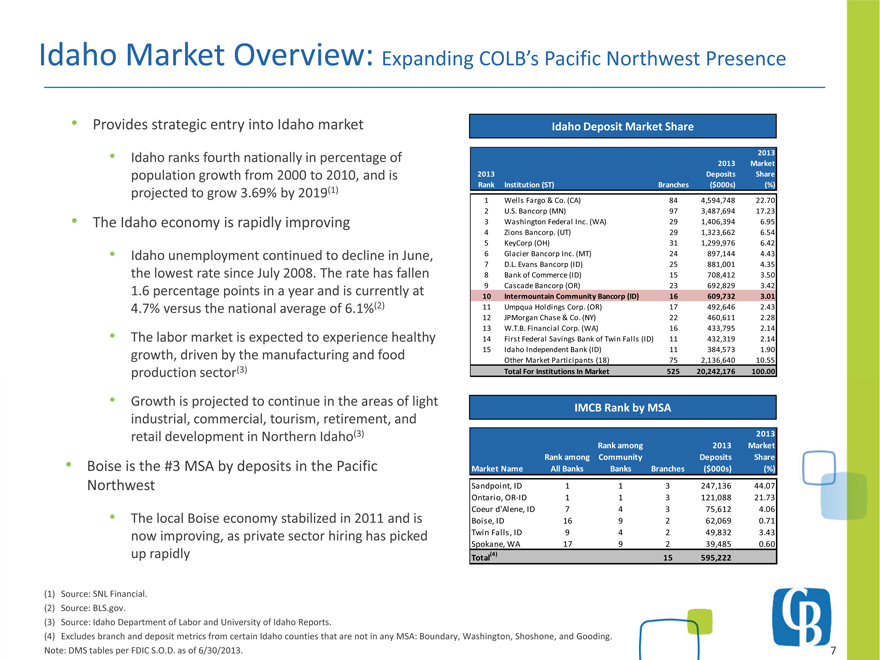
Provides strategic entry into Idaho market
Idaho ranks fourth nationally in percentage of
population growth from 2000 to 2010, and is
j d 3 69% b 2019(1)
2013
Rank Institution ( ST) Branches
2013
Deposits
($000s)
2013
Market
Share
(%)
Idaho Deposit Market Share
projected to grow 3.69% by The Idaho economy is rapidly improving
Idaho unemployment continued to decline in June,
the lowest rate since July 2008. The rate has fallen
) ( ) ( )
1 Wells Fargo & Co. (CA) 84 4,594,748 22.70
2 U.S. Bancorp (MN) 97 3,487,694 17.23
3 Washington Federal Inc. (WA) 29 1,406,394 6.95
4 Zions Bancorp. (UT) 29 1,323,662 6.54
5 KeyCorp (OH) 31 1,299,976 6.42
6 Glacier Bancorp Inc. (MT) 24 897,144 4.43
7 D.L. Evans Bancorp (ID) 25 881,001 4.35
8 Bank of Commerce (ID) 15 708,412 3.50
1.6 percentage points in a year and is currently at 9 C d B 23 692 829 3 42
4.7% versus the national average of 6.1%(2)
The labor market is expected to experience healthy
growth, driven by the manufacturing and food
production sector(3)
Cascade Bancorp (OR) 692,829 3.42
10 Intermountain Community Bancorp (ID) 16 609,732 3.01
11 Umpqua Holdings Corp. (OR) 17 492,646 2.43
12 JPMorgan Chase & Co. (NY) 22 460,611 2.28
13 W.T.B. Financial Corp. (WA) 16 433,795 2.14
14 First Federal Savings Bank of Twin Falls (ID) 11 432,319 2.14
15 Idaho Independent Bank (ID) 11 384,573 1.90
Other Market Participants (18) 75 2,136,640 10.55
Total For Institutions In Market 525 20,242,176 100.00
Market Name
Rank among
All Banks
Rank among
Community
Banks Branches
2013
Deposits
($ 000s)
2013
Market
Share
(%)
p
Growth is projected to continue in the areas of light
industrial, commercial, tourism, retirement, and
retail development in Northern Idaho(3)
Boise is the #3 MSA by deposits in the Pacific
IMCB Rank by MSA
) ( )
Sandpoint, ID 1 1 3 247,136 44.07
Ontario, OR-ID 1 1 3 121,088 21.73
Coeur d’Alene, ID 7 4 3 75,612 4.06
Boise, ID 16 9 2 62,069 0.71
Twin Falls, ID 9 4 2 49,832 3.43
Spokane, WA 17 9 2 39,485 0.60
Total(4) 15 595,222
y p
Northwest
The local Boise economy stabilized in 2011 and is
now improving, as private sector hiring has picked
up rapidly
(1) Source: SNL Financial.
(2) Source: BLS.gov.
(3) Source: Idaho Department of Labor and University of Idaho Reports.
(4) Excludes branch and deposit metrics from certain Idaho counties that are not in any MSA: Boundary, Washington, Shoshone, and Gooding.
Note: DMS tables per FDIC S.O.D. as of 6/30/2013.
7
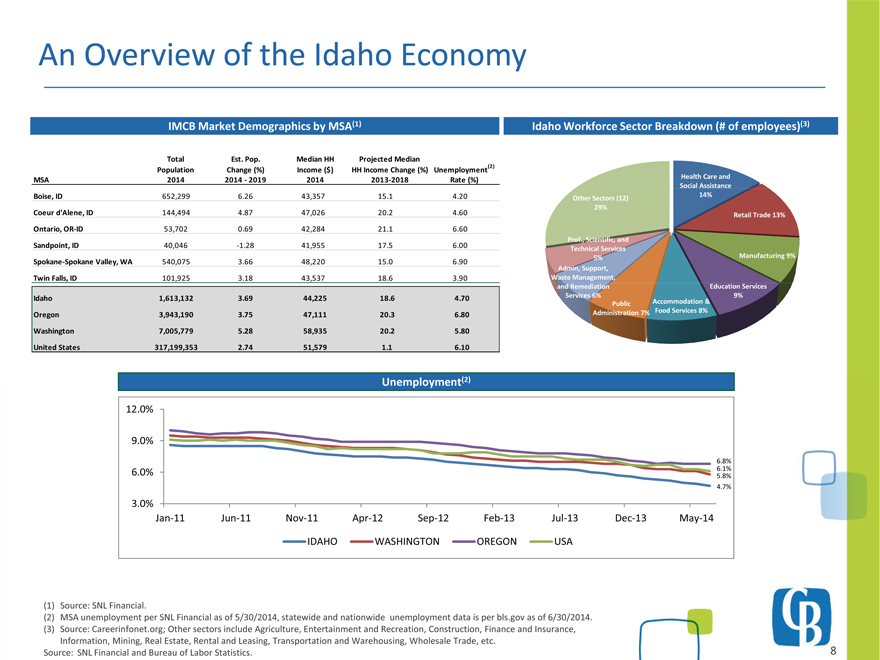
An Overview of the Idaho Economy
Health Care and
Social Assistance
IMCB Market Demographics by MSA(1) Idaho Workforce Sector Breakdown (# of employees)(3)
Total Est. Pop. Median HH Projected Median
Population Change (%) Income ($) HH Income Change (%) Unemployment(2)
MSA 2014 2014 - 2019 2014 2013-2018 Rate (%)
14%
Retail Trade 13%
Manufacturing 9%
Admin, Support,
Waste Management,
Prof., Scientific, and
Technical Services
5%
Other Sectors (12)
29%
Boise, ID 652,299 6.26 43,357 15.1 4.20
Coeur d’Alene, ID 144,494 4.87 47,026 20.2 4.60
Ontario, OR-ID 53,702 0.69 42,284 21.1 6.60
Sandpoint, ID 40,046 -1.28 41,955 17.5 6.00
Spokane-Spokane Valley, WA 540,075 3.66 48,220 15.0 6.90
Twin Falls, ID 101,925 3.18 43,537 18.6 3.90
Education Services
9%
Accommodation &
Food Services 8%
Public
Administration 7%
and Remediation
Services 6%
l (2)
Idaho 1,613,132 3.69 44,225 18.6 4.70
Oregon 3,943,190 3.75 47,111 20.3 6.80
Washington 7,005,779 5.28 58,935 20.2 5.80
United States 317,199,353 2.74 51,579 1.1 6.10
6 0%
9.0%
12.0%
6.8%
Unemployment(6.1%
3.0%
6.0%
Jan-11 Jun-11 Nov-11 Apr-12 Sep-12 Feb-13 Jul-13 Dec-13 May-14
IDAHO WASHINGTON OREGON USA
5.8%
4.7%
(1) Source: SNL Financial.
(2) MSA unemployment per SNL Financial as of 5/30/2014, statewide and nationwide unemployment data is per bls.gov as of 6/30/2014.
(3) Source: Careerinfonet.org; Other sectors include Agriculture, Entertainment and Recreation, Construction, Finance and Insurance,
Information, Mining, Real Estate, Rental and Leasing, Transportation and Warehousing, Wholesale Trade, etc.
Source: SNL Financial and Bureau of Labor Statistics.
8
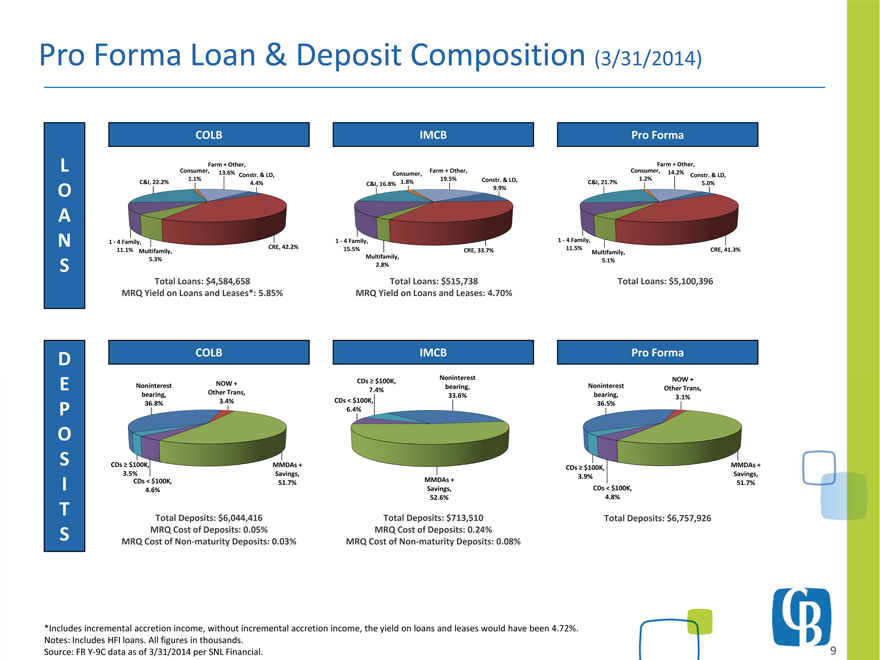
Pro Forma Loan & Deposit Composition (3/31/2014)
Constr. & LD,
C&I, 21.7% 5.0%
Consumer,
1.2%
Farm + Other,
14.2%
Constr. & LD,
C&I, 16.8% 9 9%
Consumer,
1.8%
Farm + Other,
Constr. & LD, 19.5%
C&I, 22.2% 4.4%
Consumer,
1.1%
Farm + Other,
13.6% LO
COLB IMCB Pro Forma
Multifamily, CRE, 41.3%
5.1%
1 - 4 Family,
11.5%
9.9%
CRE, 33.7%
Multifamily,
2.8%
1 - 4 Family,
CRE, 42.2% 15.5%
Multifamily,
5.3%
1 - 4 Family,
11.1%
OANS
4,584,658
515,738
5,100,396
Noninterest
NOW
DE
Total Loans: $MRQ Yield on Loans and Leases*: 5.85%
Total Loans: $MRQ Yield on Loans and Leases: 4.70%
COLB IMCB Pro Forma
Total Loans: $Noninterest
bearing,
36.5%
+
Other Trans,
3.1%
MMDAs +
S i
CDs = $100K,
bearing,
33.6%
CDs < $100K,
6.4%
CDs = $100K,
Noninterest 7.4%
bearing,
36.8%
NOW +
Other Trans,
3.4%
MMDAs +
S i
CDs = $100K,
3 5%
EPOS
Savings,
51.7%
CDs < $100K,
4.8%
MMDAs + 3.9%
Savings,
52.6%
Savings,
CDs < $100K, 51.7%
4.6%
3.5% ITS
Total Deposits: $6,044,416
MRQ Cost of Deposits: 0.05%
MRQ Cost of Non-maturity Deposits: 0.03%
Total Deposits: $713,510
MRQ Cost of Deposits: 0.24%
MRQ Cost of Non-maturity Deposits: 0.08%
Total Deposits: $6,757,926
*Includes incremental accretion income, without incremental accretion income, the yield on loans and leases would have been 4.72%.
Notes: Includes HFI loans. All figures in thousands.
Source: FR Y-9C data as of 3/31/2014 per SNL Financial.
9
Pro Forma Financial Impact
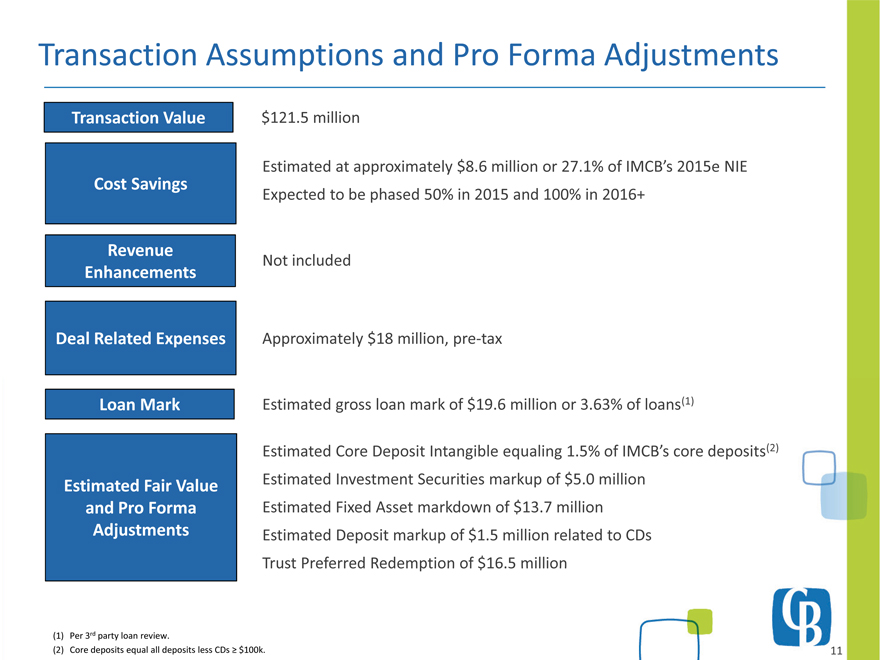
Transaction Assumptions and Pro Forma Adjustments
Cost Savings
Estimated at approximately $8.6 million or 27.1% of IMCB’s 2015e NIE
d b h d d
Transaction Value $121.5 million
Revenue
Enhancements
Not included
Expected to be phased 50% in 2015 and 100% in 2016+
Deal Related Expenses Approximately $18 million, pre-tax
Estimated Core Deposit Intangible equaling 1.5% of IMCB’s core deposits(2)
$
Loan Mark Estimated gross loan mark of $19.6 million or 3.63% of loans(1)
Estimated Investment Securities markup of 5.0 million
Estimated Fixed Asset markdown of $13.7 million
Estimated Deposit markup of $1.5 million related to CDs
Redemption of $million
Estimated Fair Value
and Pro Forma
Adjustments
(1) Per 3rd party loan review.
(2) Core deposits equal all deposits less CDs = $100k. 11
Preferred 16.5
11
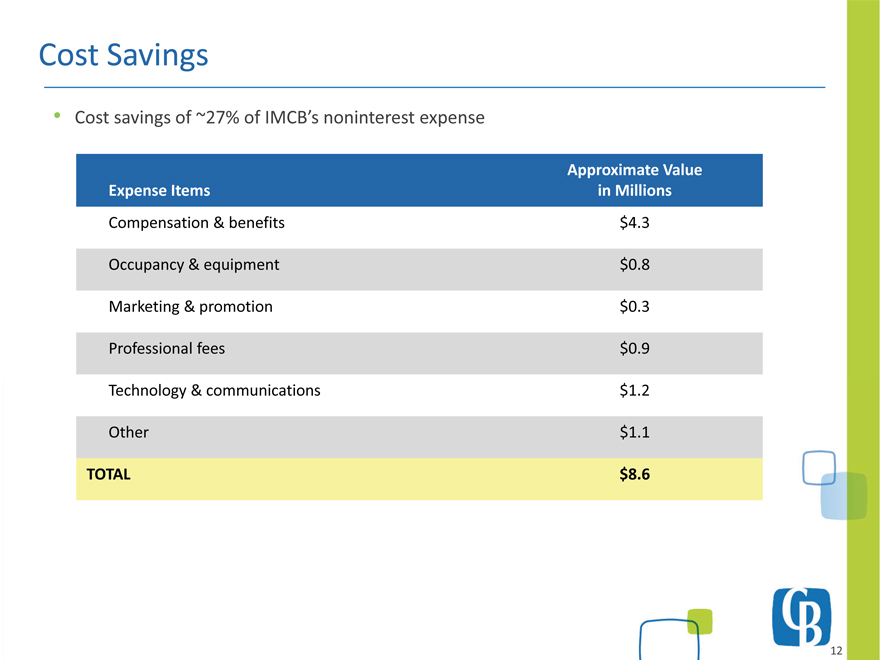
Cost Savings
Cost savings of ~27% of IMCB’s noninterest expense
Expense Items
Approximate Value
in Millions
Compensation & benefits $4.3
Occupancy & equipment $0.8
Marketing & promotion $0.3
Professional fees $0.9
Technology & communications $1.2
Other $1.1
TOTAL $8.6
12
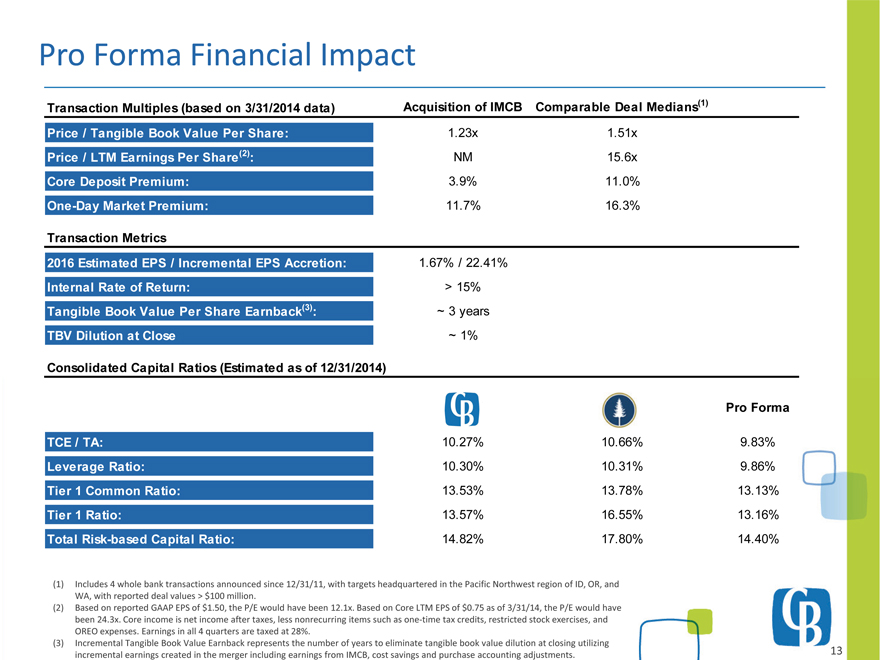
Pro Forma Financial Impact
Transaction Multiples (based on 3/31/2014 data) Acquisition of IMCB Comparable Deal Medians(1)
Price / Tangible Book Value Per Share: 1.23x 1.51x
Price / LTM Earnings Per Share(2): NM 15.6x
Core Deposit Premium: 3.9% 11.0%
One-Day Market Premium: 11.7% 16.3%
Transaction Metrics
2016 Estimated EPS / Incremental EPS Accretion: 1.67% / 22.41%
Internal Rate of Return: > 15%
Tangible Book Value Per Share Earnback(3): ~ 3 years
TBV Dilution at Close ~ 1%
Consolidated Capital Ratios (Estimated as of 12/31/2014)
Pro Forma
TCE / TA: 10.27% 10.66% 9.83%
Leverage Ratio: 10.30% 10.31% 9.86%
Tier 1 Common Ratio: 13.53% 13.78% 13.13%
Tier 1 Ratio: 13.57% 16.55% 13.16%
Total Risk-based Capital Ratio: 14.82% 17.80% 14.40%
(1) Includes 4 whole bank transactions announced since 12/31/11, with targets headquartered in the Pacific Northwest region of ID, OR, and
WA, with reported deal values > $100 million.
(2) Based on reported GAAP EPS of $1.50, the P/E would have been 12.1x. Based on Core LTM EPS of $0.75 as of 3/31/14, the P/E would have
been 24.3x. Core income is net income after taxes, less nonrecurring items such as one-time tax credits, restricted stock exercises, and
OREO expenses. Earnings in all 4 quarters are taxed at 28%.
(3) Incremental Tangible Book Value Earnback represents the number of years to eliminate tangible book value dilution at closing utilizing
incremental earnings created in the merger including earnings from IMCB, cost savings and purchase accounting adjustments.
13
Attractive Investment Opportunity
Acquisition is in line with COLB’s strategic plan, and meets COLB’s investment criteria
Entry into Idaho provides COLB a solid foothold in a contiguous state with strong growth potential
Culturally compatible banks with similar core deposit bases and commercial banking orientation
Increased size and scale favorably positions COLB for further acquisitions and growth strategies
Pacific Northwest considered a “region to watch” for brightest economic future(1)
Transaction should enhance COLB’s long-term shareholder value
(1) Source: “The U.S. Economy: Regions To Watch in 2012” per www.forbes.com, published on 1/4/2012.
14
Appendix: Merger Consideration
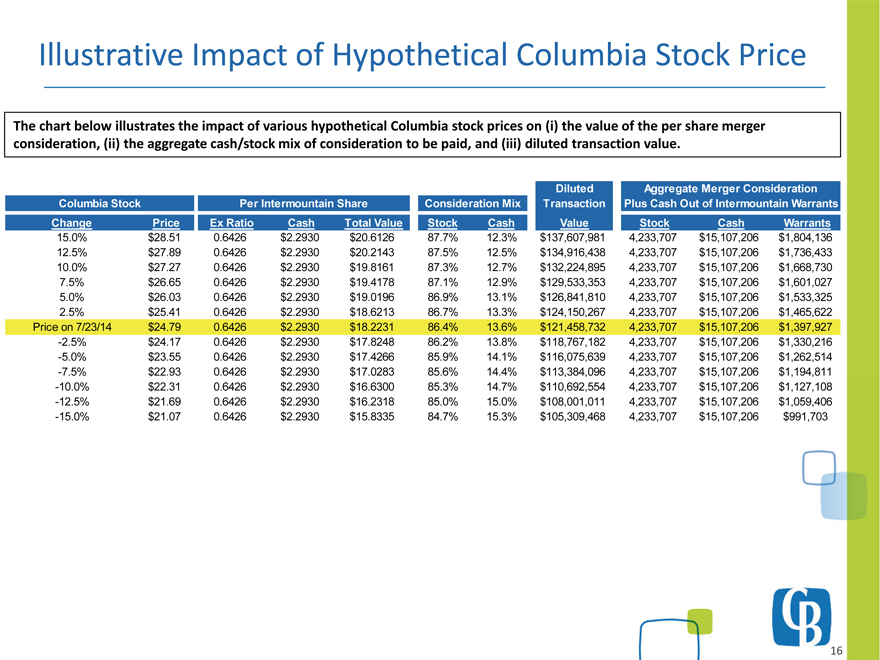
Illustrative Impact of Hypothetical Columbia Stock Price
The chart below illustrates the impact of various hypothetical Columbia stock prices on (i) the value of the per share merger consideration, (ii) the aggregate cash/stock mix of consideration to be paid, and (iii) diluted transaction value.
Diluted Aggregate Merger Consideration
Columbia Stock Per Intermountain Share Consideration Mix Transaction Plus Cash Out of Intermountain Warrants
Change Price Ex Ratio Cash Total Value Stock Cash Value Stock Cash Warrants
15.0% $28.51 0.6426 $2.2930 $ 20.6126 87.7% 12.3% $137,607,981 4,233,707 $15,107,206 $1,804,136
12.5% $27.89 0.6426 $2.2930 $ 20.2143 87.5% 12.5% $134,916,438 4,233,707 $15,107,206 $1,736,433
10.0% $27.27 0.6426 $2.2930 $ 19.8161 87.3% 12.7% $132,224,895 4,233,707 $15,107,206 $1,668,730
75%. $26.65 0.6426 $2.2930 $ 19.4178 87.1% 12.9% $129,533,353 4233, ,707 $15,107,206 $1,601,027
5.0% $26.03 0.6426 $2.2930 $ 19.0196 86.9% 13.1% $126,841,810 4,233,707 $15,107,206 $1,533,325
2.5% $25.41 0.6426 $2.2930 $ 18.6213 86.7% 13.3% $124,150,267 4,233,707 $15,107,206 $1,465,622
Price on 7/23/14 $24.79 0.6426 $2.2930 $ 18.2231 86.4% 13.6% $121,458,732 4,233,707 $15,107,206 $1,397,927
-2.5% $24.17 0.6426 $2.2930 $ 17.8248 86.2% 13.8% $118,767,182 4,233,707 $15,107,206 $1,330,216
-5.0% $23.55 0.6426 $2.2930 $ 17.4266 85.9% 14.1% $116,075,639 4,233,707 $15,107,206 $1,262,514
-7.5% $22.93 0.6426 $2.2930 $ 17.0283 85.6% 14.4% $113,384,096 4,233,707 $15,107,206 $1,194,811
-10.0% $22.31 0.6426 $2.2930 $ 16.6300 85.3% 14.7% $110,692,554 4,233,707 $15,107,206 $1,127,108
-12.5% $21.69 0.6426 $2.2930 $ 16.2318 85.0% 15.0% $108,001,011 4,233,707 $15,107,206 $1,059,406
-15.0% $21.07 0.6426 $2.2930 $ 15.8335 84.7% 15.3% $105,309,468 4,233,707 $15,107,206 $991,703
16
Appendix II:
Summary of 2nd Quarter Performance
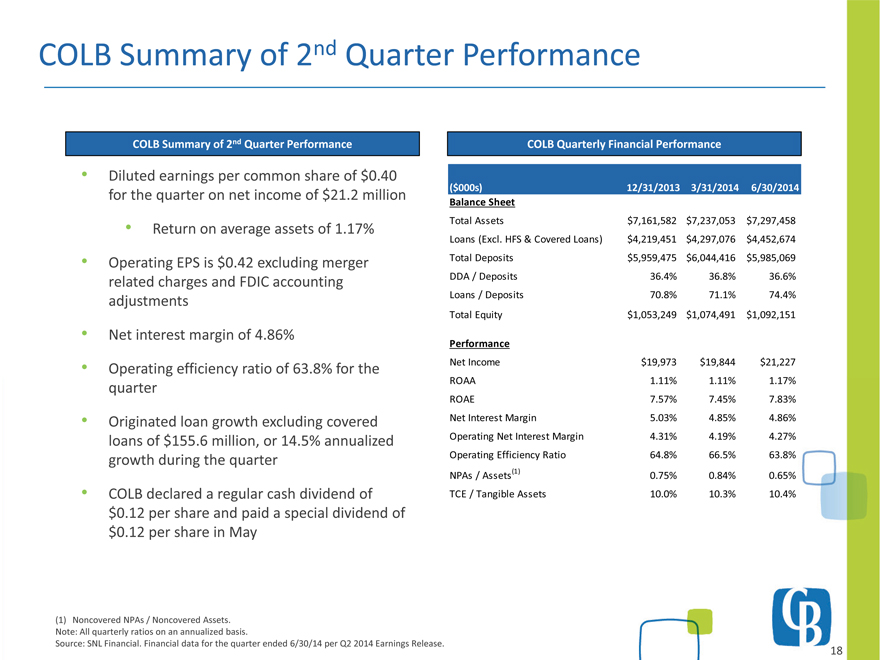
COLB Summary of 2nd Quarter Performance
COLB Summary of 2nd Quarter Performance
Diluted earnings per common share of $0.40 for the quarter on net income of $21.2 million
Return on average assets of 1.17%
Operating EPS is $0.42 excluding merger related charges and FDIC accounting adjustments
Net interest margin of 4.86%
Operating efficiency ratio of 63.8% for the quarter
Originated loan growth excluding covered loans of $155.6 million, or 14.5% annualized growth during the quarter
COLB declared a regular cash dividend of $0.12 per share and paid a special dividend of $0.12 per share in May
COLB Quarterly Financial Performance
($000s) 12/31/2013 3/31/2014 6/30/2014
Balance Sheet
Total Assets $7,161,582 $7,237,053 $7,297,458
Loans (Excl. HFS & Covered Loans) $4,219,451 $4,297,076 $4,452,674
Total Deposits $5,959,475 $6,044,416 $5,985,069
DDA / Deposits 36.4% 36.8% 36.6%
Loans / Deposits 70.8% 71.1% 74.4%
Total Equity $1,053,249 $1,074,491 $1,092,151
Performance
Net Income $19,973 $19,844 $21,227
ROAA 1.11% 1.11% 1.17%
ROAE 7.57% 7.45% 7.83%
Net Interest Margin 5.03% 4.85% 4.86%
Operating Net Interest Margin 4.31% 4.19% 4.27%
Operating Efficiency Ratio 64.8% 66.5% 63.8%
NPAs / Assets(1) 0.75% 0.84% 0.65%
TCE / Tangible Assets 10.0% 10.3% 10.4%
(1) Noncovered NPAs / Noncovered Assets. Note: All quarterly ratios on an annualized basis.
Source: SNL Financial. Financial data for the quarter ended 6/30/14 per Q2 2014 Earnings Release.
1
18
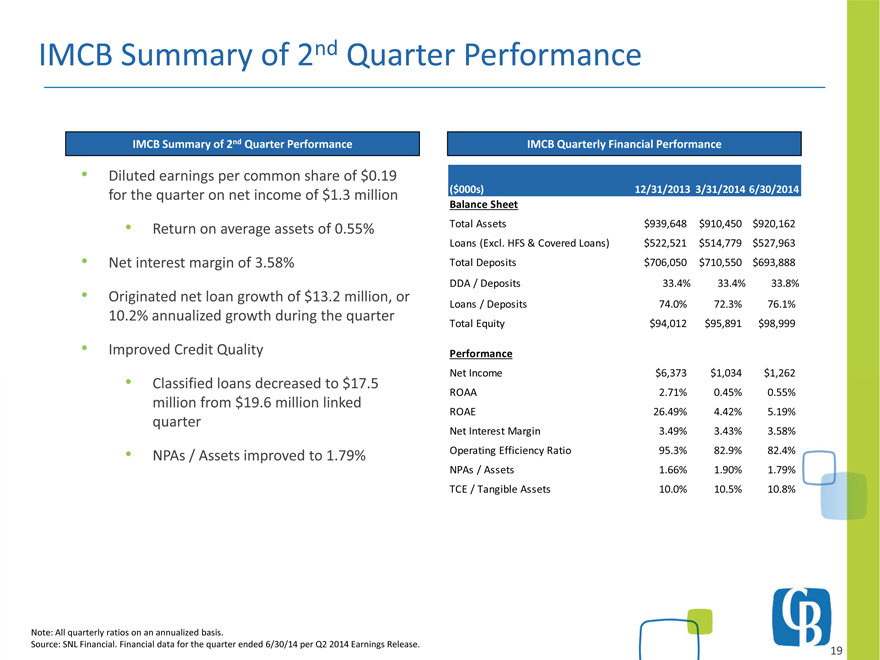
IMCB Summary of 2nd Quarter Performance
IMCB Summary of 2nd Quarter Performance
Diluted earnings per common share of $0.19 for the quarter on net income of $1.3 million
Return on average assets of 0.55%
Net interest margin of 3.58%
Originated net loan growth of $13.2 million, or 10.2% annualized growth during the quarter
Improved Credit Quality
Classified loans decreased to $17.5 million from $19.6 million linked quarter
NPAs / Assets improved to 1.79%
IMCB Quarterly Financial Performance
($000s) 12/31/2013 3/31/2014 6/30/2014
Balance Sheet
Total Assets $939,648 $910,450 $920,162
Loans (Excl. HFS & Covered Loans) $522,521 $514,779 $527,963
Total Deposits $706,050 $710,550 $693,888
Loans / Deposits 74.0% 72.3% 76.1%
Total Equity $94,012 $95,891 $98,999
Performance
Net Income $6,373 $1,034 $1,262
ROAA 2.71% 0.45% 0.55%
ROAE 26.49% 4.42% 5.19%
Net Interest Margin 3.49% 3.43% 3.58%
Operating Efficiency Ratio 95.3% 82.9% 82.4%
NPAs / Assets 1.66% 1.90% 1.79%
TCE / Tangible Assets 10.0% 10.5% 10.8%
Note: All quarterly ratios on an annualized basis.
Source: SNL Financial. Financial data for the quarter ended 6/30/14 per Q2 2014 Earnings Release.
19
Additional Information
In connection with the proposed transaction, Columbia will file with the SEC a Registration Statement on Form S-4 that will include a Proxy
Statement of Intermountain and a Prospectus of Columbia, as well as other relevant documents concerning the proposed transaction. Shareholders of Columbia and Intermountain are urged to read the Registration Statement and the Proxy Statement/Prospectus regarding the transaction when it becomes available and any other relevant documents filed with the SEC, as well as any amendments or supplements to those documents, because they will contain important information. The Proxy Statement/Prospectus and other relevant materials (when they become available) filed with the SEC may be obtained free of charge at the SEC’s Website at http://www.sec.gov. Intermountain shareholders are urged to read the Proxy Statement and the other relevant materials before voting on the transaction.
Investors will also be able to obtain these documents, free of charge, from Intermountain by accessing Intermountain’s website at www.intermountainbank.com under the link to “About Us” and then the link to “Investor Relations” or from Columbia at www.columbiabank.com under the tab “About Us” and then under the heading “Investor Relations.” Copies can also be obtained, free of charge, by directing a written request to Columbia Banking System, Inc., Attention: Corporate Secretary, 1301 A Street, Suite 800, Tacoma, Washington 98401-2156 or to Intermountain Community Bancorp, 414 Church Street, P.O. Box 967, Sandpoint, Idaho 83864.
Intermountain and Columbia and certain of their directors and executive officers and certain other persons may be deemed to be participants in the solicitation of proxies from the shareholders of Intermountain in connection with the merger. Information about the directors and executive officers of Intermountain and their ownership of Intermountain common stock is set forth in the proxy statement for Intermountain’s 2014 annual meeting of shareholders, as filed with the SEC on a Schedule 14A on March 12, 2014. Additional information regarding the interests of those participants and other persons who may be deemed participants in the transaction may be obtained by reading the Proxy Statement/Prospectus regarding the merger when it becomes available. Free copies of this document may be obtained as described in the preceding paragraph.
20
Melanie J. Dressel Curt Hecker
President & Chief Executive Officer President & Chief Executive Officer 253-305-1911; mdressel@columbiabank.com 208-265-3300; curt.hecker@intermountainbank.com
Clint E. Stein
EVP & Chief Financial Officer
253-593-8304; cstein@columbiabank.com