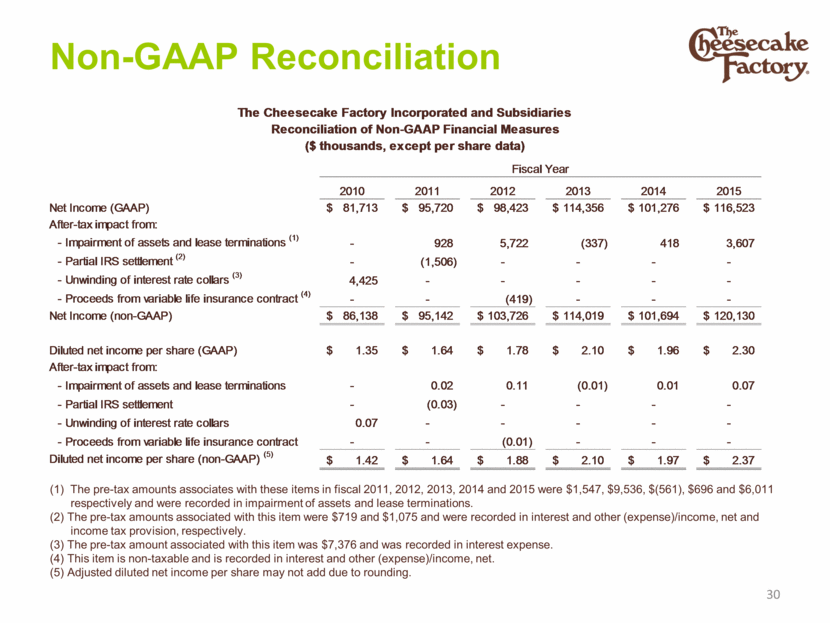
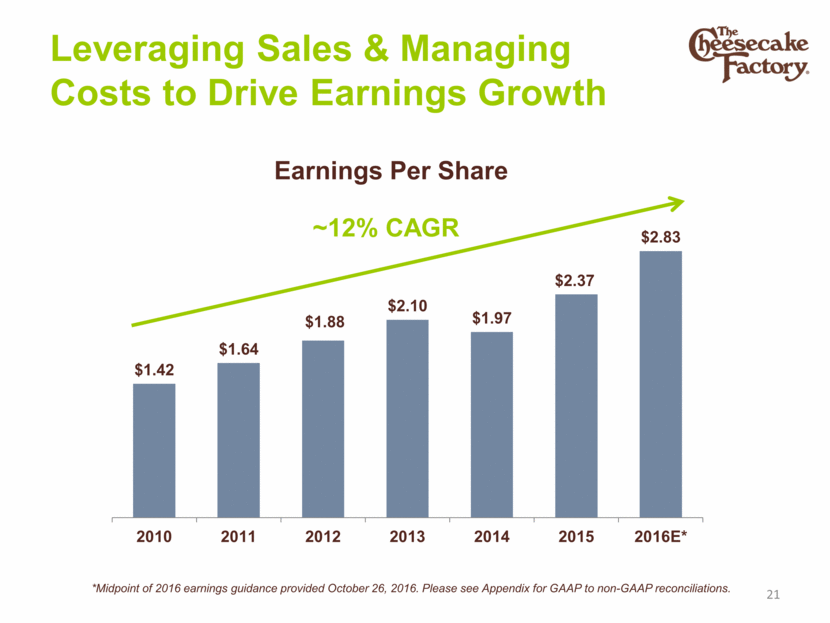
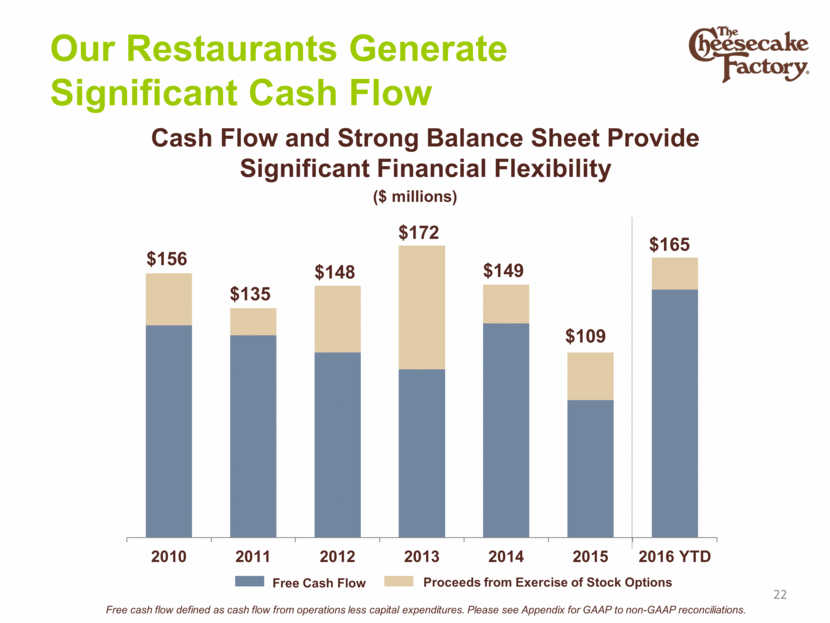
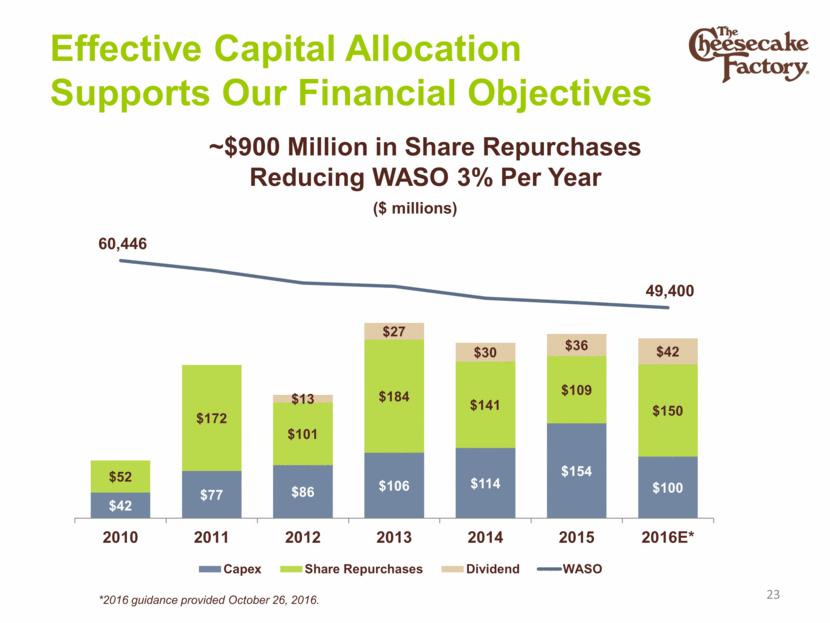
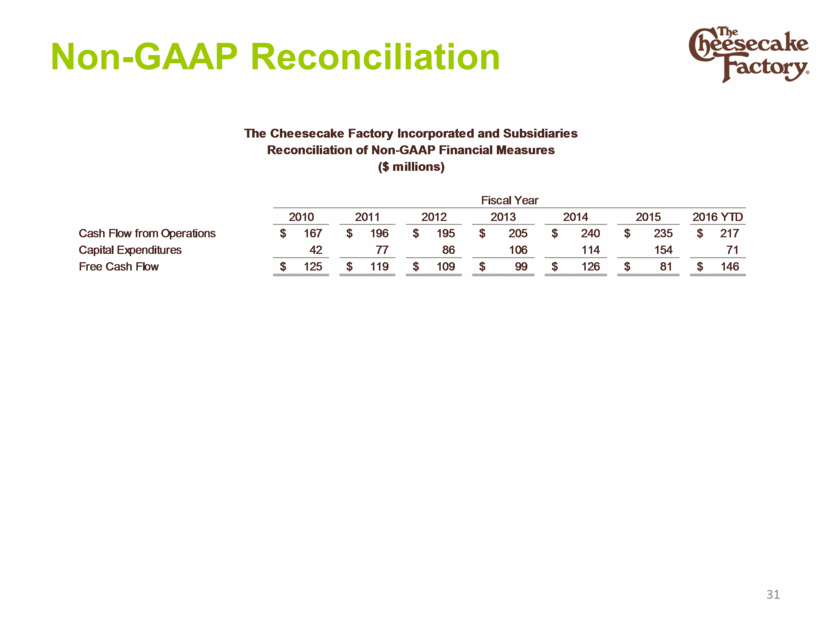
Non-GAAP Reconciliation 30 (1) The pre-tax amounts associates with these items in fiscal 2011, 2012, 2013, 2014 and 2015 were $1,547, $9,536, $(561), $696 and $6,011 respectively and were recorded in impairment of assets and lease terminations. (2) The pre-tax amounts associated with this item were $719 and $1,075 and were recorded in interest and other (expense)/income, net and income tax provision, respectively. (3) The pre-tax amount associated with this item was $7,376 and was recorded in interest expense. (4) This item is non-taxable and is recorded in interest and other (expense)/income, net. (5) Adjusted diluted net income per share may not add due to rounding. The Cheesecake Factory Incorporated and Subsidiaries Reconciliation of Non-GAAP Financial Measures ($ thousands, except per share data) Fiscal Year 2010 2011 2012 2013 2014 2015 2016(6) Net Income (GAAP) $ 81,713 $ 95,720 $ 98,423 $ 114,356 $ 101,276 $ 116,523 After-tax impact from: - Impairment of assets and lease terminations (1) - 928 5,722 (337) 418 3,607 - - Partial IRS settlement (2) - (1,506) - - - - - - Unwinding of interest rate collars (3) 4,425 - - - - - - - Proceeds from variable life insurance contract (4) - - (419) - - - - Net Income (non-GAAP) $ 86,138 $ 95,142 $ 103,726 $ 114,019 $ 101,694 $ 120,130 Diluted net income per share (GAAP) $ 1.35 $ 1.64 $ 1.78 $ 2.10 $ 1.96 $ 2.30 After-tax impact from: - Impairment of assets and lease terminations - 0.02 0.11 (0.01) 0.01 0.07 - - Partial IRS settlement - (0.03) - - - - - - Unwinding of interest rate collars 0.07 - - - - - - - Proceeds from variable life insurance contract - - (0.01) - - - - Diluted net income per share (non-GAAP) (5) $ 1.42 $ 1.64 $ 1.88 $ 2.10 $ 1.97 $ 2.37 (in millions) 2010 2011 2012 2013 2014 2015 Cash Flow from Operations $ 165 $ 196 $ 195 $ 205 $ 240 $ 235 Capital Expenditures 42 77 86 106 114 154 Free Cash Flow $ 123 $ 119 $ 109 $ 99 $ 126 $ 81