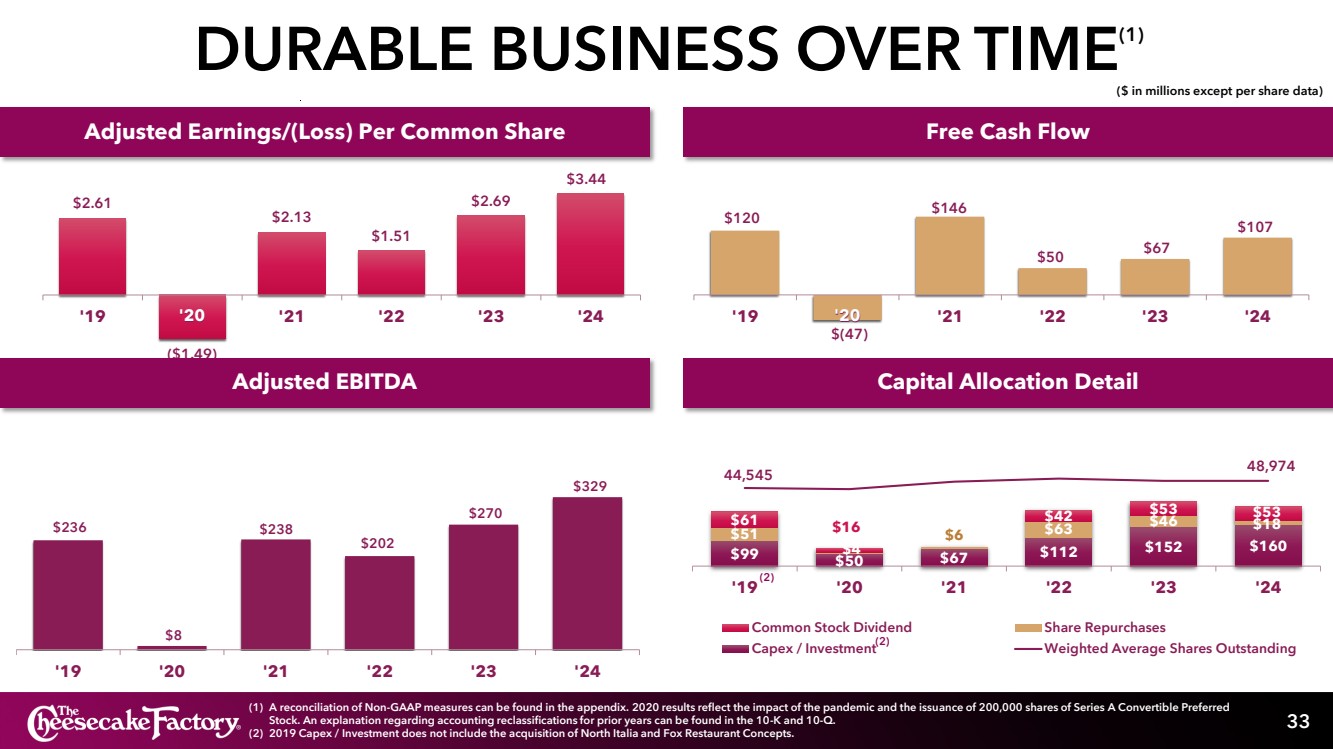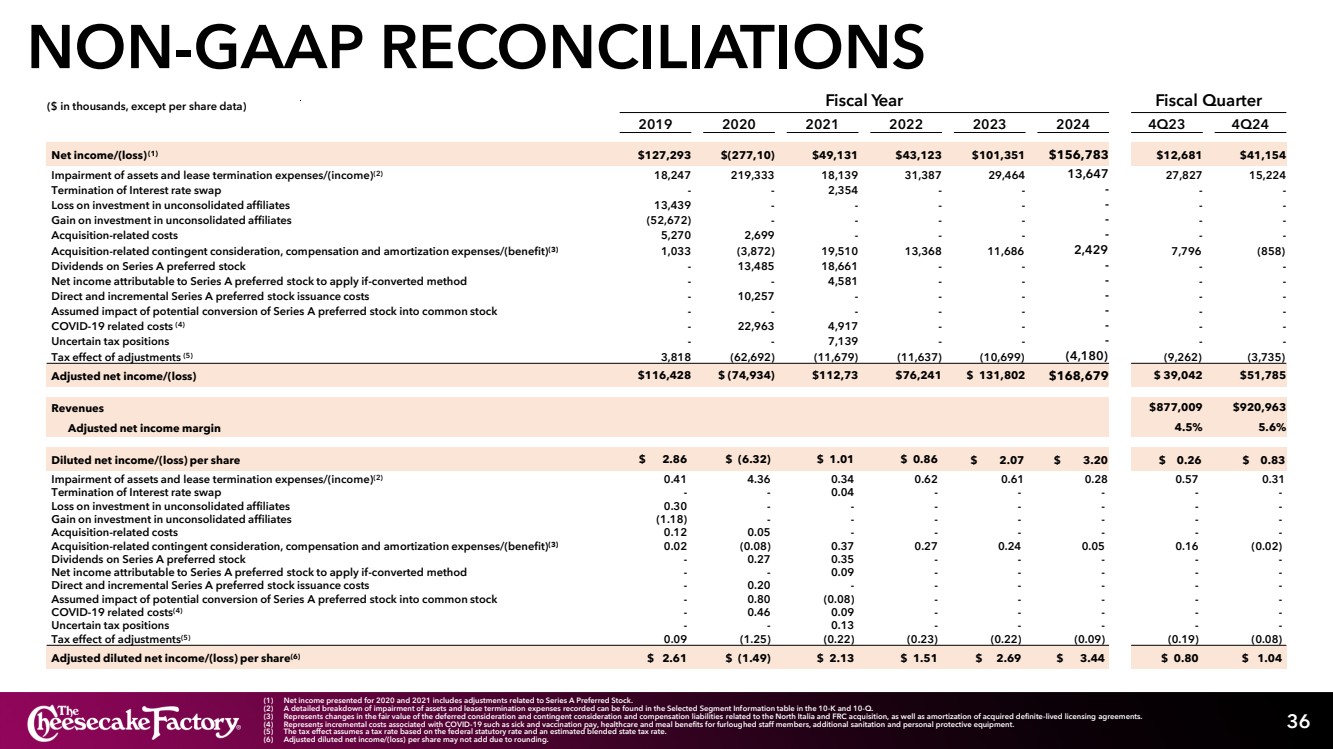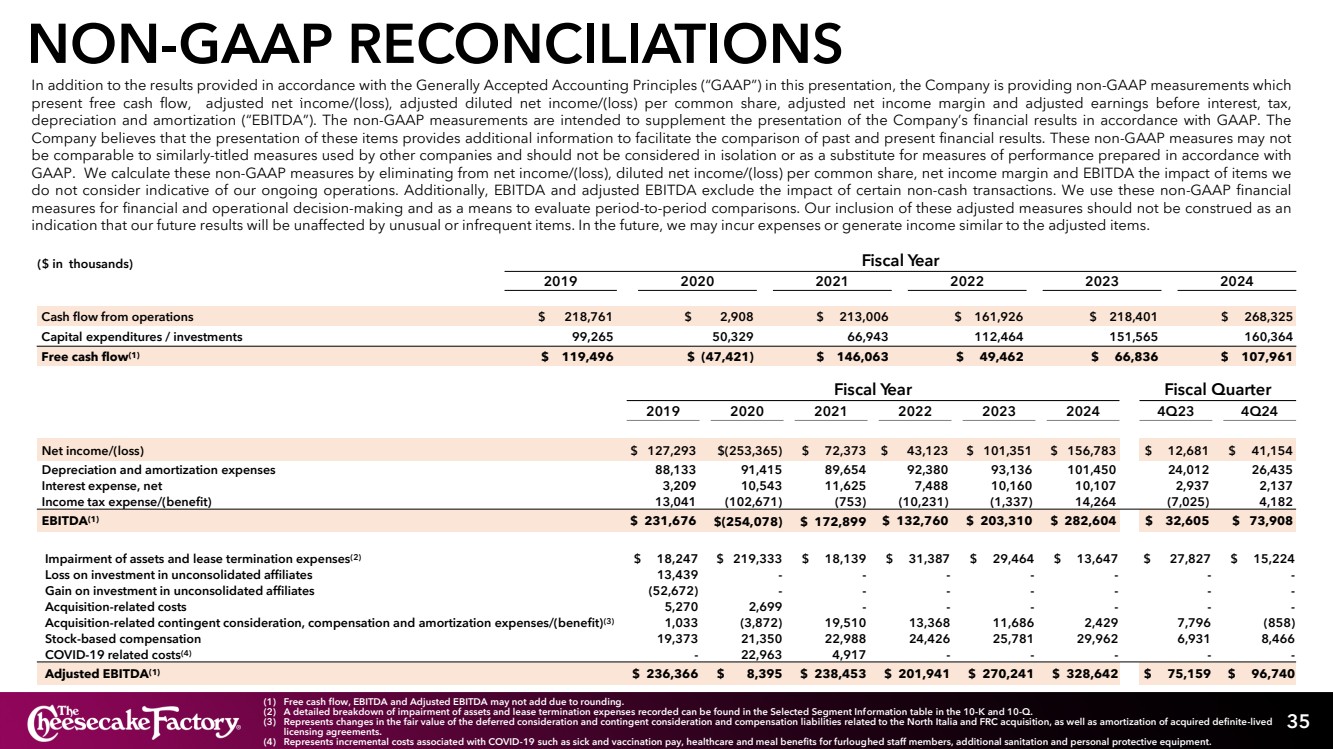
| NON-GAAP RECONCILIATIONS 35 In addition to the results provided in accordance with the Generally Accepted Accounting Principles (“GAAP”) in this presentation, the Company is providing non-GAAP measurements which present free cash flow, adjusted EBITDA excluding the impact of certain items, adjusted diluted net income/(loss) and adjusted diluted net income/(loss) per common share excluding the impact of certain items, and adjusted net income margin. The non-GAAP measurements are intended to supplement the presentation of the Company’s financial results in accordance with GAAP. The Company believes that the presentation of these items provides additional information to facilitate the comparison of past and present financial results. ($ in thousands) Fiscal Year 2019 2020 2021 2022 2023 2024 Cash flow from operations $ 218,761 $ 2,908 $ 213,006 $ 161,926 $ 218,401 $ 268,325 Capital expenditures / investments 99,265 50,329 66,943 112,464 151,565 160,364 Free cash flow(1) $ 119,496 $ (47,421) $ 146,063 $ 49,462 $ 66,836 $ 107,961 (1) Free cash flow, EBITDA and Adjusted EBITDA may not add due to rounding. (2) A detailed breakdown of impairment of assets and lease termination expenses recorded can be found in the Selected Segment Information table in the 10-K and 10-Q. (3) Represents changes in the fair value of the deferred consideration and contingent consideration and compensation liabilities related to the North Italia and FRC acquisition, as well as amortization of acquired definite-lived licensing agreements. (4) Represents incremental costs associated with COVID-19 such as sick and vaccination pay, healthcare and meal benefits for furloughed staff members, additional sanitation and personal protective equipment. Fiscal Year Fiscal Quarter 2019 2020 2021 2022 2023 2024 4Q23 4Q24 Net income/(loss) $ 127,293 $(253,365) $ 72,373 $ 43,123 $ 101,351 $ 156,783 $ 12,681 $ 41,154 Depreciation and amortization expenses 88,133 91,415 89,654 92,380 93,136 101,450 24,012 26,435 Interest expense, net 3,209 10,543 11,625 7,488 10,160 10,107 2,937 2,137 Income tax expense/(benefit) 13,041 (102,671) (753) (10,231) (1,337) 14,264 (7,025) 4,182 EBITDA(1) $ 231,676 $(254,078) $ 172,899 $ 132,760 $ 203,310 $ 282,604 $ 32,605 $ 73,908 Impairment of assets and lease termination expenses(2) $ 18,247 $ 219,333 $ 18,139 $ 31,387 $ 29,464 $ 13,647 $ 27,827 $ 15,224 Loss on investment in unconsolidated affiliates 13,439 - - - - - - - Gain on investment in unconsolidated affiliates (52,672) - - - - - - - Acquisition-related costs 5,270 2,699 - - - - - - Acquisition-related contingent consideration, compensation and amortization expenses/(benefit)(3) 1,033 (3,872) 19,510 13,368 11,686 2,429 7,796 (858) Stock-based compensation 19,373 21,350 22,988 24,426 25,781 29,962 6,931 8,466 COVID-19 related costs(4) - 22,963 4,917 - - - - - Adjusted EBITDA(1) $ 236,366 $ 8,395 $ 238,453 $ 201,941 $ 270,241 $ 328,642 $ 75,159 $ 96,740 |