QuickLinks -- Click here to rapidly navigate through this document
TABLE OF CONTENTS
| | | |
|---|---|---|
| | Page | |
| Management's Discussion and Analysis | ||
| Introduction | 1 | |
| Forward-looking Information | 1 | |
| Cautionary Note to U.S. Investors Concerning Mineral Reserves and Resources | 1 | |
| Our Business | 2 | |
| Key Financial Data | 3 | |
| Executive Summary | 4 | |
| Financial Review | 9 | |
| Financial Condition, Cash Flows, Liquidity and Capital Resources | 16 | |
| Outstanding Share Data | 18 | |
| Review of Operations | 19 | |
| Exploration Update | 22 | |
| Future Accounting Standards | 25 | |
| Risks and Uncertainties | 32 | |
| Internal Controls | 32 | |
| Other Information | 33 | |
| Non-GAAP Measures | 33 | |
Management's Discussion and Analysis
INTRODUCTION
Unless the context suggests otherwise, references to "NAP" or the "Company" or similar terms refer to North American Palladium Ltd. and its subsidiaries. "LDI" refers to Lac des Iles Mines Ltd., and "Cadiscor" refers to Cadiscor Resources Inc.
This Management's Discussion and Analysis ("MD&A") dated November 10, 2010 is intended to supplement and complement NAP's unaudited interim consolidated financial statements and related notes for the three and nine months ended September 30, 2010, which have been prepared in accordance with Canadian generally accepted accounting principles ("GAAP"). This MD&A should also be read in conjunction with both the audited consolidated financial statements and annual MD&A for the year ended December 31, 2009. Additional information regarding the Company, including its audited annual consolidated financial statements, the annual MD&A for the year ended December 31, 2009, and the most recent Form 40-F/Annual Information Form are on file with the U.S. Securities and Exchange Commission ("SEC") and the Canadian provincial securities regulatory authorities and are available at www.sec.gov and www.sedar.com, respectively.
All amounts are in Canadian dollars unless otherwise noted.
FORWARD-LOOKING INFORMATION
Certain information included in this MD&A, including any information as to the Company's future financial or operating performance and other statements, which include future oriented financial information, that express management's expectations or estimates of future performance, constitute 'forward looking statements' within the meaning of the 'safe harbor' provisions of theUnited States Private Securities Litigation Reform Act of 1995 and Canadian securities laws. The words 'expect', 'believe', 'will', 'intend', 'estimate', 'plan', 'targeting', 'goal', 'vision' and similar expressions identify forward-looking statements. Forward-looking statements are necessarily based upon a number of estimates and assumptions that, while considered reasonable by management, are inherently subject to significant business, economic and competitive uncertainties, risks and contingencies. The Company cautions the reader that such forward-looking statements involve known and unknown risks, uncertainties and other factors that may cause the actual financial results, performance or achievements of the Company to be materially different from the Company's estimated future results, performance or achievements expressed or implied by those forward-looking statements and that the forward-looking statements are not guarantees of future performance. These statements are also based on certain factors and assumptions including factors and assumptions related to future prices of palladium, gold and other metals, the Canadian dollar exchange rate, the ability of the Company to meet operating cost estimates, inherent risks associated with mining and processing, as well as those estimates, risks, assumptions and factors described in the Company's most recent Form 40-F/Annual Information Form on file with the SEC and Canadian provincial securities regulatory authorities. In addition, there can be no assurance that the Company's Lac des Iles and Sleeping Giant mines will operate as anticipated, or that the other properties can be successfully developed. The Company disclaims any obligation to update or revise any forward-looking statements, whether as a result of new information, events or otherwise, except as expressly required by law. Readers are cautioned not to put undue reliance on these forward-looking statements.
CAUTIONARY NOTE TO U.S. INVESTORS CONCERNING MINERAL RESERVES AND RESOURCES
Mineral reserve and mineral resource information contained herein has been calculated in accordance with National Instrument 43-101 – Standards of Disclosure for Mineral Projects, as required by Canadian provincial securities regulatory authorities. Canadian standards differ significantly from the requirements of the SEC, and mineral reserve and mineral resource information contained herein is not comparable to similar information disclosed in accordance with the requirements of the SEC. While the terms "measured", "indicated" and "inferred" mineral resources are
1
3RD QUARTER REPORT 2010
required pursuant to National Instrument 43-101, the SEC does not recognize such terms. U.S. investors should understand that "inferred" mineral resources have a great amount of uncertainty as to their existence and great uncertainty as to their economic and legal feasibility. In addition, U.S. investors are cautioned not to assume that any part or all of NAP's mineral resources constitute or will be converted into reserves. For a more detailed description of the key assumptions, parameters and methods used in calculating NAP's mineral reserves and mineral resources, see NAP's most recent Annual Information Form/Form 40-F on file with Canadian provincial securities regulatory authorities and the SEC.
OUR BUSINESS
North American Palladium Ltd. is a Canadian precious metals company focused on growing its production of palladium and gold in mining-friendly jurisdictions. As an established producer, the Company operates its two 100%-owned mines in Canada and has a pipeline of growth projects near its mine sites where both mills have excess capacity available for production growth.
Lac des Iles ("LDI"), the Company's flagship mine, is one of the world's two primary palladium producers. Located approximately 85 kilometres northwest of Thunder Bay, Ontario, LDI started producing palladium in 1993. The mine was temporarily placed on care and maintenance in October 2008 due to low metal prices, and was successfully restarted in April 2010. The Company is also currently developing the Offset Zone at the mine, which has the potential to transform LDI into a long life, low cost producer of palladium.
NAP also owns and operates the Sleeping Giant gold mine located in the Abitibi region of Quebec, near Val d'Or, where the Company has the potential to organically grow the gold division through the development of its other gold assets.
The Company has a strong portfolio of development and exploration assets near the LDI and Sleeping Giant mines, and is pursuing a significant exploration program in 2010 aimed at increasing its reserves and resources. With a seasoned senior management team, a strong balance sheet of approximately $161 million in working capital (including $114 million cash) as at September 30, 2010 and no long-term debt, NAP is well positioned to pursue its growth strategy.
NAP trades on the TSX under the symbol PDL and on the NYSE Amex under the symbol PAL.
2
3RD QUARTER REPORT 2010
KEY FINANCIAL DATA
| | | | | | | ||||||||||
|---|---|---|---|---|---|---|---|---|---|---|---|---|---|---|---|
| (expressed in thousands of dollars except total cash cost and per share amounts) | Three months ended September 30 | Nine months ended September 30 | | ||||||||||||
| 2010 | 2009 | 2010 | 2009 | | |||||||||||
| FINANCIAL HIGHLIGHTS | |||||||||||||||
Revenue | |||||||||||||||
| Revenue after pricing adjustments | $ | 38,451 | $ | 1 | $ | 67,596 | $ | 4,018 | |||||||
Unit sales | |||||||||||||||
| Palladium (oz) | 38,123 | – | 62,211 | – | |||||||||||
| Gold (oz) | 5,295 | – | 17,067 | – | |||||||||||
| Platinum (oz) | 2,013 | – | 3,100 | – | |||||||||||
| Nickel (lb) | 146,496 | – | 236,129 | – | |||||||||||
| Copper (lb) | 238,698 | – | 412,184 | – | |||||||||||
Net income (loss) | |||||||||||||||
| Net income (loss) | $ | 3,185 | $ | (6,194 | ) | $ | (22,999 | ) | $ | (15,653 | ) | ||||
| Net income (loss) per share | $ | 0.02 | $ | (0.06 | ) | $ | (0.17 | ) | $ | (0.17 | ) | ||||
| EBITDA1 | $ | 5,556 | $ | (6,195 | ) | $ | (16,213 | ) | $ | (16,703 | ) | ||||
| Cash flow provided by (used in) operations | |||||||||||||||
| Cash flow provided by (used in) operations before changes in non-cash working capital | $ | 6,022 | $ | (5,846 | ) | $ | (14,069 | ) | $ | (14,669 | ) | ||||
| Cash flow provided by (used in) operations before changes in non-cash working capital per share1 | $ | 0.04 | $ | (0.06 | ) | $ | (0.10 | ) | $ | (0.16 | ) | ||||
| Capital spending | $ | 14,589 | $ | 5,647 | $ | 29,222 | $ | 7,755 | |||||||
OPERATING HIGHLIGHTS | |||||||||||||||
Production | |||||||||||||||
| Palladium (oz) | 34,420 | – | 62,259 | – | |||||||||||
| Gold (oz) | 5,287 | – | 15,505 | – | |||||||||||
| Platinum (oz) | 1,830 | – | 3,103 | – | |||||||||||
| Nickel (lb) | 131,154 | – | 236,297 | – | |||||||||||
| Copper (lb) | 214,853 | – | 412,464 | – | |||||||||||
| Total cash cost2 | |||||||||||||||
| Palladium (US$) | $ | 218 | – | $ | 253 | – | |||||||||
| Gold (US$) | $ | 1,660 | – | $ | 1,527 | – | |||||||||
FINANCIAL CONDITION
| | As at September 30 2010 | As at December 31 2009 | | ||||
|---|---|---|---|---|---|---|---|
| (expressed in thousands of dollars) | | ||||||
| Net working capital | $ | 161,101 | $ | 114,507 | |||
| Cash balance | $ | 113,614 | $ | 98,255 | |||
| Shareholders' equity | $ | 264,491 | $ | 192,261 | |||
- 1
- Earnings before interest, taxes, depreciation and amortization, which is a Non-GAAP measure. Please refer to Non-GAAP measures on page 33.
- 2
- Non-GAAP measure. Please refer to Non-GAAP Measures on page 33
3
3RD QUARTER REPORT 2010
EXECUTIVE SUMMARY
Increased Earnings and Cash Flow
During the third quarter of 2010, NAP returned to profitability. Net income for the quarter ended September 30, 2010 was $3.2 million or $0.02 per share compared to a net loss of $6.2 million or $0.06 per share in the same quarter last year. NAP provided cash from operating activities of $6.0 million, before changes in non-cash working capital, for the quarter ended September 30, 2010, or $0.04 per share,2 as compared to cash used in operations of $5.8 million, before changes in non-cash working capital, or $0.06 per share,2 for the quarter ended September 30, 2009.
- 1
- Earnings before interest, taxes, depreciation and amortization, which is a Non-GAAP measure. Please refer to Non-GAAP measures on page 33.
- 2
- Non-GAAP measure. Please refer to Non-GAAP Measures on page 33
EBITDA1 was $5.6 million for the quarter ended September 30, 2010, compared to a negative $6.2 million in the same quarter last year.
Strong Balance Sheet
As at September 30, 2010, the Company has approximately $161 million in working capital (including $114 million cash on hand) and no long-term debt.
Higher Revenue
Revenue, after pricing adjustments, for the quarter ended September 30, 2010 was $38.5 million compared to a nominal amount in the same quarter last year.
LDI Mine – Operating As Expected With Lower Cash Costs
The LDI mine produced 34,420 ounces of payable palladium for the quarter ended September 30, 2010. Approximately 225,960 tonnes of ore was extracted from the LDI mine, of which 220,694 tonnes came from the Roby Zone with an average palladium grade of 6.95 grams per tonne, and 5,266 tonnes of silling ore came from the top of the Offset Zone at an average palladium grade of 9.37 grams per tonne. The LDI mill processed 198,907 tonnes of ore at an average of 6,416 tonnes per operating day at an average palladium head grade of 7.05 grams per tonne, with a palladium recovery of 82.1%, and mill availability of 91.3%. For the three months ended September 30, 2010, LDI's total cash cost2 was US$218 per ounce palladium. The lower cash cost is due to better than expected head grades and higher revenue from byproduct credit metal prices. Similar production and grades are expected in the fourth quarter of 2010.
Sleeping Giant Mine – Focused on Development
The Company's Sleeping Giant gold mine produced 3,879 ounces of gold for the quarter ended September 30, 2010. During the third quarter, 22,494 tonnes of ore was hoisted from Sleeping Giant, with 21,645 tonnes being processed by the mill at an average head grade of 5.84 grams per tonne, with a gold recovery of 95.5%. For the three months ended September 30, 2010 Sleeping Giant's total cash cost2 was US$1,660 per ounce gold. Since commencing operations at the Sleeping Giant mine, mining activities have been confined to zones mined by the previous owner.
Development work at Sleeping Giant continued in the third quarter, focused on implementing a number of measures to manage the mine's ramp-up issues. Tighter infill drilling is now being conducted to better manage grade control issues and shrinkage and long-hole stopes are being favoured over room and pillar stopes due to the higher certainty over grade and tonnage recovered. The Company will continue to adjust its mine plan and methods in order to optimize operations.
LDI Mine Expansion Update
In August, NAP announced plans to significantly increase LDI's mine production, supported by the positive results from a Preliminary Economic Assessment ("Scoping Study") on the Offset Zone. The ramp development into the Offset Zone is progressing according to plan. This ramp will provide a platform for exploration, raiseboring the Offset Zone
4
3RD QUARTER REPORT 2010
shaft to surface and production from the Offset Zone until the shaft is completed. Commercial production from the shaft is targeted for the third quarter of 2012, and is expected to yield production in excess of 250,000 ounces per year and life of mine cash costs are estimated to be around US$132 per ounce. Development work for the mine expansion is well underway and is currently progressing on NAP's projected timeline. Detailed engineering of the surface hoisting plant and production shaft was initiated in May 2010 and is on schedule to be completed by the end of the year. Timing risk has been substantially diminished as the Company has already purchased the production, sinking and service cage hoists that are critical to the project. During the quarter, the Company has awarded the raiseboring contract for the shaft to Redpath Mining and to Cementation Inc. for raiseboring the ventilation raise. All senior positions of the Offset Zone project team have been hired and the team is onsite at LDI overseeing all aspects of the Offset Zone development.
The Scoping Study highlights that there is significant upside potential from continued exploration from the Offset Zone, which remains open in all directions and from the Cowboy and Outlaw zones, which were not included in the resource estimate that was used in the study. In particular, there is potential to upgrade resources in the lower mine block and to extend the zone south where an additional lens of inferred resources was modeled.
Vezza – Gold Project Acquisition Completed
In September, the Company closed an agreement to purchase the Vezza gold project in the Abitibi region of Quebec from Agnico-Eagle Mines Ltd. for $10.0 million comprised of $3.6 million in cash and $6.5 million in shares. Vezza is an advanced-stage exploration project within trucking distance to the Sleeping Giant mill. According to a recent 43-101 technical report, the property is estimated to have 288,000 contained ounces of gold in the measured and indicated categories and an additional 121,000 ounces in inferred resources. If developed, management believes that Vezza has the potential to produce approximately 40,000 to 50,000 ounces of gold per year over a 7 to 9 year mine life. The Company started a surface drilling program and initiated the process to have the shaft and underground drifts dewatered in order to conduct underground diamond drilling over the next couple of months.
Sleeping Giant Shaft Deepening
Once the deepening of the shaft by 200 metres is completed, NAP will gain access to three new mining levels and new stopes in zones that have historically provided good tonnage and higher grade feed for the Sleeping Giant mill. The shaft deepening is expected to be completed by the end of the first quarter in 2011, following which lateral development will commence.
Focused On Significant Exploration Programs
NAP is currently pursuing a significant exploration program aimed at increasing its reserves and resources at LDI and within its gold division. NAP is completing a $15 million, 68,000-metre drilling and exploration program at LDI to identify additional resources, upgrade resource classifications, and facilitate the planning of future mine development. NAP is also spending approximately $6.2 million on a 53,000-metre gold exploration program in 2010 focused on extending Sleeping Giant zones at depth, drilling the Dormex property (adjacent to the Sleeping Giant gold mine), advancing its Flordin property, drilling from surface at its Discovery property, and conducting ground geophysical surveys and drilling at its Laflamme gold property. All Quebec based gold projects are located within trucking distance of the currently underutilized Sleeping Giant mill.
Flordin Gold Property – Potential Open Pit Gold Deposit
The Flordin property's first-time NI 43-101 report (released in March 2010) estimates that the property contains 679,000 tonnes of measured and indicated resources near surface at an average grade of 4.25 grams per tonne gold for 92,814 contained ounces and an additional inferred resource of 1,451,400 tonnes grading 3.63 grams per tonne gold for a total of 169,261 contained ounces. NAP is conducting a 10,000-metre infill drill campaign to upgrade the resource classification. The Company believes that the Flordin gold property could have the potential to provide additional feed for the underutilized Sleeping Giant mill and is currently examining open pit scenarios.
5
3RD QUARTER REPORT 2010
Discovery Gold Project
The Company recently filed an environmental impact study for the Discovery project and applied for a mining lease to continue to advance the property toward a future underground exploration program. For the remainder of the year, NAP is conducting a 4,200-metre surface drilling program to expand the gold zone intersected in 2008. An August 1, 2008 Scoping Study concluded that the project could produce 44,000 ounces of gold per year for four years with a project internal rate of return of 27%, assuming a US$850 gold price.
Dormex Gold Property
At the Dormex property, adjacent to the Sleeping Giant property, the Company continued its surface exploration program combining geophysical surveys, reverse circulation drilling of the overburden and diamond drilling.
Sleeping Giant Mill Expansion Study
NAP is currently completing a mill expansion study as the Company believes that its other gold assets (which are within trucking distance of the Sleeping Giant mill) have the potential to exceed current mill capacity if they are developed.
Outlook
The Company's management team believes it is delivering on its vision to create a diversified mid-tier precious metals producer. NAP is well positioned to benefit from the forecasted rise in the price of palladium as the LDI mine expansion is expected to significantly increase production with the development and mining the Offset Zone over the next couple of years.
The Company currently expects fourth quarter production and cash costs, net of byproduct credits, to be similar to the third quarter for both the LDI and Sleeping Giant mines. In early 2011, NAP intends to announce its 2011 guidance for annual palladium and gold production and cash costs, its budget for exploration, and the expansion plans for its gold assets.
For the remainder of the year, the Company intends to focus on:
- •
- Growing palladium production at LDI while continuing to optimize costs;
- •
- Continuing to advance the LDI mine expansion, including developing the ramp, ventilation, shaft and mining levels;
- •
- Continuing exploration programs aimed at increasing reserves and resources at LDI and in the gold division; and
- •
- Improving operating results at Sleeping Giant by continuing to implement a number of measures to mitigate the ramp-up issues and continuing the deepening of the mine shaft;
- •
- Determining expansion plans for NAP's gold assets and the underutilized Sleeping Giant mill.
While management is focused on organic growth, there could be attractive strategic opportunities to consider in the current environment. The Company may use its strong balance sheet to pursue PGM and/or gold acquisition and joint venture opportunities, but with discipline to ensure it pursues only those transactions that can deliver enhanced and sustainable shareholder value.
6
3RD QUARTER REPORT 2010
Metal Prices
| Palladium Price (US$/ Troy oz) | Gold Price (US$/ Troy oz) | |
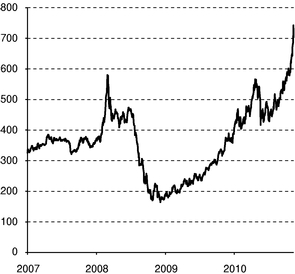 | 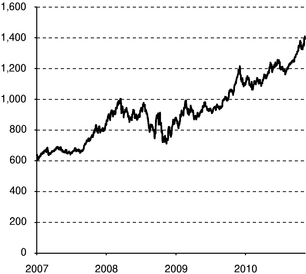 |
After peaking in March 2008 at US$582 per ounce, the price of palladium declined by 69% to US$183 per ounce on December 31, 2008. This significant decline prompted the Company to put the LDI mine on temporary care and maintenance in October 2008. As the price of palladium began to recover, the Company announced in December 2009 that it would restart the LDI mine, which was achieved ahead of schedule and under budget in April of this year.
During the third quarter of 2010, palladium spot prices averaged US$495 per ounce, and US$477 for the first nine months of the year. The recent price recovery can be attributed to increased investment demand, strong fabrication demand and constrained supply. Palladium is increasingly behaving like a precious metal with investment and jewelry demand, yet has the fundamental underpinning of an industrial metal. Palladium has been the best performing metal in percentage terms in 2010 and recently was at a nine year high. As of November 9, 2010, the price of palladium was US$730.
During the third quarter of 2010, the average price of gold was US$1,227 per ounce, with gold trading in a range of US$1,157 to US$1,308 per ounce. This compares to an average of US$961 per ounce in the third quarter of 2009, with a low of US$909 and a high of US$1,019 per ounce. The average price of gold for the nine months ended September 30, 2010 was US$1,177. As of November 9, 2010, the price of gold was US$1,421.
The Canadian dollar ("CAD") modestly strengthened during the third quarter from $0.94 to $0.97 relative to the US dollar ("USD"). During September, USD weakness was brought about by speculation over the potential for the Federal Reserve to announce another round of quantitative easing. However, the CAD is also fundamentally supported by its relatively strong sovereign position, strong commodity prices and positive foreign flows into Canada.
7
3RD QUARTER REPORT 2010
Final pricing on metals settled during the three and nine months ended September 30, 2010 are set out in the following table:
Average Realized Metal Prices and Exchange Rates
| | Three months ended September 30 | Nine months ended September 30 | | ||||||||||
|---|---|---|---|---|---|---|---|---|---|---|---|---|---|
| | 2010 | 2009 | 2010 | 2009 | | ||||||||
| Palladium – US$/oz | $ | – | $ | – | $ | – | $ | 204 | |||||
| Platinum – US$/oz | $ | – | $ | – | $ | – | $ | 1,025 | |||||
| Gold – US$/oz | $ | 1,231 | $ | – | $ | 1,172 | $ | 896 | |||||
| Nickel – US$/lb | $ | 9.35 | $ | – | $ | 9.35 | $ | 4.80 | |||||
| Copper – US$/lb | $ | 3.23 | $ | – | $ | 3.23 | $ | 1.45 | |||||
| Average exchange rate (Bank of Canada) – CDN$1 = US$ | US$ | 0.96 | US$ | 0.91 | US$ | 0.97 | US$ | 0.85 | |||||
Final realized prices for LDI are not determined until the refined metal is sold by the third party smelter, which is three months after delivery to the smelter for base metals and six months for precious metals. Until this time, LDI's metals are provisionally priced at month end forward prices.
For comparison purposes, the following table details the recorded spot metal prices and exchange rate for the specified metals:
Spot Metal Prices* and Exchange Rates
| | November 9 2010 | September 30 2010 | June 30 2010 | March 31 2010 | December 31 2009 | September 30 2009 | June 30 2009 | March 31 2009 | December 31 2008 | | ||||||||||||||||||
|---|---|---|---|---|---|---|---|---|---|---|---|---|---|---|---|---|---|---|---|---|---|---|---|---|---|---|---|---|
| Palladium – US$/oz | $ | 730 | $ | 573 | $ | 446 | $ | 479 | $ | 393 | $ | 294 | $ | 249 | $ | 215 | $ | 183 | ||||||||||
| Gold – US$/oz | $ | 1,421 | $ | 1,307 | $ | 1,244 | $ | 1,116 | $ | 1,104 | $ | 996 | $ | 934 | $ | 916 | $ | 869 | ||||||||||
| Platinum – US$/oz | $ | 1,786 | $ | 1,662 | $ | 1,532 | $ | 1,649 | $ | 1,461 | $ | 1,287 | $ | 1,186 | $ | 1,124 | $ | 898 | ||||||||||
| Nickel – US$/lb | $ | 11.03 | $ | 10.57 | $ | 8.78 | $ | 11.33 | $ | 8.38 | $ | 7.86 | $ | 7.26 | $ | 4.27 | $ | 4.90 | ||||||||||
| Copper – US$/lb | $ | 4.01 | $ | 3.65 | $ | 2.95 | $ | 3.56 | $ | 3.33 | $ | 2.78 | $ | 2.31 | $ | 1.83 | $ | 1.32 | ||||||||||
| Exchange rate (Bank of Canada) – CDN$1 = US$ | US$ | 1.00 | US$ | 0.97 | US$ | 0.94 | US$ | 0.98 | US$ | 0.96 | US$ | 0.93 | US$ | 0.86 | US$ | 0.79 | US$ | 0.82 | ||||||||||
- *
- Based on the London Metal Exchange
8
3RD QUARTER REPORT 2010
Income from mining operations
Income from mining operations includes the following:
| | Three months ended September 30 | Nine months ended September 30 | | |||||||||||
|---|---|---|---|---|---|---|---|---|---|---|---|---|---|---|
| | 2010 | 2009 | 2010 | 2009 | | |||||||||
| Revenue before pricing adjustments | $ | 33,724 | $ | – | $ | 63,334 | $ | – | ||||||
| Pricing adjustments | 4,727 | 1 | 4,262 | 4,018 | ||||||||||
| Revenue after pricing adjustments | $ | 38,451 | $ | 1 | $ | 67,596 | $ | 4,018 | ||||||
| Production costs | $ | 20,452 | $ | – | $ | 53,153 | $ | – | ||||||
| Smelter treatment, refining and freight costs | 1,953 | 4 | 3,147 | 82 | ||||||||||
| Royalty expense | 1,439 | – | 2,184 | 201 | ||||||||||
| Inventory pricing adjustment | (388 | ) | (639 | ) | – | (3,634 | ) | |||||||
| Depreciation and amortization | 3,171 | 95 | 11,252 | 197 | ||||||||||
| Asset retirement obligation accretion | 145 | 131 | 433 | 320 | ||||||||||
| Loss (gain) on disposal of equipment | 86 | (21 | ) | 103 | (21 | ) | ||||||||
| Care and maintenance costs | – | 2,533 | – | 8,799 | ||||||||||
| Total operating expenses | $ | 26,858 | $ | 2,103 | $ | 70,272 | $ | 5,944 | ||||||
| Income (loss) from mining operations | $ | 11,593 | $ | (2,102 | ) | $ | (2,676 | ) | $ | (1,926 | ) | |||
LDI Palladium Mine
Income from mining operations for the LDI palladium mine are summarized in the following table.
| Three months ended September 30 | Nine months ended September 30 | |||||||||||||
| 2010 | 2009 | 2010 | 2009 | |||||||||||
| Revenue after pricing adjustments | $ | 33,394 | $ | 1 | $ | 49,462 | $ | 4,018 | ||||||
Operating expenses | ||||||||||||||
| Production costs | $ | 13,700 | $ | – | $ | 29,834 | $ | – | ||||||
| Smelter treatment, refining and freight costs | 1,940 | 4 | 3,103 | 82 | ||||||||||
| Royalty expense | 1,439 | – | 2,184 | 201 | ||||||||||
| Inventory pricing adjustment | (388 | ) | (639 | ) | – | (3,634 | ) | |||||||
| Depreciation and amortization | 629 | 69 | 3,708 | 170 | ||||||||||
| Asset retirement obligation accretion | 96 | 94 | 287 | 283 | ||||||||||
| Loss (gain) on disposal of equipment | 84 | (21 | ) | 105 | (21 | ) | ||||||||
| Care and maintenance costs | – | 2,533 | – | 8,799 | ||||||||||
| Total operating expenses | $ | 17,500 | $ | 2,040 | $ | 39,221 | $ | 5,880 | ||||||
| Income (loss) from mining operations | $ | 15,894 | $ | (2,039 | ) | $ | 10,241 | $ | (1,862 | ) | ||||
Revenue
Revenue is affected by sales volumes, commodity prices and currency exchange rates. Metal sales for LDI are recognized in revenue at provisional prices when delivered to a smelter for treatment. Final pricing is not determined until the refined metal is sold, which in the case of LDI base metals is three months and precious metals six months after delivery to the smelter. These final pricing adjustments can result in additional revenues in a rising commodity price environment and reductions to revenue in a declining commodity price environment. Similarly, a weakening in
9
3RD QUARTER REPORT 2010
the Canadian dollar relative to the U.S. dollar will result in additional revenues and a strengthening in the Canadian dollar will result in reduced revenues.
Sales volumes of LDI's major commodities are set out in the table below.
| Three months ended September 30 | Nine months ended September 30 | |||||||||
| 2010 | 2009 | 2010 | 2009 | |||||||
| Sales volumes | ||||||||||
| Palladium (oz) | 38,123 | – | 62,211 | – | ||||||
| Gold (oz) | 1,553 | – | 2,525 | – | ||||||
| Platinum (oz) | 2,013 | – | 3,100 | – | ||||||
| Nickel (lbs) | 146,496 | – | 236,129 | – | ||||||
| Copper (lbs) | 238,698 | – | 412,184 | – | ||||||
| Cobalt (lbs) | 3,622 | – | 5,941 | – | ||||||
Revenue from metal sales during the three and nine months ended September 30, 2010 is set out below.
| Three months ended September 30 | Nine months ended September 30 | ||||||||||||||
| 2010 | 2009 | 2010 | 2009 | ||||||||||||
| Revenue before pricing adjustments | $ | 28,667 | $ | – | $ | 45,200 | $ | – | |||||||
| Pricing adjustments | 4,727 | 1 | 4,262 | 4,018 | |||||||||||
| Revenue after pricing adjustments | $ | 33,394 | $ | 1 | $ | 49,462 | $ | 4,018 | |||||||
Revenue by metal | |||||||||||||||
| Palladium | $ | 24,989 | $ | – | $ | 36,568 | $ | 2,683 | |||||||
| Gold | 2,141 | – | 3,425 | 120 | |||||||||||
| Platinum | 3,503 | – | 5,296 | 1,063 | |||||||||||
| Nickel | 1,984 | – | 2,524 | 5 | |||||||||||
| Copper | 701 | – | 1,524 | 170 | |||||||||||
| Cobalt | 61 | – | 106 | (70 | ) | ||||||||||
| Silver | 15 | 1 | 19 | 47 | |||||||||||
| $ | 33,394 | $ | 1 | $ | 49,462 | $ | 4,018 | ||||||||
For the three and nine months ending September 30, 2010, revenue before pricing adjustments was $28.7 million and $45.2 million respectively, compared to $nil for the same comparative periods last year, reflecting no production from the LDI mine. Due to the recovery of metal prices, the Company recommenced operations in April 2010 after being on care and maintenance since October 2008.
Revenue after pricing adjustments from metal settlements which includes the mark-to-market of accounts receivable for the three months ended September 30, 2010 was $33.4 million, reflecting a $5.7 million positive commodity price adjustment offset by a $1.0 million negative foreign exchange adjustment. This compares to nominal pricing adjustments recognized in the same period last year. For the nine months ended September 30, 2010, revenue after pricing adjustments was $49.5 million, reflecting a $5.0 million positive commodity price adjustment offset by a $0.8 million negative foreign exchange adjustment. This compares to $4.0 million of revenue recognized in the same period last year comprised of a $4.6 million favourable commodity price adjustment offset by a $0.6 million negative foreign exchange adjustment. The prior period pricing adjustments reflected final pricing on metal settlements relating to concentrate shipments made prior to the October 2008 mine shutdown.
10
3RD QUARTER REPORT 2010
Operating Expenses
For the quarter ended September 30, 2010, total production costs at the LDI mine were $13.7 million compared to $nil in the same quarter last year, when the mine was on care and maintenance. For the nine months ended September 30, 2010, total production costs2 were $29.8 million, which includes the operating costs to restart the Roby Zone and the LDI mill in the first quarter of 2010. The Company expensed the restart operating costs associated with the LDI palladium mine since the mine was placed on temporary care and maintenance in October 2008 and the Company retained all key senior management during the care and maintenance period in anticipation of a prompt restart when metal prices recovered. Total cash cost2 per ounce of palladium sold, net of by product credits was US$218 and US$253 for the three and nine months ended September 30, 2010 respectively.
- 2
- Non-GAAP measure. Please refer to Non-GAAP Measures on page 33.
For the three months ended September 30, 2010, the inventory pricing adjustment was a recovery of $0.4 million compared to a recovery of $0.6 million in the same period last year due to the increase in metal prices that were partially offset by the strengthening of the Canadian dollar. For the nine months ended September 30, 2010, the inventory pricing adjustment was $nil compared to a recovery of $3.6 million in the same period last year. The comparative periods in the prior year reflected the adjustment of ore inventories to net realizable value due to the increase in metal prices that were partially offset by the strengthening of the Canadian dollar.
Smelter treatment, refining and freight costs for the three months ended September 30, 2010 were $1.9 million compared to a nominal amount in the corresponding period in 2009. For the nine months ended September 30, 2010, smelter treatment, refining and freight costs were $3.1 million compared to $0.1 million in the same period last year, which reflected final pricing and assay adjustments on concentrate shipments made prior to placing the mine on temporary care and maintenance in October 2008.
For the three months ended September 30, 2010, royalty expense was $1.4 million compared to $nil in the same period last year. For the nine months ended September 30, 2010, the royalty expense was $2.2 million compared to $0.2 million in the same period last year, which reflected final pricing of metal settlements that was less than the mark-to-market adjustments on concentrate shipments made prior to placing the mine on temporary care and maintenance in October 2008.
Depreciation and amortization at the LDI mine for the third quarter ended September 30, 2010 was $0.6 million, which includes a reallocation of $0.1 million to crushed and broken ore and concentrate inventory, compared to $0.1 million in the corresponding period in 2009. For the nine months ended September 30, 2010, depreciation and amortization was $3.7 million, which includes a reallocation of $0.3 million to crushed and broken ore and concentrate inventory, compared to $0.2 million in the corresponding period in 2009. LDI's depreciation and amortization expense for the three and nine months ended September 30, 2010 reflects the use of vehicles and equipment relating to the production of the Roby underground mine, development of the Offset Zone underground mine, and mill operations using the unit of production and straight line methods of depreciation, whereas the comparative periods reflected depreciation of vehicles still in use while the mine was on care and maintenance.
During the three and nine months ended September 30, 2010, the loss on disposition of equipment was $0.1 million compared to a nominal gain in the comparative periods last year, which represented the disposition of certain mining equipment.
For the three and nine months ended September 30, 2010, the asset retirement obligation accretion was $0.1 million and $0.3 million respectively, which is comparable to the same periods last year.
11
3RD QUARTER REPORT 2010
Sleeping Giant Gold Mine
Income from mining operations for the Sleeping Giant gold mine is summarized in the following table.
| Three months ended September 30 | Nine months ended September 30 | |||||||||||||
| 2010 | 2009 | 2010 | 2009 | |||||||||||
| Revenue after pricing adjustments | $ | 5,057 | $ | – | $ | 18,134 | $ | – | ||||||
Operating expenses | ||||||||||||||
| Production costs | $ | 6,752 | $ | – | $ | 23,319 | $ | – | ||||||
| Refining and freight costs | 13 | – | 44 | – | ||||||||||
| Depreciation and amortization | 2,513 | 26 | 7,458 | 27 | ||||||||||
| Asset retirement obligation accretion | 49 | 37 | 146 | 37 | ||||||||||
| Loss (gain) on disposal of equipment | 2 | – | (2 | ) | – | |||||||||
| Total operating expenses | $ | 9,329 | $ | 63 | $ | 30,965 | $ | 64 | ||||||
| Loss from mining operations | $ | (4,272 | ) | $ | (63 | ) | $ | (12,831 | ) | $ | (64 | ) | ||
Revenue
Metal sales for the Sleeping Giant gold mine are recognized at the time that significant risks and rewards transfer to the purchaser.
Sales volumes are set out in the table below.
| Three months ended September 30 | Nine months ended September 30 | |||||||||
| 2010 | 2009 | 2010 | 2009 | |||||||
| Sales volumes summary (payable) | ||||||||||
| Gold (oz) | 3,742 | – | 14,542 | – | ||||||
| Silver (oz) | 14,000 | – | 24,000 | – | ||||||
Revenue from metal sales during the three and nine months ended September 30, 2010 is set out below.
| Three months ended September 30 | Nine months ended September 30 | |||||||||||||
| 2010 | 2009 | 2010 | 2009 | |||||||||||
| Revenue before pricing adjustments | $ | 5,057 | $ | – | $ | 18,134 | $ | – | ||||||
| Pricing adjustments | – | – | – | – | ||||||||||
| Revenue after pricing adjustments | $ | 5,057 | $ | – | $ | 18,134 | $ | – | ||||||
| Revenue by metal | – | – | ||||||||||||
| Gold | $ | 4,763 | $ | – | $ | 17,661 | $ | – | ||||||
| Silver | 294 | – | 473 | – | ||||||||||
| $ | 5,057 | $ | – | $ | 18,134 | $ | – | |||||||
For the quarter ended September 30, 2010, revenue was $5.1 million, reflecting gold sales of 3,742 ounces with an average realized price of US$1,231 per ounce. For the nine months ended September 30, 2010, revenue was $18.1 million, reflecting gold sales of 14,542 ounces with an average realized price of US$1,172 per ounce.
12
3RD QUARTER REPORT 2010
Operating Expenses
For the three and nine months ended September 30, 2010, total production costs at the Sleeping Giant gold mine were $6.8 million and $23.3 million, respectively. There were no production costs for the same periods last year as the mine reached commercial production January 1, 2010. Total cash cost2 was US$1,660 and US$1,527, respectively for the three and nine months ended September 30, 2010.
Depreciation and amortization at the Sleeping Giant gold mine was $2.5 million and $7.5 million for the three and nine months ended September 30, 2010, respectively, and reflects the depreciation and amortization of its mining interests using the unit of production and straight line methods of depreciation. The comparative periods in the prior year reflected nominal amounts relating to straight line depreciation for the use of light vehicles and office equipment.
Gain on disposal of equipment for the three and nine months ended September 30, 2010 was nominal as compared to the prior periods.
For the quarter ended September 30, 2010, the asset retirement obligation accretion was nominal as compared to the same period last year. For the nine months ended September 30, 2010, the asset retirement obligation accretion was $0.1 million, compared to a nominal amount for the same comparative period.
Asset Impairment
The Company reviews and evaluates its long-lived assets for impairment when events or changes in circumstances arise that may result in impairments in the carrying value of those assets. Impairment is considered to exist if total estimated future undiscounted cash flows are less than the carrying amount of the asset. In the opinion of the Company's management, during the three and nine months ended September 30, 2010 there were no events or changes in circumstances giving rise to an impairment in the carrying value of long-lived assets. Assumptions underlying future cash flow estimates are subject to risk and uncertainty. Any differences between significant assumptions and market conditions such as metal prices, exchange rates, recoverable metal, and/or the Company's operating performance could have a material effect on the Company's ability to recover the carrying amounts of its long-lived assets resulting in possible additional impairment charges.
- 2
- Non-GAAP measure. Please refer to Non-GAAP Measures on page 33.
Other Expenses
The Company's general and administration expenses for the quarter ended September 30, 2010 were $2.4 million compared to $1.8 million in the same period last year. For the nine months ended September 30, 2010, general and administration expenses were $7.7 million compared to $6.1 million in the corresponding period last year. In the current periods, the Company incurred additional administration costs as a result of the restart of the Sleeping Giant gold mine.
Exploration expenditures for the quarter ended September 30, 2010 were $7.0 million compared to $2.6 million in the same quarter last year. For the nine months ended September 30, 2010, exploration expenditures were $17.6 million compared to $8.9 million in the same period last year, and are comprised of the following:
| Three months ended September 30 | Nine months ended September 30 | ||||||||||||
| 2010 | 2009 | 2010 | 2009 | ||||||||||
| LDI Offset Zone project | $ | 1,849 | $ | 1,502 | $ | 5,786 | $ | 5,457 | |||||
| Other Ontario exploration projects* | 1,915 | 863 | 5,006 | 3,090 | |||||||||
| Sleeping Giant mine property | 796 | – | 2,265 | – | |||||||||
| Other Quebec exploration projects** | 2,448 | 258 | 4,537 | 400 | |||||||||
| Total exploration expenditures | $ | 7,008 | $ | 2,623 | $ | 17,594 | $ | 8,947 | |||||
- *
- Other Ontario exploration projects are comprised of Shebandowan and other LDI exploration projects, including the Mine Block, West Pit, South Pit, Creek Zone, North VT Rim, and the Legris option.
- **
- Other Quebec exploration projects are comprised of the Montbray, Harricana, Cameron Shear, Flordin, Laflamme, and Florence properties.
13
3RD QUARTER REPORT 2010
Interest and other income for the quarter ended September 30, 2010 was $0.1 million compared to $0.2 million in the corresponding period last year, a decrease of $0.1 million. For the nine months ended September 30, 2010, interest and other income was $0.1 million, compared to $1.5 million in the same period in 2009. The reduced interest and other income was due primarily to the lower interest income earned on short term interest bearing deposits.
The foreign exchange gain for the quarter ended September 30, 2010 was nominal compared to $0.1 million in the same period last year. For the nine months ended September 30, 2010, the foreign exchange gain was nominal compared to $0.3 million in the comparative period last year. The corresponding periods in 2009 primarily related to foreign exchange gains on the translation of the Company's U.S. dollar denominated capital leases and credit facilities.
Income and Mining Tax Recovery
The income and mining tax recovery for the three and nine months ended September 30, 2010 is provided in the table below.
| Three months ended September 30 | Nine months ended September 30 | ||||||||||||
| 2010 | 2009 | 2010 | 2009 | ||||||||||
| LDI palladium mine | |||||||||||||
| Ontario resource allowance recovery | $ | – | $ | – | $ | 315 | $ | – | |||||
| Ontario transitional tax credit | – | – | 280 | – | |||||||||
| Corporate minimum tax credit | – | – | 75 | – | |||||||||
| $ | – | $ | – | $ | 670 | $ | – | ||||||
Sleeping Giant gold mine | |||||||||||||
| Quebec mining duties recovery | $ | – | $ | – | $ | 110 | $ | – | |||||
| Quebec income tax recovery | – | – | 26 | – | |||||||||
| Mining interests timing difference expense | (456 | ) | – | (273 | ) | – | |||||||
| $ | (456 | ) | $ | – | $ | (137 | ) | $ | – | ||||
Corporate and other | |||||||||||||
| Expiration of warrants | $ | – | $ | – | $ | 1,593 | $ | – | |||||
| Renunciation of flow-through exploration expenditures | 1,408 | – | 2,732 | – | |||||||||
| $ | 1,408 | $ | – | $ | 4,325 | $ | – | ||||||
| $ | 952 | $ | – | $ | 4,858 | $ | – | ||||||
For the quarter ended September 30, 2010, the Company's income and mining tax recovery was $1.0 million compared to $nil in the corresponding period last year. In the past, the Company built up significant corporate income tax pools and has recorded benefits such as the recovery of future income taxes resulting from the renunciation of exploration expenses related to the 2009 flow-through share offering ($1.4 million), which was offset by the mining interests timing difference expense ($0.5 million). For the nine months ended September 30, 2010, the income and mining tax recovery was $4.9 million compared to $nil in the same period in 2009, due primarily to the recovery of future income taxes created on the renunciation of exploration expenses related to the 2009 flow-through share offering ($2.7 million), recovery of future income taxes created on the expiration of warrants ($1.6 million), the recovery of a tax liability arising in respect of the Ontario harmonization transition rules ($0.3 million), and the current income tax recovery relating to Ontario in respect of its estimated resource allowance ($0.3 million).
14
3RD QUARTER REPORT 2010
Net Income
For the quarter ended September 30, 2010, the Company reported a net income of $3.2 million or $0.02 per share compared to a net loss of $6.2 million or $0.06 per share in the same period last year. For the nine months ended September 30, 2010, the Company reported a net loss of $23.0 million or $0.17 per share compared to a net loss of $15.7 million or $0.17 per share in the same period last year.
Summary of Quarterly Results
(expressed in thousands of Canadian dollars except per share amounts)
| | | | | | | | | | | ||||||||||||||||||
|---|---|---|---|---|---|---|---|---|---|---|---|---|---|---|---|---|---|---|---|---|---|---|---|---|---|---|---|
| | 2010 | 2009* | 2008 | | |||||||||||||||||||||||
| | | | | | | | | | | ||||||||||||||||||
| | Q3 | Q2 | Q1 | Q4 | Q3 | Q2 | Q1 | Q4 | | ||||||||||||||||||
| Revenue – before pricing adjustments | $ | 33,724 | $ | 21,680 | $ | 7,930 | $ | – | $ | – | $ | – | $ | – | $ | 10,151 | |||||||||||
| Pricing adjustments: | |||||||||||||||||||||||||||
| Commodities | 5,691 | (666 | ) | – | 2 | 10 | 373 | 4,229 | (7,568 | ) | |||||||||||||||||
| Foreign exchange | (964 | ) | 201 | – | (1 | ) | (9 | ) | (1,651 | ) | 1,066 | 9,357 | |||||||||||||||
| Revenue – after pricing adjustments | $ | 38,451 | $ | 21,215 | $ | 7,930 | $ | 1 | $ | 1 | $ | (1,278 | ) | $ | 5,295 | $ | 11,939 | ||||||||||
| Exploration expense | 7,008 | 6,421 | 4,165 | 4,287 | 2,623 | 3,916 | 2,408 | 4,670 | |||||||||||||||||||
| Cash provided by (used in) operations | (20,053 | ) | (18,433 | ) | (10,172 | ) | (13,097 | ) | (8,911 | ) | 11,464 | 14,455 | (16,637 | ) | |||||||||||||
| Cash provided by (used in) operations prior to changes in non-cash working capital per share2 | $ | 0.04 | $ | (0.04 | ) | $ | (0.11 | ) | $ | (0.11 | ) | $ | (0.06 | ) | $ | (0.11 | ) | $ | 0.01 | $ | (0.19 | ) | |||||
| Net income (loss) | 3,185 | (11,560 | ) | (14,624 | ) | (14,361 | ) | (6,194 | ) | (9,806 | ) | 347 | (112,419 | ) | |||||||||||||
| Net loss per share – basic and diluted | $ | 0.02 | $ | (0.08 | ) | $ | (0.11 | ) | $ | (0.11 | ) | $ | (0.06 | ) | $ | (0.11 | ) | $ | 0.00 | $ | (1.31 | ) | |||||
- *
- Certain prior period amounts have been reclassified to conform to the classification adopted in the current period.
- 2
- Non-GAAP measure. Please refer to Non-GAAP Measures on page 33.
15
3RD QUARTER REPORT 2010
FINANCIAL CONDITION, CASH FLOWS, LIQUIDITY AND CAPITAL RESOURCES
Sources and Uses of Cash
| Three months ended September 30 | Nine months ended September 30 | |||||||||||||
| 2010 | 2009 | 2010 | 2009 | |||||||||||
| Cash used in operations prior to changes in non-cash working capital | $ | 6,022 | $ | (5,846 | ) | $ | (14,069 | ) | $ | (14,669 | ) | |||
| Changes in non-cash working capital | (26,075 | ) | (3,065 | ) | (34,589 | ) | 31,677 | |||||||
| Cash provided by (used in) operations | (20,053 | ) | (8,911 | ) | (48,658 | ) | 17,008 | |||||||
| Cash provided by (used in) financing | (678 | ) | 46,443 | 92,804 | 41,921 | |||||||||
| Cash provided by (used in) investing | (14,185 | ) | (5,626 | ) | (28,787 | ) | (8,869 | ) | ||||||
| Increase (decrease) in cash and cash equivalents | $ | (34,916 | ) | $ | 31,906 | $ | 15,359 | $ | 50,060 | |||||
For the three months ended September 30, 2010, cash provided by operations prior to changes in non-cash working capital was $6.0 million, compared to cash used in operations of $5.8 million in the same period last year, an increase of $11.8 million. This increase is due primarily to the increased net income ($12.5 million) (of which depreciation and amortization represents $3.1 million), partially offset by the future income and mining tax recoveries ($1.0 million). For the nine months ended September 30, 2010, cash used in operations prior to changes in non-cash working capital was $14.1 million, compared to $14.7 million in the same period last year, an increase of $0.6 million. This increase is due primarily to the increased net income ($3.7 million) (of which depreciation and amortization represents $11.1 million), and accrued interest and accretion on advances ($0.4 million), partially offset by the future income and mining tax recoveries ($4.1 million).
For the quarter ended September 30, 2010, non-cash working capital increased by $26.1 million compared to $3.1 million in the same period last year. The $26.1 million increase is primarily due to an increase in accounts receivable ($29.9 million), other assets ($1.1 million), inventories ($0.2 million) before a depreciation adjustment ($0.1 million), and taxes receivable ($0.1 million), offset by an increase to accounts payable and accrued liabilities ($5.3 million). For the nine months ended September 30, 2010, non-cash working capital increased by $34.6 million compared to $31.7 million in the same period last year. The $34.6 million increase is due to an increase in accounts receivable ($44.3 million), other assets ($1.2 million), and taxes receivable ($0.8 million), offset by an increase in accounts payable and accrued liabilities ($11.1 million) and a decrease in inventories ($0.9 million) before a depreciation adjustment ($0.3 million).
For the quarter ending September 30, 2010, cash used in operations was $20.1 million compared to $8.9 million in the corresponding period last year. For the nine months ending September 30, 2010, cash used in operations was $48.7 million compared to cash provided by operations of $17.0 million in the corresponding period last year.
For the quarter ending September 30, 2010, financing activities used cash of $0.7 million and reflected the scheduled repayment of capital leases, compared to cash provided of $46.4 million in the corresponding period last year, the majority of which reflected the $47.4 million net proceeds received from the September 2009 equity offering. For the nine months ending September 30, 2010, financing activities provided cash of $92.8 million of which $94.3 million related to the April 2010 equity offering, offset by the scheduled repayment of capital leases of $1.5 million, compared to cash provided of $41.9 million in the corresponding period last year, the majority of which reflected the $47.4 million net proceeds received from the September 2009 equity offering. The Company's obligations under capital leases
16
3RD QUARTER REPORT 2010
increased to $2.6 million at September 30, 2010 from $1.1 million at December 31, 2009 due to new capital lease obligations of $2.9 million, offset by scheduled capital lease repayments of $1.4 million.
On April 28, 2010, the Company completed an equity offering of 20,000,000 units at a price of $5.00 per unit for total net proceeds of $94.2 million (issue costs $5.8 million), which included the exercise of an over-allotment option in the amount of 2,600,000 units at a price of $5.00 per unit. Each unit consists of one common share and one-half of one common share purchase warrant of the Company. Each whole warrant entitles the holder to purchase an additional common share at a price of $6.50, subject to adjustment, at any time prior to October 28, 2011. In the event that the weighted average closing price of the common shares on the TSX is greater than $7.50 per share for a period of 20 trading days at any time after the closing of the offering, the Company may accelerate the expiry date of the warrants by giving notice to the holders thereof and in such case the warrants will expire on the 30th day after the date on which such notice is given by the Company.
For the three and nine months ended September 30, 2010, investing activities required cash of $14.2 million and $28.8 million, respectively relating to additions to mining interests provided in the table below, offset by proceeds of disposition of $0.4 million. For the three months ended September 30, 2009, investing activities required cash of $5.6 million. For the nine months ended September 30, 2009, investing activities required cash of $8.9 million, of which $1.1 million was attributable to transaction costs associated with the acquisition of Cadiscor and $7.8 million related to additions to mining interests.
Additions to mining interests
| Three months ended September 30 | Nine months ended September 30 | ||||||||||||
| 2010 | 2009 | 2010 | 2009 | ||||||||||
| LDI palladium mine | |||||||||||||
| Offset Zone development | $ | 3,978 | $ | – | $ | 9,951 | $ | – | |||||
| Roby Zone development | 1,443 | – | 2,425 | – | |||||||||
| Offset Zone exploration costs | 1,127 | – | 1,127 | – | |||||||||
| Roby Zone exploration costs | 639 | – | 639 | – | |||||||||
| Jaw crusher | 90 | – | 1,132 | – | |||||||||
| Mill flotation redesign | 2 | – | 798 | – | |||||||||
| Tailings management facility | 227 | 24 | 524 | 152 | |||||||||
| Other equipment and betterments | 806 | 163 | 1,541 | 422 | |||||||||
| $ | 8,312 | $ | 187 | $ | 18,137 | $ | 574 | ||||||
Sleeping Giant gold mine | |||||||||||||
| Shaft deepening | $ | 1,504 | $ | – | $ | 4,162 | $ | – | |||||
| Vezza project | 3,743 | – | 3,779 | – | |||||||||
| Underground and deferred development | 892 | 3,875 | 2,406 | 5,444 | |||||||||
| Other equipment and betterments | 138 | 1,294 | 734 | 1,434 | |||||||||
| $ | 6,277 | $ | 5,169 | $ | 11,081 | $ | 6,878 | ||||||
Corporate and other | |||||||||||||
| Other equipment and betterments | $ | – | $ | 291 | $ | 4 | $ | 303 | |||||
| $ | 14,589 | $ | 5,647 | $ | 29,222 | $ | 7,755 | ||||||
In addition to the mining interests acquired by cash reflected in the above table, the Company also acquired by means of capital leases, equipment in the amount of $nil and $2.9 million for the three and nine months ending September 30, 2010. For the three and nine months ending September 30, 2010, 1,368,421 shares were issued for $6.5 million to purchase the Vezza property, in addition to $3.5 million in cash, which was added to mining interests.
17
3RD QUARTER REPORT 2010
As at September 30, 2010 the Company had cash and cash equivalents of $113.6 million compared to $98.3 million as at December 31, 2009. The funds are invested in short term interest bearing deposits at a major Canadian chartered bank.
In July, the Company obtained a $30 million operating line of credit with the Bank of Nova Scotia. The credit facility has a one year term, secured by the Company's accounts receivables and will be used for working capital liquidity and general corporate purposes. Under its smelting contract with Xstrata Nickel, NAP is entitled to receive advance payments of 70% within 60 days following the month of concentrate delivery. At September 30, 2010, both facilities are undrawn.
The cash flow from the LDI palladium mine and the Sleeping Giant gold mine, together with the Company's cash reserves and credit facilities, are expected to be sufficient to meet the Company's requirements in the near term. For the remainder of 2010, the Company intends to continue to deepen the mine shaft at the Sleeping Giant gold mine and also continue LDI's Offset Zone ramp and development. NAP will also continue spending exploration funds on its Ontario and Quebec properties.
Contractual Obligations
| As at September 30, 2010 | Payments Due by Period | |||||||||||||||
| (expressed in thousands of Canadian dollars) | Total | 1 Year | 2-3 Years | 4-5 Years | >5 Years | |||||||||||
| Capital lease obligations | $ | 2,770 | $ | 1,346 | $ | 1,395 | $ | 29 | $ | – | ||||||
| Operating leases | 3,733 | 1,681 | 867 | 675 | 510 | |||||||||||
| Purchase obligations | 31,196 | 31,196 | – | – | – | |||||||||||
| $ | 37,699 | $ | 34,223 | $ | 2,262 | $ | 704 | $ | 510 | |||||||
In addition to the above, the Company also has asset retirement obligations in the amount of $13.4 million that would become payable at the time of the closures of the LDI and Sleeping Giant mines. Deposits established by the Company to offset these future outlays amount to $10.5 million. As a result, $2.9 million of funding is required prior to closure of the mines.
Related Party Transactions
There were no related party transactions to report for the three and nine months ended September 30, 2010.
OUTSTANDING SHARE DATA
As of November 10, 2010, there were 149,191,315 common shares of the Company outstanding. In addition, there were options outstanding pursuant to the 1995 Corporate Stock Option Plan entitling holders thereof to acquire 3,048,050 common shares of the Company at a weighted average exercise price of $3.50 per share. As of the same date, there were also 19,200,000 warrants outstanding each warrant entitling the holder thereof to purchase one common share at a weighted average exercise price of $5.42 per share.
18
3RD QUARTER REPORT 2010
REVIEW OF OPERATIONS
LDI Palladium Mine
The key operating results for the LDI palladium mine are set out in the following table.
| | | | | | | |||||||
|---|---|---|---|---|---|---|---|---|---|---|---|---|
| | Three months ended September 30 | Nine months ended September 30 | | |||||||||
| | 2010 | 2009 | 2010 | 2009 | | |||||||
| Tonnes of ore milled | 198,907 | – | 401,910 | – | ||||||||
Production | ||||||||||||
| Palladium (oz) | 34,420 | – | 62,259 | – | ||||||||
| Gold (oz) | 1,408 | – | 2,526 | – | ||||||||
| Platinum (oz) | 1,830 | – | 3,103 | – | ||||||||
| Nickel (lbs) | 131,154 | – | 236,297 | – | ||||||||
| Copper (lbs) | 214,853 | – | 412,464 | – | ||||||||
| Palladium head grade (g/t) | 7.05 | – | 6.41 | – | ||||||||
| Palladium recoveries (%) | 82.1 | – | 80.9 | – | ||||||||
| Tonnes of ore mined | 225,960 | – | 405,194 | – | ||||||||
| Cost per tonne milled | $ | 69 | – | $ | 59 | – | ||||||
| Total cash cost ($USD)2 | $ | 218 | – | $ | 253 | – | ||||||
- 2
- Non-GAAP measure. Please refer to Non-GAAP Measures on page 33.
The LDI mine consists of an open pit, an operating underground mine (currently producing from the Roby Zone), and a mill with a nominal capacity of approximately 15,000 tonnes per day. The primary deposits on the property are the Roby Zone and the Offset Zone, both disseminated magmatic nickel-copper-platinum group metal ("PGM") deposits.
During the three months ended September 30, 2010, 225,960 tonnes of ore was extracted from the LDI mine, of which 220,694 tonnes came from the Roby Zone with an average palladium grade of 6.95 grams per tonne, and 5,266 tonnes of silling ore came from the Offset Zone at an average palladium grade of 9.37 grams per tonne. For the nine months ended September 30, 2010, 405,194 tonnes of ore was extracted, of which 399,928 tonnes came from the Roby Zone with an average palladium grade of 6.49 grams per tonne, and 5,266 tonnes of silling ore came from the Offset Zone at an average palladium grade of 9.37 grams per tonne. During the same comparative periods last year, no ore was extracted as the LDI mine was still on care and maintenance. Ore production from the Roby Zone at the LDI mine is operating at 2,600 tonnes per day, seven days per week, on two 12-hour shifts per day. The Company has a workforce of approximately 180 people at LDI and a new collective agreement with the United Steelworkers, effective until May 31, 2012.
The mining method for the underground mine is sublevel retreat longitudinal longhole stoping with unconsolidated rock fill. The mining block interval is 95 metres floor to floor with two sublevels in between and 20 metre sill pillars between blocks. Stopes average 60 metres in length with 7 to 10 metre-wide vertical rib pillars between stopes. Total intake ventilation for the mine is designed to be 205 cubic metres per second. There is one intake ventilation raise/secondary egress situated outside the ultimate open pit limits and air exhausts up the main ramp.
As currently envisaged, the Company will continue mining the Roby Zone for approximately two years while developing the Offset Zone with the objective of achieving a seamless changeover from mining in the Roby Zone to the Offset Zone.
19
3RD QUARTER REPORT 2010
LDI Mill
For the three months ended September 30, 2010, the LDI mill processed 198,907 tonnes of ore at an average of 6,416 tonnes per operating day, producing 34,420 ounces of payable palladium at an average palladium head grade of 7.05 grams per tonne, with a palladium recovery of 82.1%, and mill availability of 91.3%. For the nine months ended September 30, 2010, the LDI mill processed 401,910 tonnes of ore at an average of 6,654 tonnes per operating day, producing 62,259 ounces of payable palladium at an average palladium head grade of 6.41 grams per tonne, with a palladium recovery of 80.9%, and mill availability of 93.8%. During the same comparative periods last year, the LDI mill was on temporary care and maintenance. Production costs, per tonne of ore milled, were $68 and $59, respectively for the three and nine months ended September 30, 2010. The mill is operating on a batch basis, with a two-week operating and a two-week shutdown schedule.
For the quarter ended September 30, 2010, the Company incurred capital costs relating to the mill of $0.2 million, which included the jaw crusher ($0.1 million), and other equipment and betterments ($0.1 million). For the nine months ended September 30, 2010, the Company incurred capital costs relating to the mill of $2.3 million, which included the jaw crusher ($1.1 million), mill flotation redesign ($0.8 million), and other equipment and betterments ($0.4 million).
LDI Mine Expansion Project Update
The Company engaged P&E Mining Consultants Ltd. ("P&E"), Nordmin Engineering ("Nordmin"), Xstrata Processing Support ("XPS"), and Scott Wilson Roscoe Postle Associates Inc. ("Scott Wilson RPA") to prepare a Preliminary Economic Assessment ("Scoping Study") on the development of the Offset Zone. On August 16, 2010, NAP announced its mine expansion plans were supported by a positive Scoping Study on the Offset Zone. Based on the work done with P&E, and recent exploration success, the Company believes that the most efficient way to mine the Offset Zone is by way of shaft access, with a capacity of approximately 5,500 tonnes or more per day. The mining method to be utilized is called "Super Shrinkage", a high volume bulk mining method similar to that used by Agnico-Eagle Limited at their Goldex mine in Quebec. This method increases the overall upfront capital requirements but is expected to significantly reduce the operating costs compared to other mining methods (to around $132 per ounce according to the Scoping Study), while allowing the Company to nearly double its production to over 250,000 ounces per year.
To reach commercial production from the Offset Zone by the third quarter of 2012, NAP intends to raisebore a shaft to surface from the 4,815 level and subsequently sink the shaft to the bottom 4,180 level. Commercial production is targeted at a mining rate of 3,500 tonnes per day, and is expected to increase to 5,500 tonnes per day in the fourth quarter of 2014.
Development work for the mine expansion is well underway and is currently progressing on NAP's projected timeline. The extension of the exploration ramp is approaching the 4800 level and raiseboring is scheduled to start in early 2011.
Detailed engineering of the surface hoisting plant and production shaft was initiated in May 2010 and is on schedule to be completed by the end of the year.
Execution risk is mitigated due to the fact that this is essentially a mine expansion, with a mill, tailings management facility, infrastructure and permits already in place. Timing risk has been substantially diminished as the Company has already purchased the production, sinking and service cage hoists that are critical to the project. During the quarter, the Company awarded the raiseboring contract for the shaft to Redpath Mining and to Cementation Inc. for raiseboring the ventilation raise.
NAP hired a very seasoned project management group with significant underground development experience from some of the industry's leading contractors. This team is responsible for all aspects of the Offset Zone development which includes leading the major construction components of the project as well as providing technical support to the contractors. All senior positions of the project team have been hired and the project group is onsite at LDI.
20
3RD QUARTER REPORT 2010
Sleeping Giant Gold Mine
The key operating results for the Sleeping Giant gold mine are set out in the following table.
| | | | | | | ||||||
|---|---|---|---|---|---|---|---|---|---|---|---|
| | Three months ended September 30 | Nine months ended September 30 | | ||||||||
| | 2010 | 2009 | 2010 | 2009 | | ||||||
| Tonnes of ore milled | 21,645 | – | 71,546 | – | |||||||
Production | |||||||||||
| Gold (oz) | 3,879 | – | 12,979 | – | |||||||
| Gold head grade (g/t) | 5.84 | – | 5.54 | – | |||||||
| Gold recoveries (%) | 95.5 | – | 95.4 | – | |||||||
| Tonnes of ore hoisted | 22,494 | – | 73,076 | – | |||||||
| Cost per tonne milled | $ | 312 | – | $ | 326 | – | |||||
| Total cash cost ($USD)2 | $ | 1,660 | – | $ | 1,527 | – | |||||
- 2
- Non-GAAP measure. Please refer to Non-GAAP Measures on page 33.
The Sleeping Giant gold mine consists of an underground mine and a mill with a capacity of 900 tonnes per operating day. For the quarter ended September 30, 2010, 22,494 tonnes of ore was hoisted from the underground mine with an average gold grade of 5.84 grams per tonne. For the nine months ended September 30, 2010, 73,076 tonnes of ore was hoisted from the underground mine with an average gold grade of 5.54 grams per tonne.
Since commencing operations at the Sleeping Giant mine, mining activities have been confined to zones mined by the previous owner. The ramp up to steady-state production in these zones has proceeded at a slower pace than expected as the tonnes and grade were not in line with initial expectations. New higher grade zones are currently under development in preparation for 2011 production, which will be accessible once the 200 metre shaft deepening and lateral development are completed. The Company's original mine plan was based on a technical report with wider drill spacing, which in consideration of the mine's geology, caused some of the challenges in accessing the higher grades.
A long-term solution is expected in the second quarter of 2011, once the Company's development team has completed a 200-metre shaft deepening and lateral development. This will allow the Company to access new stopes in zones that have historically provided good tonnage and higher grade feed for the mill.
For the balance of 2010, a number of measures have been implemented to manage the ramp-up issues. Tighter infill drilling is now being conducted to better manage grade control issues and shrinkage and long-hole stopes are being favoured over room and pillar stopes due to the greater certainty over grade and tonnage recovered. The Company will continue to adjust its mine plan and methods in order to optimize operations.
The Sleeping Giant gold mine was in production from 1988 to 1991 and from 1993 to September 2008, when it was placed on care and maintenance by its previous owner. Historically, cumulative production at the mine was approximately 960,000 ounces of gold over 20 years at an average grade of approximately 11.44 grams per tonne gold.
The mine is accessed by a four-compartment production shaft with a total depth of 1,053 metres. Levels are spaced at 45 metres from surface to a depth of 235 metres, and from there to a depth of 975 metres are spaced at 60 metres. The exploration shaft and various raises allow all portions of the mine to be ventilated with fresh air. An ore pass and a waste pass allow material to be handled and raised to the surface. The deepest working level of the mine is presently 975 metres. The mine uses 3 and 5 tonne electric locomotives and rail cars.
21
3RD QUARTER REPORT 2010
Sleeping Giant Mill
For the quarter ended September 30, 2010, the mill processed 21,645 tonnes of ore, producing 3,879 ounces of gold at an average gold head grade of 5.84 grams per tonne, with a gold recovery of 95.5% and mill availability of 96.7%. For the nine months ended September 30, 2010, the mill processed 71,546 tonnes of ore, producing 12,979 ounces of gold at an average gold head grade of 5.54 grams per tonne, with a gold recovery of 95.4% and mill availability of 97.6%. Higher head grades are anticipated once the mine achieves steady-state production levels. Production costs per tonne of ore milled were $312 and $326, respectively for the three and nine months ended September 30, 2010.
At September 30, 2010, the mill contained approximately 1,453 ounces of gold that was included in inventory and valued at net realizable value, as it had not been sold by the end of the period. This gold is in solution and will be recovered if the mine experiences an extended shutdown.
The Sleeping Giant mill has a rated capacity of 900 tonnes per day and was operating at approximately 722 and 779 tonnes per operating day, respectively for the three and nine months ended September 30, 2010.
At steady-state production, the mill will only be operating at 71% capacity. The Company is currently completing a mill expansion study as the Company believes that its other gold assets (which are within trucking distance of the Sleeping Giant mill) have the potential to exceed current mill capacity.
EXPLORATION UPDATE
Offset Zone
The Offset Zone of the LDI property was discovered by the Company's exploration team in 2001. The Offset Zone is currently considered to be the fault-displaced continuation of the Roby Zone mineralization and is located below and approximately 250 meters to the southwest of the Roby Zone. On May 27, 2010, NAP published an updated mineral resource estimate by RPA that included the results of drilling completed in 2009. RPA concluded that the Offset Zone still remains open along strike to the north, south and at depth. The resource estimate also increased the palladium indicated resources grade in the Offset Zone by 25%, from 5.02 grams per tonne (the last published resource grade in March 2009) to 6.29 grams per tonne.
Based on work done up to the end of 2009, the estimated mineral resources of the Offset Zone are as follows:
| | Tonnes (millions) | Pd g/t | Pt g/t | Au g/t | Ni % | Cu % | Pd (000 oz) | | |||||||
|---|---|---|---|---|---|---|---|---|---|---|---|---|---|---|---|
| Category | | ||||||||||||||
| Indicated | 8.628 | 6.29 | 0.419 | 0.395 | 0.136 | 0.110 | 1,745 | ||||||||
| Inferred | 3.322 | 5.70 | 0.352 | 0.233 | 0.095 | 0.074 | 609 | ||||||||
The mineral resource calculation uses a minimum 4 grams per tonne palladium resource block cut-off.
It should be noted that the updated resource for the Offset Zone does not include drilling data from the Cowboy and Outlaw zones, as there was insufficient drill data at the time for a resource estimate. An NI 43-101 Technical Report, to be prepared by RPA, will include an updated reserve and resource estimate for the Roby Zone at LDI, and will be available in the fourth quarter of 2010.
During the third quarter of 2010, the Company continued its program of surface directional drilling with two rigs. The purpose of the drilling program is to intersect the Offset Zone between elevation 4500 and 4650, in order to increase the quality of the resource definition at these levels and eventually deeper, later in the year. Underground drilling also continued for infilling to complete the 30 metre grid on the upper part of the Offset Zone.
22
3RD QUARTER REPORT 2010
On June 7, 2010, the Company issued a press release regarding the results of the exploration drilling on the Offset and Roby zones on which four drills have completed 63 holes totaling 20,500 meters, of which:
- •
- 26 holes (5,485 meters) were completed from underground on the extension of the Roby Zone; and
- •
- 37 holes (15,015 metres) were completed on the Offset Zone including:
- (i)
- underground on the upward extension of the Upper Offset Zone (mine elevation 4900 and higher);
- (ii)
- on the central Offset Zone to complete the previous drilling pattern and to follow its northern extension; and
- (iii)
- from surface with directional drilling, with the first deep holes into the lower Offset Zone (mine elevation 4650 and lower).
Results were positive and they expanded the Offset and Roby zones, which are still open laterally and at depth. The Offset Zone was drilled toward surface with mineralization intersected up to the 4950 level. Additional drilling is continuing on the Offset and Roby zones and an update on the exploration results will be provided before the end of the year.
On August 16, 2010, NAP announced a positive Scoping Study on the Offset Zone. Effective as of that date, the Company commenced capitalizing Offset Zone exploration costs.
Cowboy Zone and Outlaw Zone
The Cowboy Zone is located 30 to 60 metres to the west of the Offset Zone and was discovered in 2009 during infill drilling of the Offset Zone. This new discovery has the potential to extend the life of the LDI mine and could potentially favourably impact the economics of the mine. The first phase of the drilling campaign indicated that the Cowboy Zone extends for up to 250 metres along strike and 300 metres down dip. The assay results from the Phase 2 drilling extended the limit of the Cowboy Zone 50 metres farther to the north for a total strike length of 300 metres. The Outlaw Zone was intersected to the west of the Cowboy Zone and further drilling is required to explore the vertical and lateral limit of this mineralization. Additional infill drilling will be needed before resource calculations can be completed on the Cowboy and Outlaw zones. With the development of the ramp into the Offset Zone, drilling platforms will be established along this ramp to facilitate further exploration drilling of the Cowboy and Outlaw zones.
Lac Legris Property
During the second quarter of 2010, the Company signed an Option and Purchase Agreement with prospectors pursuant to which the Company can acquire a 100% interest in the Lac Legris property in exchange for cash payments totaling $0.3 million, advance royalty payments totaling $0.1 million, and royalties of 2.5% NSR. A portion of the royalty can be purchased by the Company and the Company has a right of first refusal on the sale of the royalties.
The property is adjacent to the south east portion of the Company's LDI property and is comprised of 15 claims and covering an area of approximately 4,297 hectares. The property is underlain by mafic and ultramafic rocks and was optioned for its PGE potential. The property is at a preliminary exploration stage and surface mapping, trenching and sampling started in the third quarter of 2010, with diamond drilling scheduled in the fourth quarter of 2010.
Sleeping Giant Gold Mine
The main focus of the drilling program that was conducted in the latter half of 2009 at Sleeping Giant was to demonstrate the potential to further extend the mine life. The extensional drill program resulted in additional resources both below and adjacent to the current mine workings, including an extension of the 30 West zone and the 3 zone. In 2010, the Company commenced an ongoing 30,000 metres of extensional underground drilling at a cost of approximately $2.1 million with the objective of extending the mine life further by identifying new resources and converting mineral resources to mineral reserves.
23
3RD QUARTER REPORT 2010
Vezza Gold Property
The Company recently acquired the Vezza gold property from Agnico-Eagle Mines Limited ("AEM"), for consideration of $10 million. Vezza is an advanced-stage exploration project in close proximity to the Sleeping Giant mill. The project is estimated to have 288,000 contained ounces of gold in the measured and indicated categories (1,517,000 tonnes grading 5.9 grams per tonne gold) and an additional 121,000 contained gold ounces in the inferred category (754,000 tonnes grading 5.0 grams per tonne gold) (RPA 43-101 report, dated February 23, 2010). The deposit was subject to extensive surface and underground exploration and development from 1995 to 1998 by AEM. The Company is in the permitting process to have the shaft and underground drifts dewatered in order to conduct underground diamond drilling. Surface drilling started in the third quarter and will continue in the fourth quarter of 2010.
Discovery Property
At the end of 2009, the Company filed an environmental impact study for the Discovery project and applied for a mining lease to continue to advance the property toward a future underground exploration program. The permitting process continues and the Company now expects to finalize the process during the first quarter of 2011.
A 4,200-metre surface drilling program on the 1200E sector of the property was started in the second quarter of 2010 in order to expand the gold zones intersected in 2008. The program will continue into the fourth quarter of this year.
Flordin Property
The Flordin property is approximately 40 kilometres north of the town of Lebel-sur-Quévillon, Quebec, in close proximity to NAP's Discovery project and within trucking distance of the Sleeping Giant mill. Preliminary exploration drilling in 2008 intersected several mineralized zones, expanding the known dimensions of the mineralized area. InnovExplo Inc. was contracted in 2009 to prepare a NI 43-101 resource estimate on the property. The presence of several parallel gold veins near surface led to consideration of possible open pit mining scenarios. Using a 2 gram per tonne gold cut-off, the NI 43-101 report estimates that the property contains 679,000 tonnes of measured and indicated resources at an average grade of 4.25 grams per tonne gold for 92,814 contained ounces and an additional inferred resource of 1,451,400 tonnes grading 3.63 grams per tonne gold for a total of 169,261 contained ounces.
In the second quarter of 2010, NAP commenced a 10,000 metre infill drill campaign to upgrade the resource classification. The drilling campaign will continue until the end of 2010. The Company believes that the Flordin gold property could have the potential to provide additional feed for the underutilized Sleeping Giant mill.
Cameron Shear and Florence Properties
The Company has an option to earn a 50% interest in the Cameron Shear property, which is currently 100% owned by Canadian Royalties Inc. Florence is a small 100% Cadiscor-owned property that is located north and adjacent to the Cameron Shear property. These properties are adjacent and to the east of the Discovery gold deposit. A 5,000 metre drill program started in the third quarter of 2010 and will continue until the end of the year.
Dormex Property
In the third quarter of 2010, the Company continued its surface exploration program at the Dormex property, which surrounds the Sleeping Giant gold mine, combining geophysical surveys, reverse circulation drilling of the overburden and diamond drilling.
Laflamme Gold Property
During the third quarter of 2009, the Company entered into an option and joint venture agreement with Midland Exploration Inc. ("Midland") to earn an initial 50% interest in the Laflamme gold property. Strategically located between the Company's Sleeping Giant gold mine and the Comtois gold deposit in Quebec's Abitibi region, the Laflamme gold property consists of 410 claims covering a surface area of approximately 220 square kilometres west of Lebel-sur-Quevillon. Laflamme offers excellent potential for gold mineralization. A recent study conducted by the Ministère des Ressources naturelles et de la Faune du Québec has identified a list of gold-bearing targets in major
24
3RD QUARTER REPORT 2010
structures that appear on the property. The Laflamme property stretches 20 to 60 kilometres east of the Sleeping Giant mine. In the fourth quarter of 2009, the company conducted an electro-magnetic aerial survey over the property in order to identify exploration targets. The survey results were analyzed during the first quarter of 2010. A number of targets were identified and line-cutting and ground geophysical surveys were initiated in the second quarter of 2010. A 4,000 metre drilling campaign on the anomalies started in early in the fourth quarter of 2010, following the interpretation of the ground geophysical surveys.
Shebandowan Property
The Company holds a 50% interest in the former producing Shebandowan mine and the surrounding Haines and Conacher properties pursuant to an Option and Joint Venture Agreement with Vale Inco Limited ("Vale"). The properties, known as the Shebandowan property, contain a series of nickel-copper-PGM mineralized bodies. The land package, which totals approximately 7,842 hectares, is located 90 kilometres west of Thunder Bay, Ontario, and approximately 100 kilometres southwest from the Company's LDI mine. Vale retains an option to increase its interest from 50% to 60%, exercisable in the event that a feasibility study on the property results in a mineral reserve and mineral resource estimate of the equivalent of 200 million pounds of nickel and other metals.
The Company and Vale conducted a large ground geophysical survey on the property in the first quarter of 2010. Preliminary results support further exploration work on the property and the parties have approved an 8-hole, 3,000 meters drilling program that started in the third quarter of 2010. The program will be completed by the end of the year. Nickel and copper mineralization containing PGEs are targeted.
FUTURE ACCOUNTING STANDARDS
Impact of International Financial Reporting Standards ("IFRS")
In February 2008, the CICA Accounting Standards Board ("AcSB") confirmed that Canadian GAAP for publicly accountable enterprises will be converged with IFRS effective in calendar year 2011, with early adoption allowed starting in calendar year 2009. The Company is required to adopt IFRS for the reporting of its interim and annual financial statements beginning on January 1, 2011. IFRS uses a conceptual framework similar to Canadian GAAP, but there are significant differences in recognition, measurement and disclosures.
The adoption of IFRS will make it possible for the Company to re-assess the fair values of assets and liabilities on its balance sheet under IFRS 1, which could impact the balance sheet significantly. Within IFRS 1 there are exemptions, some of which are mandatory and some of which are elective. The exemptions provide relief for companies from certain requirements in specified areas when the cost of complying with the requirements is likely to exceed the resulting benefit to users of financial statements. IFRS 1 generally requires retrospective application of IFRSs on first-time adoption, but prohibits such application in some areas, particularly when retrospective application would require judgments by management about past conditions after the outcome of a particular transaction is already known.
An effective conversion to IFRS requires that the Company address issues pertaining to various elements. These elements include financial reporting expertise, accounting policies, internal controls over financial reporting ("ICFR") and disclosure controls and procedures ("DC&P"), business activities, and consideration of the Company's information systems.
Financial Reporting Expertise
The Company is committed to ensuring that its board, management and employees possess the appropriate technical training to facilitate a smooth transition to IFRS. In preparation for the transition to IFRS, key members of the IFRS project team attended various seminars and information sessions and reviewed IFRS standards with a focus on identifying existing and emerging issues relating to the conversion to IFRS and ensuring their inclusion in the
25
3RD QUARTER REPORT 2010
Company's preliminary conversion project scoping analysis. Based on the transition issues identified, the Company's IFRS project team has performed an evaluation of the impact of the adoption of IFRS on its consolidated financial statements, including the optional exemptions which may be elected by the Company under IFRS 1, the transitional standard addressing initial adoption of IFRS.
During 2009, key management personnel attended various seminars and information sessions regarding IFRS standards and related transition issues and held informal discussions with key operational and IT personnel regarding the pending changes under IFRS. Management has consulted with its external auditors regarding the evaluation of its readiness for conversion and the identification of key IFRS issues and has utilized various external resources to identify and obtain appropriate sources of IFRS guidance.
Information and update sessions were held with members of the Board of Directors (including Audit Committee members) both in 2009 and in each of the three quarters of 2010. At these information sessions, management and external consultants provided an overview of the project timeline and potential transition issues, IFRS standards and developments affecting the Company, and identified impacts on the financial statements of the Company.
Management has and will continue to monitor developments under IFRS and provide quarterly updates to the Audit Committee regarding the project status, IFRS standards, proposed policy changes, and financial impacts on balances previously reported under Canadian GAAP.
A) Accounting Policies
During the conversion project, the Company has compared and evaluated the impacts of IFRS standards on its operations in comparison to those standards presently applied under Canadian GAAP. To transition to IFRS, the Company must apply "IFRS 1 – First Time Adoption of IFRS" that sets out the rules for first time adoption. In general, IFRS 1 requires an entity to comply with each IFRS effective at the reporting date for the entity's first IFRS financial statements. This requires that an entity apply IFRS to its opening IFRS balance sheet as at January 1, 2010 (i.e. the balance sheet prepared at the beginning of the earliest comparative period presented in the entity's first IFRS financial statements).
The Company has determined that the IFRS 1 exemptions which are likely to be elected by the Company at the time of transition to IFRS on January 1, 2010 are those related to: business combinations; share-based payment transactions; leases; investments in subsidiaries, jointly controlled entities and associates; compound financial instruments; and decommissioning liabilities included in the cost of property, plant and equipment. The IFRS 1 elections relating to insurance contracts and assets and liabilities of subsidiaries, associates and joint ventures will not likely apply to the Company as it does not hold any insurance contracts and both the Company and its subsidiaries will transition to and adopt IFRS concurrently. In addition, IFRS 1 elections relating to fair value as deemed cost or cumulative translation differences are not expected to be applied. The Company is currently completing its review of the applicability of remaining IFRS 1 elections and will continue to review the impacts of amendments to IFRS standards regarding its present position relating to the above elections prior to the adoption of IFRS on January 1, 2011.
In addition to the identification of IFRS 1 elections, the Company has identified potential transition differences existing between Canadian GAAP and IFRS standards which may exist at January 1, 2010. However, in the period leading up to the transition to IFRS, the AcSB has issued Canadian accounting standards that are converged with IFRS standards such as IAS 2 (Inventories), IAS 16 (Capital Assets), IAS 38 (Intangible assets), and IFRS 9 (formerly IAS 32 and IAS 39) relating to the presentation, reporting and disclosure of financial instruments. This convergence has mitigated the impact of adopting IFRS at the mandatory transition date.
The following discussion outlines details of the accounting policies the Company currently expects to apply and management's preliminary estimates of the adjustments to results reported within the consolidated financial
26
3RD QUARTER REPORT 2010
statements under Canadian GAAP at the January 1, 2010 date of transition to IFRS. The Company may choose to adopt different IFRS accounting policies, or choose to apply them only to certain transactions or circumstances in the period leading up to the final conversion to IFRS in 2011. As a result, the final transition adjustments upon conversion to IFRS may differ materially from management's current estimates.
Furthermore, the standard-setting bodies that determine IFRS have significant ongoing projects that could affect the ultimate differences between Canadian GAAP and IFRS, and their impact on the Company's consolidated financial statements. The impact IFRS has in future years will also depend on circumstances at the time.
Functional Currency
Based upon the application of IAS 21 (The Effects of Changes in Foreign Exchange Rates), the Company has determined that the Canadian dollar appropriately represents both its functional and reporting currency for the purposes of reporting under IFRS. Since this is consistent with the methodology presently applied under Canadian GAAP, no additional translation adjustments are expected as a result of the adoption of IFRS.
Mining Interests and Depreciation and Amortization
Although certain aspects of the standards under Canadian GAAP are converged with IFRS, differences still exist primarily with regards to the determination of impairment of assets under IAS 36. Under IFRS, the Company is required to identify cash generating units ("CGU's") independently for each of its consolidated entities. These CGU's represent the smallest group of assets which are capable of generating cash independently from other assets held by the Company. Specific distinction of such asset groupings is not presently applied under Canadian GAAP. As a result, management is in the process of reviewing its preliminary determinations of such groupings.
In determining whether impairment exists under Canadian GAAP, the Company performs a two-step approach that compares the net book value of assets to the undiscounted and discounted expected future cash flows from operations. Under IFRS, a one-step approach is used by which the determination of impairments require the comparison of the net book value of each of the CGU's to the recoverable amount of the CGU. The recoverable amount is determined as the higher of the fair value of the expected future cash flows from that CGU, less costs to sell ("Fair Value Less Cost to Sell") and the "Value in Use".
Under Canadian GAAP, any impairment assessed is not reversed. Under IFRS, impairments assessed must be reversed in subsequent periods should economic conditions recover.
Management has performed a preliminary analysis of the potential impact of the application of these IFRS standards on its reported mining interest balances. In accordance with IFRS 1, the Company may elect to measure certain property, plant and equipment at the date of transition to IFRSs at fair value and deem that fair value to be the cost of those assets at that date. The fair value of property, plant and equipment may be based on a previous GAAP revaluation at, or before, the date of transition to IFRSs.
Under Canadian GAAP, the carrying value of the mineral properties and fixed assets at LDI were previously impaired and were written down to fair value at December 31, 2008. In addition, the Sleeping Giant mine was acquired in 2009 and was included on the books at fair value on the date of acquisition. Based on its analysis, the Company expects to apply the IFRS 1 election on transition to IFRS to use the Canadian GAAP impaired and acquisition amounts as the deemed cost for the mineral properties and fixed assets for each mine respectively. Therefore, no adjustment is expected on transition to IFRS on January 1, 2010 as no further impairments were identified subsequent to the fair value dates for each property.
27
3RD QUARTER REPORT 2010
Financial Instruments
Although the allocation of fair values between the debt and equity components of compound financial instruments issued by the Company is performed differently under IAS 32, Financial Instruments Presentation, from the pro-rata method applied under Canadian GAAP, the measurement of the fair values of such instruments does not differ materially.
The Company is evaluating the decision to make the election available to it under IFRS 1 relating to compound financial instruments. Application of this election would eliminate the need to recognize transition variances relating to those debt instruments fully repaid prior to the January 1, 2010 transition date. As a result, only outstanding debt instruments and compound instruments denominated in foreign currencies would require retrospective restatement to comply with the standards within IAS 32 at the time of transition to IFRS on January 1, 2010.
The adoption of IAS 32 will result in material reallocations of balances within the Company's debt and equity accounts. It is the Company's preliminary assessment that, since a majority of the Company's debt and foreign denominated equity instruments matured prior to January 1, 2010, the impact of the adoption of IAS 32 will be limited primarily to the convertible notes and related embedded derivatives issued by the Company in 2006.
The convertible notes were comprised of two tranches, each consisting of notes payable, warrants, and an equity conversion option. Under Canadian GAAP, the notes were reflected as liabilities and the remaining instruments were classified as equity. Under IAS 32, since all components of the convertible notes were denominated in U.S. dollars and the notes and warrants were not issued pro-rata to all holders of its common shares, all components of this financial instrument are classified as liabilities. Since the warrants relating to the convertible notes did not mature until March and June of 2010, the IFRS 1 exemption cannot be used by the Company.
As a result, the following transitional adjustments are expected: $12.3 million recognized in contributed surplus due to non-exercise of the conversion options and $8.0 million attributed to warrant values under Canadian GAAP will be reallocated to retained earnings to reflect the gain which would have been recognized on the expiration of the liability under IFRS, with the exception of a nominal liability value of $0.1 million attributable to the outstanding fair value of the warrants at January 1, 2010.
Management is presently reviewing recent and proposed amendments to IFRS standards relating to financial instruments (IAS 32, 39, IFRS 7 and the future standard IFRS 9) which may further impact the adjustments required for conversion to IFRS. Therefore, the Company's determination of the financial impact of the final transition adjustments will be subject to its ongoing review of these amendments to IFRS standards.
Share-Based Payment Transactions
The Company has identified differences relating to the measurement of share-based payments under IFRS 2 relating to the Company's stock compensation plans. The differences between Canadian GAAP and IFRS primarily relates to the measurement of stock compensation expense relating to the Company's stock option plan and the valuation of restricted share units ("RSU") liabilities at each reporting date.
Under Canadian GAAP, stock compensation expense can be calculated on a straight-line depreciation method over the respective vesting period for each stock option. Under IFRS, stock compensation expense is recognized on a graduated method over the vesting period and a provision is generally applied against the recognized expense based on the historical rate of non-vesting of options.
Under Canadian GAAP, the fair value assigned to the liability of outstanding RSU's is the value of the Company's share price at each reporting date. Under IFRS, the fair value of the RSU liability at each reporting date is calculated to also include the intrinsic value of the underlying option of the holder to elect the timing of payment
28
3RD QUARTER REPORT 2010
of the liability. As a result, under IFRS, the Company's determination of the fair value of each RSU at each reporting date will now also recognize the incremental value attributable to the volatility of the share price over the remaining term of each RSU. Management presently expects to utilize the Black-Scholes model to determine the option value contained in each RSU.
The Company's election under IFRS 1 relating to share-based payments will restrict the adjustments relating to the measurement of such equity instruments to only those instruments granted after November 7, 2002 and which have not vested at the date of transition of January 1, 2010.
Management's preliminary analysis suggests that the adoption of the provisions for stock options under IFRS 2 will result in the additional recognition of approximately $0.5 million in compensation expense (increase in deficit) as compared to Canadian GAAP with an equivalent increase in stock options being reflected on the Company's consolidated balance sheet at the January 1, 2010 transition date. The revaluation of the Company's outstanding RSU's in accordance with IFRS 2 is expected to result in an increase in liabilities and deficit by an additional $0.3 million at January 1, 2010.
Mine Reclamation Obligations
The measurement of decommissioning liabilities and related balances included in the cost of property, plant and equipment in accordance with IAS 37 – Provisions, Contingent Liabilities and Contingent Assets differs from that applied by the Company under Canadian GAAP. An election by the Company under IFRS 1 would permit the measurement of these amounts as at January 1, 2010 with prospective application of IFRS standards subsequent to that date.
The methodology and assumptions used to determine the fair value of the Company's mine reclamation obligations at January 1, 2010 differ between Canadian GAAP and IFRS (IAS 37). Management's preliminary analysis estimated that an increase of approximately $0.7 million could be required to the obligation at January 1, 2010 under IFRS with a corresponding increase allocated between the mine reclamation assets and the accretion charges recognized through the Company's deficit.
In addition, under Canadian GAAP, certain of the mine reclamation assets held by the Company have been fully amortized. Under the application of the IFRS 1 election, the accumulated depreciation and amortization is recalculated by applying the appropriate depreciation rates to the restated mine reclamation asset value. It is expected that, this methodology will result in the reversal of depreciation and amortization recognized under Canadian GAAP in excess of $1 million. However, final estimates are contingent upon management's completion of the analysis of mining interests as previously discussed.
The Company is continuing to evaluate the potential impact of existing IFRS standards and proposed amendments to those standards on its reported mine reclamation obligation balances under IFRS. As a result of ongoing analyses and the potential amendments proposed to key IFRS standards, the specific impact that revisions to management's estimates will have upon the reporting and disclosures within the Company's financial statements cannot be effectively determined at this time.
Flow-Through Shares
The Company is presently reviewing its accounting policies relating to flow-through shares. Under Canadian GAAP, the accounting treatment of flow-through shares is addressed by Emerging Issues Committee (EIC) 146, Flow-Through Shares. Under IFRS, IAS 12, Income Taxes, contains no specific guidance on the appropriate accounting for flow-through shares. Therefore, entities are required to apply judgment in developing an appropriate model accounting policy based on the principles of IFRS standards.
29
3RD QUARTER REPORT 2010
SIC Interpretation 25, Income Taxes – Changes in the Tax Status of an Entity or its Shareholders, provides some additional guidance in that it requires that the current and deferred tax consequences of a change in tax status shall be included in profit or loss for the period, unless those consequences relate to transactions and events that result in a direct credit to the recognized amount of equity. The portion of tax liabilities or assets related to such recognized equity amounts which is not included in profit or loss must be charged or credited directly to equity. The Company's initial review of the above IFRS guidance and consultation with external sources, suggest that an approach similar to that applied under U.S. GAAP may be more appropriate.
Under Canadian GAAP, proceeds received from the issue of flow-through shares are included in the value of the Company's common share capital. The subsequent renunciation of tax deductions by the Company results in the recognition of a future tax liability and an equivalent charge is applied to reduce common share capital. Under U.S. GAAP, the fair value of the common shares issued is added to share capital with any excess of proceeds over the market value of the common shares being recorded as a liability. At the time of renunciations by the Company, the subsequent increases in future tax liabilities realized in excess of the initial amounts are expensed in the period of renunciation. As a result, the renunciation of tax deductions to holders of flow-through shares is treated as a future tax expense rather than as a cost of issuing equity as required by Canadian GAAP.
Based on the Company's U.S. GAAP filings, it is estimated that the above adjustments will result in an increase in share capital and deficit of approximately $1.8 million relating to flow-through shares settled prior to 2009 and an increase in accounts payable and a reduction of share capital of approximately $2 million relating to flow-through shares issued in 2009.
Management does not anticipate any material changes to its policies and procedures due to the adoption of IFRS standards for flow-through shares since it presently applies such policies and procedures through its requirement to determine and report the treatment for flow-through shares under both Canadian and U.S. GAAP.
Revenue Recognition
Revenue from the sale of palladium and by-product metals from the LDI mine is provisionally recognized based on forward pricing upon delivery of the concentrate to the smelter. Revenue from the sale of gold is recognized upon value date, which is when title transfers and the rights and obligations of ownership pass.
Since each of the above methods of revenue recognition are supported by IAS 18, and the Company recognizes revenues separately for each of the metals contained in the concentrate and doré bars, management's initial review of IAS 18 (Revenue) did not identify any significant issues which would require a material change to the Company's existing revenue recognition policies at the IFRS transition date.
Leases
Canadian GAAP and IFRS are similar standards in that they both require an entity to make a classification of leases based on whether substantially all of the benefits and risks of ownership have been transferred to the lessee. However, there are differences in how to classify leases and the terminology used in each standard.
The reporting of a lease agreement under Canadian GAAP is based upon its classification as either a capital or operating lease. This classification utilizes a specific set of quantitative criteria in the decision-making process. Although the classification under Canadian GAAP is not strictly a quantitative threshold, generally in practice these have been interpreted as bright line tests.
Under IAS 17 (Leases), no such quantitative thresholds are provided and guidance is based more on examples in which transfers of substantially all the risks and rewards incidental to ownership of an asset may exist. As a result, more judgment is required by Canadian entities when determining the classification of a lease arrangement rather than just meeting the quantitative threshold.
30
3RD QUARTER REPORT 2010
Management is reviewing its outstanding lease obligations to ensure whether the classifications applied under Canadian GAAP are appropriate for use under IFRS.
Income Taxes
Similar to Canadian GAAP, deferred tax assets and liabilities are recognized under IFRS based on temporary timing differences between the carrying value of assets and liabilities for accounting purposes and the respective value assigned to those assets and liabilities for tax purposes. As a result, the Company will need to recognize the corresponding increase or decrease in its reported tax asset or liability at the January 1, 2010 IFRS transition date based on the resultant differences between the restated carrying value of assets and liabilities under IFRS and their associated tax bases.
B) ICFR and DC&P
Management has continually evaluated the impact of the adoption of IFRS on the reporting and disclosure processes of the Company. Throughout the conversion project, management has made those modifications to its data analysis, information systems, and reporting processes that were required to incorporate the collection of information necessary under IFRS.
As a result of the convergence of Canadian GAAP with IFRS standards, the Company has not presently incorporated any material changes to its ICFR or DC&P during the course of its conversion project. Most changes to the Company's internal controls were already incorporated incrementally over time as a result of the Company's adoption of the converged standards.
In conjunction with the analysis of the Company's January 1, 2010 opening balances under IFRS, management has implemented changes to certain of its internal reports and data analysis to facilitate the appropriate collection of data for IFRS reporting purposes. The changes were implemented in parallel to existing reporting and appropriately reconciled to previously reported totals to ensure the completeness and accuracy of the revised reports and analyses. Since these changes represented only a component part of the reporting process, no material changes to the Company's internal controls have been specifically required as a result of these modifications.
As the ongoing review of accounting policies and procedures is completed prior to the adoption of IFRS, the Company will develop or appropriately modify its policies to ensure the integrity of its internal controls. Any material changes will be communicated quarterly within the internal control discussion contained in the MD&A.
C) Business Activities
The conversion to IFRS may result in certain consequences which are dependent upon how certain business activities are approached, monitored, or concluded by the Company. Consideration of such issues as foreign currency, hedging activities, debt covenants, compensation arrangements, and risk management practices may be required.
Whereas foreign currency considerations, compensation arrangements, and risk management issues are addressed by the Company on a regular basis, at January 1, 2010, the Company did not have any outstanding debt, with the exception of certain capital leases, and no hedging activities or contracts existed. Management will continue to monitor the impact of IFRS upon its current and future business activities.
D) Information Systems
In order to facilitate the compilation of information required for IFRS reporting and disclosures, management has made appropriate modifications to its information gathering and analysis procedures. However, no material
31
3RD QUARTER REPORT 2010
changes to the Company's existing accounting systems have been required at present. Those changes which have been implemented generally required minor changes to reports or data analysis to ensure that additional information required for disclosures under IFRS which were not currently collected under Canadian GAAP were appropriately tracked for IFRS reporting purposes.
The Company is presently reviewing its preliminary analyses regarding the adoption of IFRS standards. Based on this review, management will prepare its final recommendations to the Audit Committee and quantify the financial impact upon the opening balance sheet at January 1, 2010.
During the three months ended September 30, 2010, management documented its position and prepared initial estimates of the quantitative impacts of the identified differences for review by its external auditors prior to final presentation to the Audit Committee. Outstanding quantifications are expected to be prepared for review in the second half of the fourth quarter. Additional disclosures of the preliminary financial impacts on the Company's opening balance sheet at January 1, 2010 will be provided in the MD&A upon receipt of approval by the Audit Committee and Board of Directors.
Reconciliations of the reported balances and the preparation of the Company's interim and annual financial statements and notes in accordance with IFRS will be prepared for review by external auditors and presented to the Audit Committee and Board of Directors for approval during the remainder of 2010 and in the first quarter of 2011. These reconciliations will be updated for any revisions to IFRS standards subsequent to the January 1, 2010 transition date and will be presented as comparative results within each of the interim and annual financial statements and notes respectively throughout the 2011 reporting year.
RISKS AND UNCERTAINTIES
The risks and uncertainties are discussed within the Company's most recent Form 40-F/Annual Information Form on file with the SEC and Canadian provincial securities regulatory authorities.
INTERNAL CONTROLS
Disclosure Controls and Procedures
Management is responsible for the information disclosed in this management's discussion and analysis and has in place the appropriate information systems, procedures and controls to ensure that information used internally by management and disclosed externally is, in all material respects, complete and reliable.
For the three months ended September 30, 2010, the President and Chief Executive Officer and Vice President, Finance and Chief Financial Officer certify that they have designed, or caused to be designed under their supervision, disclosure controls and procedures to provide reasonable assurance that material information relating to the Company and its consolidated subsidiaries would be made known to them by others within those entities.
The disclosure controls and procedures are evaluated annually through regular internal reviews which are carried out under the supervision of, and with the participation of, the Company's management, including the President and Chief Executive Officer and Vice President, Finance and Chief Financial Officer.
Internal Control over Financial Reporting
For the three months ended September 30, 2010, the President and Chief Executive Officer and Vice President, Finance and Chief Financial Officer certify that they have designed, or caused to be designed under their supervision, internal controls over financial reporting to provide reasonable assurance regarding the reliability of financial reporting and the preparation of the financial statements for external purposes in accordance with Canadian GAAP.
32
3RD QUARTER REPORT 2010
There have been no changes in the Company's internal controls over the financial reporting that occurred during the most recent period ended September 30, 2010 that have materially affected or are reasonably likely to materially affect, the Company's internal control over financial reporting.
Management is responsible for establishing and maintaining adequate internal controls over financial reporting. Internal control over financial reporting, no matter how well designed, has inherent limitations and can only provide reasonable assurance, not absolute assurance, with respect to the preparation and fair presentation of published financial statements and management does not expect such controls will prevent or detect all misstatements due to error or fraud. The Company is continually evolving and enhancing its systems of controls and procedures.
Under the supervision and with the participation of the President and Chief Executive Officer and the Vice President, Finance and Chief Financial Officer, management performs regular internal reviews and conducts an annual evaluation of the effectiveness of its internal control over financial reporting based on the framework in Internal Control – Integrated Framework issued by the Committee of Sponsoring Organizations of the Treadway Commission.
OTHER INFORMATION
Additional information regarding the Company is included in the Company's Annual Information Form and Annual Report on Form 40-F, which are filed with the SEC and the provincial securities regulatory authorities, respectively. A copy of the Company's Annual Information Form is posted on the SEDAR website at www.sedar.com. A copy of the Annual Report or Form 40-F can be obtained from the SEC's website at www.sec.gov.
NON-GAAP MEASURES
This MD&A refers to cash used in operating activities per share and cash cost per ounce which are not recognized measures under Canadian GAAP. Such non-GAAP financial measures do not have any standardized meaning prescribed by Canadian GAAP and are therefore unlikely to be comparable to similar measures presented by other issuers. Management uses these measures internally. The use of these measures enables management to better assess performance trends. Management understands that a number of investors, and others who follow the Company's performance, assess performance in this way. Management believes that these measures better reflect the Company's performance and are better indications of its expected performance in future periods. This data is intended to provide additional information and should not be considered in isolation or as a substitute for measures of performance prepared in accordance with Canadian GAAP. The following tables reconcile these non-GAAP measures to the most directly comparable Canadian GAAP measures:
(a) Reconciliation of Cash Used in Operations per Share*
| | | | | | | |||||||||
|---|---|---|---|---|---|---|---|---|---|---|---|---|---|---|
| | Three months ended September 30 | | | | ||||||||||
| (expressed in thousands of dollars | Nine months ended September 30 | | ||||||||||||
| except per share amounts) | 2010 | 2009 | 2010 | 2009* | | |||||||||
| Cash provided by (used in) operations prior to changes in non-cash working capital | $ | 6,022 | $ | (5,846 | ) | $ | (14,069 | ) | $ | (14,669 | ) | |||
| Weighted average number of shares outstanding – basic and diluted | 147,537,429 | 104,099,989 | 138,814,869 | 94,592,696 | ||||||||||
| Cash provided by (used in) operations prior to changes in non-cash working capital per share | $ | 0.04 | $ | (0.06 | ) | $ | (0.10 | ) | $ | (0.16 | ) | |||
- *
- Certain prior period amounts have been reclassified to conform to the classification adopted in the current period.
33
3RD QUARTER REPORT 2010
(b) Total Cash Cost
The Company reports total cash cost on a sales basis. Total cash cost includes mine site operating costs such as mining, processing, administration, and royalties, but is exclusive of depreciation, amortization, reclamation, capital and exploration costs. Total cash cost is reduced by any by-product revenue and is then divided by ounces sold to arrive at the total by-product cash cost of sales. This measure, along with revenues, is considered to be a key indicator of a company's ability to generate operating earnings and cash flow from its mining operations.
(i) Reconciliation of Palladium Total Cash Cost per Ounce
| | Three months ended September 30 2010 | Nine months ended September 30 2010 | | |||||
|---|---|---|---|---|---|---|---|---|
| (expressed in thousands of dollars except per ounce amounts) | | |||||||
| Production costs including overhead | $ | 13,700 | $ | 29,834 | ||||
| Less mine startup costs | – | (6,003 | ) | |||||
| Smelter treatment, refining and freight costs | 1,940 | 3,103 | ||||||
| Royalty expense | 1,439 | 2,184 | ||||||
| 17,079 | 29,118 | |||||||
| Less by-product metal revenue | 8,405 | 12,894 | ||||||
| $ | 8,674 | $ | 16,224 | |||||
| Divided by ounces of palladium sold | 38,123 | 62,211 | ||||||
| Cash cost per ounce (CDN$) | $ | 228 | $ | 261 | ||||
| Exchange rate (CDN$1 – US$) | 0.96 | 0.97 | ||||||
| Cash cost per ounce (US$) | $ | 218 | $ | 253 | ||||
(ii) Reconciliation of Gold Total Cash Cost per Ounce
| | Three months ended September 30 2010 | Nine months ended September 30 2010 | | ||||
|---|---|---|---|---|---|---|---|
| (expressed in thousands of dollars except per ounce amounts) | | ||||||
| Production costs including overhead | $ | 6,752 | $ | 23,319 | |||
| Refining and freight costs | 13 | 44 | |||||
| 6,765 | 23,363 | ||||||
| Less by-product metal revenue | 294 | 473 | |||||
| 6,471 | $ | 22,890 | |||||
| Divided by ounces of gold sold | 3,742 | 14,542 | |||||
| Cash cost per ounce (CDN$) | $ | 1,729 | $ | 1,574 | |||
| Exchange rate (CDN$1 – US$) | 0.96 | 0.97 | |||||
| Cash cost per ounce (US$) | $ | 1,660 | $ | 1,527 | |||
(c) EBITDA
EBITDA is a non-GAAP financial measure, which excludes the following from net income:
- •
- Income and mining tax recovery;
- •
- Interest and other financing costs (income);
34
3RD QUARTER REPORT 2010
- •
- Depreciation and amortization;
- •
- Loss (gain) on disposal of equipment; and
- •
- Asset retirement obligation accretion.
Management believes that EBITDA is a valuable indicator of the Company's ability to generate liquidity by producing operating cash flow to fund working capital needs, service debt obligations, and fund capital expenditures.
EBITDA excludes the impact of cash costs of financing activities and taxes, and the effects of changes in operating working capital balances, and therefore is not necessarily indicative of operating profit or cash flow from operations as determined under Canadian GAAP. Other companies may calculate EBITDA differently.
| | | | | | | ||||||||||
|---|---|---|---|---|---|---|---|---|---|---|---|---|---|---|---|
| | Three months ended September 30 | Nine months ended September 30 | | ||||||||||||
| | 2010 | 2009 | 2010 | 2009 | | ||||||||||
| Net income (loss) and comprehensive income (loss) for the period | $ | 3,185 | $ | (6,194 | ) | $ | (22,999 | ) | $ | (15,653 | ) | ||||
| Income and mining tax recovery | (952 | ) | – | (4,858 | ) | – | |||||||||
| Interest and other financing costs (income) | (79 | ) | (206 | ) | (144 | ) | (1,546 | ) | |||||||
| Depreciation and amortization | 3,171 | 95 | 11,252 | 197 | |||||||||||
| Loss (gain) on disposal of equipment | 86 | (21 | ) | 103 | (21 | ) | |||||||||
| Asset retirement obligation accretion | 145 | 131 | 433 | 320 | |||||||||||
| EBITDA | $ | 5,556 | $ | (6,195 | ) | $ | (16,213 | ) | $ | (16,703 | ) | ||||
35
3RD QUARTER REPORT 2010