Exhibit 1.2
North American Palladium Ltd.
TABLE OF CONTENTS
| | | Page |
| | | |
| Management’s Discussion and Analysis | | |
| | | |
| INTRODUCTION | | 1 |
| | | |
| FORWARD-LOOKING INFORMATION | | 1 |
| | | |
| CAUTIONARY NOTE TO U.S. INVESTORS CONCERNING MINERAL RESERVES AND RESOURCES | | 2 |
| | | |
| OUR BUSINESS | | 2 |
| | | |
| KEY HIGHLIGHTS | | 3 |
| | | |
| EXECUTIVE SUMMARY | | 4 |
| | | |
| FINANCIAL REVIEW | | 10 |
| | | |
| FINANCIAL CONDITION, CASH FLOWS, LIQUIDITY AND CAPITAL RESOURCES | | 15 |
| | | |
| OUTSTANDING SHARE DATA | | 17 |
| | | |
| REVIEW OF OPERATIONS | | 18 |
| | | |
| EXPLORATION UPDATE | | 21 |
| | | |
| FUTURE ACCOUNTING STANDARDS | | 26 |
| | | |
| RISKS AND UNCERTAINTIES | | 39 |
| | | |
| INTERNAL CONTROLS | | 39 |
| | | |
| OTHER INFORMATION | | 40 |
| | | |
| NON-GAAP MEASURES | | 40 |
North American Palladium Ltd.
Management’s Discussion and Analysis
Unless the context suggests otherwise, references to “NAP” or the “Company” or similar terms refer to North American Palladium Ltd. and its subsidiaries. “LDI” refers to Lac des Iles Mines Ltd., and “Cadiscor” refers to Cadiscor Resources Inc.
The following is management’s discussion and analysis (“MD&A”) of the financial condition and results of operations to enable readers of the Company’s consolidated financial statements and related notes to assess material changes in financial condition and results of operations for the year ended December 31, 2010, compared to those of the respective periods in the prior years. This MD&A has been prepared as of February 23, 2011 and is intended to supplement and complement the audited consolidated financial statements and notes thereto for the year ended December 31, 2010 (collectively, the “Financial Statements”). Readers are encouraged to review the Financial Statements in conjunction with their review of this MD&A and the most recent Form 40-F/Annual Information Form on file with the US Securities and Exchange Commission (“SEC”) and Canadian provincial securities regulatory authorities, available at www.sec.gov and www.sedar.com, respectively.
All amounts are in Canadian dollars unless otherwise noted and all references to production ounces refer to payable production.
FORWARD-LOOKING INFORMATION
Certain information included in this MD&A, including any information as to the Company’s future financial or operating performance and other statements, which include future oriented financial information, that express management’s expectations or estimates of future performance, constitute ‘forward looking statements’ within the meaning of the ‘safe harbor’ provisions of the United States Private Securities Litigation Reform Act of 1995 and Canadian securities laws. The words ‘expect’, ‘believe’, ‘will’, ‘intend’, ‘estimate’, ‘plan’, ‘targeting’, ‘goal’, ‘vision’ and similar expressions identify forward-looking statements. Forward-looking statements are necessarily based upon a number of estimates and assumptions that, while considered reasonable by management, are inherently subject to significant business, economic and competitive uncertainties, risks and contingencies. The Company cautions the reader that such forward-looking statements involve known and unknown risks, uncertainties and other factors that may cause the actual financial results, performance or achievements of the Company to be materially different from the Company’s estimated future results, performance or achievements expressed or implied by those forward-looking statements and that the forward-looking statements are not guarantees of future performance. These statements are also based on certain factors and assumptions including factors and assumptions related to future prices of palladium, gold and other metals, the Canadian dollar exchange rate, the ability of the Company to meet operating cost estimates, inherent risks associated with mining and processing, as well as those estimates, risks, assumptions and factors described in the Company’s most recent Form 40-F/Annual Information Form on file with the SEC and Canadian provincial securities regulatory authorities. In addition, there can be no assurance that the Company’s Lac des Iles and Sleeping Giant mines will operate as anticipated, or that the other properties can be successfully developed. The Company disclaims any obligation to update or revise any forward-looking statements, whether as a result of new information, events or otherwise, except as expressly required by law. Readers are cautioned not to put undue reliance on these forward-looking statements.
YEAR END REPORT 2010
North American Palladium Ltd.
CAUTIONARY NOTE TO U.S. INVESTORS CONCERNING MINERAL
RESERVES AND RESOURCES
Mineral reserve and mineral resource information contained herein has been calculated in accordance with National Instrument 43-101 – Standards of Disclosure for Mineral Projects, as required by Canadian provincial securities regulatory authorities. Canadian standards differ significantly from the requirements of the SEC, and mineral reserve and mineral resource information contained herein is not comparable to similar information disclosed in accordance with the requirements of the SEC. While the terms “measured”, “indicated” and “inferred” mineral resources are required pursuant to National Instrument 43-101, the SEC does not recognize such terms. U.S. investors should understand that “inferred” mineral resources have a great amount of uncertainty as to their existence and great uncertainty as to their economic and legal feasibility. In addition, U.S. investors are cautioned not to assume that any part or all of NAP’s mineral resources constitute or will be converted into reserves. For a more detailed description of the key assumptions, parameters and methods used in calculating NAP’s mineral reserves and mineral resources, see NAP’s most recent Annual Information Form/Form 40-F on file with Canadian provincial securities regulatory authorities and the SEC.
North American Palladium Ltd. is a Canadian precious metals company focused on growing its production of palladium and gold in mining-friendly jurisdictions. As an established producer, the Company operates its two 100%-owned mines in Canada and has a pipeline of growth projects near its mine sites where both mills have excess capacity available for production growth.
Lac des Iles (“LDI”), the Company's flagship mine, is one of the world’s two primary palladium producers. Located approximately 85 kilometres northwest of Thunder Bay, Ontario, LDI started producing palladium in 1993. Production from the Roby Zone was successfully restarted in April 2010 after being temporarily placed on care and maintenance in October 2008 due to low metal prices. The Company is currently expanding the LDI mine to transition from mining the Roby Zone (via ramp access) to mining from the Offset Zone (via shaft). The mine expansion is currently underway, with commercial production from the shaft targeted for the fourth quarter of 2012. It is expected that this expansion will transform LDI into a long life, low cost producer of palladium.
NAP also owns and operates the Sleeping Giant gold mine located in the Abitibi region of Quebec, north of Val d’Or, where the Company plans to organically grow the gold operations through the development of its other gold assets. As part of NAP’s growth strategy for its gold operations, the Company has initiated an expansion of the Sleeping Giant mill, which is expected to process ore from NAP’s other gold development projects should they be brought into production. The Company is currently advancing the Vezza gold project towards a production decision expected at the end of 2011, and is continuing to advance its other projects through exploration and permitting.
The Company has a strong portfolio of development and exploration assets near the LDI and Sleeping Giant mines, and is pursuing a significant exploration program in 2011 aimed at increasing its reserves and resources. With an experienced senior management team, a strong balance sheet of approximately $170 million in working capital (including $75 million in cash) as at December 31, 2010 and no long-term debt, NAP is well positioned to pursue its growth strategy.
NAP trades on the TSX under the symbol PDL and on the NYSE Amex under the symbol PAL.
YEAR END REPORT 2010
North American Palladium Ltd.
| (expressed in thousands of dollars except total cash cost and per | | | | | | | | | |
| share amounts) | | 2010 | | | 2009 | | | 2008 | |
| FINANCIAL HIGHLIGHTS | | | | | | | | | |
| Revenue | | | | | | | | | |
| Revenue after pricing adjustments | | $ | 107,098 | | | $ | 4,019 | | | $ | 132,096 | |
| | | | | | | | | | | | | |
| Unit sales | | | | | | | | | | | | |
| Palladium (oz) | | | 95,057 | | | | – | | | | 199,967 | |
| Gold (oz) | | | 21,573 | | | | – | | | | 14,289 | |
| Platinum (oz) | | | 4,894 | | | | – | | | | 14,927 | |
| Nickel (lb) | | | 395,622 | | | | – | | | | 2,344,504 | |
| Copper (lb) | | | 658,013 | | | | – | | | | 4,092,118 | |
| | | | | | | | | | | | | |
| Net loss | | | | | | | | | | | | |
| Net loss | | $ | (23,259 | ) | | $ | (30,014 | ) | | $ | (160,679 | ) |
| Net loss per share | | $ | (0.16 | ) | | $ | (0.29 | ) | | $ | (1.94 | ) |
| | | | | | | | | | | | | |
Adjusted net income (loss)1 | | $ | 12,600 | | | $ | (16,816 | ) | | $ | (51,066 | ) |
EBITDA1 | | $ | (17,678 | ) | | $ | (28,465 | ) | | $ | (123,440 | ) |
Adjusted EBITDA1 | | $ | 18,181 | | | $ | (15,267 | ) | | $ | (13,827 | ) |
| | | | | | | | | | | | | |
| Cash flow used in operations | | | | | | | | | | | | |
| Cash flow used in operations before changes in non-cash working capital | | $ | (14,414 | ) | | $ | (27,656 | ) | | $ | (25,544 | ) |
Cash flow used in operations before changes in non-cash working capital per share1 | | $ | (0.10 | ) | | $ | (0.27 | ) | | $ | (0.31 | ) |
| | | | | | | | | | | | | |
| Capital spending | | $ | 49,364 | | | $ | 12,205 | | | $ | 40,691 | |
| | | | | | | | | | | | | |
| OPERATING HIGHLIGHTS | | | | | | | | | | | | |
| Production | | | | | | | | | | | | |
| Palladium (oz) | | | 95,057 | | | | – | | | | 195,083 | |
| Gold (oz) | | | 21,718 | | | | – | | | | 13,851 | |
| Platinum (oz) | | | 4,894 | | | | – | | | | 14,517 | |
| Nickel (lb) | | | 395,622 | | | | – | | | | 2,278,551 | |
| Copper (lb) | | | 658,013 | | | | – | | | | 3,929,786 | |
| | | | | | | | | | | | | |
Total cash costs per ounce1 | | | | | | | | | | | | |
| Palladium (US$) | | $ | 283 | | | | – | | | $ | 283 | |
| Gold (US$) | | $ | 1,549 | | | | – | | | $ | – | |
(expressed in thousands of dollars) | | As at December 31 2010 | | | As at December 31 2009 | |
| | | | | | | |
| Net working capital | | $ | 169,619 | | | $ | 114,507 | |
| Cash balance | | $ | 75,159 | | | $ | 98,255 | |
| Shareholders’ equity | | $ | 291,377 | | | $ | 192,261 | |
1 Non-GAAP measure. Please refer to Non-GAAP Measures on pages 40-43.
YEAR END REPORT 2010
North American Palladium Ltd.
Financial Highlights
After incurring $6.0 million of LDI restart costs and $30.1 million of exploration costs, the net loss for the year ended December 31, 2010 was $23.3 million or $0.16 per share compared to a net loss of $30.0 million or $0.29 per share in the prior year. Adjusted net income was $12.9 million for 2010 compared to an adjusted net loss of $16.8 million in 2009. NAP used cash from operating activities of $14.4 million, before changes in non-cash working capital, for the year ended December 31, 2010, or $0.10 per share1, as compared to cash used in operations of $27.7 million, before changes in non-cash working capital, or $0.27 per share1, for 2009.
For the year ended December 31, 2010, EBITDA1 was a negative $17.7 million compared to a negative $28.5 million in 2009 due to a lower net loss and higher depreciation and amortization, partially offset by lower income tax and mining tax expense. Adjusted EBITDA1 was $12.2 million compared to a negative $15.3 million in 2009 due to higher exploration expenditures.
Higher Revenue
Revenue, after pricing adjustments, for the year ended December 31, 2010 was $107.1 million compared to $4.0 million in the prior year.
Strong Balance Sheet
As at December 31, 2010, the Company had approximately $169.6 million in working capital (including $75.2 million of cash on hand) and no long-term debt.
For the year ended December 31, 2010, $17.5 million of Series A and $8.1 million of Series B warrants were exercised, of which $5.8 million was received in cash and $19.8 million was received subsequent to year end. In January 2011, the Company received additional proceeds of $21.3 million from the exercise of Series A warrants. In addition, the Company closed its $22 million financing of flow-through shares in February 2011.
Investment in Growth
For the year ended December 31, 2010, the Company spent $30.1 million on exploration activities and $49.4 million on development expenditures at the palladium and gold operations.
In this favourable price environment, the operating cash flow from the LDI palladium mine and the Sleeping Giant gold mine, together with the Company’s cash reserves and credit facilities, which remain undrawn, are expected to be sufficient to fund NAP’s financing requirements in 2011.
LDI Mine
The LDI mine produced 95,057 ounces of payable palladium for the year ended December 31, 2010. During 2010, 615,926 tonnes of ore was extracted from the mine with 649,649 tonnes of ore processed by the LDI mill at an average of 6,564 tonnes per operating day at an average palladium head grade of 6.06 grams per tonne, with a palladium recovery of 80.8%, and mill availability of 96.3%. For 2010, LDI’s total cash costs1 were US$283 per ounce of palladium.
For 2011, the Company forecasts that the LDI mine will produce between 165,000 to 175,000 ounces of payable palladium, comprised of 10,000 ounces from the Offset Zone and the balance from the Roby Zone and lower grade surface stockpiles. The Company expects the combined palladium head grade at the mill to average 4.4 grams per tonne with a mill recovery of 80%. Due to the lower average head grade per tonne being processed by the mill, cash costs1 per ounce are expected to be in the range of US$340 to US$370 in 2011.
1 Non-GAAP measure. Please refer to Non-GAAP Measures on pages 40-43.
YEAR END REPORT 2010
North American Palladium Ltd.
Sleeping Giant Mine
In 2010, the Sleeping Giant gold mine produced 17,695 ounces of gold. During the year, 95,261 tonnes of ore were hoisted from Sleeping Giant, with 93,296 tonnes being processed by the mill at an average head grade of 5.90 grams per tonne, with a gold recovery of 95.5%. For the year ended December 31, 2010, Sleeping Giant’s total cash costs1 were US$1,549 per ounce gold. Development work and tighter infill drilling at Sleeping Giant continued in the latter part of 2010 to better manage grade control issues. Shrinkage and long-hole stopes were being favoured over room and pillar stopes due to the higher certainty over grade and tonnage recovered. While the development work at depth continued, mining remained confined to stopes mined by the previous owner. The Company will continue to adjust its mine plan and methods in order to optimize operations. During the last quarter of 2010, the Company initiated an incentive program to retain and attract experienced miners to potentially increase production in the future.
For 2011, the Company forecasts production in the range of 30,000 to 35,000 ounces of payable gold at the Sleeping Giant gold mine. The Company expects to see an improvement in the average gold grade to 8.09 grams per tonne, with gold recovery of 96.5%. Mining will be focused on the areas around the 975 elevation and above. The Company expects to increase the number of stopes over the course of the year. While the development work at depth continues and mining remains confined to stopes mined by the previous operator, cash costs1 are expected to remain high into the first part of 2011, but will reduce during the year to average approximately US$1,200 to US$1,300 per ounce.
LDI Mine Expansion Update
The Company is currently expanding the LDI mine to transition from mining from the Roby Zone (via ramp access) to mining from the Offset Zone (via shaft). In 2010, the Company spent approximately $26.0 million on the mine expansion development activities and in 2011, plans to spend $147.0 million on development work focused on:
| | · | Completing the raised bore section of the production shaft and ventilation raise bore; |
| | · | Installing adequate ventilation at surface and underground; |
| | · | Advancing the ramp towards the 4570 mine level; |
| | · | Developing the 4790 mine level; |
| | · | Constructing the head frame, hoist room and substation; and |
The Company is targeting commercial production from the shaft at a capacity of 3,500 tonnes per day to commence in the fourth quarter of 2012, with plans to increase it to 5,500 tonnes per day starting in the first quarter of 2015.
Once completed, the LDI mine is expected to become a long life, low cost producer of palladium, allowing the Company to significantly increase production to over 250,000 ounces per year from 2015 and onwards at significantly reduced cash costs1 (expected to decline to less than US$150 per ounce).
Vezza Gold Project
In 2010, the Company completed 74 drill holes from surface for a total of 12,105 metres. The surface drilling program confirmed both continuity and grade in the near surface, eastern extension of the deposit. The Vezza shaft and underground drifts are currently being dewatered to allow for underground diamond drilling. Results from the exploration and development work in 2011 will allow the Company to better evaluate the project before making a production decision. If a positive production decision is made, gold production could begin in the first quarter of 2012 from the expanded Sleeping Giant mill, at an expected rate of to 39,000 ounces per year over a seven to nine year mine life. A bulk sample of up to 40,000 tonnes is planned for 2011.
The Company is planning to spend $25.8 million in 2011 to advance the Vezza project towards a production decision expected in the fourth quarter. These expenditures will be reduced by estimated pre-production revenue of $8.2 million, for a net expenditure of $17.6 million.
1 Non-GAAP measure. Please refer to Non-GAAP Measures on pages 40-43.
YEAR END REPORT 2010
North American Palladium Ltd.
Sleeping Giant Shaft Deepening
The mine shaft deepening is expected to be completed in the second quarter of 2011, following which development work will commence on the three new mining levels, in preparation for 2012 production. This will allow the Company to follow the continuity trends at depth with potentially higher grade zones that have historically fed the mill and potentially increase the mine’s production to 40,000 to 50,000 ounces per year.
Significant Exploration Programs
In 2010, the Company completed a significant exploration program aimed at increasing its reserves and resources at LDI and at the gold operations. For the year ended December 31, 2010, NAP’s exploration expenditures amounted to $30.1 million, comprised of $15.1 million in Ontario, primarily at LDI, and $15.0 million in expenditures in Quebec on the Company’s gold properties. Cash costs1 are expected to be between US$700 to US$750 per ounce starting in 2012. Updated resource estimates for the LDI and Sleeping Giant mines and the Vezza, Discovery and Flordin projects are due for release in the second quarter.
Flordin Gold Project
The Flordin property’s first-time NI 43-101 report (released in March 2010) estimates that the property contains 679,000 tonnes of measured and indicated resources near surface at an average grade of 4.25 grams per tonne gold for 92,814 contained ounces and an additional inferred resource of 1,451,400 tonnes grading 3.63 grams per tonne gold for a total of 169,261 contained ounces. The Company believes that the Flordin gold property could have the potential to provide additional feed for the Sleeping Giant mill and is currently examining open pit scenarios. In 2010, 212 drill holes were completed from surface to 100 metres at depth, totalling 25,720 metres.
Discovery Gold Project
In 2010, 40 drill holes totalling 25,495 metres were completed at the Discovery project. The objective of the drill program was to extend the 1200E zone, which was not included in the 2008 Scoping Study. A scoping study from August 2008 concluded that the project could produce 44,000 ounces of gold per year for four years, yielding a 27% internal rate of return at a US$850 gold price. During 2011, the Company intends to update the scoping study with current costs and revised estimates of future gold prices.
Dormex Gold Project
During 2010, the Company continued its surface exploration program combining geophysical surveys and reverse circulation drilling of the overburden at the Dormex project. In 2010, the Company completed a reverse circulation drill program of 3,064 metres in order to better delineate overburden gold anomalies already known on the property. The 2010 exploration program included ground and airborne geophysics and nine conventional drill holes for a total of 4,206 metres. Logging and analysis of the 2010 work is ongoing and is expected to impact the planned 2011 drilling program once all new information is interpreted and integrated.
Sleeping Giant Mill Expansion
As part of NAP’s growth strategy for its gold operations, the Company initiated a $7.0 million expansion of Sleeping Giant’s mill from its current capacity of 900 tonnes per day to 1,250 tonnes per day. The expanded mill will be engineered in advance to accommodate a further expansion to 1,750 tonnes per day should the development of NAP’s other gold projects require additional mill capacity.
Outlook
The Company’s management team believes it is delivering on its vision to create a diversified mid-tier precious metals producer. NAP is well positioned to benefit from the rise in the price of palladium as the LDI mine expansion is expected to significantly increase production through the development of the Offset Zone over the next couple of years.
YEAR END REPORT 2010
North American Palladium Ltd.
In 2011, the Company intends to focus on:
| | · | Growing palladium production at LDI while continuing to optimize costs and facilitate mine planning for production from the Offset Zone; |
| | · | Continuing to advance the LDI mine expansion, including development work on the ramp, ventilation, shaft and mining levels; |
| | · | Continuing exploration programs aimed at increasing reserves and resources at LDI and in the gold division; |
| | · | Improving operating results at Sleeping Giant while continuing the deepening of the mine shaft to facilitate development of the new higher grade zones at depth; |
| | · | Expanding Sleeping Giant’s mill capacity from 900 tonnes per day to 1,250 tonnes per day; and |
| | · | Advancing the Vezza gold project through exploration and development towards a production decision by year-end. |
While management is focused on organic growth, there could be attractive strategic opportunities to consider in the current environment. The Company may use its strong balance sheet to pursue platinum group metal (“PGM”) and/or gold acquisition and joint venture opportunities, but with discipline to ensure it pursues only those transactions that can deliver enhanced and sustainable shareholder value.
YEAR END REPORT 2010
North American Palladium Ltd.
Selected Annual Information
(expressed in thousands of dollars, except per share amounts)
| | | 2010 | | | 2009 | | | 2008 | |
| Revenue after pricing adjustments | | $ | 107,098 | | | $ | 4,019 | | | $ | 132,096 | |
| Asset impairment charge | | | – | | | | – | | | | (90,000 | ) |
| Income (loss) from mining operations | | | 9,926 | | | | (6,232 | ) | | | (127,759 | ) |
| Net income (loss) | | | (23,259 | ) | | | (30,014 | ) | | | (160,679 | ) |
| Net income (loss) per share – Basic and diluted | | | (0.16 | ) | | | (0.29 | ) | | | (1.94 | ) |
| Cash flow from (used in) operations prior to changes in non-cash working capital | | | (14,414 | ) | | | (27,656 | ) | | | (25,544 | ) |
| Total assets | | | 348,347 | | | | 219,211 | | | | 146,904 | |
| Obligations under capital leases | | | 2,391 | | | | 1,134 | | | | 7,552 | |
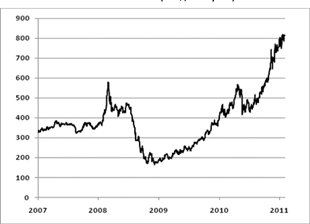
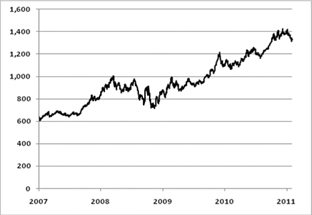
Metal Prices
| Palladium Price (US$/ Troy oz) | | Gold Price (US$/ Troy oz) |
| | |
In 2008, the price of palladium declined significantly by 69% to US$183 per ounce prompting the Company to put the LDI mine on temporary care and maintenance. As the price of palladium began to recover, the Company restarted the LDI mine in April 2010, ahead of schedule and under budget.
During 2010, the palladium price averaged US$527 per ounce, ranging from a low of US$404 to a high of US$802 per ounce. The recent price recovery can be attributed to increased investment demand, strong fabrication demand and constrained supply. Palladium is increasingly behaving like a precious metal with rising investment and jewelry demand, yet has the fundamental underpinning of an industrial metal. Palladium was the best performing metal in percentage terms in 2010 and recently reached a ten year high of US$859 per ounce. As of February 22, 2011, the price of palladium was US$804 per ounce.
During the year ended 2010, the average price of gold was US$1,227 per ounce, with gold trading in a range of US$1,063 to US$1,424 per ounce. As of February 22, 2011, the price of gold was US$1,399. The price of gold delivered strong performance towards the end of 2010 without significant volatility. Gold prices were strongly supported by investment demand as gold ETFs continued to grow.
The Canadian dollar modestly strengthened during 2010 from $0.96 to $1.00 relative to the U.S. dollar (“USD”). The Canadian dollar ended 2010 above parity with the U.S. currency, closing at its highest level in two and a half years amid rising commodities prices. The Canadian dollar is fundamentally supported by its relatively strong sovereign position, strong commodity prices and positive foreign flows into Canada. Other contributing factors include a relatively healthy fiscal position amongst the G10 and favourable investor sentiment.
YEAR END REPORT 2010
North American Palladium Ltd.
NAP Metal Prices and Exchange Rates
| | | 2010 | | | 2009 | | | 2008 | |
| Palladium – US$/oz | | $ | 665 | | | $ | 204 | | | $ | 378 | |
| Platinum – US$/oz | | $ | 1,690 | | | $ | 1,025 | | | $ | 1,547 | |
| Gold – US$/oz | | $ | 1,208 | | | $ | 941 | | | $ | 862 | |
| Nickel – US$/lb | | $ | 10.11 | | | $ | 4.80 | | | $ | 10.13 | |
| Copper – US$/lb | | $ | 3.58 | | | $ | 1.45 | | | $ | 3.29 | |
| Average exchange rate (Bank of Canada) – CDN$1 = US$ | | US$ | 0.97 | | | US$ | 0.88 | | | US$ | 0.94 | |
Under LDI’s smelter agreement, metal prices are not finalized until three months after delivery to the smelter for base metals and six months for precious metals. Prior to final pricing and settlement, LDI’s metals are provisionally priced at month end forward prices. The Company entered into financial contracts during the fourth quarter of 2010 to mitigate this provisional pricing exposure to rising or declining palladium prices for past production already delivered and sold to the smelter. For further details, see the Financial Review section.
Spot Metal Prices* and Exchange Rates
For comparison purposes, the following table details recorded spot metal prices and exchange rates.
| | | Dec 31 2010 | | | Sept 30 2010 | | | June 30 2010 | | | Mar 31 2010 | | | Dec 31 2009 | | | Sept 30 2009 | | | June 30 2009 | | | Mar 31 2009 | |
| Palladium – US$/oz | | $ | 791 | | | $ | 573 | | | $ | 446 | | | $ | 479 | | | $ | 393 | | | $ | 294 | | | $ | 249 | | | $ | 215 | |
| Gold – US$/oz | | $ | 1,410 | | | $ | 1,307 | | | $ | 1,244 | | | $ | 1,116 | | | $ | 1,104 | | | $ | 996 | | | $ | 934 | | | $ | 916 | |
| Platinum – US$/oz | | $ | 1,731 | | | $ | 1,662 | | | $ | 1,532 | | | $ | 1,649 | | | $ | 1,461 | | | $ | 1,287 | | | $ | 1,186 | | | $ | 1,124 | |
| Nickel – US$/lb | | $ | 11.32 | | | $ | 10.57 | | | $ | 8.78 | | | $ | 11.33 | | | $ | 8.38 | | | $ | 7.86 | | | $ | 7.26 | | | $ | 4.27 | |
| Copper – US$/lb | | $ | 4.38 | | | $ | 3.65 | | | $ | 2.95 | | | $ | 3.56 | | | $ | 3.33 | | | $ | 2.78 | | | $ | 2.31 | | | $ | 1.83 | |
| Exchange rate (Bank of Canada) – CDN$1 = US$ | | US$ | 1.01 | | | US$ | 0.97 | | | US$ | 0.94 | | | US$ | 0.98 | | | US$ | 0.96 | | | US$ | 0.93 | | | US$ | 0.86 | | | US$ | 0.79 | |
* Based on the London Metal Exchange
YEAR END REPORT 2010
North American Palladium Ltd.
LDI Palladium Mine
Income from mining operations for the LDI palladium mine are summarized in the following table.
| | | 2010 | | | 2009 | | | 2008 | |
| Revenue after pricing adjustments | | $ | 84,813 | | | $ | 4,019 | | | $ | 132,096 | |
| Operating expenses | | | | | | | | | | | | |
| Production costs | | $ | 46,269 | | | $ | – | | | $ | 115,037 | |
| Smelter treatment, refining and freight costs | | | 4,721 | | | | 109 | | | | 20,342 | |
| Royalty expense | | | 4,202 | | | | 201 | | | | 5,588 | |
| Inventory pricing adjustment | | | – | | | | (3,634 | ) | | | 3,875 | |
| Depreciation and amortization | | | 3,250 | | | | 217 | | | | 36,026 | |
| Asset retirement obligation accretion (recovery) | | | 383 | | | | 246 | | | | 321 | |
| Loss (gain) on disposal of equipment | | | (268 | ) | | | (36 | ) | | | 2,466 | |
| Asset impairment charge | | | – | | | | – | | | | 90,000 | |
| Insurance recovery | | | – | | | | – | | | | (13,800 | ) |
| Care and maintenance costs | | | – | | | | 12,987 | | | | – | |
| Total operating expenses | | $ | 58,557 | | | $ | 10,090 | | | $ | 259,855 | |
| Income (loss) from mining operations | | $ | 26,256 | | | $ | (6,071 | ) | | $ | (127,759 | ) |
Revenue – LDI Mine
Revenue is affected by sales volumes, commodity prices and currency exchange rates. Metal sales for LDI are recognized in revenue at provisional prices when delivered to a smelter for treatment. Final pricing is not determined until the refined metal is sold by the smelter, which in the case of LDI base metals is three months and precious metals six months after delivery to the smelter. These final pricing adjustments can result in additional revenues in a rising commodity price environment and reductions to revenue in a declining commodity price environment. Similarly, a weakening in the Canadian dollar relative to the U.S. dollar will result in additional revenues and a strengthening in the Canadian dollar will result in reduced revenues. During the fourth quarter, the Corporation entered into financial contracts to mitigate the smelter agreements’ provisional pricing exposure to rising or declining palladium prices and an appreciating Canadian dollar for past production already sold. The total of these financial contracts represent 68,950 ounces as at December 31, 2010. These contracts mature from January 2011 through June 2011 at an average price of $640 per ounce (or US$631 per ounce). The amount specified in the financial contracts substantially match final pricing settlement periods of palladium delivered to the customer under the smelter agreement. The palladium financial contracts are being recognized on a mark-to-market basis as an adjustment to revenue. The fair value of these contracts at December 31, 2010 was a liability of $11.1 million, included in accounts payable and accrued liabilities. At December 31, 2009, the Company had no outstanding financial contracts.
Sales volumes of LDI’s major commodities are set out in the table below.
| | | 2010 | | | 2009 | | | 2008 | |
| Sales volumes | | | | | | | | | |
| Palladium (oz) | | | 95,057 | | | | – | | | | 195,083 | |
| Gold (oz) | | | 4,023 | | | | – | | | | 15,921 | |
| Platinum (oz) | | | 4,894 | | | | – | | | | 16,311 | |
| Nickel (lbs) | | | 395,622 | | | | – | | | | 2,503,902 | |
| Copper (lbs) | | | 658,013 | | | | – | | | | 4,623,278 | |
| Cobalt (lbs) | | | 9,801 | | | | – | | | | – | |
| Silver (oz) | | | 1,619 | | | | – | | | | – | |
YEAR END REPORT 2010
North American Palladium Ltd.
Revenue from metal sales from the LDI palladium mine are set out below.
| | | 2010 | | | 2009 | | | 2008 | |
| Revenue before pricing adjustments | | $ | 77,429 | | | $ | – | | | $ | 156,241 | |
| Pricing adjustments | | | 7,384 | | | | 4,019 | | | | (24,145 | ) |
| Revenue after pricing adjustments | | $ | 84,813 | | | $ | 4,019 | | | $ | 132,096 | |
| Revenue by metal | | | | | | | | | | | | |
| Palladium | | $ | 63,351 | | | $ | 2,683 | | | $ | 59,251 | |
| Gold | | | 5,640 | | | | 120 | | | | 15,122 | |
| Platinum | | | 8,659 | | | | 1,063 | | | | 21,202 | |
| Nickel | | | 4,283 | | | | 5 | | | | 21,179 | |
| Copper | | | 2,659 | | | | 170 | | | | 12,797 | |
| Cobalt | | | 171 | | | | (70 | ) | | | 2,545 | |
| Silver | | | 50 | | | | 48 | | | | – | |
| | | $ | 84,813 | | | $ | 4,019 | | | $ | 132,096 | |
For the year ended December 31, 2010, revenue before pricing adjustments was $77.4 million respectively, compared to $nil for the same comparative periods last year, reflecting no production from the LDI mine. Due to the recovery of metal prices, the Company recommenced operations in April 2010 after being on care and maintenance since October 2008.
Revenue after pricing adjustments from metal settlements for the year ended December 31, 2010 was $84.8 million, reflecting an $8.9 million positive commodity price adjustment offset by a $1.6 million negative foreign exchange adjustment. This compares to $4.0 million of revenue in the prior year, comprised of a $4.6 million favourable commodity price adjustment offset by a $0.6 million negative foreign exchange adjustment. The 2009 pricing adjustments reflected final pricing on metal settlements relating to concentrate shipments made prior to the October 2008 mine shutdown.
Operating Expenses – LDI Mine
For the year ended December 31, 2010, total production costs1 were $46.3 million, including costs of $6.0 million to restart the LDI mine and mill, which occurred in the first quarter of 2010. The first quarter restart costs were expensed since the Company kept the LDI operations commercially available and retained all key senior management in anticipation of a prompt restart when metal prices recovered. Total cash costs1 per ounce of palladium sold, net of by product credits were US$283 for year ended December 31, 2010.
For the year ended December 31, 2010, the inventory pricing adjustment was $nil compared to a recovery of $3.6 million in the same period last year. The comparative periods in the prior year reflected the adjustment of ore inventories to net realizable value due to the increase in metal prices that were partially offset by the strengthening of the Canadian dollar.
Smelter treatment, refining and freight costs for the year ended December 31, 2010 were $4.7 million compared to $0.1 million in the same period last year, the increase is due to the LDI mine and mill restart earlier in 2010.
For the year ended December 31, 2010, the royalty expense was $4.2 million compared to $0.2 million in the same period last year. The prior year expense represents the final pricing adjustments of metal settlements on concentrate delivered to the smelter prior to placing the mine on temporary care and maintenance in October 2008.
Depreciation and amortization at the LDI mine for the year ended December 31, 2010 was $3.3 million, compared to $0.2 million in the year ended December 31, 2009. A $2.0 million credit was recorded due to the timing of LDI’s mining property closure plan being extended to include the Offset Zone project.
1 Non-GAAP measure. Please refer to Non-GAAP Measures on pages 40-43.
YEAR END REPORT 2010
North American Palladium Ltd.
During the year ended December 31, 2010, the gain on disposition of equipment was $0.3 million, compared to a nominal gain in the prior year. These gains represent the disposition of certain mining equipment, primarily the disposal of a dozer and scissor lift.
For the year ended December 31, 2010, asset retirement obligation accretion expense was $0.4 million compared to accretion expense of $0.3 million in the prior year.
Sleeping Giant Gold Mine
Income from mining operations for the Sleeping Giant gold mine is summarized in the following table.
| | | 2010 | | | 2009 | |
| Revenue after pricing adjustments | | $ | 22,285 | | | $ | – | |
| Operating expenses | | | | | | | | |
| Production costs | | $ | 28,440 | | | $ | – | |
| Refining and freight costs | | | 59 | | | | – | |
| Depreciation and amortization | | | 9,797 | | | | 25 | |
| Asset retirement obligation accretion | | | 194 | | | | 109 | |
| Loss (gain) on disposal of equipment | | | (3 | ) | | | – | |
| Total operating expenses | | $ | 38,487 | | | $ | 134 | |
| Loss from mining operations | | $ | (16,202 | ) | | $ | (134 | ) |
Revenue – Sleeping Giant Mine
Metal sales for the Sleeping Giant gold mine are recognized at the time the title is transferred to a third party. Sales volumes are set out in the table below.
| | | 2010 | | | 2009 | |
| Sales volumes | | | | | | |
| Gold (oz) | | | 17,550 | | | | – | |
| Silver (oz) | | | 24,000 | | | | – | |
Revenue from metal sales from the Sleeping Giant gold mine is set out below.
| | | 2010 | | | 2009 | |
| Revenue before pricing adjustments | | $ | 22,285 | | | $ | – | |
| Pricing adjustments | | | – | | | | – | |
| Revenue after pricing adjustments | | $ | 22,285 | | | $ | – | |
| Revenue by metal | | | | | | | – | |
| Gold | | $ | 21,812 | | | $ | – | |
| Silver | | | 473 | | | | – | |
| | | $ | 22,285 | | | $ | – | |
For the year ended December 31, 2010, revenue was $22.3 million, reflecting gold sales of 17,550 ounces with an average realized price of US$1,204 per ounce.
Operating Expenses – Sleeping Giant Mine
For the year ended December 31, 2010, total production costs at the Sleeping Giant gold mine were $28.4 million. There were no production costs in 2009 as the mine reached commercial production on January 1, 2010. Total cash costs1 were US$1,549 for the year ended December 31, 2010.
YEAR END REPORT 2010
North American Palladium Ltd.
Depreciation and amortization at the Sleeping Giant gold mine was $9.8 million for the year ended December 31, 2010. In the prior year the nominal amounts relate to straight line depreciation for the use of light vehicles and office equipment.
Other Expenses
The Company’s general and administration expenses for the year ended December 31, 2010 were $10.7 million, compared to $9.0 million, an increase of $1.7 million due to additional administration costs from increased activities at the Sleeping Giant gold mine and LDI palladium mine.
Exploration expenditures for the year ended December 31, 2010 were $30.1 million compared to $13.2 million in the prior year period, comprised as follows:
| | | 2010 | | | 2009 | | | 2008 | |
| LDI Offset Zone project | | $ | 5,812 | | | $ | 7,234 | | | $ | 1,826 | |
| Other Ontario exploration projects* | | | 9,310 | | | | 4,329 | | | | 12,650 | |
| Sleeping Giant mine property | | | 3,437 | | | | 989 | | | | – | |
| Other Quebec exploration projects** | | | 11,768 | | | | 1,050 | | | | – | |
| Arctic Platinum Project | | | – | | | | – | | | | 8,594 | |
| Exploration tax credits | | | (201 | ) | | | (368 | ) | | | – | |
| Total exploration expenditures | | $ | 30,126 | | | $ | 13,234 | | | $ | 23,070 | |
| * | Other Ontario exploration projects are comprised of LDI exploration projects, (including the Mine Block, West Pit, South Pit, Creek Zone, North VT Rim, and the Legris Lake option) and Shebandowan. |
| ** | Other Quebec exploration projects are comprised of the Vezza, Discovery, Dormex, Montbray, Harricana, Cameron Shear, Flordin, Laflamme, and Florence properties. |
Interest and other income for the year ended December 31, 2010 was $0.3 million compared to $2.0 million in the prior year, a decrease of $1.7 million. The reduced interest and other income was primarily due to the lower interest income earned on short term interest bearing deposits and lower cash balances and lower gain on investments compared to prior year. In the current year, gains on investments were $nil compared to prior year gains on investments of $0.7 million.
The foreign exchange gain for the year ended December 31, 2010 was nominal compared to a loss of $0.2 million in 2009. The corresponding periods in 2009 primarily related to foreign exchange losses on the translation of the Company’s U.S. dollar denominated capital leases and credit facilities.
Asset Impairment
The Company reviews and evaluates its long-lived assets for impairment when events or changes in circumstances arise that may result in impairments in the carrying value of those assets. Impairment is considered to exist if total estimated future undiscounted cash flows are less than the carrying amount of the asset. In the opinion of management, for the year ended December 31, 2010, there were no events or changes in circumstances giving rise to an impairment in the carrying value of long-lived assets. Assumptions underlying future cash flow estimates are subject to risk and uncertainty. Any differences between significant assumptions and market conditions such as metal prices, exchange rates, recoverable metal, and/or the Company’s operating performance could have a material effect on the Company’s ability to recover the carrying amounts of its long-lived assets resulting in possible impairment charges.
YEAR END REPORT 2010
North American Palladium Ltd.
Income and Mining Tax Recovery (Expense)
The income and mining tax recovery (expense) for the years ended December 31 are provided in the table below.
| | | 2010 | | | 2009 | | | 2008 | |
| LDI palladium mine | | | | | | | | | |
| Ontario resource allowance recovery | | $ | 315 | | | $ | (315 | ) | | $ | – | |
| Ontario transitional tax credit | | | 280 | | | | (1,964 | ) | | | – | |
| Corporate minimum tax credit | | | 75 | | | | – | | | | – | |
| Ontario income tax recovery | | | – | | | | – | | | | 1,452 | |
| Ontario mining tax recovery | | | – | | | | – | | | | 778 | |
| | | $ | 670 | | | $ | (2,280 | ) | | $ | 2,230 | |
| Sleeping Giant gold mine | | | | | | | | | | | | |
| Quebec mining duties recovery | | $ | 246 | | | $ | 82 | | | $ | – | |
| Quebec income tax recovery | | | 26 | | | | – | | | | – | |
| Mining interests temporary difference expense | | | (372 | ) | | | (1,038 | ) | | | – | |
| | | $ | (100 | ) | | $ | (956 | ) | | $ | – | |
| Corporate and other | | | | | | | | | | | | |
| Expiration of warrants | | $ | 1,593 | | | $ | – | | | $ | – | |
| Renunciation of flow-through exploration expenditures | | | 5,136 | | | | (2 | ) | | | – | |
| | | $ | 6,729 | | | $ | (2 | ) | | $ | – | |
| | | $ | 7,299 | | | $ | (3,237 | ) | | $ | 2,230 | |
For the year ended December 31, 2010, the income and mining tax recovery was $7.3 million compared to a $3.2 million expense in the same period in 2009, due primarily to the recovery of future income taxes created on the renunciation of exploration expenses related to the 2009 flow-through share offering ($5.1 million), recovery of future income taxes created on the expiration of warrants ($1.6 million), the recovery of a tax liability arising in respect of the Ontario harmonization transition rules ($0.3 million), and the current income tax recovery relating to Ontario in respect of its estimated resource allowance ($0.3 million), partially offset by mining interest temporary difference expense ($0.4 million).
Net Loss
For the year ended December 31, 2010, the Company reported a net loss of $23.3 million or $0.16 per share compared to a net loss of $30.0 million or $0.29 per share in the prior year.
Summary of Quarterly Results
(expressed in thousands of Canadian dollars except per share amounts)
| | | 2010 | | | 2009* | |
| | | Q4 | | | Q3 | | | Q2 | | | Q1 | | | Q4 | | | Q3 | | | Q2 | | | Q1 | |
| Revenue – after pricing adjustments | | $ | 39,502 | | | $ | 38,451 | | | $ | 21,215 | | | $ | 7,930 | | | $ | 1 | | | $ | 1 | | | $ | (1,278 | ) | | $ | 5,295 | |
| Exploration expense | | | 12,532 | | | | 7,008 | | | | 6,421 | | | | 4,165 | | | | 4,287 | | | | 2,623 | | | | 3,916 | | | | 2,408 | |
| Cash provided by (used in) operations | | | (25,234 | ) | | | (20,053 | ) | | | (18,433 | ) | | | (10,172 | ) | | | (12,186 | ) | | | (8,911 | ) | | | 11,464 | | | | 14,455 | |
Cash provided by (used in) operations prior to changes in non-cash working capital per share1 | | $ | 0.00 | | | $ | 0.04 | | | $ | (0.04 | ) | | $ | (0.11 | ) | | $ | (0.11 | ) | | $ | (0.06 | ) | | $ | (0.11 | ) | | $ | 0.01 | |
| Capital expenditures | | | 20,142 | | | | 14,589 | | | | 10,146 | | | | 4,487 | | | | 4,450 | | | | 5,647 | | | | 1,898 | | | | 210 | |
| Net income (loss) | | | (260 | ) | | | 3,185 | | | | (11,560 | ) | | | (14,624 | ) | | | (14,361 | ) | | | (6,194 | ) | | | (9,806 | ) | | | 347 | |
| Net loss per share – basic and diluted | | $ | (0.00 | ) | | $ | 0.02 | | | $ | (0.08 | ) | | $ | (0.11 | ) | | $ | (0.11 | ) | | $ | (0.06 | ) | | $ | (0.11 | ) | | $ | 0.00 | |
*Certain prior period amounts have been reclassified to conform to the classification adopted in the current period.
1 Non-GAAP measure. Please refer to Non-GAAP Measures on pages 40-43.
YEAR END REPORT 2010
North American Palladium Ltd.
FINANCIAL CONDITION, CASH FLOWS, LIQUIDITY AND CAPITAL RESOURCES
Sources and Uses of Cash
| | | 2010 | | | 2009 | | | 2008 | |
| Cash used in operations prior to changes in non-cash working capital | | $ | (14,414 | ) | | $ | (27,656 | ) | | $ | (25,544 | ) |
| Changes in non-cash working capital | | | (59,478 | ) | | | 32,478 | | | | 32,290 | |
| Cash provided by (used in) operations | | | (73,892 | ) | | | 4,822 | | | | 6,746 | |
| Cash provided by (used in) financing | | | 99,353 | | | | 63,669 | | | | 2,105 | |
| Cash provided by (used in) investing | | | (48,557 | ) | | | (13,304 | ) | | | (40,389 | ) |
| Increase (decrease) in cash and cash equivalents | | $ | (23,096 | ) | | $ | 55,187 | | | $ | (31,538 | ) |
Operating Activities
For the year ended December 31, 2010, cash used in operations prior to changes in non-cash working capital was $14.4 million, compared to $27.7 million in the prior year, a decrease of $13.3 million. This decrease is due primarily to the lower net loss of $19.6 million (including $12.9 million increased depreciation and amortization) partially offset by an increase of future income and mining tax recoveries of $7.4 million.
For the year ended December 31, 2010, changes in non-cash working capital resulted in a use of cash of $59.5 million compared to a source of cash of $32.5 million in the prior year. The $59.5 million amount is substantially due to an increase in accounts receivable ($80.7 million) representing LDI’s concentrate shipped for smelting and refining, other assets ($5.3 million), an increase in inventories ($2.0 million) and taxes payable ($1.2 million), partially offset by an increase in accounts payable and accrued liabilities ($29.6 million).
For the year ended December 31, 2010, cash used in operations was $73.9 million compared to cash provided by operations of $4.8 million in 2009.
Financing Activities
For the year ended December 31, 2010, financing activities provided cash of $99.4 million of which $94.2 million related to the net proceeds of the April 2010 equity offering and $5.8 million related to the exercise of warrants ($19.8 million was received subsequent to the year end in January 2011), offset by the scheduled repayment of capital leases of $1.7 million. This compared to cash provided of $63.7 million in the corresponding period last year, the majority of which reflected the $70.1 million net proceeds received from the October 2009 equity offering and flow-through common shares. The Company’s obligations under capital leases increased to $2.4 million at December 31, 2010 from $1.1 million at December 31, 2009 due to new capital lease obligations of $3.0 million, offset by scheduled capital lease repayments of $1.7 million.
In October 2009, the Company completed an equity offering of 18.4 million units for net proceeds of $53.6 million. Each unit consisted of one common share and one-half of one common share purchase warrant of the Company. Each whole warrant (Series A warrants) entitled the holder to purchase an additional common share at a price of $4.25 per share, subject to adjustment, at any time prior to September 30, 2011. Since the 20-day volume weighted average price of the common shares on the TSX was equal to or greater than C$5.75 per share (as per the acceleration event in the warrant indenture), on December 8, 2010 the Company announced the acceleration of the expiry of the Series A warrants to January 14, 2011. As at December 31, 2010, 4,122,076 Series A warrants were exercised for proceeds of $17.5 million. Subsequent to year end, 5,009,986 Series A warrants were exercised for proceeds of $21.3 million, bringing the total proceeds from the exercise of Series A warrants to $38.8 million. 67,938 Series A warrants were not exercised prior to expiry.
YEAR END REPORT 2010
North American Palladium Ltd.
On April 28, 2010, the Company completed an equity offering of 20 million units at a price of $5.00 per unit for total net proceeds of $94.2 million (issue costs $5.8 million), which included the exercise of an over-allotment option in the amount of 2,600,000 units at a price of $5.00 per unit. Each unit consists of one common share and one-half of one common share purchase warrant of the Company. Each whole warrant (Series B warrants) entitles the holder to purchase an additional common share at a price of $6.50, subject to adjustment, at any time prior to October 28, 2011. In the event that the 20-day volume weighted average closing price of the common shares on the TSX is greater than $7.50 per share, the Company may accelerate the expiry date of the warrants by giving notice to the holders thereof and in such case the warrants will expire on the 30th day after the date on which such notice is given by the Company. As at December 31, 2010, 1,240,000 Series B warrants were exercised for total proceeds of $8.1 million.
Investing Activities
For the year ended December 31, 2010, investing activities required cash of $48.6 million, relating to additions to mining interests of $49.4 million as set out in the table below, partially offset by proceeds of disposition $0.8 million. For the year ended December 31, 2009, investing activities required cash of $13.3 million, primarily relating to additions to mining interests of $12.2 million, the majority of which was attributable to the development of the Sleeping Giant gold mine.
Additions to mining interests
| | | 2010 | | | 2009 | | | 2008 | |
| LDI palladium mine | | | | | | | | | |
| Offset Zone development | | $ | 23,689 | | | $ | – | | | $ | | |
| Roby Zone development | | | 2,573 | | | | – | | | | 3,547 | |
| Offset Zone exploration costs | | | 2,334 | | | | – | | | | – | |
| Roby Zone exploration costs | | | 828 | | | | – | | | | – | |
| Jaw crusher | | | 1,124 | | | | – | | | | – | |
| Mill flotation redesign | | | 798 | | | | – | | | | – | |
| Tailings management facility | | | 642 | | | | 310 | | | | 26,668 | |
| Other equipment and betterments | | | 3,504 | | | | 576 | | | | 10,476 | |
| | | $ | 35,492 | | | $ | 886 | | | $ | 40,691 | |
| Sleeping Giant gold mine | | | | | | | | | | | | |
| Shaft deepening | | $ | 5,999 | | | $ | – | | | $ | – | |
| Vezza project | | | 3,633 | | | | – | | | | – | |
| Underground and deferred development | | | 3,006 | | | | 9,760 | | | | – | |
| Other equipment and betterments | | | 994 | | | | 1,230 | | | | – | |
| | | $ | 13,632 | | | $ | 10,990 | | | $ | – | |
| Corporate and other | | | | | | | | | | | | |
| Other equipment and betterments | | $ | 240 | | | $ | 329 | | | $ | – | |
| | | $ | 49,364 | | | $ | 12,205 | | | $ | 40,691 | |
In addition to the mining interests acquired by cash reflected in the above table, the Company also acquired by means of capital leases, equipment in the amount $3.0 million for the year ended December 31, 2010. In September 2010, 1,368,421 shares were issued for $6.5 million to purchase the Vezza property, in addition to $3.5 million in cash, which was added to mining interests.
Capital Resources
As at December 31, 2010 the Company had cash and cash equivalents of $75.2 million compared to $98.3 million as at December 31, 2009. The funds are invested in short term interest bearing deposits at a major Canadian chartered bank.
YEAR END REPORT 2010
North American Palladium Ltd.
In July 2010, the Company obtained a $30 million operating line of credit with the Bank of Nova Scotia. The credit facility has a one year term, secured by the Company's accounts receivables and may be used for working capital liquidity and general corporate purposes. At December 31, 2010, the operating line of credit was undrawn.
For the year ended December 31, 2010, $17.5 million of Series A and $8.1 million Series B warrants were exercised, of which $5.8 million was received in cash and $19.8 million was received subsequent to year end. In January 2011, the Company received additional proceeds of $21.3 million from the exercise of Series A warrants. In addition, the Company closed its $22 million financing of flow-through shares in February 2011.
The cash flow from the LDI palladium mine and the Sleeping Giant gold mine, together with the Company’s cash reserves and credit facilities, are expected to be sufficient to fund the Company’s requirements in 2011.
Contractual Obligations
| As at December 31, 2010 | | Payments Due by Period | |
| (expressed in thousands of Canadian dollars) | | Total | | | 1 Year | | | 2-3 Years | | | 4-5 Years | | | >5 years | |
| Capital lease obligations | | $ | 2,558 | | | $ | 1,307 | | | $ | 980 | | | $ | 221 | | | $ | 50 | |
| Operating leases | | | 4,115 | | | | 2,057 | | | | 934 | | | | 677 | | | | 447 | |
| Purchase obligations | | | 37,189 | | | | 37,189 | | | | – | | | | – | | | | – | |
| | | $ | 43,862 | | | $ | 40,553 | | | $ | 1,914 | | | $ | 898 | | | $ | 497 | |
In addition to the above, the Company also has asset retirement obligations at December 31, 2010 in the amount of $11.6 million that would become payable at the time of the closures of the LDI and Sleeping Giant mines. Deposits established by the Company to offset these future outlays amount to $10.5 million. As a result, $1.1 million of funding is required prior to closure of the mines.
Related Party Transactions
There were no related party transactions for the year ended December 31, 2010.
As of February 23, 2011, there were 162,371,897 common shares of the Company outstanding. In addition, there were options outstanding pursuant to the Amended and Restated 2010 Corporate Stock Option Plan entitling holders thereof to acquire 3,989,164 common shares of the Company at a weighted average exercise price of $4.31 per share. As of the same date, there were also 8,760,000 Series B warrants outstanding, each warrant entitling the holder thereof to purchase one common share at a weighted average exercise price of $6.50 per share.
YEAR END REPORT 2010
North American Palladium Ltd.
LDI Palladium Mine
The key operating results for the LDI palladium mine are set out in the following table.
| | | 2010 | | | 2009 | | | 2008 | |
| Tonnes of ore milled | | | 649,649 | | | | – | | | | 3,722,732 | |
| Production | | | | | | | | | | | | |
| Palladium (oz) | | | 95,057 | | | | – | | | | 195,083 | |
| Gold (oz) | | | 4,023 | | | | – | | | | 15,921 | |
| Platinum (oz) | | | 4,894 | | | | – | | | | 16,311 | |
| Nickel (lbs) | | | 395,622 | | | | – | | | | 2,503,902 | |
| Copper (lbs) | | | 658,013 | | | | – | | | | 4,623,278 | |
| Palladium head grade (g/t) | | | 6.06 | | | | – | | | | 2.33 | |
| Palladium recoveries (%) | | | 80.8 | | | | – | | | | 75.3 | |
| Tonnes of ore mined | | | 615,926 | | | | – | | | | 3,676,418 | |
| Cost per tonne milled | | $ | 62 | | | | – | | | $ | 31 | |
Total cash cost ($USD)1 | | $ | 283 | | | | – | | | $ | 283 | |
The LDI mine consists of an open pit, an operating underground mine (currently producing from the Roby Zone), and a mill with a nominal capacity of approximately 15,000 tonnes per day. The primary deposits on the property are the Roby Zone and the Offset Zone, both disseminated magmatic nickel-copper-platinum group metal (“PGM”) deposits.
For the year ended December 31, 2010, 615,926 tonnes of ore was extracted, of which 608,872 tonnes came from the Roby Zone with an average palladium grade of 6.16 grams per tonne, and 7,054 tonnes of silling ore came from the Offset Zone at an average palladium grade of 7.88 grams per tonne. During 2009, no ore was extracted as the LDI mine was on temporary care and maintenance. Ore production from the Roby Zone at the LDI mine is operating at 2,600 tonnes per day, seven days a week, on two 12-hour shifts per day. The Company has a workforce of approximately 208 people at LDI and a new collective agreement with the United Steelworkers that is effective until May 31, 2012.
To achieve a seamless transition from Roby Zone mining to Offset Zone mining while the mine expansion development work continues, the Company will continue mining from the Roby Zone during 2011 and augment production by processing lower grade ore from surface stockpiles to take advantage of the favourable price environment. In 2011, the Company forecasts that the LDI mine will produce between 165,000 to 175,000 ounces of payable palladium, comprised of 10,000 ounces from the Offset Zone and the balance from the Roby Zone and surface stockpiles.
Cash costs1 per ounce are expected to be in the range of US$340 to US$370 in 2011. Cash costs1 are expected to be higher during the first half of the year due to seasonal trends that impact operating costs, such as increased use of propane during the winter season. Cash costs1 per ounce are presented net of byproduct credits and can be materially affected by changes in byproduct metal prices, as well as the Canadian/US dollar exchange rate. The 2011 guidance assumes the following: US$1,350/oz Au, US$1,650/oz Pt, US$3.75/lb Cu, US$10.00/lb Ni and an exchange rate of 1.00.
LDI Mill
For the year ended December 31, 2010, the LDI mill processed 649,649 tonnes of ore at an average of 6,564 tonnes per operating day, producing 95,057 ounces of payable palladium at an average palladium head grade of 6.06 grams per tonne, with a palladium recovery of 80.8%, and mill availability of 96.3%. During 2009, the LDI mill was on temporary care and maintenance. Production costs, per tonne of ore milled, was $62 for the year ended December 31, 2010. The mill is operating on a batch basis, with a two-week operating and a two-week shutdown schedule.
1 Non-GAAP measure. Please refer to Non-GAAP Measures on pages 40-43.
YEAR END REPORT 2010
North American Palladium Ltd.
For the year ended December 31, 2010, the Company incurred capital costs relating to the LDI mill of $2.5 million, which included the jaw crusher ($1.1 million), mill flotation redesign ($0.8 million), and other equipment and betterments ($0.6 million).
LDI Mine Expansion Project Update
The Company is currently expanding the LDI mine to transition from mining from the Roby Zone (via ramp access) to mining from in Offset Zone (via shaft). The development work for the mine expansion is underway, with commercial production from the shaft targeted for the fourth quarter of 2012. Once completed, the LDI mine is expected to become a long life, low cost producer of palladium.
Based on a scoping study done by P&E Mining Consultants Ltd. (“P&E”) and recent exploration success, the Company is advancing the mine expansion project to the Offset Zone by way of shaft access, with a capacity of approximately 3,500 tonnes per day (starting in the fourth quarter of 2012) and then increasing to 5,500 tonnes per day (starting in the first quarter of 2015). The mining method to be utilized is called “Super Shrinkage”, a high volume bulk mining method similar to that used by Agnico-Eagle Limited at their Goldex mine in Quebec. This method increases the overall upfront capital requirements but is expected to significantly reduce the operating costs compared to other mining methods, while allowing the Company to significantly increase production to over 250,000 ounces per year from 2015 and onwards at significantly reduced cash costs1 (expected to decline to less than US$150 per ounce).
The mine expansion’s execution risk is mitigated since the LDI complex already includes a mill, tailings management facility, infrastructure and the Company has permits in place. Timing risk has been substantially diminished as the Company has already purchased the production, sinking and service cage hoists that are critical to the project. NAP hired a seasoned project management group with significant underground development experience. This team is onsite at LDI and is responsible for all aspects of the Offset Zone development which includes procuring the major construction components of the project as well as providing technical support to the contractors.
The Company estimates capital expenditures at LDI for 2011 as follows:
| | | 2011 | |
| Capital Expenditures | | | |
| Definition drilling | | $ | 2,250 | |
| Ramp, infrastructure and service development | | | 22,355 | |
| Surface, shaft and service facilities | | | 64,939 | |
| Mining and surface equipment | | | 14,374 | |
| Engineering, services and project management | | | 25,400 | |
| Contingency (13.7%) | | | 17,700 | |
| Total | | $ | 147,019 | |
Development work in 2011 will be focused on:
| | · | Completing the raised bore section of the production shaft and ventilation raise bore; |
| | · | Installing adequate ventilation at surface and underground; |
| | · | Advancing the ramp towards the 4570 mine level; |
| | · | Developing the 4790 mine level; |
| | · | Constructing the head frame, hoist room and substation; and |
YEAR END REPORT 2010
North American Palladium Ltd.
Sleeping Giant Gold Mine
The key operating results for the Sleeping Giant gold mine are set out in the following table.
| | | 2010 | | | 2009 | |
| Tonnes of ore milled | | | 93,296 | | | | – | |
| Production | | | | | | | | |
| Gold (oz) | | | 17,695 | | | | – | |
| Gold head grade (g/t) | | | 5.90 | | | | – | |
| Gold recoveries (%) | | | 95.5 | | | | – | |
| Tonnes of ore hoisted | | | 95,261 | | | | – | |
| Cost per tonne milled | | $ | 305 | | | | – | |
Total cash cost ($USD)1 | | $ | 1,549 | | | | – | |
The Sleeping Giant gold mine consists of an underground mine and a mill with a capacity of 900 tonnes per operating day. For the year ended December 31, 2010, 95,261 tonnes of ore was hoisted from the underground mine with an average gold grade of 5.90 grams per tonne.
Since commencing operations at the Sleeping Giant mine, mining activities have been confined to zones mined by the previous owners. The ramp up to steady-state production in these zones has proceeded at a slower pace than expected as the tonnes and grade were not in line with initial expectations. The Company’s original mine plan was based on a technical report with wider drill spacing, which in consideration of the mine’s geology, caused some of the challenges in accessing the higher grades in 2010. Development work and tighter infill drilling continued in the latter part of 2010 to better manage grade control issues. During the last quarter of 2010, the Company initiated an incentive program to retain and attract experienced miners to potentially increase production in the future.
New higher grade zones are currently under development in preparation for 2012 production, which will be accessible once the 200 meter shaft deepening and lateral development are completed. The mine shaft deepening is expected to be completed in the second quarter of 2011, following which development work will commence on the three new mining levels. This will allow the Company to follow the continuity trends at depth of the higher grade zones that have historically fed the mill.
Mining in 2011 will be focused on the areas around the 975 elevation and above of the Sleeping Giant mine. The Company expects to increase the number of stopes over the course of the year and will continue to adjust its mine plan and methods in order to optimize operations.
Sleeping Giant Mill
For the year ended December 31, 2010, the mill processed 93,296 tonnes of ore, producing 17,695 ounces of gold at an average gold head grade of 5.90 grams per tonne, with a gold recovery of 95.5% and mill availability of 98.2%. Production costs per tonne of ore milled were $305 for the year ended December 31, 2010.
At December 31, 2010, the mill contained approximately 2,595 ounces of gold that was included in inventory and valued at net realizable value, as it had not been sold by the end of the period.
The Sleeping Giant mill has a rated capacity of 900 tonnes per day and was operating at approximately 766 tonnes per operating day, for the year ended December 31, 2010.
1 Non-GAAP measure. Please refer to Non-GAAP Measures on pages 40-43.
YEAR END REPORT 2010

North American Palladium Ltd.
As part of NAP’s growth strategy for its gold operations, during 2010 the Company initiated an expansion study for Sleeping Giant’s mill, which has the potential to serve NAP’s other gold projects in the Abitibi region. For a capital cost of approximately $7 million, in 2011 NAP will expand the mill to 1,250 tonnes per day. The expansion is planned to commence in February and is expected to be completed in September 2011. No significant interruption is expected to result from the mill expansion activities. The expanded mill will be engineered in advance to accommodate a further expansion to 1,750 tonnes per day should the development of NAP’s other gold projects require additional mill capacity. The cost of such further expansion is currently estimated at $3 million and would result in minimal disruptions of the mill activities.
Offset Zone
The Offset Zone of the LDI property was discovered by the Company’s exploration team in 2001. The Offset Zone is located below and approximately 250 metres to the southwest of the Roby Zone. On May 27, 2010, NAP published an updated mineral resource estimate by Scott Wilson Roscoe Postle Associates Ltd (“RPA”) that included the results of drilling completed in 2009. RPA concluded that the Offset Zone still remains open along strike to the north, south and at depth. The resource estimate also increased the palladium indicated resources grade in the Offset Zone by 25%, from 5.02 grams per tonne (the last published resource grade in March 2009) to 6.29 grams per tonne.
Based on work done up to the end of 2009, the estimated mineral resources of the Offset Zone are as follows:
| Category | | Tonnes (millions) | | | Pd g/t | | | Pt g/t | | | Au g/t | | | Ni % | | | Cu % | | | Pd (000 oz) | |
| Indicated | | | 8.628 | | | | 6.29 | | | | 0.419 | | | | 0.395 | | | | 0.136 | | | | 0.110 | | | | 1,745 | |
| Inferred | | | 3.322 | | | | 5.70 | | | | 0.352 | | | | 0.233 | | | | 0.095 | | | | 0.074 | | | | 609 | |
1. Mineral Resources for the underground Offset Zone were estimated at a cut-off grade of 4.0 g/t Pd (6.0 g/t PdEq).
2. PdEq factors were calculated separately for each area, based on operating cost and metallurgical performance estimates appropriate for those areas.
3. Metal price assumptions of US$400/oz Pd; US$1,400/oz Pt; US$1,000/oz Au; US$3.00/lb Cu; US$8.50/lb Ni; US$20/lb Co. Exchange rate is 1.11 US$/C$.
It should be noted that the updated resource for the Offset Zone does not include drilling data from the Cowboy and Outlaw zones, as there was insufficient drill data at the time for a resource estimate. An updated resource estimate for LDI is expected in the second quarter of 2011.
On February 14, 2011, the Company provided an update on the third tranche of drill results from its 2010 exploration program on the Offset and Roby zones. In total, 217 holes totalling 76,995 metres were completed in 2010, of which:
| | | 38 holes (8,925 metres) were completed from underground on the extension of the Roby Zone; |
| | | 163 holes (58,025 metres) were completed on the Offset Zone including: |
| | (i) | underground on the upward extension of the Upper Offset Zone (mine elevation 4900 and higher); |
| | (ii) | on the central Offset Zone to complete the previous drilling pattern and to follow its northern extension; and |
| | (iii) | from surface with directional drilling, with the first deep holes into the lower Offset Zone (mine elevation 4650 and lower). |
| | | 6 holes (5,740 metres) were completed from surface on the new south-east zone (the Sheriff Zone); and |
| | | 10 holes (4,305 metres) were completed from surface on the Creek Zone and West Pit Area. |
North American Palladium Ltd.
Results were positive and expanded the Offset and Roby zones, which are still open laterally and at depth. The Offset Zone was drilled toward surface with mineralization intersected up to the 4950 level.
On August 16, 2010, NAP announced a positive Scoping Study on the Offset Zone. Effective as of that date, the Company commenced capitalizing Offset Zone exploration costs.
Cowboy and Outlaw Zones
The Cowboy Zone is located 30 to 60 metres to the west of the Offset Zone and was discovered in 2009 during infill drilling of the Offset Zone. This new discovery has the potential to extend the life of the LDI mine which could favorably impact the economics of the mine. The first phase of the drilling campaign indicated that the Cowboy Zone extends for up to 250 metres along strike and 300 metres down dip. The assay results from the Phase 2 drilling extended the limit of the Cowboy Zone 50 metres farther to the north for a total strike length of 300 metres. The Outlaw Zone was intersected to the west of the Cowboy Zone and further drilling is required to explore the vertical and lateral limit of this mineralization. Additional infill drilling will be needed before resource calculations can be completed on the Cowboy and Outlaw zones. With the development of the ramp into the Offset Zone, further exploration drilling of the Cowboy and Outlaw zones will continue in 2011.
Legris Lake Property
During the second quarter of 2010, the Company signed an Option and Purchase Agreement with prospectors pursuant to which the Company can acquire a 100% interest in the Legris Lake property in exchange for cash payments totalling $0.3 million, advance royalty payments totalling $0.1 million, and a 2.5% NSR. A portion of the royalty can be purchased by the Company and the Company has a right of first refusal on the sale of the royalties.
The property is adjacent to the south east portion of the Company’s LDI property and is comprised of 15 claims and covering an area of approximately 4,297 hectares. The property is underlain by mafic and ultramafic rocks and was optioned for its PGE potential. The property is at a preliminary exploration stage and surface mapping, trenching and sampling started in the third quarter of 2010, with diamond drilling performed in the fourth quarter of 2010.
Sleeping Giant Gold Mine
The main focus of the drilling program that was conducted in the latter half of 2009 at Sleeping Giant was to demonstrate the potential to further extend the mine life. The extensional drill program resulted in additional resources both below and adjacent to the current mine workings, including extensions of the 30 West, 8N18, 785N and 20 zones. The primary objective of the 2010 exploration program at Sleeping Giant was to define and extend zones within the current mine (including infill drilling to achieve greater certainty of the mine’s grades), and at depth on the proposed three new mining levels. During 2010, 194 drill holes were completed at Sleeping Giant, totalling 37,862 metres.
Systematic drilling from underground stations has improved the Company’s understanding of several previously known zones and extended them to greater depth. Although not all results are yet available, selected results were released on February 14, 2011.
Ongoing property-scale surface exploration surrounding Sleeping Giant in 2010 also identified significant new veins marked by visible gold, east and south of the current mine workings. Drilling from surface included 12 drill holes totalling 5,760 metres. The new gold veins report grades of 11.7 grams per tonne gold and 12.3 grams per tonne gold over 1 metre, which are comparable to grades at the mine. These new occurrences are located approximately 500 metres south of the formerly worked JD zones.
YEAR END REPORT 2010
North American Palladium Ltd.
Vezza Gold Property
In September 2010, the Company acquired the Vezza gold property from Agnico-Eagle Mines Limited (“AEM”), for consideration of $10 million. Vezza is an advanced-stage exploration project approximately 85 kilometres from the Sleeping Giant mill. The project is estimated to have 288,000 contained ounces of gold in the measured and indicated categories (1,517,000 tonnes grading 5.9 grams per tonne gold) and an additional 121,000 contained gold ounces in the inferred category (754,000 tonnes grading 5.0 grams per tonne gold). On February 23, 2010 the Company filed a NI 43-101 Technical Report for the project that was prepared by RPA, an independent Qualified Person. The deposit was subject to extensive surface and underground exploration and development from 1995 to 1998 by AEM.
In 2010, NAP completed 74 drill holes from surface for a total of 12,105 metres. The surface drilling program confirmed both continuity and grade in the near surface, eastern extension of the deposit.
The Company is currently dewatering the shaft and underground drifts to conduct underground diamond drilling. Results from the exploration and development work in 2011 will allow the Company to better evaluate the project before making a production decision at the end of the year. If a positive production decision is made, gold production could begin in the first quarter of 2012 from the expanded Sleeping Giant mill, increasing to 39,000 ounces per year over a seven to nine year mine life. A bulk sample of up to 40,000 tonnes is planned for 2011.
Discovery Property
Located approximately 70 kilometres from the Sleeping Giant mill, Discovery is an advanced exploration property. At the end of 2009, the Company filed an environmental impact study for the Discovery project and applied for a mining lease to continue to advance the property toward a future underground exploration program. The permitting process continues and the Company now expects to finalize the process during the first quarter of 2011.
In 2010, 40 drill holes totalling 25,495 metres were completed, two-thirds of which have now been logged and analyses received. Drilling was aimed at extending the 1200E zone, which was not considered in the 2008 Scoping Study, which considered the west gold zones only. Drilling the eastern extension of the 1200E zone has revealed new gold zones at depth and followed known zones deeper and eastward. An updated estimate of resources will be prepared once all data has been received and integrated into a geological model, expected in the second quarter of 2011.
Based on a 2008 scoping study, Discovery can potentially produce 44,000 ounces of gold per year for four years. During 2011, the Company intends to update the scoping study with current costs and estimated future gold prices.
In 2010, a 4,200-meter surface drilling program on the 1200E sector of the property was started in order to expand the gold zones intersected in 2008.
Flordin Property
The Flordin property is approximately 40 kilometres north of the town of Lebel-sur-Quévillon, Quebec, in close proximity to NAP’s Discovery project and within trucking distance of the Sleeping Giant mill. Preliminary exploration drilling in 2008 intersected several mineralized zones, expanding the known dimensions of the mineralized area. InnovExplo Inc., an independent Qualified Person, was contracted in 2009 to prepare a NI 43-101 resource estimate on the property. The presence of several parallel gold veins near surface led to consideration of possible open pit mining scenarios. Using a 2 gram per tonne gold cut-off, the NI 43-101 report estimates that the property contains 679,000 tonnes of measured and indicated resources at an average grade of 4.25 grams per tonne gold for 92,814 contained ounces and an additional inferred resource of 1,451,400 tonnes grading 3.63 grams per tonne gold for a total of 169,261 contained ounces.
Exploration on the Flordin property in 2010 consisted of a significant drilling program (212 holes for 25,720 metres), which brought coverage of the central part of the known deposit to an approximate 30 by 30 meter drill hole spacing. Many drill holes remain to be logged and work will continue in the Lebel-sur-Quevillon office over the winter of 2011. Exploration expenses for 2010 totaled approximately $2.4 million.
YEAR END REPORT 2010
North American Palladium Ltd.
An updated estimate of mineral resources was begun by an independent consultant and is expected to be ready in the second quarter of 2011 after all the drill holes are logged and analyses received. The Company believes that the Flordin gold property could have the potential to provide additional feed for the Sleeping Giant mill. Although not all results are yet available, selected results were released on February 14, 2011.
Cameron Shear and Florence Properties
The Company has an option to earn a 50% interest in the Cameron Shear property, which is currently 100% owned by Canadian Royalties Inc. Florence is a small 100% Cadiscor-owned property that is located north and adjacent to the Cameron Shear property. These properties are adjacent and to the east of the Discovery gold deposit. A 5,000 meter drill program started in the latter half of 2010. Drilling on a number of geophysical targets has improved the Company’s understanding of the early-stage properties, although economic intersections have yet been encountered at this juncture. The logging and sampling for analysis is still ongoing.
Dormex Property
The Dormex project is located adjacent to the Sleeping Giant mine and mill, and is believed to have potential gold targets similar to Sleeping Giant. This property is covered by an average 10 metres of overburden. In the fourth quarter of 2010, the Company continued its surface exploration program at the Dormex property, combining geophysical surveys and reverse circulation drilling of the overburden.
In 2010, the Company completed a major reverse circulation drill program of 3,064 metres in order to better delineate overburden gold anomalies already known on the property. An exploration program including ground and airborne geophysics was completed in late 2010. The Company drilled nine conventional holes for a total of 4,206 metres. Logging and analysis of the 2010 work is ongoing and is expected to influence the 2011 drilling program once all new information is interpreted and integrated.
Laflamme Gold Property
In 2009, the Company entered into an option and joint venture agreement with Midland Exploration Inc. (“Midland”) to earn an initial 50% interest in the Laflamme gold property. Strategically located between the Company’s Sleeping Giant gold mine and the Comtois gold deposit in Quebec’s Abitibi region, the Laflamme gold property consists of 410 claims covering a surface area of approximately 220 square kilometres west of Lebel-sur-Quevillon. Laflamme offers excellent potential for gold mineralization. A study conducted by the Ministère des Ressources naturelles et de la Faune du Québec in 2009 identified a list of gold-bearing targets in major structures that appear on the property. The Laflamme property stretches 20 to 60 kilometres east of the Sleeping Giant mine. In 2009, the company conducted an electro-magnetic aerial survey over the property in order to identify exploration targets. The survey results were analyzed and a number of targets were identified and line-cutting and ground geophysical surveys were initiated in 2010. A 4,000 meter drilling campaign on the anomalies was initiated before the end of 2010, following the interpretation of the ground geophysical surveys. Diamond drilling was completed on some of the targets. Drilling on a number of geophysical targets has improved the Company’s understanding of the early-stage property, although economic intersections have yet been encountered at this juncture. The logging and sampling for analysis is still ongoing.
Shebandowan Property
The Company holds a 50% interest in the former producing Shebandowan mine and the surrounding Haines and Conacher properties pursuant to an Option and Joint Venture Agreement with Vale Inco Limited (“Vale”). The properties, known as the Shebandowan property, contain a series of nickel-copper-PGM mineralized bodies. The land package, which totals approximately 7,842 hectares, is located 90 kilometres west of Thunder Bay, Ontario, and approximately 100 kilometres southwest from the Company’s LDI mine. Vale retains an option to increase its interest from 50% to 60%, exercisable in the event that a feasibility study on the property results in a mineral reserve and mineral resource estimate of the equivalent of 200 million pounds of nickel and other metals.
YEAR END REPORT 2010
North American Palladium Ltd.
In 2010, the Company and Vale conducted a large ground geophysical survey on the property. Preliminary results support further exploration work on the property and the parties approved an 8-hole, 3,000 metres drilling program that was completed by the end of the year.
| CRITICAL ACCOUNTING POLICIES AND ESTIMATES |
Critical accounting policies generally include estimates that are highly uncertain and for which changes in those estimates could materially impact the Company’s financial statements. The following accounting policies are considered critical:
The preparation of financial statements requires management to make estimates and assumptions that affect the reported amount of assets and liabilities, and disclosure of contingent assets and liabilities at the date of the financial statements and the reported amounts of revenue and expenses during the year. Significant estimates and assumptions relate to recoverability of mining operations and mineral exploration properties. While management believes that these estimates and assumptions are reasonable, actual results could vary significantly.
Certain assumptions are dependent upon reserves, which represent the estimated amount of ore that can be economically and legally extracted from the Company’s properties. In order to estimate reserves, assumptions are required about a range of geological, technical and economic factors, including quantities, grades, production techniques, recovery rates, production costs, transportation costs, commodity demand, commodity prices and exchange rates. Estimating the quantity and/or grade of reserves requires the size, shape and depth of ore bodies to be determined by analyzing geological data such as drilling samples. This process may require complex and difficult geological judgments to interpret the data.
Because the economic assumptions used to estimate reserves change from period to period, and because additional geological data is generated during the course of operations, estimates of reserves may change from period to period. Changes in reported reserves may affect the Company’s financial results and financial position in a number of ways, including the following:
| | a. | Asset carrying values may be affected due to changes in estimated future cash flows; |
| | b. | Amortization charged in the income statement may change where such charges are determined by the units of production basis, or where the useful economic lives of assets change; |
| | c. | Overburden removal costs recorded on the balance sheet or charged to the income statement may change due to changes in the units of production basis of amortization; |
| | d. | Decommissioning, site restoration and environmental provisions may change where changes in estimated reserves affect expectations about the timing or cost of these activities; and |
| | e. | The carrying value of future tax assets may change due to changes in estimates of the likely recovery of the tax benefits. |
| b. | Impairment assessments of long-lived assets |
Each year, the Company reviews mining plans for the remaining life of each property. Significant changes in the mine plan can occur as a result of mining experience, new discoveries, changes in mining methods and rates, process changes, investments in new equipment and technology and other factors. The Company reviews its accounting estimates and adjusts these estimates based on year-end recoverable minerals determined by the Company, in the current mine plan.
YEAR END REPORT 2010
North American Palladium Ltd.
The Company reviews and evaluates its long-lived assets for impairment when events or changes in circumstances arise that may result in impairments in the carrying value of those assets. Impairment is considered to exist if total estimated future undiscounted cash flows are less than the carrying amount of the asset. Future cash flows are estimated based on quantities of recoverable minerals, expected palladium, gold, and other commodity prices and expected foreign exchange rates (considering current, historical and expected future prices and foreign exchange rates and related factors), production levels and cash costs of production and capital and reclamation expenditures, all based on detailed life-of-mine plans and projections. The term “recoverable minerals” refers to the estimate of recoverable production from measured, indicated and inferred mineral resources that are considered economically mineable and are based on management’s confidence in converting such resources to proven and probable reserves. Assumptions underlying future cash flow estimates are subject to risk and uncertainty. Any differences between significant assumptions and market conditions such as metal prices, exchange rates, recoverable metal, and/or the Company’s operating performance could have a material effect on the Company’s ability to recover the carrying amounts of its long-lived assets resulting in possible additional impairment charges.
| c. | Amortization of mining interests |
The Company amortizes a large portion of its mining interests using the unit of production method based on proven and probable reserves to which they relate or on a straight-line basis over their estimated useful lives, ranging from three to seven years.
Revenue from the sale of palladium and by-product metals from the LDI mine is provisionally recognized net of royalties based on quoted market prices upon the delivery of concentrate to the smelter, which is when title transfers and the rights and obligations of ownership pass. The Company’s smelter contract provides for final prices to be determined by quoted market prices in a period subsequent to the date of concentrate delivery. Variations from the provisionally priced sales are recognized as revenue adjustments when final pricing is determined. Concentrate awaiting settlement is an accounts receivable that is recorded net of estimated treatment and refining costs which is subject to final assay adjustments.
Revenue from the sale of gold-silver doré bars from Sleeping Giant is recognized when the significant risks and awards of ownership have transferred to the buyer and selling prices are known or can be reasonably estimated.
| e. | Asset retirement obligations |
Asset retirement obligations are recognized when incurred and recorded as liabilities at fair value. The amount of the liability is subject to re-measurement at each reporting period. The liability is accreted over time through periodic charges to earnings. In addition, the asset retirement cost is capitalized as part of mining interests and amortized over the estimated life of the mine.
| FUTURE ACCOUNTING STANDARDS |
Impact of International Financial Reporting Standards (“IFRS”)
In February 2008, the CICA Accounting Standards Board (“AcSB”) confirmed that Canadian GAAP for publicly accountable enterprises will be converged with IFRS effective in calendar year 2011, with early adoption allowed starting in calendar year 2009. The Company is required to adopt IFRS for the reporting of its interim and annual financial statements beginning on January 1, 2011. IFRS uses a conceptual framework similar to Canadian GAAP, but there are significant differences in recognition, measurement and disclosures.
The adoption of IFRS will make it possible for the Company to re-assess the fair values of assets and liabilities on its balance sheet under IFRS 1, which could impact the balance sheet significantly. Within IFRS 1 there are exemptions, some of which are mandatory and some of which are elective. The exemptions provide relief for companies from certain requirements in specified areas when the cost of complying with the requirements is likely to exceed the resulting benefit to users of financial statements. IFRS 1 generally requires retrospective application of IFRSs on first-time adoption, but prohibits such application in some areas, particularly when retrospective application would require judgments by management about past conditions after the outcome of a particular transaction is already known.
YEAR END REPORT 2010
North American Palladium Ltd.
An effective conversion to IFRS requires that the Company address issues pertaining to various elements. These elements include financial reporting expertise, accounting policies, internal controls over financial reporting (“ICFR”) and disclosure controls and procedures (“DC&P”), business activities, and consideration of the Company’s information systems.
Financial Reporting Expertise
The Company is committed to ensuring that its board, management and employees possess the appropriate technical training to facilitate a smooth transition to IFRS. In preparation for the transition to IFRS, key members of the IFRS project team attended various seminars and information sessions and reviewed IFRS standards with a focus on identifying existing and emerging issues relating to the conversion to IFRS and ensuring their inclusion in the Company’s preliminary conversion project scoping analysis. Based on the transition issues identified, the Company’s IFRS project team has performed an evaluation of the impact of the adoption of IFRS on its consolidated financial statements, including the optional exemptions which may be elected by the Company under IFRS 1, the transitional standard addressing initial adoption of IFRS.
During 2009 and 2010, key management personnel attended various seminars and information sessions regarding IFRS standards and related transition issues and held informal discussions with key operational and IT personnel regarding the pending changes under IFRS. Management has consulted with its external auditors regarding the evaluation of its readiness for conversion and the identification of key IFRS issues and has utilized various external resources to identify and obtain appropriate sources of IFRS guidance.
Information and update sessions were held with members of the Board of Directors (including Audit Committee members) in 2009 and 2010. At these information sessions, management and external consultants provided an overview of the project timeline and potential transition issues, IFRS standards and developments affecting the Company, and identified impacts on the financial statements of the Company.
Preliminary IFRS Consolidated Opening Balance Sheet
To transition to IFRS, the Company must apply “IFRS 1 – First Time Adoption of IFRS” that sets out the rules for first time adoption. In general, IFRS 1 requires an entity to comply with each IFRS effective at the reporting date for the entity’s first IFRS financial statements. This requires that an entity apply IFRS to its opening IFRS balance sheet as at the beginning of the earliest comparative period presented in the entity’s first IFRS financial statements, being January 1, 2010.
During the fourth quarter of 2010, the Company completed the reconciliation of its preliminary opening IFRS balance sheet as at January 1, 2010, which reflects the impact of the applicable IFRS 1 elections the Company expects to apply in its transition to IFRS. The opening balance sheet also reflects the impact of accounting policy differences arising from the transition from Canadian GAAP to IFRS.
The opening consolidated IFRS balance sheet, the discussion regarding IFRS 1 elections, and IFRS accounting policies presented in this MD&A, are preliminary in nature. The final IFRS opening consolidated balance sheet that will be reflected in the IFRS interim first quarter consolidated financial statements dated March 31, 2011 may reflect adjustments relating to any new IFRS pronouncements or other reconciling items which may be identified during the first quarter of 2011.
Exemptions applied under IFRS 1
In preparing the interim consolidated financial statements in accordance with IFRS 1, the Company has applied certain of the optional exemptions and all mandatory exceptions from full retrospective application of IFRS.
| A) | Optional exemptions from full retrospective application |
In the first year of adoption, IFRS 1 allows optional exemptions from the general requirements to apply certain IFRS standards in effect when the Company prepares its interim and annual financial statements. The following summarizes the preliminary discussion relating to those optional exemptions under IFRS 1 and related elections available to the Company.
YEAR END REPORT 2010
North American Palladium Ltd.
Business combinations exemption
The Company has elected to apply the business combinations exemption. As a result, the Company has not restated business combinations or otherwise applied IFRS 3 Business Combinations to any acquisitions of subsidiaries or of interests in associates and joint ventures that occurred before the Company’s January 1, 2010 transition date.
Share-based payment transaction exemption
The Company has elected to apply the share-based payment exemption. As a result, IFRS 2 Share-based Payment has not been applied to any equity instruments that were granted on or before November 7, 2002, nor has it been applied to equity instruments granted after November 7, 2002 that vested before the latter of January 1, 2005 and the date of transition of January 1, 2010. For cash-settled share-based payment arrangements, the Company has not applied IFRS 2 to liabilities that were settled before January 1, 2010.
Fair value as deemed cost exemption
The Company has elected to utilize the deemed cost exemption for the valuation of certain assets held by its LDI and Sleeping Giant mines. By making this election, the Company is permitted to measure certain items of property, plant and equipment at fair values determined on or before January 1, 2010, with appropriate retrospective adjustments applied under IFRS during the interim period reflected in the opening IFRS balance sheet at January 1, 2010. Other mining interests have been recorded under IFRS using historical costs.
Leases exemption
The Company has elected to evaluate the existence of whether certain arrangements contain leases as at the transition date of January 1, 2010 based on facts and circumstances existing at that date. As a result, retrospective evaluation and restatement was not required and has not been applied by the Company.
Investments in subsidiaries, jointly controlled entities and associates exemption
At the January 1, 2010 transition date, the Company would be required to account for investments in subsidiaries at cost or fair value in accordance with IAS 39. However, the application of this exemption, provided by IFRS 1, allows the Company to elect the previous Canadian GAAP carrying amount to be the deemed cost under IFRS at the January 1, 2010 transition date. The Company has elected to apply this exemption to its subsidiary operations.
Assets and liabilities of subsidiaries, associates and joint ventures exemption
This exemption is not applicable since the use of the exemption is made at the level of the subsidiary, associate or joint venture that adopts IFRS later than its parent company. The Company and its subsidiaries completed the transition and adoption of IFRS concurrently.
Compound financial instruments exemption
Under this exemption, a first-time adopter need not separate the liability and equity components under the IAS 32 requirements if the liability component is no longer outstanding on January 1, 2010 transition date. Since various compound financial instruments in the form of convertible notes, debentures, and unit offerings with foreign-denominated warrants have been used by the Company in recent years, the Company has elected to apply this exemption relating to compound instruments.
Designation of previously recognized financial instruments exemption
This exemption permits an election to initially recognize certain financial instruments as available-for-sale or designate certain instruments as being at fair value through profit or loss at the date of transition. Neither the Company nor its subsidiaries possessed financial assets or liabilities at January 1, 2010 which would benefit from the application of this exemption. Therefore, the Company has elected not to apply this exemption to its IFRS consolidated financial statements.
YEAR END REPORT 2010
North American Palladium Ltd.
Fair value measurement of financial assets or liabilities at initial recognition
This exemption restricts the fair value approach under IAS 39, requiring consistent application of the methodology to be applied prospectively from October 25, 2002 or January 1, 2004. As a result of other IFRS 1 exemptions and standards applied, the Company and its subsidiaries’ financial assets and liabilities reflected in the January 1, 2010 IFRS consolidated opening balance sheet relate to the period after the specified dates for prospective application and would therefore not benefit from the application of this election. As a result, the Company has elected not to apply this exemption to its IFRS consolidated financial statements.
Decommissioning liabilities included in the cost of property, plant and equipment exemption
The Company recognizes an asset retirement obligation (“ARO”) in respect of environmental liabilities relating to contamination caused to land, decommissioning of existing production facilities and reclamation of mining properties. The election in IFRS 1, provides an exemption from the full retrospective application of IFRIC 1- Changes in existing decommissioning, restoration and similar liabilities and permits the determination of a revised ARO provision and related adjustment to the net ARO asset value at the transition date of January 1, 2010.
The Company has elected to apply the exemption from full retrospective application of decommissioning provisions as allowed under IFRS 1. As a result the Company has re-measured its ARO provisions as at January 1, 2010 under IAS 37 Provisions, Contingent Liabilities and Contingent Assets, estimated the amount to be included in the cost of the related asset by discounting the liability to the date at which the liability first arose using best estimates of the historical risk adjusted discount rates, and recalculated the accumulated amortization under IFRS up to the transition date.
Financial assets or intangible assets accounted for in accordance with IFRIC 12 exemption
The Company is not party to any Service Concession Arrangements. Therefore, this election is not applicable and has not been applied within the consolidated financial statements of the Company as at the January 1, 2010 transition date and subsequent periods.
Borrowing costs exemption
All material borrowings have been repaid in full prior to the January 1, 2010 transition date. Therefore, this election has not been applied within the consolidated financial statements of the Company as at the January 1, 2010 transition date and subsequent periods
Extinguishing financial liabilities with equity instruments
This exemption permits the Company to apply the transitional provisions within IFIRC 19. Although no financial liabilities exist which are contemplated for, or eligible for such extinguishment, IFRIC 19 becomes effective for annual periods beginning on or after July 1, 2010 and retrospective application and disclosure of the change in accounting policy would be required at that time. Therefore, the Company has elected to utilize the exemption (whether applicable or not) and early adopt the standard at the January 1, 2010 transition date.
Disclosures about financial instruments
This exemption was implemented to avoid the application of hindsight and equalize the accounting requirements between existing IFRS filers and adopting entities. Therefore, management considers it reasonable to apply this exemption at the time of transition as permitted by IFRS 1.
YEAR END REPORT 2010
North American Palladium Ltd.
| B) | Mandatory exceptions from full retrospective application |
The Company has applied the following mandatory exceptions from retrospective application.
Derecognition of financial assets and liabilities exception
Financial assets and liabilities derecognized before January 1, 2004 are not re-recognized under IFRS. The application of the exemption from restating comparatives for IAS 32 and IAS 39 means that the Company recognized from January 1, 2005 any financial assets and financial liabilities derecognized since January 1, 2004 that do not meet the IAS 39 derecognition criteria. Management did not chose to retrospectively apply the IAS 39 derecognition criteria to an earlier date.
Hedge accounting exception
Management has adopted hedge accounting from January 1, 2005 only if the hedge relationship meets all the hedge accounting criteria under IAS 39.
Non-controlling interests
Under this exception, prospective application of specific requirements under IAS 27 must be applied from the date of transition to IFRS.
Estimates exception
Estimates under IFRS at January 1, 2010 should be consistent with estimates made for the same date under previous GAAP, unless there is evidence that those estimates were made in error.
YEAR END REPORT 2010
North American Palladium Ltd.
Reconciliations between IFRS and GAAP
The following reconciliations provide a quantification of the effect of the transition to IFRS. Reconciliations are provided for the transition date as at January 1, 2010.
| | | | January 1, 2010 | |
| | Notes | | GAAP | | | Effect of transition to IFRS | | | IFRS | |
| ASSETS | | | | | | | | | | |
| Current Assets | | | | | | | | | | |
| Cash and cash equivalents | | | $ | 98,255 | | | $ | – | | | $ | 98,255 | |
| Accounts receivable | | | | – | | | | – | | | | – | |
| Taxes receivable | | | | 204 | | | | – | | | | 204 | |
| Inventories | | | | 25,306 | | | | – | | | | 25,306 | |
| Other assets | | | | 2,495 | | | | – | | | | 2,495 | |
| | | | | 126,260 | | | | – | | | | 126,260 | |
| Non-current Assets | | | | | | | | | | | | | |
| Mining interests | (a) | | $ | 82,448 | | | $ | 2,566 | | | $ | 85,014 | |
| Intangible assets | | | | – | | | | – | | | | – | |
| Reclamation deposits | | | | 10,503 | | | | – | | | | 10,503 | |
| Total assets | | | $ | 219,211 | | | $ | 2,566 | | | $ | 221,777 | |
| LIABILITIES AND SHAREHOLDERS’ EQUITY | | | | | | | | | | | | | |
| Current Liabilities | | | | | | | | | | | | | |
| Accounts payable and accrued liabilities | (b) | | $ | 11,195 | | | $ | 1,247 | | | $ | 12,442 | |
| Current portion of obligations under capital leases | | | | 558 | | | | – | | | | 558 | |
| Senior credit facility | | | | – | | | | – | | | | – | |
| Provisions | (c) | | | – | | | | 1,000 | | | | 1,000 | |
| Other financial liabilities | (d) | | | – | | | | 56 | | | | 56 | |
| | | | | 11,753 | | | | 2,303 | | | | 14,056 | |
| Non-current Liabilities | | | | | | | | | | | | | |
| Taxes payable | | | | 1,573 | | | | – | | | | 1,573 | |
| Asset retirement obligations | (e) | | | 12,921 | | | | 681 | | | | 13,602 | |
| Obligations under capital leases | | | | 576 | | | | – | | | | 576 | |
| Deferred mining tax liability | | | | 127 | | | | – | | | | 127 | |
| Total liabilities | | | | 26,950 | | | | 2,984 | | | | 29,934 | |
| | | | | | | | | | | | | | |
| Shareholders’ Equity | | | | | | | | | | | | | |
| Common share capital and purchase warrants | (f) | | | 583,089 | | | | (8,211 | ) | | | 574,878 | |
| Stock options | (g) | | | 2,704 | | | | 504 | | | | 3,208 | |
| Contributed surplus | (h) | | | 19,608 | | | | (12,337 | ) | | | 7,271 | |
| Deficit | (i) | | | (413,140 | ) | | | 19,626 | | | | (393,514 | ) |
| Total shareholders’ equity | | | | 192,261 | | | | (418 | ) | | $ | 191,843 | |
| Total shareholders’ equity and liabilities | | | $ | 219,211 | | | $ | 2,566 | | | $ | 221,777 | |
YEAR END REPORT 2010
North American Palladium Ltd.
Explanation of the effect of the transition to IFRS
The following explains the material adjustments to the balance sheet and income statement.
(a) Mining interests
| | | January 1 2010 | |
| (i) Adjustment to asset retirement costs and related accumulated amortization | | $ | 1,861 | |
| (ii) Net adjustment to carrying value of assets due to deemed cost election under IFRS 1 | | | 705 | |
| Total adjustment at transition IFRS | | $ | 2,566 | |
| (i) | Under IFRS 1 exemptions, the Company elected to determine the fair value of the ARO as at January 1, 2010 and discount that fair value to determine the related asset and accumulated amortization. As a result, a recovery of accumulated amortization charges was realized under IFRS and has been reflected in the opening mining interest balances. |
| (ii) | The Company has elected under IFRS 1 to apply deemed cost exemption in respect of the LDI and Sleeping Giant mining interests. The valuation of the LDI property was deemed to be the fair value as determined at December 31, 2008. For Sleeping Giant mine, the final fair values relating to the May 26, 2009 acquisition date were elected as the deemed cost. The change in accumulated amortization as at January 1, 2010 as a result of the deemed cost elections has been included to reflect the net change in carrying values. |
Information on impairment provisions at January 1, 2010
The recoverable amount of a cash generating unit (“CGU”) is determined based on the greater of the CGU’s fair value less cost to sell and value-in-use calculations. These calculations use cash flow projections based on financial budgets and extended operational plans approved by management.
The Company performed an analysis of impairment of all CGUs as at January 1, 2010. As a result of those analyses, it was concluded that the deemed costs assigned to CGUs were not impaired at the date of transition to IFRS and no modifications were required to be made to the useful lives and residual values of mining interests.
(b) Accounts payable and accrued liabilities
| | | January 1 2010 | |
| (i) Reclassification of premiums related to flow-through shares | | $ | 2,000 | |
| (ii) Reclassification of provisions included in accrued payables | | | (1,000 | ) |
| (iii) Adjustments to accounting for restricted share units | | | 247 | |
| Total adjustment at transition IFRS | | $ | 1,247 | |
| (i) | In accordance with IFRS interpretations, the premium of proceeds received on flow-through shares in excess of the market value of the shares on the date of issue represents the value of the liability relating to the transfer of income tax credits foregone and owing to investors upon renunciation. Similar to U.S. GAAP, these liabilities have been reclassified from equity to liabilities and will be reversed at the time that renunciation of costs occurs. |
| (ii) | Under Canadian GAAP, certain contractual provisions were included as accrued payables. Under IFRS, these provisions have been reclassified as provisions. |
YEAR END REPORT 2010
North American Palladium Ltd.
| Under Canadian GAAP, the liability relating to restricted share units (“RSUs”) which have vested and are outstanding is determined based on the spot price for the Company’s common shares at the end of the reporting period. Under IFRS 2, the valuation at the end of the reporting period is based on the use of valuation models which include consideration of the volatility of the underlying common share pricing. The Company determined the fair value under IFRS based on the use of the Black-Scholes model. |
(c) Provisions
| | | January 1 2010 | |
| (i) Reclassification of provisions included in accrued payables | | $ | 1,000 | |
| Total adjustment at transition IFRS | | $ | 1,000 | |
| (i) | Under Canadian GAAP, certain contractual provisions were included as accrued payables. Under IFRS, these provisions have been reclassified as current provisions. |
(d) Other financial liabilities
| | | January 1 2010 | |
| (i) Reclassification of foreign-denominated warrants under IAS 32 | | $ | 56 | |
| | | | | |
| Total adjustment at transition IFRS | | $ | 56 | |
| (i) | Under IAS 32, warrants and similar call options, denominated in a foreign currency, which have not been issued on a pro-rata basis to all holders of the same class of shares are classified as liabilities. The warrants relating to the convertible debentures issued in 2006 were denominated in U.S. dollars and were therefore reclassified accordingly on the balance sheet at January 1, 2010. |
(e) Asset retirement obligations
| | | January 1 2010 | |
| (i) Adjustments to the valuation of asset retirement obligations | | $ | 681 | |
| Total adjustment at transition IFRS | | $ | 681 | |
| (i) | Under IFRS 1 exemptions, the Company elected to determine the fair value of the ARO as at January 1, 2010. As a result of differences between the methodology, rates, and assumptions required to be used under IFRS versus Canadian GAAP, a transitional variance has been recognized at January 1, 2010. |
YEAR END REPORT 2010
North American Palladium Ltd.
(f) Common share capital and purchase warrants
| | | January 1 2010 | |
| (i) Reclassification of foreign-denominated warrants under IAS 32 | | $ | (8,038 | ) |
| (ii) Reclassification of premiums related to flow-through shares | | | (2,000 | ) |
| (iii) Adjustment to expense flow-through share renunciations | | | 1,827 | |
| Total adjustment at transition IFRS | | $ | (8,211 | ) |
| (i) | Under IAS 32, warrants denominated in a foreign currency which have not been issued on a pro-rata basis to all holders of the same class of shares are classified as liabilities. The warrants relating to the convertible debentures issued in 2006 were denominated in U.S. dollars and were therefore reclassified accordingly on the balance sheet at January 1, 2010. |
| (ii) | In accordance with IFRS interpretations, the premium received on flow-through shares represents the value of the liability relating to the transfer of income tax credits foregone and owing to investors upon renunciation. Similar to U.S. GAAP, these liabilities have been reclassified from equity to liabilities and will be reversed at the time that renunciation of costs occurs. |
| (iii) | Under Canadian GAAP, renunciations related to flow-through shares results in an increase in future taxes payable and a decrease in equity. Under IFRS, the related tax expense has been charged through profit or loss in the period of renunciation. |
(g) Stock options
| | | January 1 2010 | |
| (i) Adjustment to compensation expense due to adoption of IFRS 2 | | $ | 504 | |
| Total adjustment at transition IFRS | | $ | 504 | |
| (i) | Under IFRS 2, compensation expense is realized using the graduated method over all respective vesting periods with the inclusion of a provision for cancellation based on historical non-vesting rates. Under Canadian GAAP, compensation expense is recognized on a straight-line basis over each vesting period. |
(h) Contributed surplus
| | | January 1 2010 | |
| (i) Reclassification of foreign-denominated conversion option under IAS 32 | | $ | (12,337 | ) |
| Total adjustment at transition IFRS | | $ | (12,337 | ) |
| (i) | Under IAS 32, warrants and similar call options, denominated in a foreign currency, which have not been issued on a pro-rata basis to all holders of the same class of shares are classified as liabilities. The conversion option relating to the Convertible Debentures issued in 2006 were denominated in U.S. dollars and were therefore reclassified accordingly on the balance sheet at January 1, 2010. |
(i) Deficit
All above adjustments were recorded against the opening deficit. The total net impact is a decrease in deficit of $19,626 at January 2010.
YEAR END REPORT 2010
North American Palladium Ltd.
Accounting Policies
During the conversion project, the Company compared and evaluated the impact of IFRS standards on its operations in comparison to those standards presently applied under Canadian GAAP. The Company has completed its final review of the applicability of IFRS 1 elections and will continue to review the impact of amendments to IFRS standards to the first quarter of 2011, the first filing under IFRS.
The following discussion outlines details of certain accounting policies the Company has applied which have been reflected in the Company’s IFRS consolidated opening balance sheet for the January 1, 2010 date of transition to IFRS.
Functional Currency
Based upon the application of IAS 21 (The Effects of Changes in Foreign Exchange Rates), the Company has determined that the Canadian dollar appropriately represents both its functional and reporting currency for the purposes of reporting under IFRS. Since this is consistent with the methodology presently applied under Canadian GAAP, no additional translation adjustments are expected as a result of the adoption of IFRS.
Mining Interests and Depreciation and Amortization
Although certain aspects of the standards under Canadian GAAP are converged with IFRS, differences still exist primarily with regards to the determination of impairment of assets under IAS 36. Under IFRS, the Company is required to identify cash generating units (“CGU’s”) independently for each of its consolidated entities. These CGU’s represent the smallest group of assets which are capable of generating cash independently from other assets held by the Company.
In determining whether impairment exists under Canadian GAAP, the Company performs a two-step approach that compares the net book value of assets to the undiscounted and discounted expected future cash flows from operations. Under IFRS, a one-step approach is used by which the determination of impairments require the comparison of the net book value of each of the CGU’s to the recoverable amount of the CGU. The recoverable amount is determined as the higher of the fair value of the expected future cash flows from that CGU, less costs to sell (“Fair Value Less Cost to Sell”) and the “Value in Use”.
Under Canadian GAAP, any impairment assessed is not reversed. Under IFRS, impairments assessed must be reversed in subsequent periods should economic conditions recover.
Management has performed a preliminary analysis of the potential impact of the application of these IFRS standards on its reported mining interests balance. In accordance with IFRS 1, the Company may elect to measure certain property, plant and equipment at the date of transition to IFRSs at fair value and deem that fair value to be the cost of those assets at that date. The fair value of property, plant and equipment may be based on a previous GAAP revaluation at, or before, the date of transition to IFRS.
Under Canadian GAAP, the carrying value of the mineral properties and fixed assets at LDI were previously impaired and were written down to fair value at December 31, 2008. In addition, the Sleeping Giant mine was acquired in 2009 and was included on the books at fair value on the date of acquisition. Based on its analysis, the Company expects to apply the IFRS 1 election on transition to IFRS to use the Canadian GAAP impaired and acquisition amounts as the deemed cost for the mineral properties and fixed assets for each mine respectively. Therefore, no adjustment is expected on transition to IFRS on January 1, 2010 as no further impairments were identified subsequent to the fair value dates for each property.
Financial Instruments
Although the allocation of fair values between the debt and equity components of compound financial instruments issued by the Company is performed differently under IAS 32, Financial Instruments Presentation, from the pro-rata method applied under Canadian GAAP, the measurement of the fair values of such instruments does not differ materially.
YEAR END REPORT 2010
North American Palladium Ltd.
The Company is evaluating the decision to make the election available to it under IFRS 1 relating to compound financial instruments. Application of this election would eliminate the need to recognize transition variances relating to those debt instruments fully repaid prior to the January 1, 2010 transition date. As a result, only outstanding debt instruments and compound instruments denominated in foreign currencies would require retrospective restatement to comply with the standards within IAS 32 at the time of transition to IFRS on January 1, 2010.
The adoption of IAS 32 will result in material reallocations of balances within the Company’s debt and equity accounts. It is the Company’s preliminary assessment that since the majority of the Company’s debt and foreign denominated equity instruments matured prior to January 1, 2010, the impact of the adoption of IAS 32 will be limited primarily to the convertible notes and related embedded derivatives issued by the Company in 2006.
The convertible notes were comprised of two tranches, each consisting of notes payable, warrants, and an equity conversion option. Under Canadian GAAP, the notes were reflected as liabilities and the remaining instruments were classified as equity. Under IAS 32, since all components of the convertible notes were denominated in U.S. dollars and the notes and warrants were not issued pro-rata to all holders of its common shares, all components of this financial instrument are classified as liabilities. Since the warrants relating to the convertible notes did not mature until March and June of 2010, the IFRS 1 exemption cannot be used by the Company.
Management is presently reviewing recent and proposed amendments to IFRS standards relating to financial instruments (IAS 32, 39, IFRS 7 and the future standard IFRS 9) which may further impact the adjustments required for conversion to IFRS. Therefore, the Company’s determination of the financial impact of the final transition adjustments will be subject to its ongoing review of these amendments to IFRS standards.
Share-Based Payment Transactions
The Company has identified differences relating to the measurement of share-based payments under IFRS 2 relating to the Company’s stock compensation plans. The differences between Canadian GAAP and IFRS primarily relate to the measurement of stock compensation expense relating to the Company’s stock option plan and the valuation of RSU liabilities at each reporting date.
Under Canadian GAAP, stock compensation expense can be calculated on a straight-line depreciation method over the respective vesting period for each stock option. Under IFRS, stock compensation expense is recognized on a graduated method over the vesting period and a provision is generally applied against the recognized expense based on the historical rate of non-vesting of options.
Under Canadian GAAP, the fair value assigned to the liability of outstanding RSU’s is the value of the Company’s share price at each reporting date. Under IFRS, the fair value of the RSU liability at each reporting date is calculated to also include the intrinsic value of the underlying option of the holder to elect the timing of payment of the liability. As a result, under IFRS, the Company’s determination of the fair value of each RSU at each reporting date will now also recognize the incremental value attributable to the volatility of the share price over the remaining term of each RSU. Management presently expects to utilize the Black-Scholes model to determine the option value contained in each RSU.
The Company’s election under IFRS 1 relating to share-based payments will restrict the adjustments relating to the measurement of such equity instruments to only those instruments granted after November 7, 2002 and which have not vested at the date of transition of January 1, 2010.
Mine Reclamation Obligations
The measurement of decommissioning liabilities and related balances included in the cost of property, plant and equipment in accordance with IAS 37 – Provisions, Contingent Liabilities and Contingent Assets differs from that applied by the Company under Canadian GAAP. An election by the Company under IFRS 1 would permit the measurement of these amounts as at January 1, 2010 with prospective application of IFRS standards subsequent to that date. However, differences in the methodology and assumptions used to determine the fair value of the Company’s mine reclamation obligations at January 1, 2010 under IFRS 1 still result in transition variances between Canadian GAAP and IFRS (IAS 37).
YEAR END REPORT 2010
North American Palladium Ltd.
In addition, under Canadian GAAP, certain of the mine reclamation assets held by the Company have been fully amortized. Under the application of the IFRS 1 election, the accumulated depreciation and amortization is recalculated by applying the appropriate depreciation rates to the restated mine reclamation asset value. It is expected that, this methodology will result in the reversal of depreciation and amortization recognized under Canadian GAAP of approximately $0.7 million. However, final estimates are contingent upon management’s completion of the analysis of mining interests as previously discussed.
Flow-Through Shares
The Company is presently reviewing its accounting policies relating to flow-through shares. Under Canadian GAAP, the accounting treatment of flow-through shares is addressed by Emerging Issues Committee (EIC) 146, Flow-Through Shares. Under IFRS, IAS 12, Income Taxes, contains no specific guidance on the appropriate accounting for flow-through shares. Therefore, entities are required to apply judgment in developing an appropriate model accounting policy based on the principles of IFRS standards.
SIC Interpretation 25, Income Taxes – Changes in the Tax Status of an Entity or its Shareholders, provides some additional guidance in that it requires that the current and deferred tax consequences of a change in tax status shall be included in profit or loss for the period, unless those consequences relate to transactions and events that result in a direct credit to the recognized amount of equity. The portion of tax liabilities or assets related to such recognized equity amounts which is not included in profit or loss must be charged or credited directly to equity. The Company’s initial review of the above IFRS guidance and consultation with external sources, suggest that an approach similar to that applied under U.S. GAAP may be more appropriate.
Under Canadian GAAP, proceeds received from the issue of flow-through shares are included in the value of the Company’s common share capital. The subsequent renunciation of tax deductions by the Company results in the recognition of a future tax liability and an equivalent charge is applied to reduce common share capital. Under U.S. GAAP, the fair value of the common shares issued is added to share capital with any excess of proceeds over the market value of the common shares being recorded as a liability. At the time of renunciations by the Company, the subsequent increases in future tax liabilities realized in excess of the initial amounts are expensed in the period of renunciation. As a result, the renunciation of tax deductions to holders of flow-through shares is treated as a future tax expense rather than as a cost of issuing equity as required by Canadian GAAP.
Management does not anticipate any material changes to its policies and procedures due to the adoption of IFRS standards for flow-through shares since it presently applies such policies and procedures through its requirement to determine and report the treatment for flow-through shares under both Canadian and U.S. GAAP.
Revenue Recognition
Revenue from the sale of palladium and by-product metals from the LDI mine is provisionally recognized based on forward pricing upon delivery of the concentrate to the smelter. Revenue from the sale of gold is recognized upon value date, which is when title transfers and the rights and obligations of ownership pass.
Since each of the above methods of revenue recognition are supported by IAS 18, and the Company recognizes revenues separately for each of the metals contained in the concentrate and doré bars, management’s initial review of IAS 18 (Revenue) did not identify any significant issues which would require a material change to the Company’s existing revenue recognition policies at the IFRS transition date.
Leases
Canadian GAAP and IFRS are similar standards in that they both require an entity to make a classification of leases based on whether substantially all of the benefits and risks of ownership have been transferred to the lessee. However, there are differences in how to classify leases and the terminology used in each standard.
YEAR END REPORT 2010
North American Palladium Ltd.
The reporting of a lease agreement under Canadian GAAP is based upon its classification as either a capital or operating lease. This classification utilizes a specific set of quantitative criteria in the decision-making process. Although the classification under Canadian GAAP is not strictly a quantitative threshold, generally in practice these have been interpreted as bright line tests.
Under IAS 17 (Leases), no such quantitative thresholds are provided and guidance is based more on examples in which transfers of substantially all the risks and rewards incidental to ownership of an asset may exist. As a result, more judgment is required by Canadian entities when determining the classification of a lease arrangement rather than just meeting the quantitative threshold.
Management is reviewing its outstanding lease obligations to ensure whether the classifications applied under Canadian GAAP are appropriate for use under IFRS.
Income Taxes
Similar to Canadian GAAP, deferred tax assets and liabilities are recognized under IFRS based on temporary timing differences between the carrying value of assets and liabilities for accounting purposes and the respective value assigned to those assets and liabilities for tax purposes. As a result, the Company has recognized the corresponding increase or decrease in its reported deferred tax asset or liability balances at the January 1, 2010 IFRS transition date based on the resultant differences between the restated carrying value of assets and liabilities under IFRS and their associated tax bases.
Internal Controls over Financial Reporting & Disclosure Controls and Procedures
Management has continually evaluated the impact of the adoption of IFRS on the reporting and disclosure processes of the Company. Throughout the conversion project, management has made those modifications to its data analysis, information systems, and reporting processes that were required to incorporate the collection of information necessary under IFRS.
As a result of the convergence of Canadian GAAP with IFRS standards, the Company has not presently incorporated any material changes to its ICFR or DC&P during the course of its conversion project. Most changes to the Company’s internal controls were already incorporated incrementally over time as a result of the Company’s adoption of the converged standards.
In conjunction with the analysis of the Company’s January 1, 2010 opening balances under IFRS, management has implemented changes to certain of its internal reports and data analysis to facilitate the appropriate collection of data for IFRS reporting purposes. The changes were implemented in parallel to existing reporting and appropriately reconciled to previously reported totals to ensure the completeness and accuracy of the revised reports and analyses. Since these changes represented only a component part of the reporting process, no material changes to the Company’s internal controls have been specifically required as a result of these modifications.
As the ongoing review of accounting policies and procedures is completed prior to the adoption of IFRS, the Company will develop or appropriately modify its policies to ensure the integrity of its internal controls. Any material changes will be communicated quarterly within the internal control discussion contained in the MD&A.
Business Activities
The conversion to IFRS may result in certain consequences which are dependent upon how certain business activities are approached, monitored, or concluded by the Company. Consideration of such issues as foreign currency, hedging activities, debt covenants, compensation arrangements, and risk management practices may be required.
Whereas foreign currency considerations, compensation arrangements, and risk management issues are addressed by the Company on a regular basis, at January 1, 2010, the Company did not have any outstanding debt, with the exception of certain capital leases, and no hedging activities or contracts existed. Management will continue to monitor the impact of IFRS upon its current and future business activities.
YEAR END REPORT 2010
North American Palladium Ltd.
Information Systems
In order to facilitate the compilation of information required for IFRS reporting and disclosures, management has made appropriate modifications to its information gathering and analysis procedures. However, no material changes to the Company’s existing accounting systems have been required at present. Those changes which have been implemented generally required minor changes to reports or data analysis to ensure that additional information required for disclosures under IFRS that were not currently collected under Canadian GAAP were appropriately tracked for IFRS reporting purposes.
The risks and uncertainties are discussed within the Company’s most recent Form 40-F/Annual Information Form on file with the SEC and Canadian provincial securities regulatory authorities.
Disclosure Controls and Procedures
Management is responsible for the information disclosed in this management’s discussion and analysis and has in place the appropriate information systems, procedures and controls to ensure that information used internally by management and disclosed externally is, in all material respects, complete and reliable.
For the year ended December 31, 2010, the President and Chief Executive Officer and Vice President, Finance and Chief Financial Officer certify that they have designed, or caused to be designed under their supervision, disclosure controls and procedures to provide reasonable assurance that material information relating to the Company and its consolidated subsidiaries would be made known to them by others within those entities.
The disclosure controls and procedures are evaluated annually through regular internal reviews which are carried out under the supervision of, and with the participation of, the Company’s management, including the President and Chief Executive Officer and Vice President, Finance and Chief Financial Officer. Based on that evaluation, the Chief Executive Officer and Chief Financial Officer concluded that the design and operation of these disclosure controls were effective as of December 31, 2010.
Internal Control over Financial Reporting
For the year ended December 31, 2010, the President and Chief Executive Officer and Vice President, Finance and Chief Financial Officer certify that they have designed, or caused to be designed under their supervision, internal controls over financial reporting to provide reasonable assurance regarding the reliability of financial reporting and the preparation of the financial statements for external purposes in accordance with Canadian GAAP.
There have been no changes in the Company’s internal controls over the financial reporting that occurred during the most recent period ended December 31, 2010 that have materially affected or are reasonably likely to materially affect, the Company’s internal control over financial reporting.
Management is responsible for establishing and maintaining adequate internal controls over financial reporting. Internal control over financial reporting, no matter how well designed, has inherent limitations and can only provide reasonable assurance, not absolute assurance, with respect to the preparation and fair presentation of published financial statements and management does not expect such controls will prevent or detect all misstatements due to error or fraud. The Company is continually evolving and enhancing its systems of controls and procedures.
Under the supervision and with the participation of the President and Chief Executive Officer and the Vice President, Finance and Chief Financial Officer, management performs regular internal reviews and conducts an annual evaluation of the effectiveness of its internal control over financial reporting based on the framework in Internal Control – Integrated Framework issued by the Committee of Sponsoring Organizations of the Treadway Commission. Based on that evaluation, the Chief Executive Officer and Chief Financial Officer concluded that, subject to the scope limitation, the design and operation of these internal controls over financial reporting were effective as of December 31, 2010.
YEAR END REPORT 2010
North American Palladium Ltd.
Additional information regarding the Company is included in the Company’s Annual Information Form and Annual Report on Form 40-F, which are filed with the SEC and the provincial securities regulatory authorities, respectively. A copy of the Company’s Annual Information Form is posted on the SEDAR website at www.sedar.com. A copy of the Annual Report or Form 40-F can be obtained from the SEC’s website at www.sec.gov.
This MD&A refers to cash used in operating activities per share and cash cost per ounce which are not recognized measures under Canadian GAAP. Such non-GAAP financial measures do not have any standardized meaning prescribed by Canadian GAAP and are therefore unlikely to be comparable to similar measures presented by other issuers. Management uses these measures internally. The use of these measures enables management to better assess performance trends. Management understands that a number of investors, and others who follow the Company’s performance, assess performance in this way. Management believes that these measures better reflect the Company’s performance and are better indications of its expected performance in future periods. This data is intended to provide additional information and should not be considered in isolation or as a substitute for measures of performance prepared in accordance with Canadian GAAP. The following tables reconcile these non-GAAP measures to the most directly comparable Canadian GAAP measures:
Reconciliation of Cash Used in Operations per Share*
| (expressed in thousands of dollars except per share amounts) | | 2010 | | | | 2009 | * | | | 2008 | * |
| Cash provided by (used in) operations prior to changes in non-cash working capital | | $ | (14,414 | ) | | $ | (27,656 | ) | | $ | (25,544 | ) |
| Weighted average number of shares outstanding – basic and diluted | | | 141,537,377 | | | | 102,630,908 | | | | 82,839,706 | |
| Cash provided by (used in) operations prior to changes in non-cash working capital per share | | $ | (0.10 | ) | | $ | (0.27 | ) | | $ | (0.31 | ) |
*Certain prior period amounts have been reclassified to conform to the classification adopted in the current period.
The Company reports total cash costs1 on a sales basis. Total cash costs1 include mine site operating costs such as mining, processing, administration, and royalties, but is exclusive of depreciation, amortization, reclamation, capital and exploration costs. Total cash costs1 are reduced by any by-product revenue and is then divided by ounces sold to arrive at the total by-product cash cost of sales. This measure, along with revenues, is considered to be a key indicator of a company’s ability to generate operating earnings and cash flow from its mining operations.
YEAR END REPORT 2010
North American Palladium Ltd.
| (a) | Reconciliation of Palladium Total Cash Cost per Ounce |
| (expressed in thousands of dollars except per ounce amounts) | | | | | | | | | |
| | | 2010 | | | 2009 | | | 2008 | |
| Production costs including overhead | | $ | 46,269 | | | $ | – | | | $ | 115,037 | |
| Less mine startup costs | | | (6,003 | ) | | | – | | | | – | |
| Less mine shutdown costs | | | – | | | | – | | | | (7,877 | ) |
| Smelter treatment, refining and freight costs | | | 4,721 | | | | – | | | | 20,342 | |
| Royalty expense | | | 4,202 | | | | – | | | | 5,588 | |
| | | | 49,189 | | | | – | | | | 133,090 | |
| Less by-product metal revenue | | | 21,462 | | | | – | | | | 72,845 | |
| | | $ | 27,727 | | | $ | – | | | $ | 60,245 | |
| Divided by ounces of palladium sold | | | 95,057 | | | | – | | | | 199,967 | |
| Cash cost per ounce (CDN$) | | $ | 292 | | | $ | – | | | $ | 301 | |
| Exchange rate (CDN$1 – US$) | | | 0.97 | | | | – | | | | 0.94 | |
| Cash cost per ounce (US$) | | $ | 283 | | | $ | – | | | $ | 283 | |
| (b) | Reconciliation of Gold Total Cash Cost per Ounce |
| (expressed in thousands of dollars except per ounce amounts) | | | | | | |
| | | 2010 | | | 2009 | |
| Production costs including overhead | | $ | 28,440 | | | $ | – | |
| Refining and freight costs | | | 58 | | | | – | |
| | | | 28,498 | | | | – | |
| Less by-product metal revenue | | | 473 | | | | – | |
| | | | 28,025 | | | | – | |
| Divided by ounces of gold sold | | | 17,550 | | | | – | |
| Cash cost per ounce (CDN$) | | $ | 1,597 | | | $ | – | |
| Exchange rate (CDN$1 – US$) | | | 0.97 | | | | – | |
| Cash cost per ounce (US$) | | $ | 1,549 | | | $ | – | |
YEAR END REPORT 2010
North American Palladium Ltd.
| (c) | Adjusted net income (loss) |
Adjusted net income (loss) is a non-GAAP financial measure, which excludes the following from net income (loss):
| | · | Asset impairment charges; |
| | · | Loss (gain) on disposal of equipment; and |
| | | 2010 | | | 2009 | | | 2008 | |
| Net loss and comprehensive loss for the year | | $ | (23,259 | ) | | $ | (30,014 | ) | | $ | (160,679 | ) |
| Exploration | | | 30,126 | | | | 13,234 | | | | 23,070 | |
| Mine startup costs | | | 6,003 | | | | – | | | | – | |
| Mine shutdown costs | | | – | | | | – | | | | 7,877 | |
| Asset impairment charge | | | – | | | | – | | | | 90,000 | |
| Loss (gain) on disposal of equipment | | | (270 | ) | | | (36 | ) | | | 2,466 | |
| Insurance recovery | | | – | | | | – | | | | (13,800 | ) |
| Adjusted net income (loss) | | $ | 12,600 | | | $ | (16,816 | ) | | $ | (51,066 | ) |
Adjusted EBITDA is a non-GAAP financial measure, which excludes the following from net income (loss):
| | · | Income and mining tax expense (recovery); |
| | · | Interest and other financing costs (income); |
| | · | Depreciation and amortization; |
| | · | Loss (gain) on disposal of equipment; and |
Management believes that EBITDA is a valuable indicator of the Company’s ability to generate liquidity by producing operating cash flow to fund working capital needs, service debt obligations, and fund capital expenditures.
EBITDA excludes the impact of cash costs of financing activities and taxes, and the effects of changes in operating working capital balances, and therefore is not necessarily indicative of operating profit or cash flow from operations as determined under Canadian GAAP. Other companies may calculate EBITDA differently.
YEAR END REPORT 2010
North American Palladium Ltd.
| | | 2010 | | | 2009 | | | 2008 | |
| Net loss and comprehensive loss for the year | | $ | (23,259 | ) | | $ | (30,014 | ) | | $ | (160,679 | ) |
| Income and mining tax expense (recovery) | | | (7,299 | ) | | | 3,237 | | | | (2,230 | ) |
| Interest and other financing costs (income) | | | (295 | ) | | | (1,957 | ) | | | 3,443 | |
| Depreciation and amortization | | | 13,175 | | | | 269 | | | | 36,026 | |
| EBITDA | | | (17,678 | ) | | | (28,465 | ) | | | (123,440 | ) |
| Exploration | | | 30,126 | | | | 13,234 | | | | 23,070 | |
| Mine startup costs | | | 6,003 | | | | – | | | | – | |
| Mine shutdown costs | | | – | | | | – | | | | 7,877 | |
| Loss (gain) on disposal of equipment | | | (270 | ) | | | (36 | ) | | | 2,466 | |
| Asset impairment charge | | | – | | | | – | | | | 90,000 | |
| Insurance recoveries | | | – | | | | – | | | | (13,800 | ) |
| Adjusted EBITDA | | $ | 18,181 | | | $ | (15,267 | ) | | $ | (13,827 | ) |
YEAR END REPORT 2010