
North American Palladium Ltd.
TABLE OF CONTENTS
| | Page |
| | |
| Management’s Discussion and Analysis | |
| | |
| INTRODUCTION | 1 |
| | |
| FORWARD-LOOKING INFORMATION | 1 |
| | |
| CAUTIONARY NOTE TO U.S. INVESTORS CONCERNING MINERAL RESERVES AND RESOURCES | 2 |
| | |
| OUR BUSINESS | 2 |
| | |
| KEY HIGHLIGHTS | 3 |
| | |
| FINANCIAL CONDITION | 4 |
| | |
| EXECUTIVE SUMMARY | 4 |
| | |
| PALLADIUM OPERATIONS – FINANCIAL, OPERATING & DEVELOPMENT RESULTS | 7 |
| | |
| GOLD OPERATIONS – FINANCIAL, OPERATING & DEVELOPMENT RESULTS | 12 |
| | |
| CONSOLIDATED FINANCIAL RESULTS | 14 |
| | |
| FINANCIAL CONDITION, CASH FLOWS, LIQUIDITY AND CAPITAL RESOURCES | 17 |
| | |
| OUTSTANDING SHARE DATA | 19 |
| | |
| OVERVIEW OF NAP’S EXPLORATION PROPERTIES | 19 |
| | |
| CRITICAL ACCOUNTING POLICIES AND ESTIMATES | 23 |
| | |
| RISKS AND UNCERTAINTIES | 26 |
| | |
| INTERNAL CONTROLS | 26 |
| | |
| OTHER INFORMATION | 27 |
| | |
| NON-IFRS MEASURES | 27 |
North American Palladium Ltd. |
Management’s Discussion and Analysis
Unless the context suggests otherwise, references to “NAP” or the “Company” or similar terms refer to North American Palladium Ltd. and its subsidiaries. “LDI” refers to Lac des Iles Mines Ltd. and “NAP Quebec” refers to NAP Quebec Mines Ltd. On March 4, 2011, the name Cadiscor Resources Inc. was changed to NAP Quebec Mines Ltd.
The following is management’s discussion and analysis (“MD&A”) of the financial condition and results of operations to enable readers of the Company’s consolidated financial statements and related notes to assess material changes in financial condition and results of operations for the three and six months ended June 30, 2012, compared to those of the respective periods in the prior year. This MD&A has been prepared as of August 8, 2012 and is intended to supplement and complement the consolidated financial statements and notes thereto for the three and six months ended June 30, 2012 (collectively, the “Financial Statements”), which have been prepared in accordance with International Financial Reporting Standards (“IFRS”). Readers are encouraged to review the Financial Statements in conjunction with their review of this MD&A and the most recent Form 40-F/Annual Information Form on file with the U.S. Securities and Exchange Commission (“SEC”) and Canadian provincial securities regulatory authorities, available at www.sec.gov and www.sedar.com, respectively.
All amounts are in Canadian dollars unless otherwise noted and all references to production ounces refer to payable production.
| FORWARD-LOOKING INFORMATION |
Certain information contained in this MD&A constitutes ‘forward-looking statements’ within the meaning of the ‘safe harbor’ provisions of the United States Private Securities Litigation Reform Act of 1995 and Canadian securities laws. All statements other than statements of historical fact are forward-looking statements. The words ‘expect’, ‘believe’, ‘anticipate’, ‘contemplate’, ‘target’, ‘plan’, ‘may’, ‘will’, ‘intend’, ‘estimate’ and similar expressions identify forward-looking statements. Forward-looking statements included in this MD&A include, without limitation: information as to our strategy, plans or future financial or operating performance, such as the Company’s expansion plans, project timelines, production plans, projected cash flows or expenditures, operating cost estimates, mining or milling methods, projected exploration results and other statements that express management's expectations or estimates of future performance. The Company cautions the reader that such forward-looking statements involve known and unknown risk factors that may cause the actual results to be materially different from those expressed or implied by the forward-looking statements. Such risk factors include, but are not limited to: the possibility that metal prices and foreign exchange rates may fluctuate, inherent risks associated with exploration, development, mining and processing including environmental hazards, uncertainty of mineral reserves and resources, the risk that the Company may not be able to obtain financing, the possibility that the Lac des Iles mine and Vezza project may not perform as planned, changes in legislation, taxation, regulations or political and economic developments in Canada and abroad, employee relations, litigation and the risks associated with obtaining necessary licenses and permits. For more details on these and other risk factors see the Company’s most recent Form 40-F/Annual Information Form on file with the U.S. Securities and Exchange Commission and Canadian provincial securities regulatory authorities. Forward-looking statements are necessarily based upon a number of factors and assumptions that, while considered reasonable by management, are inherently subject to significant business, economic and competitive uncertainties and contingencies. The factors and assumptions contained in this MD&A, which may prove to be incorrect, include, but are not limited to: that metal prices and exchange rates between the Canadian and United States dollar will be consistent with the Company’s expectations , that there will be no material delays affecting operations or the timing of ongoing development projects, that prices for key mining and construction supplies, including labour costs, will remain consistent with the Company’s expectations, and that the Company’s current estimates of mineral reserves and resources are accurate. The forward-looking statements are not guarantees of future performance. The Company disclaims any obligation to update or revise any forward-looking statements, whether as a result of new information, events or otherwise, except as expressly required by law. Readers are cautioned not to put undue reliance on these forward-looking statements.
1
SECOND QUARTER REPORT 2012 |
North American Palladium Ltd. |
| CAUTIONARY NOTE TO U.S. INVESTORS CONCERNING MINERAL RESERVES AND RESOURCES |
Mineral reserve and mineral resource information contained herein has been calculated in accordance with National Instrument 43-101 –Standards of Disclosure for Mineral Projects, as required by Canadian provincial securities regulatory authorities. Canadian standards differ significantly from the requirements of the SEC, and mineral reserve and mineral resource information contained herein is not comparable to similar information disclosed in accordance with the requirements of the SEC. While the terms “measured”, “indicated” and “inferred” mineral resources are required pursuant to National Instrument 43-101, the SEC does not recognize such terms. U.S. investors should understand that “inferred” mineral resources have a great amount of uncertainty as to their existence and great uncertainty as to their economic and legal feasibility. In addition, U.S. investors are cautioned not to assume that any part or all of NAP’s mineral resources constitute or will be converted into reserves. For a more detailed description of the key assumptions, parametres and methods used in calculating NAP’s mineral reserves and mineral resources, see NAP’s most recent Annual Information Form/Form 40-F on file with Canadian provincial securities regulatory authorities and the SEC.
North American Palladium Ltd. (“NAP” or the “Company”) is an established precious metals producer that has been operating its flagship Lac des Iles (“LDI”) mine located in Ontario, Canada since 1993. LDI is one of only two primary producers of palladium in the world, and is currently undergoing a major expansion to increase production and reduce cash cost per ounce1. The Company also operates the Vezza gold mine located in the Abitibi region of Quebec.
The Company is expanding the LDI mine to transition from mining via ramp access to mining via shaft while utilizing a high volume bulk mining method which will allow LDI to increase its underground mining rate and palladium production. It is expected that the mine expansion will transform LDI into a long life, low cost producer of palladium.
The Company has significant exploration potential near the LDI mine, where a number of growth targets have been identified, and is engaged in a substantial exploration program aimed at increasing its palladium reserves and resources. As NAP pursues its organic growth strategy through the LDI mine expansion, exploration will continue to be a key focus for the Company for many years to come. As an established palladium-platinum group metal (“PGM”) producer with excess mill capacity on a permitted property, NAP has potential to convert exploration success into production and cash flow on an accelerated timeline.
With an experienced senior management team and a strong balance sheet, NAP is well positioned to pursue its growth strategy. NAP trades on the TSX under the symbol PDL and on the NYSE MKT under the symbol PAL. The Company’s common shares are included in the S&P/TSX Composite Index.
1Non-IFRS measure. Please refer to Non-IFRS Measures on pages 26-29.
2
SECOND QUARTER REPORT 2012 |
North American Palladium Ltd. |
| (expressed in thousands of dollars except cash cost per ounce, | | Three months ended June 30 | | | Six months ended June 30 | |
| metal units, metal prices and per share amounts) | | 2012 | | | 2011 | | | 2012 | | | 2011 | |
| FINANCIAL HIGHLIGHTS | | | | | | | | | | | | | | | | |
| Revenue | | $ | 40,565 | | | $ | 51,398 | | | $ | 85,147 | | | $ | 88,112 | |
| Unit sales | | | | | | | | | | | | | | | | |
| Palladium (oz) | | | 42,285 | | | | 46,362 | | | | 81,233 | | | | 76,817 | |
| Gold (oz) | | | 2,782 | | | | 6,600 | | | | 7,019 | | | | 12,900 | |
| Platinum (oz) | | | 3,055 | | | | 2,609 | | | | 5,490 | | | | 4,292 | |
| Nickel (lb) | | | 416,422 | | | | 172,393 | | | | 785,816 | | | | 305,448 | |
| Copper (lb) | | | 721,962 | | | | 335,900 | | | | 1,319,488 | | | | 564,491 | |
| Earnings | | | | | | | | | | | | | | | | |
| Net income (loss) | | $ | (3,053 | ) | | $ | 5,380 | | | $ | (3,981 | ) | | $ | (4,941 | ) |
| Net income (loss) per share | | $ | (0.02 | ) | | $ | 0.03 | | | $ | (0.02 | ) | | $ | (0.03 | ) |
| Adjusted net income 1 | | $ | 1,924 | | | $ | 11,514 | | | $ | 6,076 | | | $ | 5,032 | |
| EBITDA1 | | $ | 431 | | | $ | 9,504 | | | $ | 4,341 | | | $ | 5,748 | |
| Adjusted EBITDA1 | | $ | 5,408 | | | $ | 15,638 | | | $ | 14,398 | | | $ | 15,721 | |
| Cash flow provided by operations | | | | | | | | | | | | | | | | |
| Cash flow provided by operations before changes in non-cash working capital1 | | $ | 3,673 | | | | 11,357 | | | $ | 7,894 | | | $ | 4,789 | |
| Cash flow provided by operations before changes in non-cash working capital per share1 | | $ | 0.02 | | | $ | 0.07 | | | $ | 0.05 | | | $ | 0.03 | |
| Capital spending | | $ | 40,746 | | | $ | 41,363 | | | $ | 85,670 | | | $ | 82,507 | |
| | | | | | | | | | | | | | | | | |
| OPERATING HIGHLIGHTS | | | | | | | | | | | | | | | | |
| Production | | | | | | | | | | | | | | | | |
| Palladium (oz) | | | 40,017 | | | | 46,971 | | | | 81,777 | | | | 77,632 | |
| Gold (oz) | | | 2,643 | | | | 6,634 | | | | 6,588 | | | | 11,540 | |
| Platinum (oz) | | | 2,930 | | | | 2,638 | | | | 5,528 | | | | 4,330 | |
| Nickel (lb) | | | 397,262 | | | | 174,644 | | | | 789,559 | | | | 308,480 | |
| Copper (lb) | | | 691,096 | | | | 339,579 | | | | 1,326,720 | | | | 569,585 | |
| Realized metal prices | | | | | | | | | | | | | | | | |
| Palladium | | $ | 622 | | | $ | 754 | | | $ | 646 | | | $ | 772 | |
| Gold | | $ | 1,606 | | | $ | 1,523 | | | $ | 1,669 | | | $ | 1,461 | |
| Cash cost per ounce1 | | | | | | | | | | | | | | | | |
| Palladium (US$) | | $ | 429 | | | $ | 335 | | | $ | 404 | | | $ | 408 | |
| Gold (US$) | | | - | | | $ | 1,643 | | | $ | 1,236 | | | $ | 1,824 | |
| | | As at June 30 | | | As at December 31 | |
| (expressed in thousands of dollars) | | 2012 | | | 2011 | |
| Net working capital | | $ | 65,436 | | | $ | 108,432 | |
| Cash balance | | $ | 23,886 | | | $ | 50,935 | |
| Shareholders’ equity | | $ | 298,298 | | | $ | 268,996 | |
1 Non-IFRS measure. Please refer to Non-IFRS Measures on pages 26-29.
3
SECOND QUARTER REPORT 2012 |
North American Palladium Ltd. |
Financial Highlights
Revenue for the quarter was $40.6 million, compared to $51.4 million in the prior year, primarily due to a lower realized palladium price and the closure of the Sleeping Giant gold mine at the beginning of this year. Net loss for the quarter was $3.1 million or $0.02 per share and EBITDA1 was $0.4 million, compared to net income of $5.4 million or $0.03 per share and EBITDA1 of $9.5 million in the same period in the prior year. For the second quarter of 2012, adjusted net income1 was $1.9 million and adjusted EBITDA1 was $5.4 million, compared to adjusted net income1 of $11.5 million and adjusted EBITDA1 of $15.6 million in the prior year period. The Company generated cash from operating activities of $3.7 million, before changes in non-cash working capital1.
Financings and Balance Sheet
During the second quarter, the Company closed a $35.0 million financing of flow-through shares to fund eligible exploration activities and mine expansion expenditures at LDI. As at June 30, 2012, the Company had approximately $65.4 million in working capital, including $23.9 million of cash on hand. Subsequent to quarter end, the Company closed a $43.0 million convertible debenture financing, bringing the June 30, 2012 pro-forma cash position to $64.7 million.
Investment in Growth
For the quarter ended June 30, 2012, the Company invested $4.0 million in exploration activities and $40.7 million in development expenditures ($32.1 million at its palladium operations, of which $28.2 million was invested in the LDI mine expansion, and $8.6 million on the Vezza gold mine).
LDI Mine Palladium Production
The LDI mine produced 40,017 ounces of payable palladium for the quarter ended June 30, 2012. During the quarter, 504,497 tonnes of ore were mined with 528,068 tonnes of ore processed by the mill. The mill processed an average of 13,136 tonnes per operating day at an average palladium head grade of 3.35 grams per tonne, with a palladium recovery of 77.3%. For the second quarter, LDI’s cash cost per ounce1 (net of byproduct credits) was US$429.
Production at the LDI mine in the quarter included the blending of higher grade underground ore (211,963 tonnes with an average palladium grade of 5.24 grams per tonne) with lower grade surface ore (316,105 tonnes with an average palladium grade of 2.08 grams per tonne).
Other charges at the LDI mine for the three months ended June 30, 2012 were $0.7 million. These additional costs related to expenditures to mitigate the effects of flooding caused by an unprecedented rainfall in the Thunder Bay region in June, which was excluded from the cash cost per ounce1 of $US429.
LDI Mine Expansion Update
In the second quarter, mine expansion expenditures totaled $28.2 million, excluding capitalized interest of $1.7 million. The Company made significant progress during the quarter advancing the critical aspects of its mine expansion. Upon completion of the shaft, LDI is expected to benefit from increased production at reduced cash costs per ounce1.
Recent mine expansion highlights include:
| · | Surface construction work significantly advanced and remains on target to be completed by the end of Q3; |
| · | Shaft sinking is underway and on target to begin commissioning at year end; |
| · | Underground development progressing on schedule; |
| · | Preparation for the first upper Offset Zone production stope is completed; |
| · | Commissioning of the service and auxiliary hoists is on schedule for August; and |
| · | The main sub-station was successfully commissioned and connected to the power grid. |
1Non-IFRS measure. Please refer to Non-IFRS Measures on pages 26-29.
4
SECOND QUARTER REPORT 2012 |
North American Palladium Ltd. |
Development work in the second half of 2012 will be focused on completing the surface construction activities, advancing underground development (including mine level development and setting up mining stopes), and completing the shaft sinking to the 795-metre mine level by year end.
Vezza Gold Mine Development Update
Late in the second quarter, the Company received the final production permit for its Vezza gold mine, and commenced mining the initial stoping panels. Although the grades encountered have been as expected, dilution has been higher than anticipated, and the daily mining rate is ramping up more slowly primarily due to longer stope preparation time. The Company is in the process of optimizing its mining techniques based on the early stoping results, with the objective of reducing dilution and stope preparation times by adding and improving long-hole benching techniques to complement alimak stope mining.
In the second quarter, development expenditures totaled $8.6 million. Until the mine reaches commercial production, all costs associated with achievement of commercial production (net of pre-production revenue from gold sales) will be capitalized. With the development well advanced, and permits in place, the Company announced on July 9th that it will explore divestiture opportunities for its gold assets.
Exploration
In the second quarter of 2012, the Company expensed $4.0 million in exploration costs and capitalized an additional $0.5 million associated with the LDI mine expansion. In the second quarter, 47 holes were drilled totaling 10,591 metres and 87 holes were drilled totaling 22,494 metres in the first half of 2012.
Outlook
Palladium spot prices averaged US$629 per ounce in the second quarter, ranging from a low of US$566 per ounce, to a high of US$683 per ounce. Despite some temporary price weakness stemming from the uncertainty of the European debt crisis, the long term supply and demand fundamentals of palladium remain strong, and most forecasters continue to have a positive outlook. Supporting factors behind the positive outlook for the metal's future performance are strong industrial demand, continuing investment demand, and constrained global supply.
For the remainder of the year, the Company plans to focus on the following milestones:
| · | Commence commissioning of the LDI mine shaftby year end; |
| · | Realizing value for the gold division assets; and |
| · | Advancing its ongoing near-mine and greenfields palladium exploration programs. |
Metal Prices
Palladium Price (US$/ Troy oz)
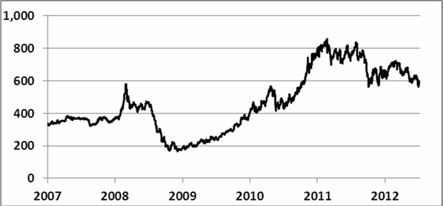
During the second quarter, the palladium price averaged US$629 per ounce, ranging from a low of US$566 to a high of US$683 per ounce. As of August 7, 2012, the palladium price was US$587 per ounce.
5
SECOND QUARTER REPORT 2012 |
North American Palladium Ltd. |
Average exchange rate (CDN$1=US$)
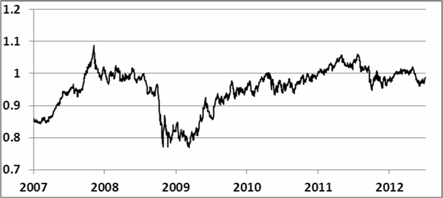
During the second quarter, the average Canadian dollar exchange rate was $0.99, ranging from a low of $0.96 to a high of $1.02 to the U.S. dollar. The Canadian dollar closed at $0.98 to the U.S. dollar on June 30, 2012, compared to $1.00 at March 31, 2012. As of August 7, 2012, the Canadian dollar exchange rate was $1.00.
Gold Price (US$/ Troy oz)
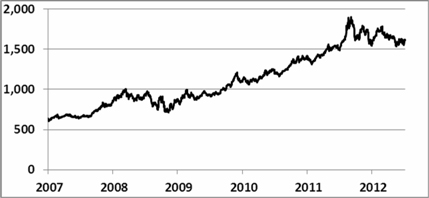
During the second quarter, the average price of gold was US$1,612 per ounce, ranging from a low of US$1,540 to a high of US$1,678 per ounce. The price of gold was US$1,612 as of August 7, 2012.
NAP Realized Metal Prices and Exchange Rates
| | | Three months ended June 30 | | | Six months ended June 30 | |
| | | 2012 | | | 2011 | | | 2012 | | | 2011 | |
| Palladium – US$/oz | | $ | 622 | | | $ | 754 | | | $ | 646 | | | $ | 772 | |
| Platinum – US$/oz | | $ | 1,487 | | | $ | 1,767 | | | $ | 1,531 | | | $ | 1,780 | |
| Gold – US$/oz | | $ | 1,606 | | | $ | 1,523 | | | $ | 1,669 | | | $ | 1,461 | |
| Nickel – US$/lb | | $ | 7.73 | | | $ | 10.67 | | | $ | 8.29 | | | $ | 11.36 | |
| Copper – US$/lb | | $ | 3.53 | | | $ | 4.13 | | | $ | 3.66 | | | $ | 4.26 | |
| Average exchange rate – CDN$1 = US$ | | $ | 0.99 | | | $ | 1.03 | | | $ | 0.99 | | | $ | 1.02 | |
Realized metal prices in the chart above represent the weighted average metal prices on amounts settled from smelters for final outturn of metals during the year.
6
SECOND QUARTER REPORT 2012 |
North American Palladium Ltd. |
Spot Metal Prices* and Exchange Rates
For comparison purposes, the following table sets out spot metal prices and exchange rates.
| | | Jun-30 | | | Mar-31 | | | Dec-31 | | | Sep-30 | | | Jun-30 | | | Mar-31 | | | Dec-31 | | | Sep-30 | |
| | | 2012 | | | 2012 | | | 2011 | | | 2011 | | | 2011 | | | 2011 | | | 2010 | | | 2010 | |
| Palladium – US$/oz | | $ | 578 | | | $ | 651 | | | $ | 636 | | | $ | 614 | | | $ | 761 | | | $ | 766 | | | $ | 791 | | | $ | 573 | |
| Gold – US$/oz | | $ | 1,599 | | | $ | 1,663 | | | $ | 1,575 | | | $ | 1,620 | | | $ | 1,506 | | | $ | 1,439 | | | $ | 1,410 | | | $ | 1,307 | |
| Platinum – US$/oz | | $ | 1,428 | | | $ | 1,640 | | | $ | 1,381 | | | $ | 1,511 | | | $ | 1,722 | | | $ | 1,773 | | | $ | 1,731 | | | $ | 1,662 | |
| Nickel – US$/lb | | $ | 7.46 | | | $ | 7.91 | | | $ | 8.28 | | | $ | 8.30 | | | $ | 10.48 | | | $ | 11.83 | | | $ | 11.32 | | | $ | 10.57 | |
| Copper – US$/lb | | $ | 3.44 | | | $ | 3.83 | | | $ | 3.43 | | | $ | 3.24 | | | $ | 4.22 | | | $ | 4.26 | | | $ | 4.38 | | | $ | 3.65 | |
| Exchange rate (Bank of Canada) – CDN$1 = US$ | | US$ | 0.98 | | | US$ | 1.00 | | | US$ | 0.98 | | | US$ | 0.96 | | | US$ | 1.04 | | | US$ | 1.03 | | | US$ | 1.01 | | | US$ | 0.97 | |
* Based on the London Metal Exchange
| PALLADIUM OPERATIONS – FINANCIAL, OPERATING & DEVELOPMENT RESULTS |
The LDI mine consists of an open pit, an underground mine, and a mill with a design capacity of approximately 15,000 tonnes per day. The primary deposits on the property are the open pit Roby Zone and the Offset Zone, both disseminated magmatic palladium-platinum group metal deposits.
For the three and six months ended June 30, 2012, underground ore production from the LDI mine operated at approximately 2,300 tonnes per day, seven days a week, on two 12-hour shifts per day. The LDI mine has a workforce of approximately 328 employees.
Financial Results
Income from mining operations for the Palladium operations is summarized in the following table.
| | | Three months ended June 30 | | | Six months ended June 30 | |
| | | 2012 | | | 2011 | | | 2012 | | | 2011 | |
| Revenue | | $ | 40,563 | | | $ | 44,329 | | | $ | 82,143 | | | $ | 73,765 | |
| Mining operating expenses | | | | | | | | | | | | | | | | |
| Production costs | | $ | 27,214 | | | $ | 21,131 | | | $ | 52,608 | | | $ | 41,170 | |
| Smelting, refining and freight costs | | | 3,761 | | | | 2,118 | | | | 6,736 | | | | 3,545 | |
| Royalty expense | | | 1,471 | | | | 1,899 | | | | 3,065 | | | | 3,025 | |
| Other | | | 734 | | | | - | | | | 734 | | | | - | |
| Depreciation and amortization | | | 4,861 | | | | 2,594 | | | | 8,608 | | | | 4,349 | |
| (Gain) loss on disposal of equipment | | | 97 | | | | (242 | ) | | | 97 | | | | (242 | ) |
| Total mining operating expenses | | $ | 38,138 | | | $ | 27,500 | | | $ | 71,848 | | | $ | 51,847 | |
| Income from mining operations | | $ | 2,425 | | | $ | 16,829 | | | $ | 10,295 | | | $ | 21,918 | |
The Company has included income from mining operations as an additional IFRS measure to provide the user with information on the actual results of operations for each reporting segment.
7
SECOND QUARTER REPORT 2012 |
North American Palladium Ltd. |
Revenue
Revenue is affected by sales volumes, commodity prices and currency exchange rates. Metal sales for LDI are recognized in revenue at provisional prices when delivered to a smelter for treatment or designated shipping point. Final pricing is not determined until the refined metal is sold by the smelter, which in the case of LDI’s gold, nickel and copper is two months and LDI’s palladium and platinum is four months after delivery to the smelter. These final pricing adjustments can result in additional revenues in a rising commodity price environment and reductions to revenue in a declining commodity price environment. Similarly, a weakening in the Canadian dollar relative to the U.S. dollar will result in additional revenues and a strengthening in the Canadian dollar will result in reduced revenues. For past production delivered to the smelter, the Company enters into financial contracts to mitigate the smelter agreements’ provisional pricing exposure to rising or declining palladium and gold prices and an appreciating Canadian dollar. These financial contracts represent 91,300 ounces of palladium and 5,385 ounces of gold as at June 30, 2012 and mature from July 2012 through December 2012 at an average price of $661 per ounce of palladium and $1,690 per ounce of gold. For substantially all of the palladium delivered to the customer under the smelter agreement, the quantities and timing of settlement specified in the financial contracts match final pricing settlement periods. The palladium financial contracts are being recognized on a mark-to-market basis as an adjustment to revenue. The fair value of these contracts at June 30, 2012 was $6.4 million, which is included in accounts receivable (December 31, 2011 – $2.0 million).
During the second quarter, LDI signed a three-year contract for the smelting and refining of the mine’s concentrate which contains higher smelting and refining charges from the previous contract, but has a shorter payment period, which will enable the Company to reduce its investment in working capital.
Sales volumes of LDI’s major commodities are set out in the table below.
| | | Three months ended June 30 | | | Six months ended June 30 | |
| | | 2012 | | | 2011 | | | 2012 | | | 2011 | |
| Sales volumes | | | | | | | | | | | | | | | | |
| Palladium (oz) | | | 42,285 | | | | 46,362 | | | | 81,233 | | | | 76,817 | |
| Gold (oz) | | | 2,782 | | | | 1,790 | | | | 5,356 | | | | 2,990 | |
| Platinum (oz) | | | 3,055 | | | | 2,609 | | | | 5,490 | | | | 4,292 | |
| Nickel (lbs) | | | 416,422 | | | | 172,393 | | | | 785,816 | | | | 305,448 | |
| Copper (lbs) | | | 721,962 | | | | 335,900 | | | | 1,319,488 | | | | 564,491 | |
| Cobalt (lbs) | | | 3,479 | | | | 4,383 | | | | 12,251 | | | | 7,707 | |
| Silver (oz) | | | 2,172 | | | | 332 | | | | 4,201 | | | | 845 | |
Revenue from metal sales from the Palladium operations is set out in the table below.
| | | Three months ended June 30 | | | Six months ended June 30 | |
| | | 2012 | | | 2011 | | | 2012 | | | 2011 | |
| Revenue before pricing adjustments | | $ | 42,010 | | | $ | 45,270 | | | $ | 82,697 | | | $ | 76,318 | |
| Pricing adjustments | | | (1,447 | ) | | | (941 | ) | | | (554 | ) | | | (2,553 | ) |
| Revenue after pricing adjustments | | $ | 40,563 | | | $ | 44,329 | | | $ | 82,143 | | | $ | 73,765 | |
| Revenue by metal | | | | | | | | | | | | | | | | |
| Palladium | | $ | 26,441 | | | $ | 34,268 | | | $ | 52,841 | | | $ | 56,764 | |
| Gold | | | 4,342 | | | | 2,729 | | | | 8,985 | | | | 4,335 | |
| Platinum | | | 4,063 | | | | 4,180 | | | | 8,979 | | | | 6,950 | |
| Nickel | | | 3,193 | | | | 1,696 | | | | 6,148 | | | | 3,300 | |
| Copper | | | 2,441 | | | | 1,360 | | | | 4,901 | | | | 2,244 | |
| Cobalt | | | 31 | | | | 68 | | | | 168 | | | | 118 | |
| Silver | | | 52 | | | | 28 | | | | 121 | | | | 54 | |
| | | $ | 40,563 | | | $ | 44,329 | | | $ | 82,143 | | | $ | 73,765 | |
8
SECOND QUARTER REPORT 2012 |
North American Palladium Ltd. |
For the three months ended June 30, 2012, revenue before pricing adjustments was $42.0 million, compared to $45.3 million in the same period last year. The decreased revenue in the second quarter of 2012 reflected a decrease in the quantity of palladium ounces sold as well as lower realized prices, compared to the same quarter last year. For the six months ended June 30, 2012, revenue before pricing adjustments was $82.7 million, compared to $76.3 million for the same period last year, reflecting higher quantities of palladium ounces sold in the current year, partially offset by lower realized prices.
Operating Expenses
For the three months ended June 30, 2012, operating expenses were $38.1 million, compared to $27.5 million in the prior year period. Operating expenses for the six months ended June 30, 2012 were $71.8 million compared to $51.8 million in the same period last year. The increase in operating expenses in 2012 resulted primarily from mining and processing more tonnage from the open pit, higher contractor costs and higher parts, supplies and fuel charges, compared to the same period last year.
Cash cost per ounce1 of palladium sold, was US$429 for the quarter ended June 30, 2012 (2011 – US$335) and US$404 for the six months ended June 30, 2012 (2011 – US$408).
Due to the Company’s commitment to a comprehensive energy management plan the Company qualified for the Ontario government’s Northern Industrial Electricity Rate (“NIER”) program to receive electricity price rebates of two cents per kilowatt hour. In the second quarter of 2011, the Company was accepted into the program and a retroactive rebate of $1.9 million was received for the period April 1, 2010 through March 31, 2011. For the three months ended June 30, 2012, a rebate of $0.8 million was received ($1.7 million for the six months ended June 30, 2012). The rebate was treated as a reduction of operating expenses. The Company expects to continue to meet the eligibility criteria such that LDI will be entitled to receive additional quarterly rebates until March 2013.
Smelting, refining and freight costs for the three months ended June 30, 2012 were $3.8 million compared to $2.1 million in the same period in 2011 and for the six months ended June 30, 2012, costs were $6.7 million compared to $3.5 million in the prior year. The increase over the prior year for the three and six months ended June 30, 2012 is primarily due to more tonnes of concentrate being processed and higher smelter and refining treatment charges associated with the current smelter contract compared to the previous contract.
For the three months ended June 30, 2012, royalty expense was $1.5 million compared to $1.9 million in the prior year. Royalty expense was lower in the current quarter due to lower revenue and higher smelter, refining and freight charges in the current year. Royalty expense was $3.1 million for the six months ended June 30, 2012 compared to $3.0 million for the same period last year.
Depreciation and amortization at the LDI mine for the three months ended June 30, 2012 was $4.9 million, compared to $2.6 million for the three months ended June 30, 2011. The increase over the prior year is due to a significant increase in depreciable assets associated with the LDI mine expansion. For the six months ended June 30, 2012, depreciation and amortization was $8.6 million compared to $4.3 million in the same period last year.
Other charges at the LDI mine for the three months ended June 30, 2012 were $0.7 million, compared to $nil in the prior year quarter. These additional costs related to expenditures to mitigate the effects of flooding caused by an unprecedented rainfall in the Thunder Bay region in June, which was excluded from the cash cost per ounce1 of $US429.
1 Non-IFRS measure. Please refer to Non-IFRS Measures on pages 26-29.
9
SECOND QUARTER REPORT 2012 |
North American Palladium Ltd. |
Operating Results
The key operating results for the Palladium operations are set out in the following table.
| | | Three months ended June 30 | | | Six months ended June 30 | |
| | | 2012 | | | 2011 | | | 2012 | | | 2011 | |
| Tonnes of ore milled | | | 528,068 | | | | 377,857 | | | | 1,048,012 | | | | 715,703 | |
| Production | | | | | | | | | | | | | | | | |
| Palladium (oz) | | | 40,017 | | | | 46,971 | | | | 81,777 | | | | 77,632 | |
| Gold (oz) | | | 2,643 | | | | 1,813 | | | | 5,389 | | | | 3,020 | |
| Platinum (oz) | | | 2,930 | | | | 2,638 | | | | 5,528 | | | | 4,330 | |
| Nickel (lbs) | | | 397,262 | | | | 174,644 | | | | 789,559 | | | | 308,480 | |
| Copper (lbs) | | | 691,096 | | | | 339,579 | | | | 1,326,720 | | | | 569,585 | |
| Palladium head grade (g/t) | | | 3.35 | | | | 4.98 | | | | 3.41 | | | | 4.45 | |
| Palladium recoveries (%) | | | 77.3 | | | | 83.2 | | | | 77.3 | | | | 81.4 | |
| Tonnes of ore mined | | | 504,497 | | | | 428,692 | | | | 1,036,932 | | | | 761,215 | |
| Total cost per tonne milled | | $ | 52 | | | $ | 56 | | | $ | 50 | | | $ | 58 | |
| Cash cost per ounce of palladium ($USD)1 | | $ | 429 | | | $ | 335 | | | $ | 404 | | | $ | 408 | |
LDI Mine
Production during the second quarter of 2012 at the LDI mine included the blending of higher grade underground ore with lower-grade surface ore. During the quarter, 504,497 tonnes of ore was extracted (2011 – 428,692 tonnes of ore extracted). For the six months ended June 30, 2012, 1,036,932 tonnes of ore was extracted (2011 – 761,215 tonnes of ore extracted).
LDI Mill
For the three months ended June 30, 2012, the LDI mill processed 528,068 tonnes of ore (underground sources – 211,963 tonnes at mill grade of 5.24 grams per tonne, surface sources – 316,105 tonnes at mill grade of 2.08 grams per tonne) at an average of 13,136 tonnes per operating day, producing 40,017 ounces of payable palladium at an average palladium head grade of 3.35 grams per tonne, with a palladium recovery of 77.3%, and mill availability of 97.6%. For the three months ended June 30, 2011, 377,857 tonnes were processed, producing 46,971 ounces at an average grade of 4.98 grams per tonne, with a palladium recovery of 83.2% and mill availability of 98.3%.
For the six months ended June 30, 2012, the mill processed 1,048,012 tonnes of ore (underground sources – 419,417 tonnes at mill grade of 5.44 grams per tonnes, surface sources – 628,595 tonnes at mill grade of 2.06 grams per tonne) at an average of 12,987 tonnes per operating day, producing 81,777 ounces of payable palladium at an average palladium head grade of 3.41 grams per tonne, palladium recovery of 77.3% and mill availability of 98.2% (2011 – 715,703 tonnes processed, producing 77,632 ounces at an average grade of 4.45 grams per tonne, with a palladium recovery of 81.4% and mill availability of 96.3%.
Production costs of $52 per tonne milled for the three months ended June 30, 2012 were lower, compared to $56 per tonne in the same quarter last year due primarily to more tonnage being produced and processed in 2012. For the six months ended June 30, 2012, production costs were $50 per tonne milled (2011 - $58 per tonne milled). To improve efficiencies and minimize processing costs, the mill is operating on a batch basis, with a two-week operating and a two-week non-operating schedule.
LDI’s cash cost per ounce1 was US$429 for the three months ended June 30, 2012, compared to $335 per ounce1 in the prior year period. For the six months ended June 30, 2012, LDI’s cash cost ounce1 was US$404, compared to US$408 per ounce1 in the prior year period.
1Non-IFRS measure. Please refer to Non-IFRS Measures on pages 26-29.
10
SECOND QUARTER REPORT 2012 |
North American Palladium Ltd. |
LDI Mine Expansion
The Company is currently expanding the LDI mine to transition from mining via ramp access to mining via shaftwhile utilizing a high volume bulk mining method. The objective of the mine expansion isto increase future production at a lower cash cost per ounce1. The Company made significant progress during the quarter in advancing the critical aspects of its mine expansion. Recent mine expansion development highlights include:
| · | Surface construction work significantly advanced and remains on target to be completed by the end of Q3; |
| · | Shaft sinking is underway and on target to begin commissioning at year end; |
| · | Underground development progressing on schedule; |
| · | Preparation for the first upper Offset Zone production stope is completed; |
| · | Commissioning of the service and auxiliary hoists is on schedule for August; and |
| · | The main sub-station was successfully commissioned and connected to the power grid. |
For the three months ended June 30, 2012, $28.2 million was invested in the mine expansion, excluding capitalized interest of $1.7 million. Development work in 2012 will be focused on completing the surface construction activities, advancing underground development (including mine level development and setting up mining stopes), and completing the shaft sinking to the 795-metre mine level by year end.
| GOLD OPERATIONS – FINANCIAL, OPERATING & DEVELOPMENT RESULTS |
NAP’s gold division consists of the operating Vezza gold mine, Sleeping Giant mill, the closed Sleeping Giant mine and a number of nearby exploration projects, all located in the Abitibi region in Quebec. With the development well advanced, and permits in place, the Company announced on July 9th that it will explore divestiture opportunities for its gold assets.
The Company processed the remaining ore from the Sleeping Giant mine during the first quarter before operations were suspended. In the second quarter, the Company continued to process the bulk sample at Vezza. Until the Vezza mine reaches commercial production, all costs (net of pre-production revenue from gold sales) will be capitalized.
Financial Results
The following table summarizes the mining operations for the Gold operations and excludes the Vezza mine results, where all costs are being capitalized until commercial production has been achieved.
| | | Three months ended June 30 | | | Six months ended June 30 | |
| | | 2012 | | | 2011 | | | 2012 | | | 2011 | |
| Revenue | | $ | 2 | | | $ | 7,069 | | | $ | 3,004 | | | $ | 14,347 | |
| Mining operating expenses | | | | | | | | | | | | | | | | |
| Production costs | | | - | | | $ | 7,652 | | | $ | 2,157 | | | $ | 18,040 | |
| Smelting, refining and freight costs | | | 1 | | | | 18 | | | | 4 | | | | 30 | |
| Depreciation and amortization | | | 26 | | | | 2,300 | | | | 170 | | | | 4,662 | |
| Gold mine closure, care and maintenance costs | | | 274 | | | | | | | | 1,351 | | | | - | |
| Loss (gain) on disposal of equipment | | | (286 | ) | | | - | | | | (365 | ) | | | - | |
| Total mining operating expenses | | $ | 15 | | | $ | 9,970 | | | $ | 3,317 | | | $ | 22,732 | |
| Loss from mining operations | | $ | (13 | ) | | $ | (2,901 | ) | | $ | (313 | ) | | $ | (8,385 | ) |
The Company has included income from mining operations as an additional IFRS measure to provide the user with information of the actual results of operations for each reporting segment.
1Non-IFRS measure. Please refer to Non-IFRS Measures on pages 26-29.
11
SECOND QUARTER REPORT 2012 |
North American Palladium Ltd. |
Revenue
Metal sales for the Sleeping Giant gold mine are recognized when metal is sold to a third party. Sales volumes are set out in the table below.
| | | Three months ended June 30 | | | Six months ended June 30 | |
| | | 2012 | | | 2011 | | | 2012 | | | 2011 | |
| Sales volumes | | | | | | | | | | | | | | | | |
| Gold (oz) | | | - | | | | 4,810 | | | | 1,663 | | | | 9,910 | |
| Silver (oz) | | | 82 | | | | - | | | | 2,578 | | | | 11,400 | |
As operations for the Sleeping Giant gold mine were suspended at the beginning 2012 and pre-production revenue from the Vezza gold mine was capitalized, for the three months ended June 30, 2012, revenue was $nil compared to $7.1 million in the prior year reflecting gold sales of 4,810 ounces with an average realized price of US$1,515 per ounce. Revenue was $3.0 million for the six months ended June 30, 2012, compared to $14.3 million in the prior year, reflecting gold sales of 1,663 ounces with an average realized price of US$1,762 per ounce (2011 – 9,910 ounces with an average realized price of US$1,445).
Operating Expenses
For the three months ended June 30, 2012, total production costs at the Sleeping Giant gold mine were $nil as compared to $7.7 million in the prior year quarter due to mine operations ceasing at the beginning of 2012. Total production costs were $2.2 million for the six months ended June 30, 2012, compared to $18.0 million in 2011.
Depreciation and amortization for the Gold operations was $nil for the three months ended June 30, 2012 compared to $2.3 million in the prior year quarter due to mine operations ceasing at the beginning of 2012. For the six months ended June 30, 2012, depreciation and amortization was $0.2 million compared to $4.7 million in the prior year.
As a result of the Company’s decision to cease mining operations at Sleeping Giant and restructure the gold division, closure costs and care and maintenance costs of $0.3 million were recorded during the second quarter and $1.4 million (primarily severance) during the six months ended June 30, 2012.
Operating Results
The key operating results for the Gold operations are set out in the following table.
| | | Three months ended June 30 | | | Six months ended June 30 | |
| | | 2012 | | | 2011 | | | 2012 | | | 2011 | |
| Tonnes of ore milled | | | - | | | | 22,697 | | | | 6,369 | | | | 43,339 | |
| Production | | | | | | | | | | | | | | | | |
| Gold (oz) | | | - | | | | 4,821 | | | | 1,199 | | | | 8,520 | |
| Gold head grade (g/t) | | | - | | | | 6.83 | | | | 6.14 | | | | 6.35 | |
| Gold recoveries (%) | | | - | | | | 96.8 | | | | 95.4 | | | | 96.2 | |
| Tonnes of ore hoisted | | | - | | | | 22,604 | | | | 6,369 | | | | 42,886 | |
| Total cost per tonne milled | | | - | | | $ | 337 | | | $ | 339 | | | $ | 416 | |
| Cash cost per ounce ($USD)1 | | | - | | | $ | 1,643 | | | $ | 1,236 | | | $ | 1,824 | |
Sleeping Giant Mine
As operations for the Sleeping Giant gold mine were suspended at the beginning of 2012, there were no tonnes hoisted for the three months ended June 30, 2012, compared to 22,604 tonnes of ore hoisted from the underground mine in the prior year with an average gold grade of 6.83 grams per tonne. For the six months ended June 30, 2012, 6,369 tonnes of ore were hoisted with an average gold grade of 6.14 grams per tonne, compared to 42,886 tonnes hoisted with an average gold grade of 6.35 grams per tonne in 2011.
1Non-IFRS measure. Please refer to Non-IFRS Measures on pages 26-29.
12
SECOND QUARTER REPORT 2012 |
North American Palladium Ltd. |
Sleeping Giant Mill
For the three months ended June 30, 2012, the mill did not process any ore from the Sleeping Giant gold mine, compared to the prior year when 22,697 tonnes of ore were processed, producing 4,821 ounces of gold at an average gold head grade of 6.83 grams per tonne, with a gold recovery of 96.8% and mill availability of 93.4%.
In the prior year, Sleeping Giant’s cash cost per ounce1 was US$1,643 for the three months ended June 30, 2011 and production costs per tonne of ore milled were $337. For the six months ended June 30, 2012, Sleeping Giant’s cash cost per ounce1 was US$1,236 (2011 – US$1,824) and production costs per tonne of ore milled were $339 (2011 - $416).
At June 30, 2012, the mill contained approximately 1,534 ounces of gold being processed from Vezza that was included in inventory and valued at net realizable value. Despite the closure of the Sleeping Giant mine, the mill will continue to operate to process ore from the nearby Vezza mine.
Vezza Gold Mine
Late in the second quarter, the Company received the final production permit for its Vezza gold mine, and commenced mining the initial stoping panels. Although the grades encountered have been as expected, dilution has been higher than anticipated, and the daily mining rate is ramping up more slowly primarily due to longer stope preparation time. The Company is in the process of optimizing its mining techniques based on the early stoping results, with the objective of reducing dilution and stope preparation times by adding and improving long-hole benching techniques to complement alimak stope mining. The optimization is expected to improve the long-term production capabilities once the mine achieves commercial production, which is now not expected to occur until year-end.
In the three months ended June 30, 2012, development expenditures totaled $8.6 million ($16.4 million for the six months ended June 30, 2012). Until the mine reaches commercial production, all costs associated with achievement of commercial production (net of pre-production revenue from gold sales) will be capitalized.
| CONSOLIDATED FINANCIAL RESULTS |
General and administration
The Company’s general and administration expenses for the three months ended June 30, 2012 were $3.2 million, comparable to $3.1 million in the prior year quarter. For the six months ended June 30, 2012, general and administration costs were $6.5 million, in line with prior year.
1 Non-IFRS measure. Please refer to Non-IFRS Measures on pages 26-29.
13
SECOND QUARTER REPORT 2012 |
North American Palladium Ltd. |
Exploration
Exploration expenditures for the three months ended June 30, 2012 were $4.0 million compared to $6.1 million in the prior year quarter. Exploration expenditures were $8.0 million for the six months ended June 30, 2012 compared to $10.0 million for the six months ended June 30, 2011. Exploration expenditures are comprised as follows:
| | | Three months ended June 30 | | | Six months ended June 30 | |
| | | 2012 | | | 2011 | | | 2012 | | | 2011 | |
| Palladium operations | | | | | | | | | | | | | | | | |
| Ontario exploration projects* | | $ | 2,764 | | | $ | 3,849 | | | $ | 5,939 | | | $ | 5,757 | |
| Gold operations | | | | | | | | | | | | | | | | |
| Quebec exploration projects** | | | 571 | | | | 2,251 | | | | 1,477 | | | | 4,232 | |
| Other exploration expenses | | | 634 | | | | - | | | | 547 | | | | (66 | ) |
| | | | 1,205 | | | | 2,251 | | | | 2,024 | | | | 4,166 | |
| Corporate and other*** | | | - | | | | 34 | | | | 9 | | | | 50 | |
| Total exploration expenditures | | $ | 3,969 | | | $ | 6,134 | | | $ | 7,972 | | | $ | 9,973 | |
| * | Ontario exploration projects are comprised of LDI exploration projects, including the Cowboy, Outlaw and Sheriff/South Pit zones, North LDI, North VT Rim, South VT Rim, Legris Lake, Salmi Lake, Tib Lake, Shabaqua Gold and other grassroots exploration properties. |
| ** | Other Quebec exploration projects are comprised of the Vezza, Sleeping Giant mine property, Flordin, Discovery, Dormex, Laflamme, and Prospect properties. |
| *** | Corporate and other includes Shebandowan. |
Interest expense and other costs (income)
Interest expense and other income for the three months ended June 30, 2012 was $1.3 million compared to income of $1.0 million in the prior year quarter. The current year balance includes an unrealized gain on palladium warrants of $2.3 million, a gain on the renouncement of flow-through expenditures of $0.3 million, partially offset by accretion expense of $1.0 million and other interest charges of $0.2 million. The prior year balance includes a gain on renouncement of flow-through expenditures of $0.9 million.
For the six months ended June 30, 2012, interest expense and other income was $0.4 million compared to income of $1.4 million in the prior year. The 2012 balance includes an unrealized gain on palladium warrants of $2.3 million, a gain on the renouncement of flow-through expenditures of $0.3 million, partially offset by accretion expense of $1.6 million, and other interest charges of $0.7 million. The 2011 amount includes a gain on renunciation of flow-through expenditures of $1.3 million and interest income of $0.6 million.
Interest expense and other income include interest on finance leases, asset retirement obligation accretion, accretion expense on long-term debt, interest expense, unrealized gains/losses on palladium warrants, gains on renouncement of flow-through expenditures and interest income in the current and prior year periods.
14
SECOND QUARTER REPORT 2012 |
North American Palladium Ltd. |
Income and Mining Tax Expense (Recovery)
The income and mining tax expense (recovery) for the three and six months ended June 30, are provided as follows:
| | | Three months ended June 30 | | | Six months ended June 30 | |
| | | 2012 | | | 2011 | | | 2012 | | | 2011 | |
| LDI palladium mine | | | | | | | | | | | | | | | | |
| Ontario transitional tax credit | | $ | - | | | $ | - | | | $ | - | | | $ | 2,387 | |
| | | $ | - | | | | - | | | $ | - | | | $ | 2,387 | |
| Sleeping Giant gold mine and Vezza gold mine | | | | | | | | | | | | | | | | |
| Quebec mining duties expense (recovery) | | $ | 187 | | | $ | 137 | | | $ | (911 | ) | | $ | 92 | |
| Quebec income tax recovery | | | - | | | | - | | | | - | | | | (107 | ) |
| Mining interests temporary difference expense (recovery) | | | (287 | ) | | | 84 | | | | 732 | | | | 664 | |
| | | $ | (100 | ) | | $ | 221 | | | $ | (179 | ) | | $ | 649 | |
| Corporate and other | | | | | | | | | | | | | | | | |
| Expiration of warrants | | | - | | | | - | | | | - | | | $ | (3 | ) |
| | | | - | | | | - | | | | - | | | $ | (3 | ) |
| Income and Mining Tax Expense (Recovery) | | $ | (100 | ) | | $ | 221 | | | $ | (179 | ) | | $ | 3,033 | |
For the three months ended June 30, 2012, income and mining tax recovery was $0.1 million compared to a $0.2 million expense in the same period in 2011. In the current year, income and mining tax recovery includes mining interest temporary differences ($0.3 million), partially offset by Quebec mining duties expense ($0.2 million). The prior year balance includes Quebec mining duties expense ($0.1 million) and mining interest temporary differences ($0.1 million). Income and mining tax recovery for the six months ended June 30, 2012 was $0.2 million compared to an expense of $3.0 million in the same period last year. In the current year, income and mining tax recovery includes Quebec mining duties recovery ($0.9 million), partially offset by mining interest temporary differences ($0.7 million). The prior year balance includes Ontario transitional tax credits ($2.4 million) and mining interest temporary differences ($0.7 million).
Net Income (loss)
For the three months ended June 30, 2012, the Company reported a net loss of $3.1 million or $0.02 per share compared to net income of $5.4 million or $0.03 per share in the three months ended June 30, 2011. The increase in the net loss is primarily due to a lower realized palladium price in the current year.
The Company reported a net loss of $4.0 million or $0.02 per share for the six months ended June 30, 2012, compared to a net loss of $4.9 million or $0.03 per share in the prior year.
15
SECOND QUARTER REPORT 2012 |
North American Palladium Ltd. |
Summary of Quarterly Results
(expressed in thousands of Canadian dollars except per share amounts)
| | | 2012 | | | 2011 | | | 2010 | |
| | | Q2 | | | Q1 | | | Q4 | | | Q3 | | | Q2 | | | Q1 | | | Q4 | | | Q3 | |
| Revenue | | $ | 40,565 | | | $ | 44,582 | | | $ | 44,050 | | | $ | 38,310 | | | $ | 51,398 | | | $ | 36,714 | | | $ | 39,502 | | | $ | 38,451 | |
| Production costs | | | 27,214 | | | | 27,551 | | | | 33,120 | | | | 28,928 | | | | 28,783 | | | | 30,427 | | | | 6,057 | | | | 20,452 | |
| Gold assets impairment charge | | | - | | | | - | | | | 49,210 | | | | - | | | | - | | | | - | | | | - | | | | - | |
| Exploration expense | | | 3,969 | | | | 4,003 | | | | 4,738 | | | | 1,956 | | | | 6,134 | | | | 3,839 | | | | 12,532 | | | | 7,008 | |
| Capital expenditures | | | 40,746 | | | | 44,924 | | | | 52,565 | | | | 50,561 | | | | 41,363 | | | | 41,144 | | | | 20,142 | | | | 14,589 | |
| Net income (loss) | | | (3,053 | ) | | | (928 | ) | | | (57,397 | ) | | | (2,816 | ) | | | 5,380 | | | | (10,321 | ) | | | (2,013 | ) | | | 2,804 | |
| Cash provided by (used in) operations | | | 671 | | | | 4,751 | | | | (25,557 | ) | | | 15,883 | | | | 4,121 | | | | 4,870 | | | | (25,196 | ) | | | (20,007 | ) |
| Net income (loss) per share – basic | | $ | (0.02 | ) | | $ | (0.01 | ) | | $ | (0.35 | ) | | $ | (0.02 | ) | | $ | 0.03 | | | $ | (0.06 | ) | | $ | (0.01 | ) | | $ | 0.02 | |
| Cash provided by (used in) operations prior to changes in non-cash working capital per share1 | | | 0.02 | | | | 0.03 | | | | (0.01 | ) | | | 0.02 | | | | 0.07 | | | | (0.04 | ) | | | 0.02 | | | | 0.04 | |
| FINANCIAL CONDITION, CASH FLOWS, LIQUIDITY AND CAPITAL RESOURCES |
Sources and Uses of Cash
| | | Three months ended June 30 | | | Six months ended June 30 | |
| | | 2012 | | | 2011 | | | 2012 | | | 2011 | |
| Cash provided by operations prior to changes in non-cash working capital | | $ | 3,673 | | | $ | 11,357 | | | $ | 7,894 | | | $ | 4,789 | |
| Changes in non-cash working capital | | | (3,002 | ) | | | (7,236 | ) | | | (2,472 | ) | | | 4,202 | |
| Cash provided by (used in) operations | | | 671 | | | | 4,121 | | | | 5,422 | | | | 8,991 | |
| Cash provided by financing | | | 46,410 | | | | 7,893 | | | | 52,877 | | | | 69,144 | |
| Cash used in investing | | | (40,503 | ) | | | (40,911 | ) | | | (85,348 | ) | | | (82,055 | ) |
| Increase (decrease) in cash and cash equivalents | | $ | 6,578 | | | $ | (28,897 | ) | | $ | (27,049 | ) | | $ | (3,920 | ) |
Operating Activities
For the three months ended June 30, 2012, cash provided by operations prior to changes in non-cash working capital was $3.7 million, compared to cash provided by operations of $11.4 million in the prior year, a decrease of $7.7 million. This decrease is primarily due to lower revenue ($10.8 million), partially offset by lower production costs ($1.6 million). Cash provided by operations prior to changes in non-cash working capital was $7.9 million for the six months ended June 30, 2012, compared to cash provided by operations of $4.8 million in the prior year, an increase of $3.1 million.
For the three months ended June 30, 2012, changes in non-cash working capital resulted in a use of cash of $3.0 million compared to a use of cash of $7.2 million in the prior year. The 2012 balance of $3.0 million is primarily due to an increase in accounts receivable ($5.2 million), partially offset by an increase in accounts payable and accrued liabilities ($0.5 million), a decrease in other assets ($0.8 million) and an increase in taxes payable ($0.9 million). Changes in non-cash working capital for the six months ended June 30, 2012 used cash of $2.5 million compared to cash provided of $4.2 million in the prior year. The 2012 balance is primarily due to an increase in accounts receivable ($11.4 million), partially offset by a decrease in other assets ($5.1 million), a decrease in inventory ($1.0 million) and an increase in accounts payable and accrued liabilities ($3.2 million).
1 Non-IFRS measure. Please refer to Non-IFRS Measures on pages 26-29.
16
SECOND QUARTER REPORT 2012 |
North American Palladium Ltd. |
Financing Activities
For the three months ended June 30, 2012, financing activities provided cash of $46.4 million consisting of $32.9 million related to the issuance of flow-through common shares and $15.3 million drawn down on the credit facility, partially offset by repayments of finance leases of $1.4 million and interest payments ($0.4 million). This compared to cash provided by financing activities of $7.9 million in the prior year consisting of $8.4 million related to proceeds received for mine closure deposits, partially offset by the scheduled repayment of finance leases of $0.5 million. For the six months ended June 30, 2012, financing activities provided cash of $52.9 million consisting of $32.9 million related to the issuance of flow-through common shares, $11.2 million utilized from the $15.0 million finance lease facility and $15.3 million was drawn down on the credit facility, partially offset by repayments of finance leases of $2.6 million and interest payments ($4.0 million). This compared to cash provided by financing activities in the prior year of $69.1 million, of which $41.1 million was related to the exercise of warrants and $20.6 million from the issuance of flow through shares.
Investing Activities
For the three months ended June 30, 2012, investing activities required cash of $40.5 million, relating to additions to mining interests of $40.7 million and the Company received proceeds on disposal of equipment of $0.2 million. For the three months ended June 30, 2011, investing activities required cash of $40.9 million, relating to additions to mining interests and proceeds on disposal of equipment of $0.5 million. Investing activities required cash of $85.3 million for the six months ended June 30, 2012, compared to $82.1 million cash required by investing activities for the six months ended June 30, 2011. The majority of the additions to mining interests were attributable to LDI’s mine expansion project and the Vezza gold mine.
Additions to mining interests
Additions to mining interests are comprised as follows:
| | | Three months ended June 30 | | | Six months ended June 30 | |
| | | 2012 | | | 2011 | | | 2012 | | | 2011 | |
| Palladium operations | | | | | | | | | | | | | | | | |
| Offset Zone development | | $ | 27,708 | | | $ | 27,278 | | | $ | 63,497 | | | $ | 54,199 | |
| Offset Zone exploration costs | | | 508 | | | | 2,534 | | | | 1,386 | | | | 6,367 | |
| Tailings management facility | | | 134 | | | | 151 | | | | 196 | | | | 193 | |
| Other equipment and betterments | | | 3,722 | | | | 1,487 | | | | 4,203 | | | | 3,431 | |
| | | $ | 32,072 | | | $ | 31,450 | | | $ | 69,282 | | | $ | 64,190 | |
| Gold operations | | | | | | | | | | | | | | | | |
| Vezza mine development | | $ | 2,482 | | | $ | 7,320 | | | $ | 4,044 | | | $ | 12,608 | |
| Vezza equipment | | | 996 | | | | - | | | | 1,759 | | | | - | |
| Vezza pre-production revenue | | | (2,942 | ) | | | - | | | | (8,371 | ) | | | - | |
| Vezza pre-production costs | | | 8,138 | | | | - | | | | 18,812 | | | | - | |
| Other equipment and betterments | | | - | | | | 2,593 | | | | 144 | | | | 5,709 | |
| | | $ | 8,674 | | | $ | 9,913 | | | $ | 16,388 | | | $ | 18,317 | |
| | | $ | 40,746 | | | $ | 41,363 | | | $ | 85,670 | | | $ | 82,507 | |
In addition to the mining interests acquired by cash reflected in the table above, the Company also acquired equipment by means of finance leases. For the three months ended June 30, 2012 and June 30, 2011, there were no additions to finance leases. For the six months ended June 30, 2012, $2.0 million ($1.5 million at LDI and $0.5 million at Vezza) of equipment was acquired by means of finance leases compared to $0.9 million in the prior year.
During the second quarter on April 30, 2012, the Company issued 11,300,000 flow-through common shares at a price of $3.10 per share for net proceeds of $32.9 million. The Company is required to spend the gross proceeds of $35.0 million on eligible exploration and mine expansion development expenditures, which expenditures are expected to be renounced to investors for the 2012 tax year. As at June 30, 2012, $6.8 million was spent.
17
SECOND QUARTER REPORT 2012 |
North American Palladium Ltd. |
Capital Resources
As at June 30, 2012, the Company had cash and cash equivalents of $23.9 million compared to $50.9 million as at December 31, 2011. The decrease is due primarily to the investment in LDI’s mine expansion plan and the Vezza gold mine. The funds are invested in short term interest bearing deposits at a major Canadian chartered bank.
The Company has a US$60.0 million credit agreement that is secured by the Company's accounts receivables and inventory and may be used for working capital liquidity and general corporate purposes. Under the credit agreement, the Company utilized US$16.2 million for letters of credit primarily for reclamation deposits and has taken a drawdown of US$15.0 million, leaving US$28.8 million available at June 30, 2012.
During the first quarter of 2012, the Company established a $15.0 million finance lease facility to fund equipment for the LDI mine expansion, of which $11.2 million ($10.6 million, net of repayments) has been utilized as at June 30, 2012.
During the second quarter on April 30, 2012, the Company issued 11,300,000 flow through common shares at a price of $3.10 per share for net proceeds of $32.9 million. The Company is required to spend the gross proceeds of $35.0 million on the eligible exploration and mine expansion development expenditures, which expenditures are expected to be renounced to investors for the 2012 tax year. For the three months ended June 30, 2012, $6.8 million was spent.
Contractual Obligations
Contractual obligations are comprised as follows:
| As at June 30, 2012 | | Payments Due by Period | |
| (expressed in thousands of Canadian dollars) | | Total | | | Less than 1
year | | | 2-5 Years | | | >5 years | |
| Finance lease obligations | | $ | 18,071 | | | $ | 5,014 | | | $ | 13,057 | | | $ | - | |
| Operating leases | | | 5,881 | | | | 3,963 | | | | 1,854 | | | | 64 | |
| Purchase obligations | | | 62,703 | | | | 62,703 | | | | - | | | | - | |
| | | $ | 86,655 | | | $ | 71,680 | | | $ | 14,911 | | | $ | 64 | |
In addition to the above, the Company also has asset retirement obligations at June 30, 2012 in the amount of $20.0 million for the LDI mine, Sleeping Giant mill and Vezza gold mine. The Company obtained a letter of credit of $15.2 million to offset these future outlays. As a result, $4.8 million of funding is required prior to or upon closure of these properties.
Related Party Transactions
There were no related party transactions for the year ended June 30, 2012.
As of August 7, 2012, there were 174,544,885 common shares of the Company outstanding. In addition, there were options outstanding pursuant to the Amended and Restated 2010 Corporate Stock Option Plan entitling holders thereof to acquire 4,595,583 common shares of the Company at a weighted average exercise price of $3.67 per share.
| OVERVIEW OF NAP’S EXPLORATION PROPERTIES |
NAP expects future growth will come from its significant palladium exploration upside and through the continued exploration and development of the Company’s projects. With permits, mine infrastructure and available capacity at LDI, NAP can move from exploration success to production on an accelerated timeline. In addition to the significant exploration program at LDI, the Company’s 2012 exploration budget includes drilling at NAP’s other Ontario properties near LDI.
With respect to the Company’s pipeline of non-producing gold properties, there will be minimal expenditures in 2012 and the Company will seek to realize value through either sale or joint venture opportunities.
18
SECOND QUARTER REPORT 2012 |
North American Palladium Ltd. |
LDI Mine & Property
Exploration is central to LDI’s future and will represent an important part of future growth for the mine and for the Company. LDI is one of only two primary producers of palladium in the world and is situated in unique geology. LDI’s substantial +68,000-acre land package offers exploration upside that is further complimented by the underutilized, 15,000-tonne per day mill. Beyond the immediate mine site, most of the land has had minimal historic exploration. The exploration success achieved during the past few years gives management encouragement that there is strong potential to continue to grow the Company’s palladium reserve and resource base through exploration.
The LDI mine consists of the following underground mineralized zones:
| · | Roby Zone: underground production from Roby commenced in 2006. |
| · | Offset Zone: discovered in 2001, located below and approximately 250 metres south west of the Roby Zone. The Offset Zone remains open in all directions and continues to expand through exploration. LDI mine expansion is currently underway to access Offset Zone ore. |
| · | Cowboy Zone*: discovered in 2009 during infill drilling of the Offset Zone, located 30 to 60 metres to the west of the Offset Zone. This new discovery has the potential to extend LDI’s mine life and could positively impact the economics of the mine. |
| · | Outlaw Zone*: discovered in 2009, located to the west of the Offset Zone and the Cowboy Zone. Further drilling is required to explore the vertical and lateral limit of this mineralization. |
| · | Sheriff Zone*: discovered in 2010, located approximately 100 metres south east of the Offset Zone. Further drilling is required to confirm the geometry and resource potential. |
* The disclosure regarding these mineralized areas is conceptual in nature and there has been insufficient exploration to define a mineral resource of these areas.
The main focus of the 2012 exploration program is underground exploration at LDI targeting the Offset Zone, to conduct infill drilling as well as to test extensions of the Offset Zone mineralization towards surface, at depth, and to the south. In addition, drilling on surface will be conducted at North LDI, the North VT-Rim and Legris Lake. The Company intends to issue its updated mineral reserves and resource estimates for LDI (as at December 31, 2011) on August 8, 2012.
In the second quarter of 2012, 47 holes totaling 10,591 metres were drilled on the LDI property and for the first half of 2012, 87 holes totaling 22,494 metres were drilled. The current LDI mine plan does not include the three nearby underground mineralized zones (Cowboy, Outlaw and Sheriff) due to insufficient drilling at the present time.
On July 16, 2012, the Company provided an exploration update with the following highlights:
| · | Sheriff Zone drilling improves prospect for additional near-surface resources at LDI; |
| · | Offset Zone infill drilling continues to deliver excellent results providing increased confidence in the resource; and |
| · | The Company’s Ontario land package has increased through strategic property acquisitions consolidating the Company’s LDI regional PGE property portfolio. |
On January 30, 2012, the Company provided an update on the remaining drill results from its 2011 exploration program at LDI. Previous exploration updates on the 2011 program were issued by news release on June 28, 2011 and September 14, 2011.
19
SECOND QUARTER REPORT 2012 |
North American Palladium Ltd. |
The highlights from the update included:
| · | Infill drill results in the Offset Zone returned excellent grades, with good width and continuity, including 78 metres at 7.39 grams per tonne Palladium ("g/t Pd") and 33 metres at 8.71 g/t Pd; |
| · | Good indication of a southern extension to the Offset Zone in an area previously reported as the Southern Norite Zone, including 39 metres at 4.02 g/t Pd and 15 metres at 5.13 g/t Pd; |
| · | Mineralization discovered 300 metres to the west of the Offset, Cowboy and Outlaw zones, including 10 metres of 3.05 g/t Pd, giving support to the interpretation that some mineralized zones manifest as a series of parallel stacked lenses; |
| · | Confirmed north and south lateral extensions of upper Roby Zone, including 18 metres at 12.82 g/t Pd; and |
| · | Bonanza grade surface mineralization encountered from trenches along the North VT Rim 500 metres northeast of the LDI open pit, including approximately 1 metre samples at 64.4 g/t Pd and 45.8 g/t Pd. |
Ontario Properties
Legris Lake Property
The Legris Lake property is adjacent to the south east portion of the Company’s LDI property and is comprised of 15 claims and covering an area of approximately 4,297 hectares. The property is underlain by mafic and ultramafic rocks and was optioned for its historic anomalous PGE values. The property is at a preliminary exploration stage, however its PGM potential and close proximity to the LDI mill presents an encouraging exploration target.
Tib Lake Property
On May 3, 2012, LDI entered into an option and purchase agreement with Houston Lake Mining Inc. (“HLM”) whereby LDI obtained an exclusive right and option to purchase a 100% interest in 20 claims located northwest of the Lac des Iles mine, known as the Tib Lake property. The property is subject to a 2.5% net smelter royalty in favour of a third party on a portion of the claims and a 2.5% net smelter royalty in favour of HLM on the remaining claims.
Shebandowan Property
The Company holds a 50% interest in the former producing Shebandowan mine and the surrounding Haines and Conacher properties pursuant to an Option and Joint Venture Agreement with Vale Canada Limited (“Vale”). The properties, known as the Shebandowan property, contain a series of nickel copper-PGM mineralized bodies. The land package, which totals approximately 7,842 hectares, is located 90 kilometres west of Thunder Bay, Ontario, and approximately 100 kilometres southwest from the Company’s LDI mine. Vale retains an option to increase its interest from 50% to 60%, exercisable in the event that a feasibility study on the property results in a mineral reserve and mineral resource estimate of the equivalent of 200 million pounds of nickel and other metals.
Shebandowan West Property
In 2008, The Company initiated an underground test of the Shebandowan West nickel, copper and PGE project. A decline was excavated and mineralization was sampled before work was suspended due to declining metal prices at that time. The intent of the program was to ship mineralization compatible with that of the Roby zone to the LDI mill for processing. The measured and indicated resource for Shebandowan West was 1.3 million tonnes of 0.9% nickel, 0.6% copper, 1.1 g/t palladium, 0.3 g/t platinum and 0.2 g/t gold. Mineral Resources were estimated as of August 9, 2007 by F.H. Brown, CPG, Pr. Sci. Nat., a Qualified Person under NI 43 101.
Moose Calf and Kukkee Properties
In 2010, the Company entered into option agreements for the Moose Calf and Kukkee gold properties located west of Thunder Bay near McGraw Falls. The combined properties are now referred to as the Shabaqua Gold Project.
20
SECOND QUARTER REPORT 2012 |
North American Palladium Ltd. |
Salmi Property
On August 1, 2011, LDI entered into an option and purchase agreement whereby LDI obtained the exclusive right to conduct exploration and development activities as well as an exclusive right and option to purchase a 100% undivided interest in all or part of the property known as the Salmi property, comprised of eleven mineral claims located near the LDI mine and one additional adjacent mineral claim. The option and purchase agreement is subject to a 2% net smelter return royalty on future production from the property with LDI having the right to buy back one half of the net smelter return royalty for $0.5 million.
Other Ontario Properties
During the first half of 2012, 44 holes totaling 14,498 metres were drilled at other Ontario properties including: North LDI, North VT Rim, Sherriff/South Pit, LDI Exploration, South VT Rim, Eleph Lake and Salmi Lake.
Quebec Properties
The primary focus during the quarter was the logging and sampling of core drilled in late 2011 from various properties. In the first half of 2012, a few holes were drilled in the gold division, primarily to meet work commitments. For the remainder of 2012, the Company intends to do minimal exploration activities on its gold properties.
Vezza
During the first half of 2012, the Company drilled 883 metres at the Vezza property.
Sleeping Giant Gold Mine & Property
During the first half of 2012, the Company drilled 789 metres underground and completed the logging and sampling of core drilled in late 2011.
Flordin Property
The Flordin project is located approximately 30 kilometres north of the town of Lebel-sur-Quévillion, and approximately 70 kilometres away from the Sleeping Giant mill. The Company conducted a significant drilling program in 2010, consisting of 212 holes totaling 25,720 metres, which revealed the presence of several parallel gold veins near surface. The Company believes that the Flordin gold project may have the potential to provide additional feed for the Sleeping Giant mill.
In 2011, the Company conducted a drill program consisting of 36 holes totaling 4,857 metres at Flordin. During the first half of 2012, logging of core drilled in late 2011 was completed. Sampling results remain pending.
Discovery Property
Discovery is an advanced-stage gold exploration project located approximately 35 kilometres northwest of the town of Lebel-sur-Quévillon, and approximately 70 kilometres from the Sleeping Giant mill. The Discovery project is contiguous to the Flordin project. A 2008 scoping study confirmed the project to be economically feasible and generate positive cash flow under certain assumptions, with potential to produce 44,000 ounces of gold per year for four years.
In 2011, the Company conducted a drill program consisting of 18 holes totaling 7,438 metres on the project, targeting the extension of the 1200E Zone. During the first half of 2012, drill core recovered in late 2011 was logged and sampled.
Dormex Property
Dormex is an early-stage gold exploration project located adjacent to the Sleeping Giant mill and is believed to have potential gold targets similar to the original mineralization mined at the Sleeping Giant mine. Exploration conducted in 2010 identified a series of promising targets and confirmed the presence of gold in the tills.
21
SECOND QUARTER REPORT 2012 |
North American Palladium Ltd. |
In 2011, the Company conducted a follow up on gold anomalies discovered in the 2010 reverse circulation program and tested new geophysical targets. The drill program consisted of 10 holes totaling 4,060 metres of drilling. During the first half of 2012, core 2011 drilled late in 2011 was logged and sampled. Initial results have not identified the sources of gold anomalies in till samples.
Laflamme Gold Property
Laflamme is an early-stage gold exploration project in the Abitibi region of Quebec, a joint venture with Midland Exploration Inc. (“Midland”). The property is situated on favourable geology, following the trend from the Company’s Discovery project to the Sleeping Giant mine. The Company is the Operator of the joint venture and may acquire an additional 15% interest by completing a feasibility study.
During the first half of 2012, the Company drilled 2,072 metres.
| CRITICAL ACCOUNTING POLICIES AND ESTIMATES |
Critical accounting policies generally include estimates that are highly uncertain and for which changes in those estimates could materially impact the Company’s financial statements. The following accounting policies are considered critical:
The preparation of the consolidated financial statements in conformity with IFRS requires management to make judgments, estimates, and assumptions that affect the application of accounting policies and the reported amount of assets and liabilities, the disclosure of contingent assets and liabilities at the date of the financial statements and the reported amounts of revenue and expenses during the year. Significant estimates and assumptions relate to recoverability of mining operations and mineral exploration properties. While management believes that these estimates and assumptions are reasonable, actual results could vary significantly.
Certain assumptions are dependent upon reserves, which represent the estimated amount of ore that can be economically and legally extracted from the Company’s properties. In order to estimate reserves, assumptions are required about a range of geological, technical and economic factors, including quantities, grades, production techniques, recovery rates, production costs, transportation costs, commodity demand, commodity prices and exchange rates. Estimating the quantity and/or grade of reserves requires the size, shape and depth of ore bodies to be determined by analyzing geological data such as drilling samples. This process may require complex and difficult geological judgments to interpret the data. Estimates and underlying assumptions are reviewed on an ongoing basis. Revisions to accounting estimates are recognized in the period in which the estimates are revised and in any future periods affected.
22
SECOND QUARTER REPORT 2012 |
North American Palladium Ltd. |
Because the economic assumptions used to estimate reserves change from period to period, and because additional geological data is generated during the course of operations, estimates of reserves may change from period to period. Changes in reported reserves may affect the Company’s financial results and financial position in a number of ways, including the following:
| · | Asset carrying values may be affected due to changes in estimated future cash flows; |
| · | Depreciation and amortization expensed in the income statement may change where such expenses are determined by the units of production basis, or where the useful economic lives of assets change; |
| · | Overburden removal costs recorded on the balance sheet or charged to the statements of operations and comprehensive income may change due to changes in the units of production basis of depreciation and amortization; |
| · | Decommissioning, site restoration and environmental provisions may change where changes in estimated reserves affect expectations about the timing or cost of these activities; and |
| · | The carrying value of deferred tax assets may change due to changes in estimates of the likely recovery of the tax benefits. |
| b. | Impairment assessments of long-lived assets |
The carrying amounts of the Company’s non-financial assets, other than investment property, inventories and deferred tax assets, are reviewed at each reporting date to determine whether there is any indication of impairment. Impairment is assessed at the level of cash-generating units (“CGUs”). An impairment loss is recognized in the Consolidated Statements of Operations and Comprehensive Income (Loss) for any excess of carrying amount over the recoverable amount.
Impairment is determined for an individual asset unless the asset does not generate cash inflows that are independent of those generated from other assets or groups of assets, in which case, the individual assets are grouped together into CGUs for impairment purposes.
The recoverable amount of an asset or cash-generating unit is the greater of its “value in use” and its “fair value less costs to sell”. In assessing value in use, the estimated future cash flows are discounted to their present value using a pre-tax discount rate that reflects current market assessments of the time value of money and the risks specific to the asset.
An impairment loss is recognized in the Consolidated Statements of Operations and Comprehensive Income (Loss) if the carrying amount of an asset or its CGU exceeds its estimated recoverable amount.
Impairment losses recognized in prior periods are assessed at each reporting date for any indications that the loss has decreased or no longer exists. An impairment loss on non-financial assets other than goodwill is reversed if there has been a change in the estimates used to determine the recoverable amount, only to the extent that the asset’s carrying amount does not exceed the carrying amount that would have been determined, net of amortization, if no impairment loss had been recognized.
| c. | Depreciation and amortization of mining interests |
Mining interests relating to plant and equipment, mining leases and claims, royalty interests, and other development costs are recorded at cost with depreciation and amortization provided on the unit-of-production method over the estimated remaining ounces of palladium (LDI) and gold (NAP Quebec) to be produced based on the proven and probable reserves.
23
SECOND QUARTER REPORT 2012 |
North American Palladium Ltd. |
Mining interests relating to small vehicles and certain machinery with a determinable expected life are recorded at cost with depreciation provided on a straight-line basis over their estimated useful lives, ranging from three to seven years, which most closely reflects the expected pattern of consumption of the future economic benefits embodied in the asset. Straight-line depreciation is calculated over the depreciable amount, which is the cost of an asset, less its residual value.
Significant components of individual assets are assessed and if a component has a useful life that is different from the remainder of that asset, that component is depreciated separately using the unit-of-production or straight-line method as appropriate. Costs relating to value beyond proven and probable reserves (“VBPP”) and land are not amortized.
Leased assets are depreciated over the shorter of the lease term and their useful lives unless it is reasonably certain that the Company will obtain ownership by the end of the lease term.
Depreciation methods, useful lives and residual values are reviewed at each financial year-end and adjusted if appropriate.
Revenue from the sale of metals in the course of ordinary activities is measured at the fair value of the consideration received or receivable, net of volume adjustments. Revenue is recognized when persuasive evidence exists, usually in the form of an executed sales agreement, that the significant risks and rewards of ownership have been transferred to the buyer, recovery of the consideration is probable, the associated costs and possible return of goods can be estimated reliably, there is no continuing management involvement with the goods, and the amount of revenue can be measured reliably. The timing of the transfers of risks and rewards varies depending on the individual terms of the contract of sale.
Revenue from the sale of palladium and by-product metals from the LDI mine is provisionally recognized net of royalties based on quoted market prices upon the delivery of concentrate to the smelter or designated shipping point, which is when title transfers and significant rights and obligations of ownership pass. The Company’s smelter contract provides for final prices to be determined by quoted market prices in a period subsequent to the date of concentrate delivery. Variations from the provisionally priced sales are recognized as revenue adjustments until final pricing is determined. Accounts receivable are recorded net of estimated treatment and refining costs, which are subject to final assay adjustments. Subsequent adjustments to provisional pricing amounts due to changes in metal prices and foreign exchange, are reflected separately from initial revenues on the consolidated statements of operations and comprehensive loss.
Revenue from the sale of gold-silver doré bars from Sleeping Giant and Vezza is recognized when the significant risks and rewards of ownership have transferred to the buyer and selling prices are known or can be reasonably estimated.
| e. | Asset retirement obligations |
In accordance with Company policies, asset retirement obligations relating to legal and constructive obligations for future site reclamation and closure of the Company’s mine sites are recognized when incurred and a liability and corresponding asset are recorded at fair value. Estimated closure and restoration costs are provided for in the accounting period when the obligation arising from the related disturbance occurs or provided for in the period the obligation is determined.
The amount of any liability recognized is estimated based on the risk-adjusted costs required to settle present obligations, discounted using a pre-tax risk-free discount rate consistent with the time period of expected cash flows. When the liability is initially recorded, a corresponding asset retirement cost is recognized as an addition to mining interests and amortized using the unit of production method.
24
SECOND QUARTER REPORT 2012 |
North American Palladium Ltd. |
The liability for each mine site is accreted over time to reflect the unwinding of the discount. The accretion charges are recognized as a finance cost in the Consolidated Statements of Operations and Comprehensive Income (Loss). The liability is subject to re-measurement at each reporting date based on changes in discount rates and timing or amounts of the costs to be incurred. Changes in the liability, other than accretion charges, relating to mine rehabilitation and restoration obligations are added to or deducted from the carrying value of the related asset retirement cost in the reporting period recognized. If the change results in a reduction of the obligation in excess of the carrying value of the related asset retirement cost, the excess balance is recognized as a recovery through profit or loss in the period.
Adoption of New Accounting Standards
In addition to the initial adoption of IFRSs in effect at the January 1, 2010 transition date and any amendments effective on or before January 1, 2012, the following new accounting standards have been adopted by the Company.
IFRS 7 Financial Instruments: Disclosures
The amendments to IFRS 7 require disclosure of information that enables users of financial statements to understand the relationship between transferred financial assets that are not derecognized in their entirety and the associated liabilities; and to evaluate the nature of, and risks associated with, the entity’s continuing involvement in derecognized financial assets. This update is effective for years beginning on or after July 1, 2011. Where applicable, disclosures in these condensed interim consolidated financial statements have been prepared in accordance with the Company’s adoption of this standard.
New Standards and Interpretations Not Yet Adopted
IFRS 10 Consolidated Financial Statements, IFRS 11 Joint Arrangements, IFRS 12 Disclosure of Interests in Other Entities
IFRS 10, IFRS 11 and IFRS 12 have been amended to clarify the date of initial application of IFRS 10 and require certain disclosures under IFRS 12 on transition. The standards, as amended, are effective for years beginning on or after January 1, 2013.
The risks and uncertainties are discussed within the Company’s most recent Form 40-F/Annual Information Form on file with the SEC and Canadian provincial securities regulatory authorities.
Disclosure Controls and Procedures
Management is responsible for the information disclosed in this management’s discussion and analysis and has in place the appropriate information systems, procedures and controls to ensure that information used internally by management and disclosed externally is, in all material respects, complete and reliable.
For the quarter ended June 30, 2012, the President and Chief Executive Officer and Vice President, Finance and Chief Financial Officer certify that they have designed, or caused to be designed under their supervision, disclosure controls and procedures to provide reasonable assurance that material information relating to the Company and its consolidated subsidiaries would be made known to them by others within those entities.
The disclosure controls and procedures are evaluated annually through regular internal reviews which are carried out under the supervision of, and with the participation of, the Company’s management, including the President and Chief Executive Officer and Vice President, Finance and Chief Financial Officer.
25
SECOND QUARTER REPORT 2012 |
North American Palladium Ltd. |
Internal Control over Financial Reporting
For the quarter ended June 30, 2012, the President and Chief Executive Officer and Vice President, Finance and Chief Financial Officer certify that they have designed, or caused to be designed under their supervision, internal controls over financial reporting to provide reasonable assurance regarding the reliability of financial reporting and the preparation of the financial statements for external purposes in accordance with IFRS.
There have been no changes in the Company’s internal controls over the financial reporting that occurred during the most recent period ended June 30, 2012 that have materially affected or are reasonably likely to materially affect, the Company’s internal control over financial reporting.
Management is responsible for establishing and maintaining adequate internal controls over financial reporting. Internal control over financial reporting, no matter how well designed, has inherent limitations and can only provide reasonable assurance, not absolute assurance, with respect to the preparation and fair presentation of published financial statements and management does not expect such controls will prevent or detect all misstatements due to error or fraud. The Company is continually evolving and enhancing its systems of controls and procedures.
Under the supervision and with the participation of the President and Chief Executive Officer and the Vice President, Finance and Chief Financial Officer, management performs regular internal reviews and conducts an annual evaluation of the effectiveness of its internal control over financial reporting based on the framework in Internal Control – Integrated Framework issued by the Committee of Sponsoring Organizations of the Treadway Commission.
Additional information regarding the Company is included in the Company’s Annual Information Form and Annual Report on Form 40-F, which are filed with the SEC and the provincial securities regulatory authorities, respectively. A copy of the Company’s Annual Information Form is posted on the SEDAR website at www.sedar.com. A copy of the Annual Report or Form 40-F can be obtained from the SEC’s website at www.sec.gov.
This MD&A refers to cash provided by (used in) operating activities per share and cash cost per ounce1 which are not recognized measures under IFRS. Such Non-IFRS financial measures do not have any standardized meaning prescribed by IFRS and are therefore unlikely to be comparable to similar measures presented by other issuers. Management uses these measures internally. The use of these measures enables management to better assess performance trends. Management understands that a number of investors, and others who follow the Company’s performance, assess performance in this way. Management believes that these measures better reflect the Company’s performance and are better indications of its expected performance in future periods. This data is intended to provide additional information and should not be considered in isolation or as a substitute for measures of performance prepared in accordance with IFRS. The following tables reconcile these non-IFRS measures to the most directly comparable IFRS measures:
26
SECOND QUARTER REPORT 2012 |
North American Palladium Ltd. |
Cash Provided by Operations
| (a) | Cash Provided by Operations before changes in non-cash working capital |
The Company uses this measure as a valuable indicator of the Company’s ability to generate liquidity by producing operating cash flow to fund working capital needs, service debt obligations, and fund capital expenditures.
| | | Three months ended June 30 | | | Six months ended June 30 | |
| (expressed in thousands of dollars except per ounce amounts) | | 2012 | | | 2011 | | | 2012 | | | 2011 | |
| Net income (loss) and comprehensive income (loss) for the year | | $ | (3,053 | ) | | $ | 5,380 | | | $ | (3,981 | ) | | $ | (4,941 | ) |
| Gold mine reclamation expenditures | | | - | | | | - | | | | (1,448 | ) | | | - | |
| Operating items not involving cash | | | | | | | | | | | | | | | | |
| Depreciation and amortization | | | 4,931 | | | | 4,940 | | | | 8,867 | | | | 9,105 | |
| Accretion expense | | | 1,047 | | | | 84 | | | | 1,611 | | | | 169 | |
| Deferred income and mining tax expense (recovery) | | | (287 | ) | | | 84 | | | | 732 | | | | (1,179 | ) |
| Share-based compensation and employee benefits | | | 908 | | | | 1,051 | | | | 1,735 | | | | 1,790 | |
| Other | | | 127 | | | | (182 | ) | | | 378 | | | | (155 | ) |
| Cash providedby operations before changes in non-cash working capital | | $ | 3,673 | | | $ | 11,357 | | | $ | 7,894 | | | $ | 4,789 | |
| (b) | Cash Provided by Operations before changes in non-cash working capital per share |
| | | Three months ended June 30 | | | Six months ended June 30 | |
| (expressed in thousands of dollars except per share amounts) | | 2012 | | | 2011 | | | 2012 | | | 2011 | |
Cash provided by operations prior to changes in non-cash working
capital | | $ | 3,673 | | | $ | 11,357 | | | $ | 7,894 | | | $ | 4,789 | |
| Weighted average number of shares outstanding – basic | | | 170,644,946 | | | | 162,408,842 | | | | 166,784,892 | | | | 161,309,680 | |
| Cash provided by operations prior to changes in non-cash working capital per share | | $ | 0.02 | | | $ | 0.07 | | | $ | 0.05 | | | $ | 0.03 | |
Cash Cost Per Ounce
The Company uses this measure internally to evaluate the underlying operating performance of the Company for the reporting periods presented. The Company believes that providing cash cost per ounce allows the ability to better evaluate the results of the underlying business of the Company.
Cash cost per ounce include mine site operating costs such as mining, processing, administration, and royalties, but are exclusive of depreciation, amortization, reclamation, capital and exploration costs. Cash cost per ounce calculation is reduced by any by-product revenue and is then divided by ounces sold to arrive at the by-product cash cost per ounce of sales. This measure, along with revenues, is considered to be a key indicator of a company’s ability to generate operating earnings and cash flow from its mining operations.
27
SECOND QUARTER REPORT 2012 |
North American Palladium Ltd. |
| (c) | Reconciliation of Palladium Cash Cost per Ounce |
| | | Three months ended June 30 | | | Six months ended June 30 | |
| (expressed in thousands of dollars except per ounce amounts) | | 2012 | | | 2011 | | | 2012 | | | 2011 | |
| Production costs including overhead | | $ | 27,214 | | | $ | 21,131 | | | $ | 52,608 | | | $ | 41,170 | |
| Smelting, refining and freight costs | | | 3,761 | | | | 2,118 | | | | 6,736 | | | | 3,545 | |
| Royalty expense | | | 1,471 | | | | 1,899 | | | | 3,065 | | | | 3,025 | |
| Total operating expenses | | | 32,446 | | | | 25,148 | | | | 62,409 | | | | 47,740 | |
| Less by-product metal revenue | | | 14,122 | | | | 10,061 | | | | 29,302 | | | | 17,001 | |
| | | $ | 18,324 | | | $ | 15,087 | | | $ | 33,107 | | | $ | 30,739 | |
| Divided by ounces of palladium sold | | | 42,285 | | | | 46,362 | | | | 81,233 | | | | 76,817 | |
| Cash cost per ounce (CDN$) | | $ | 433 | | | $ | 325 | | | $ | 408 | | | $ | 400 | |
| Exchange rate (CDN$1 – US$) | | | 0.99 | | | | 1.03 | | | | 0.99 | | | | 1.02 | |
| Cash cost per ounce (US$), net of by-product credits | | $ | 429 | | | $ | 335 | | | $ | 404 | | | $ | 408 | |
| (d) | Reconciliation of Gold Cash Cost per Ounce |
| | | Three months ended June 30 | | | Six months ended June 30 | |
| (expressed in thousands of dollars except per ounce amounts) | | 2012 | | | 2011 | | | 2012 | | | 2011 | |
| Production costs including overhead | | | - | | | $ | 7,652 | | | $ | 2,157 | | | $ | 18,040 | |
| Refining and freight costs | | | - | | | | 18 | | | | 4 | | | | 30 | |
| Total operating expenses | | | - | | | | 7,670 | | | | 2,161 | | | | 18,070 | |
| Less by-product metal revenue | | | - | | | | - | | | | 86 | | | | 346 | |
| | | | - | | | $ | 7,670 | | | $ | 2,075 | | | $ | 17,724 | |
| Divided by ounces of gold sold | | | - | | | | 4,810 | | | | 1,663 | | | | 9,910 | |
| Cash cost per ounce (CDN$) | | | - | | | $ | 1,595 | | | $ | 1,248 | | | $ | 1,788 | |
| Exchange rate (CDN$1 – US$) | | | - | | | | 1.03 | | | | 0.99 | | | | 1.02 | |
| Cash cost per ounce (US$) | | | - | | | $ | 1,643 | | | $ | 1,236 | | | $ | 1,824 | |
Adjusted net income (loss)
The Company uses this measure internally to evaluate the underlying operating performance of the Company for the reporting periods presented. Providing adjusted net income (loss) allows the reader the ability to better evaluate the results of the underlying business of the Company.
28
SECOND QUARTER REPORT 2012 |
North American Palladium Ltd. |
Adjusted net income (loss) is a Non-IFRS financial measure, which excludes the following from net income (loss):
| · | Mine startup costs and closure costs; |
| · | Asset impairment charges and insurance recoveries; and |
| · | One-time costs (mine restoration costs due to flood) |
| | | Three months ended June 30 | | | Six months ended June 30 | |
| (expressed in thousands of dollars except per ounce amounts) | | 2012 | | | 2011 | | | 2012 | | | 2011 | |
| Net income (loss) and comprehensive income (loss) for the year | | $ | (3,053 | ) | | $ | 5,380 | | | $ | (3,981 | ) | | $ | (4,941 | ) |
| Exploration | | | 3,969 | | | | 6,134 | | | | 7,972 | | | | 9,973 | |
| Gold mine closure, care and maintenance costs | | | 274 | | | | - | | | | 1,351 | | | | - | |
| Other (mine restoration costs due to flood) | | | 734 | | | | - | | | | 734 | | | | - | |
| Adjusted net income (loss) | | $ | 1,924 | | | $ | 11,514 | | | $ | 6,076 | | | $ | 5,032 | |
Adjusted EBITDA
The Company believes that EBITDA and Adjusted EBITDA is a valuable indicator of the Company’s ability to generate liquidity by producing operating cash flow to fund working capital needs, service debt obligations, and fund capital expenditures.
EBITDA excludes the impact of the cost of financing activities and taxes, and the effects of changes in operating working capital balances, and therefore is not necessarily indicative of operating profit or cash flow from operations as determined under IFRS. Other companies may calculate EBITDA differently. Adjusted EBITDA is a Non-IFRS financial measure, which excludes the following from net income (loss):
| · | Income and mining tax expense (recovery); |
| · | Interest and other financing costs (income); |
| · | Depreciation and amortization; |
| · | Mine startup and closure costs; |
| · | Asset impairment charges and insurance recoveries; and |
| · | One-time costs (mine restoration costs due to flood) |
| | | Three months ended June 30 | | | Six months ended June 30 | |
| (expressed in thousands of dollars except per ounce amounts) | | 2012 | | | 2011 | | | 2012 | | | 2011 | |
| Net income (loss) and comprehensive income (loss) for the year | | $ | (3,053 | ) | | $ | 5,380 | | | $ | (3,981 | ) | | $ | (4,941 | ) |
| Income and mining tax expense (recovery) | | | (100 | ) | | | 221 | | | | (179 | ) | | | 3,033 | |
| Interest and other financing income | | | (1,347 | ) | | | (1,037 | ) | | | (366 | ) | | | (1,449 | ) |
| Depreciation and amortization | | | 4,931 | | | | 4,940 | | | | 8,867 | | | | 9,105 | |
| EBITDA | | $ | 431 | | | | 9,504 | | | $ | 4,341 | | | | 5,748 | |
| Exploration | | | 3,969 | | | | 6,134 | | | | 7,972 | | | | 9,973 | |
| Gold mine closure, care and maintenance costs | | | 274 | | | | - | | | | 1,351 | | | | - | |
| Other (mine restoration costs due to flood) | | | 734 | | | | - | | | | 734 | | | | - | |
| Adjusted EBITDA | | $ | 5,408 | | | $ | 15,638 | | | $ | 14,398 | | | $ | 15,721 | |
29
SECOND QUARTER REPORT 2012 |