Exhibit 4
CORPORATE PROFILE
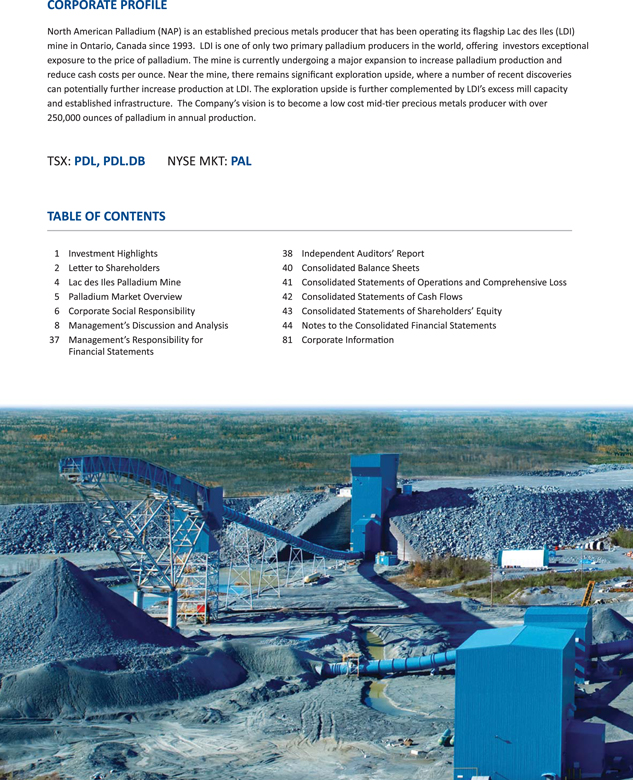
North American Palladium (NAP) is an established precious metals producer that has been operating its flagship Lac des lles (LDI) mine in Ontario, Canada since 1993. LDI is one of only two primary palladium producers in the world, offering investors exceptional exposure to the price of palladium. The mine is currently undergoing a major expansion to increase palladium production and reduce cash costs per ounce. Near the mine, there remains significant exploration upside, where a number of recent discoveries can potentially further increase production at LDI. The exploration upside is further complemented by LDI’s excess mill capacity and established infrastructure. The Company’s vision is to become a low cost mid-tier precious metals producer with over 250,000 ounces of palladium in annual production.
TSX: PDL, PDL.DB
NYSE MKT: PAL
TABLE OF CONTENTS
1 Investment Highlights
2 Letter to Shareholders
4 Lac des lles Palladium Mine
5 Palladium Market Overview
6 Corporate Social Responsibility
8 Management’s Discussion and Analysis
37 Management’s Responsibility for Financial Statements
38 Independent Auditors’ Report
40 Consolidated Balance Sheets
41 Consolidated Statements of Operations and Comprehensive Loss
42 Consolidated Statements of Cash Flows
43 Consolidated Statements of Shareholders’ Equity
44 Notes to the Consolidated Financial Statements
81 Corporate Information
INVESTMENT HIGHLIGHTS
Clear Growth Strategy to Increase Production & Lower Cash Costs
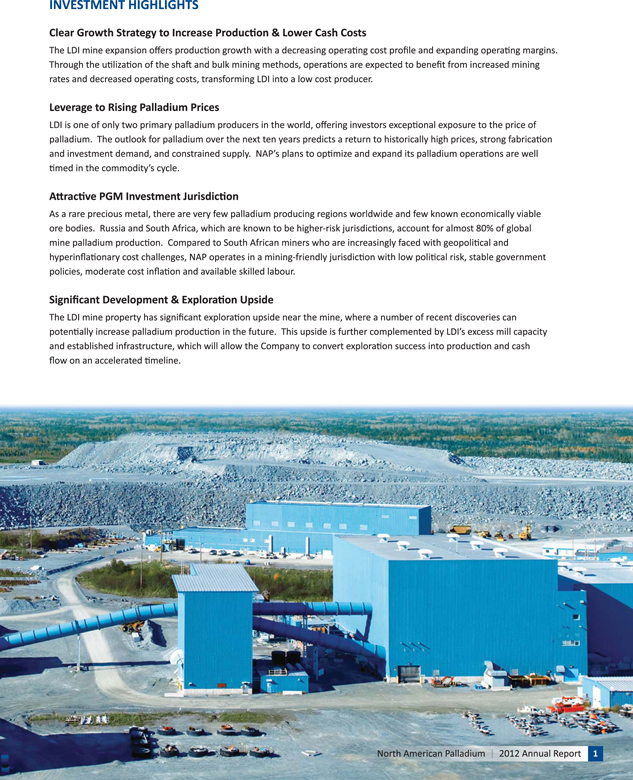
The LDI mine expansion offers production growth with a decreasing operating cost profile and expanding operating margins. Through the utilization of the shaft and bulk mining methods, operations are expected to benefit from increased mining rates and decreased operating costs, transforming LDI into a low cost producer.
Leverage to Rising Palladium Prices
LDI is one of only two primary palladium producers in the world, offering investors exceptional exposure to the price of palladium. The outlook for palladium over the next ten years predicts a return to historically high prices, strong fabrication and investment demand, and constrained supply. NAP’s plans to optimize and expand its palladium operations are well timed in the commodity’s cycle.
Attractive PGM Investment Jurisdiction
As a rare precious metal, there are very few palladium producing regions worldwide and few known economically viable ore bodies. Russia and South Africa, which are known to be higher-risk jurisdictions, account for almost 80% of global mine palladium production. Compared to South African miners who are increasingly faced with geopolitical and hyperinflationary cost challenges, NAP operates in a mining-friendly jurisdiction with low political risk, stable government policies, moderate cost inflation and available skilled labour.
Significant Development & Exploration Upside
The LDI mine property has significant exploration upside near the mine, where a number of recent discoveries can potentially increase palladium production in the future. This upside is further complemented by LDI’s excess mill capacity and established infrastructure, which will allow the Company to convert exploration success into production and cash flow on an accelerated timeline.
North American Palladium 2012 Annual Report 1
LETTER TO SHAREHOLDERS
April, 2013
Dear Shareholders
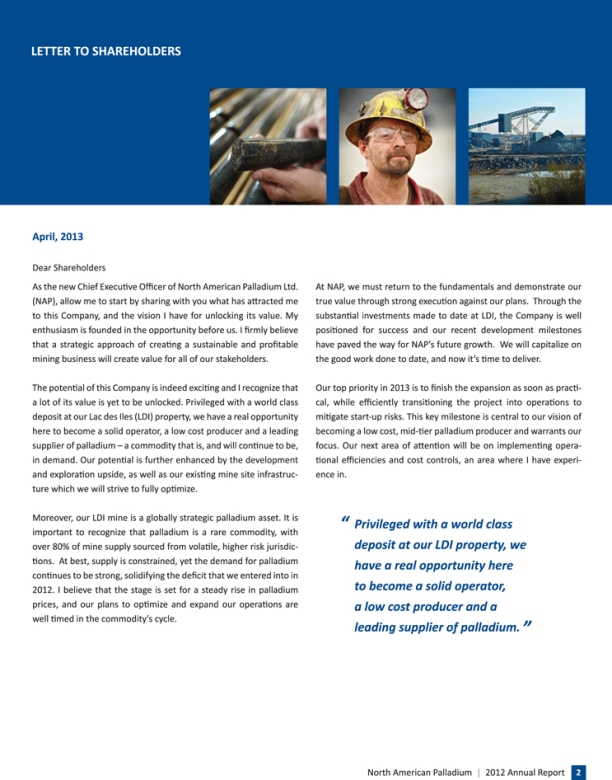
As the new Chief Executive Officer of North American Palladium Ltd. (NAP), allow me to start by sharing with you what has attracted me to this Company, and the vision I have for unlocking its value. My enthusiasm is founded in the opportunity before us. I firmly believe that a strategic approach of creating a sustainable and profitable mining business will create value for all of our stakeholders.
The potential of this Company is indeed exciting and I recognize that a lot of its value is yet to be unlocked. Privileged with a world class deposit at our Lac des lles (LDI) property, we have a real opportunity here to become a solid operator, a low cost producer and a leading supplier of palladium—a commodity that is, and will continue to be, in demand. Our potential is further enhanced by the development and exploration upside, as well as our existing mine site infrastructure which we will strive to fully optimize.
Moreover, our LDI mine is a globally strategic palladium asset. It is important to recognize that palladium is a rare commodity, with over 80% of mine supply sourced from volatile, higher risk jurisdictions. At best, supply is constrained, yet the demand for palladium continues to be strong, solidifying the deficit that we entered into in 2012. I believe that the stage is set for a steady rise in palladium prices, and our plans to optimize and expand our operations are well timed in the commodity’s cycle.
At NAP, we must return to the fundamentals and demonstrate our true value through strong execution against our plans. Through the substantial investments made to date at LDI, the Company is well positioned for success and our recent development milestones have paved the way for NAP’s future growth. We will capitalize on the good work done to date, and now it’s time to deliver.
Our top priority in 2013 is to finish the expansion as soon as practical, while efficiently transitioning the project into operations to mitigate start-up risks. This key milestone is central to our vision of becoming a low cost, mid-tier palladium producer and warrants our focus. Our next area of attention will be on implementing operational efficiencies and cost controls, an area where I have experience in.
“ Privileged with a world class deposit at our LDI property, we have a real opportunity here to become a solid operator, a low cost producer and a leading supplier of palladium. “
North American Palladium 2012 Annual Report 2
Looking ahead to 2013, I will be candid in telling you that the year will not be without its challenges. We certainly have a lot of work ahead of us, but we are also a lot closer to the finish line. As I look ahead into the Company’s future, I have a great deal of optimism about our ability to reach our full potential and will be focused on our long-term strategy to establish our palladium operations for sustainable and profitable growth. We have a first-class asset, an achievable plan for unlocking value and more importantly, we have a highly motivated and talented workforce. I am excited to have joined a Company with such outstanding prospects, and I am fully committed to deliver on my mandate.
“ Through the substantial investments made to date at LDI, the Company is well positioned for success and our recent development milestones have paved the way for NAP’s future growth. “
In closing, I would like to express my appreciation to all of our partners and stakeholders who have played key roles in advancing NAP’s strategy, including our employees and contractors, as well as the people and communities surrounding our operations in Thunder Bay. Your hard work and partnerships have been instrumental to the Company’s progress and I look forward to working with you. I am also looking forward to the guidance from our Board of Directors, whose expertise in this industry will be valued.
And finally, I am grateful to our shareholders for their continued support and patience. Be assured, our team is fully committed to deliver value for all of our stakeholders.
Sincerely,
Phil du Toit,
PRESIDENT AND CEO
North American Palladium 2012 Annual Report 3
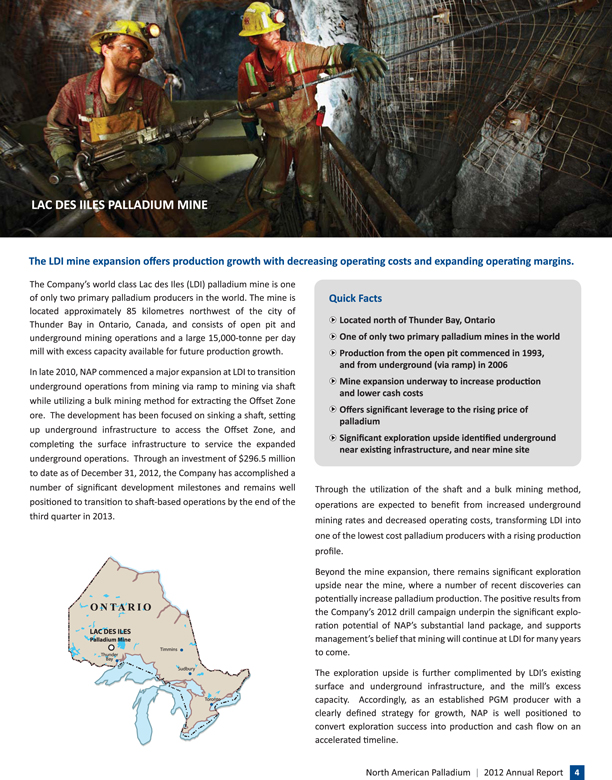
LAC DES IILES PALLADIUM MINE
The LDI mine expansion offers production growth with decreasing operating costs and expanding operating margins.
The Company’s world class Lac des lles (LDI) palladium mine is one of only two primary palladium producers in the world. The mine is located approximately 85 kilometres northwest of the city of Thunder Bay in Ontario, Canada, and consists of open pit and underground mining operations and a large 15,000-tonne per day mill with excess capacity available for future production growth.
In late 2010, NAP commenced a major expansion at LDI to transition underground operations from mining via ramp to mining via shaft while utilizing a bulk mining method for extracting the Offset Zone ore. The development has been focused on sinking a shaft, setting up underground infrastructure to access the Offset Zone, and completing the surface infrastructure to service the expanded underground operations. Through an investment of $296.5 million to date as of December 31, 2012, the Company has accomplished a number of significant development milestones and remains well positioned to transition to shaft-based operations by the end of the third quarter in 2013.
Quick Facts
• |
| Located north of Thunder Bay, Ontario |
• |
| One of only two primary palladium mines in the world |
• |
| Production from the open pit commenced in 1993, and from underground (via ramp) in 2006 |
• |
| Mine expansion underway to increase production and lower cash costs |
• |
| Offers significant leverage to the rising price of palladium |
• |
| Significant exploration upside identified underground near existing infrastructure, and near mine site |
Through the utilization of the shaft and a bulk mining method, operations are expected to benefit from increased underground mining rates and decreased operating costs, transforming LDI into one of the lowest cost palladium producers with a rising production profile.
Beyond the mine expansion, there remains significant exploration upside near the mine, where a number of recent discoveries can potentially increase palladium production. The positive results from the Company’s 2012 drill campaign underpin the significant exploration potential of NAP’s substantial land package, and supports management’s belief that mining will continue at LDI for many years to come.
The exploration upside is further complimented by LDI’s existing surface and underground infrastructure, and the mill’s excess capacity. Accordingly, as an established PGM producer with a clearly defined strategy for growth, NAP is well positioned to convert exploration success into production and cash flow on an accelerated timeline.
North American Palladium 2012 Annual Report 4
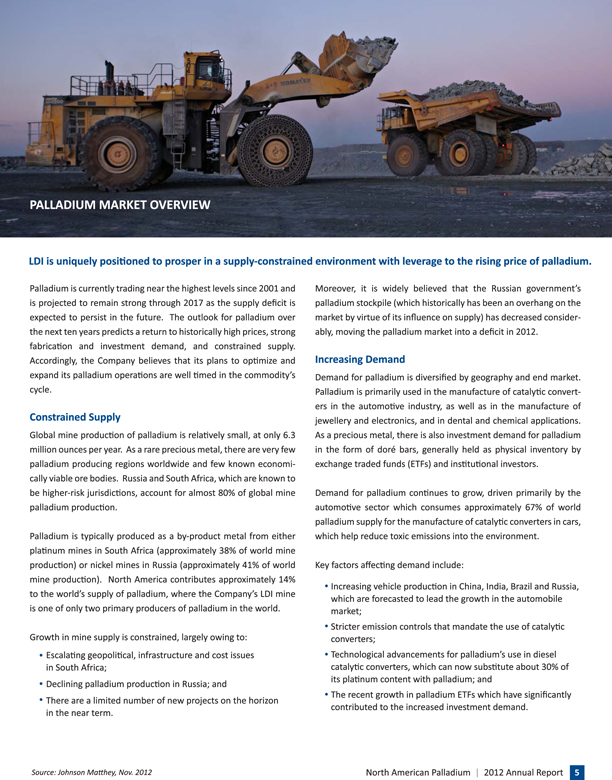
PALLADIUM MARKET OVERVIEW
LDI is uniquely positioned to prosper in a supply-constrained environment with leverage to the rising price of palladium.
Palladium is currently trading near the highest levels since 2001 and is projected to remain strong through 2017 as the supply deficit is expected to persist in the future. The outlook for palladium over the next ten years predicts a return to historically high prices, strong fabrication and investment demand, and constrained supply. Accordingly, the Company believes that its plans to optimize and expand its palladium operations are well timed in the commodity’s cycle.
Constrained Supply
Global mine production of palladium is relatively small, at only 6.3 million ounces per year. As a rare precious metal, there are very few palladium producing regions worldwide and few known economically viable ore bodies. Russia and South Africa, which are known to be higher-risk jurisdictions, account for almost 80% of global mine palladium production.
Palladium is typically produced as a by-product metal from either platinum mines in South Africa (approximately 38% of world mine production) or nickel mines in Russia (approximately 41% of world mine production). North America contributes approximately 14% to the world’s supply of palladium, where the Company’s LDI mine is one of only two primary producers of palladium in the world.
Growth in mine supply is constrained, largely owing to:
• |
| Escalating geopolitical, infrastructure and cost issues in South Africa; |
• |
| Declining palladium production in Russia; and |
• |
| There are a limited number of new projects on the horizon in the near term. |
Moreover, it is widely believed that the Russian government’s palladium stockpile (which historically has been an overhang on the market by virtue of its influence on supply) has decreased considerably, moving the palladium market into a deficit in 2012.
Increasing Demand
Demand for palladium is diversified by geography and end market. Palladium is primarily used in the manufacture of catalytic converters in the automotive industry, as well as in the manufacture of jewellery and electronics, and in dental and chemical applications. As a precious metal, there is also investment demand for palladium in the form of dore bars, generally held as physical inventory by exchange traded funds (ETFs) and institutional investors.
Demand for palladium continues to grow, driven primarily by the automotive sector which consumes approximately 67% of world palladium supply for the manufacture of catalytic converters in cars, which help reduce toxic emissions into the environment.
Key factors affecting demand include:
• |
| Increasing vehicle production in China, India, Brazil and Russia, which are forecasted to lead the growth in the automobile market; |
• |
| Stricter emission controls that mandate the use of catalytic converters; |
• |
| Technological advancements for palladium’s use in diesel catalytic converters, which can now substitute about 30% of its platinum content with palladium; and |
• |
| The recent growth in palladium ETFs which have significantly contributed to the increased investment demand. |
Source: Johnson Matthey, Nov. 2012
North American Palladium 2012 Annual Report 5
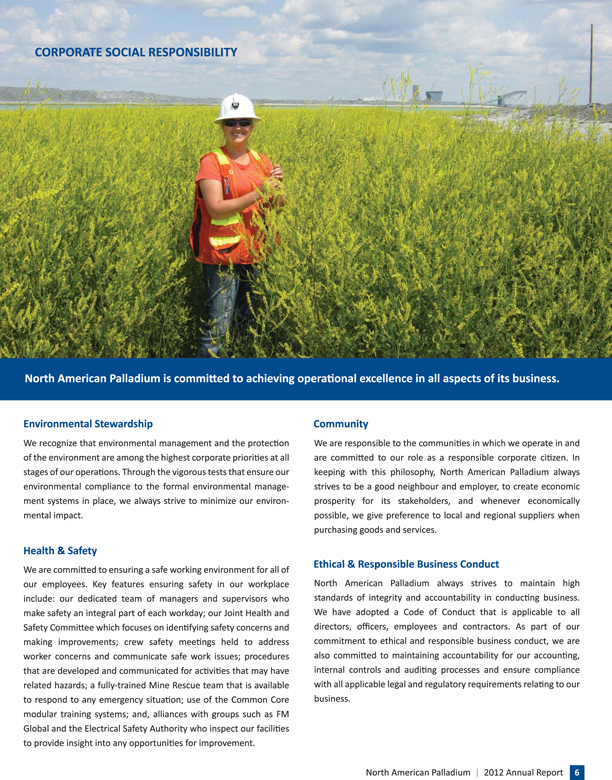
CORPORATE SOCIAL RESPONSIBILITY
Environmental Stewardship
We recognize that environmental management and the protection of the environment are among the highest corporate priorities at all stages of our operations. Through the vigorous tests that ensure our environmental compliance to the formal environmental management systems in place, we always strive to minimize our environmental impact.
Health & Safety
We are committed to ensuring a safe working environment for all of our employees. Key features ensuring safety in our workplace include: our dedicated team of managers and supervisors who make safety an integral part of each workday; our Joint Health and Safety Committee which focuses on identifying safety concerns and making improvements; crew safety meetings held to address worker concerns and communicate safe work issues; procedures that are developed and communicated for activities that may have related hazards; a fully-trained Mine Rescue team that is available to respond to any emergency situation; use of the Common Core modular training systems; and, alliances with groups such as FM Global and the Electrical Safety Authority who inspect our facilities to provide insight into any opportunities for improvement.
Community
We are responsible to the communities in which we operate in and are committed to our role as a responsible corporate citizen. In keeping with this philosophy, North American Palladium always strives to be a good neighbour and employer, to create economic prosperity for its stakeholders, and whenever economically possible, we give preference to local and regional suppliers when purchasing goods and services.
Ethical & Responsible Business Conduct
North American Palladium always strives to maintain high standards of integrity and accountability in conducting business. We have adopted a Code of Conduct that is applicable to all directors, officers, employees and contractors. As part of our commitment to ethical and responsible business conduct, we are also committed to maintaining accountability for our accounting, internal controls and auditing processes and ensure compliance with all applicable legal and regulatory requirements relating to our business.
North American Palladium 2012 Annual Report 6

North American Palladium Ltd.
TABLE OF CONTENTS
| Page | ||||
| Management’s Discussion and Analysis | ||||
| INTRODUCTION | 8 | |||
| FORWARD-LOOKING INFORMATION | 8 | |||
| CAUTIONARY NOTE TO U.S. INVESTORS CONCERNING MINERAL RESERVES AND RESOURCES | 9 | |||
| OUR BUSINESS | 9 | |||
| KEY HIGHLIGHTS | 10 | |||
| FINANCIAL CONDITION | 11 | |||
| EXECUTIVE SUMMARY | 11 | |||
| PALLADIUM OPERATIONS – FINANCIAL, OPERATING & DEVELOPMENT RESULTS | 15 | |||
| GOLD OPERATIONS – FINANCIAL, OPERATING & DEVELOPMENT RESULTS | 18 | |||
| CONSOLIDATED FINANCIAL RESULTS | 21 | |||
| FINANCIAL CONDITION, CASH FLOWS, LIQUIDITY AND CAPITAL RESOURCES | 23 | |||
| OUTSTANDING SHARE DATA | 25 | |||
| OVERVIEW OF NAP’S EXPLORATION PROPERTIES | 25 | |||
| CRITICAL ACCOUNTING POLICIES AND ESTIMATES | 28 | |||
| RISKS AND UNCERTAINTIES | 33 | |||
| INTERNAL CONTROLS | 33 | |||
| OTHER INFORMATION | 34 | |||
| NON-IFRS MEASURES | 34 | |||
7
2012 Annual Report
North American Palladium Ltd.
Management’s Discussion and Analysis
INTRODUCTION
Unless the context suggests otherwise, references to “NAP” or the “Company” or similar terms refer to North American Palladium Ltd. and its subsidiaries. “LDI” refers to Lac des Iles Mines Ltd. and “NAP Quebec” refers to NAP Quebec Mines Ltd.
The following is management’s discussion and analysis of the financial condition and results of operations (“MD&A”) to enable readers of the Company’s consolidated financial statements and related notes to assess material changes in financial condition and results of operations for the year ended December 31, 2012, compared to those of the respective periods in the prior year. This MD&A has been prepared as of February 21, 2013 and is intended to supplement and complement the consolidated financial statements and notes thereto for the year ended December 31, 2012 (collectively, the “Financial Statements”), which have been prepared in accordance with International Financial Reporting Standards (“IFRS”) as issued by the IASB. Readers are encouraged to review the Financial Statements in conjunction with their review of this MD&A and the most recent Form 40-F/Annual Information Form on file with the U.S. Securities and Exchange Commission (“SEC”) and Canadian provincial securities regulatory authorities, available at www.sec.gov and www.sedar.com, respectively.
All amounts are in Canadian dollars unless otherwise noted and all references to production ounces refer to payable production.
FORWARD-LOOKING INFORMATION
Certain information contained in this MD&A constitutes ‘forward-looking statements’ within the meaning of the ‘safe harbor’ provisions of the United States Private Securities Litigation Reform Act of 1995 and Canadian securities laws. All statements other than statements of historical fact are forward-looking statements. The words ‘expect’, ‘believe’, ‘anticipate’, ‘contemplate’, ‘target’, ‘plan’, ‘may’, ‘will’, ‘intend’, ‘estimate’ and similar expressions identify forward-looking statements. Forward-looking statements included in this MD&A include, without limitation: information as to our strategy, plans or future financial or operating performance, such as the Company’s expansion plans, project timelines, production plans, projected cash flows or expenditures, operating cost estimates, mining including the LDI Mine expansion and other statements that express management’s expectations or estimates of future performance. The Company cautions the reader that such forward-looking statements involve known and unknown risk factors that may cause the actual results to be materially different from those expressed or implied by the forward-looking statements. Such risk factors include, but are not limited to: the possibility that metal prices and foreign exchange rates may fluctuate, inherent risks associated with development, exploration, mining and processing including risks to the LDI Mine expansion timeline, environmental hazards, uncertainty of mineral reserves and resources, the risk that the Company may not be able to obtain financing, the possibility that the Lac des Iles mine and may not perform as planned, changes in legislation, regulations or political and economic developments in Canada and abroad, employee relations, risks related to the availability of skilled labour, litigation and the risks associated with obtaining necessary licenses and permits. For more details on these and other risk factors see the Company’s most recent Form 40-F/Annual Information Form on file with the SEC and Canadian provincial securities regulatory authorities. Forward-looking statements are necessarily based upon a number of factors and assumptions that, while considered reasonable by management, are inherently subject to significant business, economic and competitive uncertainties and contingencies. The factors and assumptions contained in this MD&A, which may prove to be incorrect, include, but are not limited to: that metal prices and exchange rates between the Canadian and United States dollar will be consistent with the Company’s expectations, that there will be no material delays affecting operations or the timing of ongoing development projects that there will be no material delays related to commissioning equipment, that prices for key mining and construction supplies, including labour costs, will remain consistent with the Company’s expectations, and that the Company’s current estimates of mineral reserves and resources are accurate. The forward-looking statements are not guarantees of future
8
2012 Annual Report
North American Palladium Ltd.
performance. The Company disclaims any obligation to update or revise any forward-looking statements, whether as a result of new information, events or otherwise, except as expressly required by law. Readers are cautioned not to put undue reliance on these forward-looking statements.
CAUTIONARY NOTE TO U.S. INVESTORS CONCERNING MINERAL RESERVES AND RESOURCES
Mineral reserve and mineral resource information contained herein has been calculated in accordance with National Instrument 43-101 –Standards of Disclosure for Mineral Projects, as required by Canadian provincial securities regulatory authorities. Canadian standards differ significantly from the requirements of the SEC, and mineral reserve and mineral resource information contained herein is not comparable to similar information disclosed in accordance with the requirements of the SEC. While the terms “measured”, “indicated” and “inferred” mineral resources are required pursuant to National Instrument 43-101, the SEC does not recognize such terms. U.S. investors should understand that “inferred” mineral resources have a great amount of uncertainty as to their existence and great uncertainty as to their economic and legal feasibility. In addition, U.S. investors are cautioned not to assume that any part or all of NAP’s mineral resources constitute or will be converted into reserves. For a more detailed description of the key assumptions, parameters and methods used in calculating NAP’s mineral reserves and mineral resources, see NAP’s most recent Annual Information Form/Form 40-F on file with Canadian provincial securities regulatory authorities and the SEC.
OUR BUSINESS
NAP is an established precious metals producer that has been operating its flagship LDI Mine located in Ontario, Canada since 1993. LDI is one of only two primary producers of palladium in the world, and is currently undergoing a major expansion to increase production and reduce cash cost per ounce1. The Company is also developing the Vezza gold mine located in the Abitibi region of Quebec, which is held for sale.
The Company is expanding the underground LDI Mine to transition from mining via ramp access to mining via shaft while utilizing bulk mining methods. Through the utilization of the shaft and the bulk mining methods, operations are expected to benefit from increased mining rates and decreased operating costs, transforming LDI into a low cost producer with a rising production profile.
The Company has significant exploration potential near the LDI Mine, where a number of growth targets have been identified, and is engaged in a substantial exploration program aimed at increasing its palladium reserves and resources. As NAP pursues its organic growth strategy through the LDI Mine expansion, exploration will continue to be a key focus for the Company for many years to come. As an established palladium-platinum group metal (“PGM”) producer with excess mill capacity on a permitted property, NAP has potential to convert exploration success into production and cash flow on an accelerated timeline.
NAP trades on the TSX under the symbol PDL and on the NYSE MKT under the symbol PAL.
1Non-IFRS measure. Please refer to Non-IFRS Measures on pages 34-36.
9
2012 Annual Report
North American Palladium Ltd.
KEY HIGHLIGHTS
| (expressed in thousands of dollars except cash cost per ounce, metal units, metal prices and per share amounts) | 2012 | 2011 | 2010 | |||||||||
FINANCIAL HIGHLIGHTS | ||||||||||||
Revenue | $ 160,704 | $ 143,659 | $ 84,813 | |||||||||
Unit sales | ||||||||||||
Palladium (oz) | 161,845 | 146,457 | 95,057 | |||||||||
Gold (oz) | 10,950 | 7,256 | 4,023 | |||||||||
Platinum (oz) | 11,056 | 9,133 | 4,894 | |||||||||
Nickel (lb) | 1,349,664 | 814,551 | 395,622 | |||||||||
Copper (lb) | 2,564,740 | 1,593,479 | 658,013 | |||||||||
Earnings | ||||||||||||
(Loss) income from continuing operations | $ (11,403 | ) | $ 4,392 | $ 2,914 | ||||||||
(Loss) Income from continuing operations per share | $ (0.07 | ) | $ 0.03 | $ 0.02 | ||||||||
Net loss | $ (66,037 | ) | $ (65,154 | ) | $ (29,409 | ) | ||||||
Net loss per share | $ (0.39 | ) | $ (0.40 | ) | $ (0.21 | ) | ||||||
Adjusted net income1 | $ 7,709 | $ 14,331 | $ 6,720 | |||||||||
EBITDA1 | $ (45,248 | ) | $ (53,497 | ) | $ (17,073 | ) | ||||||
Adjusted EBITDA1 | $ 28,498 | $ 25,988 | $ 19,056 | |||||||||
Cash flow provided by (used in) operations | $ 55,249 | $ 31,622 | $ (73,750 | ) | ||||||||
| Cash flow provided by (used in) continuing operations before changes in non-cash working capital1 | $ 15,594 | $ 15,598 | $ 10,007 | |||||||||
| Cash flow provided by (used in) continuing operations before changes in non-cash working capital per share1 | $ 0.09 | $0.10 | $ 0.07 | |||||||||
Capital spending, continuing operations | $ 145,180 | $ 148,309 | $ 35,732 | |||||||||
OPERATING HIGHLIGHTS | ||||||||||||
Production | ||||||||||||
Palladium (oz) | 163,980 | 146,624 | 95,057 | |||||||||
Gold (oz) | 11,106 | 7,267 | 4,023 | |||||||||
Platinum (oz) | 11,187 | 9,143 | 4,894 | |||||||||
Nickel (lb) | 1,348,179 | 816,037 | 395,622 | |||||||||
Copper (lb) | 2,592,748 | 1,596,185 | 658,013 | |||||||||
Realized metal prices per ounce | ||||||||||||
Palladium (US$) | $ 640 | $ 733 | $ 665 | |||||||||
Gold (US$) | $ 1,677 | $ 1,534 | $ 1,208 | |||||||||
Cash cost per ounce1 | ||||||||||||
Palladium (US$) | $ 401 | $ 448 | $ 283 | |||||||||
1Non-IFRS measure. Please refer to Non-IFRS Measures on pages 34-36.
10
2012 Annual Report
North American Palladium Ltd.
FINANCIAL CONDITION
| (expressed in thousands of dollars) | As at December 31 2012 | As at December 31 2011 | As at December 31 2010 | |||||||||
Net working capital | $ 32,563 | $ 108,432 | $ 169,559 | |||||||||
Cash balance | $ 20,168 | $ 50,935 | $ 75,159 | |||||||||
Shareholders’ equity | $ 246,900 | $ 268,996 | $ 290,450 | |||||||||
Total debt | $ 130,395 | $ 70,230 | $ 2, 391 | |||||||||
EXECUTIVE SUMMARY
Financial Highlights
Revenue for the year ended December 31, 2012 was $160.7 million, compared to $143.7 million in the prior year. In 2012, revenue increased from the palladium operations by $17.0 million. Net loss for the year was $66.0 million, including a $54.6 million loss from the discontinued gold operations, which included a non-cash gold asset impairment charge of $56.0 million, or $0.39 per share and Adjusted EBITDA1 was $28.5 million, compared to a net loss, including a non-cash gold asset impairment charge of $49.2 million, of $65.2 million or $0.40 per share and Adjusted EBITDA1 of $26.0 million in the prior year. For 2012, adjusted net income1 was $7.7 million, compared to adjusted net income1 of $14.3 million in the prior year. The Company’s operating activities provided cash of $15.6 million, before changes in non-cash working capital1.
Balance Sheet
As at December 31, 2012, the Company had approximately $32.6 million in working capital, including $20.2 million of cash on hand. As at December 31, 2012, the Company had US$27.5 million available on its US$60.0 million credit facility.
Investment in Growth
For the year ended December 31, 2012, the Company invested $14.5 million in exploration activities and $145.2 million in development expenditures at its palladium operations.
LDI Mine Palladium Production
The LDI Mine produced 163,980 ounces of payable palladium for the year ended December 31, 2012, exceeding management’s annual production guidance of 150,000 to 160,000 ounces. During the year, 2,063,260 tonnes of ore were processed by the LDI mill at an average palladium head grade of 3.44 grams per tonne, with a palladium recovery of 78%. For 2012, LDI’s palladium cash cost per ounce1 (net of byproduct credits) was US$401.
Production at the LDI Mine in 2012 included the blending of higher grade underground ore (853,600 milled tonnes with an average palladium grade of 5.19 grams per tonne) with lower grade surface ore (1,209,660 milled tonnes with an average palladium grade of 2.21 grams per tonne).
LDI Mine Expansion Update
In 2012, mine expansion expenditures totaled $127.5 million, excluding capitalized interest of $8.0 million. Development work in 2012 was focused on completing the surface construction activities, advancing underground development (including mine level development and setting up mining stopes) and sinking the shaft.
1Non-IFRS measure. Please refer to Non-IFRS Measures on pages 34-36.
11
2012 Annual Report
North American Palladium Ltd.
By year end, the Company made significant progress advancing the critical aspects of its mine expansion. On surface, the major construction components are now completed. The headframe, the main substation, the hoist house building, the service hoist (which is used for shaft sinking) and the auxiliary hoist are all fully operational and 100% completed. The installation of the production hoist has commenced and commissioning is scheduled for the first quarter of 2013. The remaining work on surface includes the installation of the main skip dump and the surface ore bins.
Underground, shaft sinking is progressing well, in line with the Company’s scheduled rates of advancement. The shaft sinking is currently at a depth of 550 metres below surface, representing almost 67% of the total 825 metres planned for the first phase of the shaft sinking. Installation of the 740-metre level loading pocket is scheduled for the first quarter of 2013, and the ramp and stope development is also progressing on schedule. The Company maintains its development timeline to begin hoisting mineralized material via shaft by the end of the third quarter of 2013.
Gold Division Update
The Company continues to evaluate opportunities for the divesture of its gold assets and undertakings located in Quebec, which are held by NAP Quebec Mines Ltd., including the Sleeping Giant gold mine and mill complex, the Vezza gold mine and the other exploration projects including the Flordin property and the Discovery project, and all associated rights, privileges, agreements, permits and associated infrastructure and equipment. As part of the Company’s ongoing consideration of opportunities for divestiture, which provided an indication of the value of these assets in late 2012, the Company believes that the current value of such assets is likely less than their book value. In anticipation of a potential sale, the Company recorded a non-cash impairment charge on its gold assets of $56.0 million, as reflected in the year end 2012 financial results.
In 2012, the Company continued to advance its Vezza gold project and commenced mining the initial test stope panels in late Q1 and Q2. Early results were not favorable with regards to dilution so the mining method was changed from Alimak stoping to long hole benching. As at year end, the stoping conversion is virtually complete with dilution results significantly improved. Due to these changes, as well as the desire to divest of the gold division, mining rates were slowed to achieve a balance between production rates and development requirements as the assets were prepared for sale. In 2012, capitalized expenditures at the Company’s Vezza gold project totaled $26.3 million.
Exploration
In 2012, the Company expensed $14.5 million in exploration costs and capitalized an additional $1.6 million associated with the LDI Mine expansion. In 2012, 229 holes were drilled totaling 50,148 metres. Exploration work in 2012 was predominately focused on underground exploration targeting the Offset Zone (infill drilling and testing Offset Zone extensions towards surface, at depth, and south) and surface exploration targeting the Sheriff Zone and the North VT Rim.
Palladium Market Outlook
Palladium spot prices averaged US$640 per ounce in 2012, ranging from a low of US$556 per ounce, to a high of US$719 per ounce. The price volatility seen in 2012 was largely driven by the uncertainty of the European debt crisis earlier in the year, however market sentiment recovered later in the year as the long term supply and demand fundamentals of palladium remained strong. The general consensus of the leading forecasters is that palladium prices will rise. Their outlook for palladium over the next ten years predicts a return to historically high prices, strong fabrication and investment demand, and constrained supply.
12
2012 Annual Report
North American Palladium Ltd.
Selected Annual Information
| (expressed in thousands of dollars, except per share amounts) | 2012 | 2011 | 2010 | |||||||||
Revenue | $ 160,704 | $ 143,659 | $ 84,813 | |||||||||
Income from mining operations | 15,691 | 28,404 | 24,365 | |||||||||
Loss from discontinued operations | (54,634 | ) | (69,546 | ) | (32,323 | ) | ||||||
Net loss | (66,037 | ) | (65,154 | ) | (29,409 | ) | ||||||
Net loss per share – basic and diluted | (0.39 | ) | (0.40 | ) | (0.21 | ) | ||||||
(Loss) income from continuing operations per share – basic and diluted | (0.07 | ) | 0.03 | 0.02 | ||||||||
Cash flow provided by (used in) operations prior to changes in non-cash working capital1 | 15,594 | 15,598 | 10,007 | |||||||||
Total assets | 471,232 | 416,045 | 348,437 | |||||||||
Total non-current liabilities | 129,155 | 95,595 | 15,932 | |||||||||
For the year ended December 31, 2011, revenue was $143.7 million compared to $84.8 million in the prior year. Income from mining operations for the year ended December 31, 2011 was $28.4 million compared to $24.4 million in the prior year. Production from LDI was successfully restarted in April 2010 after being temporarily placed on care and maintenance in October 2008 due to low metal prices.
Metal Prices and Foreign Exchange
Palladium Price (US$/Troy oz)
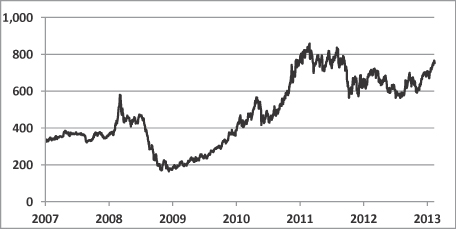
During 2012, the palladium price averaged US$640 per ounce, ranging from a low of US$556 to a high of US$719 per ounce. As of February 21, 2013, the palladium price was US$722 per ounce.
1Non-IFRS measure. Please refer to Non-IFRS Measures on pages 34-36.
13
2012 Annual Report
North American Palladium Ltd.
Canadian dollar exchange rate (CDN$1=US$)
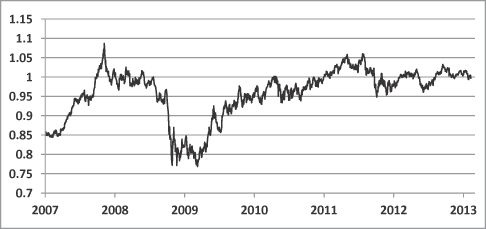
During 2012, the average Canadian dollar exchange rate was $1.00, ranging from a low of $0.98 to a high of $1.03 to the U.S. dollar. The Canadian dollar closed 2012 at $1.01 to the U.S. dollar, compared to $0.98 at the end of 2011. As of February 21, 2013, the Canadian dollar exchange rate was $0.98.
NAP Realized Metal Prices and Exchange Rates
| 2012 | 2011 | |||||||
Palladium – US$/oz | $ 640 | $ 733 | ||||||
Platinum – US$/oz | $ 1,557 | $ 1,725 | ||||||
Gold – US$/oz | $ 1,677 | $ 1,534 | ||||||
Nickel – US$/lb | $ 7.81 | $ 10.52 | ||||||
Copper – US$/lb | $ 3.58 | $ 4.06 | ||||||
Average exchange rate – CDN$1 = US$ | $ 1.00 | $ 1.01 | ||||||
Realized metal prices in the chart above represent the weighted average metal prices on amounts settled from smelters for final outturn of metals during the year.
Spot Metal Prices* and Exchange Rates
For comparison purposes, the following table sets out spot metal prices and exchange rates.
| Dec-31 2012 | Sep-30 2012 | Jun-30 2012 | Mar-31 2012 | Dec-31 2011 | Sep-30 2011 | Jun-30 2011 | Mar-31 2011 | |||||||||||||||||||||||||
Palladium – US$/oz | $ 699 | $ 642 | $ 578 | $ 651 | $ 636 | $ 614 | $ 761 | $ 766 | ||||||||||||||||||||||||
Gold – US$/oz | $ 1,664 | $ 1,776 | $ 1,599 | $ 1,663 | $ 1,575 | $ 1,620 | $ 1,506 | $ 1,439 | ||||||||||||||||||||||||
Platinum – US$/oz | $ 1,523 | $ 1,668 | $ 1,428 | $ 1,640 | $ 1,381 | $ 1,511 | $ 1,722 | $ 1,773 | ||||||||||||||||||||||||
Nickel – US$/lb | $ 7.75 | $ 8.40 | $ 7.46 | $ 7.91 | $ 8.28 | $ 8.30 | $ 10.48 | $ 11.83 | ||||||||||||||||||||||||
Copper – US$/lb | $ 3.59 | $ 3.75 | $ 3.44 | $ 3.83 | $ 3.43 | $ 3.24 | $ 4.22 | $ 4.26 | ||||||||||||||||||||||||
Exchange rate (Bank of Canada) – CDN$1 = US$ | US$1.01 | US$1.02 | US$0.98 | US$1.00 | US$0.98 | US$0.96 | US$1.04 | US$1.03 | ||||||||||||||||||||||||
* Based on the London Metal Exchange
14
2012 Annual Report
North American Palladium Ltd.
PALLADIUM OPERATIONS – FINANCIAL, OPERATING & DEVELOPMENT RESULTS
The LDI Mine consists of an open pit, an underground mine, and a mill with a processing capacity of approximately 15,000 tonnes per day. The primary deposits on the property are the Roby Zone open pit, the underground Roby Zone and the underground Offset Zone, all disseminated magmatic palladium-platinum group metal deposits.
In 2012, underground ore production from the LDI Mine operated on average at approximately 2,200 tonnes per day, seven days a week, on two 12-hour shifts per day. At year end, the LDI Mine and mill had a workforce of approximately 320 employees, some of which are unionized and are subject to a three year agreement that expires in May, 2015.
Financial Results
Income from mining operations for the Palladium operations is summarized in the following table.
| (expressed in thousands of dollars) | 2012 | 2011 | ||||||
Revenue | $ 160,704 | $ 143,659 | ||||||
Mining operating expenses | ||||||||
Production costs | $ 100,802 | $ 89,657 | ||||||
Smelting, refining and freight costs | 13,679 | 9,206 | ||||||
Royalty expense | 6,720 | 5,819 | ||||||
Other | 3,813 | 1,352 | ||||||
Depreciation and amortization | 19,706 | 10,144 | ||||||
(Gain) loss on disposal of equipment | 293 | (923 | ) | |||||
Total mining operating expenses | $ 145,013 | $ 115,255 | ||||||
Income from mining operations | $ 15,691 | $ 28,404 | ||||||
The Company has included income from mining operations as an additional IFRS measure to provide the user with information on the actual results of operations for each reporting segment.
Revenue
Revenue is affected by sales volumes, commodity prices and currency exchange rates. Metal sales for LDI are recognized in revenue at provisional prices when delivered to a smelter for treatment or designated shipping point. Final pricing is determined in accordance with LDI’s smelter agreements. In most cases, final pricing is determined two months after delivery to the smelter for gold, nickel and copper and four months after delivery for palladium and platinum. These final pricing adjustments can result in additional revenues in a rising commodity price environment and reductions to revenue in a declining commodity price environment. Similarly, a weakening in the Canadian dollar relative to the U.S. dollar will result in additional revenues and a strengthening in the Canadian dollar will result in reduced revenues. The Company enters into financial contracts for past production delivered to the smelter to mitigate the smelter agreements’ provisional pricing exposure to rising or declining palladium and gold prices and an appreciating Canadian dollar. These financial contracts represent 55,000 ounces of palladium as at December 31, 2012 and mature from January 2013 through May 2013 at an average forward price of $640 per ounce of palladium. For substantially all of the palladium delivered to the customer under the smelter agreement, the quantities and timing of settlement specified in the financial contracts match final pricing settlement periods. The palladium financial contracts are being recognized on a mark-to-market basis as an adjustment to revenue. The fair value of these contracts at December 31, 2012 was a liability of $3.2 million included in accounts payable and accrued liabilities (December 31, 2011 – $2.0 million asset included in accounts receivable).
15
2012 Annual Report
North American Palladium Ltd.
Sales volumes of LDI’s major commodities are set out in the table below.
| 2012 | 2011 | |||||||
Sales volumes | ||||||||
Palladium (oz) | 161,845 | 146,457 | ||||||
Gold (oz) | 10,950 | 7,256 | ||||||
Platinum (oz) | 11,056 | 9,133 | ||||||
Nickel (lbs) | 1,349,664 | 814,551 | ||||||
Copper (lbs) | 2,564,740 | 1,593,479 | ||||||
Cobalt (lbs) | 12,368 | 20,839 | ||||||
Silver (oz) | 7,347 | 3,752 | ||||||
Revenue from metal sales from the palladium operations is set out in the table below.
| (expressed in thousands of dollars) | 2012 | 2011 | ||||||
Revenue before pricing adjustments | $ 161,286 | $ 148,480 | ||||||
Pricing adjustments | (582 | ) | (4,821 | ) | ||||
Revenue after pricing adjustments | $ 160,704 | $ 143,659 | ||||||
Revenue by metal | ||||||||
Palladium | $ 104,501 | $ 104,004 | ||||||
Gold | 18,567 | 11,971 | ||||||
Platinum | 17,798 | 13,867 | ||||||
Nickel | 10,225 | 7,585 | ||||||
Copper | 9,216 | 5,804 | ||||||
Other metals | 397 | 428 | ||||||
| $ 160,704 | $ 143,659 | |||||||
For the year ended December 31, 2012, revenue before pricing adjustments was $161.3 million, compared to $148.5 million in 2011. The increased revenue in 2012 was primarily due to increased revenue from non-palladium payable metals and an increase in the quantity of palladium ounces sold, partially offset by lower realized prices.
Operating Expenses from Continuing Operations
For the year ended December 31, 2012, operating expenses were $145.0 million, compared to $115.3 million in 2011. The increase in operating expenses in 2012 resulted primarily from mining and processing more physical tonnage (restart of the Roby open pit) and also from higher costs of contractor labour, power, parts and supplies, and fuel charges.
Cash cost per ounce1 of palladium sold, was US$401 for the year ended December 31, 2012 (2011 – US$448).
Due to the Company’s commitment to a comprehensive energy management plan, the Company qualified for the Ontario government’s Northern Industrial Electricity Rate (“NIER”) program to receive electricity price rebates of two cents per kilowatt hour. In the second quarter of 2011, the Company was accepted into the program. For the year ended December 31, 2012, a rebate of $3.4 million was received ($4.2 million, including a retroactive rebate of $1.9 million for LDI’s electricity costs for the period April 1, 2010 through March 31, 2011, was received for the year ended December 31, 2011). The rebate was treated as a reduction of operating expenses. The Company expects to continue to meet the eligibility criteria such that LDI will be entitled to receive additional quarterly rebates until March 2013 (and possibly longer, as the Ontario government intends to extend the NIER program).
Smelting, refining and freight costs for the year ended December 31, 2012 were $13.7 million compared to $9.2 million in 2011. The increase over the prior year is primarily due to more tonnes of concentrate sold and higher smelting and refining charges associated with the current smelter contracts compared to the previous contracts.
16
2012 Annual Report
North American Palladium Ltd.
For the year ended December 31, 2012, royalty expense was $6.7 million compared to $5.8 million in the prior year. Royalty expense was higher in the current year due to higher revenue, net of higher smelting and refining, and freight charges in the current year.
Depreciation and amortization at the LDI Mine for the year ended December 31, 2012 was $19.7 million, compared to $10.1 million for the year ended December 31, 2011. The increase over the prior year is due to a significant increase in depreciable assets associated with the LDI Mine expansion.
Other charges at the LDI Mine in 2012 were $3.8 million, compared to $1.4 million in the prior year. These additional costs are related to dewatering and repairing the damage caused by flooding due to two unprecedented rainfalls in the Thunder Bay region in the second and third quarters of 2012, and are reflected in the financial statements as Other expenses. These costs were excluded from the cash cost per ounce1 of US$401. Following these rainstorms, the Company made several improvements to LDI’s water management systems which are expected to limit the impact of flooding to underground operations in the future.
In 2012, the Company also capitalized $7.7 million related to necessary upgrades to its tailings management facility (“TMF”). Due to the two severe rainstorms, the extra water pumped to the TMF accelerated the timeline for the upgrades to the TMF that were previously planned for 2013.
Operating Results
The key operating results for the Palladium operations are set out in the following table.
| 2012 | 2011 | |||||||
Tonnes of ore milled | 2,063,260 | 1,689,781 | ||||||
Production | ||||||||
Palladium (oz) | 163,980 | 146,624 | ||||||
Gold (oz) | 11,106 | 7,267 | ||||||
Platinum (oz) | 11,187 | 9,143 | ||||||
Nickel (lbs) | 1,348,179 | 816,037 | ||||||
Copper (lbs) | 2,592,748 | 1,596,185 | ||||||
Palladium head grade (g/t) | 3.44 | 3.70 | ||||||
Palladium recoveries (%) | 78.4 | 78.3 | ||||||
Tonnes of ore mined | 2,051,563 | 1,830,234 | ||||||
Total cost per tonne milled | $ 49 | $ 54 | ||||||
Cash cost per ounce of palladium sold (US$)1 | $ 401 | $ 448 | ||||||
LDI Mine
Production during 2012 at the LDI Mine included the blending of higher grade underground ore with lower-grade surface ore. During the year ended December 31, 2012, 2,051,563 tonnes of ore was extracted (2011 – 1,830,234).
LDI Mill
For the year ended December 31, 2012, the mill processed 2,063,260 tonnes of ore, producing 163,980 ounces of payable palladium at an average palladium head grade of 3.44 grams per tonne, palladium recovery of 78.4% (2011 – 1,689,781 tonnes processed, at an average grade of 3.70 grams per tonne, with a palladium recovery of 78.3% producing 146,624 ounces). Production costs of $49 per tonne milled for the year ended December 31, 2012 were lower, compared to $54 per tonne in 2011, due primarily to more tonnage being produced and processed in the year. To improve efficiencies and minimize processing costs, the mill is operating on a batch basis, with a two-week operating and a two-week non-operating schedule.
1Non-IFRS measure. Please refer to Non-IFRS Measures on pages 34-36.
17
2012 Annual Report
North American Palladium Ltd.
LDI’s cash cost per ounce1 was US$401 for the year ended December 31, 2012, compared to US$448 per ounce in the prior year.
LDI Mine Expansion
The Company is currently expanding the LDI Mine to transition from mining via ramp access to mining via shaft while utilizing bulk mining methods. The objective of the mine expansion is to access the deeper and new ore zones that are less economical to mine via a ramp system. With a shaft access infrastructure, future production can be increased at a lower cash cost per ounce1.
Development work in 2012 was focused on completing the surface construction activities, advancing underground development, stoping panel setup and shaft sinking activities.
By 2012 year end, the Company had made significant progress advancing the critical aspects of its mine expansion, including:
| • | On surface, the major construction components are now completed. The headframe, the main substation, the hoist house building, the service hoist (which is used for shaft sinking) and the auxiliary hoist are all fully operational and 100% completed. The installation of the production hoist has commenced and commissioning is scheduled for the first quarter of 2013. |
| • | The remaining work on surface includes the installation of the main skip dumps and the surface ore bins and the installation of the back fill plant scheduled for 2014. |
| • | Underground, shaft sinking is progressing well, in line with the Company’s scheduled rates of advancement. The shaft sinking is at a depth of 550 metres below surface, representing almost 67% of the total 825 metres planned for the first phase of the shaft sinking. Installation of the 740-metre level loading pocket is scheduled for the first quarter of 2013, and the ramp and stope development is also progressing on schedule. |
| • | The Company maintains its development timeline to begin mining via shaft in the third quarter of 2013. |
In the year ended December 31, 2012, $127.5 million was invested in the mine expansion, excluding capitalized interest of $8.0 million.
GOLD OPERATIONS – FINANCIAL, OPERATING & DEVELOPMENT RESULTS
NAP’s gold division consists of the developing Vezza gold mine, the Sleeping Giant mill, the closed Sleeping Giant mine and a number of nearby exploration projects, all located in the Abitibi region of Quebec. In 2012, the Company commenced a process to explore divestiture opportunities for its gold assets. In anticipation of a potential sale, the Company recorded a non-cash impairment charge on its gold assets, which are held for sale, of $56.0 million.
The mine production for the year ended December 31, 2012 is from the remaining ore from the Sleeping Giant mine during the first quarter, prior to the suspension of operations on January 17, 2012. Until the Vezza mine reaches commercial production, all costs (net of pre-production revenue from gold sales) will be capitalized.
1Non-IFRS measure. Please refer to Non-IFRS Measures on pages 34-36.
18
2012 Annual Report
North American Palladium Ltd.
Financial Results
The following table summarizes the mining operations for the Sleeping Giant mine and excludes the Vezza development project results, where all costs are being capitalized until commercial production has been achieved.
| (expressed in thousands of dollars) | 2012 | 2011 | ||||||
Revenue | $ 3,004 | $ 26,813 | ||||||
Mining operating expenses | ||||||||
Production costs | $ 2,153 | $ 31,601 | ||||||
Smelting, refining and freight costs | 16 | 54 | ||||||
Depreciation and amortization | 199 | 7,460 | ||||||
Gold assets impairment charge | 56,023 | 49,210 | ||||||
Gold mine closure, care and maintenance costs | 1,463 | - | ||||||
Gain on disposal of equipment | (435 | ) | (27 | ) | ||||
Total mining operating expenses | $ 59,419 | $ 88,298 | ||||||
Loss from mining operations | $ (56,415 | ) | $ (61,485 | ) | ||||
The Company has included loss from mining operations as an additional IFRS measure to provide the user with information of the actual results of operations for each reporting segment.
Revenue
Metal sales for the Sleeping Giant gold mine were recognized when metal was sold to a third party. Sales volumes are set out in the table below.
| 2012 | 2011 | |||||||
Sales volumes | ||||||||
Gold (oz) | 1,663 | 17,019 | ||||||
Silver (oz) | 2,578 | 31,150 | ||||||
As operations for the Sleeping Giant gold mine were suspended at the beginning of 2012 and pre-production revenue from the Vezza gold mine was capitalized, revenue was $3.0 million for the year ended December 31, 2012, compared to $26.8 million in the prior year, reflecting gold sales of 1,663 ounces with an average realized price of US$1,762 per ounce (2011 – 17,019 ounces with an average realized price of US$1,531).
Operating Expenses
For the year ended December 31, 2012, total production costs at the Sleeping Giant gold mine were $2.2 million as compared to $31.6 million in 2011 due to mine operations ceasing at the beginning of 2012.
Depreciation and amortization for the gold operations was $0.2 million for the year ended December 31, 2012 compared to $7.5 million in the prior year due to mine operations ceasing at the beginning of 2012.
As a result of the Company’s decision to cease mining operations at Sleeping Giant and restructure the gold division, closure costs and care and maintenance costs of $1.5 million (primarily severance) were recorded during the year ended December 31, 2012. As part of the Company’s active consideration of opportunities for divestiture of its gold assets, which has provided an indication of the value of these assets, the Company believes that the current value of these assets is likely significantly less than their book value. Accordingly, the Company has incurred a non-cash impairment charge of $56.0 million. As a result of the Company’s decision to cease mining operations at Sleeping Giant and restructure the gold divisions, a gold asset impairment charge of $49.2 million was recorded during the year ended December 31, 2011.
1Non-IFRS measure. Please refer to Non-IFRS Measures on pages 34-36.
19
2012 Annual Report
North American Palladium Ltd.
Operating Results
The key operating results for the Gold operations are set out in the following table.
| 2012 | 2011 | |||||||
Tonnes of ore milled | 6,369 | 74,154 | ||||||
Production | ||||||||
Gold (oz) | 1,199 | 14,623 | ||||||
Gold head grade (g/t) | 6.14 | 6.36 | ||||||
Gold recoveries (%) | 95.4 | 96.4 | ||||||
Tonnes of ore hoisted | 6,369 | 73,701 | ||||||
Total cost per tonne milled | $ 339 | $ 426 | ||||||
Sleeping Giant Mine
As operations for the Sleeping Giant gold mine were suspended at the beginning of 2012, 6,369 tonnes of ore were hoisted with an average gold grade of 6.14 grams per tonne for the year ended December 31, 2012, compared to 73,701 tonnes of ore hoisted from the underground mine in the prior year with an average gold grade of 6.36 grams per tonne.
Production costs per tonne of ore milled were $339 for the year ended December 31, 2012 (2011 – $426 per tonne).
Sleeping Giant Mill
For the year ended December 31, 2012, the mill processed 6,369 tonnes of ore, producing 1,199 ounces of gold at an average gold head grade of 6.14 grams per tonne, with a gold recovery of 95.4% and mill availability of 98.9% (2011 – 74,154 tonnes of ore, at an average gold head grade of 6.36 grams per tonne, with a gold recovery of 96.4% and mill availability of 98.9% producing 14,623 ounces of gold).
At December 31, 2012, the mill contained approximately 2,137 ounces (2011 – 2,742 ounces from Sleeping Giant) of gold being processed from Vezza that was included in inventory and valued at net realizable value. Despite the closure of the Sleeping Giant mine, the mill continued to operate to process ore from the nearby Vezza project.
Vezza Gold Project
In 2012, the Company continued to advance its Vezza gold project and commenced mining the initial test stoping panels in late Q1 and Q2. Early results were not favorable with regards to dilution so the mining method was changed from Alimak stoping to a modified long hole benching technique. As at year end, the stoping conversion is virtually complete with dilution results significantly improved. Due to this delay toward commercial production, mining rates were slowed to achieve a balance between production rates and development requirements. In 2012, capitalized expenditures at the Company’s Vezza gold project totaled $23.8 million.
The Company continues to evaluate opportunities for the divesture of its gold division assets and undertakings.
20
2012 Annual Report
North American Palladium Ltd.
CONSOLIDATED FINANCIAL RESULTS
General and administration
The Company’s general and administration expenses for the year ended December 31, 2012 were $12.0 million, compared to $12.2 million in the prior year. The decrease is primarily due to decreased staff at the Corporate head office.
Exploration
Exploration expense for the year ended December 31, 2012 was $14.5 million compared to $9.9 million in the prior year. The increase primarily reflects $4.6 million of increased exploration in Ontario compared with the prior year. Exploration expenditures are comprised as follows:
| (expressed in thousands of dollars) | 2012 | 2011 | ||||||
Palladium operations | ||||||||
Ontario exploration projects* | $ 14,408 | $ 9,834 | ||||||
Corporate and other** | 105 | 105 | ||||||
Total exploration expenditures | $ 14,513 | $ 9,939 | ||||||
| * | Ontario exploration projects include the LDI Mine Block intrusion, comprising the Roby, Offset, Cowboy, Sheriff, Baker, Creek and North VT Rim mineralized zones and the South LDI and South VT Rim target areas, the North Lac des Iles intrusive complex, several greenfields PGM properties in the LDI region, and two greenfields Au properties in the LDI-Thunder Bay region (Salmi Lake, Shabaqua). |
| ** | Corporate and other includes the Shebandowan Ni project (joint venture with Vale). |
Interest expense & other costs and other income
Interest expense & other costs and other income for the year ended December 31, 2012 was a net expense of $1.1 million compared to income of $0.3 million in the prior year. The current year net balance includes an accretion expense of $3.0 million, an interest on finance leases of $0.8 million and other interest expense of $ 0.6 million, partially offset by a gain on the renouncement of flow-through expenditures of $1.6 million, an unrealized gain on palladium warrants of $0.9 million, a gain or revaluation of debt of $0.8 million, and interest income of $0.2 million. The prior year balance includes a gain on renouncement of flow-through expenditures of $1.8 million and interest income of $0.9 million, partially offset by financing costs of $0.8 million, accretion expense of $0.7 million, unrealized loss in palladium warrants of $0.5 million and other items of $0.5 million.
Income and Mining Tax Expense (Recovery)
The income and mining tax expense (recovery) for the years ended December 31 are provided as follows:
| (expressed in thousands of dollars) | 2012 | 2011 | ||||||
LDI palladium mine | ||||||||
Ontario transitional tax debit | $ - | $ 2,388 | ||||||
| $ - | $ 2,388 | |||||||
Corporate and other | ||||||||
Expiration of warrants | - | $ (555 | ) | |||||
| - | $ (555 | ) | ||||||
Income and mining tax expense | $ - | $ 1,833 | ||||||
For the year ended December 31, 2012, income and mining tax expense was $Nil compared to $1.8 million in the same period in 2011. The prior year balance includes Ontario transitional tax debits ($2.4 million) partially offset by the tax recovery on the expiration of Series B warrants ($0.6 million).
21
2012 Annual Report
North American Palladium Ltd.
Summary of Quarterly Results
| (expressed in thousands of Canadian dollars except per share amounts) | 2012 | 2011 | ||||||||||||||||||||||||||||||
| Q4 | Q3 | Q2 | Q1 | Q4 | Q3 | Q2 | Q1 | |||||||||||||||||||||||||
Revenue | $ 42,368 | $ 36,193 | $ 40,563 | $ 41,580 | $ 37,205 | $ 32,689 | $ 44,329 | $ 29,436 | ||||||||||||||||||||||||
Production costs | 23,937 | 24,257 | 27,214 | 25,394 | 25,990 | 22,497 | 21,131 | 20,039 | ||||||||||||||||||||||||
Exploration expense | 5,961 | 2,604 | 2,764 | 3,184 | 2,390 | 1,742 | 3,883 | 1,924 | ||||||||||||||||||||||||
Capital expenditures | 41,810 | 34,088 | 32,072 | 37,210 | 44,446 | 39,673 | 31,450 | 32,740 | ||||||||||||||||||||||||
Net income (loss) from continuing operations | (3,739 | ) | (5,908 | ) | (1,903 | ) | 147 | (4,343 | ) | 356 | 10,746 | (2,367 | ) | |||||||||||||||||||
Cash provided by (used in) operations | 39,045 | 5,174 | 4,833 | 6,197 | (147 | ) | 16,232 | 6,362 | 9,175 | |||||||||||||||||||||||
Cash provided by (used in) financing activities | 2,299 | 35,280 | 46,712 | 6,201 | 69,433 | 71 | 7,897 | 61,256 | ||||||||||||||||||||||||
Cash provided by (used in) investing activities | (41,831 | ) | (33,864 | ) | (31,829 | ) | (37,131 | ) | (43,864 | ) | (38,822 | ) | (30,998 | ) | (32,740 | ) | ||||||||||||||||
Net income (loss) per share from continuing operations – basic | $ (0.02 | ) | $ (0.03 | ) | $ (0.01 | ) | $ (0.00 | ) | $(0.03 | ) | $ (0.00 | ) | $ 0.07 | $ (0.01 | ) | |||||||||||||||||
Net income (loss) per share from continuing operations – diluted | (0.02 | ) | (0.03 | ) | (0.01 | ) | (0.00 | ) | (0.03 | ) | (0.00 | ) | 0.07 | (0.01 | ) | |||||||||||||||||
Cash provided by (used in) operations prior to changes in non-cash working capital per share1 | 0.03 | 0.00 | 0.03 | 0.03 | (0.01 | ) | 0.03 | 0.08 | (0.01 | ) | ||||||||||||||||||||||
Tonnes milled | 511,226 | 504,022 | 528,068 | 519,944 | 531,825 | 442,253 | 377,857 | 337,846 | ||||||||||||||||||||||||
Palladium sold (ounces) | 44,394 | 36,218 | 42,285 | 38,948 | 35,116 | 34,524 | 46,362 | 30,455 | ||||||||||||||||||||||||
Revenue for the three months ended December 31, 2012 was $42.4 million compared to $37.2 million for the three months ended December 31, 2011. Net loss for the quarter, was $3.7 million or $0.02 per share compared to a net loss of $4.3 million or $0.03 per share in the comparative period in 2011.
For the three months ended December 31, 2012, the Company expensed $6.0 million in exploration activities compared to $2.4 million in 2011 and $41.8 million in development expenditures at its palladium operations. For the three months ended December 31, 2012, the Company’s operations provided cash, before changes in non-cash working capital, of $5.2 million compared to cash used in operations, before changes in non-cash working capital, of $1.7 million for the same period in 2011. For the three months ended December 31, 2012, financing activities provided cash of $2.3 million, compared to cash provided by financing activities in 2011 of $69.4 million, primarily consisting of $69.7 million related to the issuance of senior secured notes. Investing activities required cash of $41.8 million for the three months ended December 31, 2012 compared to $43.9 million required for investing activities in the comparative period in 2011.
The LDI Mine produced 44,294 ounces of payable palladium for the three months ended December 31, 2012 compared to 34,121 ounces of payable palladium for the comparative period in 2011. During the fourth quarter of 2012, 511,226 tonnes of ore processed by the LDI mill (2011 – 531,825 tonnes).
1Non-IFRS measure. Please refer to Non-IFRS Measures on pages 34-36.
22
2012 Annual Report
North American Palladium Ltd.
FINANCIAL CONDITION, CASH FLOWS, LIQUIDITY AND CAPITAL RESOURCES
Sources and Uses of Cash
| (expressed in thousands of dollars) | 2012 | 2011 | ||||||
Cash provided by operations prior to changes in non-cash working capital | $ 15,594 | $ 15,598 | ||||||
Changes in non-cash working capital | 39,655 | 16,024 | ||||||
Cash provided by operations | 55,249 | 31,622 | ||||||
Cash provided by financing | 90,492 | 138,660 | ||||||
Cash used in investing | (144,654 | ) | (146,425 | ) | ||||
Increase in cash from continuing operations | 1,087 | 23,857 | ||||||
Net cash used in discontinued operations | (31,301 | ) | (48,081 | ) | ||||
Reclassification of cash to assets held for sale | (553 | ) | (71 | ) | ||||
Decrease in cash and cash equivalents | $ (30,767 | ) | $ (24,295 | ) | ||||
Operating Activities
For the year ended December 31, 2012, cash provided by operations prior to changes in non-cash working capital was $15.6 million, unchanged from cash provided by operations of $15.6 million in the prior year.
For the year ended December 31, 2012, changes in non-cash working capital resulted in a source of cash of $39.7 million compared to a source of cash of $16.0 million in the prior year. The 2012 balance of $39.7 million is primarily due to a decrease in accounts receivable ($22.4 million), an increase in accounts payable and accrued liabilities ($22.4 million), partially offset by an increase in inventories ($2.4 million), an increase in other assets ($1.8 million) and a decrease in other financial liabilities ($0.9 million).
Financing Activities
For the year ended December 31, 2012, financing activities provided cash of $90.5 million consisting of $40.8 million related to the issuance of convertible debentures, $36.4 million related to the issuance of flow-through common shares, $15.3 million from drawdown on credit facility and $11.2 million drawdown on capital lease facility, partially offset by repayments of finance leases of $4.8 million and interest payments of $8.5 million. This compared to cash provided by financing activities of $138.7 million in the prior year consisting of $61.9 million related to the exercise of warrants, issuance of flow-through common shares and $69.7 million related to the issuance of senior secured notes and refund of reclamation deposit of $8.8 million, partially offset by net scheduled repayments and additions of $1.7 million of finance leases.
Anticipated operating cash flows and net proceeds on disposal of the gold division are not expected to provide sufficient cash to fund capital expenditures anticipated for 2013, therefore the Company plans to access the capital markets. The Company believes the debt and equity markets are currently available to finance this funding requirement. In the event access to the capital markets is unavailable, the Company will review its options to preserve cash resources.
Investing Activities
For the year ended December 31, 2012, investing activities required cash of $144.7 million primarily due to additions to mining interests of $145.2 million. For the year ended December 31, 2011, investing activities required cash of $146.4 million, primarily due to additions to mining interests of $148.3 million. The majority of the additions to mining interests were attributable to LDI’s mine expansion project.
23
2012 Annual Report
North American Palladium Ltd.
Additions to mining interests
Additions to mining interests are comprised as follows:
| (expressed in thousands of dollars) | 2012 | 2011 | ||||||
Palladium operations | ||||||||
Offset Zone development | $ 130,408 | $ 131,322 | ||||||
Offset Zone exploration costs | 2,687 | 9,216 | ||||||
Tailings management facility | 7,750 | 821 | ||||||
Other equipment and betterments | 4,335 | 6,950 | ||||||
| $ 145,180 | $ 148,309 | |||||||
In addition to the mining interests acquired by cash reflected in the table above, the Company also acquired equipment by means of finance leases. For the year ended December 31, 2012, $12.5 million of equipment was acquired by means of finance leases compared to $3.7 million in the prior year.
During the year, the Company issued 13,725,000 flow-through common shares at an average price of $2.84 per share for net proceeds of $36.4 million. The Company is required to spend the gross proceeds of $39.0 million on eligible exploration and mine development expenditures, which expenditures are expected to be renounced to investors for the 2012 tax year. As at December 31, 2012, $36.9 million was spent. The remaining $2.1 million commitment will be spent by March 31, 2013.
Capital Resources
As at December 31, 2012, the Company had cash and cash equivalents of $20.2 million compared to $50.9 million as at December 31, 2011. The decrease is due primarily to the investment in LDI’s mine expansion and the Vezza gold project held for sale net of financing and cash from operations. The funds are invested in short term interest bearing deposits at a major Canadian chartered bank.
The Company has a US$60.0 million credit facility that is secured by certain of the Company’s accounts receivables and inventory and may be used for working capital liquidity and general corporate purposes. Under the credit agreement, the Company utilized US$17.3 million for letters of credit primarily for reclamation deposits and has taken a drawdown of US$15.2 million, leaving US$27.5 million available at December 31, 2012.
During 2012, the Company established a $15.0 million capital lease facility to fund equipment for the LDI Mine expansion, of which $14.1 million ($9.8 million, net of repayments) had been utilized as at December 31, 2012.
In November 2012, the Company issued 2.4 million flow-through common shares at a price of $1.65 per share for net proceeds of $3.6 million. The Company is required to spend the gross proceeds of $4.0 million on eligible exploration and mine development expenditures, which expenditures are expected to be renounced to investors for the 2012 tax year. As at December 31, 2012, $1.9 million was spent. The remaining $2.1 million commitment was subsequently spent.
On April 30, 2012, the Company issued 11.3 million flow-through common shares at a price of $3.10 per share for net proceeds of $32.8 million. The Company is required to spend the gross proceeds of $35.0 million on eligible exploration and mine development expenditures, which expenditures are expected to be renounced to investors for the 2012 tax year. As at December 31, 2012, $35.0 million was spent.
On July 31, 2012, the Company completed an offering of 43,000 convertible unsecured subordinated debentures of the Company at a price of $1,000 per debenture, for total gross proceeds of $43.0 million ($40.8 million net proceeds). The debentures mature on September 30, 2017 and bear interest at a rate of 6.15% per year, payable semi-annually. At the option of the holder, the debentures may be converted into common shares of the Company at any time prior to maturity at a conversion price of $2.90 per common share. Of the net proceeds of $40.8 million, $33.9 million has been allocated to long-term debt with the remaining portion of $6.9 million allocated to the conversion feature and recorded in equity.
24
2012 Annual Report
North American Palladium Ltd.
During the second quarter of 2012, LDI signed a three-year smelting and refining contract for the majority of the mine’s concentrate. This new contract has higher smelting and refining charges from the previous contract, but has a shorter payment period, which has enabled the Company to reduce its investment in working capital.
Contractual Obligations
Contractual obligations are comprised as follows:
| As at December 31, 2012 | Payments Due by Period | |||||||||||||||
| (expressed in thousands of dollars) | Total | 1-3 Years | 3-5 Years | 5+ Years | ||||||||||||
Finance lease obligations | $ 15,337 | $ 4,374 | $ 10,963 | $ - | ||||||||||||
Operating leases | 6,721 | 2,761 | 3,960 | - | ||||||||||||
Purchase obligations | 84,932 | 84,932 | - | - | ||||||||||||
| $ 106,990 | $ 92,067 | $ 14,923 | $ - | |||||||||||||
In addition to the above, the Company also has asset retirement obligations at December 31, 2012 in the amount of $21.3 million for the LDI Mine, Sleeping Giant mill and Vezza gold mine. The Company obtained letters of credit of $15.9 million as financial surety for these future outlays. As a result, $5.4 million of funding is required prior to or upon closure of these properties.
Contingencies
From time to time, the Company is involved in litigation, investigations, or proceedings related to claims arising in the ordinary course of business. The Company does not believe such matters are material. In 2011, a Statement of Claim was filed with the Ontario Superior Court of Justice against the Company and two of its officers regarding a potential class action lawsuit. In 2012, a fresh Statement of Claim was filed increasing the amount of the claim to $100.0 million. In December of 2012, the plaintiffs filed a motion of record for certification and for leave. The Company intends to vigorously defend the potential claim. It is not possible at this time to estimate the outcome of the potential action and accordingly, the Company has not recorded any associated provisions within its consolidated financial statements at December 31, 2012. The company believes the net impact of this claim will not be material.
Related Party Transactions
There were no related party transactions for the period ended December 31, 2012.
OUTSTANDING SHARE DATA
As of February 21, 2013, there were 177,373,185 common shares of the Company outstanding. In addition, there were options outstanding pursuant to the Amended and Restated 2010 Corporate Stock Option Plan entitling holders thereof to acquire 3,542,249 common shares of the Company at a weighted average exercise price of$3.67 per share.
OVERVIEW OF NAP’S EXPLORATION PROPERTIES
NAP expects future growth will come from continued exploration and development of the Company’s grassroots and near-mine projects. With permits, mine infrastructure and available mill capacity at the LDI Mine, NAP can move from exploration success to production on an accelerated timeline. In addition to the significant exploration program at LDI, the Company’s 2013 exploration budget includes reconnaissance exploration on several, recently acquired greenfields platinum group equivalent (“PGE”) properties – all of which are located within 30 km of the LDI mill.
The Company’s continued to evaluate opportunities for divesture of its gold assets and undertakings. Consequently, there was minimal gold exploration expenditures in 2012.
25
2012 Annual Report
North American Palladium Ltd.
Ontario Properties
LDI Mine & Property
The LDI Mine Block includes approximately 21,000 acres of land and offers significant exploration upside that is complimented by the 15,000-tonne per day mill, which currently has excess capacity. Beyond the immediate mine site, most of the land has had minimal exploration. The exploration success achieved during the past few years gives management encouragement that there is strong potential to continue to grow the Company’s palladium reserve and resource base through exploration.
The LDI property includes the following surface and underground mineralized zones:
| • | Roby Zone: initially mined as an open pit since 1993, underground production from Roby commenced in 2006. |
| • | Offset Zone: discovered in 2001, located below and approximately 250 metres south west of the Roby Zone. The Offset Zone remains open in all directions and continues to expand through exploration. Mining from the Offset Zone commenced in the fourth quarter of 2012. The LDI Mine expansion is currently underway to access the northern and upper portion of the Offset Zone deposit. |
| • | Sheriff Zone*: discovered in 2010, located approximately 100 metres south east of the Offset Zone. This zone is currently being considered for its open pit potential. Planning has commenced to assess the zone’s economics, permitting requirements and production potential. |
| • | Cowboy Zone*: discovered in 2009 during infill drilling of the Offset Zone, located 30 to 60 metres to the west of the Offset Zone. This new discovery has the potential to extend LDI’s mine life and could positively impact the economics of the mine. |
| • | Outlaw Zone*: discovered in 2009, located to the west of the Offset Zone and the Cowboy Zone. Further drilling is required to define the extent of this mineralization. |
| • | North VT Rim*: historical drilling and more recent trenching on the northwestern margin of the LDI Mine Block intrusion have defined a narrow zone of PGE mineralization that is currently being investigated for its open pit potential. |
| * | The disclosure regarding these mineralized areas is conceptual in nature and there has been insufficient exploration to define a mineral resource of these areas. |
The main focus of the 2012 near-mine exploration program was underground exploration at LDI targeting the Offset Zone, including infill drilling and extension drilling towards surface, at depth, and to the south. In addition, the Company initiated a program of resource delineation drilling on the Sheriff Zone to determine if this zone could provide a future source of near-surface, pit grade resources. The Company also began the first program of systematic, closely spaced surface drilling on the North VT rim trend.
A total of 50,148 metres of diamond drilling were completed on the LDI property in 2012. This amount includes 19,405 metres of surface drilling and 30,743 metres of underground drilling. On January 31, 2013, the Company provided an update on the results of its 2012 exploration program for the following:
| • | Offset Zone underground extension drilling program, |
| • | the Sheriff Zone near-surface resource potential, |
| • | the Roby Zone north extension drilling program , |
| • | the North VT Rim surface exploration drilling, and |
| • | new mineralization intersected on the North LDI property. |
26
2012 Annual Report
North American Palladium Ltd.
PGE Greenfields Properties
The Company has interests in a number of greenfields properties including:
North Lac des Iles Intrusive Complex:
In 2012, the Company completed an airborne magnetic and electromagnetic survey over this property and conducted approximately 3,500 metres of diamond drilling on priority geology and geophysical targets.
Legris Lake Property:
The property is at a preliminary exploration stage, however its PGM potential and close proximity to the LDI mill presents an encouraging exploration target.
Tib Lake Property:
On May 3, 2012, LDI entered into an option and purchase agreement with Houston Lake Mining Inc. (“HLM”) whereby LDI obtained an exclusive right and option to purchase a 100% interest in 20 claims located northwest of the Lac des Iles mine, known as the Tib Lake property. The property is subject to a 2.5% net smelter royalty in favour of a third party on a portion of the claims and a 2.5% net smelter royalty in favour of HLM on the remaining claims. The property includes an additional 19 claims staked by LDI and 4 claims purchased from Platinex Inc. in September, 2012.
New Properties:
NAP has acquired a significant land position comprising intrusions in the immediate vicinity of the LDI Mine property. All of these intrusions are believed to be part of the same magmatic event that produced the Lac des Iles intrusive complex and its PGE-Cu-Ni resources. During the first three quarters of 2012, the Company acquired nine additional greenfields PGE properties through staking, option and purchase agreement. The location of these properties is shown in the Company’s July 16, 2012 news release.
In the third quarter of 2012, the Company commenced a reconnaissance exploration program on these recently acquired greenfields PGM properties. Initial drilling on the greenfields properties commenced in the fourth quarter of 2012.
Shebandowan Property:
The Company holds a 50% interest in the former producing Shebandowan mine and the surrounding Haines and Conacher properties pursuant to an Option and Joint Venture Agreement with Vale Canada Limited (“Vale”). The properties, known as the Shebandowan property, contain a series of nickel copper-PGE mineralized bodies.
In 2012, the Company focused on compiling all historical exploration data for the property. In 2013, the Company expects to complete a comprehensive technical review of this data, supporting a re-appraisal of the value of known mineralization and an assessment of the residual mineral potential on the property.
Moose Calf and Kukkee Properties:
In 2012, a limited amount of surface mapping and trenching was conducted on the property.
Salmi Property:
In 2012, a small program of surface mapping, trenching and shallow diamond drilling was conducted on the property.
Quebec Properties:
The primary focus in 2012 was the logging and sampling of core previously drilled from various properties. During 2012, minimal drilling was conducted in the gold division, primarily to meet work commitments.
27
2012 Annual Report
North American Palladium Ltd.
Vezza:
During 2012, the Company drilled 2,179 metres at the Vezza property.
Sleeping Giant Gold Mine & Property:
In 2012, the Company drilled 789 metres underground and completed the logging and sampling of core drilled in late 2011.
Flordin Property:
During 2012, logging of core drilled in late 2011 was completed. Sampling was completed late in the third quarter of 2012, with preliminary results received in the fourth quarter of 2012, but were still being validated at year end.
Discovery Property:
During 2012, drill core recovered in late 2011 was logged and sampled late in the third quarter. Assay results were received in the fourth quarter of 2012, but were still being validated at year end.
Dormex Property:
There was minimal work done on the property in 2012.
Laflamme Gold Property:
Laflamme is an early-stage gold exploration project in the Abitibi region of Quebec. The Company entered into a 50:50 joint venture agreement with Midland Exploration Inc. (“Midland”). The Company is the Operator of the joint venture and may acquire an additional 15% interest by completing a feasibility study.
In 2012, the Company drilled 2,072 metres. On July 25, 2012, Midland announced identification of a new area with strong gold potential and announced the start of ground geophysical surveys on the property.
CRITICAL ACCOUNTING POLICIES AND ESTIMATES
Critical accounting policies generally include estimates that are highly uncertain and for which changes in those estimates could materially impact the Company’s financial statements. The following accounting policies are considered critical:
| a. | Use of estimates |
The preparation of the consolidated financial statements in conformity with IFRS requires management to make judgments, estimates, and assumptions that affect the application of accounting policies and the reported amount of assets and liabilities, the disclosure of contingent assets and liabilities at the date of the financial statements and the reported amounts of revenue and expenses during the year. Significant estimates and assumptions relate to recoverability of mining operations and mineral exploration properties. While management believes that these estimates and assumptions are reasonable, actual results could vary significantly.
Certain assumptions are dependent upon reserves, which represent the estimated amount of ore that can be economically and legally extracted from the Company’s properties. In order to estimate reserves, assumptions are required about a range of geological, technical and economic factors, including quantities, grades, production techniques, recovery rates, production costs, transportation costs, commodity prices and exchange rates. Estimating the quantity and/or grade of reserves requires the size, shape and depth of ore bodies to be determined by analyzing geological data such as drilling samples. This process may require complex and difficult geological judgments to interpret the data. Estimates and underlying assumptions are reviewed on an ongoing basis. Revisions to accounting estimates are recognized in the period in which the estimates are revised and in any future periods affected.
28
2012 Annual Report
North American Palladium Ltd.
Because the economic assumptions used to estimate reserves change from period to period, and because additional geological data is generated during the course of operations, estimates of reserves may change from period to period. Changes in reported reserves may affect the Company’s financial results and financial position in a number of ways, including the following:
| • | Asset carrying values including mining interests may be affected due to changes in estimated future cash flows; |
| • | Depreciation and amortization expensed in the statement of operations may change or be impacted where such expenses are determined by the units of production basis, or where the useful economic lives of assets change; |
| • | Decommissioning, site restoration and environmental provisions may change where changes in estimated reserves affect expectations about the timing or cost of these activities; and |
| • | The carrying value of deferred tax assets may change due to changes in estimates of the likely recovery of the tax benefits. |
| b. | Impairment assessments of long-lived assets |
The carrying amounts of the Company’s non-financial assets, excluding inventories and deferred tax assets, are reviewed at each reporting date to determine whether there is any indication of impairment. Impairment is assessed at the level of cash-generating units (“CGUs”). An impairment loss is recognized in the Consolidated Statements of Operations and Comprehensive Loss for any excess of carrying amount over the recoverable amount.
Impairment is determined for an individual asset unless the asset does not generate cash inflows that are independent of those generated from other assets or groups of assets, in which case, the individual assets are grouped together into CGUs for impairment purposes.
The recoverable amount of an asset or cash-generating unit is the greater of its “value in use”, defined as the discounted present value of the future cash flows expected to arise from its continuing use and its ultimate disposal, and its “fair value less costs to sell”, defined as the best estimate of the asset’s selling price less costs of disposal. In assessing value in use, the estimated future cash flows are discounted to their present value using a pre-tax discount rate that reflects current market assessments of the time value of money and the risks specific to the asset.
An impairment loss is recognized in the Consolidated Statements of Operations and Comprehensive Loss if the carrying amount of an asset or its CGU exceeds its estimated recoverable amount. The recoverable amount of an asset is the higher of its fair value less costs to sell and its value in use.
Impairment losses recognized in prior periods are assessed at each reporting date for any indications that the loss has decreased or no longer exists. An impairment loss on non-financial assets other than goodwill is reversed if there has been a change in the estimates used to determine the recoverable amount, only to the extent that the asset’s carrying amount does not exceed the carrying amount that would have been determined, net of amortization, if no impairment loss had been recognized.
| c. | Depreciation and amortization of mining interests |
Mining interests relating to plant and equipment, mining leases and claims, royalty interests, and other development costs are recorded at cost with depreciation and amortization provided on the unit-of-production method over the estimated remaining ounces of palladium (LDI) and gold (NAP Quebec) to be produced based on the proven and probable reserves or, in the event that the Company is mining resources, an appropriate estimate of the resources mined or expected to be mined.
29
2012 Annual Report
North American Palladium Ltd.
Mining interests relating to small vehicles and certain machinery with a determinable expected life are recorded at cost with depreciation provided on a straight-line basis over their estimated useful lives, ranging from three to seven years, which most closely reflects the expected pattern of consumption of the future economic benefits embodied in the asset. Straight-line depreciation is calculated over the depreciable amount, which is the cost of an asset, less its residual value.
Significant components of individual assets are assessed and, if a component has a useful life that is different from the remainder of that asset, that component is depreciated separately using the unit-of-production or straight-line method as appropriate. Costs relating to land are not amortized.
Leased assets are depreciated over the shorter of the lease term and their useful lives unless it is reasonably certain that the Company will obtain ownership by the end of the lease term.
Depreciation methods, useful lives and residual values are reviewed at each financial year-end and adjusted if appropriate.
| d. | Revenue recognition |
Revenue from the sale of metals in the course of ordinary activities is measured at the fair value of the consideration received or receivable, net of volume adjustments. Revenue is recognized when persuasive evidence exists, usually in the form of an executed sales agreement, that the significant risks and rewards of ownership have been transferred to the buyer, recovery of the consideration is probable, the associated costs and possible return of goods can be estimated reliably, there is no continuing management involvement with the goods, and the amount of revenue can be measured reliably. The timing of the transfers of risks and rewards varies depending on the individual terms of the contract of sale.
Revenue from the sale of palladium and by-product metals from the LDI Mine is provisionally recognized based on quoted market prices upon the delivery of concentrate to the smelter or designated shipping point, which is when title transfers and significant rights and obligations of ownership pass. The Company’s smelter contract provides for final prices to be determined by quoted market prices in a period subsequent to the date of concentrate delivery. Variations from the provisionally priced sales are recognized as revenue adjustments until final pricing is determined. Accounts receivable are recorded net of estimated treatment and refining costs, which are subject to final assay adjustments. Subsequent adjustments to provisional pricing amounts due to changes in metal prices and foreign exchange are disclosed separately from initial revenues in the notes to the financial statements.
Until its closure, revenue from the sale of gold-silver doré bars from Sleeping Giant was recognized when the significant risks and rewards of ownership have transferred to the buyer and selling prices are known or can be reasonably estimated.
| e. | Asset retirement obligations |
In accordance with Company policies, asset retirement obligations relating to legal and constructive obligations for future site reclamation and closure of the Company’s mine sites are recognized when incurred and a liability and corresponding asset are recorded at management’s best estimate. Estimated closure and restoration costs are provided for in the accounting period when the obligation arising from the related disturbance occurs.
The amount of any liability recognized is estimated based on the risk-adjusted costs required to settle present obligations, discounted using a pre-tax risk-free discount rate consistent with the time period of expected cash flows. When the liability is initially recorded, a corresponding asset retirement cost is recognized as an addition to mining interests and amortized using the unit of production method.
The liability for each mine site is accreted over time and the accretion charges are recognized as a finance cost in the Consolidated Statements of Operations and Comprehensive Loss. The liability is subject to re-measurement at each reporting date based on changes in discount rates and timing or amounts of the costs to be incurred. Changes in the liability, other than accretion charges, relating to mine rehabilitation and restoration obligations, which are not the result of current production of inventory, are added to or deducted from the carrying value of the related
30
2012 Annual Report
North American Palladium Ltd.
asset retirement cost in the reporting period recognized. If the change results in a reduction of the obligation in excess of the carrying value of the related asset retirement cost, the excess balance is recognized as a recovery through profit or loss in the period.
Adoption of New Accounting Standards
The following new accounting standards have been adopted by the Company.
IFRS 7 Financial Instruments: Disclosures
The amendments to IFRS 7 require disclosure of information that enables users of financial statements to understand the relationship between transferred financial assets that are not derecognized in their entirety and the associated liabilities; and to evaluate the nature of, and risks associated with, the entity’s continuing involvement in derecognized financial assets. This update is effective for years beginning on or after July 1, 2011. Where applicable, disclosures in these consolidated financial statements have been prepared in accordance with the Company’s adoption of this standard.
New Standards and Interpretations Not Yet Adopted
The following new standards, amendments to standards and interpretations are not yet effective for the year ended December 31, 2012 or have otherwise not yet been adopted by the Company. The Company is evaluating the impact, if any, adoption of the standards will have on the disclosures in the Company’s consolidated financial statements:
IFRS 9 Financial Instruments: Classification and Measurement
This is the first part of a new standard on classification and measurement of financial assets that will replace IAS 39, Financial Instruments: Recognition and Measurement. IFRS 9 has two measurement categories: amortized cost and fair value. All equity instruments are measured at fair value. A debt instrument is at amortized cost only if the entity is holding it to collect contractual cash flows and the cash flows represent principal and interest. Otherwise, it is at fair value through profit or loss. An update to IFRS 9 includes guidance on financial liabilities and de-recognition of financial instruments. This standard and the related update are effective for years beginning on or after January 1, 2015.
The Company will evaluate the impact of the change to its consolidated financial statements based on the characteristics of its financial instruments at the time of adoption.
IAS 1 Presentation of Financial Statements
This standard is amended to change the disclosure of items presented in other comprehensive income (“OCI”), including a requirement to separate items presented in OCI into two groups based on whether or not they may be recycled to profit or loss in the future. The amendment is effective for reporting years beginning on or after July 1, 2012. This amendment is presently not expected to impact the consolidated financial statements of the Company.
IAS 19 Employee Benefits
The standard is amended to reflect significant changes to recognition and measurement of defined benefit pension expense and termination benefits, and provides expanded disclosure requirements. The amendment is effective for annual periods beginning on or after January 1, 2013. This amendment is presently not expected to impact the consolidated financial statements of the Company.
IAS 32 Financial Instruments: Presentation
This standard is amended to clarify requirements for offsetting of financial assets and financial liabilities. The amendment is effective for annual periods beginning on or after January 1, 2014. Management is evaluating the impact, if any, the adoption of this amendment to IFRS 7 will have on the disclosures in its consolidated financial statements.
31
2012 Annual Report
North American Palladium Ltd.
New Standards Addressing the Scope of a Reporting Entity
The following IFRS standards are introduced and IAS standards amended accordingly, for which the Company is evaluating the impact, if any, adoption of the standards will have on the disclosures in the Company’s consolidated financial statements:
IFRS 10 Consolidated Financial Statements
This standard replaces the guidance on control and consolidation in IAS 27, Consolidated and Separate Financial Statements, and SIC-12, Consolidation – Special Purpose Entities. IFRS 10 changes the definition of control under IFRS so that the same criteria are applied to all entities to determine control.
IFRS 11 Joint Arrangements
This standard replaces IAS 31, Interests in Joint Ventures. IFRS 11 reduces the types of joint arrangements to two: joint ventures and joint operations. IFRS 11 requires the use of equity accounting for interests in joint ventures, eliminating the existing policy choice of proportionate consolidation for jointly controlled entities under IAS 31. Entities that participate in joint operations will follow accounting much like that for jointly controlled assets and jointly controlled operations under IAS 31.
IFRS 12 Disclosures of Interests in Other Entities
This standard sets out the disclosure requirements for entities reporting under IFRS 10 and IFRS 11, and replaces the disclosure requirements currently found in IAS 28, Investments in Associates.
IAS 27 Consolidated and Separate Financial Statements
This standard is renamed “Separate Financial Statements” and deals solely with separate financial statements, the guidance for which remains unchanged.
All above standards and amendments are effective for reporting years beginning on or after January 1, 2013.
IFRS 10 Consolidated Financial Statements, IFRS 11 Joint Arrangements, IFRS 12 Disclosure of Interests in Other Entities, IAS 27 Consolidated and Separate Financial Statements
IFRS 10, IFRS 11, IFRS 12, and IAS 27 have been amended to clarify the date of initial application of IFRS 10 and require certain disclosures under IFRS 12 on transition. The standards, as amended, are effective for years beginning on or after January 1, 2013. This amendment is presently not expected to impact the consolidated financial statements of the Company.
IFRS 13 Fair Value Measurement
The new standard provides a single source of guidance on how to measure fair value where its use is already required or permitted by other IFRS and enhances disclosure requirements for information about fair value measurements. The standard is effective for reporting years beginning on or after January 1, 2013.
32
2012 Annual Report
North American Palladium Ltd.
IFRIC 20 - Stripping Costs in the Production Phase of a Surface Mine
On October 20, 2011, the IASB issued a new interpretation, IFRIC 20, to address accounting issues regarding waste removal costs incurred in surface mining activities during the production phase of a mine, referred to as production stripping costs. The new interpretation addresses the classification and measurement of production stripping costs as either inventory or as a tangible or intangible non-current ‘stripping activity asset’. The standard also provides guidance for the depreciation or amortization and impairment of such assets.
IFRIC 20 is effective for reporting years beginning on or after January 1, 2013, although earlier application is permitted. The Company is assessing the impact, if any, the adoption of this standard may have on the consolidated financial statements of the Company.
RISKS AND UNCERTAINTIES
The risks and uncertainties are discussed within the Company’s most recent Form 40-F/Annual Information Form on file with the SEC and Canadian provincial securities regulatory authorities and the Company’s Short Form Base Shelf Prospectus filed on February 12, 2013.
INTERNAL CONTROLS
Disclosure Controls and Procedures
Management is responsible for the information disclosed in this MD&A and has in place the appropriate information systems, procedures and controls to ensure that information used internally by management and disclosed externally is, in all material respects, complete and reliable.
For the year ended December 31, 2012, the Interim Chief Executive Officer and Chief Financial Officer certify that they have designed, or caused to be designed under their supervision, disclosure controls and procedures to provide reasonable assurance that material information relating to the Company and its consolidated subsidiaries would be made known to them by others within those entities.
The disclosure controls and procedures are evaluated annually through regular internal reviews which are carried out under the supervision of, and with the participation of, the Company’s management, including the Interim Chief Executive Officer and Chief Financial Officer. Based on that evaluation, the Interim Chief Executive Officer and Chief Financial Officer concluded that the design and operation of these disclosure controls were effective as of December 31, 2012.
Internal Control over Financial Reporting
For the year ended December 31, 2012, the Interim Chief Executive Officer and Chief Financial Officer certify that they have designed, or caused to be designed under their supervision, internal controls over financial reporting to provide reasonable assurance regarding the reliability of financial reporting and the preparation of the financial statements for external purposes in accordance with IFRS.
There have been no changes in the Company’s internal controls over the financial reporting that occurred during the most recent period ended December 31, 2012 that have materially affected, or are reasonably likely to materially affect, the Company’s internal control over financial reporting.
Management is responsible for establishing and maintaining adequate internal controls over financial reporting. Internal control over financial reporting, no matter how well designed, has inherent limitations and can only provide reasonable assurance, not absolute assurance, with respect to the preparation and fair presentation of published financial statements and management does not expect such controls will prevent or detect all misstatements due to error or fraud. The Company is continually evolving and enhancing its systems of controls and procedures.
Under the supervision and with the participation of the Interim Chief Executive Officer and the Chief Financial Officer, management performs regular internal reviews and conducts an annual evaluation of the effectiveness of its internal
33
2012 Annual Report
North American Palladium Ltd.
control over financial reporting based on the framework in Internal Control – Integrated Framework issued by the Committee of Sponsoring Organizations of the Treadway Commission. Based on that evaluation, the Interim Chief Executive Officer and Chief Financial Officer concluded that the design and operation of these internal controls over financial reporting were effective as of December 31, 2012.
OTHER INFORMATION
Additional information regarding the Company is included in the Company’s Annual Information Form and Annual Report on Form 40-F, which are filed with the SEC and the provincial securities regulatory authorities, respectively. A copy of the Company’s Annual Information Form is posted on the SEDAR website at www.sedar.com. A copy of the Annual Report or Form 40-F can be obtained from the SEC’s website at www.sec.gov.
NON-IFRS MEASURES
This MD&A refers to cash provided by operations before changes in non-cash working capital, in total and per share, cash cost per ounce, adjusted net income, EBITDA and adjusted EBITDA which are not recognized measures under IFRS. Such Non-IFRS financial measures do not have any standardized meaning prescribed by IFRS and are therefore unlikely to be comparable to similar measures presented by other issuers. Management uses these measures internally. The use of these measures enables management to better assess performance trends. Management understands that a number of investors, and others who follow the Company’s performance, assess performance in this way. Management believes that these measures better reflect the Company’s performance and are better indications of its expected performance in future periods. This data is intended to provide additional information and should not be considered in isolation or as a substitute for measures of performance prepared in accordance with IFRS. The following tables reconcile these non-IFRS measures to the most directly comparable IFRS measures:
Cash Provided by Operations
| (a) | Cash Provided by Operations before changes in non-cash working capital |
The Company uses this measure as a valuable indicator of the Company’s ability to generate liquidity by producing operating cash flow to fund working capital needs, service debt obligations, and fund capital expenditures.
| (expressed in thousands of dollars) | 2012 | 2011 | ||||||
Net income (loss) from continuing operations for the year | $ (11,403 | ) | $ 4,392 | |||||
Operating items not involving cash | ||||||||
Depreciation and amortization | 19,706 | 10,144 | ||||||
Accretion expense | 3,258 | 749 | ||||||
Deferred income and mining tax recovery | - | (555 | ) | |||||
Share-based compensation and employee benefits | 2,277 | 3,086 | ||||||
Other expense (income) | 1,756 | (2,218 | ) | |||||
Cash provided by operations before changes in non-cash working capital | $ 15,594 | $ 15,598 | ||||||
| (b) | Cash Provided by Operations before changes in non-cash working capital per share |
| (expressed in thousands of dollars except per share amounts) | 2012 | 2011 | ||||||
Cash provided by operations prior to changes in non-cash working capital | $ 15,594 | $ 15,598 | ||||||
Weighted average number of shares outstanding – basic | 170,960,774 | 162,011,253 | ||||||
Cash provided by operations prior to changes in non-cash working capital per share | $ 0.09 | $ 0.10 | ||||||
Cash Cost Per Ounce of Palladium
The Company uses this measure internally to evaluate the underlying operating performance of the Company for the reporting periods presented. The Company believes that providing cash cost per ounce allows the ability to better evaluate the results of the underlying business of the Company.
34
2012 Annual Report
North American Palladium Ltd.
Cash cost per ounce include mine site operating costs such as mining, processing, administration and royalties, but are exclusive of depreciation, amortization, reclamation, capital and exploration costs. Cash cost per ounce calculation is reduced by any by-product revenue and is then divided by ounces sold to arrive at the by-product cash cost per ounce of sales. This measure, along with revenues, is considered to be a key indicator of a Company’s ability to generate operating earnings and cash flow from its mining operations.
Reconciliation of Palladium Cash Cost per Ounce
| (expressed in thousands of dollars except ounce and per ounce amounts) | 2012 | 2011 | ||||||
Production costs including overhead | $ 100,802 | $ 89,657 | ||||||
Smelting, refining and freight costs | 13,679 | 9,206 | ||||||
Royalty expense | 6,720 | 5,819 | ||||||
Operational expenses | 121,201 | 104,682 | ||||||
Less by-product metal revenue | 56,203 | 39,655 | ||||||
| $ 64,998 | $ 65,027 | |||||||
Divided by ounces of palladium sold | 161,845 | 146,457 | ||||||
Cash cost per ounce (CDN$) | $ 401 | $ 444 | ||||||
Exchange rate (CDN$1 – US$) | 1.00 | 1.01 | ||||||
Cash cost per ounce (US$), net of by-product credits | $ 401 | $ 448 | ||||||
Adjusted net income
The Company uses this measure internally to evaluate the underlying operating performance of the Company for the reporting periods presented. Providing adjusted net income allows the reader the ability to better evaluate the results of the underlying business of the Company.
Adjusted net income is a Non-IFRS financial measure, which excludes the following from loss:
| • | Exploration; |
| • | Loss from discontinued operations; |
| • | Mine startup costs and closure costs; |
| • | Asset impairment charges and insurance recoveries; and |
| • | Mine restoration costs due to flood and retirement payments |
| (expressed in thousands of dollars) | 2012 | 2011 | ||||||
Net loss and comprehensive loss for the year | $ (66,037 | ) | $ (65,154 | ) | ||||
Exploration | 14,513 | 9,939 | ||||||
Loss from discontinued operations | 54,634 | 69,546 | ||||||
Other (mine restoration costs due to flood and retirement payments) | 4,599 | - | ||||||
Adjusted net income | $ 7,709 | $ 14,331 | ||||||
Adjusted EBITDA
The Company believes that EBITDA and Adjusted EBITDA is a valuable indicator of the Company’s ability to generate liquidity by producing operating cash flow to fund working capital needs, service debt obligations, and fund capital expenditures.
35
2012 Annual Report
North American Palladium Ltd.
EBITDA excludes the impact of the cost of financing activities and taxes, and the effects of changes in operating working capital balances, and therefore is not necessarily indicative of operating profit or cash flow from operations as determined under IFRS. Other companies may calculate EBITDA differently. Adjusted EBITDA is a Non-IFRS financial measure, which excludes the following from loss:
| • | Income and mining tax expense; |
| • | Interest and other financing costs (income); |
| • | Depreciation and amortization; |
| • | Exploration; |
| • | Loss from discontinued operations; |
| • | Mine startup and closure costs; |
| • | Asset impairment charges and insurance recoveries; and |
| • | One-time costs (mine restoration costs due to flood and retirement payments) |
| (expressed in thousands of dollars) | 2012 | 2011 | ||||||
(Loss) income and comprehensive (loss) income from continuing operations for the year | $ (11,403 | ) | $ 4,392 | |||||
Income and mining tax expense | - | 1,833 | ||||||
Interest and other financing costs (income) | 1,083 | (320 | ) | |||||
Depreciation and amortization | 19,706 | 10,144 | ||||||
EBITDA | $ 9,386 | 16,049 | ||||||
Exploration | 14,513 | 9,939 | ||||||
Other (mine restoration costs due to flood and retirement payments) | 4,599 | - | ||||||
Adjusted EBITDA | $ 28,498 | $ 25,988 | ||||||
36
2012 Annual Report
North American Palladium Ltd.
Management’s Responsibility
for Financial Statements
The accompanying consolidated financial statements have been prepared by management in accordance with International Financial Reporting Standards (IFRS) as issued by the IASB. Financial statements include certain amounts based on estimates and judgments. When an alternative method exists under IFRS, management has chosen that which it deems most appropriate in the circumstances in order to ensure that the consolidated financial statements are presented fairly, in all material respects, in accordance with IFRS. The financial information presented elsewhere in the annual report is consistent with that in the consolidated financial statements.
The Company maintains adequate systems of internal accounting and administrative controls. Such systems are designed to provide reasonable assurance that transactions are properly authorized and recorded, the Company’s assets are appropriately accounted for and adequately safeguarded and that the financial information is relevant and reliable.
The Board of Directors of the Company is responsible for ensuring that management fulfills its responsibilities for financial reporting, and is ultimately responsible for reviewing and approving the consolidated financial statements and the accompanying management’s discussion and analysis. The Board of Directors carries out this responsibility principally through its Audit Committee.
The Audit Committee is appointed by the Board of Directors and all of its members are non-management directors. The Audit Committee meets periodically with management and the external auditors to discuss internal controls, auditing matters and financial reporting issues, and to satisfy itself that each party is properly discharging its responsibilities. The Audit Committee also reviews the consolidated financial statements, management’s discussion and analysis, the external auditors’ report, examines the fees and expenses for audit services, and considers the engagement or reappointment of the external auditors. The Audit Committee reports its findings to the Board of Directors for its consideration when approving the consolidated financial statements for issuance to the shareholders. KPMG LLP, the external auditors, have full and free access to the Audit Committee.
Toronto, Canada
February 21, 2013
 |  | |
| André Douchane | Dave Langille | |
Interim CEO | CFO | |
37
2012 Annual Report
North American Palladium Ltd.
 | ||||||||
| KPMG LLP | Telephone | (416) 777-8500 | ||||||
| Chartered Accountants | Fax | (416) 777-8818 | ||||||
| Bay Adelaide Centre | Internet | www.kpmg.ca | ||||||
| 333 Bay Street Suite 4600 | ||||||||
| Toronto ON M5H 2S5 |
Independent Auditors’ Report of Registered Public Accounting Firm.
To the Shareholders of North American Palladium Ltd.
We have audited the accompanying consolidated financial statements of North American Palladium Ltd., which comprise the consolidated balance sheets as at December 31, 2012 and December 31, 2011, the consolidated statements of operations and comprehensive loss, shareholders’ equity and cash flows for the years then ended, and notes, comprising a summary of significant accounting policies and other explanatory information.
Management’s Responsibility for the Consolidated Financial Statements
Management is responsible for the preparation and fair presentation of these consolidated financial statements in accordance with International Financial Reporting Standards as issued by the International Accounting Standards Board, and for such internal control as management determines is necessary to enable the preparation of consolidated financial statements that are free from material misstatement, whether due to fraud or error.
Auditors’ Responsibility
Our responsibility is to express an opinion on these consolidated financial statements based on our audits. We conducted our audits in accordance with Canadian generally accepted auditing standards, and the standards of the Public Company Accounting Oversight Board (United States). Those standards require that we comply with ethical requirements and plan and perform the audit to obtain reasonable assurance about whether the consolidated financial statements are free from material misstatement.
An audit involves performing procedures to obtain audit evidence about the amounts and disclosures in the consolidated financial statements. The procedures selected depend on our judgment, including the assessment of the risks of material misstatement of the consolidated financial statements, whether due to fraud or error. In making those risk assessments, we consider internal control relevant to the entity’s preparation and fair presentation of the consolidated financial statements in order to design audit procedures that are appropriate in the circumstances.An audit also includes evaluating the appropriateness of accounting policies used and the reasonableness of accounting estimates made by management, as well as evaluating the overall presentation of the consolidated financial statements.
We believe that the audit evidence we have obtained in our audits is sufficient and appropriate to provide a basis for our audit opinion.
KPMG LLP is a Canadian limited liability partnership and a member firm of the KPMG
network of independent member firms affiliated with KPMG International Cooperative
(“KPMG International”), a Swiss entity.
KPMG Canada provides services to KPMG LLP.
38
2012 Annual Report
Opinion
In our opinion, the consolidated financial statements present fairly, in all material respects, the consolidated financial position of North American Palladium Ltd. as at December 31, 2012 and December 31, 2011, and its consolidated financial performance and its consolidated cash flows for the years then ended in accordance with International Financial Reporting Standards as issued by the International Accounting Standards Board.
Chartered Accountants, Licensed Public Accountants
February 21, 2013
Toronto, Canada
39
2012 Annual Report
North American Palladium Ltd.
Consolidated Balance Sheets
(expressed in thousands of Canadian dollars)
| Notes | December 31 2012 | December 31 2011 | ||||||||||
ASSETS | ||||||||||||
Current Assets | ||||||||||||
Cash and cash equivalents | $ 20,168 | $ 50,935 | ||||||||||
Accounts receivable | 5 | 53,922 | 73,048 | |||||||||
Taxes receivable | - | 4,602 | ||||||||||
Inventories | 6 | 15,388 | 20,046 | |||||||||
Other assets | 7 | 8,448 | 11,255 | |||||||||
Assets of disposal group classified as held for sale | 4 | 29,814 | - | |||||||||
Total Current Assets | 127,740 | 159,886 | ||||||||||
Non-current Assets | ||||||||||||
Mining interests | 8 | 343,492 | 256,159 | |||||||||
Total Non-current Assets | 343,492 | 256,159 | ||||||||||
Total Assets | $ 471,232 | $ 416,045 | ||||||||||
LIABILITIES AND SHAREHOLDERS’ EQUITY | ||||||||||||
Current Liabilities | ||||||||||||
Accounts payable and accrued liabilities | 10 | $ 58,474 | $ 42,436 | |||||||||
Credit facility | 5 | 15,089 | - | |||||||||
Current portion of obligations under finance leases | 11 | 3,717 | 2,428 | |||||||||
Provisions | 12 | 1,000 | 1,000 | |||||||||
Taxes payable | 874 | 715 | ||||||||||
Current derivative liability | 13 | 3,952 | 4,875 | |||||||||
Liabilities of disposal group classified as held for sale | 4 | 12,071 | - | |||||||||
Total Current Liabilities | 95,177 | 51,454 | ||||||||||
Non-current Liabilities | ||||||||||||
Income taxes payable | 2,352 | 2,648 | ||||||||||
Asset retirement obligations | 9 | 15,214 | 20,881 | |||||||||
Obligations under finance leases | 11 | 9,956 | 2,104 | |||||||||
Long-term debt | 13 | 101,633 | 65,698 | |||||||||
Deferred mining tax liability | 22 | - | 4,264 | |||||||||
Total Non-current Liabilities | 129,155 | 95,595 | ||||||||||
Shareholders’ Equity | ||||||||||||
Common share capital and purchase warrants | 15 | 776,632 | 740,888 | |||||||||
Stock options and related surplus | 9,125 | 7,859 | ||||||||||
Equity component of convertible debentures, net of issue costs | 13 | 6,931 | - | |||||||||
Contributed surplus | 8,873 | 8,873 | ||||||||||
Deficit | (554,661 | ) | (488,624 | ) | ||||||||
Total Shareholders’ Equity | 246,900 | 268,996 | ||||||||||
Total Liabilities and Shareholders’ Equity | $ 471,232 | $ 416,045 | ||||||||||
Commitments and contingencies – Notes 18 and 21
See accompanying notes to the consolidated financial statements
On Behalf of the Board of Directors
|  | |||
André J. Douchane, Director | Steven R. Berlin, Director |
40
2012 Annual Report
North American Palladium Ltd.
Consolidated Statements of Operations and
Comprehensive Loss
(expressed in thousands of Canadian dollars, except share and per share amounts)
| Notes | 2012 | 2011 | ||||||||||
Revenue | 19 | $ 160,704 | $ 143,659 | |||||||||
Mining operating expenses | ||||||||||||
Production costs | 100,802 | 89,657 | ||||||||||
Smelting, refining and freight costs | 13,679 | 9,206 | ||||||||||
Royalty expense | 6,720 | 5,819 | ||||||||||
Depreciation and amortization | 19,706 | 10,144 | ||||||||||
Loss (gain) on disposal of equipment | 293 | (923 | ) | |||||||||
Other | 3,813 | 1,352 | ||||||||||
Total mining operating expenses | 145,013 | 115,255 | ||||||||||
Income from mining operations | 15,691 | 28,404 | ||||||||||
Other expenses | ||||||||||||
Exploration | 14,513 | 9,939 | ||||||||||
General and administration | 12,002 | 12,201 | ||||||||||
Other income | 20 | (3,598 | ) | (2,783 | ) | |||||||
Interest expense and other costs | 20 | 4,681 | 2,463 | |||||||||
Foreign exchange (gain) loss | (504 | ) | 359 | |||||||||
Total other expenses | 27,094 | 22,179 | ||||||||||
(Loss) income from continuing operations before taxes | (11,403 | ) | 6,225 | |||||||||
Income and mining tax expense | 22 | - | (1,833 | ) | ||||||||
| (Loss) income and comprehensive (loss) income from continuing operations for the period | $ (11,403 | ) | $ 4,392 | |||||||||
Loss and comprehensive loss from discontinued operations for the period | 4 | (54,634 | ) | (69,546 | ) | |||||||
Loss and comprehensive loss for the period | $ (66,037 | ) | $ (65,154 | ) | ||||||||
Loss per share | ||||||||||||
Basic | $ (0.39 | ) | $ (0.40 | ) | ||||||||
Diluted | 15(f | ) | $ (0.39 | ) | $ (0.40 | ) | ||||||
(Loss) income from continuing operations per share | ||||||||||||
Basic | $ (0.07 | ) | $ 0.03 | |||||||||
Diluted | $ (0.07 | ) | $ 0.03 | |||||||||
Loss from discontinued operations per share | ||||||||||||
Basic | $ (0.32 | ) | $ (0.43 | ) | ||||||||
Diluted | $ (0.32 | ) | $ (0.43 | ) | ||||||||
Weighted average number of shares outstanding | ||||||||||||
Basic | 15(f | ) | 170,960,774 | 162,011,253 | ||||||||
Diluted | 15(f | ) | 170,983,774 | 162,011,253 | ||||||||
See accompanying notes to the consolidated financial statements
41
2012 Annual Report
North American Palladium Ltd.
Consolidated Statements of Cash Flows
(expressed in thousands of Canadian dollars)
| Notes | 2012 | 2011 | ||||||||||
| Cash provided by (used in) | ||||||||||||
| Operations | ||||||||||||
Net income (loss) from continuing operations for the year | $ (11,403 | ) | $ 4,392 | |||||||||
Operating items not involving cash | ||||||||||||
Depreciation and amortization | 19,706 | 10,144 | ||||||||||
Accretion expense | 20 | 3,258 | 749 | |||||||||
Deferred income and mining tax recovery | 22 | - | (555 | ) | ||||||||
Share-based compensation and employee benefits | 15(h | ) | 2,277 | 3,086 | ||||||||
Other | 1,756 | (2,218 | ) | |||||||||
| 15,594 | 15,598 | |||||||||||
Changes in non-cash working capital | 23 | 39,655 | 16,024 | |||||||||
| 55,249 | 31,622 | |||||||||||
Financing Activities | ||||||||||||
Issuance of common shares and warrants, net of issue costs | 15(d | ) | 36,404 | 61,916 | ||||||||
Issuance of long-term debt, net of issue costs | 13 | - | 69,656 | |||||||||
Issuance of convertible debentures, net of issue costs | 13 | 40,804 | - | |||||||||
Credit facility | 5 | 15,287 | - | |||||||||
Finance lease facility | 11 | 11,239 | - | |||||||||
Repayment of obligations under finance leases | 11 | (4,749 | ) | (1,523 | ) | |||||||
Interest paid | (8,493 | ) | (157 | ) | ||||||||
Mine reclamation deposit | - | 8,768 | ||||||||||
| 90,492 | 138,660 | |||||||||||
Investing Activities | ||||||||||||
Additions to mining interests (net) | 8 | (145,180 | ) | (148,309 | ) | |||||||
Proceeds on disposal of mining interests (net) | 526 | 1,884 | ||||||||||
| (144,654 | ) | (146,425 | ) | |||||||||
Increase in cash from continuing operations | 1,087 | 23,857 | ||||||||||
Net cash used in discontinued operations | 4 | (31,301 | ) | (48,081 | ) | |||||||
Reclassification of cash to assets held for sale | (553 | ) | (71 | ) | ||||||||
Decrease in cash | (30,767 | ) | (24,295 | ) | ||||||||
Cash and cash equivalents, beginning of year | 50,935 | 75,159 | ||||||||||
Cash and cash equivalents, end of year | $ 20,168 | $ 50,864 | ||||||||||
Cash and cash equivalents consisting of: | ||||||||||||
Cash | $ 20,168 | $ 50,532 | ||||||||||
Short-term investments | - | 332 | ||||||||||
| $ 20,168 | $ 50,864 | |||||||||||
Foreign exchange included in cash balance | $ (2 | ) | $ 66 | |||||||||
See accompanying notes to the consolidated financial statements
42
2012 Annual Report
North American Palladium Ltd.
Consolidated Statements of Shareholders’ Equity
(expressed in thousands of Canadian dollars, except share amounts)
| Notes | Number of shares | Capital stock | Stock options | Warrants | Equity component of convertible debentures | Contributed surplus | Deficit | Total shareholders’ equity | ||||||||||||||||||||||||||||
Balance, January 1, 2011 | 15 | 154,653,275 | $ 697,674 | $ 5,596 | $ 5,113 | - | $ 5,537 | $ (423,470 | ) | $ 290,450 | ||||||||||||||||||||||||||
Common shares issued: | ||||||||||||||||||||||||||||||||||||
Private placement of flow-through shares, net of issue costs | 15(d | ) | 2,667,000 | 20,594 | - | - | - | - | - | 20,594 | ||||||||||||||||||||||||||
Premium on issuance of flow-through shares | - | (1,840 | ) | - | - | - | - | - | (1,840 | ) | ||||||||||||||||||||||||||
Warrants: | ||||||||||||||||||||||||||||||||||||
Warrants exercised | 15(b | ) | 5,009,986 | 22,514 | - | (1,239 | ) | - | 14 | - | 21,289 | |||||||||||||||||||||||||
Expiration of warrants, net of tax | 15(b | ) | - | - | - | (3,874 | ) | - | 3,322 | - | (552 | ) | ||||||||||||||||||||||||
Stock based compensation: | ||||||||||||||||||||||||||||||||||||
Stock options exercised | 15(e | ) | 317,919 | 1,105 | (300 | ) | - | - | - | - | 805 | |||||||||||||||||||||||||
Stock-based compensation expense | 15(c | ) | 203,252 | 841 | 2,563 | - | - | - | - | 3,404 | ||||||||||||||||||||||||||
Net loss and comprehensive loss for the year ended December 31, 2011 | - | - | - | - | - | - | (65,154 | ) | (65,154 | ) | ||||||||||||||||||||||||||
Balance, December 31, 2011 | 162,851,432 | $ 740,888 | $ 7,859 | $ - | $ - | $ 8,873 | $ (488,624 | ) | $ 268,996 | |||||||||||||||||||||||||||
Common shares issued: | ||||||||||||||||||||||||||||||||||||
Private placement of flow-through shares, net of issue costs | 15(d | ) | 13,725,000 | 36,405 | - | - | - | - | - | 36,405 | ||||||||||||||||||||||||||
Premium on issuance of flow-through shares | - | (1,901 | ) | - | - | - | - | - | (1,901 | ) | ||||||||||||||||||||||||||
Convertible debentures: | ||||||||||||||||||||||||||||||||||||
Equity component of convertible debentures, net of issue costs | 13 | - | - | - | - | 6,931 | - | - | 6,931 | |||||||||||||||||||||||||||
Stock based compensation: | ||||||||||||||||||||||||||||||||||||
Stock-based compensation expense | 15(c | ) | 551,401 | 1,240 | 1,266 | - | - | - | - | 2,506 | ||||||||||||||||||||||||||
Net loss and comprehensive loss for the year ended December 31, 2012 | - | - | - | - | - | - | (66,037 | ) | (66,037 | ) | ||||||||||||||||||||||||||
Balance, December 31, 2012 | 177,127,833 | $ 776,632 | $ 9,125 | $ - | $ 6,931 | $ 8,873 | $ (554,661 | ) | $ 246,900 | |||||||||||||||||||||||||||
See accompanying notes to the consolidated financial statements
43
2012 Annual Report
North American Palladium Ltd.
Notes to the Consolidated Financial Statements
(expressed in thousands of Canadian dollars, except per share amounts and metal prices)
1. NATURE OF OPERATIONS
North American Palladium Ltd. (“NAP”) is domiciled in Canada and was incorporated on September 12, 1991 under the Canadian Business Corporations Act. The Company’s 100%-owned subsidiaries are Lac des Iles Mines Ltd. (“LDI”) and NAP Quebec Mines Ltd. (“NAP Quebec”).
NAP’s flagship operation is the LDI palladium mine, located northwest of Thunder Bay, Ontario, which started producing palladium in 1993. The Company is currently expanding the LDI mine to transition from mining via ramp access to mining via shaft while utilizing bulk mining methods.
The Company is incurring additional exploration expenditures on other palladium opportunities at LDI, including the Sheriff deposit.
The Company also owns the Vezza gold mine and Sleeping Giant mill located north of Val D’or, Quebec. The Company’s other Québec-based properties consist of Discovery, Flordin, Cameron Shear, Florence, Laflamme, Dormex and Harricana.
The consolidated financial statements for the Company as at December 31, 2012 and for the year ended December 31, 2012, include the Company and its subsidiaries (collectively referred to as the “Company”).
At December 31, 2012, the Company was committed to a plan to market and sell its gold division assets (“Disposal Group”) through the sale of the shares of its wholly-owned subsidiary NAP Quebec.
2. BASIS OF PRESENTATION
Statement of Compliance
These consolidated financial statements have been prepared in accordance with International Financial Reporting Standards (“IFRS”) as issued by the International Accounting Standards Board (“IASB”), applicable to the preparation of these financial statements, including IAS 1, Presentation of Financial Statements.
These consolidated financial statements were authorized for issuance by the Board of Directors of the Company on February 21, 2013.
Basis of Measurement
These consolidated financial statements have been prepared on the historical cost basis, except for the following items in the consolidated balance sheet:
| (i) | Accounts receivable and related derivative instruments are measured at fair value. |
| (ii) | Financial instruments at fair value through profit or loss are measured at fair value. |
| (iii) | Liabilities for cash-settled share-based payment arrangements are measured at fair value. |
Functional and Presentation Currency
These consolidated financial statements are presented in Canadian dollars, which is the Company’s and each of its subsidiaries’ functional currency. All financial information is expressed in thousands of Canadian dollars, except share and per share amounts.
44
2012 Annual Report
North American Palladium Ltd.
Use of Judgments and Estimates
The preparation of the consolidated financial statements in conformity with IFRS requires management to make judgments, estimates, and assumptions that affect the application of accounting policies and the reported amount of assets and liabilities, the disclosure of contingent assets and liabilities at the date of the consolidated financial statements and the reported amounts of revenue and expenses during the year. Significant estimates and assumptions relate to recoverability of mining operations and mineral exploration properties. While management believes that these estimates and assumptions are reasonable, actual results could vary significantly.
(a) Critical judgments
Information about critical judgments in applying accounting policies that have the most significant effect on the amounts recognized in the consolidated financial statements is included in the following note:
Note 9 – Asset retirement obligations and reclamation deposits
(b) Key estimates and assumptions
Certain assumptions are dependent upon reserves, which represent the estimated amount of ore that can be economically and legally extracted from the Company’s properties. In order to estimate reserves, assumptions are required about a range of geological, technical and economic factors, including quantities, grades, production techniques, recovery rates, production costs, transportation costs, commodity prices and exchange rates. Estimating the quantity and/or grade of reserves requires the size, shape and depth of ore bodies to be determined by analyzing geological data such as drilling samples. This process may require complex and difficult geological judgments to interpret the data. Estimates and underlying assumptions are reviewed on an ongoing basis. Revisions to accounting estimates are recognized in the period they are determined and in any future periods affected.
Because the economic assumptions used to estimate reserves change from period to period and additional geological data is generated during the course of operations, estimates of reserves may change from period to period. Changes in reported reserves may affect the Company’s financial results and financial position in a number of ways, including the following:
| (i) | Asset carrying values including mining interests may be affected due to changes in estimated future cash flows; |
| (ii) | Depreciation and amortization charged in the statement of operations may change or be impacted where such charges are determined by the units of production basis, or where the useful economic lives of assets change; |
| (iii) | Decommissioning, site restoration and environmental provisions may change where changes in estimated reserves affect expectations about the timing or cost of these activities; and |
| (iv) | The carrying value of deferred tax assets may change due to changes in estimates of the likely recovery of the tax benefits. |
Information about assumptions and estimation uncertainties that have a significant risk of resulting in a material adjustment within the next financial year are included in the following notes:
Note 19 – Revenue from metal sales
Note 21 – Contingencies
Note 22 – Income taxes
45
2012 Annual Report
North American Palladium Ltd.
3. SUMMARY OF SIGNIFICANT ACCOUNTING POLICIES
The accounting policies set out below have been applied consistently by all Company’s entities for all periods presented in these consolidated financial statements, unless otherwise indicated.
Basis of Consolidation
These consolidated financial statements include the accounts of NAP and its wholly-owned subsidiaries.
(a) Business combinations
The Company measures goodwill as the fair value of the consideration transferred including the recognized amount of any non-controlling interest in the acquiree, less the fair value of the identifiable assets acquired and liabilities assumed, all measured as of the acquisition date. When the excess is negative, a bargain purchase gain is recognized immediately in profit or loss.
The Company elects on a transaction-by-transaction basis whether to measure non-controlling interest at its fair value, or at its proportionate share of the recognized amount of the identifiable net assets, at the acquisition date.
Transaction costs, other than those directly associated with the issue of debt or equity securities, that the Company incurs in connection with a business combination are expensed as incurred.
(b) Subsidiaries
Subsidiaries are entities controlled by NAP. The financial statements of subsidiaries are included in the consolidated financial statements from the date that control commences until the date that control ceases.
(c) Transactions eliminated on consolidation
Inter-company balances and transactions and any unrealized income and expenses arising from inter-company transactions are eliminated in preparing the consolidated financial statements.
Foreign Currency Translations
The reporting and functional currency of the Company and its subsidiaries is the Canadian dollar. Accordingly, the Company translates monetary assets and liabilities denominated in foreign currency at the rate of exchange prevailing at the consolidated balance sheet dates, non-monetary assets and liabilities denominated in foreign currency at the rate in effect at the date the transaction occurred and revenues and expenses denominated in foreign currency at the exchange rate in effect during the applicable accounting period. All resulting foreign exchange gains and losses are recorded in the Consolidated Statements of Operations and Comprehensive Loss.
Financial Instruments
(a) Non-derivative financial assets
The Company initially recognizes loans and receivables and deposits on the date they originated. All other financial assets (including assets designated at fair value through profit or loss) are recognized initially on the trade date at which the Company becomes a party to the contractual provisions of the instrument.
46
2012 Annual Report
North American Palladium Ltd.
Financial instruments are measured on initial recognition at fair value plus, in the case of instruments other than those classified as “fair value through profit and loss”, directly attributable transaction costs.
The Company has the following non-derivative financial assets: financial assets at fair value through profit or loss and loans and receivables.
A financial asset is classified at fair value through profit or loss if it is classified as held for trading or is designated as such upon initial recognition. These financial instruments are measured at fair value, and changes therein are recognized in the Consolidated Statements of Operations and Comprehensive Loss. The Company’s accounts receivable from the sale of palladium and by-product metals from the LDI mine primarily represent the material financial instruments which have been recorded at fair value through profit or loss (see note 5).
Financial assets classified as loans and receivables are measured subsequent to initial recognition at amortized cost using the effective interest method, less any impairment losses. The Company’s loan and receivables are included in other assets (refer to note 7). Cash and cash equivalents are stated at fair value and include cash on account less outstanding cheques, demand deposits and short-term guaranteed investments with original maturities of three months or less.
| (b) | Non-derivative financial liabilities |
The Company initially recognizes debt securities issued and subordinated liabilities on the date they originated. All other financial liabilities (including liabilities designated at fair value through profit or loss) are recognized initially on the trade date at which the Company becomes a party to the contractual provisions of the instrument.
The Company derecognizes a financial liability when its contractual obligations are discharged, cancelled or expired. Financial assets and liabilities are offset and the net amount presented in the consolidated balance sheet when, and only when, the Company has a legal right to offset the amounts and intends either to settle on a net basis or to realize the asset and settle the liability simultaneously.
The Company has the following non-derivative financial liabilities: long-term debt, finance leases, loans and borrowings, bank overdrafts, credit facilities, and trade and other payables.
Such financial liabilities are designated initially at fair value through profit or loss, and recognized at fair value plus any directly attributable transaction costs. Subsequent to initial recognition these financial liabilities are designated at amortized cost and are measured at amortized cost using the effective interest method.
| (c) | Derivative financial instruments |
The Company holds derivative financial instruments to minimize its foreign currency and market price exposures. Embedded derivatives are separated from the host contract and accounted for separately if the economic characteristics and risks of the host contract and the embedded derivative are not closely related, a separate instrument with the same terms as the embedded derivative would meet the definition of a derivative, and the combined instrument is not measured at fair value through profit or loss.
Derivatives are recognized initially at fair value and any associated transaction costs are recognized in profit or loss as incurred. Subsequent to initial recognition, derivatives are measured at fair value, and changes therein are accounted for as described below.
Separable embedded derivatives
Changes in the fair value of separable embedded derivatives are recognized immediately in profit or loss.
47
2012 Annual Report
North American Palladium Ltd.
Other non-trading derivatives
When a derivative financial instrument is not held for trading and is not designated in a qualifying hedge relationship, all changes in its fair value are recognized immediately in profit or loss.
Inventories
Concentrate, crushed and broken ore stockpiles, and gold inventory are valued at the lower of average production cost (including an allocation of the depreciation of production related assets) and net realizable value. Crushed and broken ore stockpiles represent coarse ore that has been extracted from the mine and is available for further processing. The amount of stockpiled ore that is not expected to be processed within one year, if any, is shown as a long-term asset. Gold inventory is comprised of unprocessed ore either in stockpiles or bins, unrecovered gold in either carbon or solution within the milling circuit, and gold-silver doré bars produced but not sold as at the reporting date. Supplies inventory is valued at the lower of average cost and net realizable value.
Mining Interests
| (a) | Recognition and measurement |
Property, plant and equipment are measured at cost less accumulated depreciation and accumulated impairment losses.
Cost includes expenditures that are directly attributable to the acquisition of the asset. The cost of self-constructed assets includes the cost of materials and direct labour, any other costs directly attributable to bringing the assets to a working condition for their intended use, the costs of dismantling and removing the items and restoring the site on which they are located, and borrowing costs on qualifying assets for which the commencement date for capitalization is on or after January 1, 2010. Where funds used to finance a major project form part of general borrowings, the Company capitalizes interest on those borrowings proportionate to the project funds used.
When parts of an item of property, plant and equipment have different useful lives, they are accounted for as separate items or major components of property, plant and equipment.
Spare parts and servicing equipment are usually carried as inventory and recognized in profit or loss as consumed. However, major spare parts and stand-by equipment qualify as property, plant and equipment when the Company expects to use them during more than one period. Similarly, if the spare parts and servicing equipment can be used only in connection with an item of property, plant and equipment, they are accounted for as property, plant and equipment.
Exploration costs relating to properties are charged to earnings in the year in which they are incurred. When it is determined that a mining property can be economically developed as a result of reserve potential and subsequent exploration, expenditures are capitalized. Determination as to reserve potential is based on the results of studies, which indicate whether production from a property is economically feasible. Upon commencement of commercial production of a development project these costs are amortized using the unit-of-production method over the proven and probable reserves. Capitalized exploration costs, net of salvage values, relating to a property that is later abandoned or considered uneconomic for the foreseeable future, are written off in the period the decision is made. No amortization is provided in respect of mine development expenditures until commencement of commercial production. Any production revenue earned prior to commercial production, net of related costs, is offset against the development costs.
Gains and losses on disposal of an item of property, plant and equipment are determined by comparing the proceeds from disposal with the carrying amount of property, plant and equipment, and are recognized within mining operating expenses.
48
2012 Annual Report
North American Palladium Ltd.
| (b) | Subsequent costs |
The cost of replacing a part of an item of property, plant and equipment is recognized at the carrying amount of the item if it is probable that the future economic benefits embodied within the item will flow to the Company and its cost can be measured reliably. The carrying amount of the replaced part is derecognized. The costs of the day-to-day servicing of property, plant and equipment are recognized in profit or loss as incurred.
| (c) | Depreciation and amortization |
Mining interests relating to plant and equipment, mining leases and claims, royalty interests, and other development costs are recorded at cost with depreciation and amortization provided on the unit-of-production method over the estimated remaining ounces of palladium (LDI) and gold (NAP Quebec) to be produced based on the proven and probable reserves or, in the event that the company is mining resources, an appropriate estimate of the resources mined or expected to be mined.
Mining interests relating to small vehicles and certain machinery with a determinable expected life are recorded at cost with depreciation provided on a straight-line basis over their estimated useful lives, ranging from three to seven years, which most closely reflects the expected pattern of consumption of the future economic benefits embodied in the asset. Straight-line depreciation is calculated over the depreciable amount, which is the cost of an asset, less its residual value.
Significant components of individual assets are assessed and, if a component has a useful life that is different from the remainder of that asset, that component is depreciated separately using the unit-of-production or straight-line method as appropriate. Costs relating to land are not amortized.
Leased assets are depreciated over the shorter of the lease term and their useful lives unless it is reasonably certain that the Company will obtain ownership by the end of the lease term.
Depreciation methods, useful lives and residual values are reviewed at each financial year-end and adjusted if appropriate.
Discontinued operations and assets held for sale
A non-current asset (or disposal group) is reclassified as held for sale and reclassified to current assets if the Company expects that its carrying value will be recovered principally through a sale transaction and not through its continued use provided that the asset (or disposal group) is available for immediate sale in its present condition and realization of its sale is highly probable. A high probability of sale is considered to exist when the Company is committed to a plan to sell the asset (or disposal group), has undertaken an active program to actively market the asset (or disposal group) and locate a buyer at a price reasonable in relation to fair value of the asset (or disposal group), and expects the sale process to be concluded within one year following the date of reclassification. The assets and liabilities of any subsidiary for which the Company is committed to sell and for which loss of control of the subsidiary is expected to occur are also reclassified as held for sale.
Any component of the Company which, while in use, represented one or more cash-generating units (“CGUs”) of the Company, has been disposed of or classified as held for sale, and represents a major line of business or geographical area of operations or is part of a single plan to dispose of such a business or operation or is otherwise a subsidiary acquired exclusively for resale is classified as a discontinued operation. The assets, liabilities, comprehensive income, and cash flows relating to a discontinued operation of the Company are segregated and reported separately from the continuing operations of the Company in the period of reclassification without restatement or re-presentation of comparative periods prior to the reporting period in which the reclassification occurs.
49
2012 Annual Report
North American Palladium Ltd.
Impairment
The carrying amounts of the Company’s non-financial assets, excluding inventories and deferred tax assets, are reviewed at each reporting date to determine whether there is any indication of impairment. Impairment is assessed at the level of CGUs. An impairment loss is recognized in the Consolidated Statements of Operations and Comprehensive Loss for any excess of carrying amount over the recoverable amount.
Impairment is determined for an individual asset unless the asset does not generate cash inflows that are independent of those generated from other assets or groups of assets, in which case, the individual assets are grouped together into CGUs for impairment purposes.
The recoverable amount of an asset or CGU is the greater of its “value in use”, defined as the discounted present value of the future cash flows expected to arise from its continuing use and its ultimate disposal, and its “fair value less costs to sell”, defined as the best estimate of the asset’s selling price less costs of disposal. In assessing value in use, the estimated future cash flows are discounted to their present value using a pre-tax discount rate that reflects current market assessments of the time value of money and the risks specific to the asset.
An impairment loss is recognized in the Consolidated Statements of Operations and Comprehensive Loss if the carrying amount of an asset or its CGU exceeds its estimated recoverable amount.
Impairment losses recognized in prior periods are assessed at each reporting date for any indications that the loss has decreased or no longer exists. An impairment loss on non-financial assets other than goodwill is reversed if there has been a change in the estimates used to determine the recoverable amount, only to the extent that the asset’s carrying amount does not exceed the carrying amount that would have been determined, net of amortization, if no impairment loss had been recognized.
Mining Interests - Open Pit Mining Costs
In open pit mining operations, it is necessary to remove overburden and other waste materials to access ore from which minerals can be extracted economically. The process of mining overburden and waste materials is referred to as stripping. Stripping costs generate a future economic benefit by providing (i) access to ore to be mined in the future; (ii) increases the fair value of the mine (or pit) as access to future mineral reserves becomes less costly; and (iii) increases the productive capacity or extends the productive life of the mine (or pit). For production phase stripping costs that are expected to generate a future economic benefit, the current period stripping costs are capitalized as open pit mine development costs.
Stripping costs incurred during the production stage of a pit are accounted for as costs of the inventory produced during the period that the stripping costs were incurred, unless these costs are expected to provide a future economic benefit.
Capitalized open pit mine development costs are depreciated once the open pit has entered production and the future economic benefit is being derived. Capitalized open pit mine development costs are depreciated using the unit of production method over the life of the ore body to which accessibility has been improved by the stripping activity.
Employee benefits
Defined contribution plans
A defined contribution plan is a post-employment benefit plan under which an entity pays fixed contributions into a separate entity and will have no legal or constructive obligation to pay further amounts. Obligations for contributions to defined contribution pension plans are recognized as an employee benefit expense in profit or loss in the periods during which services are rendered by employees. Prepaid contributions are recognized as an asset to the extent that a cash refund or a reduction in future payments is available. Contributions to a defined contribution plan that are due more than 12 months after the end of the period in which the employees render the service are discounted to their present value.
50
2012 Annual Report
North American Palladium Ltd.
Compensation Agreements
Share-based payment transactions
The grant date fair value of equity-classified share-based payment awards granted to employees is recognized as an employee expense, with a corresponding increase in equity, over the period that the employees unconditionally become entitled to the awards. The amount recognized as an expense is adjusted to reflect the number of awards for which the related service are expected to be met, such that the amount ultimately recognized as an expense is based on the number of awards that do meet the related service and non-market performance conditions at the vesting date.
The Company has a Restricted Share Unit (“RSU”) plan under which eligible directors, officers and key employees of the Company are entitled to receive awards of restricted share units. Each restricted share unit is equivalent in value to the fair market value of a common share of the Company on the date of the award and a corresponding liability is established on the balance sheet. The value of each award is charged to compensation expense over the period of vesting. At each reporting date, the compensation expense and liability are adjusted to reflect the changes in market value of the liability based on the fair values of RSU’s for each vesting period determined using the Black-Scholes model.
Share-based payment arrangements in which the Company receives goods or services as consideration for its own equity instruments are accounted for as equity-settled share-based payment transactions, regardless of how the equity instruments are obtained by the Company.
Provisions
A provision is recognized if, as a result of a past event, the Company has a present legal or constructive obligation that can be estimated reliably, and it is probable that an outflow of economic benefits will be required to settle the obligation. Provisions are determined by discounting the expected future cash flows at a pre-tax rate that reflects current market assessments of the time value of money and the risks specific to the liability.
| (a) | Production Obligations |
A provision for an obligation based on achieving specific production targets is recognized when the Company, based on estimates of recoverable minerals and planned production in the current mine plan for each property, determines the production target expected to be achieved.
| (b) | Asset Retirement Obligations |
In accordance with Company policies, asset retirement obligations relating to legal and constructive obligations for future site reclamation and closure of the Company’s mine sites are recognized when incurred and a liability and corresponding asset are recorded at management’s best estimate. Estimated closure and restoration costs are provided for in the accounting period when the obligation arising from the related disturbance occurs.
The amount of any liability recognized is estimated based on the risk-adjusted costs required to settle present obligations, discounted using a pre-tax risk-free discount rate consistent with the time period of expected cash flows. When the liability is initially recorded, a corresponding asset retirement cost is recognized as an addition to mining interests and amortized using the unit of production method.
The liability for each mine site is accreted over time and the accretion charges are recognized as a finance cost in the Consolidated Statements of Operations and Comprehensive Loss. The liability is subject to re-measurement at each reporting date based on changes in discount rates and timing or amounts of the costs to be incurred. Changes in the liability, other than accretion charges, relating to mine rehabilitation and restoration obligations, which are not the result of current production of inventory, are added to or deducted from the carrying value of the related asset retirement cost in the reporting period recognized. If the change results in a reduction of the obligation in excess of the carrying value of the related asset retirement cost, the excess balance is recognized as a recovery through profit or loss in the period.
51
2012 Annual Report
North American Palladium Ltd.
Revenue and Accounts Receivable
Revenue from the sale of metals in the course of ordinary activities is measured at the fair value of the consideration received or receivable, net of volume adjustments. Revenue is recognized when persuasive evidence exists, usually in the form of an executed sales agreement, that the significant risks and rewards of ownership have been transferred to the buyer, recovery of the consideration is probable, the associated costs and possible return of goods can be estimated reliably, there is no continuing management involvement with the goods, and the amount of revenue can be measured reliably. The timing of the transfers of risks and rewards varies depending on the individual terms of the contract of sale.
Revenue from the sale of palladium and by-product metals from the LDI mine is provisionally recognized based on quoted market prices upon the delivery of concentrate to the smelter or designated shipping point, which is when title transfers and significant rights and obligations of ownership pass. The Company’s smelter contracts provide for final prices to be determined by quoted market prices in a period subsequent to the date of concentrate delivery. Variations from the provisionally priced sales are recognized as revenue adjustments until final pricing is determined. Accounts receivable is recorded net of estimated treatment and refining costs which are subject to final assay adjustments. Subsequent adjustments to provisional pricing amounts due to changes in metal prices and foreign exchange are included in revenues on the Consolidated Statements of Operations and Comprehensive Loss and disclosed in the notes to the consolidated financial statements.
Prior to its closure, revenue from the sale of gold-silver doré bars from Sleeping Giant was recognized when the significant risks and rewards of ownership have transferred to the buyer and selling prices are known or can be reasonably estimated.
Interest expense and other costs and other income
Other income is comprised of interest income on funds invested (including available-for-sale financial assets), gains on the disposal of available-for-sale financial assets, gains on the renouncement of flow-through expenditures, changes in the fair value of financial assets at fair value through profit or loss, and gains on hedging instruments that are recognized in profit or loss. Interest income is recognized as it accrues in profit or loss, using the effective interest method.
Interest expense and other costs are comprised of interest expense on borrowings, accretion expense, unwinding of the discount on provisions, changes in the fair value of financial assets at fair value through profit or loss, impairment losses recognized on financial assets, losses on hedging instruments that are recognized in profit or loss, and changes in the fair value of the palladium warrants. Borrowing costs that are not directly attributable to the acquisition, construction or production of a qualifying asset are recognized in profit or loss using the effective interest method.
Foreign currency gains and losses are reported on a net basis.
Income and mining taxes
Income tax expense is comprised of current and deferred tax. Current tax and deferred tax are recognized in profit or loss except to the extent that it relates to a business combination, or items recognized directly in equity or in other comprehensive income.
Current tax is the expected tax payable or receivable on the taxable income or loss for the year, using tax rates enacted or substantively enacted at the reporting date, and any adjustment to tax payable in respect of previous years.
52
2012 Annual Report
North American Palladium Ltd.
Deferred tax is recognized in respect of temporary differences between the carrying amounts of assets and liabilities for financial reporting purposes and the amounts used for taxation purposes. Deferred tax is not recognized for the following temporary differences:
| (i) | the initial recognition of assets or liabilities in a transaction that is not a business combination and that affects neither accounting nor taxable profit or loss; |
| (ii) | temporary differences relating to investments in subsidiaries and jointly controlled entities to the extent that it is probable that they will not reverse in the foreseeable future; and |
| (iii) | temporary differences arising on the initial recognition of goodwill. |
Deferred tax is measured at the tax rates that are expected to be applied to temporary differences when they reverse, based on the laws that have been enacted or substantively enacted by the reporting date.
Deferred tax assets and liabilities are offset if there is a legally enforceable right to offset current tax liabilities and assets, and they relate to income or mining taxes levied by the same tax authority on the same taxable entity, or on different tax entities, but they intend to settle current tax liabilities and assets on a net basis or their tax assets and liabilities will be realized simultaneously.
A deferred tax asset is recognized for unused tax losses, tax credits and deductible temporary differences, to the extent that it is probable that future taxable profits will be available against which they can be utilized. Deferred tax assets are reviewed at each reporting date and are reduced to the extent that it is no longer probable that the related tax benefit will be realized.
Basic and Diluted Earnings (Loss) Per Share
Basic earnings (loss) per common share (“EPS”) is computed by dividing the income (loss) for the period by the weighted average number of common shares outstanding during the reporting period.
Diluted EPS is computed using the treasury stock method whereby the weighted average number of shares outstanding is increased to include additional common shares from the assumed exercise of stock options, convertible debentures, palladium warrants and common share purchase warrants, if dilutive. The number of additional common shares is calculated by assuming that outstanding equity instruments were exercised and that proceeds from such exercises were used to acquire shares of common stock at the average market price during the reporting period. These common equivalent shares are not included in the calculation of the weighted average number of shares outstanding for diluted loss per common share when the effect would be anti-dilutive.
For convertible financial instruments classified as debt, the consolidated comprehensive net income (loss) is adjusted to reflect the profit or loss which would have been reported in the period if the debt instrument had been converted immediately at the beginning of the period. These adjustments to profit or loss and the equivalent shares realizable on conversion are not included in the diluted earnings per share calculation when the effect would be anti-dilutive.
Flow-Through Shares
The Company finances a portion of its exploration activities through the issuance of flow-through shares. On the date of issuance of the flow-through shares, the premium relating to the proceeds received in excess of the closing market price of the Company’s common shares is allocated to liabilities.
Under the terms of the flow-through common share issues, the tax attributes of the related expenditures are renounced to investors and deferred income tax expense and deferred tax liabilities are increased by the estimated income tax benefits renounced by the Company to the investors. The premium liability is reduced pro-rata based on the actual amount of flow-through eligible expenditures incurred during the reporting period. The reduction to the premium is recognized through profit or loss as other income.
53
2012 Annual Report
North American Palladium Ltd.
Segment Reporting
An operating segment is a component of the Company that engages in business activities from which it may earn revenues and incur expenses, including revenues and expenses that relate to transactions with any of the Company’s other components. All operating segments’ operating results are reviewed regularly by the Company’s executive team to make decisions about resources to be allocated to the segment and assess its performance, and for which discrete financial information is available.
Segment results that are reported to the executive team include items directly attributable to a segment as well as those that can be allocated on a reasonable basis. Unallocated items comprise mainly corporate assets (primarily the Company’s headquarters), head office expenses, and deferred tax assets and liabilities.
Segment capital expenditures are the total costs incurred during the period to acquire property, plant and equipment, and goodwill.
Adoption of New Accounting Standards
The following new accounting standards have been adopted by the Company.
IFRS 7 Financial Instruments: Disclosures
The amendments to IFRS 7 require disclosure of information that enables users of financial statements to understand the relationship between transferred financial assets that are not derecognized in their entirety and the associated liabilities; and to evaluate the nature of, and risks associated with, the entity’s continuing involvement in derecognized financial assets. This update is effective for years beginning on or after July 1, 2011. Where applicable, disclosures in these consolidated financial statements have been prepared in accordance with the Company’s adoption of this standard.
New standards and interpretations not yet adopted
The following new standards, amendments to standards and interpretations are not yet effective for the year ended December 31, 2012 or have otherwise not yet been adopted by the Company. The Company is evaluating the impact, if any, adoption of the standards will have on the disclosures in the Company’s consolidated financial statements:
IFRS 9 Financial Instruments: Classification and Measurement
This is the first part of a new standard on classification and measurement of financial assets that will replace IAS 39, Financial Instruments: Recognition and Measurement. IFRS 9 has two measurement categories: amortized cost and fair value. All equity instruments are measured at fair value. A debt instrument is at amortized cost only if the entity is holding it to collect contractual cash flows and the cash flows represent principal and interest. Otherwise, it is at fair value through profit or loss. An update to IFRS 9 includes guidance on financial liabilities and derecognition of financial instruments. This standard and the related update are effective for years beginning on or after January 1, 2015. This amendment is presently not expected to impact the consolidated financial statements of the Company.
IAS 1 Presentation of Financial Statements
This standard is amended to change the disclosure of items presented in other comprehensive income (“OCI”), including a requirement to separate items presented in OCI into two groups based on whether or not they may be recycled to profit or loss in the future. The amendment is effective for reporting years beginning on or after July 1, 2012. This amendment is presently not expected to impact the consolidated financial statements of the Company.
IAS 19 Employee Benefits
The standard is amended to reflect significant changes to recognition and measurement of defined benefit pension expense and termination benefits, and provides expanded disclosure requirements. The amendment is effective for
54
2012 Annual Report
North American Palladium Ltd.
annual periods beginning on or after January 1, 2013. This amendment is presently not expected to impact the consolidated financial statements of the Company.
IAS 32 Financial Instruments: Presentation
This standard is amended to clarify requirements for offsetting of financial assets and financial liabilities. The amendment is effective for annual periods beginning on or after January 1, 2014. Management is evaluating the impact, if any, the adoption of this amendment to IAS 32 will have on the disclosures in its consolidated financial statements.
New Standards Addressing the Scope of a Reporting Entity
The following IFRS standards are introduced and IAS standards amended accordingly, for which the Company is evaluating the impact, if any, adoption of the standards will have on the disclosures in the Company’s consolidated financial statements:
IFRS 10 Consolidated Financial Statements
This standard replaces the guidance on control and consolidation in IAS 27, Consolidated and Separate Financial Statements, and SIC-12, Consolidation – Special Purpose Entities. IFRS 10 changes the definition of control under IFRS so that the same criteria are applied to all entities to determine control.
IFRS 11 Joint Arrangements
This standard replaces IAS 31, Interests in Joint Ventures. IFRS 11 reduces the types of joint arrangements to two: joint ventures and joint operations. IFRS 11 requires the use of equity accounting for interests in joint ventures, eliminating the existing policy choice of proportionate consolidation for jointly controlled entities under IAS 31. Entities that participate in joint operations will follow accounting much like that for jointly controlled assets and jointly controlled operations under IAS 31.
IFRS 12 Disclosures of Interests in Other Entities
This standard sets out the disclosure requirements for entities reporting under IFRS 10 and IFRS 11, and replaces the disclosure requirements currently found in IAS 28, Investments in Associates.
IAS 27 Consolidated and Separate Financial Statements
This standard is renamed “Separate Financial Statements” and deals solely with separate financial statements, the guidance for which remains unchanged.
All above standards and amendments are effective for reporting years beginning on or after January 1, 2013.
IFRS 10 Consolidated Financial Statements, IFRS 11 Joint Arrangements, IFRS 12 Disclosure of Interests in Other Entities, IAS 27 Consolidated and Separate Financial Statements
IFRS 10, IFRS 11, IFRS 12, and IAS 27 have been amended to clarify the date of initial application of IFRS 10 and require certain disclosures under IFRS 12 on transition. The standards, as amended, are effective for years beginning on or after January 1, 2013. This amendment is presently not expected to impact the consolidated financial statements of the Company.
IFRS 13 Fair Value Measurement
The new standard provides a single source of guidance on how to measure fair value where its use is already required or permitted by other IFRS and enhances disclosure requirements for information about fair value measurements. The standard is effective for reporting years beginning on or after January 1, 2013.
55
2012 Annual Report
North American Palladium Ltd.
IFRIC 20 - Stripping Costs in the Production Phase of a Surface Mine
On October 20, 2011, the IASB issued a new interpretation, IFRIC 20, to address accounting issues regarding waste removal costs incurred in surface mining activities during the production phase of a mine, referred to as production stripping costs. The new interpretation addresses the classification and measurement of production stripping costs as either inventory or as a tangible or intangible non-current ‘stripping activity asset’. The standard also provides guidance for the depreciation or amortization and impairment of such assets.
IFRIC 20 is effective for reporting years beginning on or after January 1, 2013, although earlier application is permitted. This amendment is presently not expected to impact the consolidated financial statements of the Company.
4. DISCONTINUED OPERATIONS AND ASSETS HELD FOR SALE
The Company is in the process of disposing of its interest in its gold division through the disposal of all of the shares of its wholly-owned subsidiary NAP Quebec or sale of the related net assets. At December 31, 2012, management was committed to a plan to sell the gold division and an active program to locate a buyer and complete the plan had been initiated. The Company expects to complete the sale of NAP Quebec during 2013. As a result, the Company has presented the consolidated financial statements to segregate discontinued operations and related financial assets and liabilities held for sale from those balances relating to the Company’s continuing operations as at December 31, 2012.
Assets and liabilities held for sale
The carrying values of the major classes of assets and liabilities included as part of NAP Quebec on the consolidated balance sheet were reclassified as assets and liabilities of a disposal group classified as held for sale as at December 31, 2012. The balances reported consist of the following:
| At December 31 | ||||
| 2012 | ||||
Assets of a disposal group classified as held for sale | ||||
| Cash and cash equivalents | $ 553 | |||
Taxes receivable | 4,522 | |||
Inventories | 7,257 | |||
Other current assets | 770 | |||
Mining Interests | 16,712 | |||
| $ 29,814 | ||||
Liabilities of a disposal group classified as held for sale | ||||
Accounts payable and accrued liabilities | $ 5,908 | |||
Obligations under finance leases | 58 | |||
Asset retirement obligation | 6,105 | |||
| $ 12,071 | ||||
At December 31, 2012, the Company tested the gold division for impairment using the fair value of the expected purchase consideration less cost to sell as the recoverable amount. In performing the impairment test, the Company concluded that the recoverable amount of the gold division was lower than the carrying value. As a result, the Company has recognized an impairment loss of $56.0 million for the year ended December 31, 2012. Refer to note 8 for details.
56
2012 Annual Report
North American Palladium Ltd.
Net loss from discontinued operations
Loss and comprehensive loss related to NAP Quebec have been segregated from continuing operations. Loss from discontinued operations consists of the following:
| Note | 2012 | 2011 | ||||||||||
Revenue | $ 3,004 | $ 26,813 | ||||||||||
Mining operating expenses | ||||||||||||
Production costs | 2,153 | 31,601 | ||||||||||
Smelting, refining and freight costs | 16 | 54 | ||||||||||
Depreciation and amortization | 199 | 7,460 | ||||||||||
Gold assets impairment charge | 56,023 | 49,210 | ||||||||||
Gain on disposal of equipment | (435 | ) | (27 | ) | ||||||||
Gold mine closure, care and maintenance costs | 1,463 | - | ||||||||||
Total mining operating expenses | 59,419 | 88,298 | ||||||||||
Loss from mining operations | (56,415 | ) | (61,485 | ) | ||||||||
Other expenses | ||||||||||||
Exploration | 2,768 | 6,728 | ||||||||||
General and administration | 62 | 82 | ||||||||||
Other income | (37 | ) | (34 | ) | ||||||||
Interest expense and other costs | 130 | 111 | ||||||||||
Total other expenses | 2,923 | 6,887 | ||||||||||
Loss before taxes | (59,338 | ) | (68,372 | ) | ||||||||
Income and mining tax recovery (expense) | 22 | 4,704 | (1,174 | ) | ||||||||
Loss and comprehensive loss for the year | $ (54,634 | ) | $ (69,546 | ) | ||||||||
Cash flows from discontinued operations
Cash flows related to NAP Quebec have been segregated from continuing operations. Net cash flows provided by (used in) discontinued operations consist of the following:
| 2012 | 2011 | |||||||
Cash flow provided by (used in): | ||||||||
Operations | $ (7,742 | ) | $ (12,529 | ) | ||||
Financing | (160 | ) | 1,724 | |||||
Investing | (23,399 | ) | (37,276 | ) | ||||
Net cash used in discontinued operations | $ (31,301 | ) | $ (48,081 | ) | ||||
57
2012 Annual Report
North American Palladium Ltd.
5. ACCOUNTS RECEIVABLE
Accounts receivable consist of the following:
| At December 31 2012 | At December 31 2011 | |||||||
Accounts receivable | $ 53,922 | $ 71,097 | ||||||
Unrealized gain on financial contracts1 | - | 1,951 | ||||||
Accounts receivable | $ 53,922 | $ 73,048 | ||||||
| 1 | As at December 31, 2012, a total of 55,000 ounces of past palladium production delivered and sold to a smelter, was priced using forward prices for the month of final settlement at an average price of $640 per ounce of palladium (December 31, 2011 – 69,500 ounces of palladium at an average price of $697 per ounce). Refer to notes 10 and 16. |
Accounts receivable represents the value of all platinum group metals (“PGMs”), gold and certain base metals contained in LDI’s concentrate shipped for smelting and refining, using the December 31, 2012 forward metal prices for the month of final settlement, and for which significant risks and rewards have transferred to third parties.
All of the accounts receivable are due from three customers at December 31, 2012 (December 31, 2011 – two customers). A reserve for doubtful accounts has not been established, as in the opinion of management, the amount due will be fully collected. The Company is not economically dependent on its customers, refer to note 16.
Accounts receivable have been pledged as security against a one-year US$60.0 million credit facility with a Canadian chartered bank, which is to be used for working capital liquidity and general corporate purposes. Under the credit facility, the Company utilized US$17.3 million for letters of credit primarily for reclamation deposits and has taken a drawdown of US$15.2 million ($15.1 million), leaving US$27.5 million available at December 31, 2012.
6. INVENTORIES
Inventories consist of the following:
| At December 31 2012 | At December 31 2011 | |||||||
Supplies1 | $ 10,633 | $ 11,209 | ||||||
Gold inventory1,2 | - | 6,068 | ||||||
Concentrate inventory | 1,587 | 141 | ||||||
Crushed and broken ore stockpiles1,3 | 3,168 | 2,628 | ||||||
Total | $ 15,388 | $ 20,046 | ||||||
| 1 | For 2012, gold and supplies inventory relating to discontinued operations amounting to $7,257 has been reclassified as held for sale. Refer to note 4. |
| 2 | Gold inventory is comprised of unprocessed ore either in stockpiles or bins, unrecovered gold in either carbon or solution within the milling circuit, and gold-silver doré bars produced but not sold as at the reporting date. |
| 3 | Crushed and broken ore stockpiles represent coarse ore that has been extracted from the mine and is available for further processing. The amount of ore stockpiles that is not expected to be processed within one year, if any, is shown as a long-term asset. |
All inventory amounts are carried at cost for the periods presented with the exception of gold inventories which are written down to net realizable value.
Supplies inventory of $27,604 were recognized as an expense during the year ended December 31, 2012 (2011 – $24,111).
The company recognized a write-down of obsolete supplies inventory of $nil for the year ended December 31, 2012 (2011 – $1,352).
58
2012 Annual Report
North American Palladium Ltd.
7. OTHER ASSETS
| Other assets consist of the following: | ||||||||
| | At December 31 2012 | | | At December 31 2011 | | |||
Prepaids1 | $ 1,375 | $ 695 | ||||||
Sales taxes receivable1 | 7,065 | 8,501 | ||||||
Receivable from Ministry of Natural Resources2 | - | 1,769 | ||||||
Other1 | 8 | 290 | ||||||
| $ 8,448 | $ 11,255 | |||||||
| 1 | For 2012, other assets relating to discontinued operations amounting to $5,292 have been reclassified as held for sale . Refer to note 4. |
| 2 | In 2011, the Company issued a letter of credit related to the Sleeping Giant mine and mill closure plan, replacing the mine closure deposit. The Ministry of Natural Resources acknowledged receipt of the letter of credit in 2011 and the cash proceeds were received in the first quarter of 2012. |
59
2012 Annual Report
North American Palladium Ltd.
8. MINING INTERESTS
Mining interests are comprised of the following:
| Plant and equipment | Underground mine development1 | Equipment under finance lease2 | Mining leases and claims, royalty interest, and development | Exploration properties | Total | |||||||||||||||||||
Cost or deemed cost | ||||||||||||||||||||||||
Balance at January 1, 2011 | $ 38,469 | $ 73,214 | $ 4,951 | $ 8,679 | $ 21,873 | $ 147,186 | ||||||||||||||||||
Additions of physical assets – continuing operations | 6,164 | 135,358 | 3,669 | 5,429 | - | 150,620 | ||||||||||||||||||
Additions of physical assets – discontinued operations | 2,133 | 6,981 | 274 | - | 28,507 | 37,895 | ||||||||||||||||||
Revaluation of ARO assets – continuing operations | 5,717 | - | - | - | - | 5,717 | ||||||||||||||||||
Revaluation of ARO assets – discontinued operations | 21 | - | - | - | - | 21 | ||||||||||||||||||
Capitalization of borrowing costs | - | 1,574 | - | - | - | 1,574 | ||||||||||||||||||
Reclassification of costs for finance leases maturing in the year | - | 1,510 | (1,510 | ) | - | - | - | |||||||||||||||||
Disposals – continuing operations | (1,419 | ) | (150 | ) | - | - | - | (1,569 | ) | |||||||||||||||
Disposals – discontinued operations | (22 | ) | - | - | - | - | (22 | ) | ||||||||||||||||
Balance at December 31, 2011 | $ 51,063 | $ 218,487 | $ 7,384 | $ 14,108 | $ 50,380 | $ 341,422 | ||||||||||||||||||
Balance at January 1, 2012 | $ 51,063 | $ 218,487 | $ 7,384 | $ 14,108 | $ 50,380 | $ 341,422 | ||||||||||||||||||
Additions of physical assets – continuing operations | 12,613 | 131,580 | 12,504 | 1,645 | - | 158,342 | ||||||||||||||||||
Additions of physical assets – discontinued operations | 381 | 68 | 669 | - | 26,955 | 28,073 | ||||||||||||||||||
Revaluation of ARO assets – continuing operations | 1,047 | - | - | - | - | 1,047 | ||||||||||||||||||
Revaluation of ARO assets – discontinued operations | 483 | - | - | - | - | 483 | ||||||||||||||||||
Capitalization of borrowing costs | - | 7,999 | - | - | - | 7,999 | ||||||||||||||||||
Reclassification of costs for finance leases maturing in the year | - | (361 | ) | 408 | - | - | 47 | |||||||||||||||||
Other reclassifications – discontinued operations | 363 | - | (60 | ) | - | (293 | ) | 10 | ||||||||||||||||
Disposals – continuing operations | (4,292 | ) | (12,654 | ) | (500 | ) | - | - | (17,446 | ) | ||||||||||||||
Transfer of disposal group classified as held for sale | (13,047 | ) | (45,926 | ) | (909 | ) | (1,000 | ) | (77,042 | ) | (137,924 | ) | ||||||||||||
Balance at December 31, 2012 | $ 48,611 | $ 299,193 | $ 19,496 | $ 14,753 | $ - | $ 382,053 | ||||||||||||||||||
60
2012 Annual Report
North American Palladium Ltd.
| Plant and equipment | Underground mine development1 | Equipment under finance lease2 | Mining leases and claims, royalty interest, and development | Exploration properties | Total | |||||||||||||||||||
Depreciation and impairment losses | ||||||||||||||||||||||||
| Balance at January 1, 2011 | $ 9,072 | $ 9,937 | $ 462 | $ 1,429 | $ - | $ 20,900 | ||||||||||||||||||
Depreciation for the period – continuing operations | 2,453 | 6,128 | 707 | 855 | - | 10,143 | ||||||||||||||||||
Depreciation for the period – discontinued operations | 2,129 | 5,101 | 79 | 146 | - | 7,455 | ||||||||||||||||||
Impairment loss – discontinued operations | 1,674 | 33,568 | - | 480 | 11,673 | 47,395 | ||||||||||||||||||
Disposals – continuing operations | (469 | ) | (150 | ) | - | - | - | (619 | ) | |||||||||||||||
Disposals – discontinued operations | (11 | ) | - | - | - | - | (11 | ) | ||||||||||||||||
Balance at December 31, 2011 | $ 14,848 | $ 54,584 | $ 1,248 | $ 2,910 | $ 11,673 | $ 85,263 | ||||||||||||||||||
Balance at January 1, 2012 | $ 14,848 | $ 54,584 | $ 1,248 | $ 2,910 | $ 11,673 | $ 85,263 | ||||||||||||||||||
Depreciation for the period – continuing operations | 3,404 | 13,160 | 2,854 | 1,064 | - | 20,482 | ||||||||||||||||||
Depreciation for the period – discontinued operations | 160 | 22 | 17 | - | - | 199 | ||||||||||||||||||
Impairment loss – discontinued operations | - | - | - | - | 56,023 | 56,023 | ||||||||||||||||||
Reclassification of costs for finance leases maturing in the year | - | 18 | (18 | ) | - | - | - | |||||||||||||||||
Other reclassifications – discontinued operations | 11 | - | (60 | ) | 60 | 54 | 65 | |||||||||||||||||
Disposals – continuing operations | (251 | ) | (1,936 | ) | (71 | ) | - | - | (2,258 | ) | ||||||||||||||
Disposals – discontinued operations | - | - | - | - | - | - | ||||||||||||||||||
Transfer of disposal group classified as held for sale | (6,883 | ) | (45,538 | ) | (42 | ) | (1,000 | ) | (67,750 | ) | (121,213 | ) | ||||||||||||
Balance at December 31, 2012 | $ 11,289 | $ 20,310 | $ 3,928 | $ 3,034 | $ - | $ 38,561 | ||||||||||||||||||
Carrying amounts | ||||||||||||||||||||||||
As at December 31, 2011 | $ 36,215 | $ 163,903 | $ 6,136 | $ 11,198 | $ 38,707 | $ 256,159 | ||||||||||||||||||
As at December 31, 2012 | $ 37,322 | $ 278,883 | $ 15,568 | $ 11,719 | $ - | $ 343,492 | ||||||||||||||||||
61
2012 Annual Report
North American Palladium Ltd.
| 1 | For year ended December 31, 2012, $7,999 (2011 - $1,573) of interest costs on long-term debt was capitalized to mining interests. |
| 2 | In 2012, the Company established a $15.0 million lease facility to fund equipment for the LDI mine expansion, of which $14.1 million ($9.8 million, net of repayments) had been utilized as at December 31, 2012 for finance leases. The Company entered into this leasing arrangement by way of a sale-leaseback as the equipment had been previously purchased. As the equipment had a net book value of $10.5 million, the net amount of $0.8 million has been included in Obligations under finance leases, to be amortized over the 5 year lease term as a credit to Depreciation and amortization. Refer to note 11. |
Gold assets impairment charge
The Company announced on January 17, 2012 that it is discontinuing production at the Sleeping Giant mine.
After reviewing various mining scenarios, the Company concluded that mining would likely continue at high costs given the lack of grade continuity, with insufficient operating margin to justify continuing operations. The Company has therefore ceased mining operations at Sleeping Giant and has restructured the gold division, resulting in a non-cash impairment charge on its gold assets of $49.2 million for the year ended December 31, 2011.
At December 31, 2012, the Company tested the gold division for impairment using the fair value of the expected purchase consideration less cost to sell as the recoverable amount. In performing the impairment test, the Company concluded that the recoverable amount of the gold division was lower than the carrying value. As a result, the Company has recognized an impairment loss of $56.0 million for the year ended December 31, 2012. Refer to note 4 for details.
Asset restrictions and contractual commitments
The Company’s assets are subject to certain restrictions on title and property, plant and equipment. Certain assets are pledged as security for credit agreement arrangements and senior secured lenders.
9. ASSET RETIREMENT OBLIGATIONS AND RECLAMATION DEPOSITS
At December 31, 2012, the changes in asset retirement and the related mine restoration deposit are as follows:
At December 31 | ||||
| 2012 | ||||
Asset retirement obligation, beginning of period | $ 20,881 | |||
Change in discount rate and estimated closure costs (note 8) | 1,530 | |||
Asset retirement amounts paid | (1,448 | ) | ||
Accretion expense | 356 | |||
Asset retirement obligation, end of period | $ 21,319 | |||
Transfer discontinued operations to held for sale (note 4) | (6,105 | ) | ||
Asset retirement obligation, end of period – continuing operations | $ 15,214 | |||
62
2012 Annual Report
North American Palladium Ltd.
| Property | Expected timing of cash flows | Asset retirement obligation | Mine closure plan requirement | Letter of credit outstanding | Undiscounted retirement | |||||||||||||||
Continuing Operations: | ||||||||||||||||||||
LDI mine | 2020 | $ 15,214 | $ 14,055 | $ 14,055 | $ 17,335 | |||||||||||||||
Discontinued Operations: | ||||||||||||||||||||
Sleeping Giant mill1,2 | 2021 | $ 4,982 | $ 1,920 | $ 1,880 | $ 5,803 | |||||||||||||||
Sleeping Giant mine1,2 | 2013 | 668 | - | - | 668 | |||||||||||||||
Vezza gold mine1,2 | 2021 | 455 | - | - | 533 | |||||||||||||||
| $ 6,105 | $ 1,920 | $ 1,880 | $ 7,004 | |||||||||||||||||
| 1 | The asset retirement obligations relating to discontinued operations have been reclassified as held for sale at December 31, 2012. Refer to Note 4. |
| 2 | The mine closure plan requirement and the letter of credit outstanding for the Sleeping Giant mill are inclusive of the requirements for the Sleeping Giant mine and the Vezza gold mine. Including a letter of credit for Shebandown West project, the total letters of credit outstanding are $16.3 million. |
Asset retirement obligations are comprised of the following as at December 31, 2011:
| Property | Expected timing of cash flows | Asset retirement obligation | Mine closure plan | Letter of credit | Undiscounted asset retirement obligation | |||||||||||||||
LDI mine | 2020 | $ 13,905 | $ 12,997 | $ 8,466 | $ 16,312 | |||||||||||||||
Sleeping Giant mill1 | 2021 | 4,426 | 1,920 | 1,769 | 5,360 | |||||||||||||||
Sleeping Giant mine1 | 2012 | 2,116 | - | - | 1,448 | |||||||||||||||
Vezza gold mine1 | 2021 | 434 | - | - | 533 | |||||||||||||||
| $ 20,881 | $ 14,917 | $ 10,235 | $ 23,653 | |||||||||||||||||
| 1 | The mine closure plan requirement and the letter of credit outstanding for the Sleeping Giant mill are inclusive of the requirements for the Sleeping Giant mine and the Vezza gold mine. Including a letter of credit for Shebandowan West project, the total letters of credit outstanding are $10.6 million. |
The key assumptions applied for determination of the ARO obligation are as follows as at:
| At December 31 | At December 31 | |||||||
| 2012 | 2011 | |||||||
Continuing Operations: | ||||||||
Inflation | 2.00 | 2.00 | ||||||
Market risk | 5.00 | 5.00 | ||||||
Discount rate | 1.63 | 1.84 | ||||||
Discontinued Operations1: | ||||||||
Inflation | 2.00 | 2.00 | ||||||
Market risk | 5.00 | 5.00 | ||||||
Discount rate | 1.71 | 1.93 | ||||||
| 1 | Comparative data for the key assumptions applied, at December 31, 2011, relating to discontinued operations is provided for information purposes. The comparative assumptions for discontinued operations are included in the weighted-average rates shown for continuing operations at December 31, 2011. |
63
2012 Annual Report
North American Palladium Ltd.
The asset retirement obligation may change materially based on future changes in operations, costs of reclamation and closure activities, and regulatory requirements. During the period, the mine closure obligations were revised to reflect the Company’s most current closure cost estimates, expected mine lives and market rate assumptions.
10. ACCOUNTS PAYABLE AND ACCRUED LIABILITIES
Accounts payable and accrued liabilities are comprised of:
| At December 31 | At December 31 | |||||||
| 2012 | 2011 | |||||||
Accounts payable and accrued liabilities1 | $ 55,238 | $ 42,436 | ||||||
Unrealized loss on financial contracts2 | 3,236 | - | ||||||
Accounts payable and accrued liabilities | $ 58,474 | $ 42,436 | ||||||
| 1 | For 2012, accounts payable and accrued liabilities relating to discontinued operations amounting to $5,908 has been reclassified as held for sale. Refer to note 4. |
| 2 | As at December 31, 2012, a total of 55,000 ounces of past palladium production that had been delivered and sold to a smelter, was priced using forward prices for the month of final settlement at an average price of $640 per ounce (December 31, 2011 – 69,500 ounces at an average price of $697 per ounce). Refer to notes 5 and 16. |
11. LEASES
At the respective reporting dates, the Company was party to the following lease arrangements:
FINANCE LEASES (OBLIGATIONS UNDER FINANCE LEASES)
The Company leases production equipment under a number of finance lease agreements. Some leases provide the Company with the option to purchase the equipment at a beneficial price. The leased equipment secures the lease obligations. The net carrying amount of leased plant and equipment at each reporting date is summarized in Note 8 under the category of equipment under finance leases.
The following is a schedule of future minimum lease payments under finance leases together with the present value of the net minimum lease payments at each reporting date:
| December 31, 2012 | December 31, 2011 | |||||||||||||||||||||||
| | Future minimum lease payments | | Interest | | Present value of minimum lease payments | | | Future minimum lease payments | | Interest | | Present value of minimum lease payments | | |||||||||||
Less than one year | $ 4,374 | $ 657 | $3,717 | $ 2,677 | $ 249 | $ 2,428 | ||||||||||||||||||
Between one and five years | 10,963 | 1,007 | 9,956 | 2,228 | 124 | 2,104 | ||||||||||||||||||
| $ 15,337 | $ 1,664 | $13,673 | $ 4,905 | $ 373 | $ 4,532 | |||||||||||||||||||
Less current portion | 3,717 | 2,428 | ||||||||||||||||||||||
| $9,956 | $ 2,104 | |||||||||||||||||||||||
During 2012, the Company established a $15.0 million finance lease facility to fund equipment for the LDI mine expansion, of which $14.1 million ($9.8 million, net of repayments) had been utilized as at December 31, 2012. The Company entered into this leasing arrangement by way of a sale-leaseback as the equipment had been previously purchased. As the equipment had a net book value of $10.5 million, the net amount of $0.8 million has been included in Obligations under finance leases, to be amortized over the 5 year lease term as a credit to Depreciation and amortization. See note 8.
64
2012 Annual Report
North American Palladium Ltd.
OPERATING LEASES
The Company, from time to time, enters into leasing arrangements for production and other equipment under a number of operating leases. These leases are generally short-term in nature and subject to cancellation clauses. The Company periodically reviews the nature of these leases to identify if there have been any significant changes to the terms and use of the items under operating lease which would require reclassification as a finance lease. Such changes are considered to indicate a renewal of the lease terms and the reclassification is applied prospectively from the date the revised lease terms become effective.
The following schedule provides the future minimum lease payments under non-cancellable operating leases outstanding at each of the reporting dates:
| At December 31 | At December 31 | |||||||
| 2012 | 2011 | |||||||
Less than one year | $ 2,761 | $ 3,783 | ||||||
Between one and five years | 3,960 | 2,918 | ||||||
More than five years | - | 193 | ||||||
| $ 6,721 | $ 6,894 | |||||||
The total minimum lease payments recognized in expense during each of the stated year end periods are as follows:
| December 31 | December 31 | |||||||
| 2012 | 2011 | |||||||
Minimum lease payments expensed | $ 1,483 | $ 3,631 | ||||||
12. PROVISIONS
In conjunction with the acquisition of Cadiscor Resources Inc. in 2009, the Company assumed an obligation in the amount of $1.0 million, payable in cash or by the issuance of common shares of the Company, upon achieving a specified production target of 300,000 milled tonnes of ore at its Sleeping Giant mill. Based on production results, the Company achieved the production target in the last quarter of 2012 with settlement to occur in the first quarter of 2013.
13. LONG-TERM DEBT
Long-term debt is comprised of the following as at each reporting date:
| At December 31 | At December 31 | |||||||
| 2012 | 2011 | |||||||
Senior secured notes | $ 67,211 | $ 65,698 | ||||||
Convertible debentures | 34,422 | - | ||||||
| $ 101,633 | $ 65,698 | |||||||
Senior secured notes
During the fourth quarter of 2011, the Company issued $72.0 million of senior secured notes by way of a private placement for net proceeds of $69.6 million. The notes, which mature on October 4, 2014, with a one year extension at the option of the Company, were issued in $1,000 denominations and bear interest at a rate of 9.25% per year, payable semi-annually.
In addition to the senior secured notes, the debt agreement included the debt financing and embedded derivatives relating to the warrants, warrants settlement, and extension options relating to the notes which are available to the Company and the lender. Where applicable, the embedded derivatives which were not closely related to the debt financings were segregated and grouped for valuation and reporting purposes. Transaction costs were allocated to the debt financing on a pro-rata basis of assigned fair value at the initial recognition date of October 4, 2011. The net value of the debt is amortized using the effective interest rate method over the remaining term of the debt with interest and accretion charges being recognized through profit and loss in the period incurred. Interest charges have been capitalized as borrowing costs and included in mining interests (note 8). An effective interest rate of 13% has been applied.
65
2012 Annual Report
North American Palladium Ltd.
The embedded derivatives relating to the debt financing are recorded at fair value through profit or loss at each reporting date. At December 31, 2012 and December 31, 2011, the warrants and related options were valued using a binomial model which included with the following key assumptions:
|
| December 31 2012 |
|
| December 31 2011 |
| |||
Market price of palladium | $ 699 | $ 636 | ||||||
Strike price | $ 620 | $ 620 | ||||||
Volatility1 | 30 | % | 43 | % | ||||
Risk free rate | 1.14 | % | 0.98 | % | ||||
Expected life (in years) | 1.76 | 2.76 |
1 Expected volatility is estimated by considering historic average palladium price volatility based on the remaining life of the warrants.
The value of the derivative liability is $4.0 million at December 31, 2012 ($4.9 million – December 31, 2011).
Convertible Debentures
On July 31, 2012, the Company completed an offering of 43,000 convertible unsecured subordinated debentures of the Company at a price of $1,000 per debenture, for total gross proceeds of $43.0 million ($40.8 million net proceeds). The debentures mature on September 30, 2017 and bear interest at a rate of 6.15% per year, payable semi-annually. At the option of the holder, the debentures may be converted into common shares of the Company at any time prior to maturity at a conversion price of $2.90 per common share.
The convertible debentures are compound financial instruments, consisting of the debt instrument and the equity conversion feature. The debt instrument was valued at amortized cost using the effective interest rate method at a discount rate of 10.5%. The excess of the proceeds of $43.0 million over the value assigned to the debt instrument was allocated as the fair value of the equity component of the convertible debentures. Transaction costs were netted against the debt instrument and equity component based on the pro-rata allocation of the fair value of each instrument at initial recognition.
Of the net proceeds of $40.8 million, $33.9 million has been allocated to long-term debt, and the remaining portion of $6.9 million has been allocated to the equity component of the convertible debentures at the time of issuance.
| 14. | RELATED PARTY TRANSACTIONS |
At the respective reporting dates, the Company’s subsidiaries are as follows:
| Ownership interest | ||||||||||
| Country of | At December 31 | At December 31 | ||||||||
| incorporation | 2012 | 2011 | ||||||||
LDI | Canada | 100 | % | 100 | % | |||||
NAP Quebec1 | Canada | 100 | % | 100 | % | |||||
| 1 | At December 31, 2012, the Company was committed to the plan to sell its gold division assets through the disposal of all of the shares of its wholly-owned subsidiary NAP Quebec. Refer to note 4. |
66
2012 Annual Report
North American Palladium Ltd.
Transactions with key management personnel
Key management personnel compensation
The Company provides non-cash benefits to directors and executive officers, and contributes to a defined contribution plan on their behalf in addition to regular salaried amounts. In accordance with the terms of the Corporate Stock Option plan, directors and executive officers are entitled to receive stock-based compensation on an annual basis through participation in the Company’s group registered retirement savings plan and through incentives issued under the Company’s corporate stock option and restricted share unit plans. Refer to note 15.
Summary of key management personnel compensation
| December 31 | December 31 | |||||||
| 2012 | 2011 | |||||||
Short-term employee benefits | $ 2,412 | $ 2,709 | ||||||
Post employment benefits | 93 | 72 | ||||||
Share-based payments | 377 | 2,339 | ||||||
| $ 2,882 | $ 5,120 | |||||||
15. SHAREHOLDERS’ EQUITY
(a) Authorized and Issued Capital Stock
The authorized capital stock of the Company consists of an unlimited number of common shares.
(b) Common share purchase warrants
The changes in issued common share purchase warrants for the period end are summarized below:
| As at December 31 2012 | As at December 31 2011 | |||||||||||||||
| Warrants | Amount | Warrants | Amount | |||||||||||||
Balance beginning of period | - | $ - | 13,837,924 | $ 5,113 | ||||||||||||
Warrants exercised | - | - | (5,009,986 | ) | (1,239 | ) | ||||||||||
Warrants expired | - | - | (8,827,938 | ) | (3,874 | ) | ||||||||||
Balance, end of period | - | $ - | - | $ - | ||||||||||||
On December 8, 2010 the Company announced the acceleration of the expiry of the Series A warrants to January 14, 2011. During the first quarter of 2011, $21.3 million of proceeds were received from the exercise of 5,009,986 Series A warrants. Total proceeds of $38.8 million were received from the exercise of Series A warrants and 67,938 Series A warrants were not exercised prior to expiry.
On April 28, 2010, the Company completed an equity offering of 20,000,000 units at a price of $5.00 per unit for total net proceeds of $94.2 million (issue costs $5.8 million). Each unit consisted of one share and one-half a Series B warrant. As at December 31, 2010, 1,240,000 Series B warrants were exercised for total proceeds of $8.1 million. On October 28, 2011, the remaining Series B warrants expired unexercised.
| (c) | Group Registered Retirement Savings Plan |
The Company has a group registered retirement savings plan, in which eligible employees can participate in at their option. The Company is required to make contributions on a quarterly basis equivalent to 3% of eligible employees’ base compensation and up to an additional 2% matching, per employee per annum, made either in cash or treasury shares of the Company. The maximum number of common shares available for grant shall not exceed 10% of the issued and outstanding common shares of the Company, including the issuance under the Corporate Stock Option Plan and other securities-based compensation plans. If the matching contribution is made in treasury shares, the price per share issued is the 5-day volume weighted average trading price of the common shares on the Toronto Stock Exchange (“TSX”) preceding the end of the quarter. During the year ended December 31, 2012, the Company contributed 551,401 shares with a fair value of $1,240 (2011 – 203,252 shares with a fair value of $841).
67
2012 Annual Report
North American Palladium Ltd.
| (d) | Flow-through share offerings |
In November 2012, the Company issued 2,425,000 flow-through common shares at a price of $1.65 per share for net proceeds of $3.6 million. The Company is required to spend the gross proceeds of $4.0 million on eligible exploration and mine development expenditures, which expenditures are expected to be renounced to investors for the 2012 tax year. As at December 31, 2012, $1.9 million was spent, with the remaining $2.1 million expected to be spent by March 31, 2013.
On April 30, 2012, the Company issued 11,300,000 flow-through common shares at a price of $3.10 per share for net proceeds of $32.8 million. The Company is required to spend the gross proceeds of $35.0 million on eligible exploration and mine development expenditures, which expenditures are expected to be renounced to investors for the 2012 tax year. As at December 31, 2012, $35.0 million was spent.
On February 18, 2011, the Company completed a flow-through share offering of 2,667,000 flow-through common shares. The Company was required to spend gross proceeds of $22.0 million on Canadian exploration expenses prior to December 31, 2012, which was fulfilled by December 31, 2011.
| (e) | Corporate Stock Option Plan |
The Company has a Corporate Stock Option Plan (the “Plan”), under which eligible directors, officers, employees and consultants of the Company may receive options to acquire common shares. The Plan is administered by the Board of Directors, which will determine after considering recommendations made by the Compensation Committee, the number of options to be issued, the exercise price (which is the 5-day volume weighted average trading price of the common shares on the TSX on the trading day prior to the grant date), expiration dates of each option, the extent to which each option is exercisable (provided that the term of an option shall not exceed 10 years from the date of grant), as well as establishing the time period should the optionee cease to be an “Eligible Person” as set forth in the conditions of the Plan. One third of options granted vest on each of the first three anniversary dates of the date of grant.
The maximum number of common shares available for grant shall not exceed 10% of the issued and outstanding common shares of the Company, including the issuance under the Group Retirement Savings Plan and other securities-based compensation plans. As at December 31, 2012, 5,291,051 options (December 31, 2011 – 5,853,717 options) were available to be granted under the Plan.
The following summary sets out the activity in outstanding common share purchase options:
| December 31, 2012 | December 31, 2011 | |||||||||||||||
| Options | Weighted Average Exercise Price | Options | Weighted Average Exercise Price | |||||||||||||
Outstanding, beginning of period | 3,644,583 | $ 4.43 | 3,847,833 | $ 4.22 | ||||||||||||
Granted | 1,772,000 | $ 2.82 | 273,000 | $ 5.45 | ||||||||||||
Exercised | - | - | (317,919 | ) | $ 2.13 | |||||||||||
Cancelled | (720,000 | ) | $ 4.34 | (158,331 | ) | $ 5.73 | ||||||||||
Expired | (489,334 | ) | $ 5.14 | - | - | |||||||||||
Outstanding, end of period | 4,207,249 | $ 3.68 | 3,644,583 | $ 4.43 | ||||||||||||
Options exercisable at end of period | 2,335,591 | $ 3.88 | 2,439,925 | $ 4.06 | ||||||||||||
No options were exercised during the year ended December 31, 2012. For the year ended December 31, 2011, the weighted average share price on the dates common share purchase options were exercised was $3.57.
68
2012 Annual Report
North American Palladium Ltd.
The following table summarizes information about the Company’s stock options outstanding at December 31, 2012:
| Exercise price range | Average remaining contractual life (years) | Options Outstanding at December 31, 2012 | Options Exercisable at December 31, 2012 | |||||||||
$1.65-2.50 | 3.65 | 789,750 | 774,750 | |||||||||
$2.51-3.00 | 4.11 | 1,665,000 | 200,000 | |||||||||
$3.01-6.00 | 4.79 | 694,999 | 621,668 | |||||||||
$6.01-8.87 | 4.02 | 1,057,500 | 739,173 | |||||||||
| 4.11 | 4,207,249 | 2,335,591 | ||||||||||
The fair value of options granted during the year ended December 31, 2012 and the year ended December 31, 2011 have been estimated at the date of grant using the Black Scholes option pricing model with the following weighted average assumptions:
December 31 2012 | December 31 2011 | |||||||
Awards granted | 1,772,000 | 273,000 | ||||||
Weighted average fair value of awards | $ 1.24 | $ 2.91 | ||||||
Pre-vest forfeiture rate | 13 | % | 14 | % | ||||
Grant price | $ 2.82 | $ 5.45 | ||||||
Market price | $ 2.53 | $ 5.53 | ||||||
Volatility1 | 65 | % | 65 | % | ||||
Risk free rate | 1.25 | % | 2.04 | % | ||||
Dividend yield | 0 | % | 0 | % | ||||
Expected life (in years) | 4.4 | 4.3 | ||||||
| 1 | Expected volatility is estimated by considering historic average share price volatility based on the average expected life of the options. |
| (f) | Reconciliation of the diluted number of shares outstanding: |
December 31 2012 | December 31 2011 | |||||||
Net loss available to common shareholders | $ 66,037 | $ 65,154 | ||||||
Effect of dilutive securities | 1,017 | - | ||||||
Adjusted net loss available to common shareholders | $ 67,054 | $ 65,154 | ||||||
Weighted average number of shares outstanding | 170,960,774 | 162,011,253 | ||||||
Effect of dilutive securities | 23,000 | - | ||||||
Weighted average diluted number of shares outstanding | 170,983,774 | 162,011,253 | ||||||
Diluted net loss per share | $ 0.39 | $ 0.40 | ||||||
69
2012 Annual Report
North American Palladium Ltd.
On July 31, 2012, the Company completed an offering of convertible debentures. The calculation of the weighted average number of shares outstanding and the net profit or net loss to common shareholders will be impacted in future periods upon the assumed conversion of the convertible debentures. Refer to note 13.
For the year ended December 31, 2012, the effect of dilutive securities relates to the potential conversion of outstanding palladium warrants. The dilutive effects of the convertible debentures and stock options have not been included in the determination of diluted loss per share because to do so would be anti-dilutive. For the year ended December 31, 2011, the effect of outstanding palladium warrants and stock options has not been included in the determination of diluted loss per share because to do so would be anti-dilutive.
| (g) | Other Stock-Based Compensation – Restricted Share Unit Plan |
The Company has a Restricted Share Unit Plan (“RSU”) under which eligible directors, officers and key employees of the Company are entitled to receive awards of restricted share units. Each restricted share unit is equivalent in value to the fair market value of a common share of the Company on the date of the award and a corresponding liability is established on the balance sheet. The RSU is administered by the Board of Directors, which will determine after considering recommendations made by the Compensation Committee, the number and timing of restricted share units to be awarded and their vesting periods, not to exceed three years. The value of each award is charged to compensation expense over the period of vesting. At each reporting date, the compensation expense and liability are adjusted to reflect the changes in market value of the liability based on the fair values of RSU’s for each vesting period determined using the Black-Scholes model.
As at December 31, 2012, 237,871 (December 31, 2011 – 129,418) restricted share units had been granted and were outstanding at an aggregate value of $253 (December 31, 2011 – $237).
| (h) | Summary of Share-based compensation and employee benefits |
The following table details the components of share-based compensation expense relating to continuing operations:
Year ended December 31, 2012 | Year ended December 31, 2011 | |||||||
Registered retirement savings plan | $ 1,073 | $ 634 | ||||||
Common share stock options | 1,204 | 2,452 | ||||||
Restricted share units | 82 | 135 | ||||||
| $ 2,359 | $ 3,221 | |||||||
16. FINANCIAL INSTRUMENTS
The Company has exposure to the following risks from its use of financial instruments: credit risk, market risk, currency risk, interest rate risk, commodity price risk and liquidity risk.
Credit Risk
Credit risk is the risk of financial loss to the Company if a customer or counterparty to a financial instrument fails to meet its contractual obligations. The Company’s exposure arises principally from its short term interest bearing deposits and accounts receivable. Historically, the Company has not experienced any losses related to individual customers. The Company invests its cash and cash equivalents primarily with a major Canadian bank.
70
2012 Annual Report
North American Palladium Ltd.
The carrying amount of financial assets represents the maximum credit exposure. The maximum exposure to credit risk at the reporting date was:
| At December 31 2012 | At December 31 2011 | |||||||
Cash and cash equivalents | $ 20,168 | $ 50,935 | ||||||
Accounts receivable | 53,922 | 73,048 | ||||||
Other assets | 7,073 | 10,560 | ||||||
| $ 81,163 | $ 134,543 | |||||||
Market Risk
Market risk is the risk that the fair value or future cash flows of a financial instrument will fluctuate because of changes in market prices. Market risk is comprised of currency, interest rate, and commodity price risks. In addition, the Company is exposed to market risk relating to fluctuations in the share price of the Company’s common shares as a result of the RSU plan, which is marked-to-market using the Black-Scholes model at each period end.
| (i) | Currency risk |
Currency risk is the risk that the fair value or future cash flows of a financial instrument will fluctuate because of changes in foreign exchange rates. Currency risk is related to the portion of the Company’s business transactions denominated in currencies other than Canadian dollars. The Company is exposed to fluctuations in exchange rates due to certain of its foreign based suppliers and revenues being in foreign currencies. The Company’s primary exposure is based upon the movements of the US dollar against the Canadian dollar. The Company’s foreign exchange risk management includes, from time to time, the use of foreign currency forward contracts to fix exchange rates on certain foreign currency exposures.
For the Company’s foreign exchange transactions, fluctuations in the respective exchange rates relative to the Canadian dollar will create volatility in the Company’s cash flows and the reported amounts for revenue, operating costs, and exploration costs on a year-to-year basis. Additional earnings volatility arises from the translation of monetary assets and liabilities denominated in currencies other than Canadian dollars at the rates of exchange at each balance sheet date, the impact of which is reported as a separate component of revenue or foreign exchange gain or loss in the consolidated statements of operations and comprehensive loss.
The Company is exposed to the following currency risk on cash, purchases and borrowings at December 31, 2012.
| US$ | ||||
Cash | $ 327 | |||
Accounts payable and accrued liabilities | (199 | ) | ||
| $ 128 | ||||
A 1% strengthening or weakening of the Canadian dollar against the US dollar, assuming that all other variables remained the same, would have resulted in a nominal decrease or increase, respectively, in the Company’s statement of loss and comprehensive loss for the year ended December 31, 2012.
The Company’s revenue is affected by currency exchange rates, such that a weakening in the Canadian dollar relative to the US dollar will result in additional revenues and a strengthening in the Canadian dollar will result in reduced revenues.
| (ii) | Interest rate risk |
Interest rate risk is the risk that the fair value or future cash flows of a financial instrument will fluctuate because of changes in market interest rates. The Company does not enter into derivative financial instruments for speculative purposes. The Company does not hold any specific hedging instruments, nor does it hold any short term investments that would be significantly impacted from fluctuations in interest rates. Any interest rate fluctuations realized are expected to be offset by favourable changes in the interest on debt instruments.
71
2012 Annual Report
North American Palladium Ltd.
Management does not believe that the net impact of interest rate fluctuations on the current level of borrowings and short term investments will be significant and, therefore, has not provided a sensitivity analysis of this impact on net earnings.
| (iii) | Commodity price risk |
Commodity price risk is the risk that the fair value or future cash flows of a financial instrument will fluctuate because of changes in commodity prices. The Company is particularly exposed to fluctuations in commodity prices from its sale of metals. From time to time the Company may enter into forward commodity sales contracts to hedge the effect on revenues of changes in the price of metals it produces. Gains and losses on derivative financial instruments used to mitigate metal price risk are recognized in revenue from metal sales over the term of the hedging contract.
The Company enters into financial contracts to mitigate the smelter agreements’ provisional pricing exposure to rising or declining palladium prices and an appreciating Canadian dollar for past production already sold. The total of these financial contracts represent 55,000 ounces as at December 31, 2012 (69,500 ounces as at December 31, 2011). These contracts mature from January 2013 to May 2013 (2011 – January 2012 through June 2012) at an average forward price of $640 per ounce (or $US644 per ounce) (2011 – $697 per ounce (or $US699 per ounce)). For substantially all of the palladium delivered to the customers under the smelter agreements, the quantities and timing of settlement specified in the financial contracts matches final pricing settlement periods. The palladium financial contracts are being recognized on a mark-to-market basis as an adjustment to revenue. The fair value of these contracts at December 31, 2012 was a liability of $3.2 million included in accounts payable and accrued liabilities (December 31, 2011 – $2.0 million asset included in accounts receivable).
During 2011, the Company issued $72.0 million of senior secured notes by way of a private placement for net proceeds of $69.6 million. The Company also issued one warrant with each $1,000 note. Each warrant entitles the holder to purchase 0.35 ounces of palladium at a purchase price of US$620 (the “Strike Price”) per ounce, anytime up to October 4, 2014. If the warrants are exercised, settlement will occur in cash with the Company paying each warrant held by the note holder the difference between the average of the U.S dollar palladium afternoon fixing price per ounce on the London Platinum and Palladium Market for the ten trading days prior to the exercise date less the Strike Price, multiplied by 0.35. Alternatively, the Company has the option to settle the amount owing to the warrant holder at a 7% discount to 5-day weighted average market price of the common shares of the Company at the date of exercise. At December 31, 2012, the value of the warrants was $4.0 million, including a loss recognized in the Company’s consolidated statement of loss and comprehensive loss of $0.9 million.
As at December 31, 2012, the Company’s exposure to commodity price is limited to accounts receivable associated with provisional pricing of metal concentrate sales particularly palladium, and to palladium warrants. A 1% strengthening or weakening of the palladium price would have resulted in an approximate $0.2 million decrease or increase, respectively, in the Company’s loss and comprehensive loss for the year ended December 31, 2012.
Liquidity Risk
Liquidity risk is the risk that the Company will not be able to meet its financial obligations as they fall due. The Company’s approach to managing liquidity risk is to monitor the timing of sales and receivables, to ensure sufficient cash flows are generated from operations to meet the current debt requirements. Where insufficient liquidity may exist, the Company may pursue various debt and equity instruments for short or long term financing of its operations.
Anticipated operating cash flows and net proceeds on disposal of the gold division are not expected to provide sufficient cash to fund capital expenditures anticipated for 2013, therefore the Company plans to access the capital markets. In the event access to the capital markets is unavailable, the Company will review its options to preserve cash resources.
72
2012 Annual Report
North American Palladium Ltd.
The table below analyzes the Company’s financial liabilities which will be settled into relevant maturity groupings based on the remaining balances at December 31, 2012 to the contractual maturity date.
| Total | In less than 1 year | Between 1 year and 5 years | More than 5 years | |||||||||||||
| Accounts payable and accrued liabilities | $ 58,474 | $ 58,474 | $ - | $ - | ||||||||||||
| Obligations under finance leases | 13,673 | 3,717 | 9,956 | - | ||||||||||||
| Current derivative liability | 3,952 | - | 3,952 | - | ||||||||||||
| Long-term debt | 101,633 | - | 101,633 | - | ||||||||||||
The Company also has asset retirement obligations in the amount of $21.3 million that would become payable at the time of the closures of its LDI mine and its discontinued operations and assets held for sale (refer to Note 4). As the Company issued letters of credit of $15.9 million related to these obligations, $5.4 million of additional funding is required prior to or upon closure of these properties. Refer to note 9 for additional disclosure regarding these amounts. The majority of the asset retirement costs are expected to be incurred within one year of mine closure and an application must be made to receive funds on deposit.
Management monitors consolidated cash flow, in detail, on a daily basis, monthly through month-end reporting, quarterly through forecasting and yearly through the budget process. Based on the financial liabilities due and noted above, the Company expects to have sufficient operating cash flow exceeding the amounts due.
Fair Values
The Company’s financial assets and liabilities consist of cash and cash equivalents, accounts receivable, sales taxes receivable (included in other assets), reclamation deposits, accounts payable and accrued liabilities, current derivative liabilities, obligations under finance leases and long-term debt.
Cash and cash equivalents are stated at fair value. The carrying value of other assets, and trade accounts payable and accrued liabilities approximate their fair values due to the immediate or short-term maturity of these financial instruments.
The fair value of the obligations under finance leases approximate their carrying value due to the interest rate implicit in the leases approximating interest rates available at this time for similar lease terms. The fair value of RSUs are determined as described in note 15(g).
Derivatives
The fair value of forward exchange contracts is based on their listed market price, if available. If a listed market price is not available, then fair value is estimated by discounting the difference between the contractual forward price and the current forward price for the residual maturity of the contract using a risk-free interest rate.
Fair values reflect the credit risk of the instrument and include adjustments to take into account the credit risk of the Company entity and counterparty when appropriate.
The Company enters into financial contracts to mitigate the smelter agreements’ provisional pricing exposure to rising or declining palladium prices and an appreciating Canadian dollar for past production already sold. For substantially all of the palladium delivered to the customer under the smelter agreement, the quantities and timing of settlement specified in the financial contracts matches final pricing settlement periods. The palladium financial contracts are being recognized on a mark-to-market basis as an adjustment to revenue.
The fair value of the derivative liability relating to the 2011 long term debt issuance primarily relates to the value of palladium warrants and related conversion options. These derivative instruments are valued using a binomial model.
73
2012 Annual Report
North American Palladium Ltd.
Non-derivative financial liabilities
Fair value, which is determined for disclosure purposes, is calculated based on the present value of future principal and interest cash flows, discounted at the market rate of interest at the reporting date. For finance leases the market rate of interest is determined by reference to similar lease agreements.
The fair values of the non-derivative financial liabilities as of December 31, 2012 are senior secured notes ($68.4 million), convertible debentures ($43.0 million) and finance leases ($10.0 million).
Fair Value Hierarchy
The table below details the assets and liabilities measured at fair value at December 31, 2012:
| Quoted Prices in Active Markets for Identical Assets (Level 1) | Significant Other Observable Inputs (Level 2) | Significant Unobservable Inputs (Level 3) | Aggregate Fair Value | |||||||||||||
Financial assets | ||||||||||||||||
Cash and cash equivalents | $ 20,168 | $ - | $ - | $ 20,168 | ||||||||||||
Accounts receivable (note 5) | - | 53,922 | - | 53,922 | ||||||||||||
Financial liabilities | ||||||||||||||||
RSU liabilities* (note 15(g)) | - | (253 | ) | - | (253 | ) | ||||||||||
Fair value of financial contracts* (note 10) | - | (3,236 | ) | - | (3,236 | ) | ||||||||||
Fair value of current derivative liability | - | (3,952 | ) | - | (3,952 | ) | ||||||||||
Net carrying value | $ 20,168 | $ 46,481 | $ - | $ 66,649 | ||||||||||||
| * | As detailed in notes 5 and 10, the asset or liability relating to the mark-to-market on financial contracts is included in the carrying value of accounts receivable or accounts payable and accrued liabilities on the balance sheet respectively. RSU liabilities are measured at fair value based on the Black-Scholes valuation model at each reporting date and are included in the balance of accounts payable and accrued liabilities. |
17. CAPITAL DISCLOSURE
The Company’s objective is to maintain a strong capital base so as to maintain investor, creditor and market confidence and to sustain future development of the business.
Management defines capital as the Company’s total shareholders’ equity and any outstanding debt. The board of directors does not establish quantitative return on capital criteria for management but rather promotes year over year sustainable profitable growth.
In order to maintain or adjust the capital structure, the Company may issue new shares, issue new debt or replace existing debt with different characteristics.
There were no changes in the Company’s approach to capital management during the year. The Company is subject to certain minimum capital requirements in its debt covenants which it fulfilled as of December 31, 2012.
74
2012 Annual Report
North American Palladium Ltd.
18. COMMITMENTS
| (a) | Sheridan Platinum Group of Companies (“SPG”) Commitment |
The Company is required to pay a 5% net smelter royalty to SPG from mining operations at the Lac des Iles mine. This obligation is recorded as royalty expense.
| (b) | Operating Leases and Other Purchase Obligations |
As at December 31, 2012, the Company had outstanding operating lease commitments and other purchase obligations of $6.7 million and $84.9 million, respectively (December 31, 2011 – $6.9 million and $110.6 million, respectively) all of which had maturities of less than five years, with the exception of nil operating leases with a maturity greater than five years (December 31, 2011 – $193).
| (c) | Letters of Credit |
As at December 31, 2012, the Company had outstanding letters of credit of $17.3 million, consisting of $16.3 million for various mine closure deposits and $1.0 million for a regulated energy supplier (December 31, 2011 – $12.1 million outstanding letter of credit, consisting of $10.6 million for various mine closure deposits and $1.5 million for a regulated energy supplier).
| (d) | Flow-Through Shares |
As at December 31, 2012, the Company had outstanding commitments to spend $2.1 million on eligible exploration expenditures, which the Company expects to spend by March 31, 2013.
19. REVENUE FROM METAL SALES
| Total | Palladium | Platinum | Gold | Nickel | Copper | Other Metals | ||||||||||||||||||||||
2012 | ||||||||||||||||||||||||||||
Year ended December 31 | ||||||||||||||||||||||||||||
Revenue – before pricing adjustments1 | $ 161,286 | $ 105,161 | $ 17,277 | $ 18,392 | $ 10,744 | $ 9,310 | $ 402 | |||||||||||||||||||||
Pricing adjustments: | ||||||||||||||||||||||||||||
Commodities | (305 | ) | (693 | ) | 739 | (3 | ) | (374 | ) | 25 | 1 | |||||||||||||||||
Foreign exchange | (277 | ) | 33 | (218 | ) | 178 | (145 | ) | (119 | ) | (6 | ) | ||||||||||||||||
Revenue – after pricing adjustments | $ 160,704 | $ 104,501 | $ 17,798 | $ 18,567 | $ 10,225 | $ 9,216 | $ 397 | |||||||||||||||||||||
2011 | ||||||||||||||||||||||||||||
Year ended December 31 | ||||||||||||||||||||||||||||
Revenue – before pricing adjustments1 | $ 148,480 | $ 107,035 | $ 15,369 | $ 11,581 | $ 7,914 | $ 6,133 | $ 448 | |||||||||||||||||||||
Pricing adjustments: | ||||||||||||||||||||||||||||
Commodities | (5,407 | ) | (3,229 | ) | (1,691 | ) | 223 | (361 | ) | (326 | ) | (23 | ) | |||||||||||||||
Foreign exchange | 586 | 198 | 189 | 167 | 32 | (3 | ) | 3 | ||||||||||||||||||||
Revenue – after pricing adjustments | $ 143,659 | $ 104,004 | $ 13,867 | $ 11,971 | $ 7,585 | $ 5,804 | $ 428 | |||||||||||||||||||||
| 1 | Totals for the year ended December 31, 2012 exclude gold and silver revenues amounting to $3,004 (2011 – $26,813) relating to the Company’s NAP Quebec subsidiary. Revenues for NAP Quebec have been reported separately as part of discontinued operations. Refer to note 4. |
During 2012, the Company delivered all of its concentrate to three customers under the terms of the respective agreements (2011 – two customers).
75
2012 Annual Report
North American Palladium Ltd.
Although the Company sells its bulk concentrate to a limited number of customers, it is not economically dependent upon any one customer as there are other markets throughout the world for the Company’s concentrate.
20. INTEREST EXPENSE & OTHER COSTS AND OTHER INCOME
| 2012 | 2011 | |||||||
| Interest expense & other costs | ||||||||
Interest on finance leases | $ 843 | $ 157 | ||||||
Financing costs | - | 767 | ||||||
Asset retirement obligation accretion | 262 | 292 | ||||||
Accretion expense on long-term debt | 2,996 | 457 | ||||||
Interest expense | 580 | 330 | ||||||
Unrealized loss on palladium warrants | - | 460 | ||||||
| $ 4,681 | $ 2,463 | |||||||
Other income | ||||||||
Unrealized gain on palladium warrants | $ (924 | ) | $ - | |||||
Gain on revaluation of debt | (820 | ) | - | |||||
Gain on renouncement of flow-through expenditures | (1,625 | ) | (1,840 | ) | ||||
Interest income | (229 | ) | (943 | ) | ||||
| $ (3,598 | ) | $ (2,783 | ) | |||||
| $ 1,083 | $ (320 | ) | ||||||
21. CONTINGENCIES
From time to time, the Company is involved in litigation, investigations, or proceedings related to claims arising in the ordinary course of business. The Company does not believe such matters are material. In 2011, a Statement of Claim was filed with the Ontario Superior Court of Justice against the Company and two of its officers regarding a potential class action lawsuit. In 2012, a fresh Statement of Claim was filed increasing the amount of the claim to $100.0 million. In December of 2012, the plaintiffs filed a motion of record for certification and for leave. The Company intends to vigorously defend the potential claim. It is not possible at this time to estimate the outcome of the potential action and accordingly, the Company has not recorded any associated provisions within its consolidated financial statements at December 31, 2012.
22. INCOME TAXES
Rate Reconciliation
The provision for income and mining taxes – continuing operations differs from the amount that would have resulted by applying the combined Canadian Federal and Ontario statutory income tax rates of approximately 26.5%2 (2011 – 28.3%):
December 31 2012 | December 31 2011 | |||||||
Income tax expense (recovery) using statutory income tax rates | $ (3,022 | ) | $ 1,759 | |||||
Increase (decrease) in taxes resulting from: | ||||||||
Change in unrecognized temporary differences | 5,223 | (1,134 | ) | |||||
Statutory permanent differences | (2,202 | ) | (309 | ) | ||||
Ontario Harmonization Transitional tax, in respect of the prior period | - | 2,388 | ||||||
Expiration of warrants1 | - | (555 | ) | |||||
Difference in statutory tax rates | 1 | (316 | ) | |||||
Income and mining tax expense – continuing operations | $ - | $ 1,833 | ||||||
76
2012 Annual Report
North American Palladium Ltd.
| 1 | Tax recovery on the expiration of share purchase warrants, whereas the deferred tax liability was charged to Contributed Surplus. |
| 2 | The statutory tax rate decreased from 2011 to 2012 due to a reduction in Canadian Federal and Ontario rates over the period. |
Components of Income tax expense
The details of the Company’s income and mining tax expense (recovery) are as follows:
December 31 2012 | December 31 2011 | |||||||
Current income tax expense (recovery): | ||||||||
Income taxes | ||||||||
Adjustments for prior period1 | $ - | $ 2,388 | ||||||
Deferred income tax recovery: | ||||||||
Income taxes | - | (555 | ) | |||||
Total | $ - | $ 1,833 | ||||||
| 1 | Impact of a proposed CRA reassessment received in 2011 related to the Company’s Ontario harmonization tax liability. |
Deferred tax liabilities
The following table summarizes the components of deferred income and mining tax:
December 31 2012 | December 31 2011 | |||||||
Deferred mining tax liabilities | ||||||||
Gold mining interests | $ - | $ (4,264 | ) | |||||
Deferred tax liabilities, net | $ - | $ (4,264 | ) | |||||
The following table summarizes the movement in deferred tax liabilities:
| 2012 | 2011 | |||||||
Balance at the beginning of the year | $ (4,264 | ) | $ (1,207 | ) | ||||
Discontinued operations | 4,264 | (3,057 | ) | |||||
Balance at the end of the year | $ - | $ (4,264 | ) | |||||
Unrecognized deferred tax assets
Deferred income and mining tax assets from continuing operations have not been recognized in respect of the following items:
December 31 2012 | December 31 2011 | |||||||
| Loss carryforwards | $ 75,713 | $ 89,862 | ||||||
| Deductible temporary differences, income taxes | $ 20,382 | $ 33,599 | ||||||
| Deductible temporary differences, mining taxes | $ 2,559 | $ 9,183 | ||||||
The tax losses not recognized expire as per the amount and years noted below. The deductible temporary differences do not expire under current tax legislation. Deferred tax assets have not been recognized in respect of these items because it is not probable that future taxable profit will be available against which the Company can utilize the benefits there from.
77
2012 Annual Report
North American Palladium Ltd.
Income tax attributes
As at December 31, 2012, the Company had the following approximate income tax attributes from continuing operations to carry forward:
| Amount | Expiry Date | |||||||
| Non-capital losses | $ 293,889 | 2015 - 2032 | ||||||
| Capital losses | $ 7,260 | Indefinite | ||||||
| Undepreciated capital cost allowance | $ 119,106 | Indefinite | ||||||
| Tax basis of mineral interests | $ 265,501 | Indefinite | ||||||
23. OTHER DISCLOSURES
Statement of Cash flows
The net changes in non-cash working capital balances related to operations are as follows:
| 2012 | 2011 | |||||||
Cash provided by (used in): | ||||||||
Accounts receivable | $ 22,362 | $ 7,635 | ||||||
Inventories | (2,427 | ) | 7,326 | |||||
Other assets | (1,802 | ) | (1,488 | ) | ||||
Accounts payable and accrued liabilities | 22,403 | 2 | ||||||
Other financial liabilities | (923 | ) | - | |||||
Taxes payable | 42 | 2,549 | ||||||
| $ 39,655 | $ 16,024 | |||||||
24. SEGMENT INFORMATION
The Company is Canadian based and is in the business of exploring and mining palladium, platinum, gold and certain base metals. Its operations are organized into three reportable segments: palladium operations include the LDI palladium mine and mill; gold operations include the Vezza gold mine and Sleeping Giant mine and mill; and corporate and other. The palladium and gold operations include activities related to exploration, evaluation and development, mining, and milling. The corporate and other segment includes general corporate expenses and other projects not allocated to the other segments. The Company’s revenue by significant product type is disclosed in Note 19. The Company’s segments are summarized in the following table.
78
2012 Annual Report
North American Palladium Ltd.
As at and during the years ended December 31, 2012 and December 31, 2011, segmented information is presented as follows:
| At December 31, 2012 | At December 31, 2011 | |||||||||||||||||||||||||||||||||||
| Palladium operations | Corporate and other | Continuing operations Total | Discontinued gold operations | Total | Palladium operations | Discontinued gold operations | Corporate and other | Total | ||||||||||||||||||||||||||||
Cash and cash equivalents | $ (180 | ) | $ 20,348 | $ 20,168 | $ - | $ 20,168 | $ 1,456 | $ 71 | $ 49,408 | $ 50,935 | ||||||||||||||||||||||||||
Accounts receivable | 53,922 | - | 53,922 | - | 53,922 | 73,048 | - | - | 73,048 | |||||||||||||||||||||||||||
Inventories | 15,388 | - | 15,388 | - | 15,388 | 12,342 | 7,704 | - | 20,046 | |||||||||||||||||||||||||||
Other current assets | 7,595 | 853 | 8,448 | 29,814 | 38,262 | 5,558 | 9,033 | 1,266 | 15,857 | |||||||||||||||||||||||||||
Mining interests | 343,449 | 43 | 343,492 | - | 343,492 | 211,505 | 44,433 | 221 | 256,159 | |||||||||||||||||||||||||||
Total assets | $ 420,174 | $ 21,244 | $ 441,418 | $ 29,814 | $ 471,232 | $ 303,909 | $ 61,241 | $ 50,895 | $ 416,045 | |||||||||||||||||||||||||||
Accounts payable and accrued liabilities | $ 52,095 | $ 6,379 | $ 58,474 | $ - | $ 58,474 | $ 26,849 | $ 12,184 | $ 3,403 | $ 42,436 | |||||||||||||||||||||||||||
Credit Facility | - | 15,089 | 15,089 | - | 15,089 | - | - | - | - | |||||||||||||||||||||||||||
Obligations under finance leases | 13,673 | - | 13,673 | - | 13,673 | 4,314 | 218 | - | 4,532 | |||||||||||||||||||||||||||
Provisions | - | 1,000 | 1,000 | - | 1,000 | - | 1,000 | - | 1,000 | |||||||||||||||||||||||||||
Asset retirement obligations | 15,214 | - | 15,214 | - | 15,214 | 13,905 | 6,976 | - | 20,881 | |||||||||||||||||||||||||||
Other liabilities | 3,226 | 3,952 | 7,178 | 12,071 | 19,249 | 3,363 | 4,264 | 4,875 | 12,502 | |||||||||||||||||||||||||||
Long-term debt | - | 101,633 | 101,633 | - | 101,633 | - | - | 65,698 | 65,698 | |||||||||||||||||||||||||||
Total liabilities | $ 84,208 | $ 128,053 | $ 212,261 | $ 12,071 | $ 224,322 | $ 48,431 | $ 24,642 | $ 73,976 | $ 147,049 | |||||||||||||||||||||||||||
79
2012 Annual Report
North American Palladium Ltd.
| Year ended December 31, 2012 | Year ended December 31, 2011 | |||||||||||||||||||||||||||||||||||||||
| Palladium operations | Corporate and other | Continuing operations Total | Discontinued gold operations | Total | Palladium operations | Corporate and other | Continuing operations Total | Discontinued gold operations | Total | |||||||||||||||||||||||||||||||
Revenue – after pricing adjustments | $ 160,704 | $ - | $ 160,704 | $ 3,004 | $ 163,708 | $ 143,659 | $ - | $ 143,659 | $ 26,813 | $ 170,472 | ||||||||||||||||||||||||||||||
Depreciation and amortization | 19,528 | 178 | 19,706 | 199 | 19,905 | 9,961 | 183 | 10,144 | 7,460 | 17,604 | ||||||||||||||||||||||||||||||
Gold mine impairment charge | - | - | - | 56,023 | 56,023 | - | - | - | 49,210 | 49,210 | ||||||||||||||||||||||||||||||
Operating expenses | 125,307 | - | 125,307 | 3,197 | 128,504 | 105,111 | - | 105,111 | 31,628 | 136,739 | ||||||||||||||||||||||||||||||
Income (loss) from mining operations | 15,869 | (178 | ) | 15,691 | (56,415 | ) | (40,724 | ) | 28,587 | (183 | ) | 28,404 | (61,485 | ) | (33,081 | ) | ||||||||||||||||||||||||
Other expenses | ||||||||||||||||||||||||||||||||||||||||
General and administration | 448 | 11,554 | 12,002 | 62 | 12,064 | 429 | 11,772 | 12,201 | 82 | 12,283 | ||||||||||||||||||||||||||||||
Exploration | 14,408 | 105 | 14,513 | 2,768 | 17,281 | 9,834 | 105 | 9,939 | 6,728 | 16,667 | ||||||||||||||||||||||||||||||
| Other | 1,137 | (558 | ) | 579 | 93 | 672 | 289 | (250 | ) | 39 | 77 | 116 | ||||||||||||||||||||||||||||
Income (loss) before taxes | (124 | ) | (11,279 | ) | (11,403 | ) | (59,338 | ) | (70,741 | ) | 18,035 | (11,810 | ) | 6,225 | (68,372 | ) | (62,147 | ) | ||||||||||||||||||||||
Income and mining tax (expense) recovery | - | - | - | 4,704 | 4,704 | (2,388 | ) | 555 | (1,833 | ) | (1,174 | ) | (3,007 | ) | ||||||||||||||||||||||||||
Net income (loss) and comprehensive income (loss) for the period | $ (124 | ) | $ (11,279 | ) | $ (11,403 | ) | $ (54,634 | ) | $ (66,037 | ) | $ 15,647 | $ (11,255 | ) | $ 4,392 | $ (69,546 | ) | $ (65,154 | ) | ||||||||||||||||||||||
| Year ended December 31, 2012 | Year ended December 31, 2011 | |||||||||||||||||||||||||||||||||||||||
| Palladium operations | Corporate and other | Continuing operations Total | Discontinued gold operations | Total | Palladium operations | Corporate and other | Continuing operations Total | Discontinued gold operations | Total | |||||||||||||||||||||||||||||||
Additions to mining interests | $ 145,180 | $ - | $ 145,180 | $ 26,299 | $ 171,479 | $ 148,309 | $ - | $ 148,309 | $ 37,324 | $ 185,633 | ||||||||||||||||||||||||||||||
For additional discussion relating to reliance on customers, refer to accounts receivable in note 5 and revenue from metal sales in note 19.
80
2012 Annual Report
CORPORATE INFORMATION
Board of Directors
Robert J. Quinn, Chairman
Partner, Quinn & Brooks LLP | Houston, Texas
Andre J. Douchane
President and CEO, Mahdia Gold Corporation | Toronto, Ontario Steven R. Berlin
Retired Financial Executive | Tulsa, Oklahoma C. David A. Comba
Retired Mining Executive | Burlington, Ontario
Greg J. Van Staveren, CA, CPA
Strategic Financial Consultant | Toronto, Ontario
William J. Weymark, P.Eng.
President, Weymark Engineering Ltd. | Vancouver, British Colum
Senior Management Phil du Toit
President and Chief Executive Officer
Dave Langille
Chief Financial Officer
Greg Struble
Vice President and Chief Operating Officer
David Peck
Head of Exploration
Tess Lofsky
Vice President, General Counsel & Corporate Secretary
Investor Relations
Camilla Bartosiewicz
Director, Investor Relations and Corporate Communications
Phone: 416-360-7374 Email: camilla@nap.com Website: www.nap.com
Transfer Agent and Registrar
Auditors
Royal Bank Plaza, South Tower
Computershare Investor Services Inc.
KPMG LLP
200 Bay Street, Suite 2350
100 University Avenue, 9th Floor
333 Bay Street, Suite 4600
Toronto, Ontario, M5J 2J2
North Tower
Toronto, Ontario, M5H 2S5
Tel: (416) 360-7590
Toronto, Ontario, M5J 2Y1
Phone: 416-777-8500
Fax: (416) 360-7709
Website: www.kpmg.ca
Email: info@nap.com
North America
www.nap.com
Toll-free: 1 (800) 564-6253
Annual Meeting
Toll-free fax: 1 (888) 453-0330
Listed Securities
NAP’s Annual & Special Meeting of
International
Shareholders will be held on May 9,2013
TSX: PDL, PDL.DB
Tel: (514) 982-7555
at 10:30 a.m. (ET) at the TSX Broadcast
NYSE MKT: PAL
Fax: (416) 263-9524
Centre Gallery, The Exchange Tower,
130 King Street West,
Email: service@computershare.com
Toronto, Ontario
Website: www.computershare.com
|P| North American Palladium Ltd.
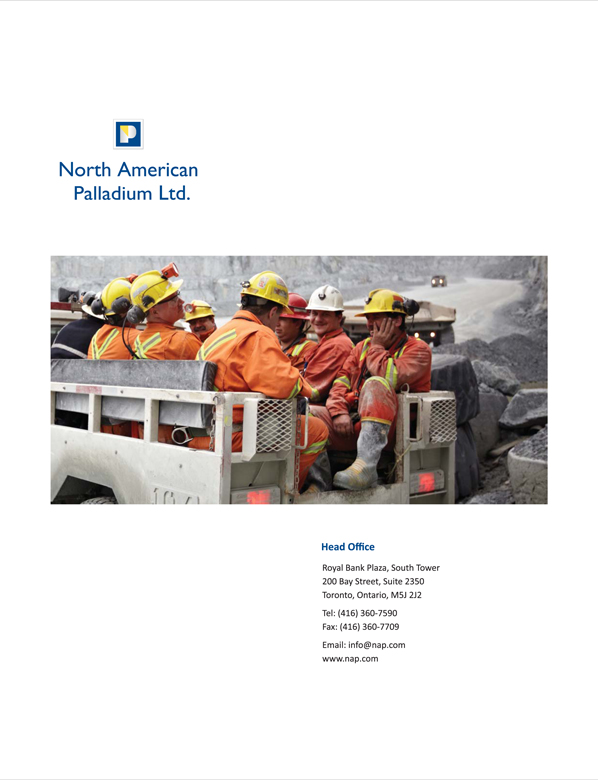
North American Palladium Ltd.
Head Office
Royal Bank Plaza, South Tower
200 Bay Street, Suite 2350
Toronto, Ontario, M5J 2J2
Tel: (416) 360-7590
Fax: (416) 360-7709
Email: info@nap.com www.nap.com