
Stifel 2017 Technology, Internet & Media Conference June 6, 2017 Presenters: Per Loof – Chief Executive Officer William M. Lowe, Jr. – EVP & Chief Financial Officer
Cautionary Statement Certain statements included herein contain forward-looking statements within the meaning of federal securities laws about KEMET Corporation's (the "Company") financial condition and results of operations that are based on management's current expectations, estimates and projections about the markets in which the Company operates, as well as management's beliefs and assumptions. Words such as "expects," "anticipates," "believes," "estimates," variations of such words and other similar expressions are intended to identify such forward-looking statements. These statements are not guarantees of future performance and involve certain risks, uncertainties and assumptions, which are difficult to predict. Therefore, actual outcomes and results may differ materially from what is expressed or forecasted in, or implied by, such forward-looking statements. Readers are cautioned not to place undue reliance on these forward-looking statements, which reflect management's judgment only as of the date hereof. The Company undertakes no obligation to update publicly any of these forward-looking statements to reflect new information, future events or otherwise. Factors that may cause actual outcomes and results to differ materially from those expressed in, or implied by, these forward-looking statements include, but are not necessarily limited to, the following: (i) adverse economic conditions could impact our ability to realize operating plans if the demand for our products declines, and such conditions could adversely affect our liquidity and ability to continue to operate and cause a write down of long-lived assets or goodwill; (ii) an increase in the cost or a decrease in the availability of our principal or single-sourced purchased raw materials; (iii) changes in the competitive environment; (iv) uncertainty of the timing of customer product qualifications in heavily regulated industries; (v) economic, political, or regulatory changes in the countries in which we operate; (vi) difficulties, delays or unexpected costs in completing the restructuring plans; (vii) acquisitions and other strategic transactions expose us to a variety of risks; (viii) acquisition of TOKIN may not achieve all of the anticipated results; (ix) our business could be negatively impacted by increased regulatory scrutiny and litigation; (x) difficulties associated with retaining, attracting and training effective employees and management; (xi) the need to develop innovative products to maintain customer relationships and offset potential price erosion in older products; (xii) exposure to claims alleging product defects; (xiii) the impact of laws and regulations that apply to our business, including those relating to environmental matters; (xiv) the impact of international laws relating to trade, export controls and foreign corrupt practices; (xv) changes impacting international trade and corporate tax provisions related to the global manufacturing and sales of our products may have an adverse effect on our financial condition and results of operations; (xvi) volatility of financial and credit markets affecting our access to capital; (xvii) the need to reduce the total costs of our products to remain competitive; (xviii) potential limitation on the use of net operating losses to offset possible future taxable income; (xix) restrictions in our debt agreements that could limit our flexibility in operating our business; (xx) disruption to our information technology systems to function properly or control unauthorized access to our systems may cause business disruptions; (xxi) additional exercise of the warrant by K Equity, LLC which could potentially result in the existence of a significant stockholder who could seek to influence our corporate decisions; (xxii) fluctuation in distributor sales could adversely affect our results of operations, (xxiii) earthquakes and other natural disasters could disrupt our operations and have a material adverse effect on our financial condition and results of operations. 2

TOKIN Acquisition Closure
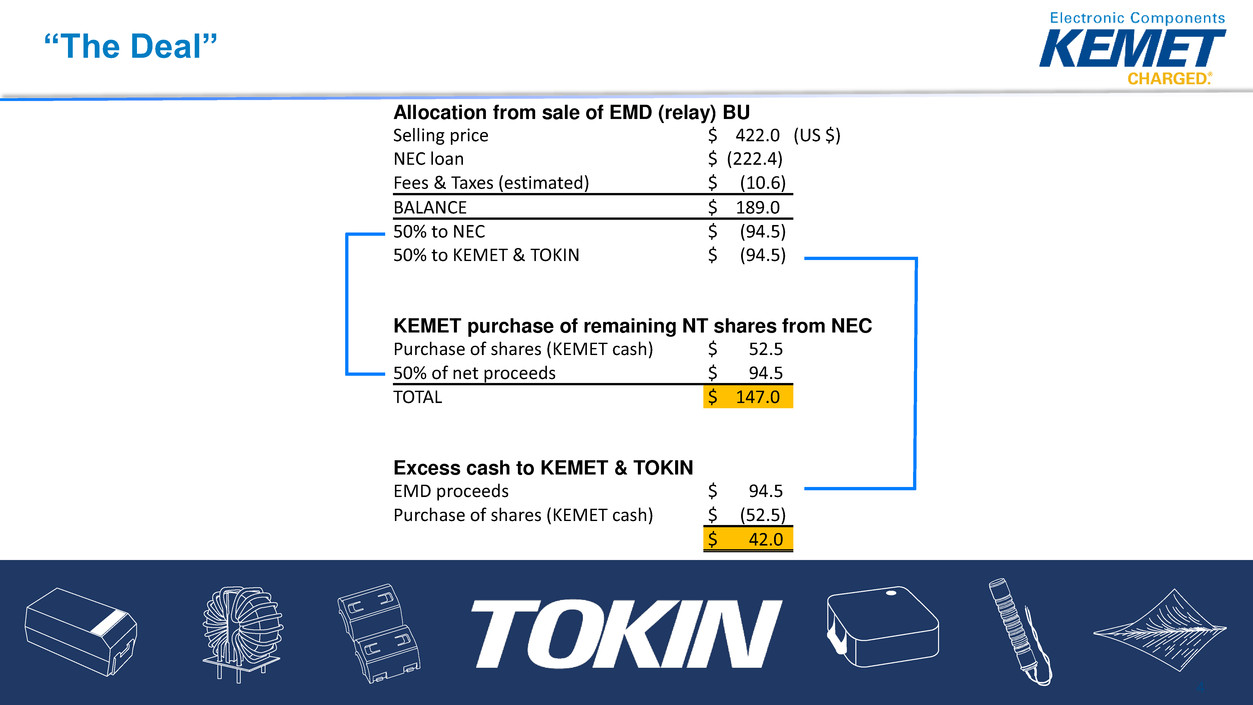
4 Allocation from sale of EMD (relay) BU Selling price $ 422.0 (US $) NEC loan $ (222.4) Fees & Taxes (estimated) $ (10.6) BALANCE $ 189.0 50% to NEC $ (94.5) 50% to KEMET & TOKIN $ (94.5) KEMET purchase of remaining NT shares from NEC Purchase of shares (KEMET cash) $ 52.5 50% of net proceeds $ 94.5 TOTAL $ 147.0 Excess cash to KEMET & TOKIN EMD proceeds $ 94.5 Purchase of shares (KEMET cash) $ (52.5) $ 42.0 “The Deal”
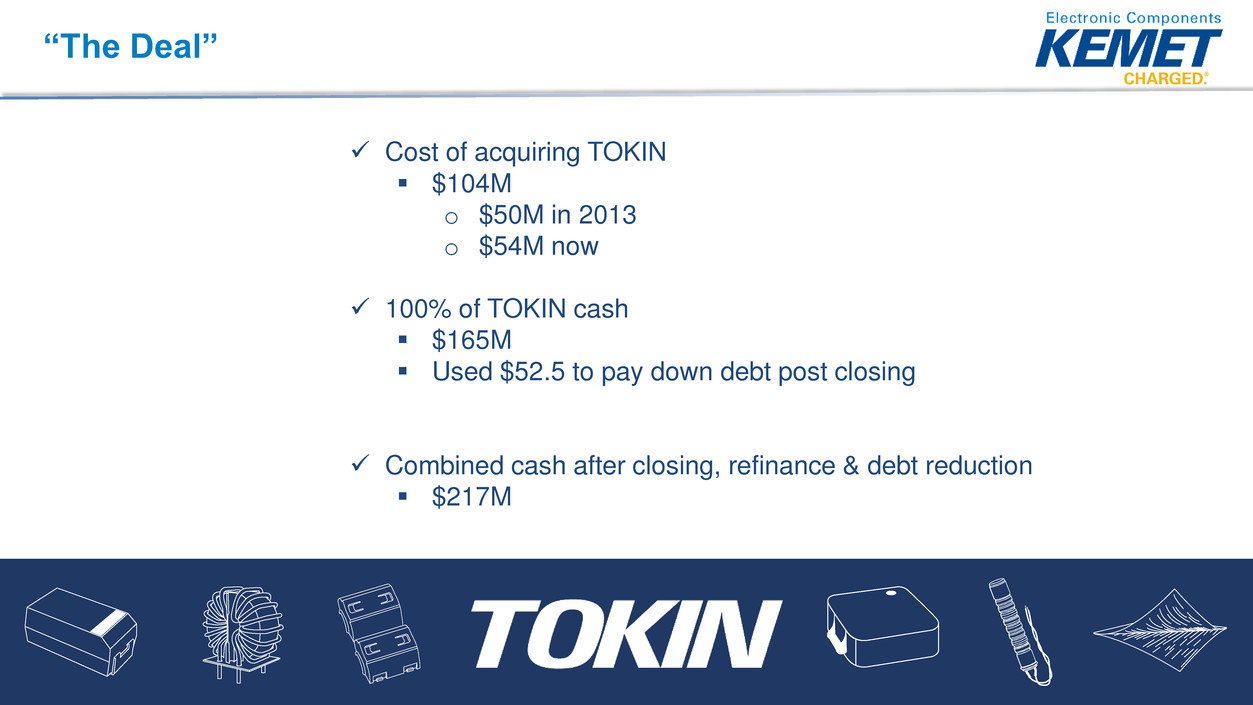
Cost of acquiring TOKIN $104M o $50M in 2013 o $54M now 100% of TOKIN cash $165M Used $52.5 to pay down debt post closing Combined cash after closing, refinance & debt reduction $217M “The Deal”
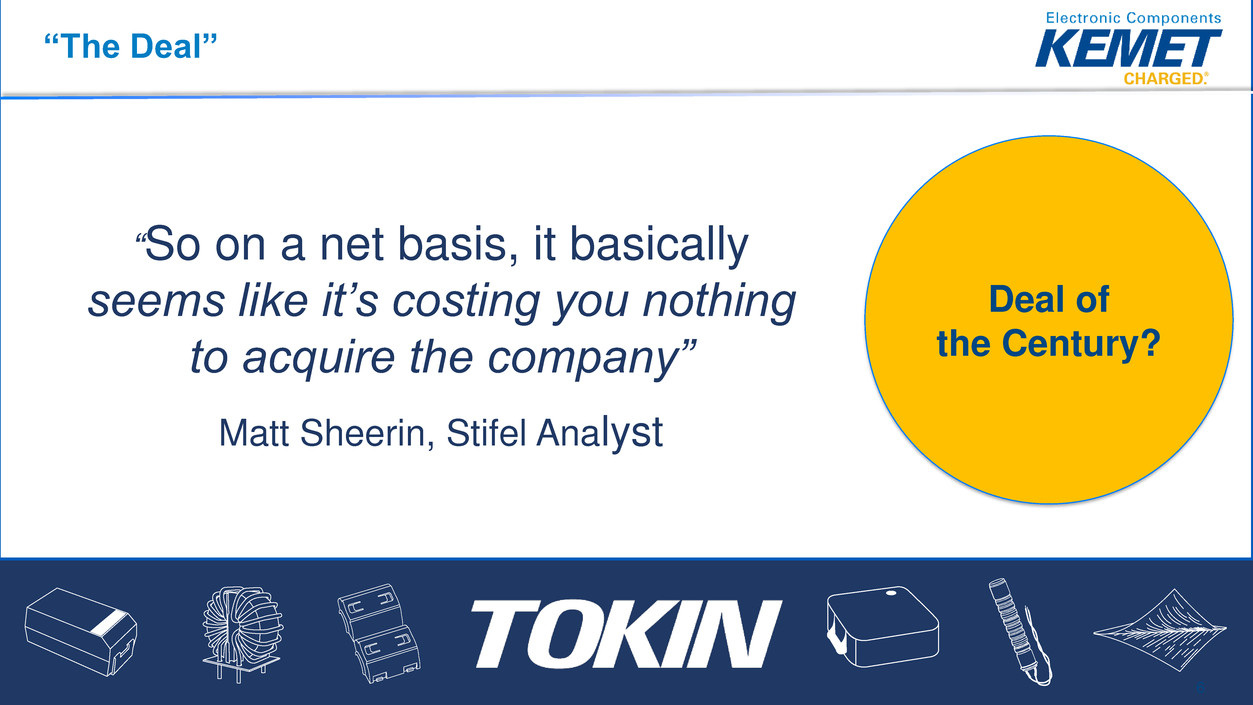
6 “So on a net basis, it basically seems like it’s costing you nothing to acquire the company” Matt Sheerin, Stifel Analyst Deal of the Century? “The Deal”
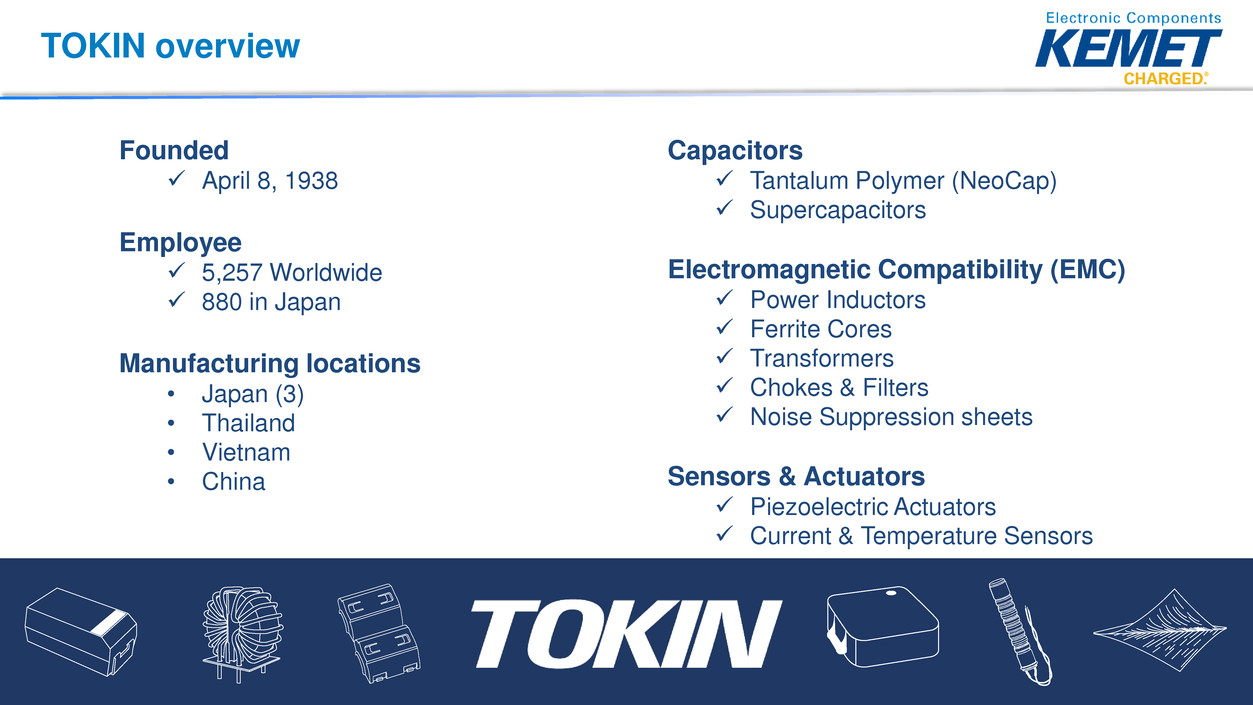
Founded April 8, 1938 Employee 5,257 Worldwide 880 in Japan Manufacturing locations • Japan (3) • Thailand • Vietnam • China Capacitors Tantalum Polymer (NeoCap) Supercapacitors Electromagnetic Compatibility (EMC) Power Inductors Ferrite Cores Transformers Chokes & Filters Noise Suppression sheets Sensors & Actuators Piezoelectric Actuators Current & Temperature Sensors TOKIN overview

High-Yield Bonds Refinanced 1) Fund redemption of all outstanding $353 million 10.5% Senior notes due 2018 2) Repaid outstanding amount on revolver of $34 million 3) New Term Loan: $345M US$ Rate = LIBOR + 600 bps $13M / year interest savings 5% annual principal amortization Matures April 28, 2024

PRODUCTS Capacitors Inductors Chokes Filters Sensors Actuators EMI Suppression PEOPLE 15,000 REVENUE $1.1 Billion & *Forecasted Net Sales FY18
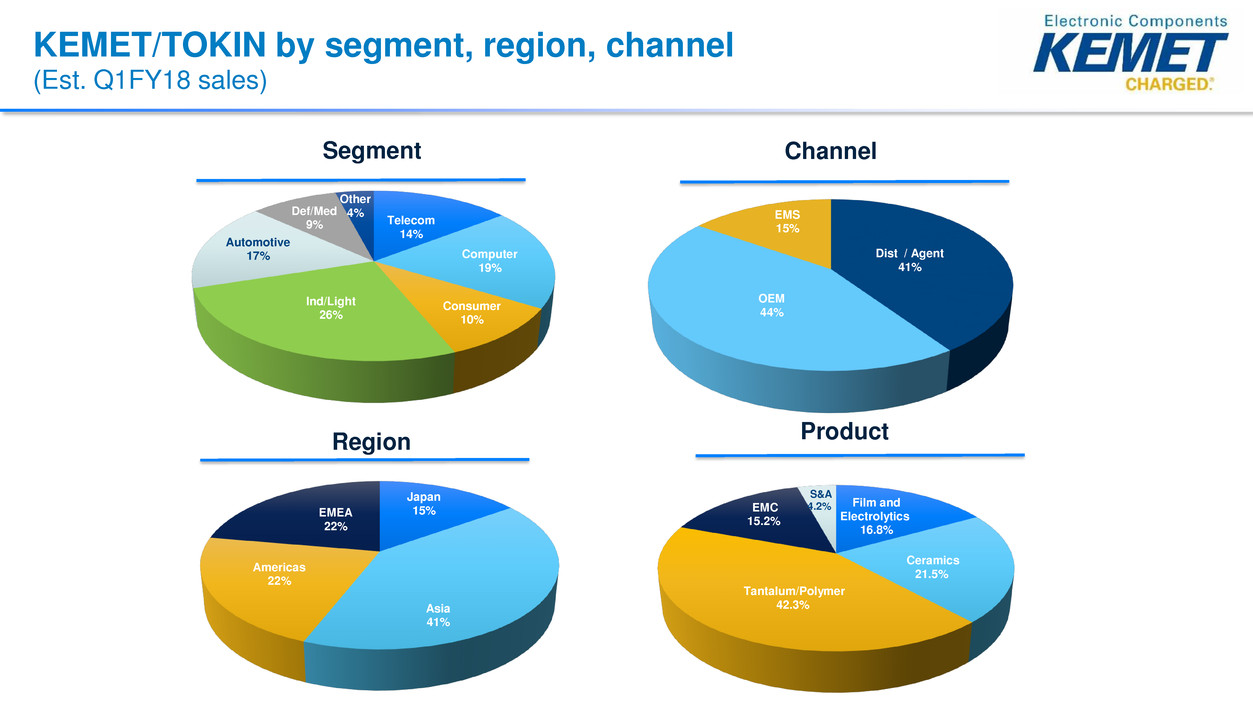
Dist / Agent 41% OEM 44% EMS 15% Japan 15% Asia 41% Americas 22% EMEA 22% Telecom 14% Computer 19% Consumer 10% Ind/Light 26% Automotive 17% Def/Med 9% Other 4% KEMET/TOKIN by segment, region, channel (Est. Q1FY18 sales) ChannelSegment Region Product Film and Electrolytics 16.8% Ceramics 21.5% Tantalum/Polymer 42.3% EMC 15.2% S&A 4.2%
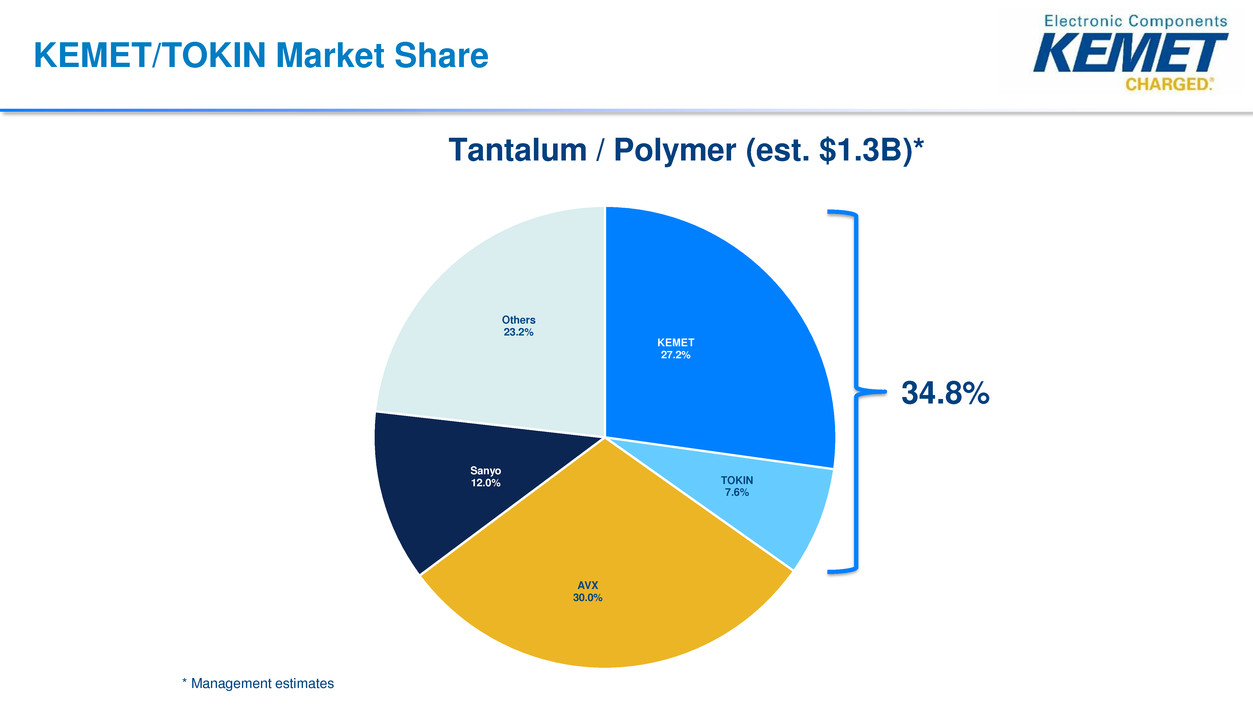
KEMET/TOKIN Market Share Tantalum / Polymer (est. $1.3B)* KEMET 27.2% TOKIN 7.6% AVX 30.0% Sanyo 12.0% Others 23.2% 34.8% * Management estimates
Market Trends
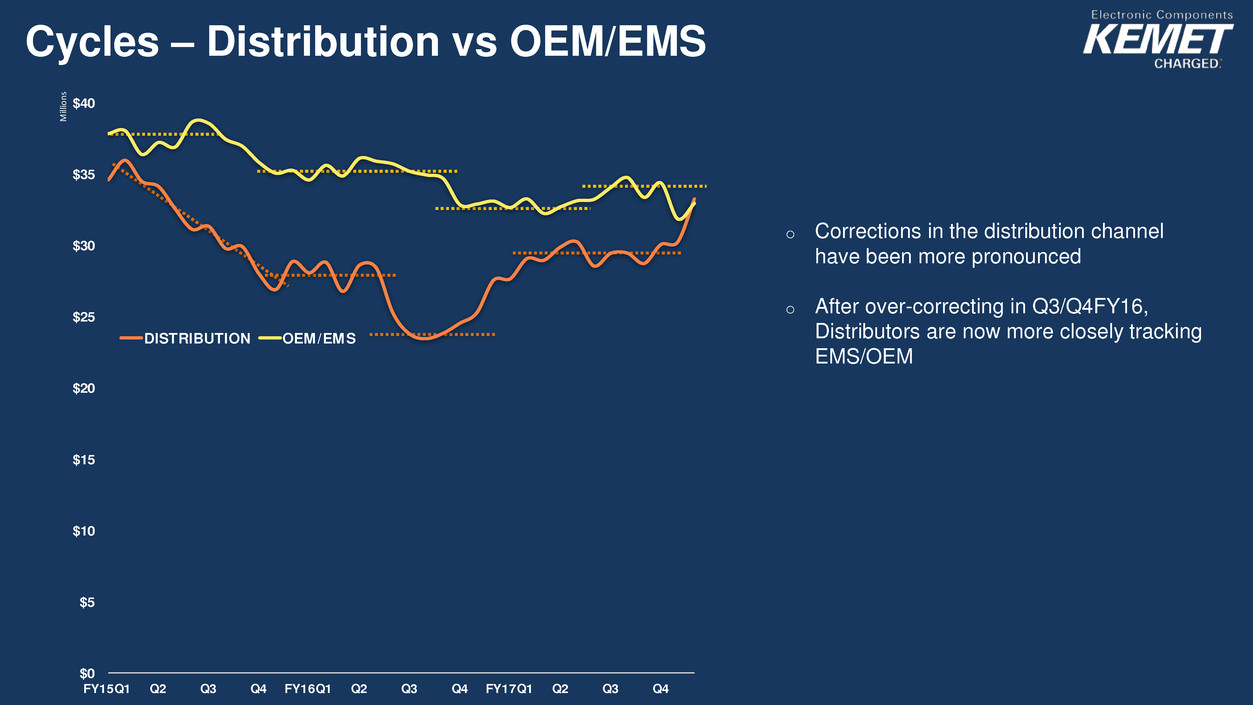
o Corrections in the distribution channel have been more pronounced o After over-correcting in Q3/Q4FY16, Distributors are now more closely tracking EMS/OEM Cycles – Distribution vs OEM/EMS Cycles – Distribution vs OEM/EMS $0 $5 $10 $15 $20 $25 $30 $35 $40 FY15Q1 Q2 Q3 Q4 FY16Q1 Q2 Q3 Q4 FY17Q1 Q2 Q3 Q4 M ill io n s DISTRIBUTION OEM/EMS
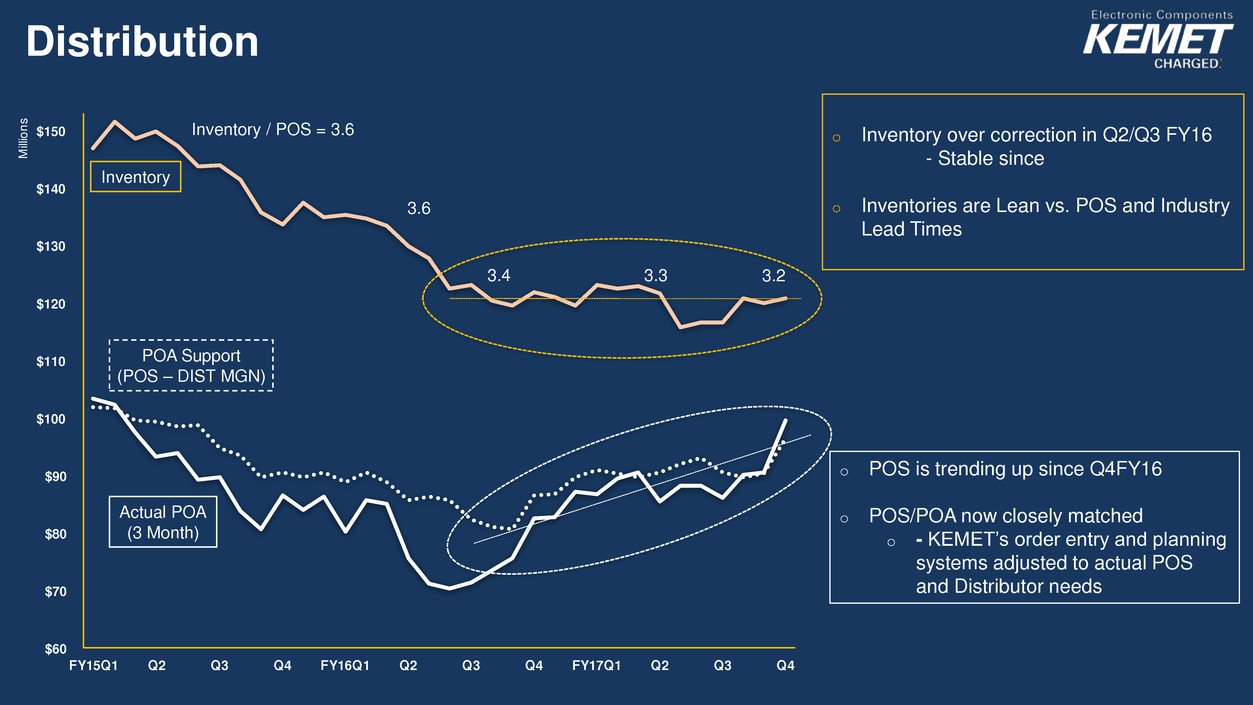
o Inventory over correction in Q2/Q3 FY16 - Stable since o Inventories are Lean vs. POS and Industry Lead Times Distribution $60 $70 $80 $90 $100 $110 $120 $130 $140 $150 FY15Q1 Q2 Q3 Q4 FY16Q1 Q2 Q3 Q4 FY17Q1 Q2 Q3 Q4 M illi on s POA Support (POS – DIST MGN) Actual POA (3 Month) Inventory Inventory / POS = 3.6 3.6 3.4 3.3 3.2 o POS is trending up since Q4FY16 o POS/POA now closely matched o - KEMET’s order entry and planning systems adjusted to actual POS and Distributor needs
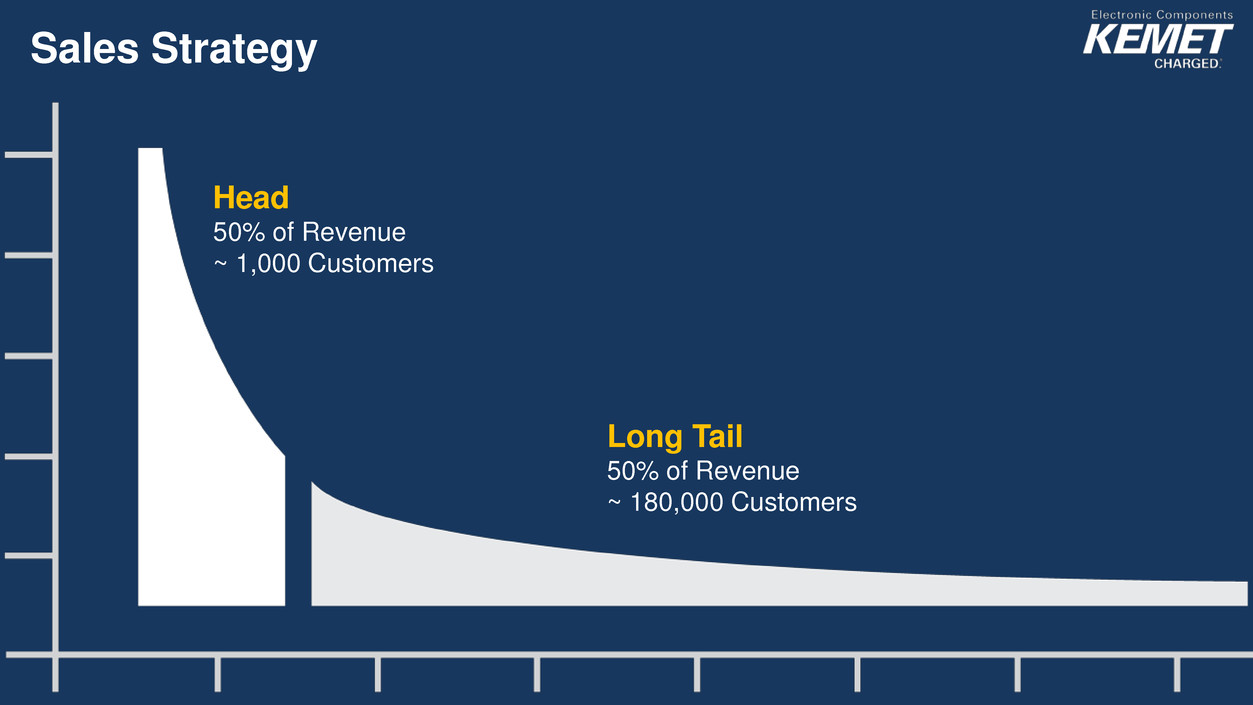
Sales Strategy Head 50% of Revenue ~ 1,000 Customers Long Tail 50% of Revenue ~ 180,000 Customers
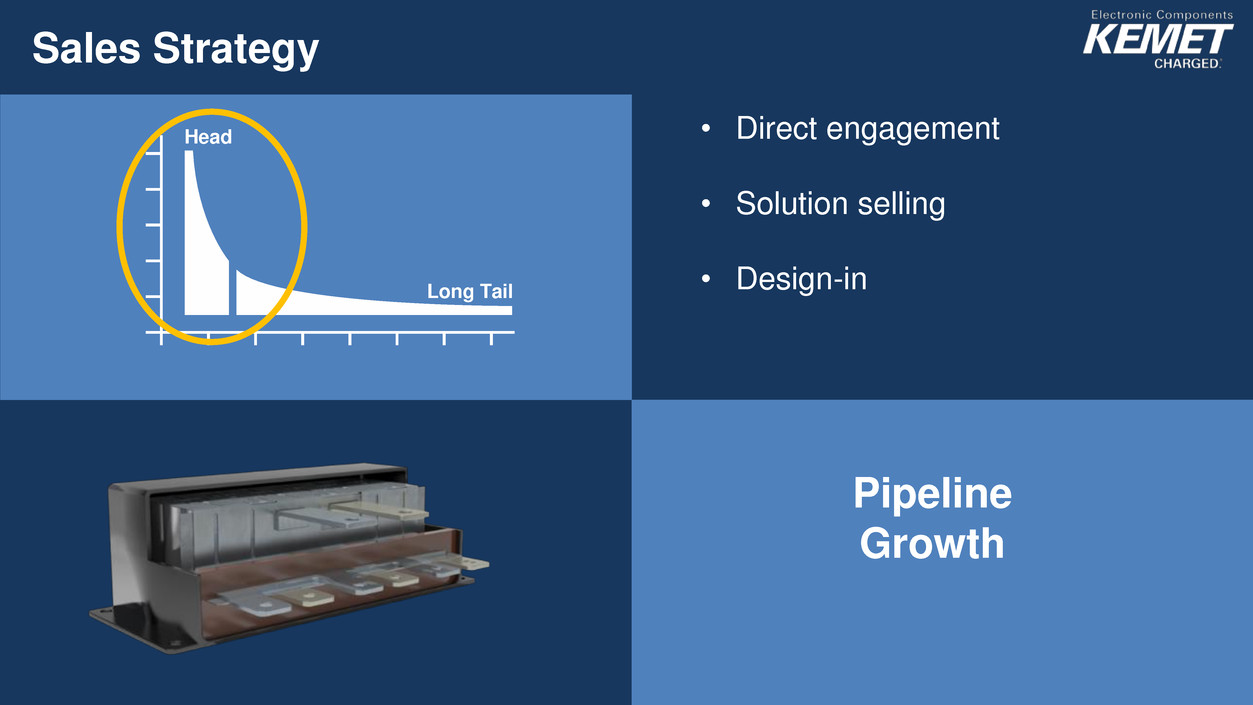
• Direct engagement • Solution selling • Design-in Sales Strategy Head Long Tail Pipeline Growth
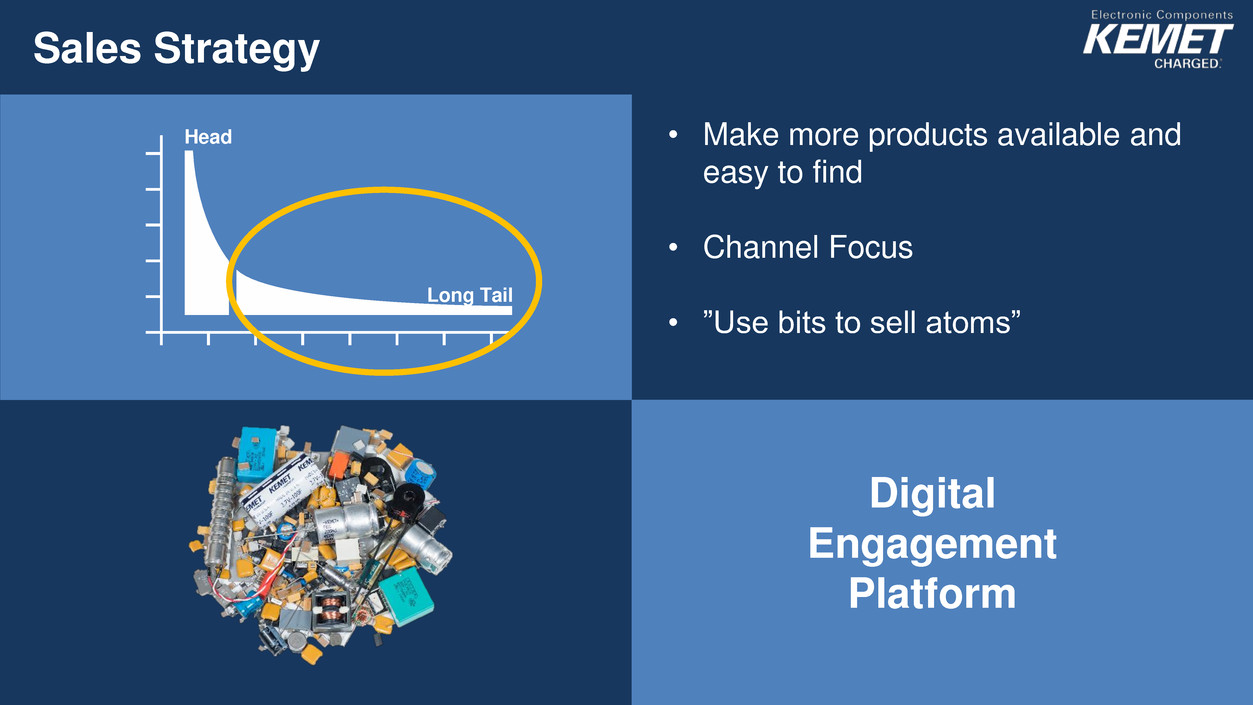
Head Long Tail • Make more products available and easy to find • Channel Focus • ”Use bits to sell atoms” Sales Strategy Digital Engagement Platform
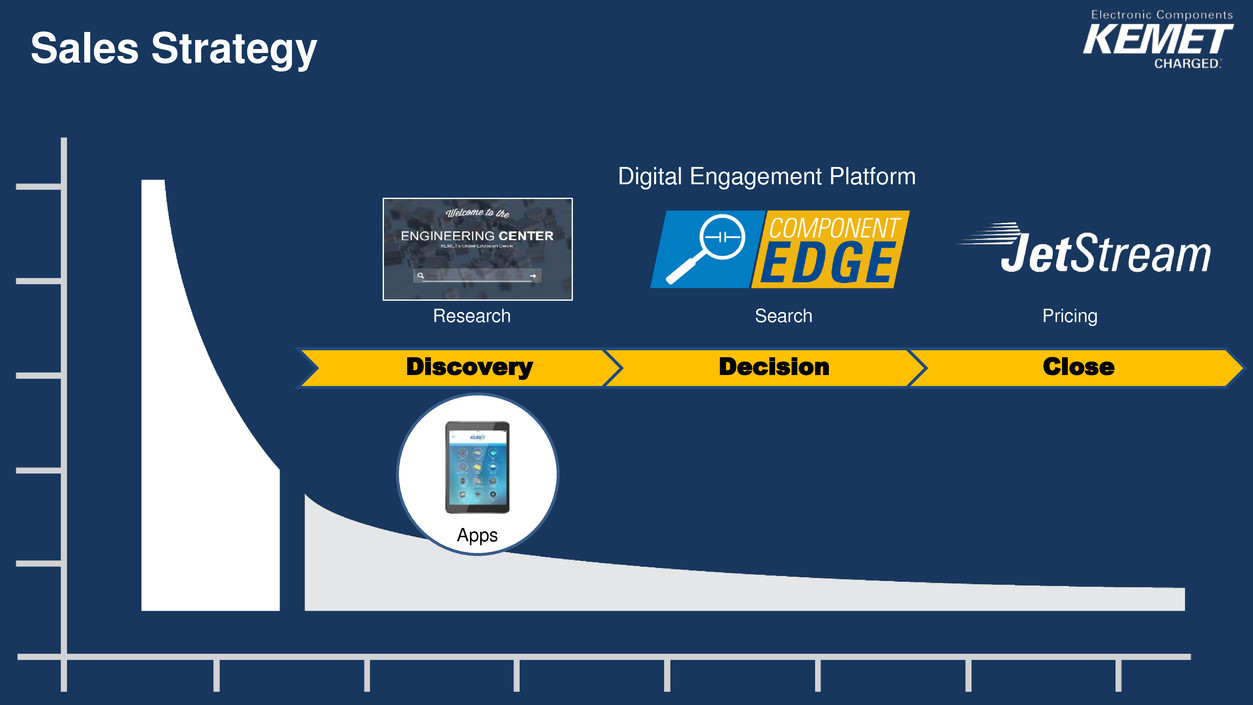
Sales Strategy Discovery Decision Close SearchResearch Pricing Apps Digital Engagement Platform
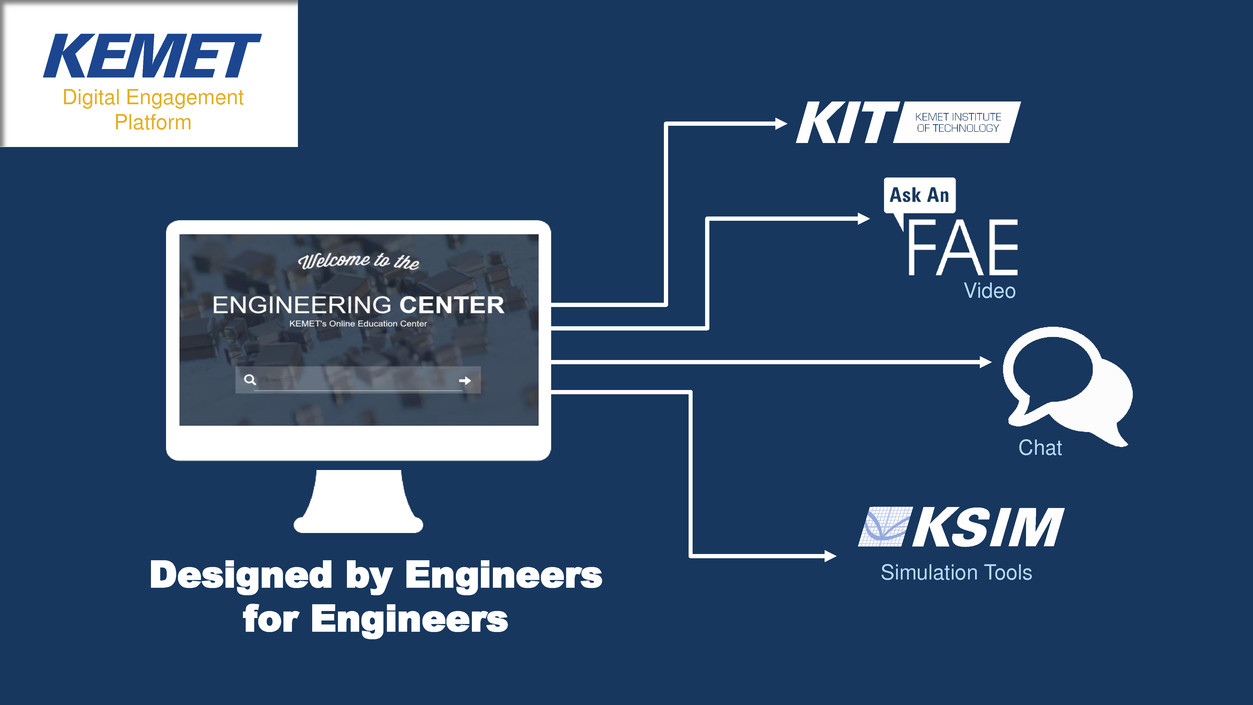
Simulation Tools Video Designed by Engineers for Engineers Chat Digital Engagement Platform
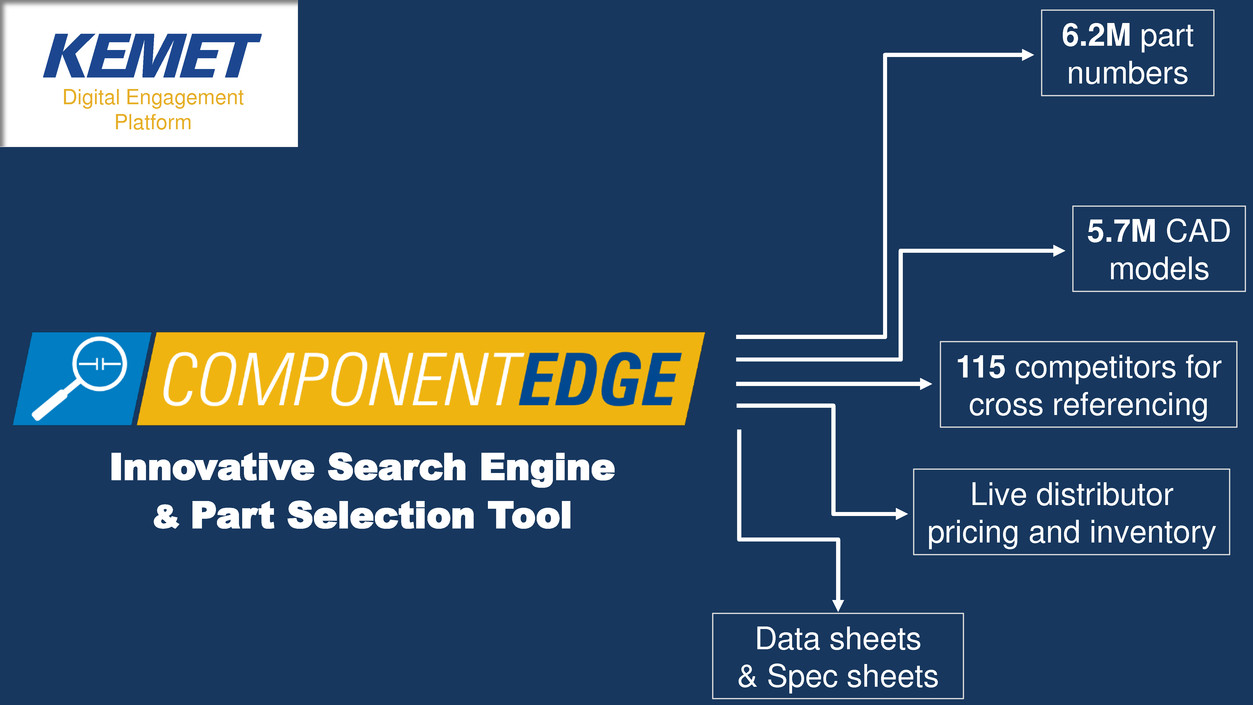
Innovative Search Engine & Part Selection Tool 6.2M part numbers 5.7M CAD models 115 competitors for cross referencing Live distributor pricing and inventory Data sheets & Spec sheets Digital Engagement Platform
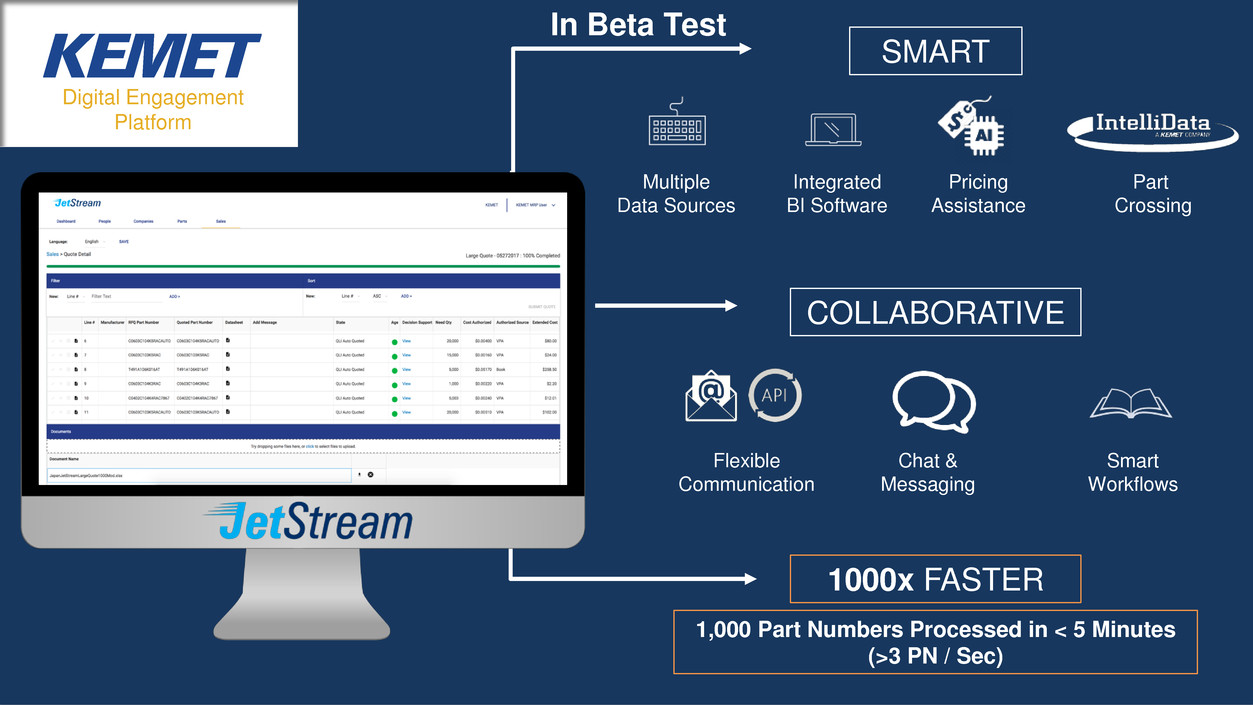
Integrated BI Software Multiple Data Sources Part Crossing SMART COLLABORATIVE Flexible Communication Smart Workflows Chat & Messaging Pricing Assistance 1000x FASTER 1,000 Part Numbers Processed in < 5 Minutes (>3 PN / Sec) Digital Engagement Platform In Beta Test

Next 10 years Major Drivers
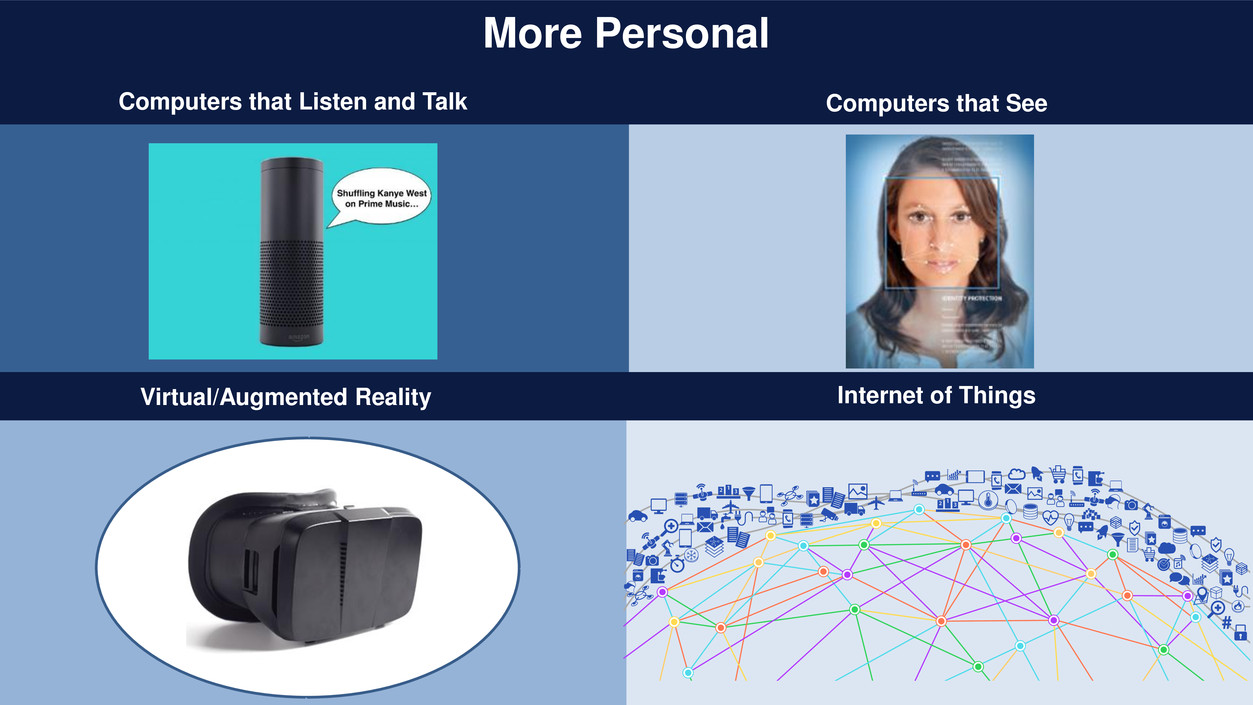
Computers that Listen and Talk Computers that See Virtual/Augmented Reality Internet of Things More Personal
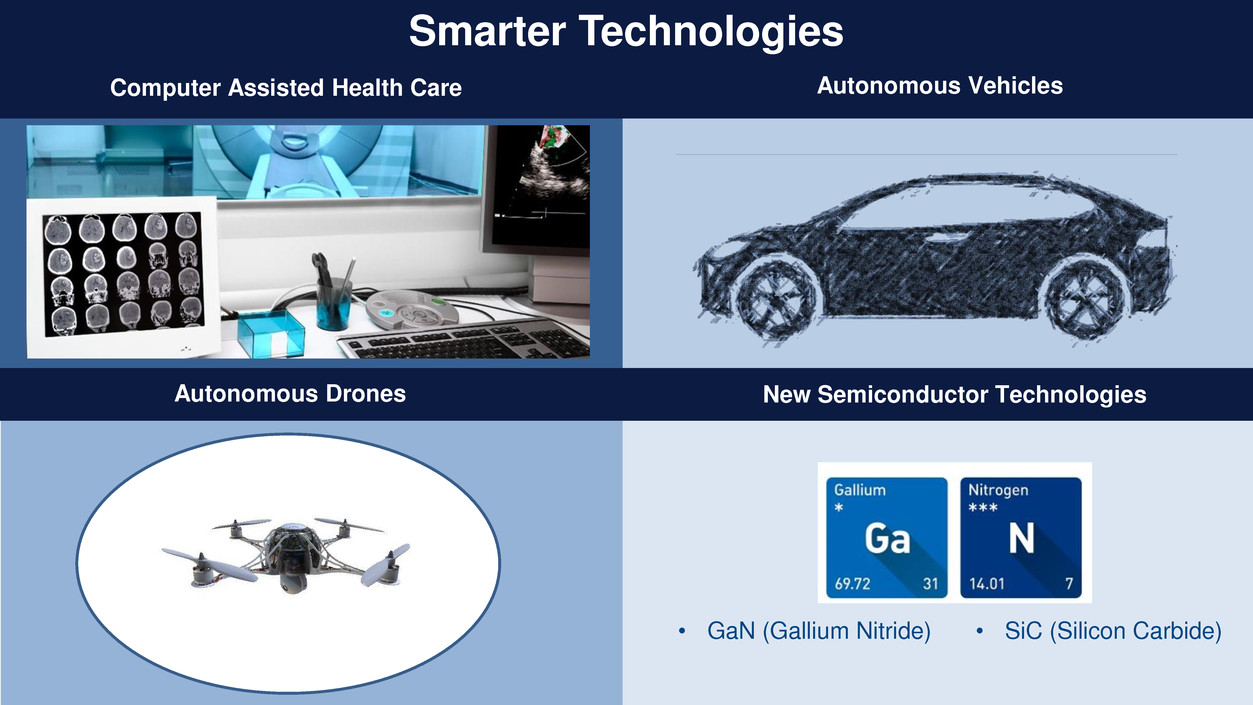
• GaN (Gallium Nitride) • SiC (Silicon Carbide) Computer Assisted Health Care Autonomous Vehicles New Semiconductor TechnologiesAutonomous Drones Smarter Technologies
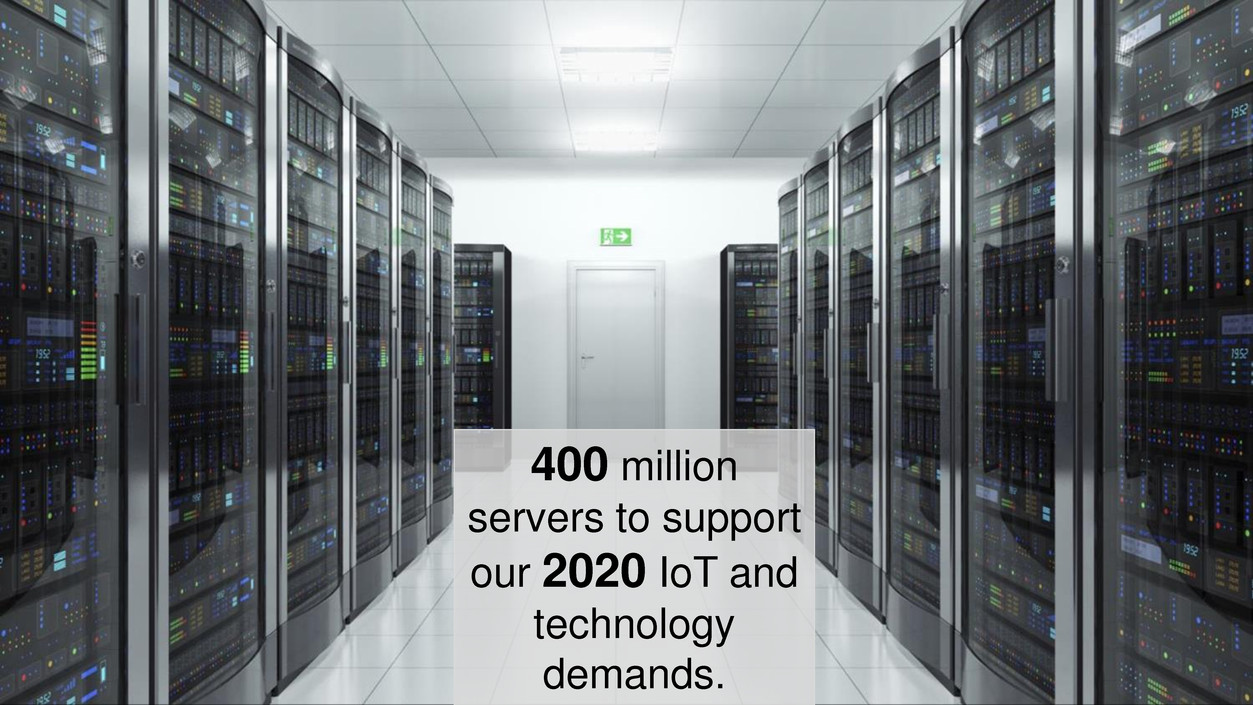
400 million servers to support our 2020 IoT and technology demands.
Energy Efficiency & State of the Art

Looking Ahead

TOKIN Integrate with elegance & appreciation • Improve profitability • Synergy activities
PEOPLE Creative & globally connected • Pride & loyalty • Philanthropic • Career engagement • Work-life balance
ADJACENCY 2.0 Technology relevance Investing in components to support: • Green energy • E-Cars • Internet of Things • Wearable medical devices • Wide Band Gap • Omnipresent digitalization
M&A • Not necessarily capacitors • Relevant technology with a sustainable revenue stream • Asia
ATOMS & BITS • Using digital to sell physical • “Creative Disruption”

PEOPLE ADJACENCY 2.0 M&A ATOMS & BITS

Summary Financial Information

Income Statement Highlights U.S. GAAP (Unaudited) Fiscal Year (Amounts in thousands, except percentages and per share data) 2017 2016 Net sales $ 757,791 $ 734,823 Gross margin $ 186,112 $ 163,280 Gross margin as a percentage of net sales 24.6% 22.2% Selling, general and administrative $ 107,868 $ 101,446 SG&A as a percentage of net sales 14.2% 13.8% Operating income (loss) $ 34,540 $ 32,326 Net income (loss) $ 47,989 $ (53,629) Per share data: Adjusted net income (loss) - basic $ 1.03 $ (1.17) Adjusted net income (loss) - diluted $ 0.87 $ (1.17) Weighted avg. shares - basic 46,552 46,004 Weighted avg. shares - diluted 55,389 46,004 35
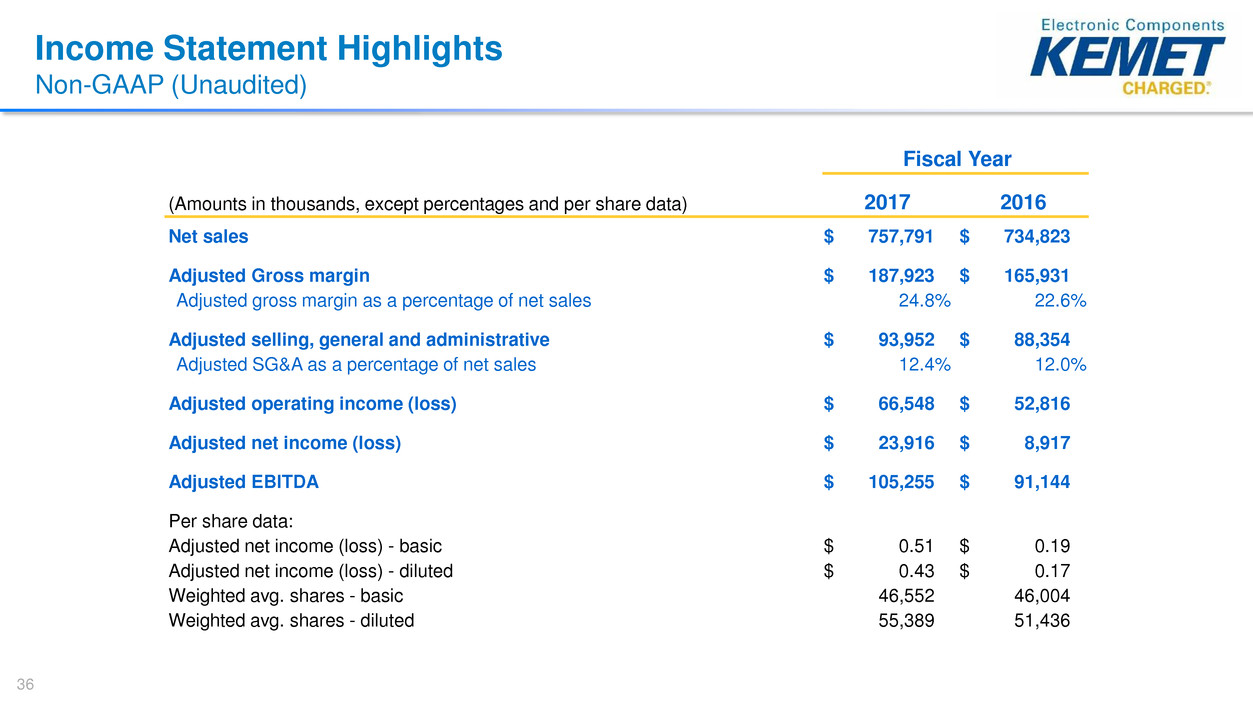
Income Statement Highlights Non-GAAP (Unaudited) Fiscal Year (Amounts in thousands, except percentages and per share data) 2017 2016 Net sales $ 757,791 $ 734,823 Adjusted Gross margin $ 187,923 $ 165,931 Adjusted gross margin as a percentage of net sales 24.8% 22.6% Adjusted selling, general and administrative $ 93,952 $ 88,354 Adjusted SG&A as a percentage of net sales 12.4% 12.0% Adjusted operating income (loss) $ 66,548 $ 52,816 Adjusted net income (loss) $ 23,916 $ 8,917 Adjusted EBITDA $ 105,255 $ 91,144 Per share data: Adjusted net income (loss) - basic $ 0.51 $ 0.19 Adjusted net income (loss) - diluted $ 0.43 $ 0.17 Weighted avg. shares - basic 46,552 46,004 Weighted avg. shares - diluted 55,389 51,436 36
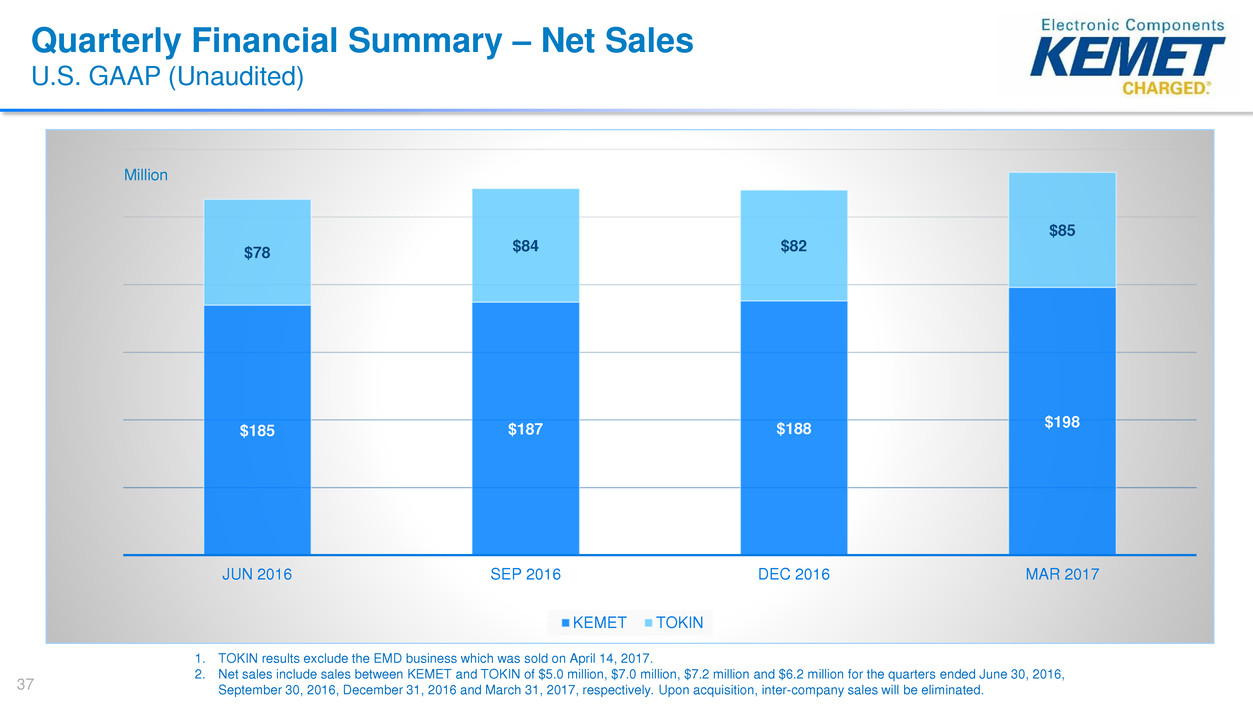
Quarterly Financial Summary – Net Sales U.S. GAAP (Unaudited) $185 $187 $188 $198 $78 $84 $82 $85 JUN 2016 SEP 2016 DEC 2016 MAR 2017 KEMET TOKIN 1. TOKIN results exclude the EMD business which was sold on April 14, 2017. 2. Net sales include sales between KEMET and TOKIN of $5.0 million, $7.0 million, $7.2 million and $6.2 million for the quarters ended June 30, 2016, September 30, 2016, December 31, 2016 and March 31, 2017, respectively. Upon acquisition, inter-company sales will be eliminated. Million 37
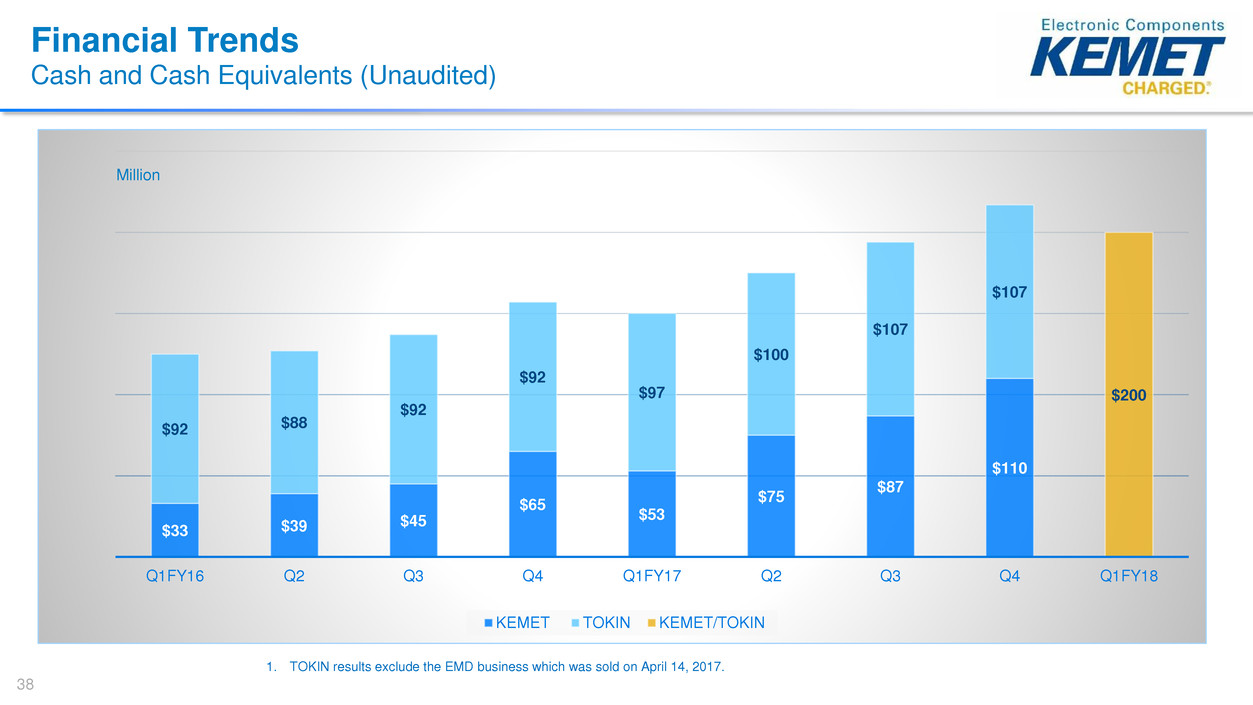
Financial Trends Cash and Cash Equivalents (Unaudited) $33 $39 $45 $65 $53 $75 $87 $110 $92 $88 $92 $92 $97 $100 $107 $107 $200 Q1FY16 Q2 Q3 Q4 Q1FY17 Q2 Q3 Q4 Q1FY18 KEMET TOKIN KEMET/TOKIN 1. TOKIN results exclude the EMD business which was sold on April 14, 2017. Million 38

Forecast Assumptions Net Sales l Total Net Sales projected to grow at a 2.2% CAGR from FY 2017 to FY 2022Forecast does not include increase potential market synergies from cross selling Gross Margin l Combined Gross Margin projected to expand from 23.6% in FY 2017 to 26.5% in FY 2022 Adjusted EBITDA l Total Adjusted EBITDA (excluding unrealized synergies) projected to grow at a 7.8% CAGR from FY 2017 to FY 2022. Depreciation expense approximately $57 million prior to purchase accounting effects. Synergies l Synergies of $11.3 million, $11.0 million and $8.4 million projected for FY 2018, FY 2019 and FY 2020, respectively l One-time equivalent cash costs to achieve projected overhead reductions of $9 million, $7 million and $4 million in FY 2018, FY 2019 and FY 2020, respectively Other Cash Flow Items l Capital expenditures projected to increase to support increased production capacity to meet additional demand, primarily for polymer products l Working capital projected to remain consistent as a percentage of Net Sales 39
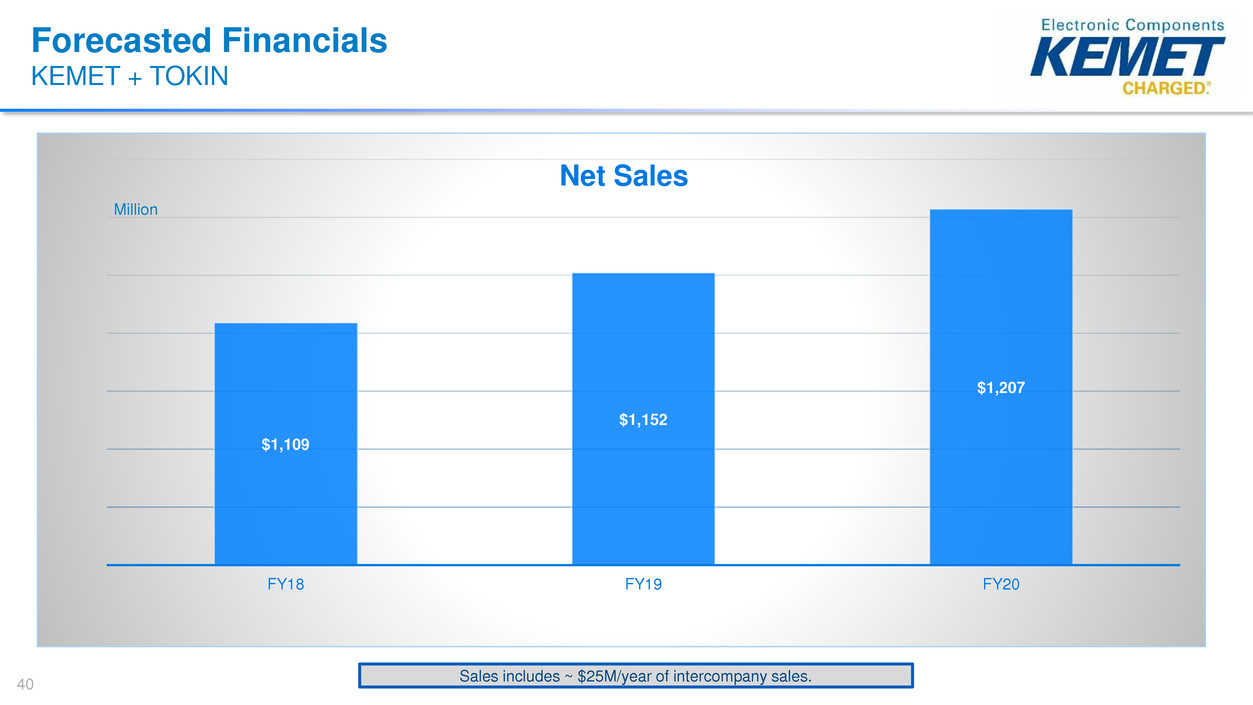
Forecasted Financials KEMET + TOKIN $1,109 $1,152 $1,207 FY18 FY19 FY20 Net Sales Sales includes ~ $25M/year of intercompany sales. Million 40
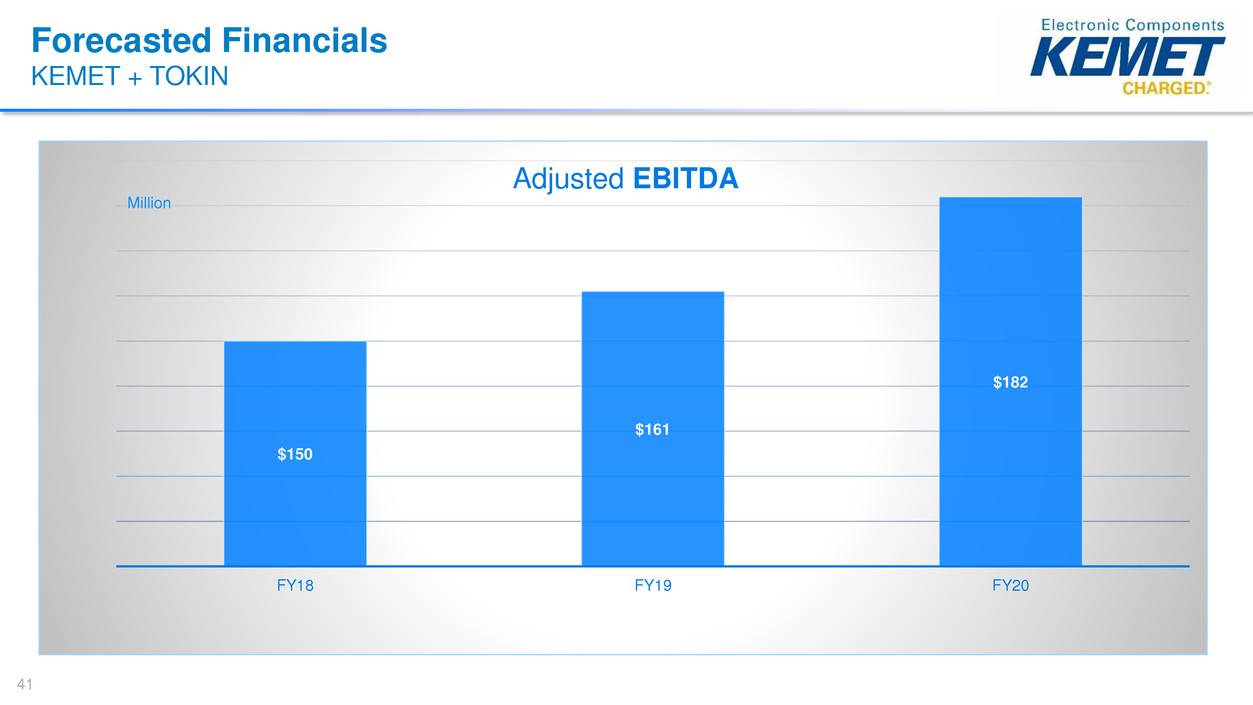
Forecasted Financials KEMET + TOKIN $150 $161 $182 FY18 FY19 FY20 Adjusted EBITDA Million 41
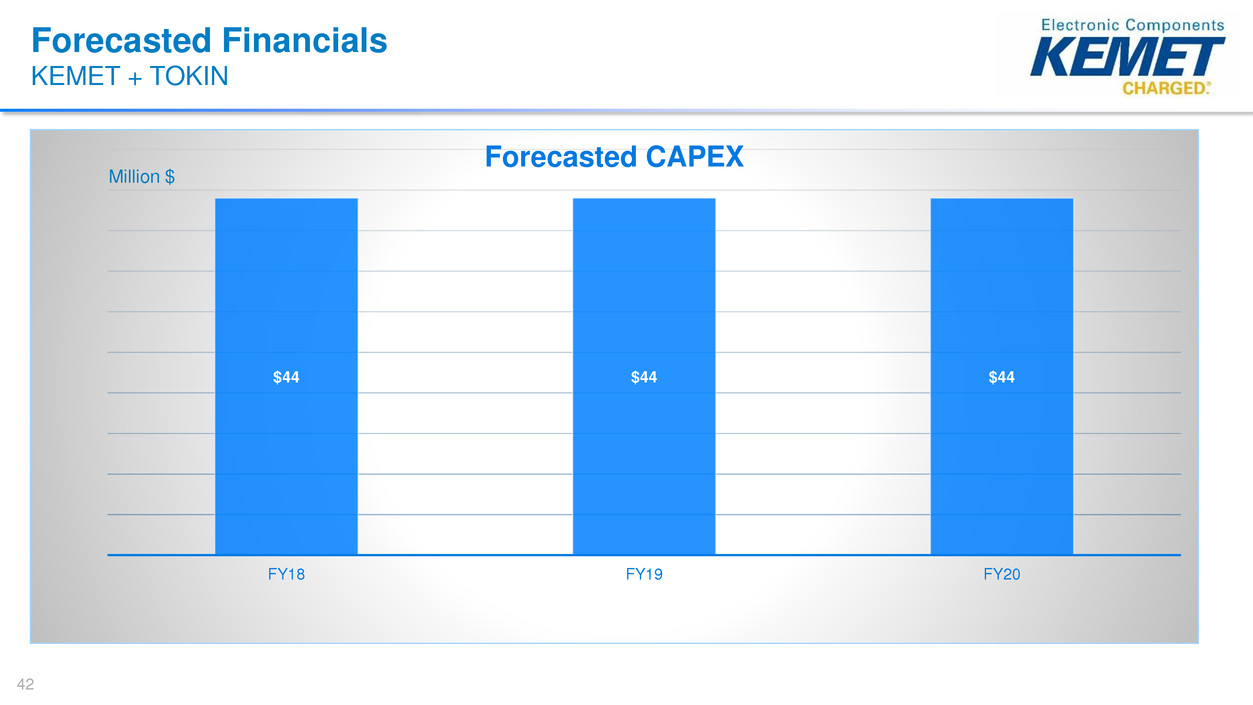
Forecasted Financials KEMET + TOKIN $44 $44 $44 FY18 FY19 FY20 Forecasted CAPEX Million $ 42
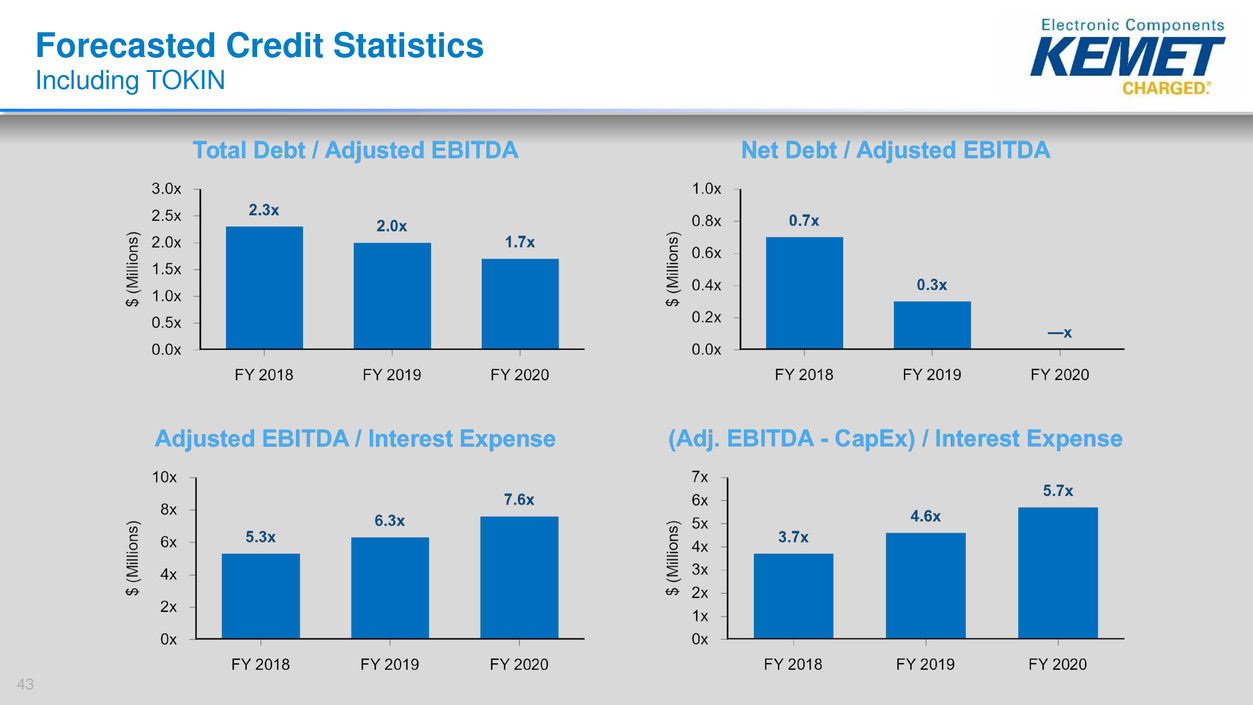
Forecasted Credit Statistics Including TOKIN 43
QUESTIONS?
Appendix

Adjusted Gross Margin Non-GAAP (Unaudited) Fiscal Year (Amounts in thousands, except percentages) 2017 2016 Net sales $ 757,791 $ 734,823 Cost of sales $ 571,679 $ 571,543 Gross margin (U.S. GAAP) $ 186,112 $ 163,280 Gross margin as a percentage of net sales 24.6% 22.2% Adjustments: Stock-based compensation expense 1,384 1,418 Plant start-up costs 427 861 Plant shut-down costs — 372 Adjusted gross margin (non-GAAP) $ 187,923 $ 165,931 Adjusted gross margin as a percentage of net sales 24.8% 22.6% 46
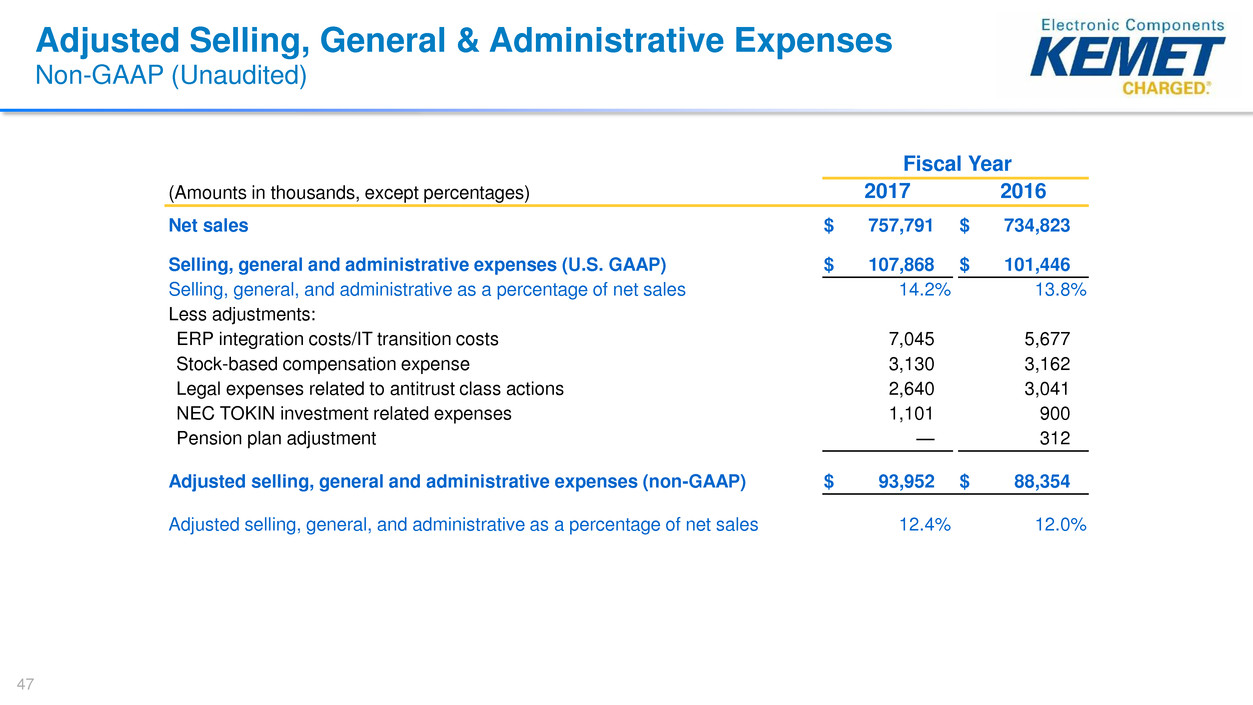
Adjusted Selling, General & Administrative Expenses Non-GAAP (Unaudited) Fiscal Year (Amounts in thousands, except percentages) 2017 2016 Net sales $ 757,791 $ 734,823 Selling, general and administrative expenses (U.S. GAAP) $ 107,868 $ 101,446 Selling, general, and administrative as a percentage of net sales 14.2% 13.8% Less adjustments: ERP integration costs/IT transition costs 7,045 5,677 Stock-based compensation expense 3,130 3,162 Legal expenses related to antitrust class actions 2,640 3,041 NEC TOKIN investment related expenses 1,101 900 Pension plan adjustment — 312 Adjusted selling, general and administrative expenses (non-GAAP) $ 93,952 $ 88,354 Adjusted selling, general, and administrative as a percentage of net sales 12.4% 12.0% 47
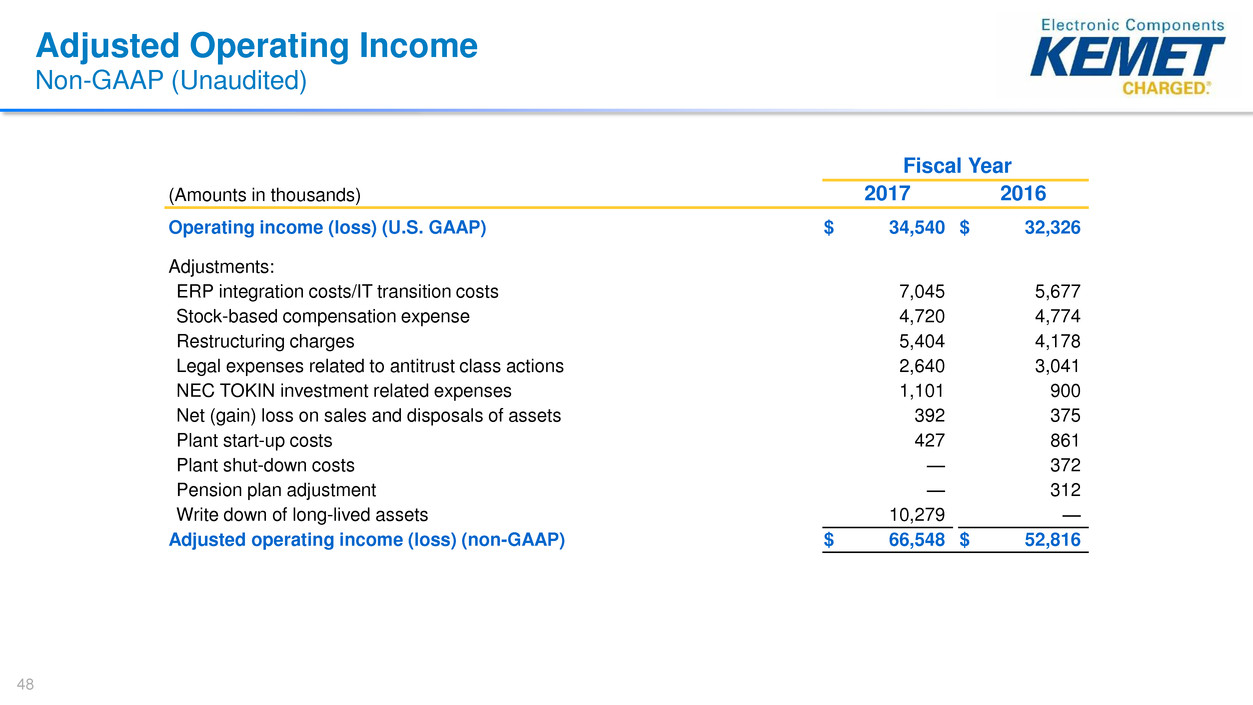
Adjusted Operating Income Non-GAAP (Unaudited) Fiscal Year (Amounts in thousands) 2017 2016 Operating income (loss) (U.S. GAAP) $ 34,540 $ 32,326 Adjustments: ERP integration costs/IT transition costs 7,045 5,677 Stock-based compensation expense 4,720 4,774 Restructuring charges 5,404 4,178 Legal expenses related to antitrust class actions 2,640 3,041 NEC TOKIN investment related expenses 1,101 900 Net (gain) loss on sales and disposals of assets 392 375 Plant start-up costs 427 861 Plant shut-down costs — 372 Pension plan adjustment — 312 Write down of long-lived assets 10,279 — Adjusted operating income (loss) (non-GAAP) $ 66,548 $ 52,816 48
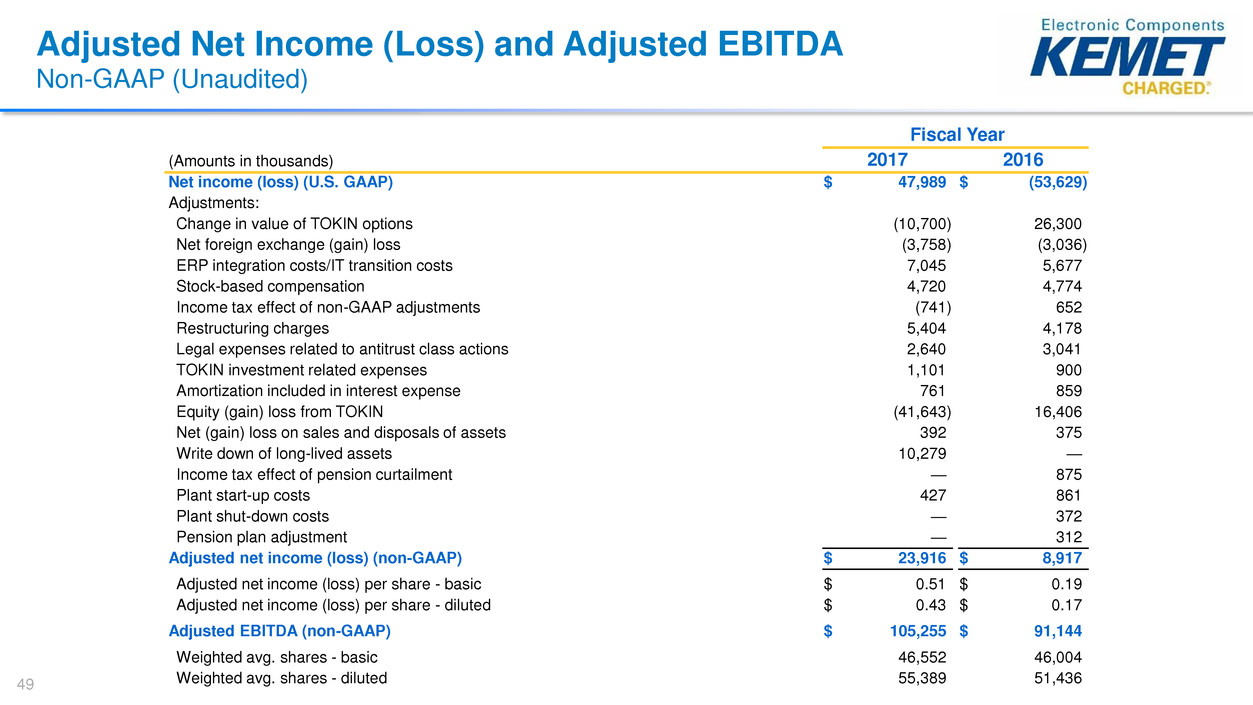
Adjusted Net Income (Loss) and Adjusted EBITDA Non-GAAP (Unaudited) Fiscal Year (Amounts in thousands) 2017 2016 Net income (loss) (U.S. GAAP) $ 47,989 $ (53,629) Adjustments: Change in value of TOKIN options (10,700) 26,300 Net foreign exchange (gain) loss (3,758) (3,036) ERP integration costs/IT transition costs 7,045 5,677 Stock-based compensation 4,720 4,774 Income tax effect of non-GAAP adjustments (741) 652 Restructuring charges 5,404 4,178 Legal expenses related to antitrust class actions 2,640 3,041 TOKIN investment related expenses 1,101 900 Amortization included in interest expense 761 859 Equity (gain) loss from TOKIN (41,643) 16,406 Net (gain) loss on sales and disposals of assets 392 375 Write down of long-lived assets 10,279 — Income tax effect of pension curtailment — 875 Plant start-up costs 427 861 Plant shut-down costs — 372 Pension plan adjustment — 312 Adjusted net income (loss) (non-GAAP) $ 23,916 $ 8,917 Adjusted net income (loss) per share - basic $ 0.51 $ 0.19 Adjusted net income (loss) per share - diluted $ 0.43 $ 0.17 Adjusted EBITDA (non-GAAP) $ 105,255 $ 91,144 Weighted avg. shares - basic 46,552 46,004 Weighted avg. shares - diluted 55,389 51,43649
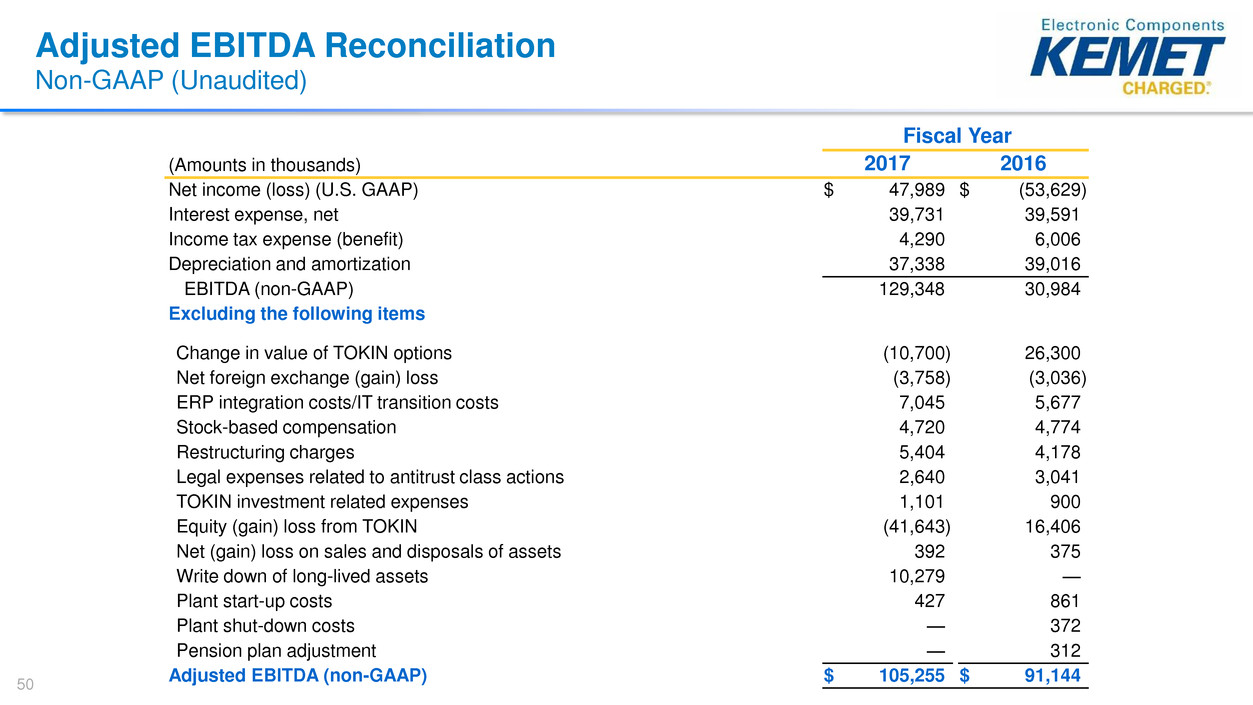
Adjusted EBITDA Reconciliation Non-GAAP (Unaudited) Fiscal Year (Amounts in thousands) 2017 2016 Net income (loss) (U.S. GAAP) $ 47,989 $ (53,629) Interest expense, net 39,731 39,591 Income tax expense (benefit) 4,290 6,006 Depreciation and amortization 37,338 39,016 EBITDA (non-GAAP) 129,348 30,984 Excluding the following items Change in value of TOKIN options (10,700) 26,300 Net foreign exchange (gain) loss (3,758) (3,036) ERP integration costs/IT transition costs 7,045 5,677 Stock-based compensation 4,720 4,774 Restructuring charges 5,404 4,178 Legal expenses related to antitrust class actions 2,640 3,041 TOKIN investment related expenses 1,101 900 Equity (gain) loss from TOKIN (41,643) 16,406 Net (gain) loss on sales and disposals of assets 392 375 Write down of long-lived assets 10,279 — Plant start-up costs 427 861 Plant shut-down costs — 372 Pension plan adjustment — 312 Adjusted EBITDA (non-GAAP) $ 105,255 $ 91,144 50
Forecast: Non-GAAP Reconciliation A reconciliation of net income to Adjusted EBITDA as projected for 2018, 2019 and 2020 is not provided. KEMET does not forecast net income as we cannot, without unreasonable effort, estimate or predict with certainty various components of net income. These components include net foreign exchange (gain) loss, further restructuring and other income or charges incurred in 2018, 2019 or 2020 as well as the related tax impacts of these items. Additionally, discrete tax items could drive variability in our projected effective tax rate. All of these components could significantly impact such financial measures. Further, in the future, other items with similar characteristics to those currently included in Adjusted EBITDA that have a similar impact on comparability of periods, and which are not known at this time, may exist and impact adjusted EBITDA. 51


