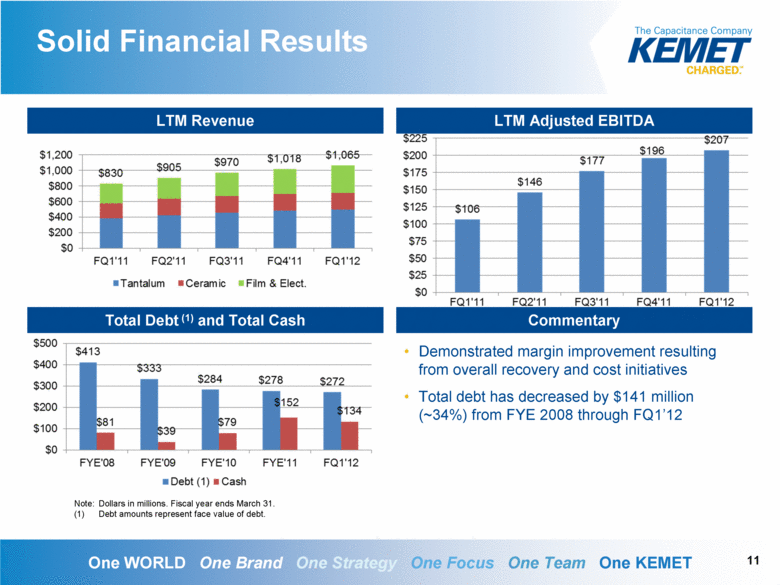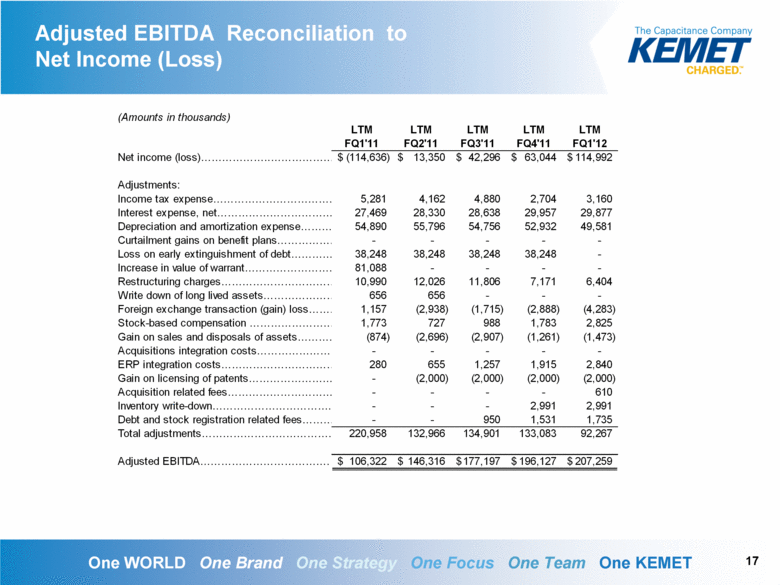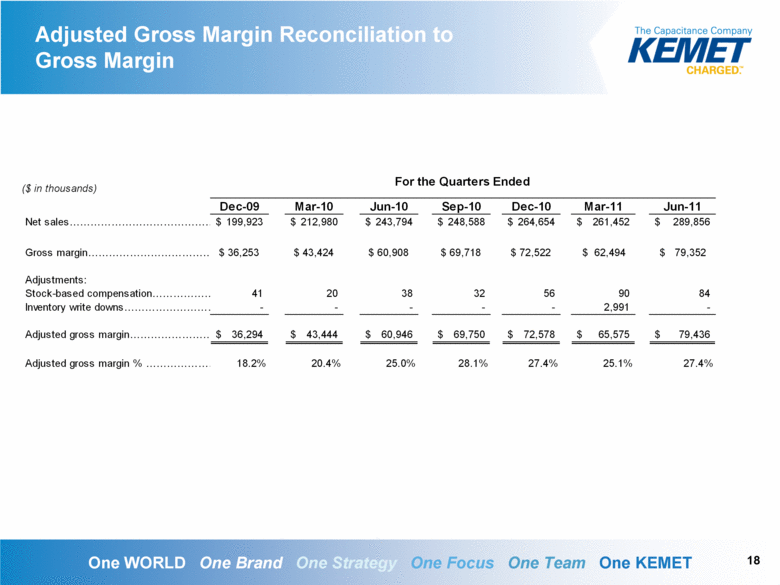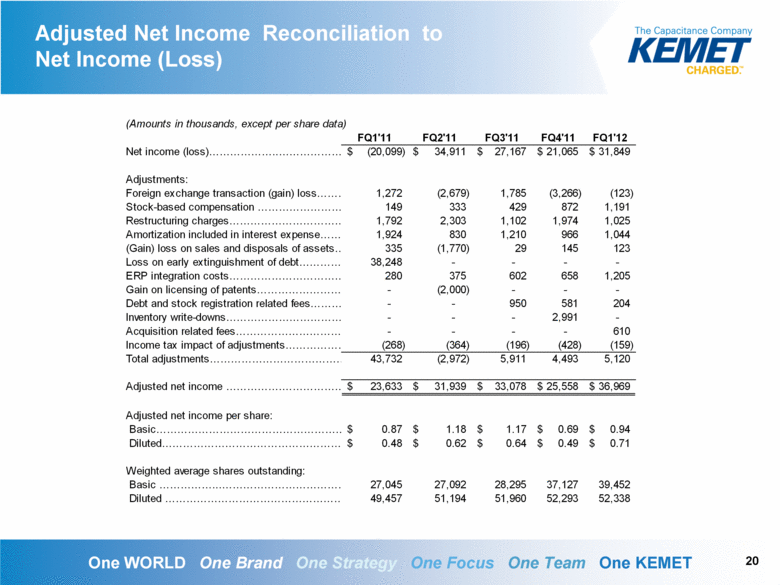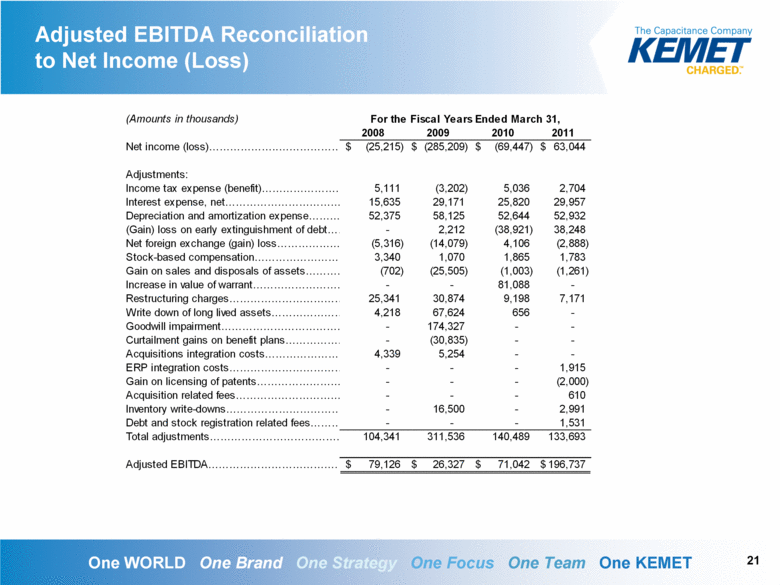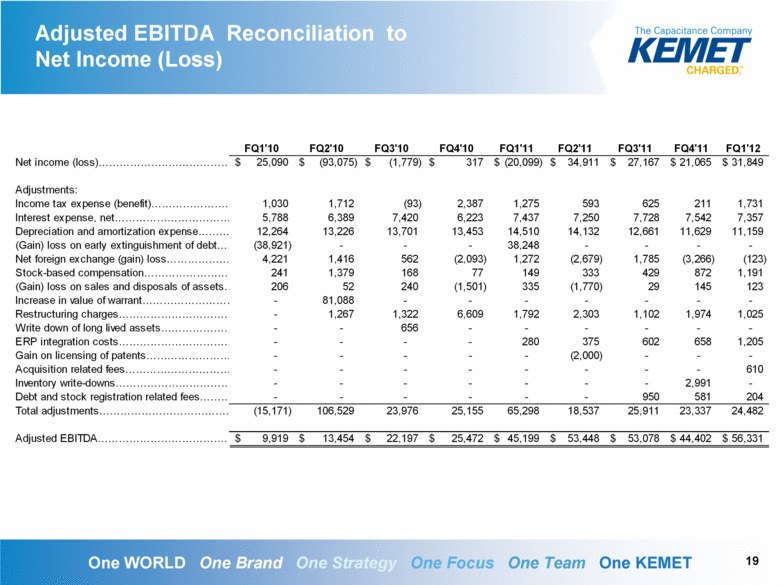
| Adjusted EBITDA Reconciliation to Net Income (Loss) 19 FQ1'10 FQ2'10 FQ3'10 FQ4'10 FQ1'11 FQ2'11 FQ3'11 FQ4'11 FQ1'12 Net income (loss) 25,090 $ (93,075) $ (1,779) $ 317 $ (20,099) $ 34,911 $ 27,167 $ 21,065 $ 31,849 $ Adjustments: Income tax expense (benefit). 1,030 1,712 (93) 2,387 1,275 593 625 211 1,731 Interest expense, net. 5,788 6,389 7,420 6,223 7,437 7,250 7,728 7,542 7,357 Depreciation and amortization expense. 12,264 13,226 13,701 13,453 14,510 14,132 12,661 11,629 11,159 (Gain) loss on early extinguishment of debt. (38,921) - - - 38,248 - - - - Net foreign exchange (gain) loss. 4,221 1,416 562 (2,093) 1,272 (2,679) 1,785 (3,266) (123) Stock-based compensation 241 1,379 168 77 149 333 429 872 1,191 (Gain) loss on sales and disposals of assets. 206 52 240 (1,501) 335 (1,770) 29 145 123 Increase in value of warrant. - 81,088 - - - - - - - Restructuring charges. - 1,267 1,322 6,609 1,792 2,303 1,102 1,974 1,025 Write down of long lived assets. - - 656 - - - - - - ERP integration costs - - - - 280 375 602 658 1,205 Gain on licensing of patents. - - - - - (2,000) - - - Acquisition related fees - - - - - - - - 610 Inventory write-downs. - - - - - - - 2,991 - Debt and stock registration related fees - - - - - - 950 581 204 Total adjustments (15,171) 106,529 23,976 25,155 65,298 18,537 25,911 23,337 24,482 Adjusted EBITDA. 9,919 $ 13,454 $ 22,197 $ 25,472 $ 45,199 $ 53,448 $ 53,078 $ 44,402 $ 56,331 $ |
