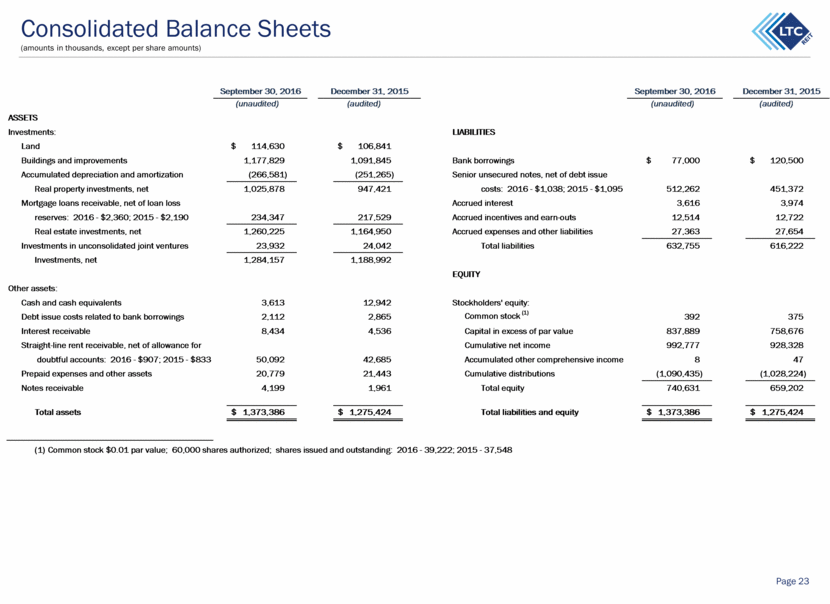
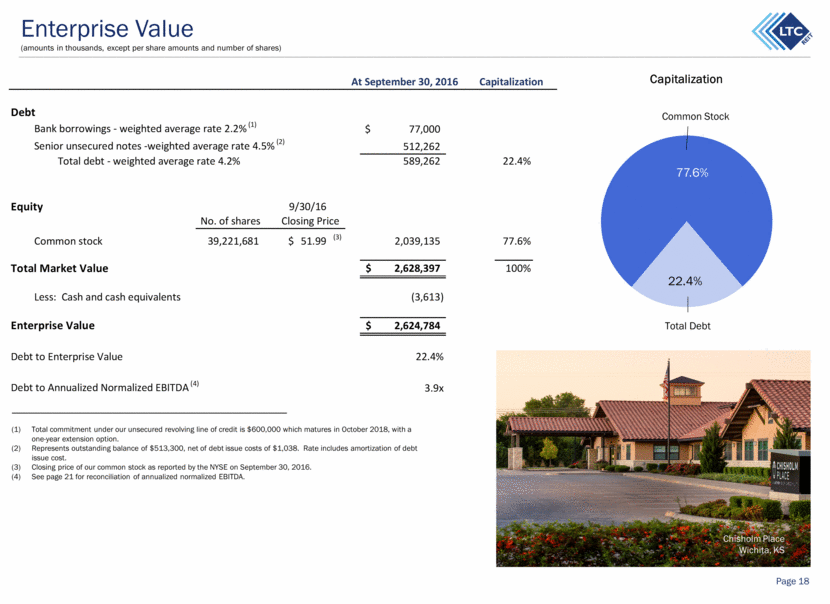
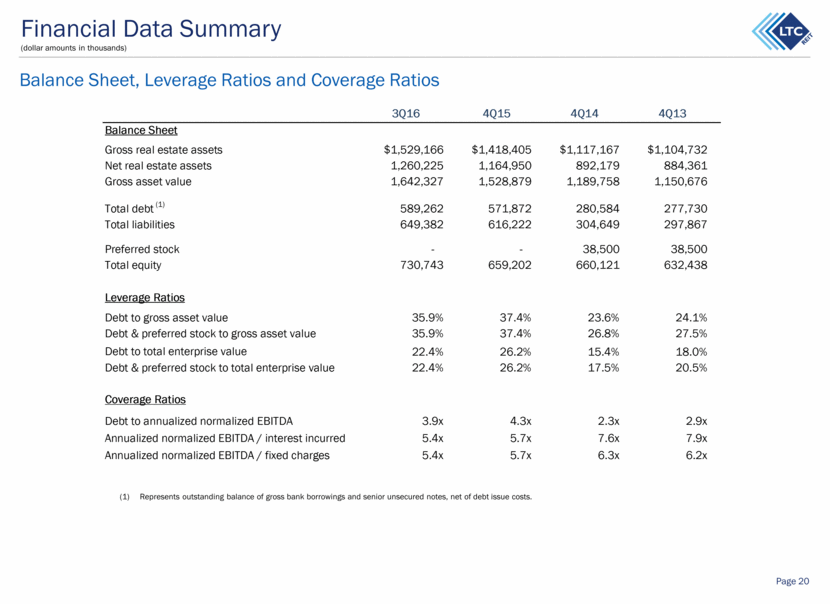
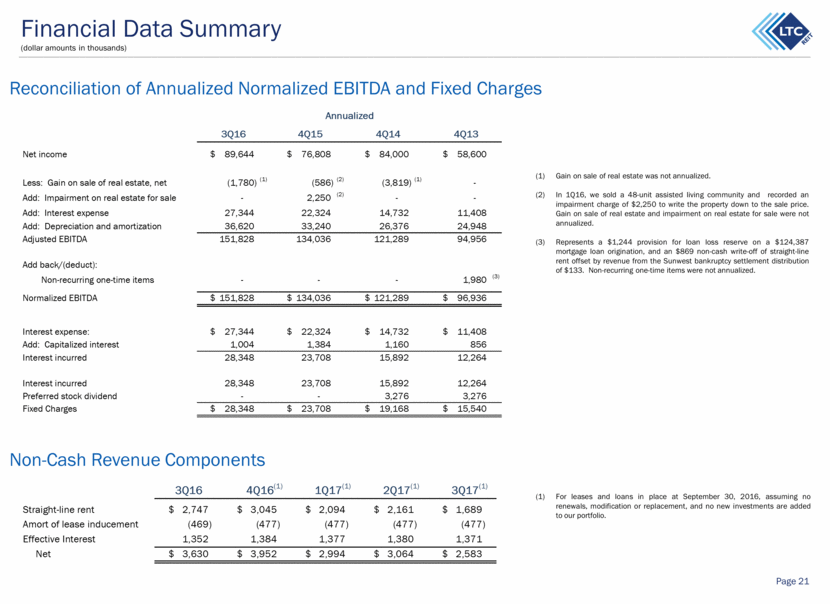
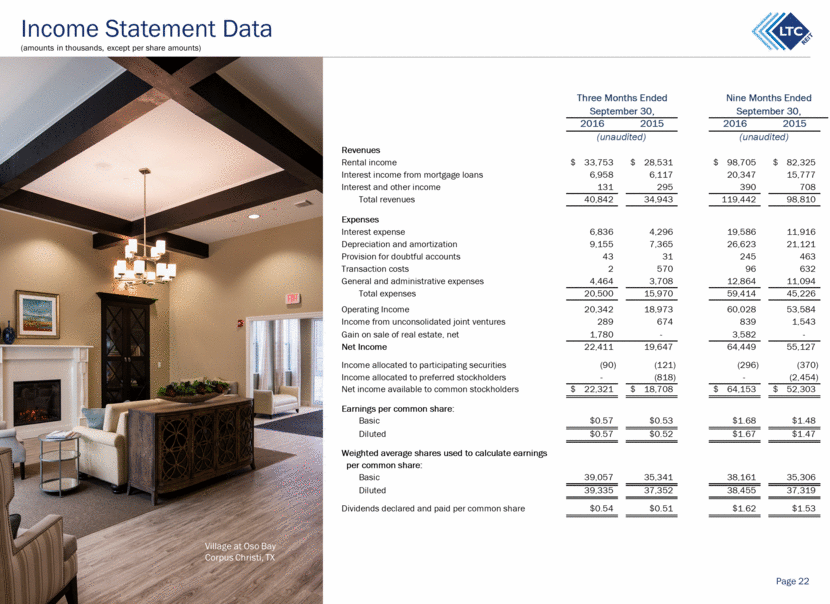
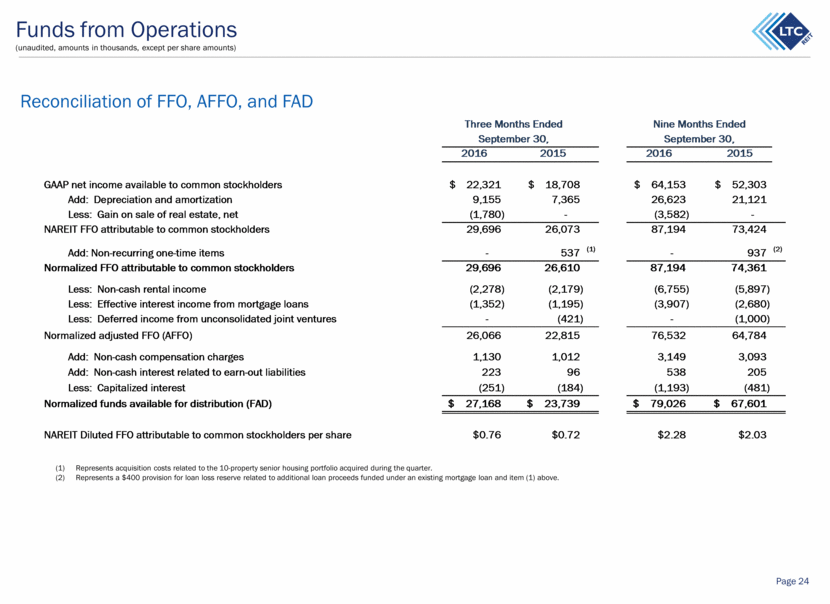
Consolidated Balance Sheets (amounts in thousands, except per share amounts) Page 23 (unaudited) (audited) (unaudited) (audited) ASSETS Investments: LIABILITIES Land 114,630 $ 106,841 $ Buildings and improvements 1,177,829 1,091,845 Bank borrowings 77,000 $ 120,500 $ Accumulated depreciation and amortization (266,581) (251,265) Senior unsecured notes, net of debt issue Real property investments, net 1,025,878 947,421 costs: 2016 - $1,038; 2015 - $1,095 512,262 451,372 Mortgage loans receivable, net of loan loss Accrued interest 3,616 3,974 reserves: 2016 - $2,360; 2015 - $2,190 234,347 217,529 Accrued incentives and earn-outs 12,514 12,722 Real estate investments, net 1,260,225 1,164,950 Accrued expenses and other liabilities 27,363 27,654 Investments in unconsolidated joint ventures 23,932 24,042 Total liabilities 632,755 616,222 Investments, net 1,284,157 1,188,992 EQUITY Other assets: Cash and cash equivalents 3,613 12,942 Stockholders' equity: Debt issue costs related to bank borrowings 2,112 2,865 Common stock (1) 392 375 Interest receivable 8,434 4,536 Capital in excess of par value 837,889 758,676 Straight-line rent receivable, net of allowance for Cumulative net income 992,777 928,328 doubtful accounts: 2016 - $907; 2015 - $833 50,092 42,685 Accumulated other comprehensive income 8 47 Prepaid expenses and other assets 20,779 21,443 Cumulative distributions (1,090,435) (1,028,224) Notes receivable 4,199 1,961 Total equity 740,631 659,202 Total assets 1,373,386 $ 1,275,424 $ Total liabilities and equity 1,373,386 $ 1,275,424 $ (1) Common stock $0.01 par value; 60,000 shares authorized; shares issued and outstanding: 2016 - 39,222; 2015 - 37,548 September 30, 2016 September 30, 2016 December 31, 2015 December 31, 2015
