Exhibit 99.2

RENEWAL AND TRANSITION SUPPLEMENTAL OPERATING AND FINANCIAL DATA FIRST QUARTER 2022

1Q 2022 SUPPLEMENTAL REPORT FORWARD - LOOKING STATEMENTS This supplemental information contains forward - looking statements within the meaning of Section 27 A of the Securities Act of 1933 , as amended, and Section 21 E of the Securities Exchange Act of 1934 , as amended, adopted pursuant to the Private Securities Litigation Reform Act of 1995 . Statements that are not purely historical may be forward - looking . You can identify some of the forward - looking statements by their use of forward - looking words, such as ‘‘believes,’’ ‘‘expects,’’ ‘‘may,’’ ‘‘will,’’ ‘‘should,’’ ‘‘seeks,’’ ‘‘approximately,’’ ‘‘intends,’’ ‘‘plans,’’ ‘‘estimates’’ or ‘‘anticipates,’’ or the negative of those words or similar words . Forward - looking statements involve inherent risks and uncertainties regarding events, conditions and financial trends that may affect our future plans of operation, business strategy, results of operations and financial position . A number of important factors could cause actual results to differ materially from those included within or contemplated by such forward - looking statements, including, but not limited to, the status of the economy, the status of capital markets (including prevailing interest rates), and our access to capital ; the income and returns available from investments in health care related real estate, the ability of our borrowers and lessees to meet their obligations to us, our reliance on a few major operators ; competition faced by our borrowers and lessees within the health care industry, regulation of the health care industry by federal, state and local governments, changes in Medicare and Medicaid reimbursement amounts (including due to federal and state budget constraints), compliance with and changes to regulations and payment policies within the health care industry, debt that we may incur and changes in financing terms, our ability to continue to qualify as a real estate investment trust, the relative illiquidity of our real estate investments, potential limitations on our remedies when mortgage loans default, and risks and liabilities in connection with properties owned through limited liability companies and partnerships . For a discussion of these and other factors that could cause actual results to differ from those contemplated in the forward - looking statements, please see the discussion under ‘‘Risk Factors’’ and other information contained in our Annual Report on Form 10 - K for the fiscal year ended December 31 , 2021 and in our publicly available filings with the Securities and Exchange Commission . We do not undertake any responsibility to update or revise any of these factors or to announce publicly any revisions to forward - looking statements, whether as a result of new information, future events or otherwise . NON - GAAP INFORMATION This supplemental information contains certain non - GAAP information including EBITDA re , adjusted EBITDA re , FFO, FFO excluding non - recurring items, FAD, FAD excluding non - recurring items, adjusted interest coverage ratio, and adjusted fixed charges coverage ratio . A reconciliation of this non - GAAP information is provided on pages 22 , 25 and 26 of this supplemental information, and additional information is available under the “Non - GAAP Financial Measures” subsection under the “Selected Financial Data” section of our website at www . LTCreit . com . TABLE OF CONTENTS 2 COMPANY Company Information & Leadership 3 INVESTMENTS Real Estate Activities Investments and Capital Recycling 4 Acquisitions, Mortgage & Mezzanine Loan Originations 5 Joint Ventures 6 Lease-Up and Renovations & Expansions 7 5-Year Lease-Up History 8 PORTFOLIO Overview 9-10 Maturity 11 Diversification Operators 12-13 Geography, MSA, Age of Portfolio 14-15 Real Estate Investments Metrics 16 Update 17 FINANCIAL Enterprise Value 18 Debt Metrics 19 Debt Maturity 20 Financial Data Summary 21-22 Income Statement Data 23 Consolidated Balance Sheets 24 Funds from Operations 25-26 ESG and GLOSSARY ESG (Environmental, Social & Governance) 27 Glossary 28-29

1Q 2022 SUPPLEMENTAL REPORT 3 Founded in 1992 , LTC Properties, Inc . (NYSE : LTC) is a self - administered real estate investment trust (REIT) investing in seniors housing and health care properties primarily through sale - leaseback transactions, mortgage financing and structured finance solutions including preferred equity and mezzanine lending . LTC’s portfolio encompasses Skilled Nursing Facilities (SNF), Assisted Living Communities (ALF), Independent Living Communities (ILF), Memory Care Communities (MC) and combinations thereof . Our main objective is to build and grow a diversified portfolio that creates and sustains shareholder value while providing our stockholders current distribution income . To meet this objective, we seek properties operated by regional operators, ideally offering upside and portfolio diversification (geographic, operator, property type and investment vehicle) . For more information, visit www . LTCreit . com . Any opinions, estimates, or forecasts regarding LTC’s performance made by the analysts listed above do not represent the opinions, estimates, and forecasts of LTC or its management. BOARD OF DIRECTORS ANALYSTS WENDY SIMPSON Chairman and Chief Executive Officer PAM KESSLER Co - President, CFO and Secretary CLINT MALIN Co - President and Chief Investment Officer CECE CHIKHALE Executive Vice President, Chief Accounting Officer and Treasurer DOUG KOREY Executive Vice President, Managing Director of Business Development PETER LYEW Vice President, Director of Taxes GIBSON SATTERWHITE Senior Vice President, Asset Management MANDI HOGAN Vice President of Marketing, Investor Relations and ESG MIKE BOWDEN Vice President, Investments LEADERSHIP RACHEL SON Vice President and Controller LTC PROPERTIES, INC. 2829 Townsgate Road Suite 350 Westlake Village, CA 91361 805 - 981 - 8655 www.LTCreit.com TRANSFER AGENT Broadridge Shareholder Services c/o Broadridge Corporate Issuer Solutions 1155 Long Island Avenue Edgewood, NY 11717 - 8309 ATTN: IWS 866 - 708 - 5586 WENDY SIMPSON Chairman CORNELIA CHENG ESG Committee Chairman BOYD HENDRICKSON Lead Independent Director JAMES PIECZYNSKI Nominating & Corporate Governance Committee Chairman DEVRA SHAPIRO Audit Committee Chairman TIMOTHY TRICHE, MDCompensation Committee Chairman CONNOR SIVERSKY Berenberg Capital Markets JUAN SANABRIA BMO Capital Markets Corp. DANIEL BERNSTEIN CapitalOne TAYO OKUSANYA Credit Suisse Securities (USA) LLC AARON HECHT JMP Securities, LLC AUSTIN WURSCHMIDTKeyBanc Capital Markets, Inc. MIKE CARROLL RBC Capital Markets Corporation RICHARD ANDERSONSMBC Nikko Securities STEVE MANAKER Stifel, Nicolaus & Company, Inc.

1Q 2022 SUPPLEMENTAL REPORT Million $ 335.7 Total Sales (2) (1) Represents total investments. (2) Reflects total sales price. INVESTMENTS I 4 Million 140.6 Total Gains $ Billion $ 1.7 Total Investments (1) MILLION REAL ESTATE ACTIVITIES – INVESTMENTS AND CAPITAL RECYCLING SINCE 2010 (FROM JANUARY 1, 2010 THROUGH APRIL 28, 2022) $0 $50 $100 $150 $200 $250 $300 $350 $400 $450 2010 2011 2012 2013 2014 2015 2016 2017 2018 2019 2020 2021 YTD 2022 Investments Sales
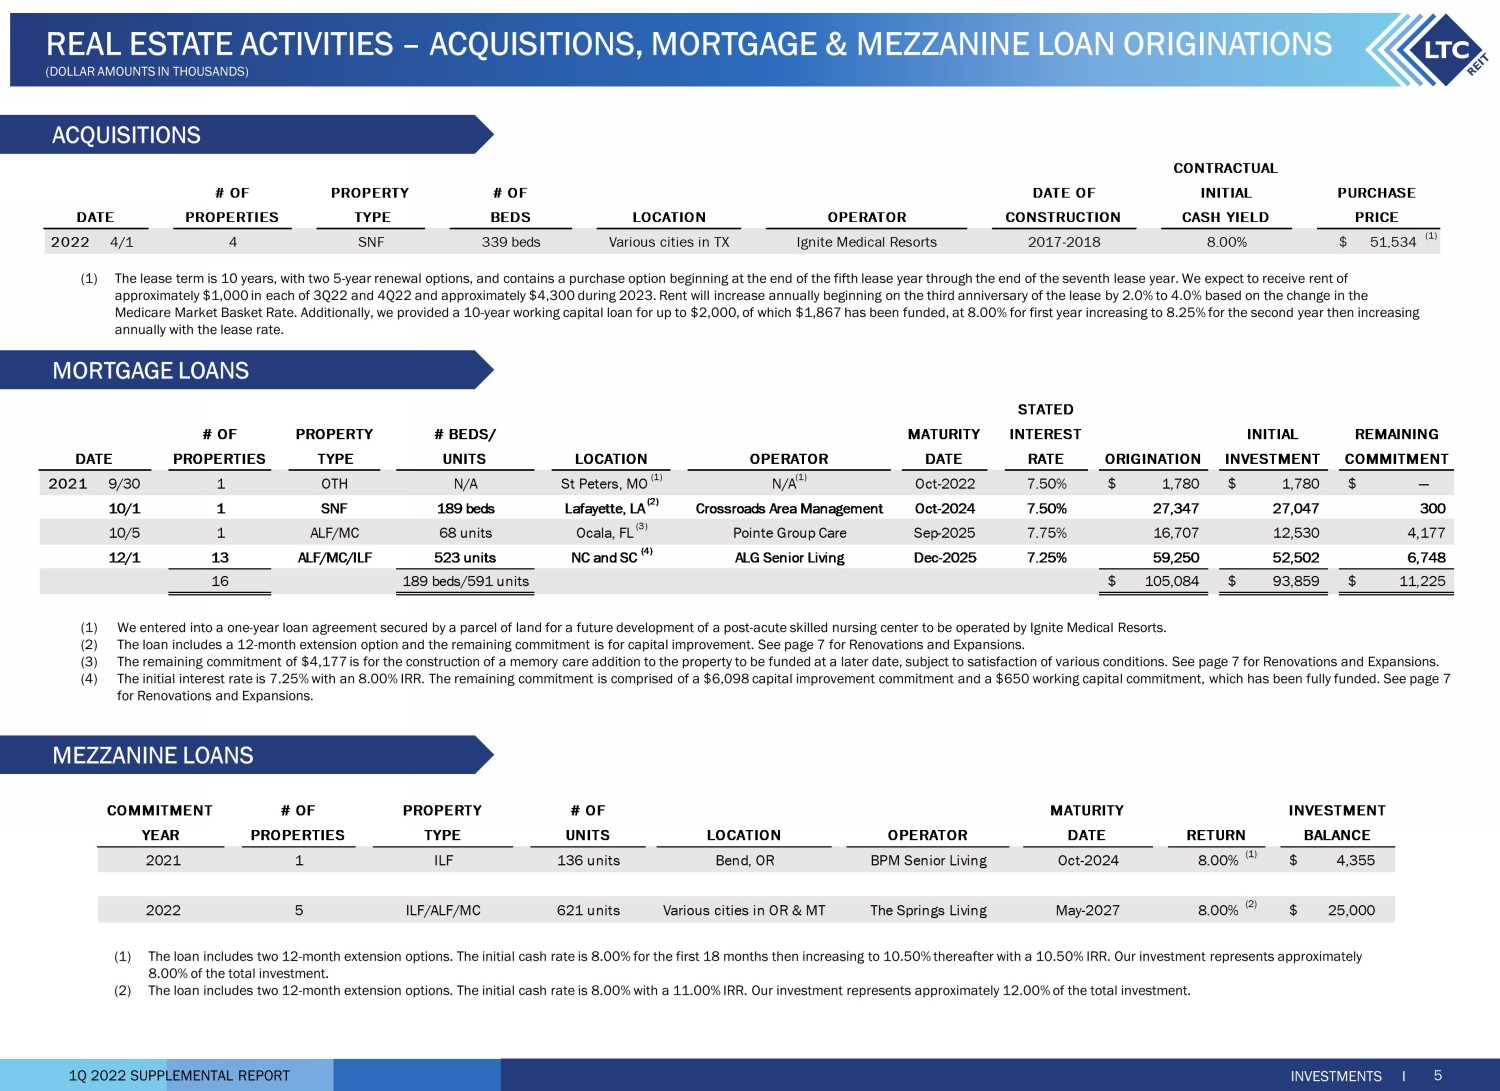
1Q 2022 SUPPLEMENTAL REPORT STATED # OF PROPERTY # BEDS/ MATURITY INTEREST INITIAL REMAINING PROPERTIES TYPE UNITS LOCATION OPERATOR DATE RATE ORIGINATION INVESTMENT COMMITMENT 2021 9/30 1 OTH N/A St Peters, MO (1) N/A (1) Oct-2022 7.50% 1,780$ 1,780$ —$ 10/1 1 SNF 189 beds Lafayette, LA (2) Crossroads Area Management Oct-2024 7.50% 27,347 27,047 300 10/5 1 ALF/MC 68 units Ocala, FL (3) Pointe Group Care Sep-2025 7.75% 16,707 12,530 4,177 12/1 13 ALF/MC/ILF 523 units NC and SC (4) ALG Senior Living Dec-2025 7.25% 59,250 52,502 6,748 16 189 beds/591 units 105,084$ 93,859$ 11,225$ DATE ACQUISITIONS MORTGAGE LOANS 5 INVESTMENTS I REAL ESTATE ACTIVITIES – ACQUISITIONS, MORTGAGE & MEZZANINE LOAN ORIGINATIONS (DOLLAR AMOUNTS IN THOUSANDS) CONTRACTUAL # OF PROPERTY # OF DATE OF INITIAL PURCHASE PROPERTIES TYPE BEDS LOCATION OPERATOR CONSTRUCTION CASH YIELD PRICE 2022 4/1 4 SNF 339 beds Various cities in TX Ignite Medical Resorts 2017-2018 8.00% 51,534$ (1) DATE (1) We entered into a one - year loan agreement secured by a parcel of land for a future development of a post - acute skilled nursing c enter to be operated by Ignite Medical Resorts. (2) The loan includes a 12 - month extension option and the remaining commitment is for capital improvement. See page 7 for Renovation s and Expansions. (3) The remaining commitment of $4,177 is for the construction of a memory care addition to the property to be funded at a later dat e, subject to satisfaction of various conditions. See page 7 for Renovations and Expansions. (4) The initial interest rate is 7.25% with an 8.00% IRR. The remaining commitment is comprised of a $6,098 capital improvement c omm itment and a $650 working capital commitment, which has been fully funded. See page 7 for Renovations and Expansions. MEZZANINE LOANS (1) The loan includes two 12 - month extension options. The initial cash rate is 8.00% for the first 18 months then increasing to 10.5 0% thereafter with a 10.50% IRR. Our investment represents approximately 8.00% of the total investment. (2) The loan includes two 12 - month extension options. The initial cash rate is 8.00% with a 11.00% IRR. Our investment represents ap proximately 12.00% of the total investment. # OF PROPERTY # OF MATURITY PROPERTIES TYPE UNITS LOCATION OPERATOR DATE 2021 1 ILF 136 units Bend, OR BPM Senior Living Oct-2024 8.00% (1) 4,355$ 2022 5 ILF/ALF/MC 621 units Various cities in OR & MT The Springs Living May-2027 8.00% (2) 25,000$ COMMITMENT YEAR RETURN INVESTMENT BALANCE (1) The lease term is 10 years, with two 5 - year renewal options, and contains a purchase option beginning at the end of the fifth le ase year through the end of the seventh lease year. We expect to receive rent of approximately $1,000 in each of 3Q22 and 4Q22 and approximately $4,300 during 2023. Rent will increase annually beginning on the third anniversary of the lease by 2.0% to 4.0% based on the change in the Medicare Market Basket Rate. Additionally, we provided a 10 - year working capital loan for up to $2,000, of which $1,867 has been funded, at 8.00% for first year increasing to 8.25% for the second year then increasing annually with the lease rate.

1Q 2022 SUPPLEMENTAL REPORT INVESTMENT PROPERTY # OF YEAR TYPE UNITS LOCATION OPERATOR INVESTMENT PURPOSE 2017 ALF/MC/ILF 110 units Cedarburg, WI Tealwood Senior Living Owned Real Estate & Development 22,244$ 2,305$ 19,939$ 2017 ALF 87 units Spartanburg, SC ALG Senior Owned Real Estate 11,660 1,241 10,419 197 units 33,904 3,546 30,358 2018 ALF/MC 78 units Medford, OR Fields Senior Living (1) Owned Real Estate & Development 18,978 1,090 17,888 2018 ILF 89 units Medford, OR Fields Senior Living (1) Owned Real Estate 14,661 2,858 11,803 167 units 33,639 3,948 29,691 2019 ALF/MC 74 units Abingdon, VA English Meadows Senior Living (2) Owned Real Estate 16,895 919 15,976 438 units 84,438$ 8,413$ 76,025$ CONTRIBUTION LTCJOINT VENTURES INTEREST TOTAL NON-CONTROLLING CONTRIBUTIONCOMMITMENT (1) Represents a single joint venture with ownership in two properties. (2) Subsequent to March 31, 2022, the community comprising the joint venture was sold for $16,895. The community has a gross book va lue of $16,895 and a net book value of $15,549 at March 31 2022. We expect to recognize approximately $1,300 of gain on sale in 2Q22. In connection with the sale, the current operator paid a lease termin ati on fee of approximately $1,200. Accordingly, we anticipate dissolving the joint venture during 2Q22. (1) The initial cash rate is 7.00% increasing to 9.00% in year - four until the IRR is 8.00%. After achieving an 8.00% IRR, the cash r ate drops to 8.00% with an IRR ranging between of 12.00% and 14.00% depending upon timing of redemption. Our investment represents 15.50% of the total investment. The property opened in December 2021 and occu pan cy was 52% at March 31,2022. We have the option to require the JV partner to purchase our preferred equity interest at any time between August 17, 2031 and December 31, 2036. (2) The initial cash rate is 8.00% with an IRR of 12.00%. Our investment represents 11.60% of the total estimated project cost. T he JV provides the JV partner the option to buy out our investment at any time after August 31, 2023 at the IRR rate. Also, we have the option to require the JV partner to purchase our preferred equity interest at any ti me between August 31, 2027 and, upon project completion and leasing the property, prior to the end of the first renewal term of the lease. The estimated project completion is 4Q22. CONSOLIDATED JOINT VENTURES UNCONSOLIDATED JOINT VENTURES INVESTMENTS I 6 REAL ESTATE ACTIVITIES – JOINT VENTURES (DOLLAR AMOUNTS IN THOUSANDS) # OF PROPERTY # OF INVESTMENT PROPERTIES TYPE UNITS LOCATION OPERATOR TYPE 2020 1 ALF/MC 95 units Arlington, WA Fields Senior Living Preferred Equity 7.00% (1) 6,340$ 2020 1 UDP-ILF/ALF 267 units Vancouver, WA Koelsch Communities Preferred Equity 8.00% (2) 13,000 2 362 units 19,340$ COMMITMENT INVESTMENT YEAR COMMITMENTRETURN
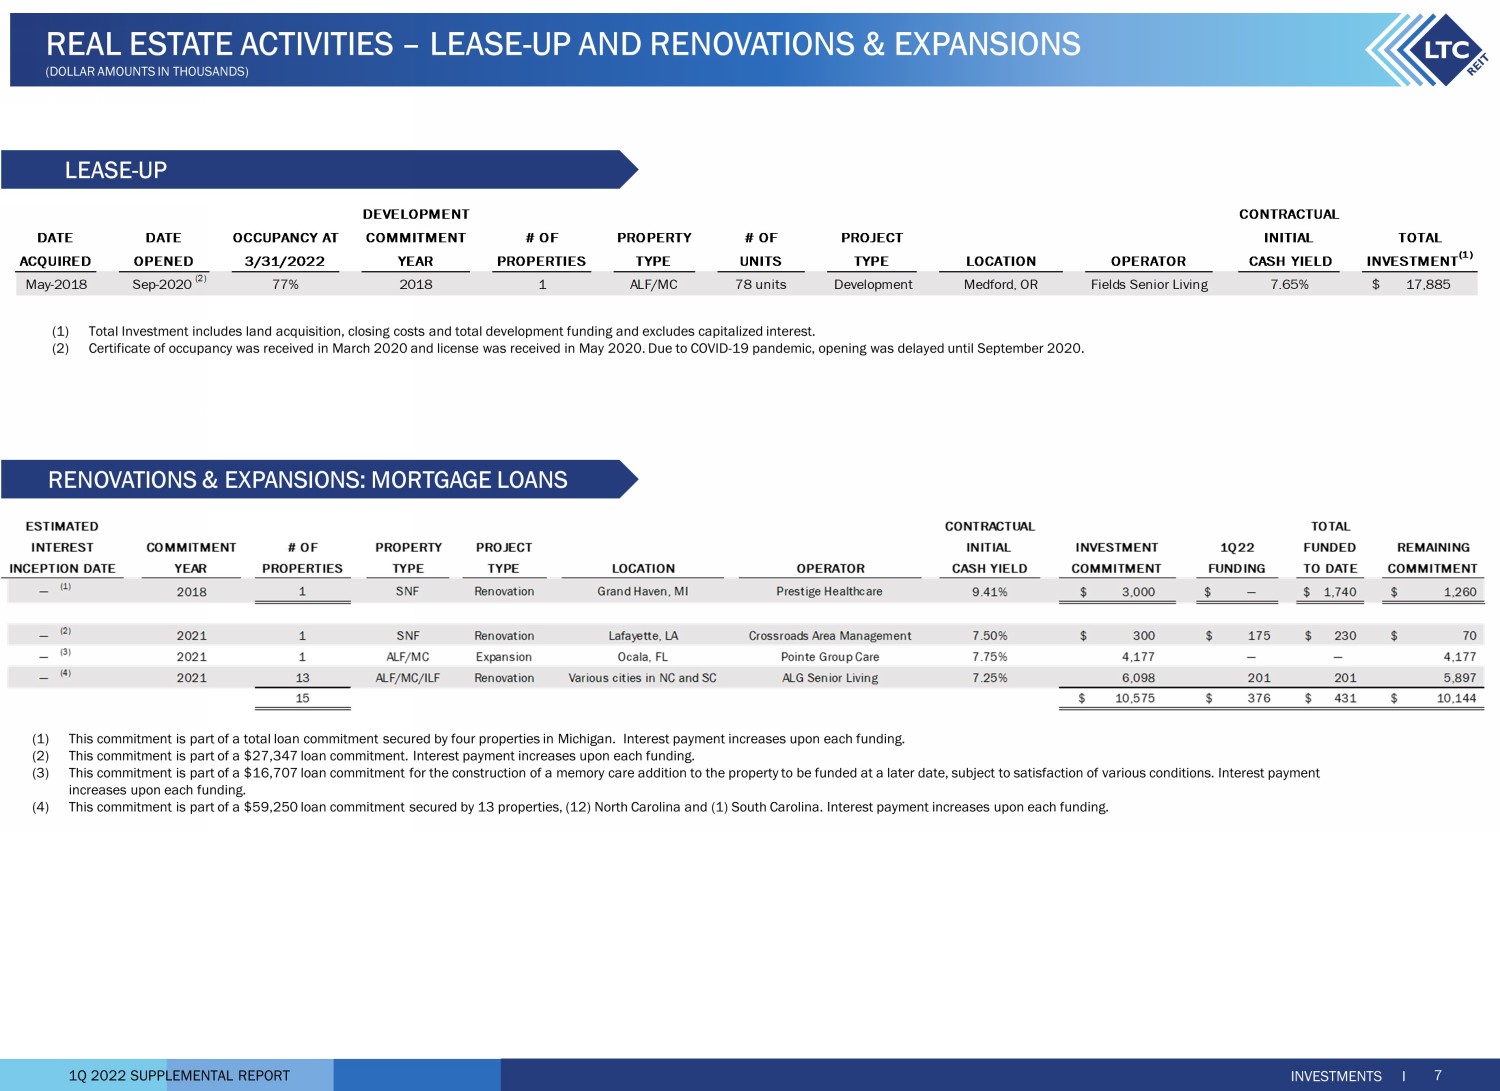
1Q 2022 SUPPLEMENTAL REPORT CONTRACTUAL TOTAL COMMITMENT # OF PROPERTY PROJECT INITIAL INVESTMENT 1Q22 FUNDED REMAINING YEAR PROPERTIES TYPE TYPE LOCATION OPERATOR CASH YIELD TO DATE COMMITMENT — (1) 2018 1 SNF Renovation Grand Haven, MI Prestige Healthcare 9.41% 3,000$ —$ 1,740$ 1,260$ — (2) 2021 1 SNF Renovation Lafayette, LA Crossroads Area Management 7.50% 300$ 175$ 230$ 70$ — (3) 2021 1 ALF/MC Expansion Ocala, FL Pointe Group Care 7.75% 4,177 — — 4,177 — (4) 2021 13 ALF/MC/ILF Renovation Various cities in NC and SC ALG Senior Living 7.25% 6,098 201 201 5,897 15 10,575$ 376$ 431$ 10,144$ INCEPTION DATE COMMITMENT FUNDING INTEREST ESTIMATED (1) This commitment is part of a total loan commitment secured by four properties in Michigan. Interest payment increases upon e ach funding. (2) This commitment is part of a $27,347 loan commitment. Interest payment increases upon each funding. (3) This commitment is part of a $16,707 loan commitment for the construction of a memory care addition to the property to be fun ded at a later date, subject to satisfaction of various conditions. Interest payment increases upon each funding. (4) This commitment is part of a $59,250 loan commitment secured by 13 properties, (12) North Carolina and (1) South Carolina. In ter est payment increases upon each funding. (1) Total Investment includes land acquisition, closing costs and total development funding and excludes capitalized interest. (2) Certificate of occupancy was received in March 2020 and license was received in May 2020. Due to COVID - 19 pandemic, opening was delayed until September 2020. LEASE - UP RENOVATIONS & EXPANSIONS: MORTGAGE LOANS INVESTMENTS I 7 REAL ESTATE ACTIVITIES – LEASE - UP AND RENOVATIONS & EXPANSIONS (DOLLAR AMOUNTS IN THOUSANDS) DEVELOPMENT CONTRACTUAL DATE DATE OCCUPANCY AT COMMITMENT # OF PROPERTY # OF PROJECT INITIAL ACQUIRED OPENED 3/31/2022 YEAR PROPERTIES TYPE UNITS TYPE LOCATION OPERATOR CASH YIELD May-2018 Sep-2020 (2) 77% 2018 1 ALF/MC 78 units Development Medford, OR Fields Senior Living 7.65% 17,885$ INVESTMENT (1) TOTAL

1Q 2022 SUPPLEMENTAL REPORT (1) Represents date of Certificate of Occupancy. (2) Although this property met our definition of stabilization on page 29 based on the time criteria, it did not meet the occupan cy threshold. INVESTMENTS I 8 REAL ESTATE ACTIVITIES – 5 - YEAR LEASE - UP HISTORY PROPERTY PROJECT # BEDS/ DATE DATE DATE PROPERTY LOCATION OPERATOR TYPE TYPE UNITS ACQUIRED OPENED (1) STABILIZED Harvester Place Burr Ridge, IL Anthem MC Development 66 units Oct-2014 Feb-2016 Feb-2018 24 (2) Vineyard Place Murrieta, CA Anthem MC Development 66 units Sep-2015 Aug-2016 Aug-2018 24 (2) Porter Place Tinley Park, IL Anthem MC Development 66 units May-2015 Jul-2016 Jul-2018 24 (2) Emerald Place Glenview, IL Anthem MC Development 66 units Oct-2015 Dec-2017 Dec-2019 24 (2) Grace Point Place Oak Lawn, IL Anthem MC Development 66 units Oct-2016 Jun-2018 Jun-2020 24 (2) Boonespring Healthcare Center Union, KY Carespring SNF Development 143 beds Sep-2016 Feb-2019 Dec-2019 10 Carmel Village Memory Care Clovis, CA Generations MC/ILF Acquisition 73 units Jun-2017 Sep-2016 Jun-2018 12 Carmel Village at Clovis Clovis, CA Generations ALF Acquisition 107 units Jun-2017 Nov-2014 Jun-2018 12 Ignite Medical Resort Blue Springs Independence, MO Ignite Medical Resorts SNF Development 90 beds Aug-2019 Sep-2020 Jun-2021 9 Oxford Villa Wichita, KS Oxford Senior Living ILF Development 108 units May-2015 Nov-2016 Nov-2018 24 (2) Oxford Kansas City Kansas City, MO Oxford Senior Living ALF/MC Acquisition 73 units Oct-2017 Aug-2017 Jun-2019 22 Hamilton House Cedarburg, WI Tealwood ALF/MC/ILF Development 110 units Dec-2017 Feb-2019 Feb-2021 24 (2) # OF MONTHS TO STABILIZATION

1Q 2022 SUPPLEMENTAL REPORT # OF % OF % OF BY INVESTMENT TYPE PROPERTIES INVESTMENT REVENUES REVENUES INCOME STATEMENT LINE Owned Portfolio (1) 153 1,409,625$ 76.6% 104,471$ (2) 73.5% Rental Income Mortgage Loans 37 350,037 19.0% 34,525 24.3% Interest Income from Mortgage Loans Notes Receivable 7 62,127 3.4% 1,540 (3) 1.1% Interest and Other Income Unconsolidated Joint Ventures (5) 1 19,340 1.0% 1,504 1.1% Income from Unconsolidated Joint Ventures Total 198 1,841,129$ 100.0% 142,040$ 100.0% # OF % OF BY PROPERTY TYPE PROPERTIES INVESTMENT Assisted Living 124 956,642$ 52.0% Skilled Nursing 73 858,151 46.6% Other (4) 1 13,336 0.7% Under Development (5) — 13,000 0.7% Total 198 1,841,129$ 100.0% INVESTMENT GROSS INVESTMENT TWELVE MONTHS ENDED MARCH 31, 2022 GROSS Owned Portfolio 76.6% Mortgage Loans* 19.0% Notes Receivable 3.4% Unconsolidated Joint Ventures 1.0% Assisted Living 52.0% Skilled Nursing 46.6% Under Development 0.7% Other 0.7% (1) Subsequent to March 31 , 2022 , we purchased four skilled nursing centers in TX . See page 5 for Acquisitions . (2) Includes cash rent, straight - line rent and amortization of lease incentives and excludes real estate tax reimbursement, and rental income from properties sold during the twelve months ended March 31 , 2022 . See page 21 for Components of Rental Income . (3) Includes interest income from mezzanine loans and working capital notes . (4) Includes one behavioral health care hospital and three parcels for land held - for - use and one parcel of land securing a first mortgage held for future development of a post - acute skilled nursing center . (5) Includes a $ 13 , 000 preferred equity investment in an entity that will develop and own a 267 - unit ILF/ALF community in Washington . See page 6 for Unconsolidated Joint Ventures . 35 Operators 29 States 198 Properties PORTFOLIO I 9 PORTFOLIO OVERVIEW (DOLLAR AMOUNTS IN THOUSANDS) *Weighted average maturity – 17.2 years GROSS INVESTMENT BY INVESTMENT TYPE GROSS INVESTMENT BY PROPERTY TYPE

1Q 2022 SUPPLEMENTAL REPORT (1) Subsequent to March 31 , 2022 , we purchased four skilled nursing centers in TX . See page 5 for Acquisitions . (2) Includes cash rent, straight - line rent and amortization of lease incentives and excludes real estate tax reimbursement, and rental income from properties sold during the twelve months ended March 31 , 2022 . See page 21 for Components of Rental Income . (3) Includes interest income from mezzanine loans and working capital notes . ALF 39.0% SNF 33.8% OTH 0.7% PORTFOLIO I 10 PORTFOLIO OVERVIEW (DOLLAR AMOUNTS IN THOUSANDS) RENTAL INCOME (AS % OF TOTAL REVENUES) INTEREST INCOME (AS % OF TOTAL REVENUES) ALF 0.9% SNF 0.2% INTEREST & OTHER INCOME (AS % OF TOTAL REVENUES) ALF 0.3% UDP 0.8% UNCONSOLIDATED JV INCOME (AS % OF TOTAL REVENUES) ALF 1.2% SNF 23.0% OTH 0.1% # OF OWNED PROPERTIES PROPERTIES RENTAL INCOME Assisted Living 102 844,995$ 45.9% 55,399$ 39.0% Skilled Nursing (1) 50 553,073 30.1% 48,105 33.8% Other 1 11,557 0.6% 967 0.7% Total 153 1,409,625$ 76.6% 104,471$ 73.5% # OF MORTGAGE LOANS PROPERTIES INTEREST INCOME Assisted Living 14 61,960$ 3.4% 1,743$ 1.2% Skilled Nursing 23 286,297 15.5% 32,714 23.0% Other — 1,780 0.1% 68 0.1% Total 37 350,037$ 19.0% 34,525$ 24.3% REAL ESTATE INVESTMENTS 190 1,759,662$ 95.6% 138,996$ # OF INTEREST AND NOTES RECEIVABLE PROPERTIES OTHER INCOME Assisted Living 7 43,347$ 2.4% 1,326$ 0.9% Skilled Nursing — 18,780 1.0% 214 0.2% Total 7 62,127$ 3.4% 1,540$ 1.1% # OF UNCONSOLIDATED UNCONSOLIDATED JOINT VENTURES PROPERTIES JV INCOME Assisted Living 1 6,340$ 0.3% 450$ 0.3% Under Development — 13,000 0.7% 1,054 0.8% Total 1 19,340$ 1.0% 1,504$ 1.1% TOTAL INVESTMENTS 198 1,841,129$ 100.0% 142,040$ 100.0% INVESTMENT TWELVE MONTHS ENDED MARCH 31, 2022 GROSS % OF GROSS INVESTMENT REVENUES (2) % OF TOTAL INVESTMENT GROSS GROSS INVESTMENT GROSS INVESTMENT % OF GROSS INVESTMENT % OF GROSS INVESTMENT % OF GROSS INVESTMENT REVENUES % OF TOTAL REVENUES % OF TOTAL REVENUES (3) % OF TOTAL
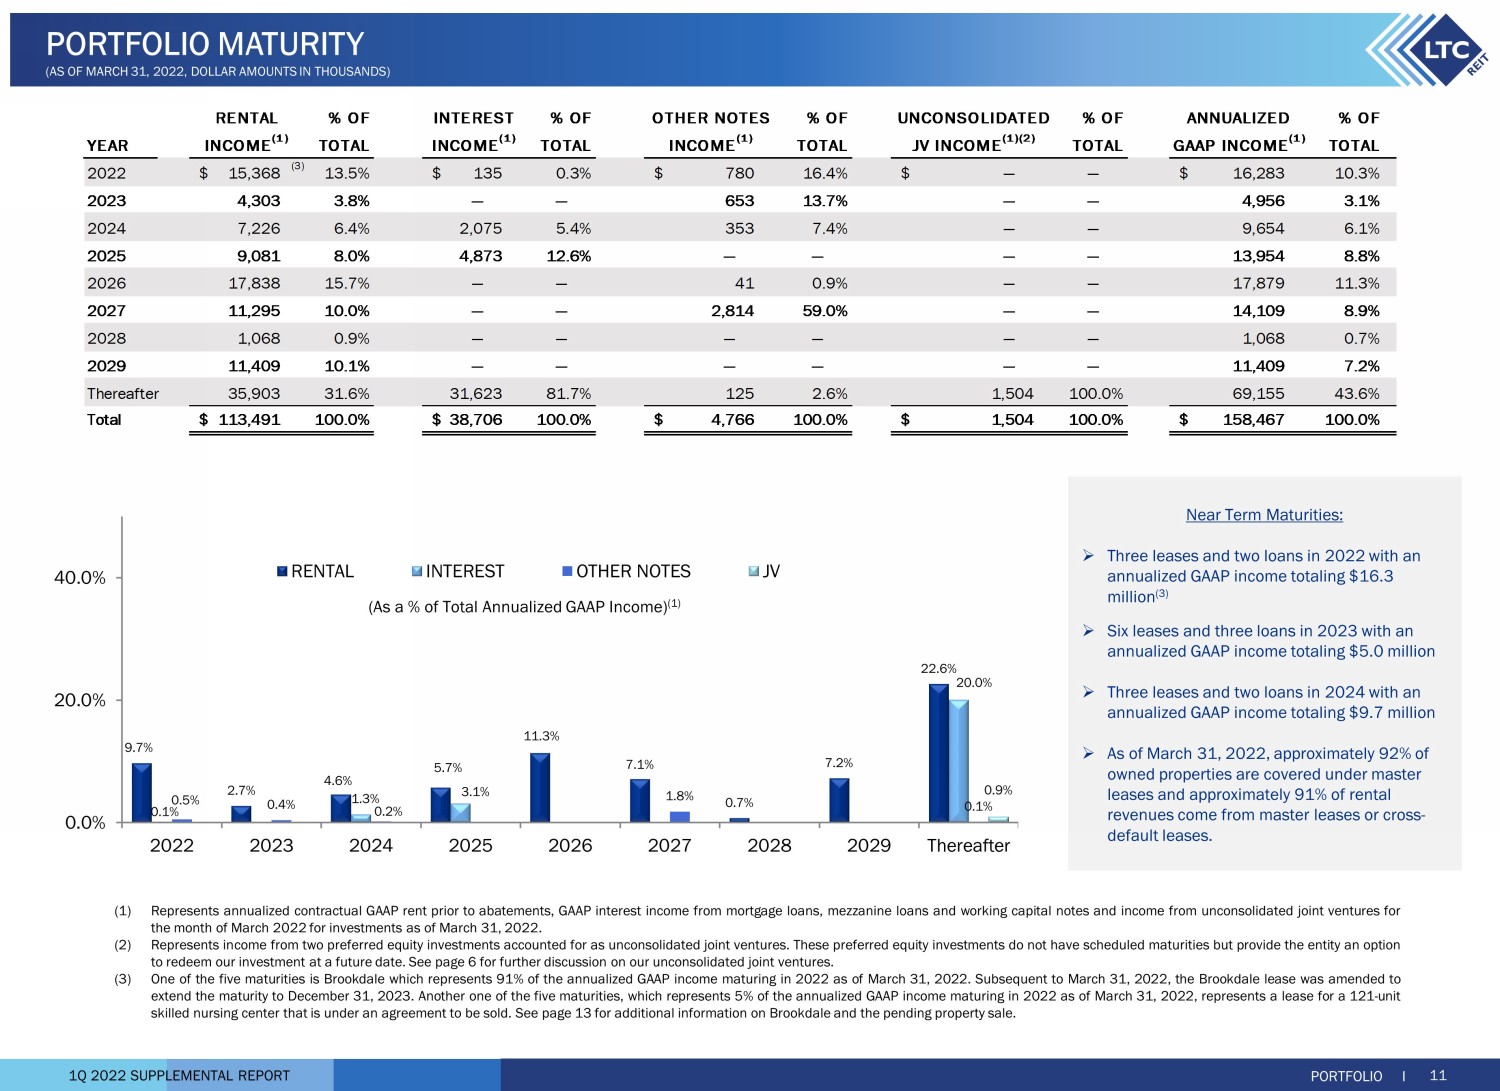
1Q 2022 SUPPLEMENTAL REPORT 9.7% 2.7% 4.6% 5.7% 11.3% 7.1% 0.7% 7.2% 22.6% 0.1% 1.3% 3.1% 20.0% 0.5% 0.4% 0.2% 1.8% 0.1% 0.9% 0.0% 20.0% 40.0% 2022 2023 2024 2025 2026 2027 2028 2029 Thereafter RENTAL INTEREST OTHER NOTES JV (As a % of Total Annualized GAAP Income) (1) Near Term Maturities: » Three leases and two loans in 2022 with an annualized GAAP income totaling $16.3 million (3) » Six leases and three loans in 2023 with an annualized GAAP income totaling $5.0 million » Three leases and two loans in 2024 with an annualized GAAP income totaling $9.7 million » As of March 31, 2022, approximately 92% of owned properties are covered under master leases and approximately 91% of rental revenues come from master leases or cross - default leases. (1) Represents annualized contractual GAAP rent prior to abatements, GAAP interest income from mortgage loans, mezzanine loans and working capital notes and income from unconsolidated joint ventures for the month of March 2022 for investments as of March 31 , 2022 . (2) Represents income from two preferred equity investments accounted for as unconsolidated joint ventures . These preferred equity investments do not have scheduled maturities but provide the entity an option to redeem our investment at a future date . See page 6 for further discussion on our unconsolidated joint ventures . (3) One of the five maturities is Brookdale which represents 91 % of the annualized GAAP income maturing in 2022 as of March 31 , 2022 . Subsequent to March 31 , 2022 , the Brookdale lease was amended to extend the maturity to December 31 , 2023 . Another one of the five maturities, which represents 5 % of the annualized GAAP income maturing in 2022 as of March 31 , 2022 , represents a lease for a 121 - unit skilled nursing center that is under an agreement to be sold . See page 13 for additional information on Brookdale and the pending property sale . PORTFOLIO MATURITY (AS OF MARCH 31, 2022, DOLLAR AMOUNTS IN THOUSANDS) % OF % OF % OF % OF % OF YEAR TOTAL TOTAL TOTAL TOTAL TOTAL 2022 15,368$ (3) 13.5% 135$ 0.3% 780$ 16.4% —$ — 16,283$ 10.3% 2023 4,303 3.8% — — 653 13.7% — — 4,956 3.1% 2024 7,226 6.4% 2,075 5.4% 353 7.4% — — 9,654 6.1% 2025 9,081 8.0% 4,873 12.6% — — — — 13,954 8.8% 2026 17,838 15.7% — — 41 0.9% — — 17,879 11.3% 2027 11,295 10.0% — — 2,814 59.0% — — 14,109 8.9% 2028 1,068 0.9% — — — — — — 1,068 0.7% 2029 11,409 10.1% — — — — — — 11,409 7.2% Thereafter 35,903 31.6% 31,623 81.7% 125 2.6% 1,504 100.0% 69,155 43.6% Total 113,491$ 100.0% 38,706$ 100.0% 4,766$ 100.0% 1,504$ 100.0% 158,467$ 100.0% RENTAL INTEREST OTHER NOTES UNCONSOLIDATED ANNUALIZED INCOME (1) INCOME (1) INCOME (1) JV INCOME (1)(2) GAAP INCOME (1) PORTFOLIO I 11

1Q 2022 SUPPLEMENTAL REPORT PORTFOLIO I 12 PORTFOLIO DIVERSIFICATION – 35 OPERATORS (AS OF MARCH 31, 2022, DOLLAR AMOUNTS IN THOUSANDS) ARK Privately Held SNF/ALF/ILF 13 Properties 4 States GENESIS OTC PINK: GENN SNF/ Senior Living More than 250 Properties 22 States JUNIPER Privately Held ALF/ILF/MC/SNF 29 Properties 4 States ALG Privately Held ALF/ILF/MC 149 Properties 7 States RANDALL Privately Held ALF/ILF/MC 19 Properties 3 States PRESTIGE Privately Held SNF/ALF/ILF Other Rehab 78 Properties 5 States BROOKDALE NYSE: BKD ALF/ILF/MC Continuing Care 678 Properties 41 States ANTHEM Privately Held Exclusively MC 21 Properties 9 States CARESPRING Privately Held SNF/ALF/ILF Transitional Care 13 Properties 2 States FUNDAMENTAL Privately Held SNF/MC Hospitals & Other Rehab 80 Properties 8 States OPERATORS # OF PROPS % % % GROSS INVESTMENT % Prestige Healthcare 24 27,259$ 18.6% 27,259$ 17.7% 32,665$ 20.6% 272,326$ 14.8% Brookdale Senior Living (6) 35 14,766 10.1% 14,766 9.6% 14,754 9.3% 103,136 5.6% Anthem Memory Care (6) 11 10,800 7.4% 10,800 7.0% 10,800 6.8% 139,176 7.6% Carespring Health Care Management 4 10,254 7.0% 10,254 6.6% 11,199 7.1% 102,697 5.6% Fundamental 7 9,128 6.2% 9,128 5.9% 8,406 5.3% 75,992 4.1% Ark Post Acute Network 7 8,914 6.1% 8,914 5.8% 8,257 5.2% 71,742 3.9% Genesis Healthcare 6 8,539 5.8% 8,539 5.5% 8,539 5.4% 50,004 2.7% Juniper Communities 7 6,975 4.8% 6,975 4.5% 6,475 4.1% 92,569 5.0% ALG Senior Living 15 5,533 3.8% 5,533 3.6% 5,498 3.5% 76,715 4.2% Randall Residence 8 5,398 3.7% 5,398 3.5% 5,397 3.4% 66,819 3.6% All Others (6) 74 38,662 26.5% 46,676 30.3% 46,477 29.3% 789,953 42.9% 198 146,228$ 100.0% 154,242$ 100.0% 158,467$ 100.0% 1,841,129$ 100.0% ANNUALIZED GAAP (3)(5) ANNUALIZED ACTUAL CASH (1)(4) ANNUALIZED CONTRACTUAL CASH (2)(4)(5) (1) Represents annualized cash rental income, interest income from mortgage loans, mezzanine loans and working capital notes and income from unconsolidated joint ventures received for the month of March 2022 for investments as of March 31 , 2022 . (2) Represents annualized contractual cash rental income prior to abatements, interest income from mortgage loans, mezzanine loans and working capital notes and income from unconsolidated joint ventures for the month of March 2022 for investments as of March 31 , 2022 . (3) Represents annualized GAAP rent prior to abatements, GAAP interest income from mortgage loans, mezzanine loans and working capital notes and income from unconsolidated joint ventures for the month of March 2022 for investments as of March 31 , 2022 . (4) The difference between annualized actual cash and annualized contractual cash is due to deferrals and abatements . (5) The difference between annualized contractual cash and annualized GAAP is due to straight - line rent, lease inducements and effective interest . See page 21 for Non - Cash Revenue Components . (6) See operator updates on page 13 .
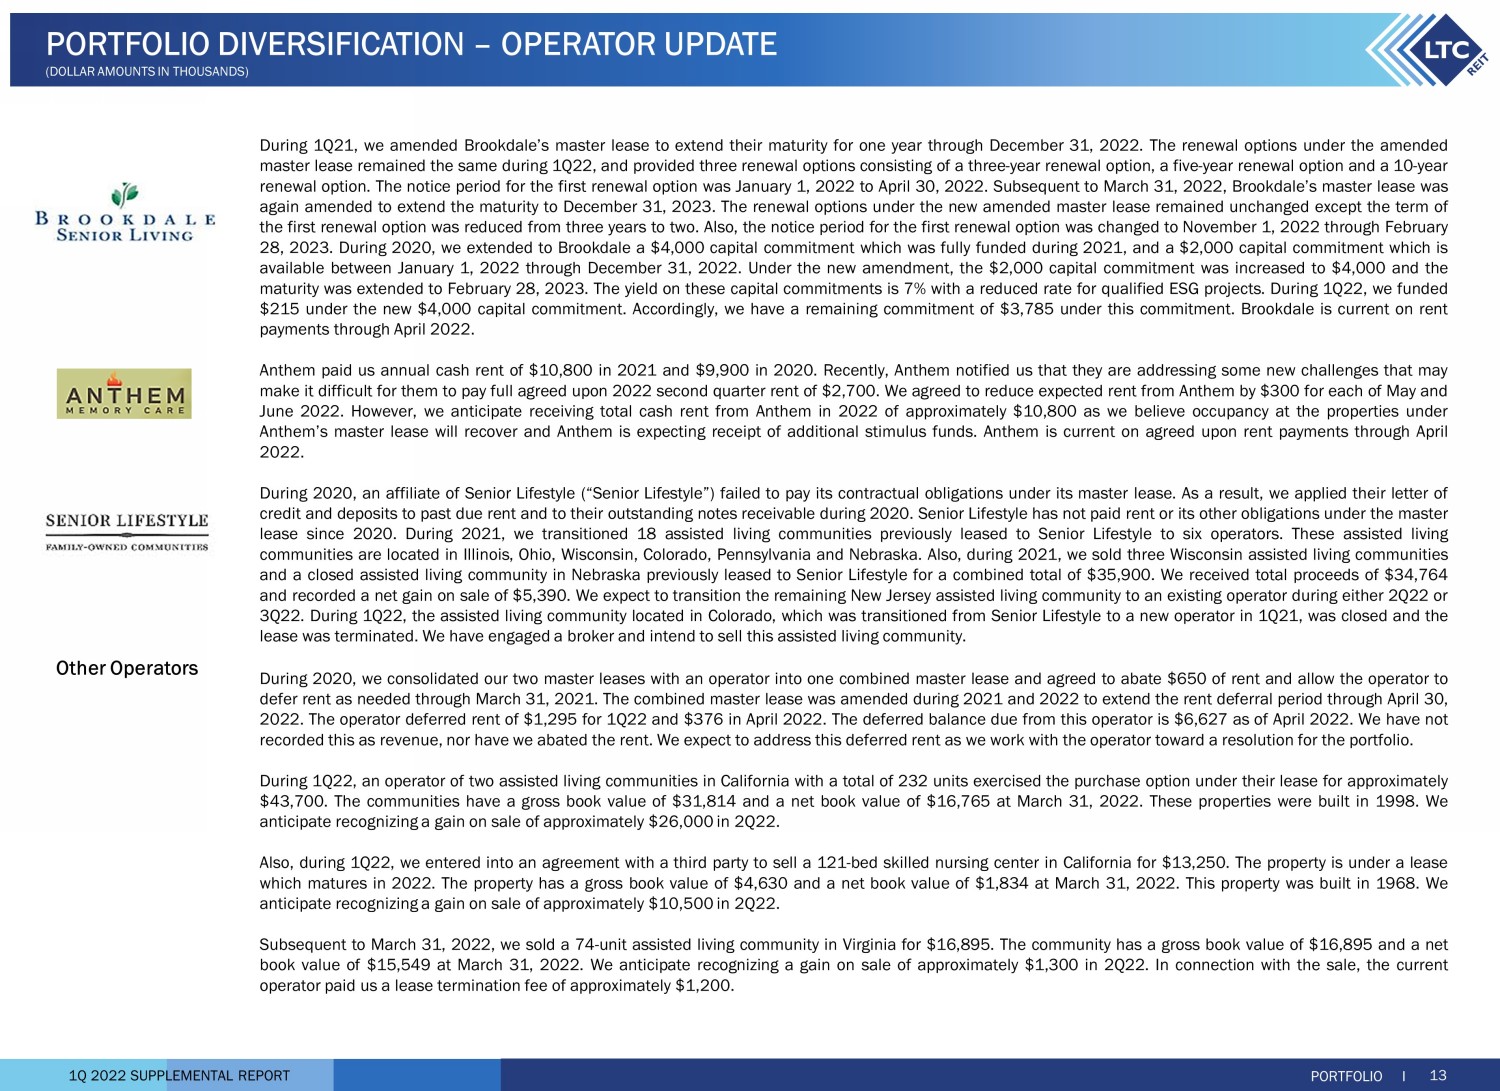
1Q 2022 SUPPLEMENTAL REPORT PORTFOLIO I 13 PORTFOLIO DIVERSIFICATION – OPERATOR UPDATE (DOLLAR AMOUNTS IN THOUSANDS) During 1 Q 21 , we amended Brookdale’s master lease to extend their maturity for one year through December 31 , 2022 . The renewal options under the amended master lease remained the same during 1 Q 22 , and provided three renewal options consisting of a three - year renewal option, a five - year renewal option and a 10 - year renewal option . The notice period for the first renewal option was January 1 , 2022 to April 30 , 2022 . Subsequent to March 31 , 2022 , Brookdale’s master lease was again amended to extend the maturity to December 31 , 2023 . The renewal options under the new amended master lease remained unchanged except the term of the first renewal option was reduced from three years to two . Also, the notice period for the first renewal option was changed to November 1 , 2022 through February 28 , 2023 . During 2020 , we extended to Brookdale a $ 4 , 000 capital commitment which was fully funded during 2021 , and a $ 2 , 000 capital commitment which is available between January 1 , 2022 through December 31 , 2022 . Under the new amendment, the $ 2 , 000 capital commitment was increased to $ 4 , 000 and the maturity was extended to February 28 , 2023 . The yield on these capital commitments is 7 % with a reduced rate for qualified ESG projects . During 1 Q 22 , we funded $ 215 under the new $ 4 , 000 capital commitment . Accordingly, we have a remaining commitment of $ 3 , 785 under this commitment . Brookdale is current on rent payments through April 2022 . Anthem paid us annual cash rent of $ 10 , 800 in 2021 and $ 9 , 900 in 2020 . Recently, Anthem notified us that they are addressing some new challenges that may make it difficult for them to pay full agreed upon 2022 second quarter rent of $ 2 , 700 . We agreed to reduce expected rent from Anthem by $ 300 for each of May and June 2022 . However, we anticipate receiving total cash rent from Anthem in 2022 of approximately $ 10 , 800 as we believe occupancy at the properties under Anthem’s master lease will recover and Anthem is expecting receipt of additional stimulus funds . Anthem is current on agreed upon rent payments through April 2022 . During 2020 , an affiliate of Senior Lifestyle (“Senior Lifestyle”) failed to pay its contractual obligations under its master lease . As a result, we applied their letter of credit and deposits to past due rent and to their outstanding notes receivable during 2020 . Senior Lifestyle has not paid rent or its other obligations under the master lease since 2020 . During 2021 , we transitioned 18 assisted living communities previously leased to Senior Lifestyle to six operators . These assisted living communities are located in Illinois, Ohio, Wisconsin, Colorado, Pennsylvania and Nebraska . Also, during 2021 , we sold three Wisconsin assisted living communities and a closed assisted living community in Nebraska previously leased to Senior Lifestyle for a combined total of $ 35 , 900 . We received total proceeds of $ 34 , 764 and recorded a net gain on sale of $ 5 , 390 . We expect to transition the remaining New Jersey assisted living community to an existing operator during either 2 Q 22 or 3 Q 22 . During 1 Q 22 , the assisted living community located in Colorado, which was transitioned from Senior Lifestyle to a new operator in 1 Q 21 , was closed and the lease was terminated . We have engaged a broker and intend to sell this assisted living community . During 2020 , we consolidated our two master leases with an operator into one combined master lease and agreed to abate $ 650 of rent and allow the operator to defer rent as needed through March 31 , 2021 . The combined master lease was amended during 2021 and 2022 to extend the rent deferral period through April 30 , 2022 . The operator deferred rent of $ 1 , 295 for 1 Q 22 and $ 376 in April 2022 . The deferred balance due from this operator is $ 6 , 627 as of April 2022 . We have not recorded this as revenue, nor have we abated the rent . We expect to address this deferred rent as we work with the operator toward a resolution for the portfolio . During 1 Q 22 , an operator of two assisted living communities in California with a total of 232 units exercised the purchase option under their lease for approximately $ 43 , 700 . The communities have a gross book value of $ 31 , 814 and a net book value of $ 16 , 765 at March 31 , 2022 . These properties were built in 1998 . We anticipate recognizing a gain on sale of approximately $ 26 , 000 in 2 Q 22 . Also, during 1 Q 22 , we entered into an agreement with a third party to sell a 121 - bed skilled nursing center in California for $ 13 , 250 . The property is under a lease which matures in 2022 . The property has a gross book value of $ 4 , 630 and a net book value of $ 1 , 834 at March 31 , 2022 . This property was built in 1968 . We anticipate recognizing a gain on sale of approximately $ 10 , 500 in 2 Q 22 . Subsequent to March 31 , 2022 , we sold a 74 - unit assisted living community in Virginia for $ 16 , 895 . The community has a gross book value of $ 16 , 895 and a net book value of $ 15 , 549 at March 31 , 2022 . We anticipate recognizing a gain on sale of approximately $ 1 , 300 in 2 Q 22 . In connection with the sale, the current operator paid us a lease termination fee of approximately $ 1 , 200 . Other Operators

1Q 2022 SUPPLEMENTAL REPORT States in which we have some of the highest concentration of properties are states with the highest projected increases in the 80+ population cohort over the next decade. Represents 10 states with the highest projected increases in the 80+ population cohort from year 2020 to year 2030 Source: The American Senior Housing Association, Winter 2018, Population Growth Forecast by State PORTFOLIO I 14 PORTFOLIO DIVERSIFICATION - GEOGRAPHY (AS OF MARCH 31, 2022) 1 29 STATES * Behavioral health care hospital SNF (73) ALF (124) OTH* (1) LAND (4) UDP (1) CA WA ME NV WY IL AR WV ND NY OR AZ NM TX UT ID MT SD NE KS OK MS MN WI FL AL GA SC TN MO IA IN OH PA NJ NC VA CO KY 4 17 1 2 3 1 2 4 2 1 5 6 17 17 2 7 7 3 8 4 13 7 6 1 22 2 5 7 1 1 2 1 2 6 1 2 2 MI 1 1 1 LA 2
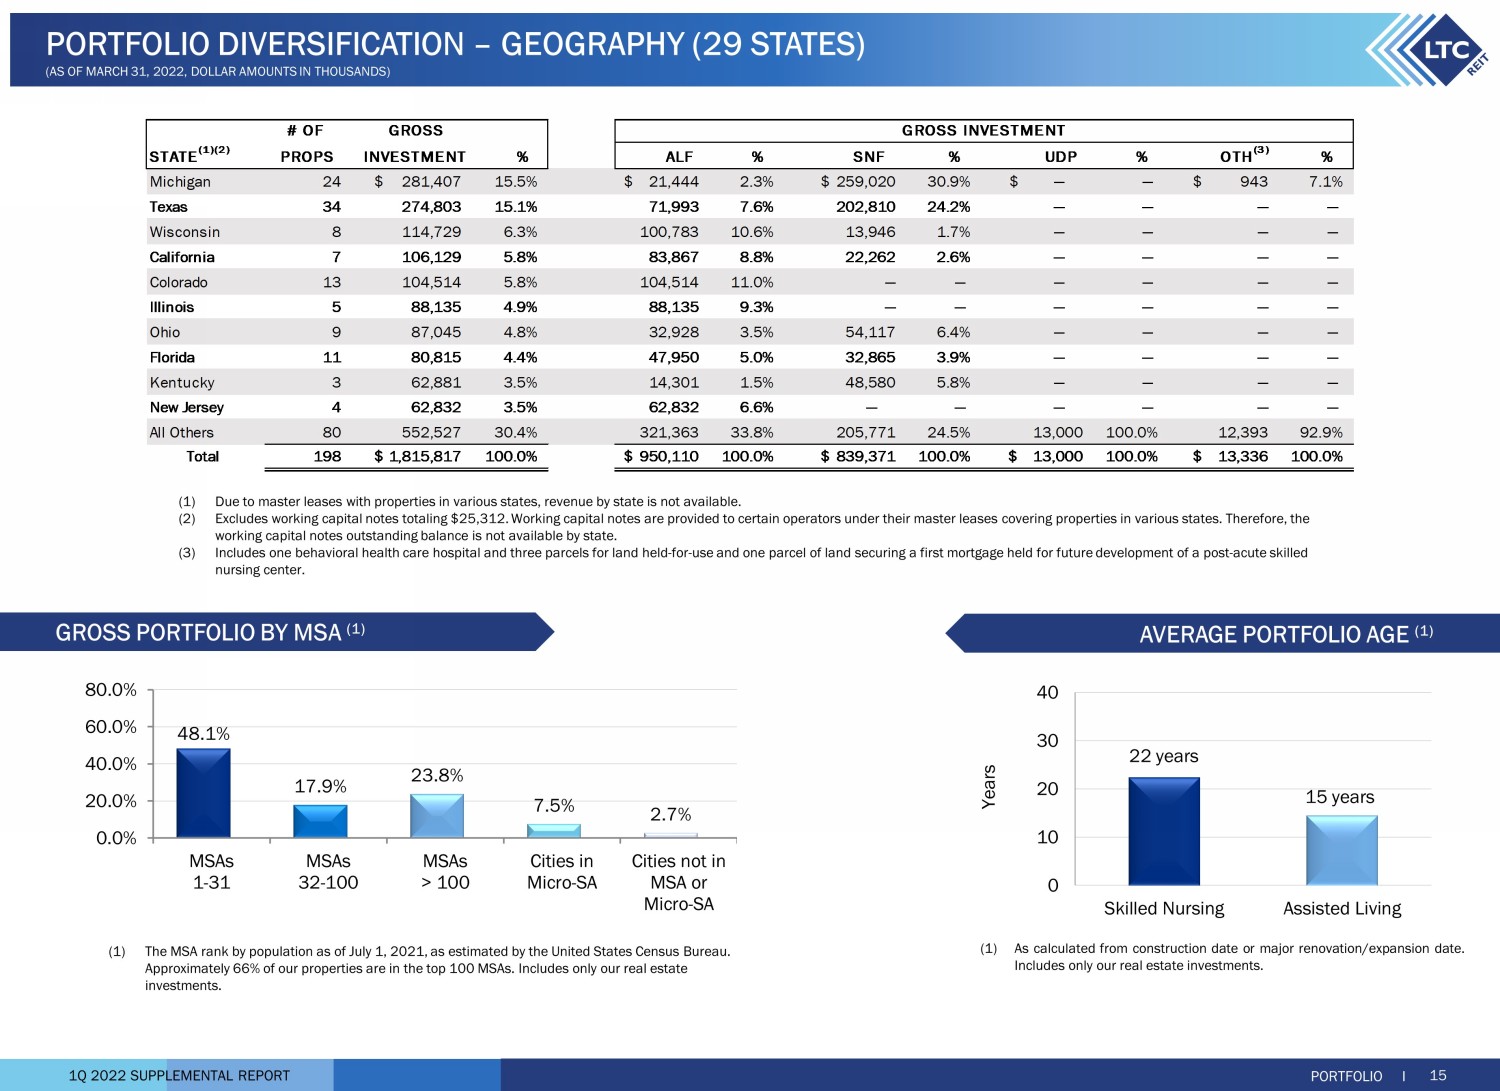
1Q 2022 SUPPLEMENTAL REPORT 48.1% 17.9% 23.8% 7.5% 2.7% 0.0% 20.0% 40.0% 60.0% 80.0% MSAs 1-31 MSAs 32-100 MSAs > 100 Cities in Micro-SA Cities not in MSA or Micro-SA 22 years 15 years 0 10 20 30 40 Skilled Nursing Assisted Living Years (1) The MSA rank by population as of July 1, 2021, as estimated by the United States Census Bureau. Approximately 66% of our properties are in the top 100 MSAs. Includes only our real estate investments. (1) Due to master leases with properties in various states, revenue by state is not available. (2) Excludes working capital notes totaling $25,312. Working capital notes are provided to certain operators under their master l eas es covering properties in various states. Therefore, the working capital notes outstanding balance is not available by state. (3) Includes one behavioral health care hospital and three parcels for land held - for - use and one parcel of land securing a first mor tgage held for future development of a post - acute skilled nursing center. (1) As calculated from construction date or major renovation/expansion date . Includes only our real estate investments . GROSS PORTFOLIO BY MSA (1) AVERAGE PORTFOLIO AGE (1) PORTFOLIO I 15 PORTFOLIO DIVERSIFICATION – GEOGRAPHY (29 STATES) (AS OF MARCH 31, 2022, DOLLAR AMOUNTS IN THOUSANDS) # OF STATE (1)(2) PROPS % ALF % SNF % UDP % % Michigan 24 281,407$ 15.5% 21,444$ 2.3% 259,020$ 30.9% —$ — 943$ 7.1% Texas 34 274,803 15.1% 71,993 7.6% 202,810 24.2% — — — — Wisconsin 8 114,729 6.3% 100,783 10.6% 13,946 1.7% — — — — California 7 106,129 5.8% 83,867 8.8% 22,262 2.6% — — — — Colorado 13 104,514 5.8% 104,514 11.0% — — — — — — Illinois 5 88,135 4.9% 88,135 9.3% — — — — — — Ohio 9 87,045 4.8% 32,928 3.5% 54,117 6.4% — — — — Florida 11 80,815 4.4% 47,950 5.0% 32,865 3.9% — — — — Kentucky 3 62,881 3.5% 14,301 1.5% 48,580 5.8% — — — — New Jersey 4 62,832 3.5% 62,832 6.6% — — — — — — All Others 80 552,527 30.4% 321,363 33.8% 205,771 24.5% 13,000 100.0% 12,393 92.9% Total 198 1,815,817$ 100.0% 950,110$ 100.0% 839,371$ 100.0% 13,000$ 100.0% 13,336$ 100.0% OTH (3) INVESTMENT GROSS INVESTMENTGROSS

1Q 2022 SUPPLEMENTAL REPORT $17,500 $17,300 $5,875 $0 $5,000 $10,000 $15,000 $20,000 $25,000 Dec-18 EBITDAR Dec-19 EBITDAR Anticipated 2022 Rent (1) Information is from property level operator financial statements which are unaudited and have not been independently verified by LTC. The same store portfolio excludes each property currently, or formerly, operated by Senior Lifestyle and Senior Care and will be added back to SPP 15 months after the date of the transition to the new operator . (2) The coverage and occupancy levels at our properties may be adversely affected if COVID - 19 or another pandemic results in infecti ons on a large scale at our properties, early resident move - outs, our operators delay accepting new residents due to quarantines, and/or potential occupants postpone moving to a senior housing facility, and/or r esi dents delay or postpone elective surgeries at hospitals. (3) The spot occupancy for the 18 properties previously leased to Senior Lifestyle in March 31, 2022 and December 31, 2020 was 83 % a nd 72%, respectively. ASSISTED LIVING SKILLED NURSING 1.59 1.46 2.06 1.92 71.1% 71.0% 60.0% 70.0% 80.0% 90.0% 100.0% 0.00x 2.00x 4.00x 3Q21 4Q21 Occupancy % Normalized EBITDAR Normalized EBITDARM Occupancy 0.83 0.78 1.04 0.99 73.9% 74.2% 70.0% 80.0% 90.0% 100.0% 0.00x 0.50x 1.00x 1.50x 3Q21 4Q21 Occupancy % Normalized EBITDAR Normalized EBITDARM Occupancy SNF metrics include CSF, as allocated/reported by operators. Excluding CSF, the 4Q21 normalized EBITDAR and EBITDARM coverages were 1.12x and 1.57x, respectively, and 0.99x and 1.45x, respectively, for 3Q21. Occupancy represents the average TTM occupancy. For the 89% of the reported SPP SNF, average monthly occupancy was 73% in March 2022, 72% in December 2021 and 70% in September 2021. ALF metrics include Coronavirus Stimulus Funds (“CSF”) as allocated/reported by operators. Excluding CSF, the 4Q21 normalized EBITDAR and EBITDARM coverages were 0.67x and 0.88x, respectively, and 0.64x and 0.85x, respectively, for 3Q21. See definition of Coronavirus Stimulus Funds on Page 28. Occupancy represents the average TTM occupancy. For the 63% of the reported SPP ALF, spot occupancy was 78% at March 31, 2022, 79% at December 31, 2021 and 76% at September 30, 2021. PORTFOLIO I 16 REAL ESTATE INVESTMENTS METRICS (TRAILING TWELVE MONTHS THROUGH DECEMBER 31, 2021 AND SEPTEMBER 30, 2021) SAME PROPERTY PORTFOLIO (“SPP”) COVERAGE STATISTICS (1)(2) The spot occupancy for the six properties previously leased to Senior Lifestyle currently covered by leases with quarterly fair market rent resets in March 31, 2022 and December 31, 2020 was 76% and 60%, respectively. $4,000 $4,500 $880 $0 $2,000 $4,000 $6,000 $8,000 $10,000 Dec-18 EBITDAR Dec-19 EBITDAR Anticipated 2022 Rent SENIOR LIFESTYLE (3) (FOR THE SIX PROPERTIES CURRENTLY COVERED BY LEASES WITH QUARTER LY FAIR MARKET RENT RESETS) SENIOR CARE/ABRI HEALTH (dollar amounts in thousands) (dollar amounts in thousands) The average monthly occupancy in March 31, 2022 and December 31, 2020 was 56% and 57%, respectively.

1Q 2022 SUPPLEMENTAL REPORT PORTFOLIO I 17 PORTFOLIO UPDATE (AMOUNTS IN THOUSANDS) ABATED RENT ▪ $720 abated rent during 1Q22 ▪ Deferred rent of $1,285, net of repayments, during 1Q22. ▪ As of March 31, 2022, outstanding deferred rent of $6,967 related to assisted living communities. $6,251 of the outstanding balance relates to an operator of 12 assisted living communities. We have not recorded this as revenue, nor have we abated the rent. We expect to address this deferred rent as we work with the operator toward a resolution for the portfolio. See page 13 for further discussion. ▪ Our rent deferral agreements generally require the deferred rent to be paid within 12 to 36 months. ▪ LTC evaluated deferral requests with close attention to ongoing operations, rent coverage, corporate financial health and liquidity of the operator. DEFERRED RENT CONTRACTUAL 1Q22 RENT AND MORTGAGE INTEREST Collected, 94.6% - $35,214 Abated, 1.9% - $720 Net Deferred, 3.5% - $1,285 ▪ Provided a total of $376 of deferred rent and $240 of rent abatement in April 2022. ▪ Agreed to provide rent abatements of up to $240 for each of May and June 2022. ▪ A greed to reduce expected rent from Anthem by $300 for each of May and June 2022. See page 13 for further discussion. SUBSEQUENT TO MARCH 31, 2022

1Q 2022 SUPPLEMENTAL REPORT MARCH 31, 2022 Revolving line of credit - WA rate 1.6% (1) 157,900$ Term loans, net of debt issue costs - WA rate 2.6% (2) 99,400 Senior unsecured notes, net of debt issue costs - WA rate 4.4% (3) 505,482 Total debt - WA rate 3.6% 762,782 33.4% No. of shares Common stock 39,460,029 38.47$ (4) 1,518,027 66.6% Total Market Value 1,518,027 2,280,809$ 100.0% Add: Non-controlling interest 8,413 Less: Cash and cash equivalents (4,393) 2,284,829$ Debt to Enterprise Value 33.4% Debt to Annualized Adjusted EBITDAre (5) 6.1x ENTERPRISE VALUE TOTAL VALUE CAPITALIZATION DEBT EQUITY 3/31/2022 Closing Price (1) Subsequent to March 31, 2022, we had a net borrowing of $34,000 under our unsecured revolving line of credit. Accordingly, we have $191,900 outstanding with $208,100 available for borrowing. (2) Represents outstanding balance of $100,000, net of debt issue costs of $600. (3) Represents outstanding balance of $505,980, net of debt issue costs of $498. (4) Closing price of our common stock as reported by the NYSE on March 31, 2022. (5) See page 22 for reconciliation of annualized adjusted EBITDA re . FINANCIAL I 18 ENTERPRISE VALUE (AMOUNTS IN THOUSANDS, EXCEPT PER SHARE AMOUNTS AND NUMBER OF SH ARES)

1Q 2022 SUPPLEMENTAL REPORT LEVERAGE RATIOS COVERAGE RATIOS LINE OF CREDIT LIQUIDITY FINANCIAL I 19 DEBT METRICS (DOLLAR AMOUNTS IN THOUSANDS) $157,900 $110,900 $89,900 $93,900 $242,100 $289,100 $510,100 $506,100 $- $100,000 $200,000 $300,000 $400,000 $500,000 $600,000 1Q22 2021 2020 2019 Balance Available 6.1x 4.4x 6.0x 4.4x 4.4x 4.9x 4.6x 4.8x 0.0x 2.0x 4.0x 6.0x 8.0x Debt to Adjusted EBITDAre Adjusted EBITDAre/ Fixed Charges 1Q22 2021 2020 2019 39.6% 33.4% 38.4% 34.9% 35.8% 29.8% 37.2% 28.0% 0.0% 10.0% 20.0% 30.0% 40.0% 50.0% Debt to Gross Asset Value Debt to Total Enterprise Value 1Q22 2021 2020 2019

1Q 2022 SUPPLEMENTAL REPORT Senior Unsecured Notes 66.2% Term Loans 13.1% Revolving Line of Credit 20.7% $157,900 $50,000 $50,000 $41,160 $49,160 $49,160 $49,500 $51,500 $54,500 $55,000 $58,000 $98,000 $- $100,000 $200,000 $300,000 $400,000 2022 2023 2024 2025 2026 2027 2028 2029 Thereafter Revolving Line of Credit Term Loans Senior Unsecured Notes (1) Subsequent to March 31, 2022, we had a net borrowing of $34,000 under our unsecured revolving line of credit. Accordingly, we ha ve $191,900 outstanding with $208,100 available for borrowing. (2) Reflects scheduled principal payments. (3) Excludes debt issue costs which are netted against the principal outstanding in the term loans and senior unsecured notes bal anc e on our Consolidated Balance Sheets shown on page 24. DEBT STRUCTURE (3) FINANCIAL I 20 DEBT MATURITY (AS OF MARCH 31, 2022, DOLLAR AMOUNTS IN THOUSANDS) REVOLVING SENIOR LINE OF TERM UNSECURED % OF YEAR CREDIT (1) LOANS (2) NOTES (2) TOTAL TOTAL 2022 —$ —$ 41,160$ 41,160$ 5.4% 2023 — — 49,160 49,160 6.4% 2024 — — 49,160 49,160 6.4% 2025 157,900 50,000 49,500 257,400 33.7% 2026 — 50,000 51,500 101,500 13.3% 2027 — — 54,500 54,500 7.2% 2028 — — 55,000 55,000 7.2% 2029 — — 58,000 58,000 7.6% Thereafter — — 98,000 98,000 12.8% Total 157,900$ 100,000$ (3) 505,980$ (3) 763,880$ (3) 100.0%

1Q 2022 SUPPLEMENTAL REPORT (1) Includes outstanding gross revolving line of credit, term loans, net of debt issue costs, and senior unsecured notes, net of debt issue costs. (1) For leases and loans in place at March 31, 2022, assuming no renewals, modifications or replacements and no new investments are added to our portfolio. (2) Includes a write - off of $173 related to a property closure and subsequent lease termination in 1Q22. (1) Decrease primarily due to the Senior Care and Senior Care’s parent company, Abri Health, portfolio transition, abated and deferred rent, and decreased rent from a sold property, partially offset by prior year’s 50% reduction of 2021 rent escalations, rent received from properties transitioned from Senior Lifestyle, and rent increases from completed projects, annual rent escalations and capital improvement fundings. (2) Increase primarily due to properties transitioned from Senior Lifestyle. (3) Decrease primarily due to the impact of prior year’s 50% reduction of 2021 rent escalations for those leases accounted for on a straight - line basis. (4) Represents the write - off of an operator’s straight - line rent receivable during 1Q21. (5) Increase primarily due to the lease incentive write - off related to a property closure and subsequent lease termination. NON - CASH REVENUE COMPONENTS COMPONENTS OF RENTAL INCOME FINANCIAL I 21 FINANCIAL DATA SUMMARY (DOLLAR AMOUNTS IN THOUSANDS) 12/31/19 Gross investments $ 1,841,129 $ 1,804,435 $ 1,737,795 $ 1,778,341 Net investments $ 1,452,997 $ 1,426,070 $ 1,385,414 $ 1,427,845 Gross asset value $ 1,924,229 $ 1,883,190 $ 1,811,867 $ 1,864,705 Total debt (1) $ 762,782 $ 722,719 $ 649,382 $ 693,388 Total liabilities (1) $ 793,498 $ 759,698 $ 683,680 $ 728,783 Total equity $ 742,599 $ 745,127 $ 775,806 $ 785,426 12/31/2012/31/213/31/22 Cash rent 26,972$ 28,623$ (1,651)$ (1) Operator reimbursed real estate tax revenue 3,982 3,538 444 (2) Straight-line rent (adjustment) income (234) 682 (916) (3) Straight-line rent write-off — (758) 758 (4) Amortization of lease incentives (396) (112) (284) (5) Total rental income 30,324$ 31,973$ (1,649)$ THREE MONTHS ENDED MARCH 31, 2022 2021 Variance 1Q22 2Q22 (1) 3Q22 (1) 4Q22 (1) 1Q23 (1) (234)$ (302)$ (329)$ (416)$ (517)$ (396) (2) (212) (212) (174) (171) 1,402 1,545 1,558 1,503 1,466 772$ 1,031$ 1,017$ 913$ 778$ Straight-line rent Amortization of lease incentives Effective interest Net

1Q 2022 SUPPLEMENTAL REPORT RECONCILIATION OF ANNUALIZED ADJUSTED EBITDA re AND FIXED CHARGES FINANCIAL I 22 FINANCIAL DATA SUMMARY (DOLLAR AMOUNTS IN THOUSANDS) Net income 14,507$ 56,224$ 95,677$ 80,872$ Less: Gain on sale of real estate, net (102) (7,462) (44,117) (2,106) Less: Gain on insurance proceeds — — (373) (3) (2,111) (3) Add: Loss on unconsolidated joint ventures — — 758 (4) — Add: Impairment loss from investments — — 3,977 (5) 5,500 (4) Add: Interest expense 7,143 27,375 29,705 30,582 Add: Depreciation and amortization 9,438 38,296 39,071 39,216 EBITDAre 30,986 114,433 124,698 151,953 Add/(less): Non-recurring one-time items 423 (1) 5,947 (2) 22,841 (6) (1,535) (7) Adjusted EBITDAre 31,409$ 120,380$ 147,539$ 150,418$ Interest expense 7,143$ 27,375$ 29,705$ 30,582$ Add: Capitalized interest — — 354 608 Fixed charges (9) 7,143$ 27,375$ 30,059$ 31,190$ Annualized Adjusted EBITDAre 125,636$ Annualized Fixed Charges 28,572$ Debt (net of debt issue costs) 762,782$ 722,719$ 649,382$ 693,388$ Debt to Adjusted EBITDAre 6.1x 6.0x (8) 4.4x 4.6x Adjusted EBITDAreto Fixed Charges 4.4x 4.4x 4.9x 4.8x 12/31/20 12/31/19 12/31/21 3/31/22 THREE MONTHS ENDED FOR THE YEAR ENDED (1) Represents provision for credit losses related to the origination of a $ 25 , 000 mezzanine loan and a lease incentive balance write - off of $ 173 related to a property closure and subsequent lease termination . (2) Represents the Senior Care and Abri Health settlement payment ( $ 3 , 895 ), the straight - line rent receivable write - off ( $ 758 ), the provision for credit losses on mortgage loan originations ( $ 869 ), and the 50 % reduction of 2021 rent and interest escalations ( $ 425 ) . (3) Represents the gain from insurance proceeds related to previously sold properties . (4) In 4 Q 19 , we wrote down our investment in an unconsolidated joint venture (“JV”) by $ 5 , 500 to its estimated fair value as a result of the JV entering into a contract to the sell the properties comprising the JV . In 2 Q 20 , the JV sold the properties and we incurred an additional loss of $ 758 . (5) Represents an impairment loss relating to a 48 - unit memory care in Colorado and a 61 - unit assisted living community in Florida which was sold in 1 Q 21 . (6) Represents the $ 23 , 029 straight - line rent receivable write - off related to Senior Lifestyle, Genesis and another operator and the Senior Lifestyle lease incentives write - off of $ 185 offset by the gain from insurance proceeds ( $ 373 ) . (7) Represents the gain from insurance proceeds ( $ 2 , 111 ) and deferred rent repayment of $ 1 , 350 from an operator offset by $ 1 , 926 write - off of straight - line rent receivable due a lease termination . (8) Increase due to additional borrowings for $ 98 , 215 of investments in 3 Q 21 and 4 Q 21 . (9) Given we do not have preferred stock, our fixed charge coverage ratio and interest coverage ratio are the same .
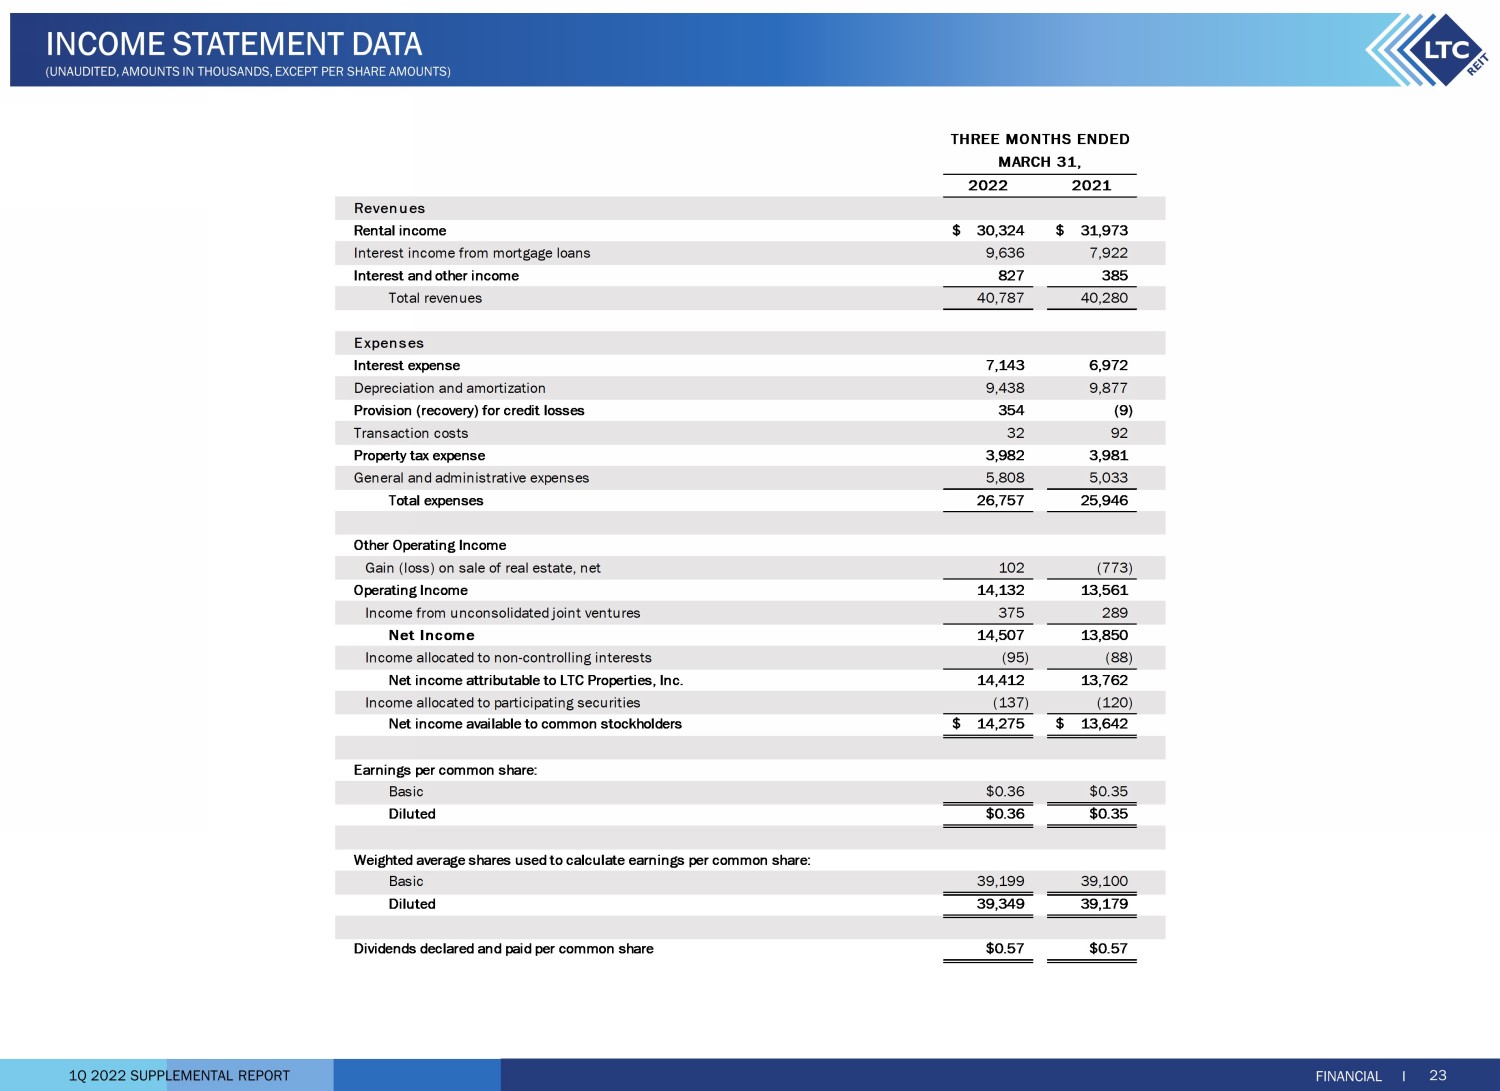
1Q 2022 SUPPLEMENTAL REPORT FINANCIAL I 23 INCOME STATEMENT DATA (UNAUDITED, AMOUNTS IN THOUSANDS, EXCEPT PER SHARE AMOUNTS) 2022 2021 Revenues Rental income 30,324$ 31,973$ Interest income from mortgage loans 9,636 7,922 Interest and other income 827 385 Total revenues 40,787 40,280 Expenses Interest expense 7,143 6,972 Depreciation and amortization 9,438 9,877 Provision (recovery) for credit losses 354 (9) Transaction costs 32 92 Property tax expense 3,982 3,981 General and administrative expenses 5,808 5,033 Total expenses 26,757 25,946 Other Operating Income Gain (loss) on sale of real estate, net 102 (773) Operating Income 14,132 13,561 Income from unconsolidated joint ventures 375 289 Net Income 14,507 13,850 Income allocated to non-controlling interests (95) (88) Net income attributable to LTC Properties, Inc. 14,412 13,762 Income allocated to participating securities (137) (120) Net income available to common stockholders 14,275$ 13,642$ Earnings per common share: Basic $0.36 $0.35 Diluted $0.36 $0.35 Weighted average shares used to calculate earnings per common share: Basic 39,199 39,100 Diluted 39,349 39,179 Dividends declared and paid per common share $0.57 $0.57 THREE MONTHS ENDED MARCH 31,

1Q 2022 SUPPLEMENTAL REPORT FINANCIAL I 24 CONSOLIDATED BALANCE SHEETS (AMOUNTS IN THOUSANDS, EXCEPT PER SHARE AMOUNTS) ASSETS Investments: Land $ 120,203 $ 123,239 Buildings and improvements 1,240,713 1,285,318 Accumulated depreciation and amortization (367,623) (374,606) Operating real estate property, net 993,293 1,033,951 Properties held-for-sale, net of accumulated depreciation: 2022—$16,396; 2021—$0 32,313 — Real property investments, net 1,025,606 1,033,951 Mortgage loans receivable, net of loan loss reserve: 2022—$3,494; 2021—$3,473 346,543 344,442 Real estate investments, net 1,372,149 1,378,393 Notes receivable, net of loan loss reserve: 2022—$619; 2021—$286 61,508 28,337 Investments in unconsolidated joint ventures 19,340 19,340 Investments, net 1,452,997 1,426,070 Other assets: Cash and cash equivalents 4,393 5,161 Debt issue costs related to revolving line of credit 2,883 3,057 Interest receivable 41,165 39,522 Straight-line rent receivable 23,912 24,146 Lease incentives 2,277 2,678 Prepaid expenses and other assets 8,470 4,191 Total assets $ 1,536,097 $ 1,504,825 LIABILITIES Revolving line of credit $ 157,900 $ 110,900 Term loans, net of debt issue costs: 2022—$600; 2021—$637 99,400 99,363 Senior unsecured notes, net of debt issue costs: 2022—$498; 2021—$524 505,482 512,456 Accrued interest 3,090 3,745 Accrued expenses and other liabilities 27,626 33,234 Total liabilities 793,498 759,698 EQUITY Stockholders’ equity: Common stock: $0.01 par value; 60,000 shares authorized; shares issued and outstanding: 2022—39,460; 2021—39,374 395 394 Capital in excess of par value 857,558 856,895 Cumulative net income 1,459,048 1,444,636 Accumulated other comprehensive income (loss) 4,704 (172) Cumulative distributions (1,587,519) (1,565,039) Total LTC Properties, Inc. stockholders’ equity 734,186 736,714 Non-controlling interests 8,413 8,413 Total equity 742,599 745,127 Total liabilities and equity $ 1,536,097 $ 1,504,825 (unaudited) (audited) DECEMBER 31, 2021MARCH 31,2022

1Q 2022 SUPPLEMENTAL REPORT (1) Represents provision for credit losses related to the origination of a $ 25 , 000 mezzanine loan during 1 Q 22 and ( 2 ) below . (2) Includes a lease incentive balance write - off of $ 173 related to a property closure and subsequent lease termination . (3) Includes the GAAP impact of the 50 % reduction of 2021 rent and interest escalation ( $ 292 ) and ( 5 ) below . (4) Includes the impact of the 50 % reduction of 2021 rent and interest escalation on straight - line rent and effective interest . (5) Represents a straight - line rent receivable write - off due to transitioning rental revenue recognition to cash basis . (6) Includes the cash impact of the 50 % reduction of 2021 rent and interest escalation . FINANCIAL I 25 FUNDS FROM OPERATIONS – RECONCILIATION OF FFO AND FAD (UNAUDITED, AMOUNTS IN THOUSANDS, EXCEPT PER SHARE AMOUNTS) 2022 2021 GAAP net income available to common stockholders 14,275$ 13,642$ Add: Depreciation and amortization 9,438 9,877 (Less)/add: (Gain) loss on sale of investments, net (102) 773 NAREIT FFO attributable to common stockholders 23,611$ 24,292$ $0.60 $0.62 NAREIT FFO attributable to common stockholders 23,611$ 24,292$ Add: Non-recurring items 423 (1) 1,050 (3) 24,034$ 25,342$ NAREIT FFO attributable to common stockholders 23,611$ 24,292$ Non-cash income: Less: Straight-line rental adjustment (income) 234 (682) (4) Add: Amortization of lease incentives 396 (2) 112 Add: Other non-cash expense — 758 (5) Less: Effective interest income from mortgage loans (1,402) (1,744) (4) Net non-cash income (772) (1,556) Non-cash expense: Add: Non-cash compensation charges 1,925 1,852 Add: Provision (recovery) for credit losses 354 (9) Net non-cash expense 2,279 1,843 Funds available for distribution (FAD) 25,118$ 24,579$ Less: Non-recurring income — 1,204 (6) Funds available for distribution (FAD), excluding non-recurring items 25,118$ 25,783$ FFO attributable to common stockholders, excluding non-recurring items THREE MONTHS ENDED MARCH 31, NAREIT Diluted FFO attributable to common stockholders per share
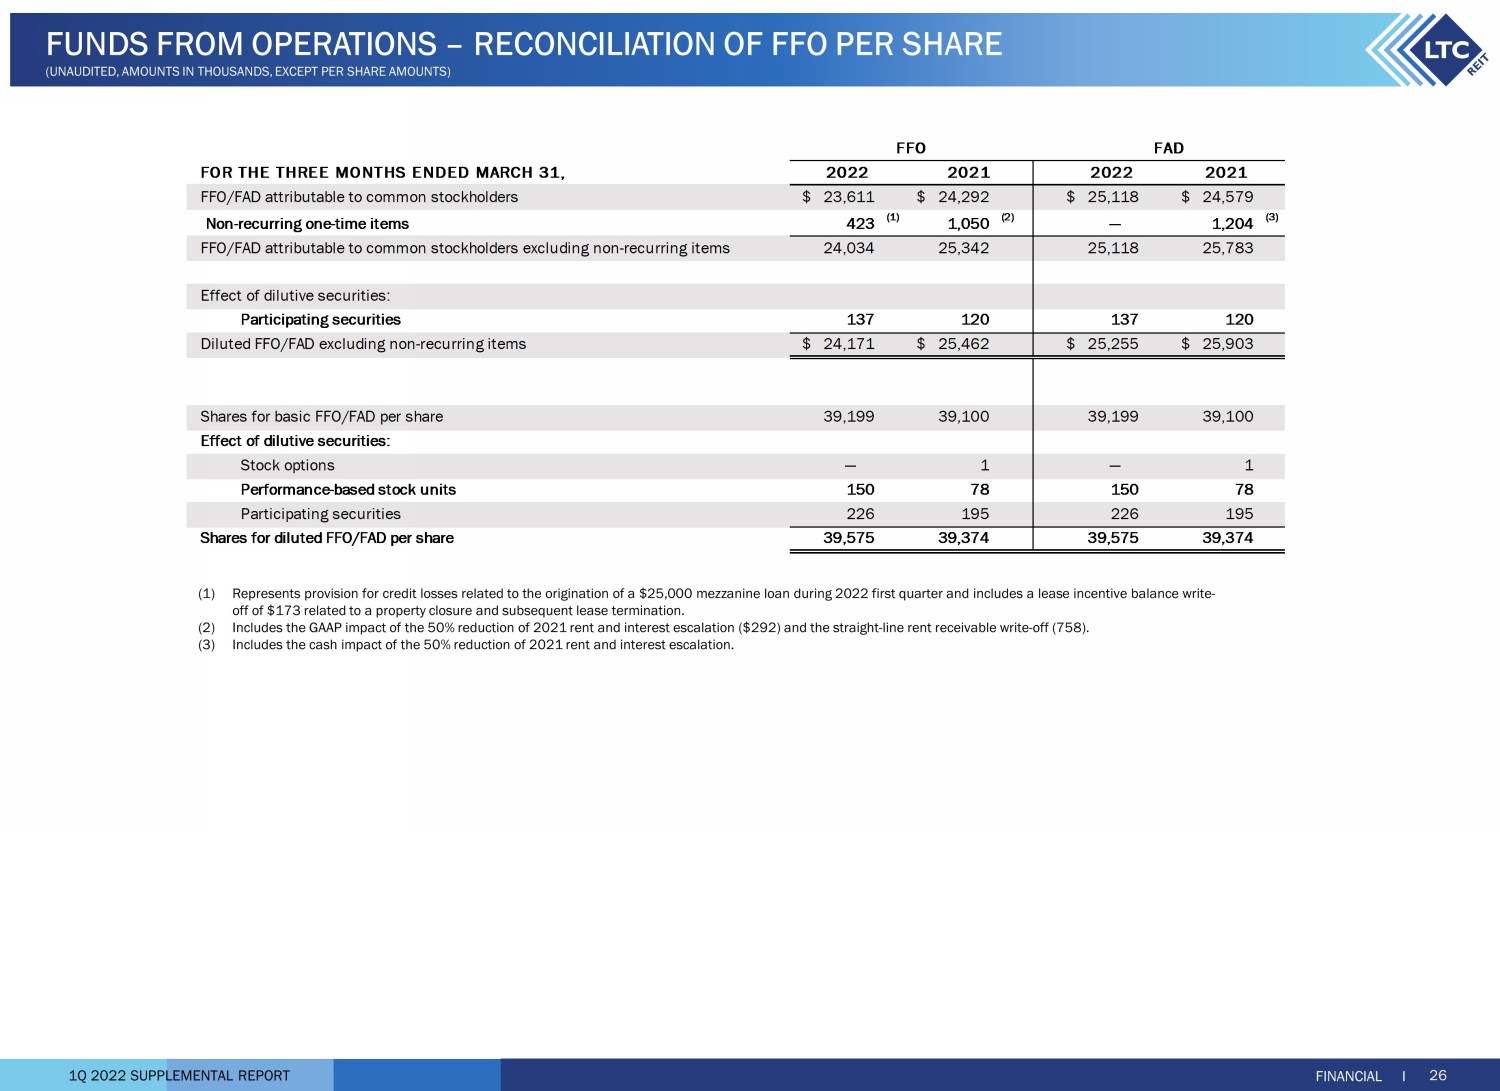
1Q 2022 SUPPLEMENTAL REPORT FOR THE THREE MONTHS ENDED MARCH 31, FFO/FAD attributable to common stockholders 23,611$ 24,292$ 25,118$ 24,579$ Non-recurring one-time items 423 (1) 1,050 (2) — 1,204 (3) FFO/FAD attributable to common stockholders excluding non-recurring items 24,034 25,342 25,118 25,783 Effect of dilutive securities: Participating securities 137 120 137 120 Diluted FFO/FAD excluding non-recurring items 24,171$ 25,462$ 25,255$ 25,903$ 39,199 39,100 39,199 39,100 Effect of dilutive securities: Stock options — 1 — 1 Performance-based stock units 150 78 150 78 Participating securities 226 195 226 195 Shares for diluted FFO/FAD per share 39,575 39,374 39,575 39,374 Shares for basic FFO/FAD per share FFO FAD 2022 2021 2022 2021 FINANCIAL I 26 FUNDS FROM OPERATIONS – RECONCILIATION OF FFO PER SHARE (UNAUDITED, AMOUNTS IN THOUSANDS, EXCEPT PER SHARE AMOUNTS) (1) Represents provision for credit losses related to the origination of a $ 25 , 000 mezzanine loan during 2022 first quarter and includes a lease incentive balance write - off of $ 173 related to a property closure and subsequent lease termination . (2) Includes the GAAP impact of the 50 % reduction of 2021 rent and interest escalation ( $ 292 ) and the straight - line rent receivable write - off ( 758 ) . (3) Includes the cash impact of the 50 % reduction of 2021 rent and interest escalation .
1Q 2022 SUPPLEMENTAL REPORT 27 ESG (ENVIRONMENTAL, SOCIAL & GOVERNANCE) Implementing corporate stewardship through socially responsible and sustainable practices within confines of predominately NNN lease structures. LTC is Committed to ESG: 2021 : Board established an ESG committee to oversee practices and performance Created and published an Environmental Sustainability Commitment and Human Capital Management and Labor Rights Guidelines found here: LTC ESG 2022 : Enhanced disclosures highlighting our ESG initiatives found here: LTC ESG Working toward aligning with the Sustainability Accounting Standards Board (SASB) reporting framework and adopting select United Nations Sustainability Development Goals (SDGs) in guiding us to provide shareholders with relevant information on our environmental impact

1Q 2022 SUPPLEMENTAL REPORT Assisted Living Communities (“ALF”) : The ALF portfolio consists of assisted living, independent living, and/or memory care properties . (See Independent Living and Memory Care) Assisted living properties are seniors housing properties serving elderly persons who require assistance with activities of daily living, but do not require the constant supervision skilled nursing properties provide . Services are usually available 24 hours a day and include personal supervision and assistance with eating, bathing, grooming and administering medication . The facilities provide a combination of housing, supportive services, personalized assistance and health care designed to respond to individual needs . Contractual Lease Rent : Rental revenue as defined by the lease agreement between us and the operator for the lease year . Coronavirus Stimulus Funds (“CSF”) : CSF includes funding from various state and federal programs to support healthcare providers in dealing with the challenges of the coronavirus pandemic . Included in CSF are state - specific payments identified by operators as well as federal payments connected to the Paycheck Protection Program and the Provider Relief Fund . CSF is self - reported by operators in unaudited financial statements provided to LTC . Specifically excluded from CSF are the suspension of the Medicare sequestration cut, and increases to the Federal Medical Assistance Percentages (FMAP), both of which are reflected in reported coverage both including and excluding CSF . Earnings Before Interest, Tax, Depreciation and Amortization for Real Estate (“EBITDA re”) : As defined by the National Association of Real Estate Investment Trusts (“ NAREIT”), EBITDA re is calculated as net income (computed in accordance with GAAP) excluding (i) interest expense, (ii) income tax expense, (iii) real estate depreciation and amortization, (iv) impairment write - downs of depreciable real estate, (v) gains or losses on the sale of depreciable real estate, and (vi) adjustments for unconsolidated partnerships and joint ventures . Funds Available for Distribution (“FAD”) : FFO excluding the effects of straight - line rent, amortization of lease costs, effective interest income, deferred income from unconsolidated joint ventures, non - cash compensation charges, capitalized interest and non - cash interest charges . Funds From Operations (“FFO”) : A s defined by NAREIT, net income available to common stockholders (computed in accordance with U . S . GAAP) excluding gains or losses on the sale of real estate and impairment write - downs of depreciable real estate plus real estate depreciation and amortization, and after adjustments for unconsolidated partnerships and joint ventures . GAAP Lease Yield : GAAP rent divided by the sum of the purchase price and transaction costs . GAAP Rent : Total rent we will receive as a fixed amount over the initial term of the lease and recognized evenly over that term . GAAP rent recorded in the early years of a lease is higher than the cash rent received and during the later years of the lease, the cash rent received is higher than GAAP rent recognized . GAAP rent is commonly referred to as straight - line rental income . Gross Asset Value : The carrying amount of total assets after adding back accumulated depreciation and loan loss reserves, as reported in the company’s consolidated financial statements . Gross Investment : Original price paid for an asset plus capital improvements funded by LTC, without any depreciation deductions . Gross Investment is commonly referred to as undepreciated book value . Independent Living Communities (“ILF”) : Seniors housing properties offering a sense of community and numerous levels of service, such as laundry, housekeeping, dining options/meal plans, exercise and wellness programs, transportation, social, cultural and recreational activities, on - site security and emergency response programs . Many offer on - site conveniences like beauty/barber shops, fitness facilities, game rooms, libraries and activity centers . ILFs are also known as retirement communities or seniors apartments . Interest Income : Represents interest income from mortgage loans and other notes . Licensed Beds/Units : The number of beds and/or units that an operator is authorized to operate at seniors housing and long - term care properties . Licensed beds and/or units may differ from the number of beds and/or units in service at any given time . Memory Care Communities (“MC”) : Seniors housing properties offering specialized options for seniors with Alzheimer’s disease and other forms of dementia . These facilities offer dedicated care and specialized programming for various conditions relating to memory loss in a secured environment that is typically smaller in scale and more residential in nature than traditional assisted living facilities . These facilities have staff available 24 hours a day to respond to the unique needs of their residents . Metropolitan Statistical Areas (“MSA”) : Based on the U . S . Census Bureau, MSA is a geographic entity defined by the Office of Management and Budget (OMB) for use by Federal statistical agencies in collecting, tabulating, and publishing Federal statistics . A metro area contains a core urban area of 50 , 000 or more population . MSAs 1 to 31 have a population of 19 . 8 M – 2 . 2 M . MSAs 32 to 100 have a population of 2 . 2 M – 0 . 6 M . MSAs greater than 100 have a population of 0 . 6 M – 59 K . Cities in a Micro - SA have a population of 223 K – 12 K . Cities not in a MSA has population of less than 100 K . Mezzanine : In certain circumstances, the Company strategically allocates a portion of its capital deployment toward mezzanine loans to grow relationships with operating companies that have not typically utilized sale leaseback financing as a component of their capital structure . Mezzanine financing sits between senior debt and common equity in the capital structure, and typically is used to finance development projects, value - add opportunities on existing operational properties, partnership buy - outs and recapitalization of equity . We seek market - based, risk - adjusted rates of return typically between 9 % to 14 % with the loan term typically between three to 10 years . Security for mezzanine loans can include all or a portion of the following credit enhancements ; secured second mortgage, pledge of equity interests and personal/corporate guarantees . Mezzanine loans can be recorded for GAAP purposes as either a loan or joint venture depending upon specifics of the loan terms and related credit enhancements . GLOSSARY I 28 GLOSSARY
1Q 2022 SUPPLEMENTAL REPORT Micropolitan Statistical Areas (“Micro - SA”) : Based on the U . S . Census Bureau, Micro - SA is a geographic entity defined by the Office of Management and Budget (OMB) for use by Federal statistical agencies in collecting, tabulating, and publishing Federal statistics . A micro area contains an urban core of at least 10 , 000 population . Mortgage Loan : Mortgage financing is provided on properties based on our established investment underwriting criteria and secured by a first mortgage . Subject to underwriting, additional credit enhancements may be required including, but not limited to, personal/corporate guarantees and debt service reserves . When possible, LTC attempts to negotiate a purchase option to acquire the property at a future time and lease the property back to the borrower . Net Real Estate Assets : Gross real estate investment less accumulated depreciation . Net Real Estate Asset is commonly referred to as Net Book Value (“NBV”) . Non - cash Rental Income : Straight - line rental income and amortization of lease inducement . Non - cash Compensation Charges : Vesting expense relating to stock options and restricted stock . Normalized EBITDAR Coverage : The trailing twelve month’s earnings from the operator financial statements adjusted for non - recurring, infrequent, or unusual items and before interest, taxes, depreciation, amortization, and rent divided by the operator’s contractual lease rent . Management fees are imputed at 5 % of revenues . Normalized EBITDARM Coverage : The trailing twelve month’s earnings from the operator financial statements adjusted for non - recurring, infrequent, or unusual items and before interest, taxes, depreciation, amortization, rent, and management fees divided by the operator’s contractual lease rent . Occupancy : The weighted average percentage of all beds and/or units that are occupied at a given time . The calculation uses the trailing twelve months and is based on licensed beds and/or units which may differ from the number of beds and/or units in service at any given time . Operator Financial Statements : Property level operator financial statements which are unaudited and have not been independently verified by us . Payor Source : LTC revenue by operator underlying payor source for the period presented . LTC is not a Medicaid or a Medicare recipient . Statistics represent LTC's rental revenues times operators' underlying payor source revenue percentage . Underlying payor source revenue percentage is calculated from property level operator financial statements which are unaudited and have not been independently verified by us . Private Pay : Private pay includes private insurance, HMO, VA, and other payors . Purchase Price : Represents the fair value price of an asset that is exchanged in an orderly transaction between market participants at the measurement date . An orderly transaction is a transaction that assumes exposure to the market for a period prior to the measurement date to allow for marketing activities that are usual and customary for transactions involving such assets ; it is not a forced transaction (for example, a forced liquidation or distress sale) . Real Estate Investments : Represents our investments in real property and mortgage loan receivables . Rental Income : Represents GAAP rent net of amortized lease inducement cost . Same Property Portfolio (“SPP”) : Same property statistics allow for the comparative evaluation of performance across a consistent population of LTC’s leased property portfolio and the Prestige Healthcare mortgage loan portfolio . Our SPP is comprised of stabilized properties occupied and operated throughout the duration of the quarter - over - quarter comparison periods presented (excluding assets sold and assets held - for - sale) . Accordingly, a property must be occupied and stabilized for a minimum of 15 months to be included in our SPP . Each property currently, or formerly, operated by Senior Lifestyle and Senior Care has been excluded from SPP and will be added back to SPP 15 months after the date of the transition to the new operator . Skilled Nursing Properties (“SNF”) : Seniors housing properties providing restorative, rehabilitative and nursing care for people not requiring the more extensive and sophisticated treatment available at acute care hospitals . Many SNFs provide ancillary services that include occupational, speech, physical, respiratory and IV therapies, as well as sub - acute care services which are paid either by the patient, the patient’s family, private health insurance, or through the federal Medicare or state Medicaid programs . Stabilized : Properties are generally considered stabilized upon the earlier of achieving certain occupancy thresholds (e . g . 80 % for SNFs and 90 % for ALFs) and, as applicable, 12 months from the date of acquisition/lease transition or, in the event of a de novo development, redevelopment, major renovations or addition, 24 months from the date the property is first placed in or returned to service, or properties acquired in lease - up . Under Development Properties (“UDP”) : Development projects to construct seniors housing properties . GLOSSARY I 29 GLOSSARY