Exhibit 99.2
RENEWAL AND TRANSITION SUPPLEMENTAL OPERATING AND FINANCIAL DATA FIRST QUARTER 2023

1Q 2023 SUPPLEMENTAL REPORT FORWARD - LOOKING STATEMENTS This supplemental information contains forward - looking statements within the meaning of Section 27 A of the Securities Act of 1933 , as amended, and Section 21 E of the Securities Exchange Act of 1934 , as amended, adopted pursuant to the Private Securities Litigation Reform Act of 1995 . Statements that are not purely historical may be forward - looking . You can identify some of the forward - looking statements by their use of forward - looking words, such as ‘‘believes,’’ ‘‘expects,’’ ‘‘may,’’ ‘‘will,’’ ‘‘should,’’ ‘‘seeks,’’ ‘‘approximately,’’ ‘‘intends,’’ ‘‘plans,’’ ‘‘estimates’’ or ‘‘anticipates,’’ or the negative of those words or similar words . Forward - looking statements involve inherent risks and uncertainties regarding events, conditions and financial trends that may affect our future plans of operation, business strategy, results of operations and financial position . A number of important factors could cause actual results to differ materially from those included within or contemplated by such forward - looking statements, including, but not limited to, the status of the economy, the status of capital markets (including prevailing interest rates), and our access to capital ; the income and returns available from investments in health care related real estate, the ability of our borrowers and lessees to meet their obligations to us, our reliance on a few major operators ; competition faced by our borrowers and lessees within the health care industry, regulation of the health care industry by federal, state and local governments, changes in Medicare and Medicaid reimbursement amounts (including due to federal and state budget constraints), compliance with and changes to regulations and payment policies within the health care industry, debt that we may incur and changes in financing terms, our ability to continue to qualify as a real estate investment trust, the relative illiquidity of our real estate investments, potential limitations on our remedies when mortgage loans default, and risks and liabilities in connection with properties owned through limited liability companies and partnerships . For a discussion of these and other factors that could cause actual results to differ from those contemplated in the forward - looking statements, please see the discussion under ‘‘Risk Factors’’ and other information contained in our Annual Report on Form 10 - K for the fiscal year ended December 31 , 2022 and in our publicly available filings with the Securities and Exchange Commission . We do not undertake any responsibility to update or revise any of these factors or to announce publicly any revisions to forward - looking statements, whether as a result of new information, future events or otherwise . NON - GAAP INFORMATION This supplemental information contains certain non - GAAP information including EBITDA re , adjusted EBITDA re , FFO, FFO excluding non - recurring items, FAD, FAD excluding non - recurring items, adjusted interest coverage ratio, and adjusted fixed charges coverage ratio . A reconciliation of this non - GAAP information is provided on pages 21 , 24 and 25 of this supplemental information, and additional information is available under the “Non - GAAP Financial Measures” subsection under the “Selected Financial Data” section of our website at www . LTCreit . com . TABLE OF CONTENTS 2 COMPANY Company Information & Leadership 3 INVESTMENTS Real Estate Activities Investments and Capital Recycling 4 Acquisitions and Financing Receivables 5 Mortgage and Mezzanine Loan Originations 6 Joint Ventures 7 Purchase Options and Renovations & Expansions 8 PORTFOLIO Overview 9-10 Diversification Operators 11-12 Maturity 13 Geography, MSA, Age of Portfolio 14-15 Real Estate Investments Metrics 16 FINANCIAL Enterprise Value 17 Debt Metrics 18 Debt Maturity 19 Financial Data Summary 20-21 Consolidated Statements of Income 22 Consolidated Balance Sheets 23 Funds from Operations 24-25 ESG and GLOSSARY ESG (Environmental, Social & Governance) 26-27 Glossary 28-29 Founded in 1992 , LTC Properties, Inc . (NYSE : LTC) is a self - administered real estate investment trust (REIT) investing in seniors housing and health care properties primarily through sale - leaseback transactions, mortgage financing and structured finance solutions including preferred equity and mezzanine lending . LTC’s portfolio encompasses Skilled Nursing Facilities (SNF), Assisted Living Communities (ALF), Independent Living Communities (ILF), Memory Care Communities (MC) and combinations thereof . Our main objective is to build and grow a diversified portfolio that creates and sustains shareholder value while providing our stockholders current distribution income . To meet this objective, we seek properties operated by regional operators, ideally offering upside and portfolio diversification (geographic, operator, property type and investment vehicle) . For more information, visit www . LTCreit . com .

1Q 2023 SUPPLEMENTAL REPORT 3 Any opinions, estimates, or forecasts regarding LTC’s performance made by the analysts listed above do not represent the opinions, estimates, and forecasts of LTC or its management. BOARD OF DIRECTORS ANALYSTS LEADERSHIP LTC PROPERTIES, INC. 2829 Townsgate Road Suite 350 Westlake Village, CA 91361 805 - 981 - 8655 www.LTCreit.com TRANSFER AGENT Broadridge Shareholder Services c/o Broadridge Corporate Issuer Solutions 1155 Long Island Avenue Edgewood, NY 11717 - 8309 ATTN: IWS 866 - 708 - 5586 WENDY SIMPSON Chairman CORNELIA CHENG ESG Committee Chairman BOYD HENDRICKSON Lead Independent Director and Nominating & Corporate Governance Committee Chairman JAMES PIECZYNSKI Investment Committee Chairman DEVRA SHAPIRO Audit Committee Chairman TIMOTHY TRICHE, MD Compensation Committee Chairman STEVEN VALIQUETTE Barclays JUAN SANABRIA BMO Capital Markets Corp. TAYO OKUSANYA Credit Suisse Securities (USA) LLC AARON HECHT JMP Securities, LLC AUSTIN WURSCHMIDT KeyBanc Capital Markets, Inc. MIKE CARROLL RBC Capital Markets Corporation RICHARD ANDERSON SMBC Nikko Securities STEVE MANAKER Stifel, Nicolaus & Company, Inc. CONNOR SIVERSKY Wells Fargo Securities, LLC WENDY SIMPSON Chairman and Chief Executive Officer PAM KESSLER Co - President, CFO and Secretary CLINT MALIN Co - President and Chief Investment Officer CECE CHIKHALE Executive Vice President, Chief Accounting Officer and Treasurer DOUG KOREY Executive Vice President, Managing Director of Business Development PETER LYEW Vice President, Director of Taxes GIBSON SATTERWHITE Senior Vice President, Asset Management MANDI HOGAN Senior Vice President of Marketing, Investor Relations and ESG MIKE BOWDEN Vice President, Investments RACHEL SON Vice President and Controller ERIC SMITH Vice President of Facilities and Capital Projects
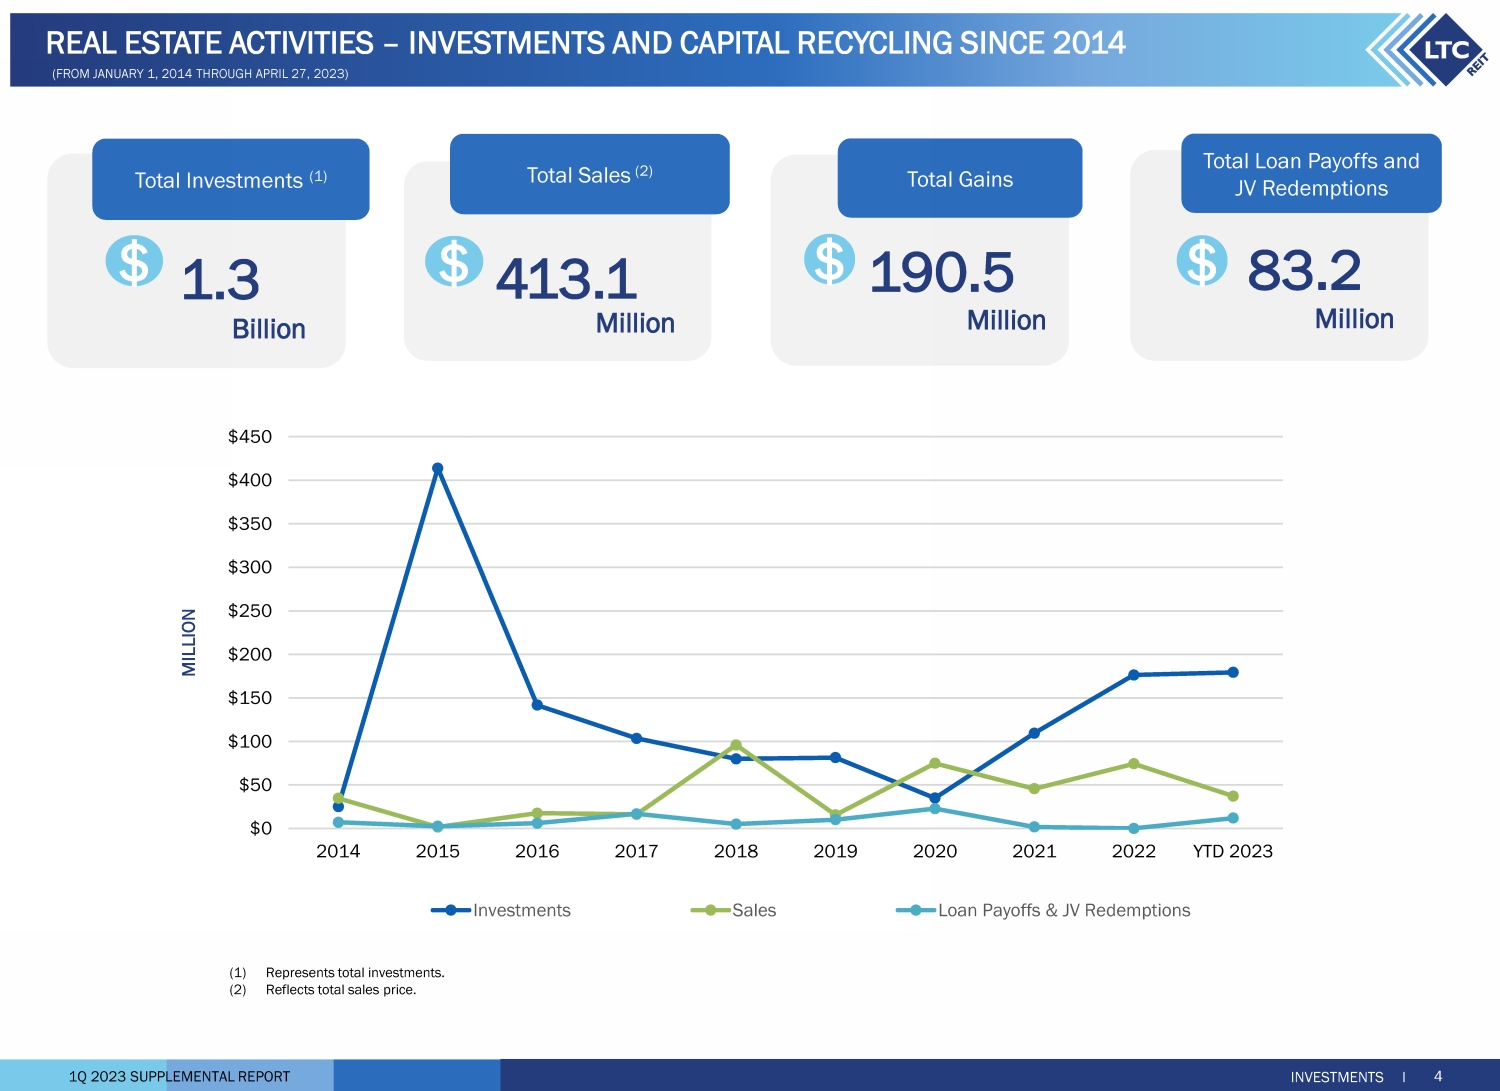
1Q 2023 SUPPLEMENTAL REPORT Million $ 413.1 Total Sales (2) INVESTMENTS I 4 Million 190.5 Total Gains $ Billion $ 1.3 Total Investments (1) MILLION REAL ESTATE ACTIVITIES – INVESTMENTS AND CAPITAL RECYCLING SINCE 2014 (FROM JANUARY 1, 2014 THROUGH APRIL 27, 2023) $0 $50 $100 $150 $200 $250 $300 $350 $400 $450 2014 2015 2016 2017 2018 2019 2020 2021 2022 YTD 2023 Investments Sales Loan Payoffs & JV Redemptions (1) Represents total investments. (2) Reflects total sales price. Million 83.2 Total Loan Payoffs and JV Redemptions $
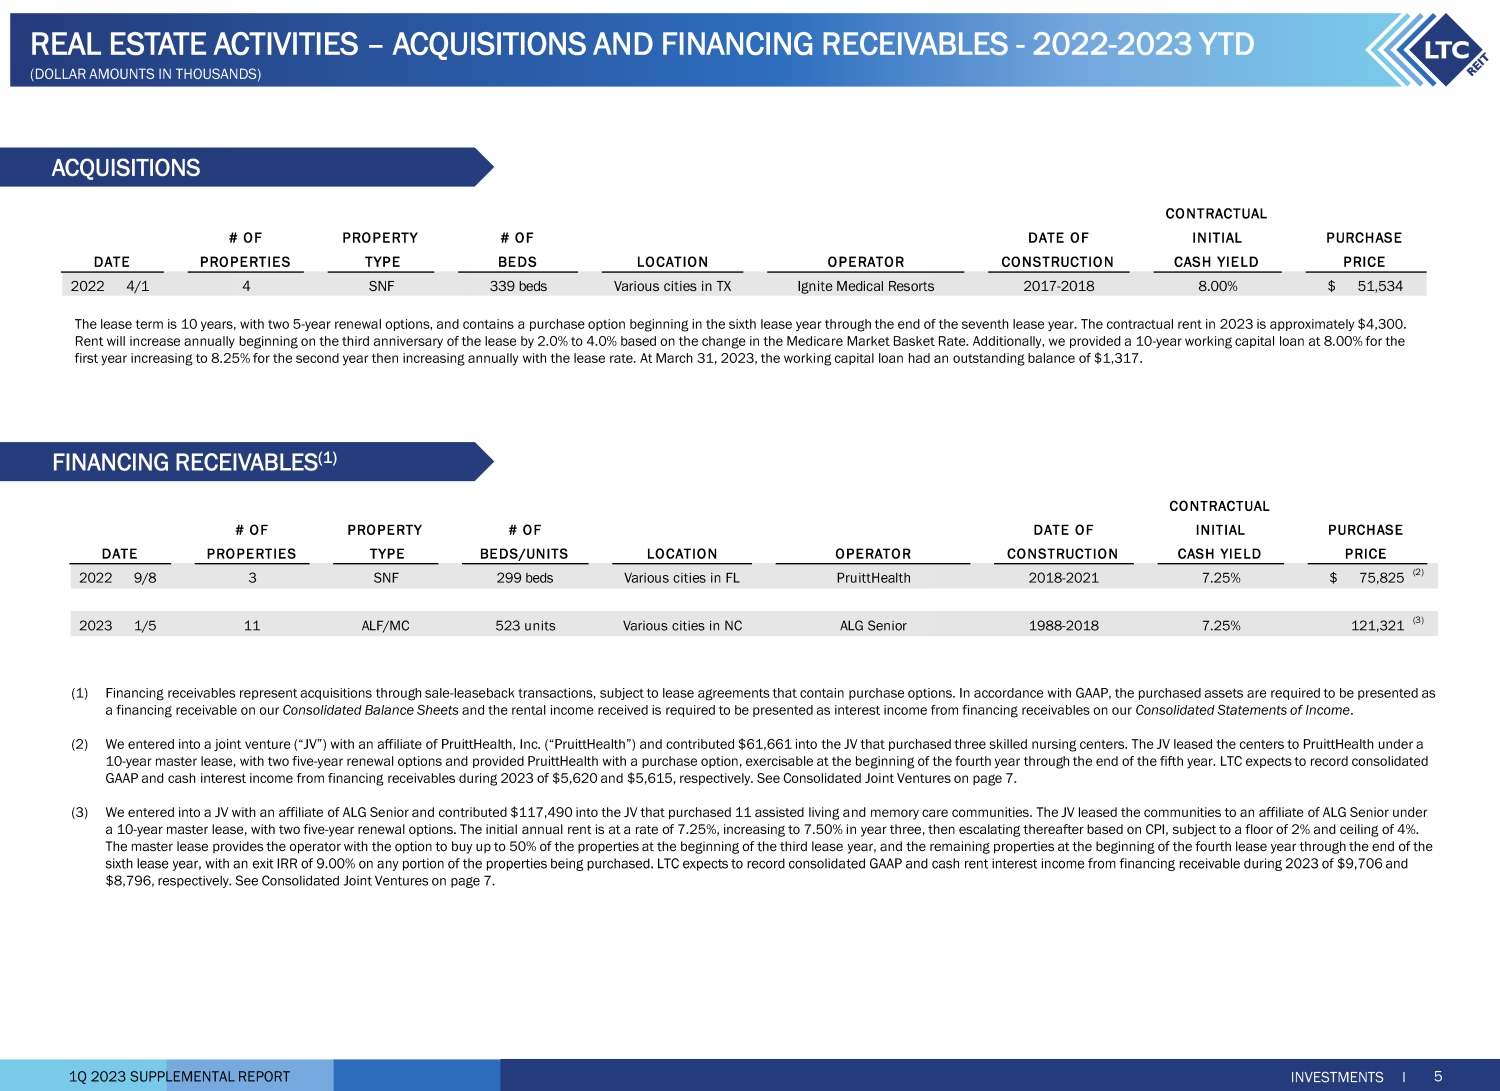
1Q 2023 SUPPLEMENTAL REPORT ACQUISITIONS 5 INVESTMENTS I REAL ESTATE ACTIVITIES – ACQUISITIONS AND FINANCING RECEIVABLES - 2022 - 2023 YTD CONTRACTUAL # OF PROPERTY # OF DATE OF INITIAL PURCHASE PROPERTIES TYPE BEDS LOCATION OPERATOR CONSTRUCTION CASH YIELD PRICE 2022 4/1 4 SNF 339 beds Various cities in TX Ignite Medical Resorts 2017-2018 8.00% 51,534$ DATE FINANCING RECEIVABLES (1) The lease term is 10 years, with two 5 - year renewal options, and contains a purchase option beginning in the sixth lease year th rough the end of the seventh lease year. The contractual rent in 2023 is approximately $4,300. Rent will increase annually beginning on the third anniversary of the lease by 2.0% to 4.0% based on the change in the Medica re Market Basket Rate. Additionally, we provided a 10 - year working capital loan at 8.00% for the first year increasing to 8.25% for the second year then increasing annually with the lease rate. At March 31, 2023, the worki ng capital loan had an outstanding balance of $1,317. (DOLLAR AMOUNTS IN THOUSANDS) CONTRACTUAL # OF PROPERTY # OF DATE OF INITIAL PURCHASE PROPERTIES TYPE BEDS/UNITS LOCATION OPERATOR CONSTRUCTION CASH YIELD PRICE 2022 9/8 3 SNF 299 beds Various cities in FL PruittHealth 2018-2021 7.25% 75,825$ (2) 2023 1/5 11 ALF/MC 523 units Various cities in NC ALG Senior 1988-2018 7.25% 121,321 (3) DATE (1) Financing receivables represent acquisitions through sale - leaseback transactions, subject to lease agreements that contain purch ase options. In accordance with GAAP, the purchased assets are required to be presented as a financing receivable on our Consolidated Balance Sheets and the rental income received is required to be presented as interest income from financing receivables on our Consolidated Statements of Income . (2) We entered into a joint venture (“JV”) with an affiliate of PruittHealth, Inc. (“PruittHealth”) and contributed $61,661 into the JV that purchased three skilled nursing centers. The JV leased the centers to PruittHealth under a 10 - year master lease, with two five - year renewal options and provided PruittHealth with a purchase option, exercisable at the be ginning of the fourth year through the end of the fifth year. LTC expects to record consolidated GAAP and cash interest income from financing receivables during 2023 of $5,620 and $5,615, respectively. See Consolidated Joi nt Ventures on page 7. (3) We entered into a JV with an affiliate of ALG Senior and contributed $117,490 into the JV that purchased 11 assisted living a nd memory care communities. The JV leased the communities to an affiliate of ALG Senior under a 10 - year master lease, with two five - year renewal options. The initial annual rent is at a rate of 7.25%, increasing to 7.50% i n year three, then escalating thereafter based on CPI, subject to a floor of 2% and ceiling of 4%. The master lease provides the operator with the option to buy up to 50% of the properties at the beginning of the third lease ye ar, and the remaining properties at the beginning of the fourth lease year through the end of the sixth lease year, with an exit IRR of 9.00% on any portion of the properties being purchased. LTC expects to record consolida ted GAAP and cash rent interest income from financing receivable during 2023 of $9,706 and $8,796, respectively. See Consolidated Joint Ventures on page 7.
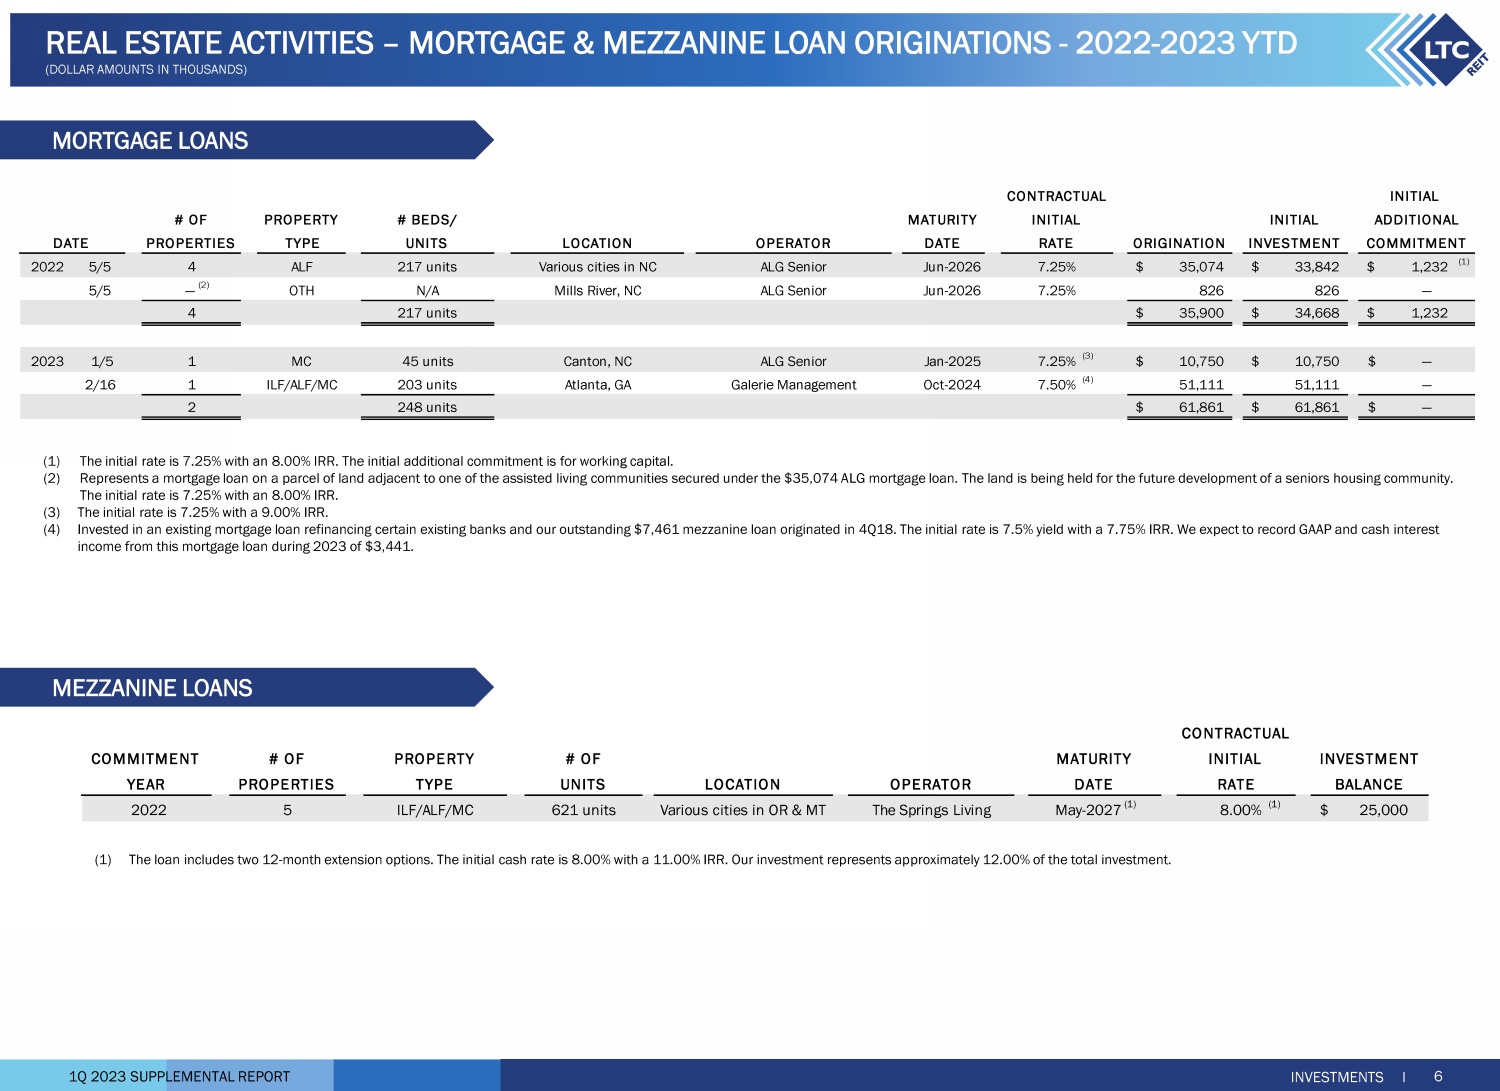
1Q 2023 SUPPLEMENTAL REPORT MORTGAGE LOANS 6 INVESTMENTS I REAL ESTATE ACTIVITIES – MORTGAGE & MEZZANINE LOAN ORIGINATIONS - 2022 - 2023 YTD (DOLLAR AMOUNTS IN THOUSANDS) MEZZANINE LOANS (1) The loan includes two 12 - month extension options. The initial cash rate is 8.00% with a 11.00% IRR. Our investment represents ap proximately 12.00% of the total investment. # OF PROPERTY # OF MATURITY PROPERTIES TYPE UNITS LOCATION OPERATOR DATE 2022 5 ILF/ALF/MC 621 units Various cities in OR & MT The Springs Living May-2027 (1) 8.00% (1) 25,000$ INVESTMENT CONTRACTUAL YEAR RATE BALANCE COMMITMENT INITIAL # OF PROPERTY # BEDS/ MATURITY INITIAL PROPERTIES TYPE UNITS LOCATION OPERATOR DATE ORIGINATION INVESTMENT 2022 5/5 4 ALF 217 units Various cities in NC ALG Senior Jun-2026 7.25% 35,074$ 33,842$ 1,232$ (1) 5/5 — (2) OTH N/A Mills River, NC ALG Senior Jun-2026 7.25% 826 826 — 4 217 units 35,900$ 34,668$ 1,232$ 2023 1/5 1 MC 45 units Canton, NC ALG Senior Jan-2025 7.25% (3) 10,750$ 10,750$ —$ 2/16 1 ILF/ALF/MC 203 units Atlanta, GA Galerie Management Oct-2024 7.50% (4) 51,111 51,111 — 2 248 units 61,861$ 61,861$ —$ INITIAL DATE COMMITMENT ADDITIONAL CONTRACTUAL INITIAL RATE (1) The initial rate is 7.25% with an 8.00% IRR. The initial additional commitment is for working capital. (2) Represents a mortgage loan on a parcel of land adjacent to one of the assisted living communities secured under the $35,074 A LG mortgage loan. The land is being held for the future development of a seniors housing community. The initial rate is 7.25% with an 8.00% IRR. (3) The initial rate is 7.25% with a 9.00% IRR. (4) Invested in an existing mortgage loan refinancing certain existing banks and our outstanding $7,461 mezzanine loan originated in 4Q18. The initial rate is 7.5% yield with a 7.75% IRR. We expect to record GAAP and cash interest income from this mortgage loan during 2023 of $3,441.

1Q 2023 SUPPLEMENTAL REPORT INVESTMENT PROPERTY # OF YEAR TYPE UNITS/BEDS LOCATION OPERATOR INVESTMENT PURPOSE 2017 ILF/ALF/MC 110 units Cedarburg, WI Tealwood Senior Living Owned Real Estate 22,244$ 2,305$ 19,939$ 2017 ALF 87 units Spartanburg, SC ALG Senior Owned Real Estate 11,660 1,241 10,419 197 units 33,904 3,546 30,358 2018 ALF/MC 78 units Medford, OR Fields Senior Living (1) Owned Real Estate (1) 18,978 1,090 17,888 2018 ILF 89 units Medford, OR Fields Senior Living (1) Owned Real Estate (1) 14,651 2,907 11,744 167 units 33,629 3,997 29,632 2022 SNF 299 beds Various cities in FL PruittHealth (2) Owned Real Estate (2) 75,986 14,325 61,661 2023 ALF/MC 523 units Various cities in NC ALG Senior (3) Owned Real Estate (3) 121,321 3,831 117,490 887 units/299 beds 264,840$ 25,699$ 239,141$ CONTRIBUTION LTCJOINT VENTURES INTEREST TOTAL NON-CONTROLLING CONTRIBUTIONCOMMITMENT (1) The initial cash rate is 7.00% increasing to 9.00% in year - four until the IRR is 8.00%. After achieving an 8.00% IRR, the cash r ate drops to 8.00% with an IRR ranging between of 12.00% and 14.00% depending upon timing of redemption. Our investment represents 15.50% of the total investment. The property opened in December 2021 and occupancy was 80% at March 31,2023. We have the option to require the JV partner to purchase our preferred equity interest at any time between August 17, 2031 and December 31, 2036. (2) The initial cash rate is 8.00% with an IRR of 14.00%. Our investment represents 11.00% of the total estimated project cost. T he JV provides the JV partner the option to buy out our investment at any time after August 31, 2023 at the IRR rate. Also, we have the option to require the JV partner to purchase our preferred equity interest at any time bet wee n August 31, 2027 and prior to the end of the first renewal term of the lease. The estimated project completion is 3Q23. CONSOLIDATED JOINT VENTURES UNCONSOLIDATED JOINT VENTURES INVESTMENTS I 7 REAL ESTATE ACTIVITIES – JOINT VENTURES - CURRENT INVESTMENTS HE LD (DOLLAR AMOUNTS IN THOUSANDS) # OF PROPERTY # OF INVESTMENT PROPERTIES TYPE UNITS LOCATION OPERATOR TYPE 2020 1 ALF/MC 95 units Arlington, WA Fields Senior Living Preferred Equity 7.00% (1) 6,340$ 2020 1 UDP-ILF/ALF 267 units Vancouver, WA Koelsch Communities Preferred Equity 8.00% (2) 13,000 2 362 units 19,340$ YEAR COMMITMENTRETURN COMMITMENT INVESTMENT (1) Represents a single joint venture with ownership in two properties. (2) We entered into a JV with an affiliate of PruittHealth and the JV purchased three skilled nursing centers. In accordance with GA AP, the purchased assets are presented as a financing receivable on our Consolidated Balance Sheets. See further discussion of the PruittHealth financing receivable on page 5. (3) We entered into a JV with an affiliate of ALG Senior to purchase 11 assisted living/memory care communities. In accordance wi th GAAP, the purchased assets are presented as a financing receivable on our Consolidated Balance Sheets . See further discussion of the ALG Senior financing receivable on page 5.

1Q 2023 SUPPLEMENTAL REPORT CONTRACTUAL TOTAL COMMITMENT # OF PROPERTY PROJECT INITIAL INVESTMENT 1Q23 FUNDED REMAINING YEAR PROPERTIES TYPE TYPE LOCATION OPERATOR CASH YIELD TO DATE COMMITMENT — (1) 2018 1 SNF Renovation Grand Haven, MI Prestige Healthcare 9.41% 3,000$ 31$ 1,807$ 1,193$ — (2) 2021 1 ALF/MC Expansion Ocala, FL Pointe Group Care 7.75% 4,177 952 2,730 1,447 — (3) 2021 13 ILF/ALF/MC Renovation Various cities in NC and SC ALG Senior 7.25% 6,098 — 3,702 2,396 15 13,275$ 983$ 8,239$ 5,036$ INCEPTION DATE COMMITMENT FUNDING INTEREST ESTIMATED (1) This commitment is part of a total loan commitment secured by four properties in Michigan. Interest payment increases upon e ach funding. (2) This commitment is part of a $16,707 loan commitment for the construction of a memory care addition to the property. Interest pa yment increases upon each funding. (3) This commitment is part of a $59,250 loan commitment secured by 13 properties, (12) North Carolina and (1) South Carolina. In ter est payment increases upon each funding. RENOVATIONS & EXPANSIONS: MORTGAGE LOANS INVESTMENTS I 8 REAL ESTATE ACTIVITIES – PURCHASE OPTIONS AND RENOVATIONS & EXPA NSIONS (DOLLAR AMOUNTS IN THOUSANDS) PURCHASE OPTIONS # OF PROPERTY GROSS OPTION STATE PROPERTIES TYPE INVESTMENTS WINDOW California 2 ALF/MC 38,895$ 2,876$ 2023-2029 Florida 1 MC 15,201 664 2029 Florida 3 SNF 76,756 5,620 2025-2027 (1) Nebraska 3 ALF 7,633 660 TBD (2) North Carolina 11 ALF/MC 121,321 9,706 2025-2028 (1) Ohio 1 MC 16,160 — 2024-2025 South Carolina 1 ALF/MC 11,680 907 2029 Texas 4 SNF 51,837 4,337 2027-2029 (3) Total 26 339,483$ 24,770$ ANNUALIZED GAAP REVENUE (1) See Financing Receivables on page 5 for further discussion. (2) Subject to the properties achieving certain coverage ratios. (3) The master lease allows the operator to elect either an earn - out payment or purchase option. If neither option is elected within the timeframe defined in the lease, both elections are terminated.

1Q 2023 SUPPLEMENTAL REPORT # OF % OF % OF BY INVESTMENT TYPE PROPERTIES INVESTMENT REVENUES (1) REVENUES INCOME STATEMENT LINE Owned Portfolio (2) 149 1,389,222$ 65.8% 110,762$ 67.7% Rental Income Financing Receivables 14 198,077 9.5% 5,514 3.4% Interest Income from Financing Receivables Mortgage Loans 43 457,524 21.6% 42,207 25.8% Interest Income from Mortgage Loans Notes Receivable 5 46,936 2.2% 3,673 2.2% Interest and Other Income Unconsolidated Joint Ventures 1 19,340 0.9% 1,504 0.9% Income from Unconsolidated Joint Ventures Total 212 2,111,099$ 100.0% 163,660$ 100.0% # OF % OF BY PROPERTY TYPE PROPERTIES INVESTMENT Assisted Living (2) 135 1,113,096$ 52.7% Skilled Nursing 76 970,300 46.0% Other (3) 1 14,703 0.7% Under Development — 13,000 0.6% Total 212 2,111,099$ 100.0% INVESTMENT GROSS INVESTMENT TRAILING TWELVE MONTHS ENDED MARCH 31, 2023 GROSS Owned Portfolio 65.8% Mortgage Loans* 9.5% Financing Receivable 21.6% Notes Receivable 2.2% Unconsolidated Joint Ventures 0.9% Assisted Living 52.7% Skilled Nursing 46.0% Other 0.7% Under Development 0.6% 30 Operators 29 States 212 Properties PORTFOLIO I 9 PORTFOLIO OVERVIEW (DOLLAR AMOUNTS IN THOUSANDS) *Weighted average maturity @ 3/31/23 – 12.8 years GROSS INVESTMENT BY INVESTMENT TYPE GROSS INVESTMENT BY PROPERTY TYPE (1) See Trailing Twelve Months Revenues definition in the Glossary . (2) Subsequent to March 31 , 2023 , we sold a 70 - unit assisted living community located in Florida for $ 4 , 850 . In connection with the sale, we recorded a $ 434 impairment loss during 1 Q 23 . (3) Includes one behavioral health care hospital and three parcels for land held - for - use, a parcel of land securing a first mortgage held for future development of a post - acute skilled nursing center and a parcel of land securing a first mortgage held for future development of a seniors housing community .

1Q 2023 SUPPLEMENTAL REPORT PORTFOLIO I 10 PORTFOLIO OVERVIEW – DETAIL (DOLLAR AMOUNTS IN THOUSANDS) # OF OWNED PORTFOLIO PROPERTIES RENTAL INCOME (1) Assisted Living (2) 98 785,912$ 37.2% 53,035$ 32.4% Skilled Nursing 50 591,305 28.0% 56,727 34.7% Other 1 12,005 0.6% 1,000 0.6% Total 149 1,389,222$ 65.8% 110,762$ 67.7% # OF FINANCING RECEIVABLES PROPERTIES FINANCING INCOME (1) Assisted Living 11 121,321$ 5.8% 2,346$ 1.4% Skilled Nursing 3 76,756 3.7% 3,168 2.0% Total 14 198,077$ 9.5% 5,514$ 3.4% # OF MORTGAGE LOANS MORTGAGE LOANS PROPERTIES INTEREST INCOME (1) Assisted Living 20 167,573$ 7.9% 8,311$ 5.1% Skilled Nursing 23 287,253 13.6% 33,700 20.6% Other — 2,698 0.1% 196 0.1% Total 43 457,524$ 21.6% 42,207$ 25.8% REAL ESTATE INVESTMENTS 206 2,044,823$ 96.9% 158,483$ 96.9% # OF INTEREST AND NOTES RECEIVABLE PROPERTIES OTHER INCOME (1) Assisted Living 5 31,950$ 1.5% 2,947$ 1.8% Skilled Nursing — 14,986 0.7% 726 0.4% Total 5 46,936$ 2.2% 3,673$ 2.2% # OF UNCONSOLIDATED UNCONSOLIDATED JOINT VENTURES PROPERTIES JV INCOME (1) Assisted Living 1 6,340$ 0.3% 450$ 0.3% Under Development — 13,000 0.6% 1,054 0.6% Total 1 19,340$ 0.9% 1,504$ 0.9% TOTAL INVESTMENTS 212 2,111,099$ 100.0% 163,660$ 100.0% GROSS INVESTMENT % OF GROSS INVESTMENT REVENUES % OF TOTAL REVENUES % OF TOTAL REVENUES % OF TOTAL INVESTMENT TRAILING TWELVE MONTHS ENDED MARCH 31, 2023 GROSS % OF GROSS INVESTMENT REVENUES % OF TOTAL GROSS % OF % OF TOTAL INVESTMENT GROSS INVESTMENT REVENUES INVESTMENT GROSS GROSS INVESTMENT GROSS INVESTMENT % OF GROSS INVESTMENT % OF (1) See Trailing Twelve Months Revenues definition in the Glossary . (2) Subsequent to March 31 , 2023 , we sold a 70 - unit assisted living community located in Florida for $ 4 , 850 . In connection with the sale, we recorded a $ 434 impairment loss during 1 Q 23 . 32.4% 34.7% 0.6% 0.0% 25.0% 50.0% ALF SNF OTH RENTAL INCOME (AS % OF TOTAL REVENUES) MORTGAGE LOANS INTEREST INCOME (AS % OF TOTAL REVENUES) INTEREST & OTHER INCOME (AS % OF TOTAL REVENUES) UNCONSOLIDATED JV INCOME (AS % OF TOTAL REVENUES) 5.1% 20.6% 0.1% 0.0% 25.0% 50.0% ALF SNF OTH 1.8% 0.4% 0.0% 5.0% 10.0% ALF SNF 0.3% 0.6% 0.0% 5.0% 10.0% ALF SNF 1.4% 2.0% 0.0% 5.0% 10.0% ALF SNF FINANCING RECEIVABLES (AS % OF TOTAL REVENUES)
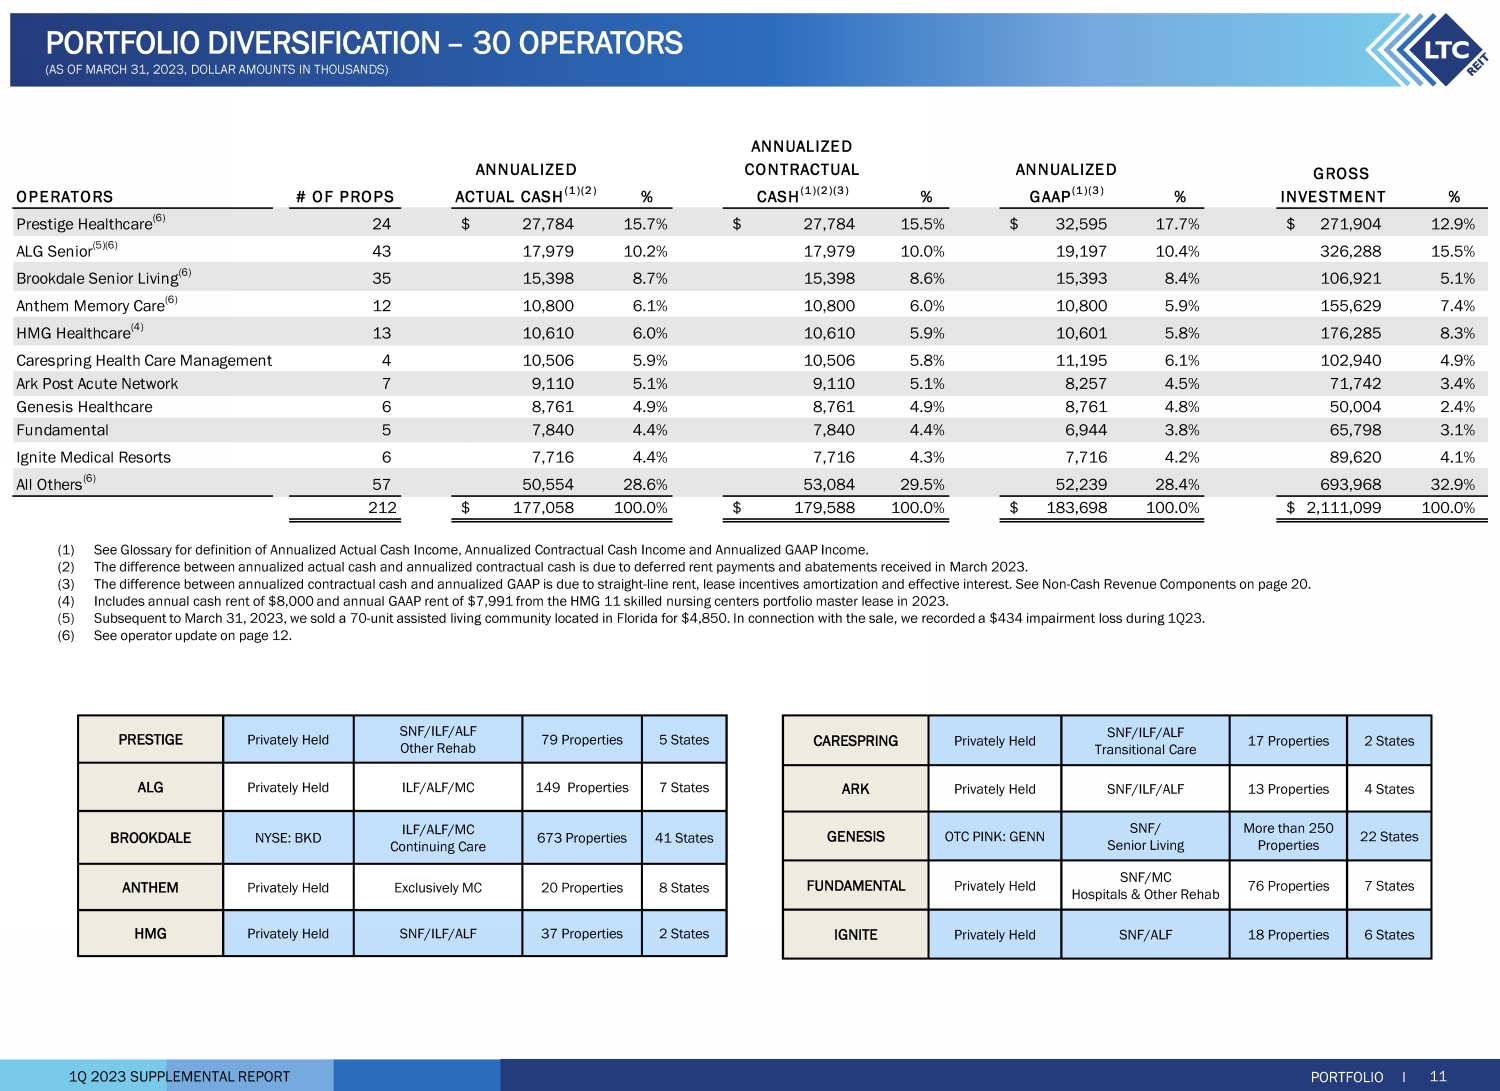
1Q 2023 SUPPLEMENTAL REPORT OPERATORS # OF PROPS % % % GROSS INVESTMENT % Prestige Healthcare (6) 24 27,784$ 15.7% 27,784$ 15.5% 32,595$ 17.7% 271,904$ 12.9% ALG Senior (5)(6) 43 17,979 10.2% 17,979 10.0% 19,197 10.4% 326,288 15.5% Brookdale Senior Living (6) 35 15,398 8.7% 15,398 8.6% 15,393 8.4% 106,921 5.1% Anthem Memory Care (6) 12 10,800 6.1% 10,800 6.0% 10,800 5.9% 155,629 7.4% HMG Healthcare (4) 13 10,610 6.0% 10,610 5.9% 10,601 5.8% 176,285 8.3% Carespring Health Care Management 4 10,506 5.9% 10,506 5.8% 11,195 6.1% 102,940 4.9% Ark Post Acute Network 7 9,110 5.1% 9,110 5.1% 8,257 4.5% 71,742 3.4% Genesis Healthcare 6 8,761 4.9% 8,761 4.9% 8,761 4.8% 50,004 2.4% Fundamental 5 7,840 4.4% 7,840 4.4% 6,944 3.8% 65,798 3.1% Ignite Medical Resorts 6 7,716 4.4% 7,716 4.3% 7,716 4.2% 89,620 4.1% All Others (6) 57 50,554 28.6% 53,084 29.5% 52,239 28.4% 693,968 32.9% 212 177,058$ 100.0% 179,588$ 100.0% 183,698$ 100.0% 2,111,099$ 100.0% ANNUALIZED GAAP (1)(3) ANNUALIZED ACTUAL CASH (1)(2) ANNUALIZED CONTRACTUAL CASH (1)(2)(3) PORTFOLIO I 11 PORTFOLIO DIVERSIFICATION – 30 OPERATORS (AS OF MARCH 31, 2023, DOLLAR AMOUNTS IN THOUSANDS) CARESPRING Privately Held SNF/ILF/ALF Transitional Care 17 Properties 2 States ARK Privately Held SNF/ILF/ALF 13 Properties 4 States GENESIS OTC PINK: GENN SNF/ Senior Living More than 250 Properties 22 States FUNDAMENTAL Privately Held SNF/MC Hospitals & Other Rehab 76 Properties 7 States IGNITE Privately Held SNF/ALF 18 Properties 6 States PRESTIGE Privately Held SNF/ILF/ALF Other Rehab 79 Properties 5 States ALG Privately Held ILF/ALF/MC 149 Properties 7 States BROOKDALE NYSE: BKD ILF/ALF/MC Continuing Care 673 Properties 41 States ANTHEM Privately Held Exclusively MC 20 Properties 8 States HMG Privately Held SNF/ILF/ALF 37 Properties 2 States (1) See Glossary for definition of Annualized Actual Cash Income, Annualized Contractual Cash Income and Annualized GAAP Income . (2) The difference between annualized actual cash and annualized contractual cash is due to deferred rent payments and abatements received in March 2023 . (3) The difference between annualized contractual cash and annualized GAAP is due to straight - line rent, lease incentives amortization and effective interest . See Non - Cash Revenue Components on page 20 . (4) Includes annual cash rent of $ 8 , 000 and annual GAAP rent of $ 7 , 991 from the HMG 11 skilled nursing centers portfolio master lease in 2023 . (5) Subsequent to March 31 , 2023 , we sold a 70 - unit assisted living community located in Florida for $ 4 , 850 . In connection with the sale, we recorded a $ 434 impairment loss during 1 Q 23 . (6) See operator update on page 12 .
1Q 2023 SUPPLEMENTAL REPORT PORTFOLIO I 12 REVENUE UPDATES During 1Q23, we collected 98.4%, or $39,014, of contractual rent and mortgage interest income and provided 1.6%, or $645, of aba ted rent to an existing operator. We provided $215 of abated rent in April 2023 and agreed to provide rent abatements up to $215 for each of May and June of 2023 pursuant to a master lease covering two assisted living communities. We are evaluating options for these communities. In regard to our transitioned ALF portfolios with quarterly market - based rent resets, we expect to receive $630 in rent during 2 023. For our transitioned SNF portfolio to HMG with quarterly market - based resets, we expect to receive $8,000 in rent during 2023. Anthem paid us the agreed upon annual cash rent of $10,800 in each of 2022 and 2021 and we expect to receive $10,800 of annua l c ash rent from Anthem during 2023. During 1Q23, we transitioned a 60 - unit memory care community located in Ohio to Anthem. Under a new two - year lease, no ren t will be paid through May 2023, after which cash rent will be based on mutually agreed upon fair market rent. This property was part of a two - property portfolio which lease was due to mature this year. The other property, which was located in Kentucky, was sold in 1Q23. Anthem is current on agreed upon rent payments through A pri l 2023. We receive regular financial performance updates from Anthem and continue to monitor their performance obligations under the master lease agreement. Subsequent to March 31, 2023, we a greed to defer each of April and May 2023 rent of $467 for an operator for whom LTC previously provided assistance. We are in th e process of transitioning this portfolio of eight assisted living communities with a total of 500 units to another LTC operato r, and expect to complete the transaction during 2Q23. These communities are located in Ohio, Michigan and Illinois. After the portfolio is transitioned, cash rent will be ba sed on mutually agreed upon fair market rent. Subsequent to March 31, 2023, we have agreed to defer $1,500 in interest payment due on a mortgage loan secured by 15 skilled nu rsing centers located in Michigan which are operated by Prestige Healthcare. The deferral will be available from May through September 2023 capped at $300 per mon th. PORTFOLIO DIVERSIFICATION – OPERATOR UPDATE (DOLLAR AMOUNTS IN THOUSANDS) LEASE RENEWALS REAL ESTATE SALES Brookdale elected not to exercise its renewal option under a master lease that matures on December 31, 2023. Brookdale is obl iga ted to pay rent on the portfolio of 35 assisted living communities through maturity. We plan to sell approximately half of the properties in the Brookdale portfolio , w hile re - leasing the other half. Brookdale is current on rent payments through April 2023. During 1Q23, a master lease covering two skilled nursing centers that was scheduled to mature in 2023 was renewed at the contractual rate fo r another five years extending the maturity to November 2028. The centers have a total 216 beds and are located in Florida. Subsequent to March 31, 2023, we s old a 70 - unit assisted living community located in Florida for $4,850. In connection with the sale, we recorded a $434 impairmen t loss during 1Q23.
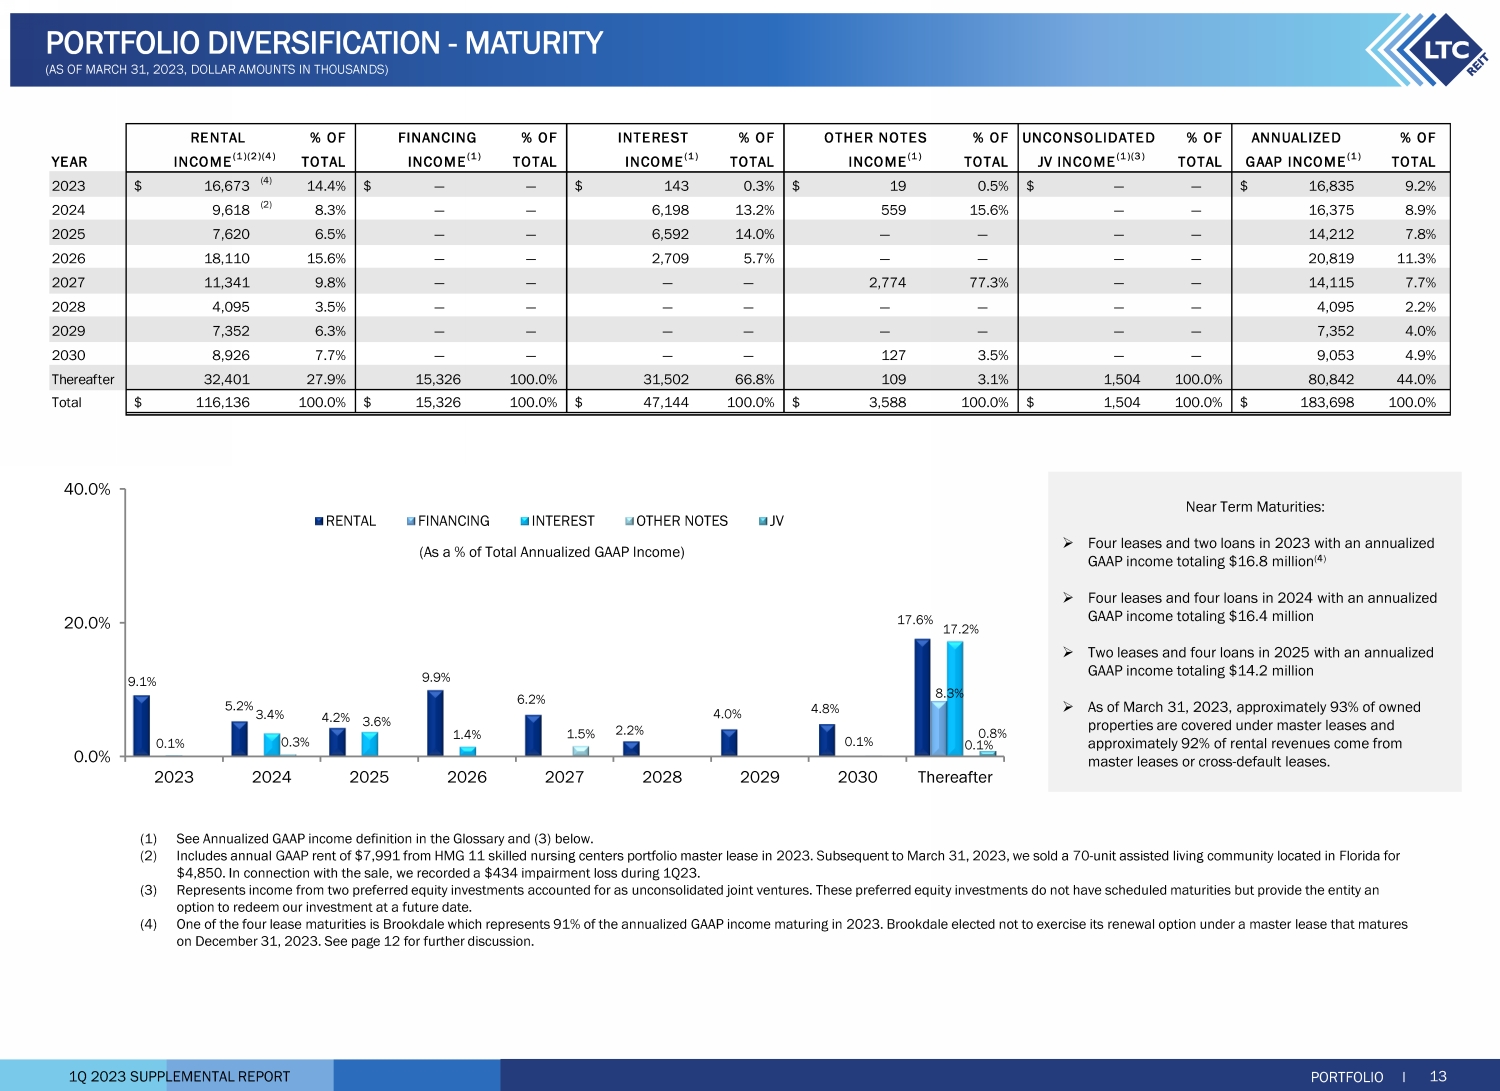
1Q 2023 SUPPLEMENTAL REPORT 9.1% 5.2% 4.2% 9.9% 6.2% 2.2% 4.0% 4.8% 17.6% 8.3% 0.1% 3.4% 3.6% 1.4% 17.2% 0.3% 1.5% 0.1% 0.1% 0.8% 0.0% 20.0% 40.0% 2023 2024 2025 2026 2027 2028 2029 2030 Thereafter RENTAL FINANCING INTEREST OTHER NOTES JV (As a % of Total Annualized GAAP Income) Near Term Maturities: » Four leases and two loans in 2023 with an annualized GAAP income totaling $16.8 million (4) » Four leases and four loans in 2024 with an annualized GAAP income totaling $16.4 million » Two leases and four loans in 2025 with an annualized GAAP income totaling $14.2 million » As of March 31, 2023, approximately 93% of owned properties are covered under master leases and approximately 92% of rental revenues come from master leases or cross - default leases. PORTFOLIO DIVERSIFICATION - MATURITY (AS OF MARCH 31, 2023, DOLLAR AMOUNTS IN THOUSANDS) % OF % OF INTEREST % OF % OF % OF ANNUALIZED % OF YEAR TOTAL TOTAL TOTAL TOTAL TOTAL TOTAL 2023 16,673$ (4) 14.4% —$ — 143$ 0.3% 19$ 0.5% —$ — 16,835$ 9.2% 2024 9,618 (2) 8.3% — — 6,198 13.2% 559 15.6% — — 16,375 8.9% 2025 7,620 6.5% — — 6,592 14.0% — — — — 14,212 7.8% 2026 18,110 15.6% — — 2,709 5.7% — — — — 20,819 11.3% 2027 11,341 9.8% — — — — 2,774 77.3% — — 14,115 7.7% 2028 4,095 3.5% — — — — — — — — 4,095 2.2% 2029 7,352 6.3% — — — — — — — — 7,352 4.0% 2030 8,926 7.7% — — — — 127 3.5% — — 9,053 4.9% Thereafter 32,401 27.9% 15,326 100.0% 31,502 66.8% 109 3.1% 1,504 100.0% 80,842 44.0% Total 116,136$ 100.0% 15,326$ 100.0% 47,144$ 100.0% 3,588$ 100.0% 1,504$ 100.0% 183,698$ 100.0% RENTAL UNCONSOLIDATED INCOME (1) OTHER NOTES FINANCING INCOME (1) INCOME (1) INCOME (1)(2)(4) JV INCOME (1)(3) GAAP INCOME (1) PORTFOLIO I 13 (1) See Annualized GAAP income definition in the Glossary and (3) below. (2) Includes annual GAAP rent of $7,991 from HMG 11 skilled nursing centers portfolio master lease in 2023. Subsequent to March 3 1, 2023, we sold a 70 - unit assisted living community located in Florida for $4,850. In connection with the sale, we recorded a $434 impairment loss during 1Q23. (3) Represents income from two preferred equity investments accounted for as unconsolidated joint ventures. These preferred equit y i nvestments do not have scheduled maturities but provide the entity an option to redeem our investment at a future date. (4) One of the four lease maturities is Brookdale which represents 91% of the annualized GAAP income maturing in 2023. Brookdale ele cted not to exercise its renewal option under a master lease that matures on December 31, 2023. See page 12 for further discussion.

1Q 2023 SUPPLEMENTAL REPORT States in which we have some of the highest concentration of properties are states with the highest projected increases in the 80+ population cohort over the next decade. PORTFOLIO I 14 PORTFOLIO DIVERSIFICATION - GEOGRAPHY (AS OF MARCH 31, 2023, DOLLAR AMOUNTS IN THOUSANDS) 29 STATES * Behavioral health care hospital SNF (76) ALF (135) OTH* (1) LAND (5) UDP (1) CA WA ME NV WY IL AR WV ND NY OR AZ NM TX UT ID MT SD NE KS OK MS MN WI FL (1) AL GA SC TN MO IA IN OH PA NJ NC VA CO KY 7 20 1 1 3 1 2 4 2 1 3 6 17 33 2 7 7 3 8 4 13 5 6 1 22 2 5 7 1 1 2 1 2 5 2 2 MI 1 1 LA 2 Represents 10 states with the highest projected increases in the 80+ population cohort from year 2020 to year 2030 Source: The American Senior Housing Association, Winter 2018, Population Growth Forecast by State (1) Subsequent to March 31, 2023, we sold a 70 - unit assisted living community located in Florida for $4,850. In connection with the sale, we recorded a $434 impairment loss during 1Q23.

1Q 2023 SUPPLEMENTAL REPORT 47.8% 17.6% 25.0% 6.5% 3.1% 0.0% 20.0% 40.0% 60.0% 80.0% MSAs 1-31 MSAs 32-100 MSAs > 100 Cities in Micro-SA Cities not in MSA or Micro-SA 20 years 15 years 0 10 20 30 40 Skilled Nursing Assisted Living Years (1) The MSA rank by population as of July 1, 2021, as estimated by the United States Census Bureau. Approximately 65% of our properties are in the top 100 MSAs. Includes only our real estate investments. (1) As calculated from construction date or major renovation/expansion date . Includes only our real estate investments . GROSS PORTFOLIO BY MSA (1) AVERAGE PORTFOLIO AGE (1) PORTFOLIO I 15 PORTFOLIO DIVERSIFICATION – GEOGRAPHY (29 STATES) (AS OF MARCH 31, 2023, DOLLAR AMOUNTS IN THOUSANDS) # OF STATE (1) PROPS % ALF % SNF % UDP % % Texas 37 328,442$ 15.7% 73,061$ 6.6% 255,381$ 26.7% —$ — —$ — Michigan 24 280,294 13.4% 21,444 2.0% 257,907 27.0% — — 943 6.4% North Carolina 33 232,841 11.2% 232,029 21.0% — — — — 812 5.5% Florida (3) 14 159,461 7.6% 49,840 4.5% 109,621 11.5% — — — — Wisconsin 8 114,838 5.5% 100,892 9.1% 13,946 1.5% — — — — Colorado 13 105,106 5.0% 105,106 9.5% — — — — — — Illinois 5 88,504 4.3% 88,504 8.0% — — — — — — Ohio 9 87,693 4.2% 33,469 3.0% 54,224 5.7% — — — — California 4 69,685 3.3% 52,053 4.7% 17,632 1.8% — — — — Georgia 2 65,621 3.1% 65,621 5.9% — — — — — — All Others 63 556,678 26.7% 284,127 25.7% 246,603 25.8% 13,000 100.0% 12,948 88.1% Total 212 2,089,163$ 100.0% 1,106,146$ 100.0% 955,314$ 100.0% 13,000$ 100.0% 14,703$ 100.0% OTH (2) INVESTMENT GROSS INVESTMENTGROSS (1) Due to master leases with properties in various states, revenue by state is not available. Also, working capital notes are pr ovi ded to certain operators under their master leases covering properties in various states. Therefore, the working capital notes outstanding balance totaling $21,936 is also not available by state. (2) Includes one behavioral health care hospital and three parcels for land held - for - use, one parcel of land securing a first mortga ge held for future development of a post - acute skilled nursing center and one parcel of land securing a first mortgage held for future development of a seniors housing community. (3) Subsequent to March 31, 2023, we sold a 70 - unit assisted living community located in Florida for $4,850. In connection with the sale, we recorded a $434 impairment loss during 1Q23.
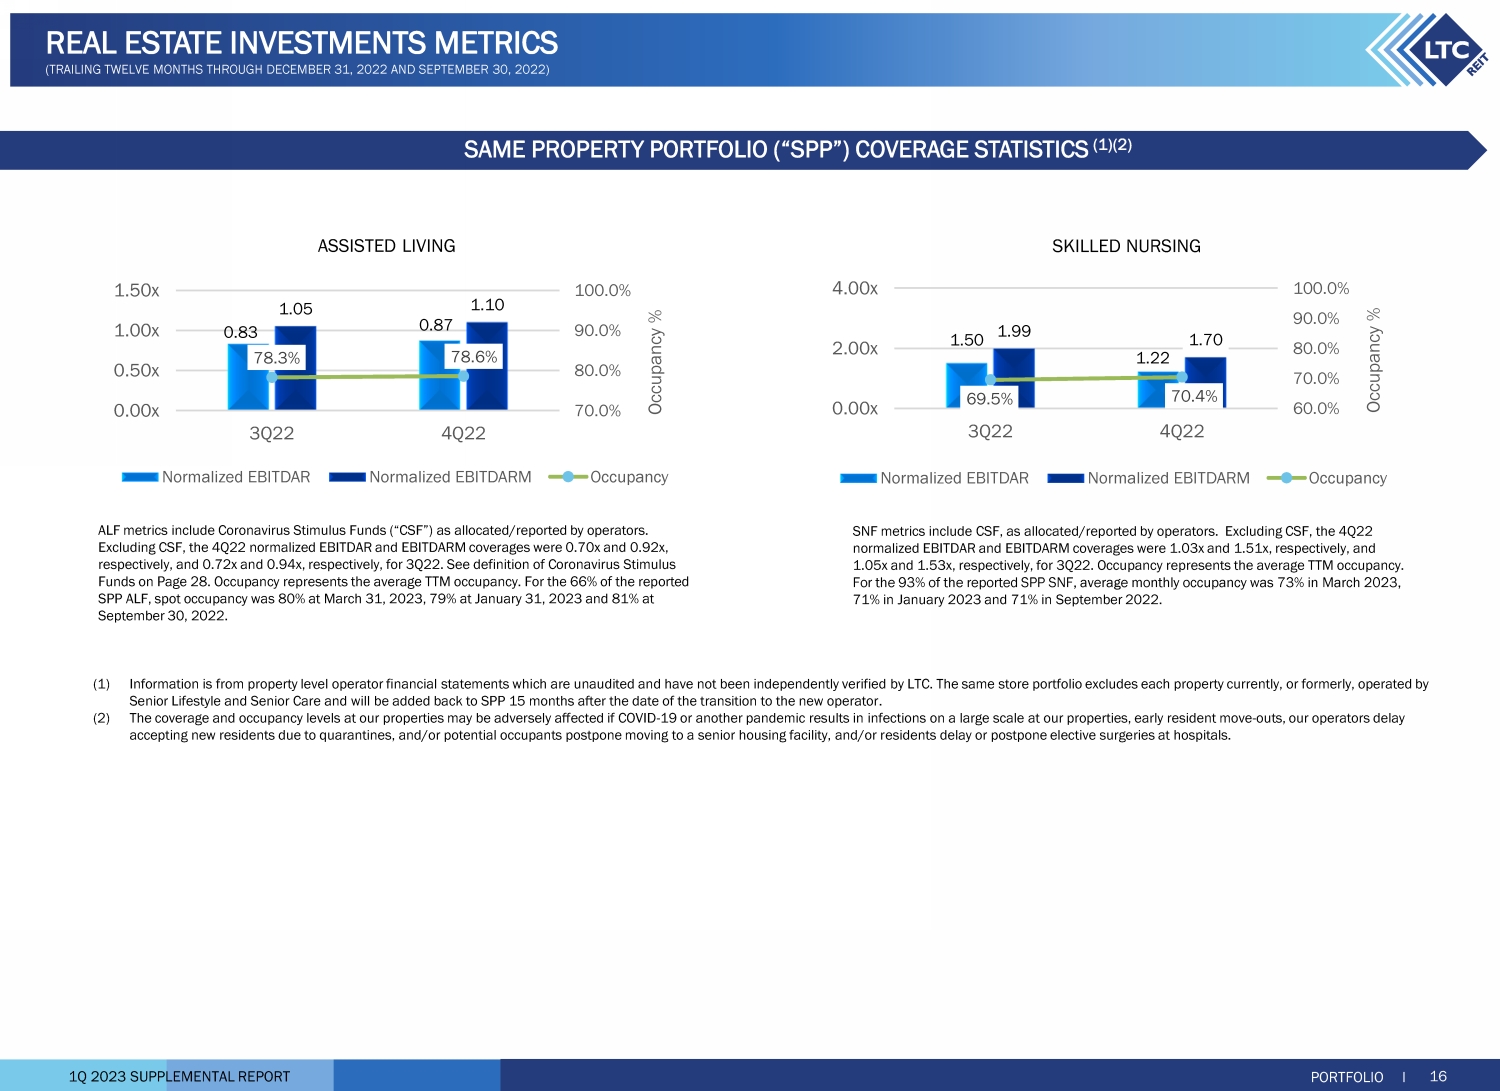
1Q 2023 SUPPLEMENTAL REPORT (1) Information is from property level operator financial statements which are unaudited and have not been independently verified by LTC. The same store portfolio excludes each property currently, or formerly, operated by Senior Lifestyle and Senior Care and will be added back to SPP 15 months after the date of the transition to the new operator . (2) The coverage and occupancy levels at our properties may be adversely affected if COVID - 19 or another pandemic results in infecti ons on a large scale at our properties, early resident move - outs, our operators delay accepting new residents due to quarantines, and/or potential occupants postpone moving to a senior housing facility, and/or r esi dents delay or postpone elective surgeries at hospitals. ASSISTED LIVING SKILLED NURSING 1.50 1.22 1.99 1.70 69.5% 70.4% 60.0% 70.0% 80.0% 90.0% 100.0% 0.00x 2.00x 4.00x 3Q22 4Q22 Occupancy % Normalized EBITDAR Normalized EBITDARM Occupancy 0.83 0.87 1.05 1.10 78.3% 78.6% 70.0% 80.0% 90.0% 100.0% 0.00x 0.50x 1.00x 1.50x 3Q22 4Q22 Occupancy % Normalized EBITDAR Normalized EBITDARM Occupancy SNF metrics include CSF, as allocated/reported by operators. Excluding CSF, the 4Q22 normalized EBITDAR and EBITDARM coverages were 1.03x and 1.51x, respectively, and 1.05x and 1.53x, respectively, for 3Q22. Occupancy represents the average TTM occupancy. For the 93% of the reported SPP SNF, average monthly occupancy was 73% in March 2023, 71% in January 2023 and 71% in September 2022. ALF metrics include Coronavirus Stimulus Funds (“CSF”) as allocated/reported by operators. Excluding CSF, the 4Q22 normalized EBITDAR and EBITDARM coverages were 0.70x and 0.92x, respectively, and 0.72x and 0.94x, respectively, for 3Q22. See definition of Coronavirus Stimulus Funds on Page 28. Occupancy represents the average TTM occupancy. For the 66% of the reported SPP ALF, spot occupancy was 80% at March 31, 2023, 79% at January 31, 2023 and 81% at September 30, 2022. PORTFOLIO I 16 REAL ESTATE INVESTMENTS METRICS (TRAILING TWELVE MONTHS THROUGH DECEMBER 31, 2022 AND SEPTEMBER 30, 2022) SAME PROPERTY PORTFOLIO (“SPP”) COVERAGE STATISTICS (1)(2)
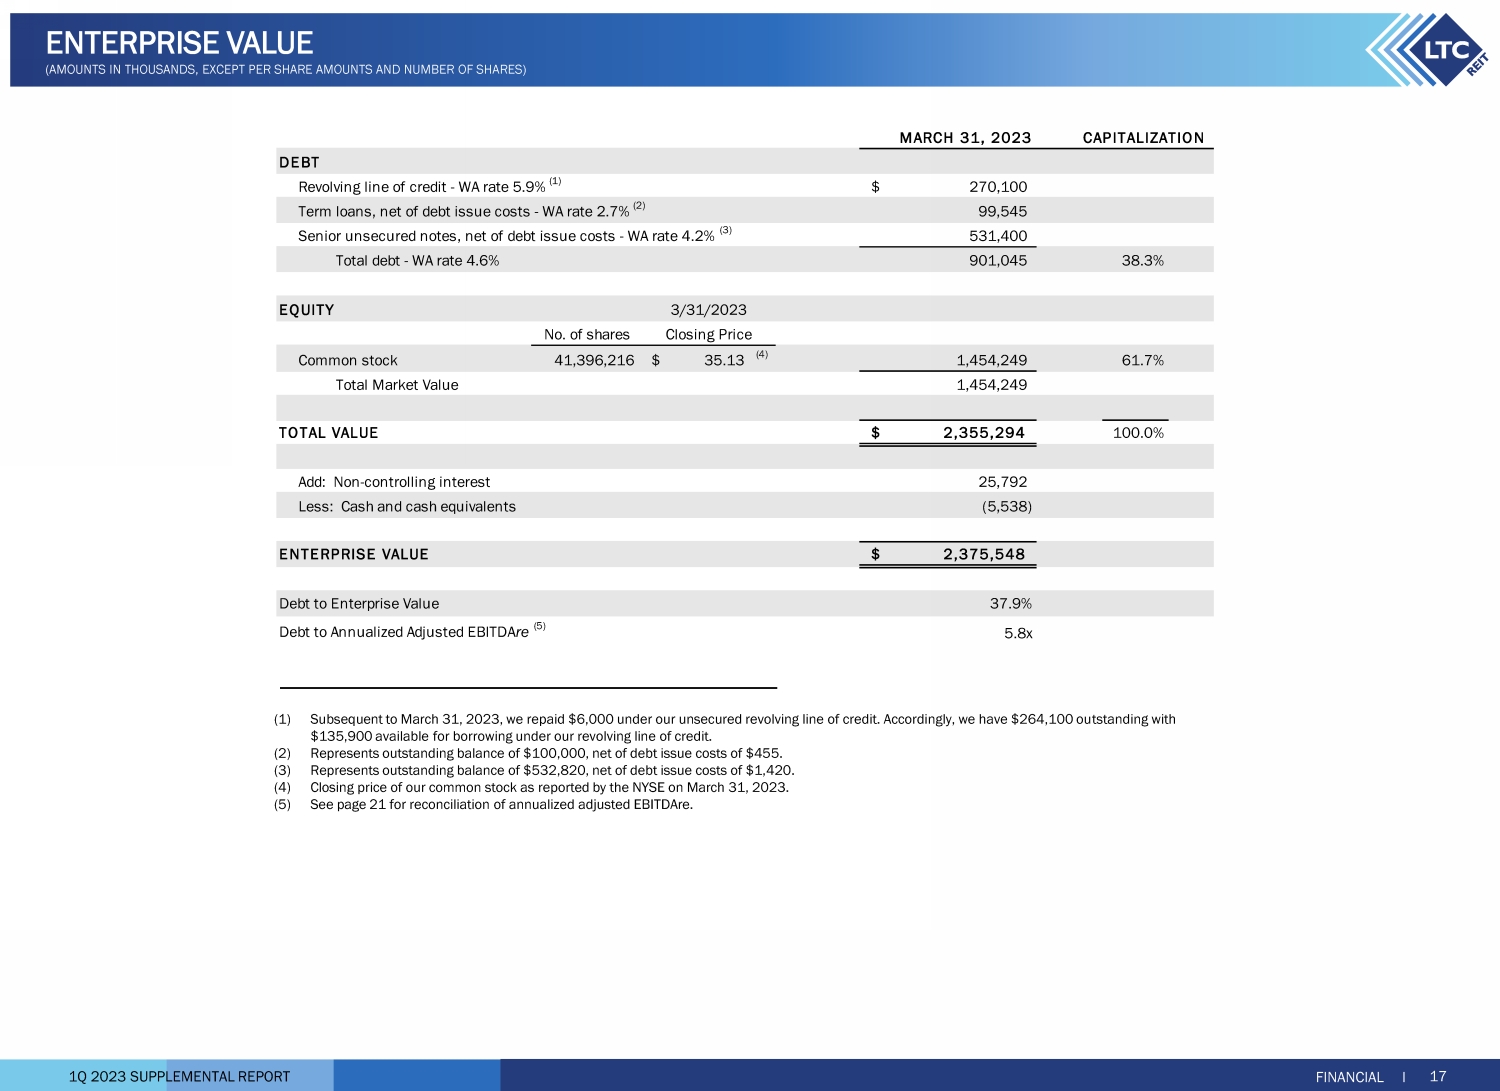
1Q 2023 SUPPLEMENTAL REPORT MARCH 31, 2023 Revolving line of credit - WA rate 5.9% (1) 270,100$ Term loans, net of debt issue costs - WA rate 2.7% (2) 99,545 Senior unsecured notes, net of debt issue costs - WA rate 4.2% (3) 531,400 Total debt - WA rate 4.6% 901,045 38.3% No. of shares Common stock 41,396,216 35.13$ (4) 1,454,249 61.7% Total Market Value 1,454,249 2,355,294$ 100.0% Add: Non-controlling interest 25,792 Less: Cash and cash equivalents (5,538) 2,375,548$ Debt to Enterprise Value 37.9% Debt to Annualized Adjusted EBITDAre (5) 5.8x TOTAL VALUE ENTERPRISE VALUE CAPITALIZATION DEBT EQUITY Closing Price 3/31/2023 (1) Subsequent to March 31, 2023, we repaid $6,000 under our unsecured revolving line of credit. Accordingly, we have $264,100 ou tst anding with $135,900 available for borrowing under our revolving line of credit. (2) Represents outstanding balance of $100,000, net of debt issue costs of $455. (3) Represents outstanding balance of $532,820, net of debt issue costs of $1,420. (4) Closing price of our common stock as reported by the NYSE on March 31, 2023. (5) See page 21 for reconciliation of annualized adjusted EBITDAre. FINANCIAL I 17 ENTERPRISE VALUE (AMOUNTS IN THOUSANDS, EXCEPT PER SHARE AMOUNTS AND NUMBER OF SH ARES)

1Q 2023 SUPPLEMENTAL REPORT LEVERAGE RATIOS COVERAGE RATIOS LINE OF CREDIT LIQUIDITY FINANCIAL I 18 DEBT METRICS (DOLLAR AMOUNTS IN THOUSANDS) 35.8% 29.8% 38.4% 34.9% 37.4% 34.2% 41.0% 37.9% 0.0% 10.0% 20.0% 30.0% 40.0% 50.0% Debt to Gross Asset Value Debt to Total Enterprise Value 2020 2021 2022 1Q23 4.4x 4.9x 6.0x 4.4x 5.6x 4.3x 5.8x 3.6x 0.0x 2.0x 4.0x 6.0x 8.0x Debt to Adjusted EBITDAre Adjusted EBITDAre/ Fixed Charges 2020 2021 2022 1Q23 (1) Subsequent to March 31, 2023, we repaid $6,000 under our unsecured revolving line of credit. Accordingly, we have $264,100 ou tst anding with $135,900 available for borrowing under our revolving line of credit. $89,900 $110,900 $130,000 $270,100 $510,100 $289,100 $270,000 $129,900 $- $100,000 $200,000 $300,000 $400,000 $500,000 $600,000 2020 2021 2022 1Q23 Balance Available (1)

1Q 2023 SUPPLEMENTAL REPORT Senior Unsecured Notes 59.0% Term Loans 11.1% Revolving Line of Credit 29.9% $270,100 $50,000 $50,000 $42,160 $49,160 $49,500 $51,500 $54,500 $55,000 $63,000 $67,000 $101,000 $- $100,000 $200,000 $300,000 $400,000 2023 2024 2025 2026 2027 2028 2029 2030 Thereafter Revolving Line of Credit Term Loans Senior Unsecured Notes DEBT STRUCTURE (3) FINANCIAL I 19 DEBT MATURITY (AS OF MARCH 31, 2023, DOLLAR AMOUNTS IN THOUSANDS) REVOLVING SENIOR LINE OF TERM UNSECURED % OF YEAR CREDIT LOANS (1)(2) NOTES (1)(2) TOTAL TOTAL 2023 —$ —$ 42,160$ 42,160$ 4.7% 2024 — — 49,160 49,160 5.5% 2025 270,100 (3) 50,000 49,500 369,600 40.9% 2026 — 50,000 51,500 101,500 11.2% 2027 — — 54,500 54,500 6.0% 2028 — — 55,000 55,000 6.1% 2029 — — 63,000 63,000 7.0% 2030 — — 67,000 67,000 7.4% Thereafter — — 101,000 101,000 11.2% Total 270,100$ 100,000$ 532,820$ 902,920$ 100.0% (1) Reflects scheduled principal payments. (2) Excludes debt issue costs which are netted against the principal outstanding in the term loans and senior unsecured notes bal anc e on our Consolidated Balance Sheets shown on page 23. (3) Subsequent to March 31, 2023, we repaid $6,000 under our unsecured revolving line of credit. Accordingly, we have $264,100 ou tst anding with $135,900 available for borrowing under our revolving line of credit.
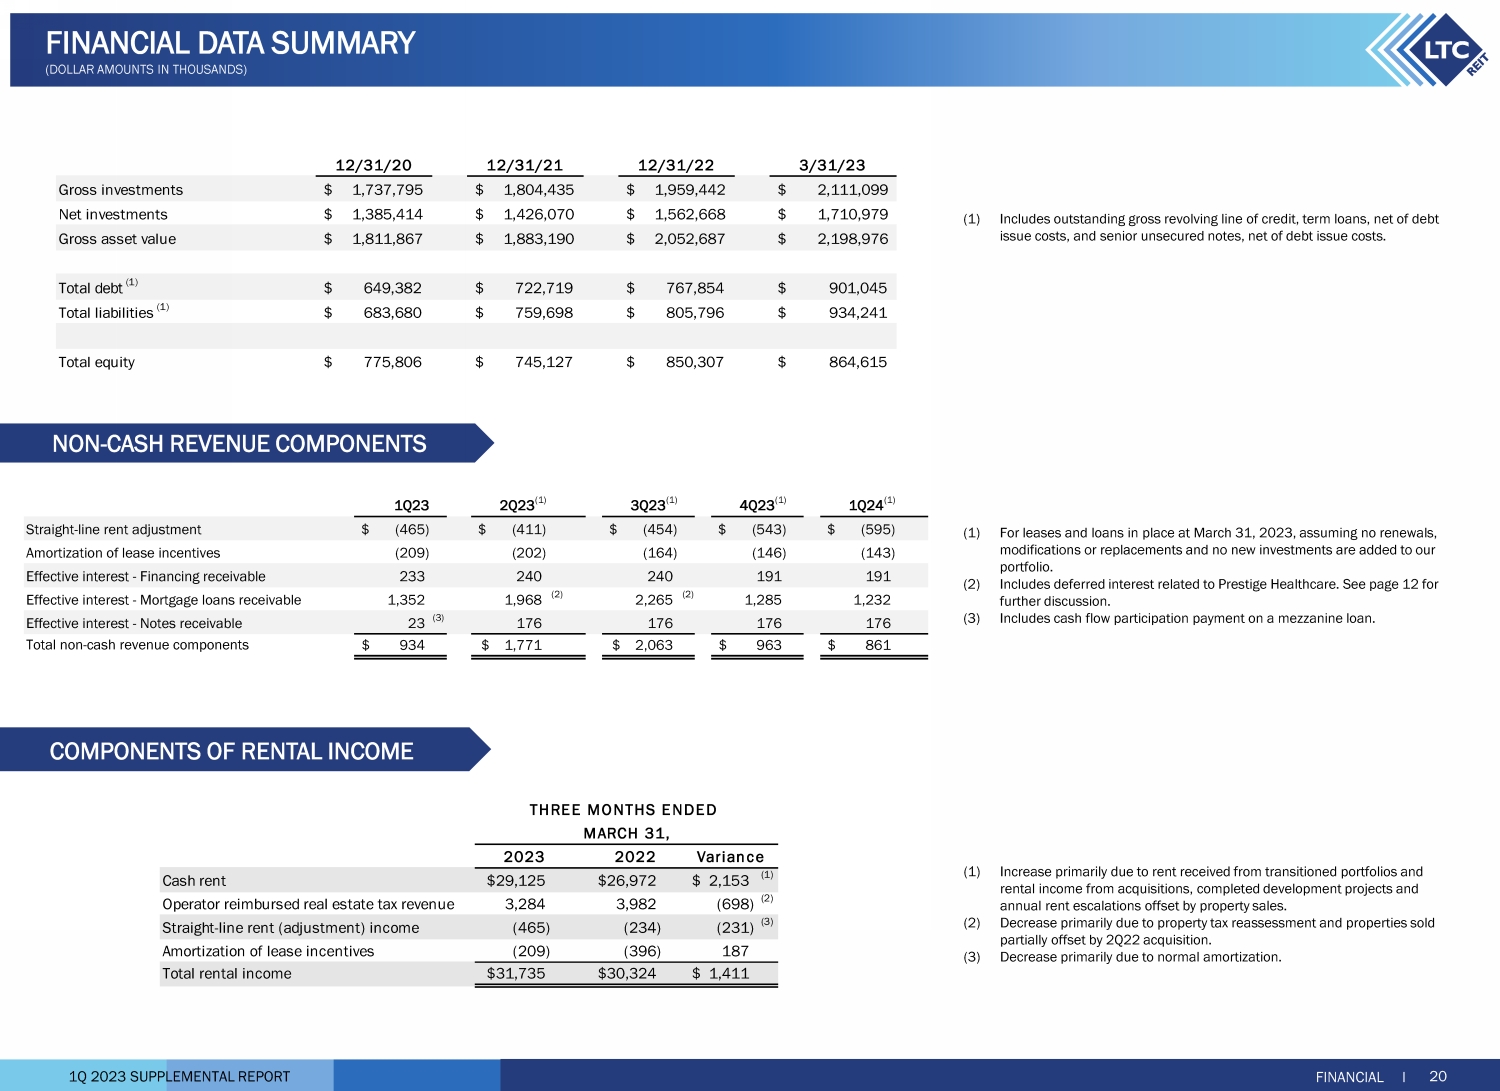
1Q 2023 SUPPLEMENTAL REPORT (1) For leases and loans in place at March 31, 2023, assuming no renewals, modifications or replacements and no new investments are added to our portfolio. (2) Includes deferred interest related to Prestige Healthcare. See page 12 for further discussion. (3) Includes cash flow participation payment on a mezzanine loan. (1) Increase primarily due to rent received from transitioned portfolios and rental income from acquisitions, completed development projects and annual rent escalations offset by property sales. (2) Decrease primarily due to property tax reassessment and properties sold partially offset by 2Q22 acquisition. (3) Decrease primarily due to normal amortization. NON - CASH REVENUE COMPONENTS COMPONENTS OF RENTAL INCOME FINANCIAL I 20 FINANCIAL DATA SUMMARY (DOLLAR AMOUNTS IN THOUSANDS) 12/31/20 12/31/21 12/31/22 3/31/23 Gross investments $ 1,737,795 $ 1,804,435 $ 1,959,442 $ 2,111,099 Net investments $ 1,385,414 $ 1,426,070 $ 1,562,668 $ 1,710,979 Gross asset value $ 1,811,867 $ 1,883,190 $ 2,052,687 $ 2,198,976 Total debt (1) $ 649,382 $ 722,719 $ 767,854 $ 901,045 Total liabilities (1) $ 683,680 $ 759,698 $ 805,796 $ 934,241 Total equity $ 775,806 $ 745,127 $ 850,307 $ 864,615 Cash rent 29,125$ 26,972$ 2,153$ (1) Operator reimbursed real estate tax revenue 3,284 3,982 (698) (2) Straight-line rent (adjustment) income (465) (234) (231) (3) Amortization of lease incentives (209) (396) 187 Total rental income 31,735$ 30,324$ 1,411$ 2023 2022 Variance THREE MONTHS ENDED MARCH 31, (1) Includes outstanding gross revolving line of credit, term loans, net of debt issue costs, and senior unsecured notes, net of debt issue costs. 1Q23 2Q23 (1) 3Q23 (1) 4Q23 (1) 1Q24 (1) (465)$ (411)$ (454)$ (543)$ (595)$ (209) (202) (164) (146) (143) 233 240 240 191 191 1,352 1,968 (2) 2,265 (2) 1,285 1,232 23 (3) 176 176 176 176 934$ 1,771$ 2,063$ 963$ 861$ Effective interest - Mortgage loans receivable Effective interest - Notes receivable Straight-line rent adjustment Amortization of lease incentives Effective interest - Financing receivable Total non-cash revenue components
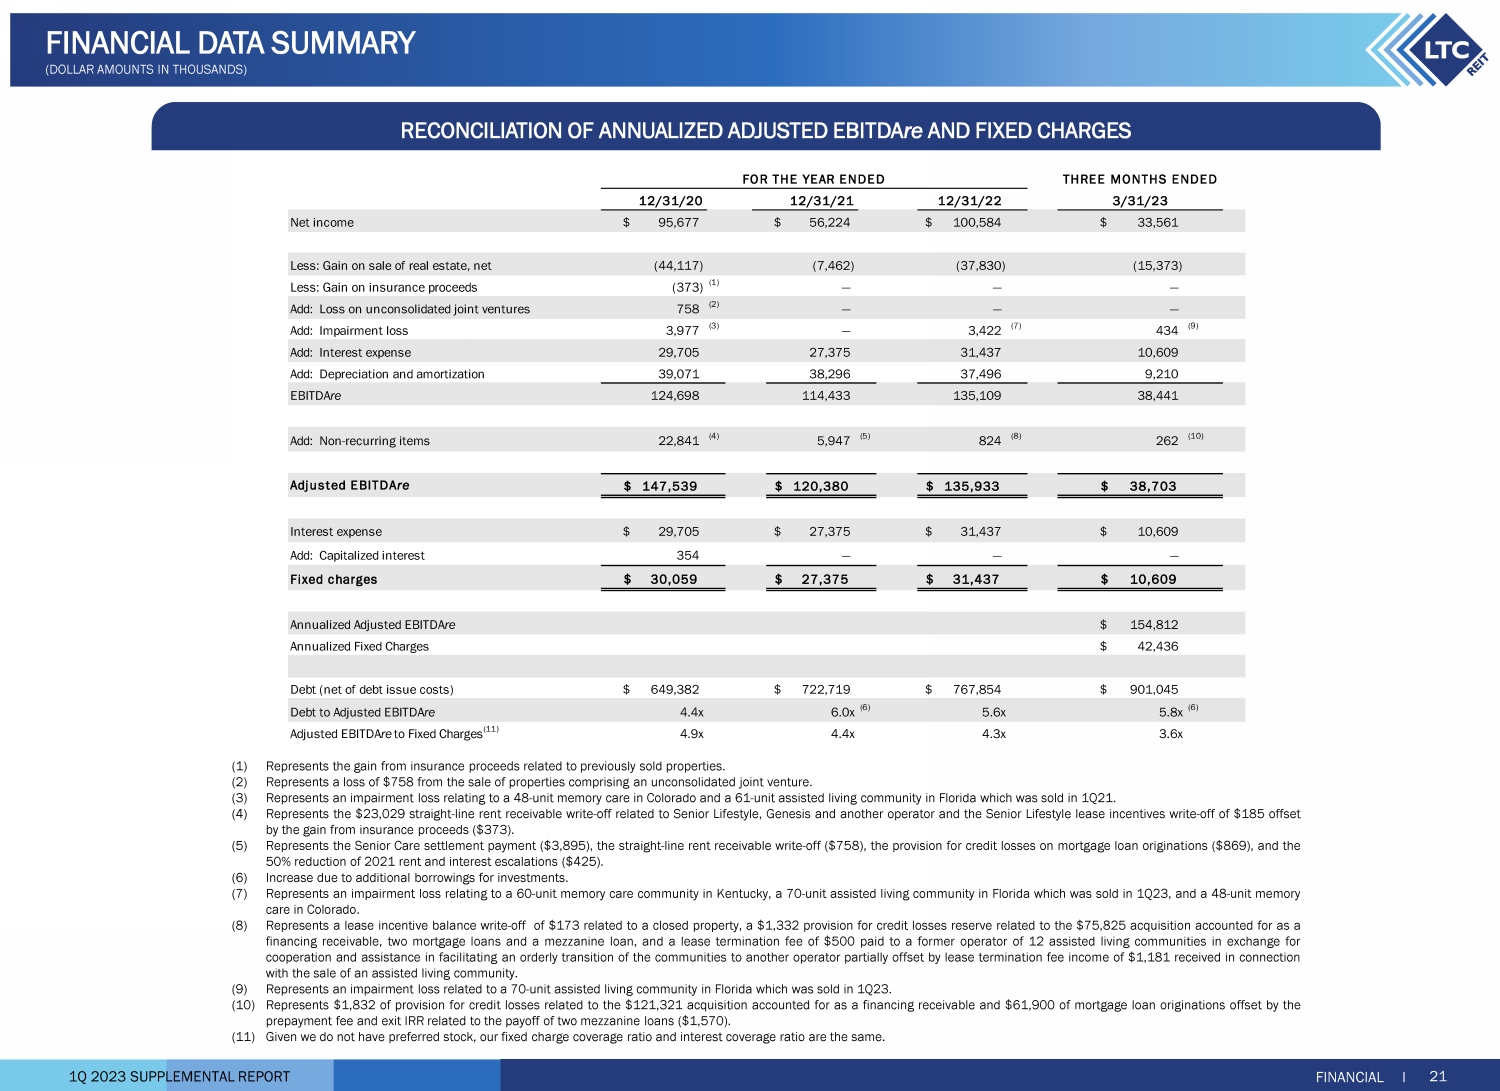
1Q 2023 SUPPLEMENTAL REPORT RECONCILIATION OF ANNUALIZED ADJUSTED EBITDA re AND FIXED CHARGES FINANCIAL I 21 FINANCIAL DATA SUMMARY (DOLLAR AMOUNTS IN THOUSANDS) (1) Represents the gain from insurance proceeds related to previously sold properties . (2) Represents a loss of $ 758 from the sale of properties comprising an unconsolidated joint venture . (3) Represents an impairment loss relating to a 48 - unit memory care in Colorado and a 61 - unit assisted living community in Florida which was sold in 1 Q 21 . (4) Represents the $ 23 , 029 straight - line rent receivable write - off related to Senior Lifestyle, Genesis and another operator and the Senior Lifestyle lease incentives write - off of $ 185 offset by the gain from insurance proceeds ( $ 373 ) . (5) Represents the Senior Care settlement payment ( $ 3 , 895 ), the straight - line rent receivable write - off ( $ 758 ), the provision for credit losses on mortgage loan originations ( $ 869 ), and the 50 % reduction of 2021 rent and interest escalations ( $ 425 ) . (6) Increase due to additional borrowings for investments . (7) Represents an impairment loss relating to a 60 - unit memory care community in Kentucky, a 70 - unit assisted living community in Florida which was sold in 1 Q 23 , and a 48 - unit memory care in Colorado . (8) Represents a lease incentive balance write - off of $ 173 related to a closed property, a $ 1 , 332 provision for credit losses reserve related to the $ 75 , 825 acquisition accounted for as a financing receivable, two mortgage loans and a mezzanine loan, and a lease termination fee of $ 500 paid to a former operator of 12 assisted living communities in exchange for cooperation and assistance in facilitating an orderly transition of the communities to another operator partially offset by lease termination fee income of $ 1 , 181 received in connection with the sale of an assisted living community . (9) Represents an impairment loss related to a 70 - unit assisted living community in Florida which was sold in 1 Q 23 . (10) Represents $ 1 , 832 of provision for credit losses related to the $ 121 , 321 acquisition accounted for as a financing receivable and $ 61 , 900 of mortgage loan originations offset by the prepayment fee and exit IRR related to the payoff of two mezzanine loans ( $ 1 , 570 ) . (11) Given we do not have preferred stock, our fixed charge coverage ratio and interest coverage ratio are the same . 12/31/22 Net income 95,677$ 56,224$ 100,584$ 33,561$ Less: Gain on sale of real estate, net (44,117) (7,462) (37,830) (15,373) Less: Gain on insurance proceeds (373) (1) — — — Add: Loss on unconsolidated joint ventures 758 (2) — — — Add: Impairment loss 3,977 (3) — 3,422 (7) 434 (9) Add: Interest expense 29,705 27,375 31,437 10,609 Add: Depreciation and amortization 39,071 38,296 37,496 9,210 EBITDAre 124,698 114,433 135,109 38,441 Add: Non-recurring items 22,841 (4) 5,947 (5) 824 (8) 262 (10) Adjusted EBITDAre 147,539$ 120,380$ 135,933$ 38,703$ Interest expense 29,705$ 27,375$ 31,437$ 10,609$ Add: Capitalized interest 354 — — — Fixed charges 30,059$ 27,375$ 31,437$ 10,609$ Annualized Adjusted EBITDAre 154,812$ Annualized Fixed Charges 42,436$ Debt (net of debt issue costs) 649,382$ 722,719$ 767,854$ 901,045$ Debt to Adjusted EBITDAre 4.4x 6.0x (6) 5.6x 5.8x (6) Adjusted EBITDAreto Fixed Charges (11) 4.9x 4.4x 4.3x 3.6x FOR THE YEAR ENDED THREE MONTHS ENDED 12/31/20 12/31/21 3/31/23

1Q 2023 SUPPLEMENTAL REPORT FINANCIAL I 22 CONSOLIDATED STATEMENTS OF INCOME (AMOUNTS IN THOUSANDS, EXCEPT PER SHARE AMOUNTS) 2023 2022 Revenues Rental income 31,735$ 30,324$ Interest income from financing receivables (1) 3,751 — Interest income from mortgage loans 11,244 9,636 Interest and other income 2,770 827 Total revenues 49,500 40,787 Expenses Interest expense 10,609 7,143 Depreciation and amortization 9,210 9,438 Impairment loss 434 — Provision for credit losses 1,731 354 Transaction costs 117 32 Property tax expense 3,293 3,982 General and administrative expenses 6,294 5,808 Total expenses 31,688 26,757 Other Operating Income Gain on sale of real estate, net 15,373 102 Operating Income 33,185 14,132 Income from unconsolidated joint ventures 376 375 Net Income 33,561 14,507 Income allocated to non-controlling interests (427) (95) Net income attributable to LTC Properties, Inc. 33,134 14,412 Income allocated to participating securities (205) (137) Net income available to common stockholders 32,929$ 14,275$ Earnings per common share: Basic $0.80 $0.36 Diluted $0.80 $0.36 Weighted average shares used to calculate earnings per common share: Basic 41,082 39,199 Diluted 41,189 39,349 Dividends declared and paid per common share $0.57 $0.57 (unaudited) THREE MONTHS ENDED MARCH 31, (1) Represents rental income from acquisitions through sale - leaseback transactions, subject to leases which contain purchase options . In accordance with GAAP, the properties are required to be presented as financing receivables on our Consolidated Balance Sheets and the rental income to be presented as Interest income from financing receivables on our Consolidated Statements of Income .

1Q 2023 SUPPLEMENTAL REPORT FINANCIAL I 23 CONSOLIDATED BALANCE SHEETS (AMOUNTS IN THOUSANDS, EXCEPT PER SHARE AMOUNTS) ASSETS Investments: Land $ 123,338 $ 124,665 Buildings and improvements 1,258,721 1,273,025 Accumulated depreciation and amortization (390,013) (389,182) Operating real estate property, net 992,046 1,008,508 Properties held-for-sale, net of accumulated depreciation: 2023—$3,088; 2022—$2,305 4,075 10,710 Real property investments, net 996,121 1,019,218 Financing receivables, (1) net of credit loss reserve: 2023—$1,981; 2022—$768 196,096 75,999 Mortgage loans receivable, net of credit loss reserve: 2023—$4,569; 2022—$3,930 452,955 389,728 Real estate investments, net 1,645,172 1,484,945 Notes receivable, net of credit loss reserve: 2023—$469; 2022—$589 46,467 58,383 Investments in unconsolidated joint ventures 19,340 19,340 Investments, net 1,710,979 1,562,668 Other assets: Cash and cash equivalents 5,538 10,379 Debt issue costs related to revolving line of credit 2,132 2,321 Interest receivable 48,079 46,000 Straight-line rent receivable 21,238 21,847 Lease incentives 1,571 1,789 Prepaid expenses and other assets 9,319 11,099 Total assets $ 1,798,856 $ 1,656,103 LIABILITIES Revolving line of credit $ 270,100 $ 130,000 Term loans, net of debt issue costs: 2023—$455; 2022—$489 99,545 99,511 Senior unsecured notes, net of debt issue costs: 2023—$1,420; 2022—$1,477 531,400 538,343 Accrued interest 4,122 5,234 Accrued expenses and other liabilities 29,074 32,708 Total liabilities 934,241 805,796 EQUITY Stockholders’ equity: Common stock: $0.01 par value; 60,000 shares authorized; shares issued and outstanding: 2023—41,396; 2022—41,262 413 412 Capital in excess of par value 933,370 931,124 Cumulative net income 1,577,794 1,544,660 Accumulated other comprehensive income 7,357 8,719 Cumulative distributions (1,680,111) (1,656,548) Total LTC Properties, Inc. stockholders’ equity 838,823 828,367 Non-controlling interests 25,792 21,940 Total equity 864,615 850,307 Total liabilities and equity $ 1,798,856 $ 1,656,103 (unaudited) (audited) DECEMBER 31, 2022MARCH 31, 2023 (1) Represents acquisitions through sale - leaseback transactions, subject to leases which contain purchase options . In accordance with GAAP, the properties are required to be presented as financing receivables on our Consolidated Balance Sheets .

1Q 2023 SUPPLEMENTAL REPORT (1) Represents the net of ( 2 ) and ( 3 ) below . (2) Includes $ 1 , 832 of provision for credit losses related to the $ 121 , 321 acquisition accounted for as a financing receivable and $ 61 , 900 of mortgage loan originations . (3) Represents the prepayment fee and exit IRR related to the payoff of two mezzanine loans . (4) Represents the sum of ( 5 ) and ( 6 ) below . (5) Includes a lease incentive balance write - off of $ 173 related to a closed property and subsequent lease termination . (6) Includes $ 250 of provision for credit losses related to the origination of a $ 25 , 000 mezzanine loan during 1 Q 22 . FINANCIAL I 24 FUNDS FROM OPERATIONS – RECONCILIATION OF FFO AND FAD (UNAUDITED, AMOUNTS IN THOUSANDS, EXCEPT PER SHARE AMOUNTS) 2023 2022 GAAP net income available to common stockholders 32,929$ 14,275$ Add: Impairment loss 434 — Add: Depreciation and amortization 9,210 9,438 Less: Gain on sale of real estate, net (15,373) (102) NAREIT FFO attributable to common stockholders 27,200$ 23,611$ $0.66 $0.60 NAREIT FFO attributable to common stockholders 27,200$ 23,611$ Add: Non-recurring items 262 (1) 423 (4) 27,462$ 24,034$ NAREIT FFO attributable to common stockholders 27,200$ 23,611$ Non-cash income: Add: Straight-line rental adjustment 465 234 Add: Amortization of lease incentives 209 396 (5) Less: Effective interest income (1,608) (1,402) Net non-cash income (934) (772) Non-cash expense: Add: Non-cash compensation charges 2,088 1,925 Add: Provision for credit losses 1,731 (2) 354 (6) Net non-cash expense 3,819 2,279 Funds available for distribution (FAD) 30,085 25,118 Less: Non-recurring income (1,570) (3) — Funds available for distribution (FAD), excluding non-recurring items 28,515$ 25,118$ FFO attributable to common stockholders, excluding non-recurring items THREE MONTHS ENDED MARCH 31, NAREIT Diluted FFO attributable to common stockholders per share
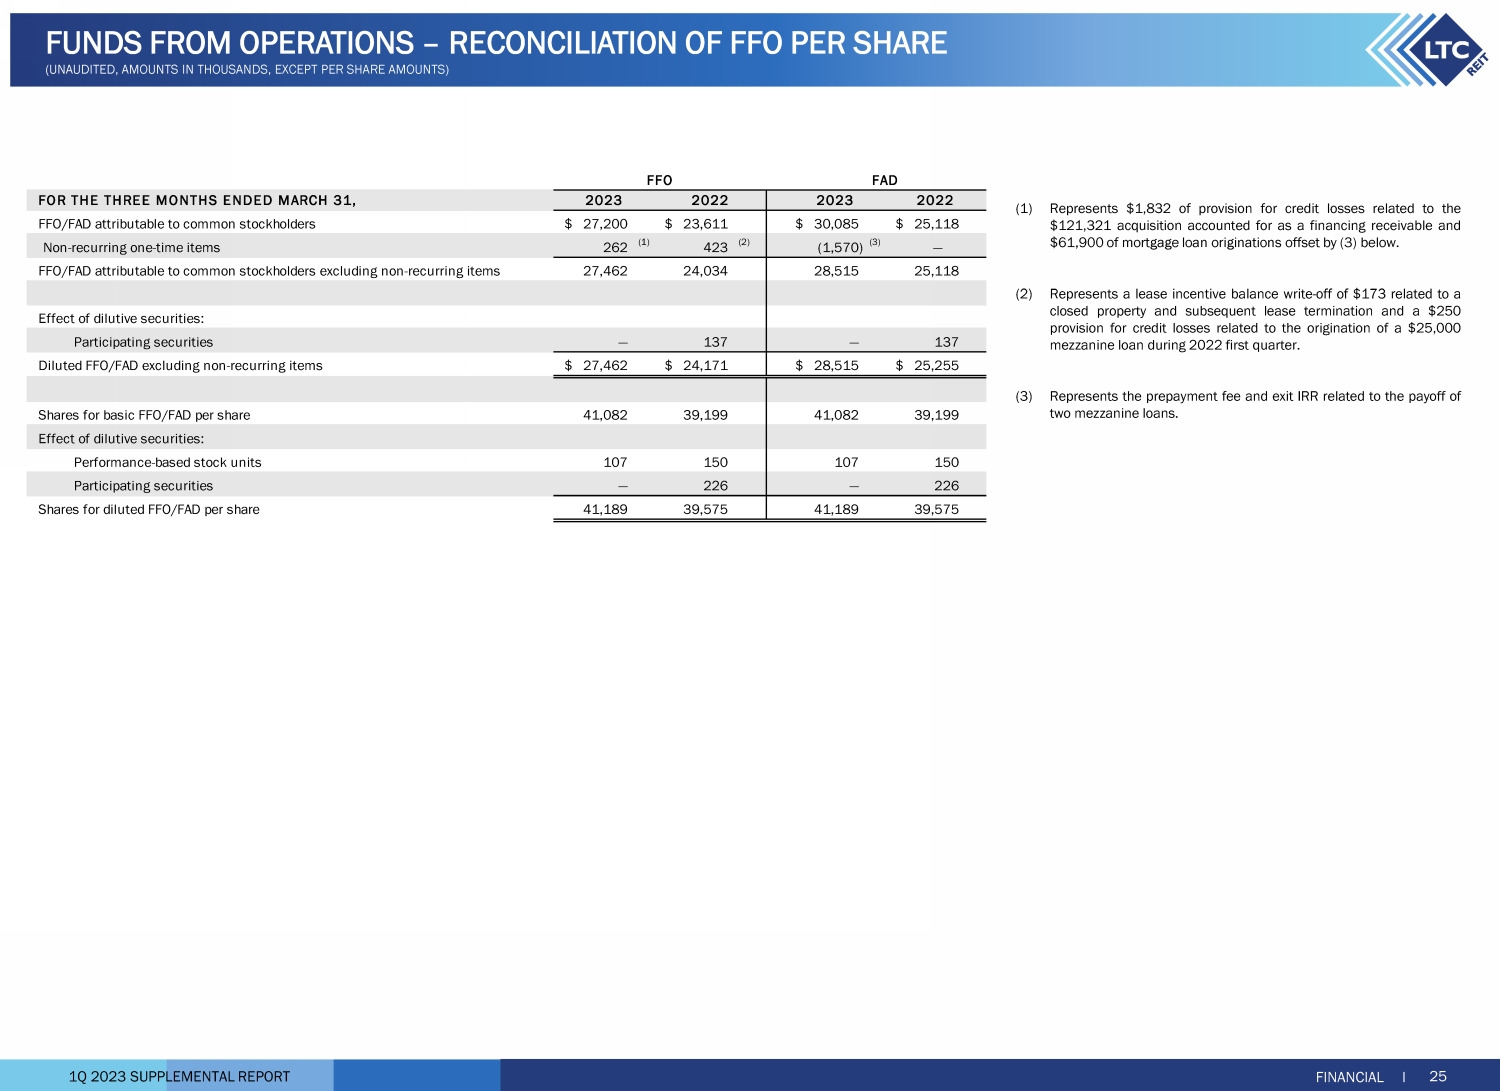
1Q 2023 SUPPLEMENTAL REPORT FOR THE THREE MONTHS ENDED MARCH 31, FFO/FAD attributable to common stockholders 27,200$ 23,611$ 30,085$ 25,118$ Non-recurring one-time items 262 (1) 423 (2) (1,570) (3) — FFO/FAD attributable to common stockholders excluding non-recurring items 27,462 24,034 28,515 25,118 Effect of dilutive securities: Participating securities — 137 — 137 Diluted FFO/FAD excluding non-recurring items 27,462$ 24,171$ 28,515$ 25,255$ 41,082 39,199 41,082 39,199 Effect of dilutive securities: Performance-based stock units 107 150 107 150 Participating securities — 226 — 226 Shares for diluted FFO/FAD per share 41,189 39,575 41,189 39,575 FAD 2023 2022 2023 2022 Shares for basic FFO/FAD per share FFO FINANCIAL I 25 FUNDS FROM OPERATIONS – RECONCILIATION OF FFO PER SHARE (UNAUDITED, AMOUNTS IN THOUSANDS, EXCEPT PER SHARE AMOUNTS) (1) Represents $ 1 , 832 of provision for credit losses related to the $ 121 , 321 acquisition accounted for as a financing receivable and $ 61 , 900 of mortgage loan originations offset by ( 3 ) below . (2) Represents a lease incentive balance write - off of $ 173 related to a closed property and subsequent lease termination and a $ 250 provision for credit losses related to the origination of a $ 25 , 000 mezzanine loan during 2022 first quarter . (3) Represents the prepayment fee and exit IRR related to the payoff of two mezzanine loans .
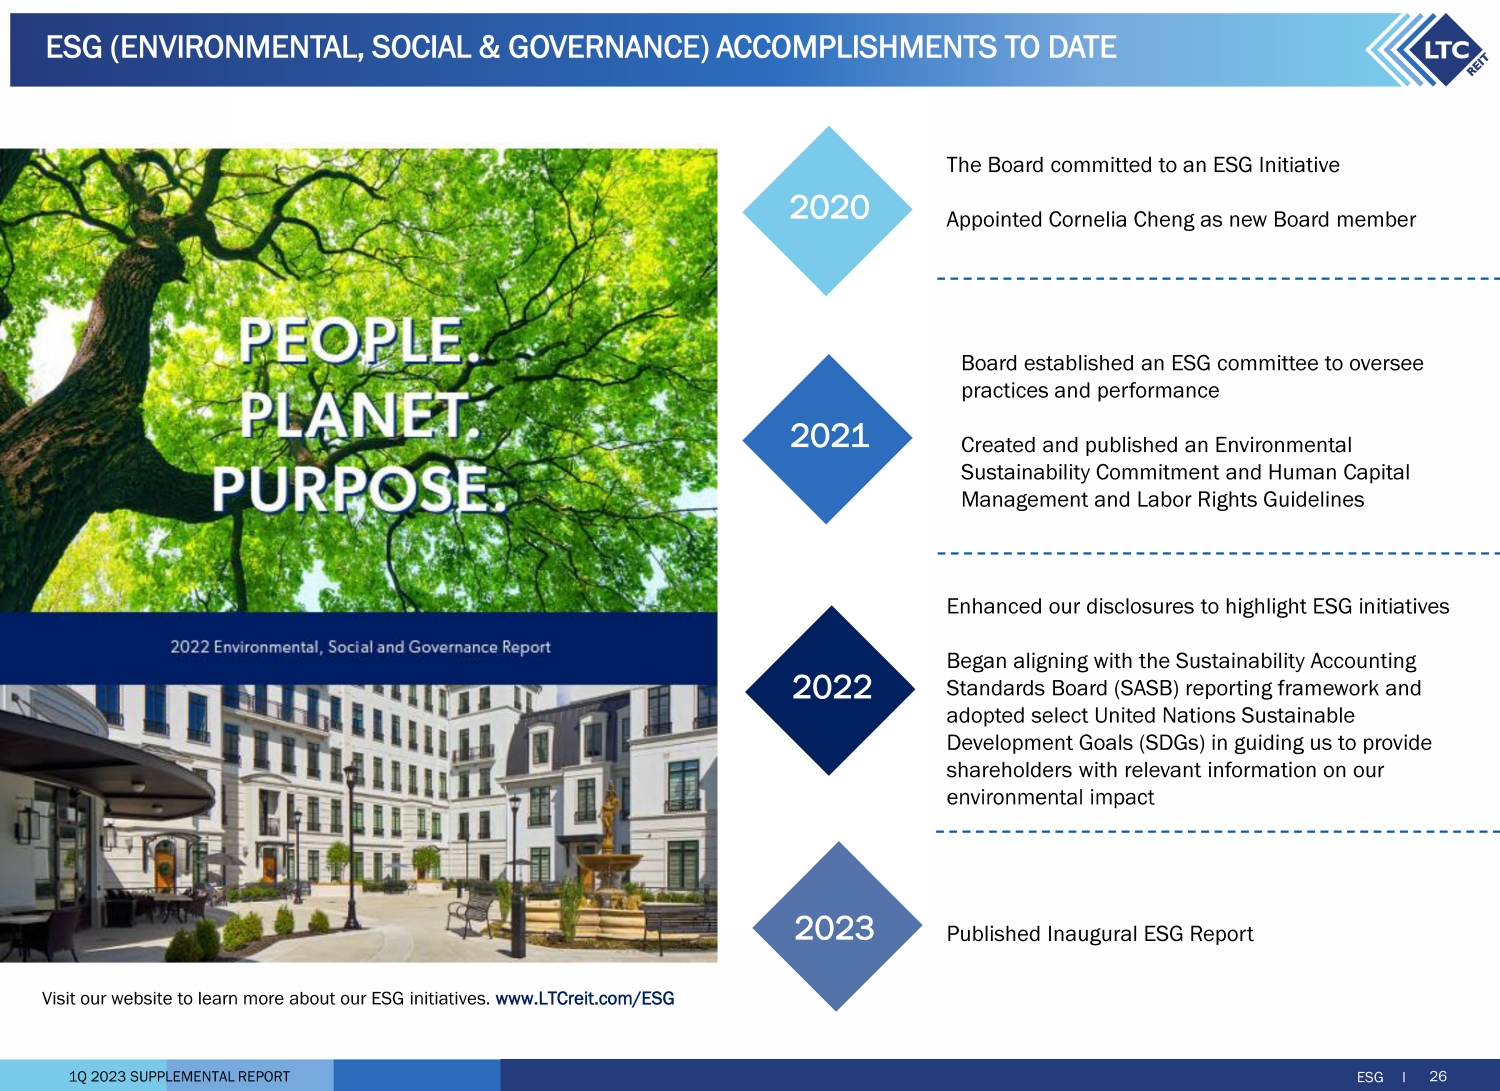
1Q 2023 SUPPLEMENTAL REPORT 26 ESG (ENVIRONMENTAL, SOCIAL & GOVERNANCE) ACCOMPLISHMENTS TO DATE ESG I The Board committed to an ESG Initiative Appointed Cornelia Cheng as new Board member Board established an ESG committee to oversee practices and performance Created and published an Environmental Sustainability Commitment and Human Capital Management and Labor Rights Guidelines Enhanced our disclosures to highlight ESG initiatives Began aligning with the Sustainability Accounting Standards Board (SASB) reporting framework and adopted select United Nations Sustainable Development Goals (SDGs) in guiding us to provide shareholders with relevant information on our environmental impact Published Inaugural ESG Report 2020 2021 2022 ESG JOURNEY 2023 Visit our website to learn more about our ESG initiatives. www.LTCreit.com/ESG

1Q 2023 SUPPLEMENTAL REPORT 27 ESG I ESG (ENVIRONMENTAL, SOCIAL & GOVERNANCE) 2023 2023 ESG Agenda ENVIRONMENT • Measure and report on energy and water usage, and waste management at LTC across select operator portfolios • Continue to build out our use of ClimateCheck®, which provides detailed climate risk data for individual properties and portfolios, assessing exposure to extreme weather events • Enhance SASB reporting and initiate Task Force on Climate - Related Financial Disclosures (TCFD) reporting • Collect, analyze, and report environmental data for select properties in our portfolio SOCIAL • Continue to conduct annual employee survey • Enhance employee engagement programs GOVERNANCE • Update disclosures annually • Enhance stakeholder communication via proxy, website, and investor presentation

1Q 2023 SUPPLEMENTAL REPORT Annualized Actual Cash Income : Represents annualized cash rental income includes cash rent and excludes real estate tax reimbursement, interest income from financing receivables, mortgage loans, mezzanine loans and working capital notes, and income from unconsolidated joint ventures received for the month of March 2023 for investments as of March 31 , 2023 . Annualized Contractual Cash Income : Represents annualized contractual cash rental income prior to abatements & deferred rent repayment and excludes real estate tax reimbursement , interest income from financing receivables, mortgage loans, mezzanine loans and working capital notes, and income from unconsolidated joint ventures for the month of March 2023 for investments as of March 31 , 2023 . Annualized GAAP Income : Represents annualized GAAP rent which includes contractual cash rent, straight - line rent and amortization of lease incentives and excludes real estate tax reimbursement , GAAP interest income from financing receivables, mortgage loans, mezzanine loans and working capital notes, and income from unconsolidated joint ventures for the month of March 2023 for investments as of March 31 , 2023 . Assisted Living Communities (“ALF”) : The ALF portfolio consists of assisted living, independent living, and/or memory care properties . (See Independent Living and Memory Care) Assisted living properties are seniors housing properties serving elderly persons who require assistance with activities of daily living, but do not require the constant supervision skilled nursing properties provide . Services are usually available 24 hours a day and include personal supervision and assistance with eating, bathing, grooming and administering medication . The facilities provide a combination of housing, supportive services, personalized assistance and health care designed to respond to individual needs . Contractual Lease Rent : Rental revenue as defined by the lease agreement between us and the operator for the lease year . Coronavirus Stimulus Funds (“CSF”) : CSF includes funding from various state and federal programs to support healthcare providers in dealing with the challenges of the coronavirus pandemic . Included in CSF are state - specific payments identified by operators as well as federal payments connected to the Paycheck Protection Program and the Provider Relief Fund . CSF is self - reported by operators in unaudited financial statements provided to LTC . Specifically excluded from CSF are the suspension of the Medicare sequestration cut, and increases to the Federal Medical Assistance Percentages (FMAP), both of which are reflected in reported coverage both including and excluding CSF . Earnings Before Interest, Tax, Depreciation and Amortization for Real Estate (“EBITDA re”) : As defined by the National Association of Real Estate Investment Trusts (“ NAREIT”), EBITDA re is calculated as net income (computed in accordance with GAAP) excluding (i) interest expense, (ii) income tax expense, (iii) real estate depreciation and amortization, (iv) impairment write - downs of depreciable real estate, (v) gains or losses on the sale of depreciable real estate, and (vi) adjustments for unconsolidated partnerships and joint ventures . Financing Receivable : Properties acquired through a sale - leaseback transaction with an operating entity being the same before and after the sale - leaseback, subject to a lease contract that contains a purchase option . In accordance with GAAP, the purchased assets are required to be presented as Financing Receivable on our Consolidated Balance Sheets and the rental income to be presented as Interest income from financing receivable on our Consolidated Statements of Income . Funds Available for Distribution (“FAD”) : FFO excluding the effects of straight - line rent, amortization of lease costs, effective interest income, deferred income from unconsolidated joint ventures, non - cash compensation charges, capitalized interest and non - cash interest charges . Funds From Operations (“FFO”) : A s defined by NAREIT, net income available to common stockholders (computed in accordance with U . S . GAAP) excluding gains or losses on the sale of real estate and impairment write - downs of depreciable real estate plus real estate depreciation and amortization, and after adjustments for unconsolidated partnerships and joint ventures . GAAP Lease Yield : GAAP rent divided by the sum of the purchase price and transaction costs . GAAP Rent : Total rent we will receive as a fixed amount over the initial term of the lease and recognized evenly over that term . GAAP rent recorded in the early years of a lease is higher than the cash rent received and during the later years of the lease, the cash rent received is higher than GAAP rent recognized . GAAP rent is commonly referred to as straight - line rental income . Gross Asset Value : The carrying amount of total assets after adding back accumulated depreciation and loan loss reserves, as reported in the company’s consolidated financial statements . Gross Investment : Original price paid for an asset plus capital improvements funded by LTC, without any depreciation deductions . Gross Investment is commonly referred to as undepreciated book value . Independent Living Communities (“ILF”) : Seniors housing properties offering a sense of community and numerous levels of service, such as laundry, housekeeping, dining options/meal plans, exercise and wellness programs, transportation, social, cultural and recreational activities, on - site security and emergency response programs . Many offer on - site conveniences like beauty/barber shops, fitness facilities, game rooms, libraries and activity centers . ILFs are also known as retirement communities or seniors apartments . Interest Income : Represents interest income from mortgage loans and other notes . Licensed Beds/Units : The number of beds and/or units that an operator is authorized to operate at seniors housing and long - term care properties . Licensed beds and/or units may differ from the number of beds and/or units in service at any given time . Memory Care Communities (“MC”) : Seniors housing properties offering specialized options for seniors with Alzheimer’s disease and other forms of dementia . These facilities offer dedicated care and specialized programming for various conditions relating to memory loss in a secured environment that is typically smaller in scale and more residential in nature than traditional assisted living facilities . These facilities have staff available 24 hours a day to respond to the unique needs of their residents . Metropolitan Statistical Areas (“MSA”) : Based on the U . S . Census Bureau, MSA is a geographic entity defined by the Office of Management and Budget (OMB) for use by Federal statistical agencies in collecting, tabulating, and publishing Federal statistics . A metro area contains a core urban area of 50 , 000 or more population . MSAs 1 to 31 have a population of 19 . 8 M – 2 . 2 M . MSAs 32 to 100 have a population of 2 . 2 M – 0 . 6 M . MSAs greater than 100 have a population of 0 . 6 M – 59 K . Cities in a Micro - SA have a population of 223 K – 12 K . Cities not in a MSA has population of less than 100 K . GLOSSARY I 28 GLOSSARY

1Q 2023 SUPPLEMENTAL REPORT Mezzanine : In certain circumstances, the Company strategically allocates a portion of its capital deployment toward mezzanine loans to grow relationships with operating companies that have not typically utilized sale - leaseback financing as a component of their capital structure . Mezzanine financing sits between senior debt and common equity in the capital structure, and typically is used to finance development projects, value - add opportunities on existing operational properties, partnership buy - outs and recapitalization of equity . We seek market - based, risk - adjusted rates of return typically between 9 % to 14 % with the loan term typically between three to 10 years . Security for mezzanine loans can include all or a portion of the following credit enhancements ; secured second mortgage, pledge of equity interests and personal/corporate guarantees . Mezzanine loans can be recorded for GAAP purposes as either a loan or joint venture depending upon specifics of the loan terms and related credit enhancements . Micropolitan Statistical Areas (“Micro - SA”) : Based on the U . S . Census Bureau, Micro - SA is a geographic entity defined by the Office of Management and Budget (OMB) for use by Federal statistical agencies in collecting, tabulating, and publishing Federal statistics . A micro area contains an urban core of at least 10 , 000 population . Mortgage Loan : Mortgage financing is provided on properties based on our established investment underwriting criteria and secured by a first mortgage . Subject to underwriting, additional credit enhancements may be required including, but not limited to, personal/corporate guarantees and debt service reserves . When possible, LTC attempts to negotiate a purchase option to acquire the property at a future time and lease the property back to the borrower . Net Real Estate Assets : Gross real estate investment less accumulated depreciation . Net Real Estate Asset is commonly referred to as Net Book Value (“NBV”) . Non - cash Rental Income : Straight - line rental income and amortization of lease inducement . Non - cash Compensation Charges : Vesting expense relating to stock options and restricted stock . Normalized EBITDAR Coverage : The trailing twelve month’s earnings from the operator financial statements adjusted for non - recurring, infrequent, or unusual items and before interest, taxes, depreciation, amortization, and rent divided by the operator’s contractual lease rent . Management fees are imputed at 5 % of revenues . Normalized EBITDARM Coverage : The trailing twelve month’s earnings from the operator financial statements adjusted for non - recurring, infrequent, or unusual items and before interest, taxes, depreciation, amortization, rent, and management fees divided by the operator’s contractual lease rent . Occupancy : The weighted average percentage of all beds and/or units that are occupied at a given time . The calculation uses the trailing twelve months and is based on licensed beds and/or units which may differ from the number of beds and/or units in service at any given time . Operator Financial Statements : Property level operator financial statements which are unaudited and have not been independently verified by us . Payor Source : LTC revenue by operator underlying payor source for the period presented . LTC is not a Medicaid or a Medicare recipient . Statistics represent LTC's rental revenues times operators' underlying payor source revenue percentage . Underlying payor source revenue percentage is calculated from property level operator financial statements which are unaudited and have not been independently verified by us . Private Pay : Private pay includes private insurance, HMO, VA, and other payors . Purchase Price : Represents the fair value price of an asset that is exchanged in an orderly transaction between market participants at the measurement date . An orderly transaction is a transaction that assumes exposure to the market for a period prior to the measurement date to allow for marketing activities that are usual and customary for transactions involving such assets ; it is not a forced transaction (for example, a forced liquidation or distress sale) . Real Estate Investments : Represents our investments in real property and mortgage loan receivables . Rental Income : Represents GAAP rent net of amortized lease inducement cost . Same Property Portfolio (“SPP”) : Same property statistics allow for the comparative evaluation of performance across a consistent population of LTC’s leased property portfolio and the Prestige Healthcare mortgage loan portfolio . Our SPP is comprised of stabilized properties occupied and operated throughout the duration of the quarter - over - quarter comparison periods presented (excluding assets sold and assets held - for - sale) . Accordingly, a property must be occupied and stabilized for a minimum of 15 months to be included in our SPP . Each property transitioned to a new operator has been excluded from SPP and will be added back to SPP for the SPP reporting period ending 15 months after the date of the transition . Skilled Nursing Properties (“SNF”) : Seniors housing properties providing restorative, rehabilitative and nursing care for people not requiring the more extensive and sophisticated treatment available at acute care hospitals . Many SNFs provide ancillary services that include occupational, speech, physical, respiratory and IV therapies, as well as sub - acute care services which are paid either by the patient, the patient’s family, private health insurance, or through the federal Medicare or state Medicaid programs . Stabilized : Properties are generally considered stabilized upon the earlier of achieving certain occupancy thresholds (e . g . 80 % for SNFs and 90 % for ALFs) and, as applicable, 12 months from the date of acquisition/lease transition or, in the event of a de novo development, redevelopment, major renovations or addition, 24 months from the date the property is first placed in or returned to service, or properties acquired in lease - up . Trailing Twelve Months Revenues : For the owned portfolio, rental income includes cash rent, straight - line rent and amortization of lease incentives and excludes real estate tax reimbursement and rental income from properties sold during the trailing twelve months . Financing receivables revenues include cash interest income and effective interest from financing receivables during the trailing twelve months . Mortgage loans revenues include cash interest income and effective interest from mortgage loans and construction loans during the trailing twelve months . Notes receivable revenues include cash interest income and effective interest from mezzanine loans and working capital notes and excludes loan payoffs during the trailing twelve months . Under Development Properties (“UDP”) : Development projects to construct seniors housing properties . GLOSSARY I 29 GLOSSARY