Exhibit 99.2
| RENEWAL AND TRANSITION SUPPLEMENTAL OPERATING AND FINANCIAL DATA FOURTH QUARTER 2024 |
| 4Q 2024 SUPPLEMENTAL REPORT FORWARD-LOOKING STATEMENTS This supplemental information contains forward-looking statements within the meaning of Section 27A of the Securities Act of 1933, as amended, and Section 21E of the Securities Exchange Act of 1934, as amended, adopted pursuant to the Private Securities Litigation Reform Act of 1995. Statements that are not purely historical may be forward-looking. You can identify some of the forward-looking statements by their use of forward-looking words, such as ‘‘believes,’’ ‘‘expects,’’ ‘‘may,’’ ‘‘will,’’ ‘‘should,’’ ‘‘seeks,’’ ‘‘approximately,’’ ‘‘intends,’’ ‘‘plans,’’ ‘‘estimates’’ or ‘‘anticipates,’’ or the negative of those words or similar words. Forward-looking statements involve inherent risks and uncertainties regarding events, conditions and financial trends that may affect our future plans of operation, business strategy, results of operations and financial position. A number of important factors could cause actual results to differ materially from those included within or contemplated by such forward-looking statements, including, but not limited to, the status of the economy, the status of capital markets (including prevailing interest rates), and our access to capital; the income and returns available from investments in health care related real estate, the ability of our borrowers and lessees to meet their obligations to us, our reliance on a few major operators; competition faced by our borrowers and lessees within the health care industry, regulation of the health care industry by federal, state and local governments, changes in Medicare and Medicaid reimbursement amounts (including due to federal and state budget constraints), compliance with and changes to regulations and payment policies within the health care industry, debt that we may incur and changes in financing terms, our ability to continue to qualify as a real estate investment trust, the relative illiquidity of our real estate investments, potential limitations on our remedies when mortgage loans default, and risks and liabilities in connection with properties owned through limited liability companies and partnerships. For a discussion of these and other factors that could cause actual results to differ from those contemplated in the forward-looking statements, please see the discussion under ‘‘Risk Factors’’ and other information contained in our Annual Report on Form 10-K for the fiscal year ended December 31, 2024 and in our publicly available filings with the Securities and Exchange Commission. We do not undertake any responsibility to update or revise any of these factors or to announce publicly any revisions to forward-looking statements, whether as a result of new information, future events or otherwise. NON-GAAP INFORMATION This supplemental information contains certain non-GAAP information including EBITDAre, adjusted EBITDAre, FFO, FFO excluding non-recurring items, FAD, FAD excluding non-recurring items, adjusted interest coverage ratio, and adjusted fixed charges coverage ratio. A reconciliation of this non-GAAP information is provided on pages 21, 24, 25 and 26 of this supplemental information, and additional information is available under the “Non-GAAP Financial Measures” subsection under the “Filings” section of our website at www.LTCreit.com. TABLE OF CONTENTS 2 COMPANY Company Information & Leadership 3 INVESTMENTS Real Estate Activities Investments and Acquisitions 4 Acquisitions Accounted for as Financing Receivables 5 Mortgage and Mezzanine Loans 6 Joint Ventures 7 Purchase Options 8 PORTFOLIO Overview 9 Diversification Operators 11 Maturity 13 Geography, MSA, Age of Portfolio 14 Real Estate Investments Metrics 16 FINANCIAL Enterprise Value 17 Debt Metrics 18 Debt Maturity 19 Financial Data Summary 20 Consolidated Statements of Income 22 Consolidated Balance Sheets 23 Funds from Operations 24 GLOSSARY 27 Founded in 1992, LTC Properties, Inc. (NYSE: LTC) is a self-administered real estate investment trust (REIT) investing in seniors housing and health care properties primarily through sale-leaseback transactions, mortgage financing and structured finance solutions including preferred equity and mezzanine lending. LTC’s portfolio encompasses Skilled Nursing Facilities (SNF), Assisted Living Communities (ALF), Independent Living Communities (ILF), Memory Care Communities (MC) and combinations thereof. Our main objective is to build and grow a diversified portfolio that creates and sustains shareholder value while providing our stockholders current distribution income. To meet this objective, we seek properties operated by regional operators, ideally offering upside and portfolio diversification (geographic, operator, property type and investment vehicle). For more information, visit www.LTCreit.com. |
| 4Q 2024 SUPPLEMENTAL REPORT 3 Any opinions, estimates, or forecasts regarding LTC’s performance made by the analysts listed above do not represent the opinions, estimates, and forecasts of LTC or its management. BOARD OF DIRECTORS ANALYSTS LEADERSHIP LTC PROPERTIES, INC. 3011 Townsgate Road Suite 220 Westlake Village, CA 91361 805-981-8655 www.LTCreit.com TRANSFER AGENT Broadridge Shareholder Services c/o Broadridge Corporate Issuer Solutions 1155 Long Island Avenue Edgewood, NY 11717-8309 ATTN: IWS 866-708-5586 WENDY SIMPSON Executive Chairman CORNELIA CHENG ESG Committee Chairman DAVID GRUBER Investment Committee Chairman BOYD HENDRICKSON Lead Independent Director and Nominating & Corporate Governance Committee Chairman BRADLEY PREBER Audit Committee Chairman TIMOTHY TRICHE, MD Compensation Committee Chairman JUAN SANABRIA BMO Capital Markets Corp. AARON HECHT Citizens JMP Securities, LLC OMOTAYO OKUSANYA Deutsche Bank Securities Inc. JOE DICKSTEIN Jefferies LLC AUSTIN WURSCHMIDT KeyBanc Capital Markets, Inc. MICHAEL CARROLL RBC Capital Markets Corp. RICHARD ANDERSON Wedbush JOHN KILICHOWSKI Wells Fargo Securities, LLC WENDY SIMPSON Executive Chairman PAM KESSLER Co-President and Co-CEO CLINT MALIN Co-President, Co-CEO and Chief Investment Officer DOUG KOREY Executive Vice President, Managing Director of Business Development GIBSON SATTERWHITE Executive Vice President, Asset Management MANDI HOGAN Senior Vice President, Marketing CECE CHIKHALE Executive Vice President, CFO, Treasurer and Secretary MIKE BOWDEN Senior Vice President, Investments |

| 4Q 2024 SUPPLEMENTAL REPORT CONTRACTUAL # O F PROPERTY DATE OF INITIAL PRO PERTIES TYPE # O F UNITS LO CATIO N OPERATOR CONSTRUCTIO N CASH YIELD 1 ILF/ALF/MC 242 units Centerville, OH Encore Senior Living 2019-2022 8.25% 54,134 $ (1) — (2) — (2) — Great Bend, KS Brookdale Senior Living — 8.00% 315 $ Jun-2023 Feb-2024 DATE PURCHASE PRICE ACQUISITIONS INVESTMENTS I 4 REAL ESTATE ACTIVITIES – INVESTMENTS - 2023-2024 (DOLLAR AMOUNTS IN THOUSANDS) (1) We contributed $45,000 to a $54,134 joint venture (“JV”) for the purchase of an independent living, assisted living and memory care campus in Ohio. The seller, LTC’s JV partner, has the option to purchase the campus during the third and fourth lease years (2025 - 2027), with an exit IRR of 9.75%. The campus was leased to an affiliate of Encore Senior Living (“Encore”) under a 10-year term at an initial yield of 8.25% on LTC’s allocation of the JV investment. We committed to fund $2,100 of lease incentives under the new lease. See Consolidated Joint Ventures on page 7 for further discussion. (2) We purchased a land parcel adjacent to an existing assisted living community. INVESTMENTS $81,315 $34,840 $109,440 $176,400 $261,851 $0 $50,000 $100,000 $150,000 $200,000 $250,000 $300,000 2019 2020 2021 2022 2023 2024 $ 66,947 |

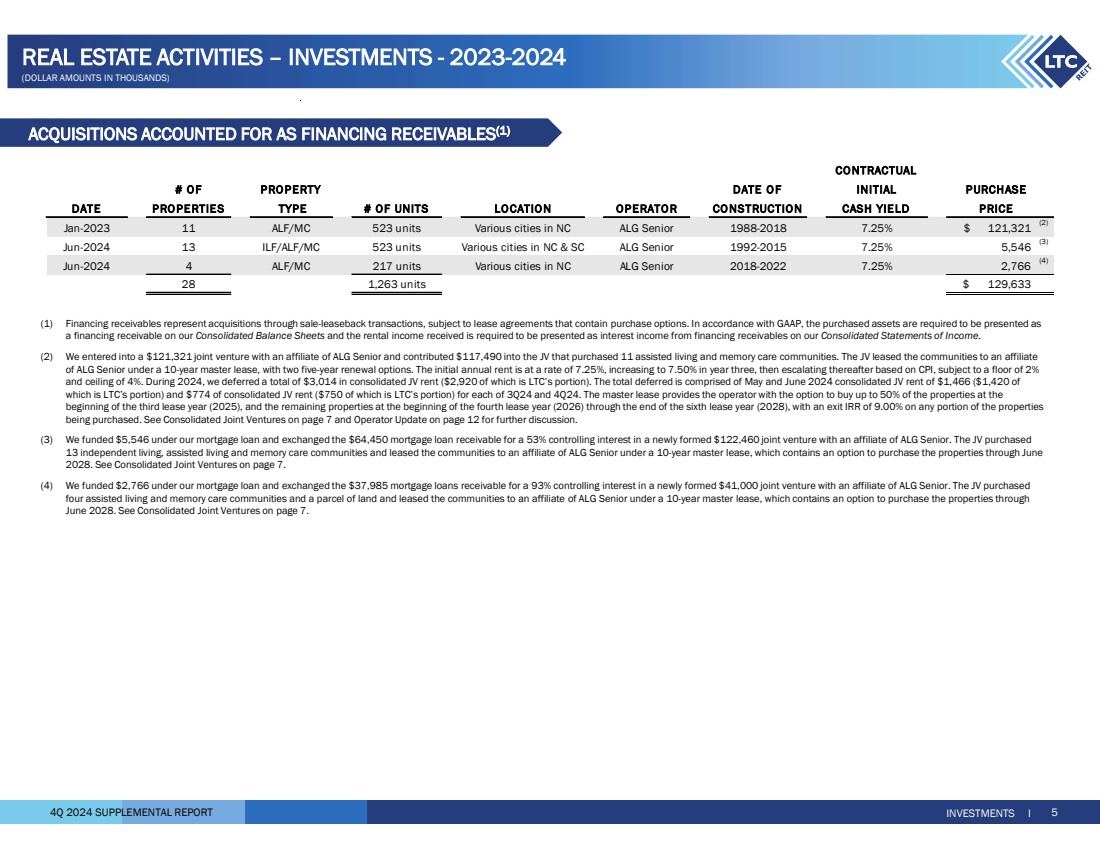
| 4Q 2024 SUPPLEMENTAL REPORT INVESTMENTS I 5 REAL ESTATE ACTIVITIES – INVESTMENTS - 2023-2024 ACQUISITIONS ACCOUNTED FOR AS FINANCING RECEIVABLES(1) (DOLLAR AMOUNTS IN THOUSANDS) CONTRACTUAL # OF PRO PERTY DATE O F INITIAL PURCHASE PRO PERTIES TYPE # OF UNITS LOCATIO N OPERATO R CO NSTRUCTION CASH YIELD PRICE 11 ALF/MC 523 units Various cities in NC ALG Senior 1988-2018 7.25% 121,321 $ (2) 13 ILF/ALF/MC 523 units Various cities in NC & SC ALG Senior 1992-2015 7.25% 5,546 (3) 4 ALF/MC 217 units Various cities in NC ALG Senior 2018-2022 7.25% 2,766 (4) 28 1,263 units 129,633 $ DATE Jun-2024 Jun-2024 Jan-2023 (1) Financing receivables represent acquisitions through sale-leaseback transactions, subject to lease agreements that contain purchase options. In accordance with GAAP, the purchased assets are required to be presented as a financing receivable on our Consolidated Balance Sheets and the rental income received is required to be presented as interest income from financing receivables on our Consolidated Statements of Income. (2) We entered into a $121,321 joint venture with an affiliate of ALG Senior and contributed $117,490 into the JV that purchased 11 assisted living and memory care communities. The JV leased the communities to an affiliate of ALG Senior under a 10-year master lease, with two five-year renewal options. The initial annual rent is at a rate of 7.25%, increasing to 7.50% in year three, then escalating thereafter based on CPI, subject to a floor of 2% and ceiling of 4%. During 2024, we deferred a total of $3,014 in consolidated JV rent ($2,920 of which is LTC’s portion). The total deferred is comprised of May and June 2024 consolidated JV rent of $1,466 ($1,420 of which is LTC’s portion) and $774 of consolidated JV rent ($750 of which is LTC’s portion) for each of 3Q24 and 4Q24. The master lease provides the operator with the option to buy up to 50% of the properties at the beginning of the third lease year (2025), and the remaining properties at the beginning of the fourth lease year (2026) through the end of the sixth lease year (2028), with an exit IRR of 9.00% on any portion of the properties being purchased. See Consolidated Joint Ventures on page 7 and Operator Update on page 12 for further discussion. (3) We funded $5,546 under our mortgage loan and exchanged the $64,450 mortgage loan receivable for a 53% controlling interest in a newly formed $122,460 joint venture with an affiliate of ALG Senior. The JV purchased 13 independent living, assisted living and memory care communities and leased the communities to an affiliate of ALG Senior under a 10-year master lease, which contains an option to purchase the properties through June 2028. See Consolidated Joint Ventures on page 7. (4) We funded $2,766 under our mortgage loan and exchanged the $37,985 mortgage loans receivable for a 93% controlling interest in a newly formed $41,000 joint venture with an affiliate of ALG Senior. The JV purchased four assisted living and memory care communities and a parcel of land and leased the communities to an affiliate of ALG Senior under a 10-year master lease, which contains an option to purchase the properties through June 2028. See Consolidated Joint Ventures on page 7. |
| 4Q 2024 SUPPLEMENTAL REPORT TOTAL COMMITMENT INVESTMENT 4Q24 FUNDED REMAINING YEAR TO DATE COMMITMENT 1Q24 (1) 2023 19,500 $ 2,754 $ 12,753 $ 6,747 $ — (2) 2024 26,120 — — 26,120 $ $ 2,754 45,620 $ 12,753 $ 32,867 $ INCEPTION DATE COMMITMENT FUNDING INTEREST ESTIMATED MORTGAGE LOANS INVESTMENTS I 6 MEZZANINE LOANS (1) The initial cash rate is 8.75% with a 12.00% IRR. Our investment represents approximately 12% of the estimated project cost. The loan will also be utilized for the construction of 89 additional units. # OF PROPERTY MATURITY PROPERTIES TYPE # OF UNITS LOCATION OPERATOR DATE ORIGINATION 2023 1 ILF/ALF/MC 130 units Alpharetta, GA Galerie Management Jun-2028 (1) 8.75% 17,000 $ CONTRACTUAL YE AR RATE COMMITMENT INITIAL # O F PROPERTY # UNITS/ MATURITY INITIAL PROPERTIES TYPE BEDS LO CATIO N OPERATOR DATE ORIGINATIO N INVE STMENT 1 MC 45 units Canton, NC ALG Senior Jan-2025 7.25% (1) $ 10,750 10,750 $ — $ 1 ILF/ALF/MC 203 units Atlanta, GA Galerie Management Oct-2024 7.50% (2) 51,111 51,111 — 1 SNF 150 beds Hanover Park, IL Ignite Medical Resorts Jun-2028 8.75% 16,500 16,500 — 2 ALF 92 units Various cities in FL Opal Senior Living Dec-2025 8.75% 4,000 (3) — 4,000 5 340 units/150 beds 82,361 $ 82,361 $ — $ 1 UDP - ALF/MC 85 units Lansing, MI Encore Senior Living Sep-2026 8.75% 19,500 $ (4) $ 16,560 2,940 $ (4) 1 UDP - ILF/ALF/MC 116 units Loves Park, IL Encore Senior Living Jul-2030 9.00% 26,120 (4) 26,120 — (4) 2 201 units 45,620 $ 2,940 $ 42,680 $ DATE Dec-2023 Jan-2023 Feb-2023 Jun-2023 CONTRACTUAL INITIAL Jan-2024 Jul-2024 COMMITMENT INITIAL ADDITIONAL RATE (1) The initial rate is 7.25% with a 9.00% IRR. (2) Invested in an existing mortgage loan refinancing certain existing banks and our outstanding $7,461 mezzanine loan originated in 4Q18. The initial rate is 7.5% yield with a 7.75% IRR. We received the payoff for this mortgage loan in 4Q24. (3) The mortgage loan provides a one-year extension. (4) Represents mortgage loans commitment to construct senior living communities. The borrowers contributed equity, which will initially fund the constructions. Once all of the borrower’s equity has been drawn, we will fund the additional commitment. The table below shows the detail of the construction funding: REAL ESTATE ACTIVITIES – INVESTMENTS - 2023-2024 (DOLLAR AMOUNTS IN THOUSANDS) (1) Began funding in 1Q24 under this construction loan commitment which was originated in July 2023. The borrower contributed $12,100 of equity at commencement, which was used to initially fund the construction. The interest only loan term is approximately three years, and includes two, one-year extensions, each of which is contingent to certain coverage thresholds. (2) The borrower contributed $12,300 of equity, which will initially fund the construction. Once all of the borrower’s equity has been drawn, expected in 3Q25, LTC will begin funding the commitment. The loan term is approximately six years at a current rate of 9.0% and IRR of 9.5%. |

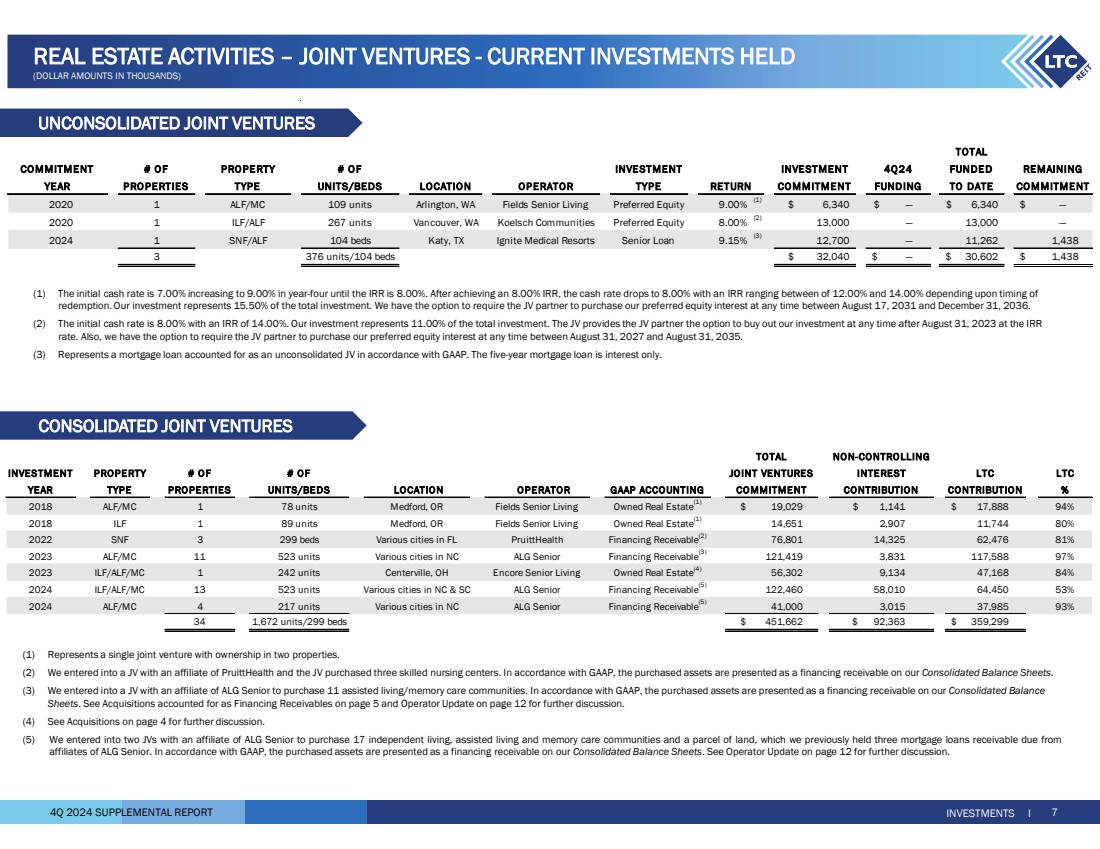
| 4Q 2024 SUPPLEMENTAL REPORT (1) The initial cash rate is 7.00% increasing to 9.00% in year-four until the IRR is 8.00%. After achieving an 8.00% IRR, the cash rate drops to 8.00% with an IRR ranging between of 12.00% and 14.00% depending upon timing of redemption. Our investment represents 15.50% of the total investment. We have the option to require the JV partner to purchase our preferred equity interest at any time between August 17, 2031 and December 31, 2036. (2) The initial cash rate is 8.00% with an IRR of 14.00%. Our investment represents 11.00% of the total investment. The JV provides the JV partner the option to buy out our investment at any time after August 31, 2023 at the IRR rate. Also, we have the option to require the JV partner to purchase our preferred equity interest at any time between August 31, 2027 and August 31, 2035. (3) Represents a mortgage loan accounted for as an unconsolidated JV in accordance with GAAP. The five-year mortgage loan is interest only. CONSOLIDATED JOINT VENTURES UNCONSOLIDATED JOINT VENTURES INVESTMENTS I 7 REAL ESTATE ACTIVITIES – JOINT VENTURES - CURRENT INVESTMENTS HELD (DOLLAR AMOUNTS IN THOUSANDS) TOTAL # OF PROPE RTY # O F INVE STMENT 4Q24 FUNDED PRO PERTIES TYPE UNITS/BEDS LOCATIO N OPERATOR TYPE FUNDING TO DATE 2020 1 ALF/MC 109 units Arlington, WA Fields Senior Living Preferred Equity 9.00% (1) $ — 6,340 $ 6,340 $ — $ 2020 1 ILF/ALF 267 units Vancouver, WA Koelsch Communities Preferred Equity 8.00% (2) — 13,000 13,000 — 2024 1 SNF/ALF 104 beds Katy, TX Ignite Medical Resorts Senior Loan 9.15% (3) — 12,700 11,262 1,438 3 376 units/104 beds 32,040 $ — $ 30,602 $ 1,438 $ COMMITMENT INVE STMENT COMMITMENT REMAINING YEAR COMMITMENT RETURN (1) Represents a single joint venture with ownership in two properties. (2) We entered into a JV with an affiliate of PruittHealth and the JV purchased three skilled nursing centers. In accordance with GAAP, the purchased assets are presented as a financing receivable on our Consolidated Balance Sheets. (3) We entered into a JV with an affiliate of ALG Senior to purchase 11 assisted living/memory care communities. In accordance with GAAP, the purchased assets are presented as a financing receivable on our Consolidated Balance Sheets. See Acquisitions accounted for as Financing Receivables on page 5 and Operator Update on page 12 for further discussion. (4) See Acquisitions on page 4 for further discussion. (5) We entered into two JVs with an affiliate of ALG Senior to purchase 17 independent living, assisted living and memory care communities and a parcel of land, which we previously held three mortgage loans receivable due from affiliates of ALG Senior. In accordance with GAAP, the purchased assets are presented as a financing receivable on our Consolidated Balance Sheets. See Operator Update on page 12 for further discussion. INVESTMENT PROPERTY # OF # OF LTC YEAR TYPE PROPERTIES UNITS/BEDS LOCATION OPERATOR GAAP ACCOUNTING % 2018 ALF/MC 1 78 units Medford, OR Fields Senior Living Owned Real Estate(1) $ 1,141 19,029 $ 17,888 $ 94% 2018 ILF 1 89 units Medford, OR Fields Senior Living Owned Real Estate(1) 2,907 14,651 11,744 80% 2022 SNF 3 299 beds Various cities in FL PruittHealth Financing Receivable(2) 14,325 76,801 62,476 81% 2023 ALF/MC 11 523 units Various cities in NC ALG Senior Financing Receivable(3) 3,831 121,419 117,588 97% 2023 ILF/ALF/MC 1 242 units Centerville, OH Encore Senior Living Owned Real Estate(4) 9,134 56,302 47,168 84% 2024 ILF/ALF/MC 13 523 units Various cities in NC & SC ALG Senior Financing Receivable(5) 58,010 122,460 64,450 53% 2024 ALF/MC 4 217 units Various cities in NC ALG Senior Financing Receivable(5) 3,015 41,000 37,985 93% 34 1,672 units/299 beds 451,662 $ 92,363 $ 359,299 $ TOTAL NON-CONTROLLING JOINT VENTURES INTEREST LTC COMMITMENT CONTRIBUTION CONTRIBUTION |
| 4Q 2024 SUPPLEMENTAL REPORT INVESTMENTS I 8 REAL ESTATE ACTIVITIES – PURCHASE OPTIONS (DOLLAR AMOUNTS IN THOUSANDS) PURCHASE OPTIONS CONSOLIDATED NO N-O PTION # OF PROPERTY AVERAGE AGE GROSS CONTROLLING GROSS WINDOW OPERATOR STATE PROPERTIES TYPE IN YEARS INVESTMENTS INTEREST INVESTMENTS 2024-2025 Anthem Memory Care Ohio 1 MC 8.0 16,161 $ — $ 16,161 $ 360 $ 2024-2028 (1) ALG Senior North Carolina 4 ALF 5.2 41,000 3,015 37,985 2,973 2024-2028 (1) ALG Senior North Carolina, South Carolina 13 ILF/ALF/MC 24.1 122,460 58,010 64,450 8,878 2025-2026 (2) Community Living Centers Tennessee 2 SNF 11.0 5,275 — 5,275 1,030 2025-2027 (3) PruittHealth Florida 3 SNF 5.7 76,603 14,325 62,278 5,951 2025-2027 (4) Encore Senior Living Ohio 1 ILF/ALF/MC 6.0 54,782 9,134 45,648 3,886 2025-2029 (3) ALG Senior North Carolina 11 ALF/MC 19.8 121,419 3,831 117,588 8,803 (5) 2026 Mainstay Senior Living South Carolina 1 ALF 26.0 11,680 — 11,680 — (7) 2026-2028 Priority Life Care Texas 1 MC 9.0 6,724 — 6,724 — (6) 2027 Legacy Senior Living Georgia, South Carolina 2 ALF/MC 9.0 32,266 — 32,266 — (7) 2027-2029 Oxford Senior Living Oklahoma 5 ALF/MC 28.4 11,068 — 11,068 984 2027-2029 (8) Ignite Medical Resorts Texas 4 SNF 7.5 52,726 — 52,726 4,488 2029 Brookdale Senior Living Colorado, Kansas, Ohio, Texas 17 ALF/MC 20.2 65,134 — 65,134 9,859 2029 Navion Senior Solutions North Carolina 5 ALF 27.0 14,980 — 14,980 3,369 Total 70 632,278 $ 88,315 $ 543,963 $ 50,581 $ ANNUALIZED CONTRACTUAL CASH LTC PORTION OF LTC PORTION OF (1) We entered into two JVs with an affiliate of ALG Senior to purchase 17 independent living, assisted living and memory care communities and a parcel of land, which we previously held three mortgage loans receivable due from affiliates of ALG Senior. In accordance with GAAP, the purchased assets are presented as a financing receivable on our Consolidated Balance Sheets. (2) In 1Q25, a master lease covering two skilled nursing centers in Tennessee that was scheduled to mature in December 2025, was amended extending the maturity to December 31, 2026. Additionally, the master lease purchase option window which expired on December 31, 2024, was extended for another year to December 31, 2025. (3) These properties were acquired through a sale-leaseback transaction, subject to a lease agreement that contains a purchase option. In accordance with GAAP, the purchased properties are presented as a financing receivable on our Consolidated Balance Sheets. (4) See Acquisitions on page 4 for further discussion. (5) During 2024, we deferred a total of $3,014 in consolidated JV rent ($2,920 of which is LTC’s portion). The total deferred is comprised of May and June 2024 consolidated JV rent of $1,466 ($1,420 of which is LTC’s portion) and $774 of consolidated JV rent ($750 of which is LTC’s portion) for each of 3Q24 and 4Q24. (6) In 2Q24, this property was transitioned to Priority Life Care. The initial rent for the first six months is zero, after which rent will be based on mutually agreed upon fair market rent. Subsequent to December 31, 2024, the purchase option was terminated in conjunction with the closure of the community. The property is being marketed for sale for an alternative use. (7) The rent for these leases are based on mutually agreed upon fair market rent. (8) The master lease allows the operator to elect either an earn-out payment or purchase option. If neither option is elected within the timeframe defined in the lease, both elections are terminated. |

| 4Q 2024 SUPPLEMENTAL REPORT # OF % OF % OF BY INVESTME NT TYPE PROPERTIE S INVESTME NT REVENUES(1 ) REVENUE S INCO ME STATE MENT LINE Owned Portfolio(2) 1,333,078 123 $ 63.8% 116,140 $ 63.8% Rental Income Owned Properties accounted for as Financing Receivables(3) 361,482 31 17.3% 21,663 11.9% Interest Income from Financing Receivables Mortgage Loans 27 315,734 (4) 15.1% (4) 20.0% Interest Income from Mortgage Loans 36,561 Notes Receivable 6 47,717 2.3% 5,264 2.9% Interest and Other Income Unconsolidated Joint Ventures 3 30,602 1.5% 2,442 1.4% Income from Unconsolidated Joint Ventures Total 190 2,088,613 $ 100.0% 182,070 $ 100.0% # OF % OF BY PROPERTY TYPE PROPERTIE S INVESTME NT Assisted Living(2) 1,117,588 113 $ 53.5% Skilled Nursing 76 959,020 45.9% Other(5) 12,005 1 0.6% Total 190 2,088,613 $ 100.0% INVESTMENT GROSS INVESTMENT TRAILING TWE LVE MONTHS ENDED DE CE MBER 31, 2024 GROSS PORTFOLIO I PORTFOLIO OVERVIEW (AS OF DECEMBER 31, 2024, DOLLAR AMOUNTS IN THOUSANDS) 30 Operators 25 States 190 Properties (1) See Trailing Twelve Months Revenues definition in the Glossary. (2) Subsequent to December 31, 2024, we sold an assisted living community in Oklahoma for $670. Upon sale, the property was removed from a master lease covering five assisted living properties in Oklahoma and rent under the master lease was not reduced as a result of the sale. (3) Financing receivables represent acquisitions through sale-leaseback transactions, subject to lease agreements that contain purchase options. In accordance with GAAP, the purchased assets are presented as a financing receivable on our Consolidated Balance Sheets and the rental income received is required to be presented as interest income from financing receivables on our Consolidated Statements of Income. (4) Mortgage loans include short-term loans of $60,709 or 2.9% of gross investment and long-term loans (Prestige) of $255,025 or 12.2% of gross investment. The weighted average maturity for our mortgage loans portfolio and long-term mortgage loans (Prestige) @ 12/31/24 is 15.9 years and 19.3 years, respectively. (5) Includes one behavioral health care hospital and three parcels for land held-for-use. 9 LONG-TERM INVESTMENTS include our Owned Portfolio, Owned Properties accounted for as Financing Receivables and Long-Term Mortgage Loans (Prestige) which represent 93% of our Gross Investments. SHORT-TERM INVESTMENTS represent investment durations shorter than 10 years and include our Notes Receivable, Unconsolidated Joint Ventures and Short-Term Mortgage Loans which represent 7% of our Gross Investments. Long-Term Investments 93% Short-Term Investments, 7% |

| 4Q 2024 SUPPLEMENTAL REPORT PORTFOLIO I 10 PORTFOLIO OVERVIEW – DETAIL (AS OF DECEMBER 31, 2024, DOLLAR AMOUNTS IN THOUSANDS) # OF OWNED PORTFOLIO PRO PE RTIES RENTAL INCOME(1 ) Assisted Living(2) 723,010 72 $ 34.6% 51,537 $ 28.3% Skilled Nursing 50 598,063 28.6% 63,479 34.9% Other 1 12,005 0.6% 1,124 0.6% Total 123 1,333,078 $ 63.8% 116,140 $ 63.8% OWNED PRO PERTIES ACCOUNTED FOR AS # OF FINANCING RECEIVABLES(3 ) PRO PERTIES FINANCING INCOME(1 ) Assisted Living 28 284,879 $ 13.6% 16,052 $ 8.8% Skilled Nursing 3 76,603 3.7% 5,611 3.1% Total 31 361,482 $ 17.3% 21,663 $ 11.9% # OF MO RTGAGE LOANS MORTGAGE LO ANS PRO PE RTIES INTEREST INCO ME(1 ) Assisted Living 5 44,209 $ 2.1% 3,540 $ 1.9% Skilled Nursing(4) 271,525 22 13.0% 33,021 18.1% Total 27 315,734 $ 15.1% 36,561 $ 20.0% REAL ESTATE INVESTMENTS 2,010,294 181 $ 96.2% 174,364 $ 95.7% # OF INTEREST AND NOTE S RE CE IVABLE PRO PE RTIES OTHE R INCOME(1 ) Assisted Living 6 46,150 $ 2.2% 4,911 $ 2.7% Skilled Nursing — 1,567 0.1% 353 0.2% Total 6 47,717 $ 2.3% 5,264 $ 2.9% # OF UNCONSOLIDATED UNCONSOLIDATED JO INT VENTURE S PRO PE RTIES JV INCOME(1 ) Assisted Living 2 19,340 $ 1.0% 1,558 $ 0.9% Skilled Nursing 1 11,262 0.5% 884 0.5% Total 3 30,602 $ 1.5% 2,442 $ 1.4% TOTAL INVESTME NTS 2,088,613 190 $ 100.0% 182,070 $ 100.0% GROSS % OF % OF TOTAL INVE STMENT GROSS INVE STMENT REVE NUE S INVE STMENT GROSS GROSS INVE STMENT GROSS INVE STMENT % OF GROSS INVE STMENT % OF INVE STMENT TRAILING TWELVE MONTHS E NDE D DECE MBER 31, 2024 GROSS % OF GROSS INVE STMENT RE VE NUE S % OF TOTAL GROSS INVE STMENT % OF GROSS INVE STMENT REVE NUE S % OF TOTAL REVE NUE S % OF TOTAL REVE NUE S % OF TOTAL 28.3% 34.9% 0.6% 0.0% 25.0% 50.0% ALF SNF OTH RENTAL INCOME (AS % OF TOTAL REVENUES) MORTGAGE LOANS INTEREST INCOME (AS % OF TOTAL REVENUES) INTEREST & OTHER INCOME (AS % OF TOTAL REVENUES) UNCONSOLIDATED JV INCOME (AS % OF TOTAL REVENUES) 1.9% 18.1% 0.0% 15.0% 30.0% ALF SNF 2.7% 0.2% 0.0% 2.5% 5.0% ALF SNF 0.9% 0.5% 0.0% 1.0% 2.0% ALF SNF 8.8% 3.1% 0.0% 15.0% 30.0% ALF SNF FINANCING RECEIVABLES (AS % OF TOTAL REVENUES) (1) See Trailing Twelve Months Revenues definition in the Glossary. (2) Subsequent to December 31, 2024, we sold an assisted living community in Oklahoma for $670. Upon sale, the property was removed from a master lease covering five assisted living properties in Oklahoma and rent under the master lease was not reduced as a result of the sale. (3) Financing receivables represent acquisitions through sale-leaseback transactions, subject to lease agreements that contain purchase options. In accordance with GAAP, the purchased assets are required to be presented as a financing receivable on our Consolidated Balance Sheets and the rental income received is required to be presented as interest income from financing receivables on our Consolidated Statements of Income. (4) Skilled nursing mortgage loans include short-term loans of $16,500 or 0.8% of gross investment and long-term loans (Prestige) of $255,025 or 12.2% of gross investment. The weighted average maturity of Prestige loans is 19.3 years. |

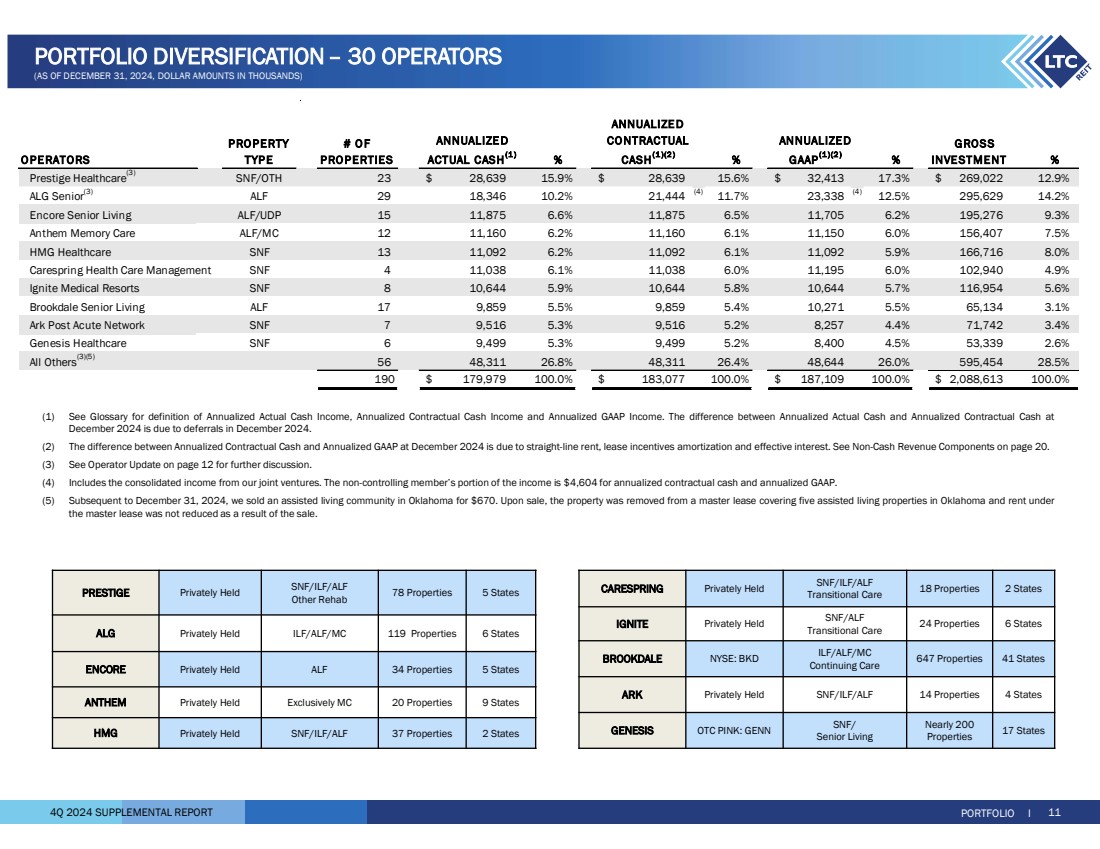
| 4Q 2024 SUPPLEMENTAL REPORT O PERATORS PROPERTY TYPE # O F PROPERTIES % % % GROSS INVE STMENT % Prestige Healthcare(3) SNF/OTH 23 28,639 $ 15.9% 28,639 $ 15.6% 32,413 $ 17.3% 269,022 $ 12.9% ALG Senior(3) ALF 29 18,346 10.2% 21,444 (4) 11.7% 23,338 (4) 12.5% 295,629 14.2% Encore Senior Living ALF/UDP 15 11,875 6.6% 11,875 6.5% 11,705 6.2% 195,276 9.3% Anthem Memory Care ALF/MC 12 11,160 6.2% 11,160 6.1% 11,150 6.0% 156,407 7.5% HMG Healthcare SNF 13 11,092 6.2% 11,092 6.1% 11,092 5.9% 166,716 8.0% Carespring Health Care Management SNF 4 11,038 6.1% 11,038 6.0% 11,195 6.0% 102,940 4.9% Ignite Medical Resorts SNF 8 10,644 5.9% 10,644 5.8% 10,644 5.7% 116,954 5.6% Brookdale Senior Living ALF 17 9,859 5.5% 9,859 5.4% 10,271 5.5% 65,134 3.1% Ark Post Acute Network SNF 7 9,516 5.3% 9,516 5.2% 8,257 4.4% 71,742 3.4% Genesis Healthcare SNF 6 9,499 5.3% 9,499 5.2% 8,400 4.5% 53,339 2.6% All Others(3)(5) 48,311 56 26.8% 48,311 26.4% 48,644 26.0% 595,454 28.5% 190 179,979 $ 100.0% 183,077 $ 100.0% 187,109 $ 100.0% 2,088,613 $ 100.0% ANNUALIZED GAAP(1 )(2 ) ANNUALIZE D ACTUAL CASH(1 ) ANNUALIZE D CONTRACTUAL CASH(1 )(2 ) PORTFOLIO I 11 PORTFOLIO DIVERSIFICATION – 30 OPERATORS (AS OF DECEMBER 31, 2024, DOLLAR AMOUNTS IN THOUSANDS) 18 Properties 2 States SNF/ILF/ALF Transitional Care CARESPRING Privately Held 24 Properties 6 States SNF/ALF Transitional Care IGNITE Privately Held 647 Properties 41 States ILF/ALF/MC Continuing Care BROOKDALE NYSE: BKD ARK Privately Held SNF/ILF/ALF 14 Properties 4 States 17 States Nearly 200 Properties SNF/ Senior Living GENESIS OTC PINK: GENN 78 Properties 5 States SNF/ILF/ALF Other Rehab PRESTIGE Privately Held ALG Privately Held ILF/ALF/MC 119 Properties 6 States ENCORE Privately Held ALF 34 Properties 5 States ANTHEM Privately Held Exclusively MC 20 Properties 9 States HMG Privately Held SNF/ILF/ALF 37 Properties 2 States (1) See Glossary for definition of Annualized Actual Cash Income, Annualized Contractual Cash Income and Annualized GAAP Income. The difference between Annualized Actual Cash and Annualized Contractual Cash at December 2024 is due to deferrals in December 2024. (2) The difference between Annualized Contractual Cash and Annualized GAAP at December 2024 is due to straight-line rent, lease incentives amortization and effective interest. See Non-Cash Revenue Components on page 20. (3) See Operator Update on page 12 for further discussion. (4) Includes the consolidated income from our joint ventures. The non-controlling member’s portion of the income is $4,604 for annualized contractual cash and annualized GAAP. (5) Subsequent to December 31, 2024, we sold an assisted living community in Oklahoma for $670. Upon sale, the property was removed from a master lease covering five assisted living properties in Oklahoma and rent under the master lease was not reduced as a result of the sale. |
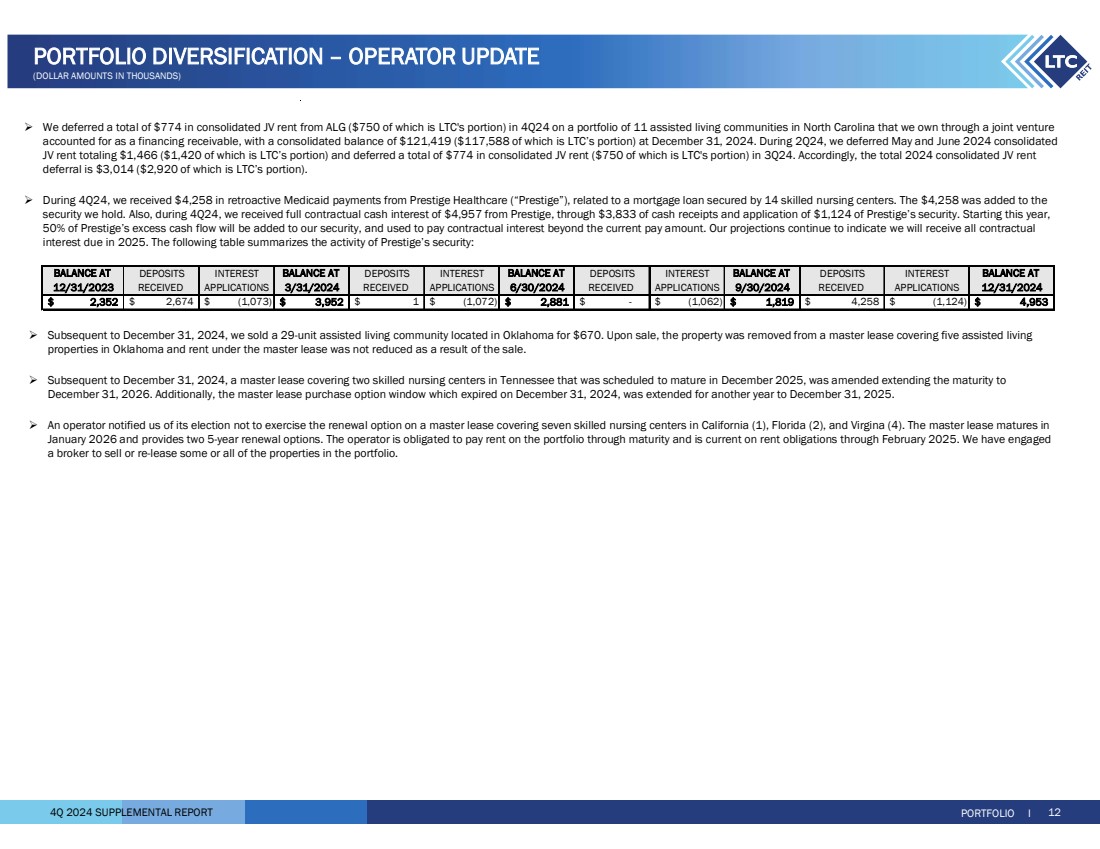
| 4Q 2024 SUPPLEMENTAL REPORT PORTFOLIO I 12 PORTFOLIO DIVERSIFICATION – OPERATOR UPDATE (DOLLAR AMOUNTS IN THOUSANDS) We deferred a total of $774 in consolidated JV rent from ALG ($750 of which is LTC's portion) in 4Q24 on a portfolio of 11 assisted living communities in North Carolina that we own through a joint venture accounted for as a financing receivable, with a consolidated balance of $121,419 ($117,588 of which is LTC’s portion) at December 31, 2024. During 2Q24, we deferred May and June 2024 consolidated JV rent totaling $1,466 ($1,420 of which is LTC’s portion) and deferred a total of $774 in consolidated JV rent ($750 of which is LTC's portion) in 3Q24. Accordingly, the total 2024 consolidated JV rent deferral is $3,014 ($2,920 of which is LTC’s portion). During 4Q24, we received $4,258 in retroactive Medicaid payments from Prestige Healthcare (“Prestige”), related to a mortgage loan secured by 14 skilled nursing centers. The $4,258 was added to the security we hold. Also, during 4Q24, we received full contractual cash interest of $4,957 from Prestige, through $3,833 of cash receipts and application of $1,124 of Prestige’s security. Starting this year, 50% of Prestige’s excess cash flow will be added to our security, and used to pay contractual interest beyond the current pay amount. Our projections continue to indicate we will receive all contractual interest due in 2025. The following table summarizes the activity of Prestige’s security: Subsequent to December 31, 2024, we sold a 29-unit assisted living community located in Oklahoma for $670. Upon sale, the property was removed from a master lease covering five assisted living properties in Oklahoma and rent under the master lease was not reduced as a result of the sale. Subsequent to December 31, 2024, a master lease covering two skilled nursing centers in Tennessee that was scheduled to mature in December 2025, was amended extending the maturity to December 31, 2026. Additionally, the master lease purchase option window which expired on December 31, 2024, was extended for another year to December 31, 2025. An operator notified us of its election not to exercise the renewal option on a master lease covering seven skilled nursing centers in California (1), Florida (2), and Virgina (4). The master lease matures in January 2026 and provides two 5-year renewal options. The operator is obligated to pay rent on the portfolio through maturity and is current on rent obligations through February 2025. We have engaged a broker to sell or re-lease some or all of the properties in the portfolio. BALANCE AT DEPOSITS INTEREST BALANCE AT DEPOSITS INTEREST BALANCE AT DEPOSITS INTEREST BALANCE AT DEPOSITS INTEREST BALANCE AT 12/31/2023 RECEIVED APPLICATIONS 3/31/2024 RECEIVED APPLICATIONS 6/30/2024 RECEIVED APPLICATIONS 9/30/2024 RECEIVED APPLICATIONS 12/31/2024 $ 2,352 $ 2,674 $ (1,073) $ 3,952 $ 1 $ (1,072) $ 2,881 $ - $ (1,062) $ 1,819 $ 4,258 $ (1,124) $ 4,953 |
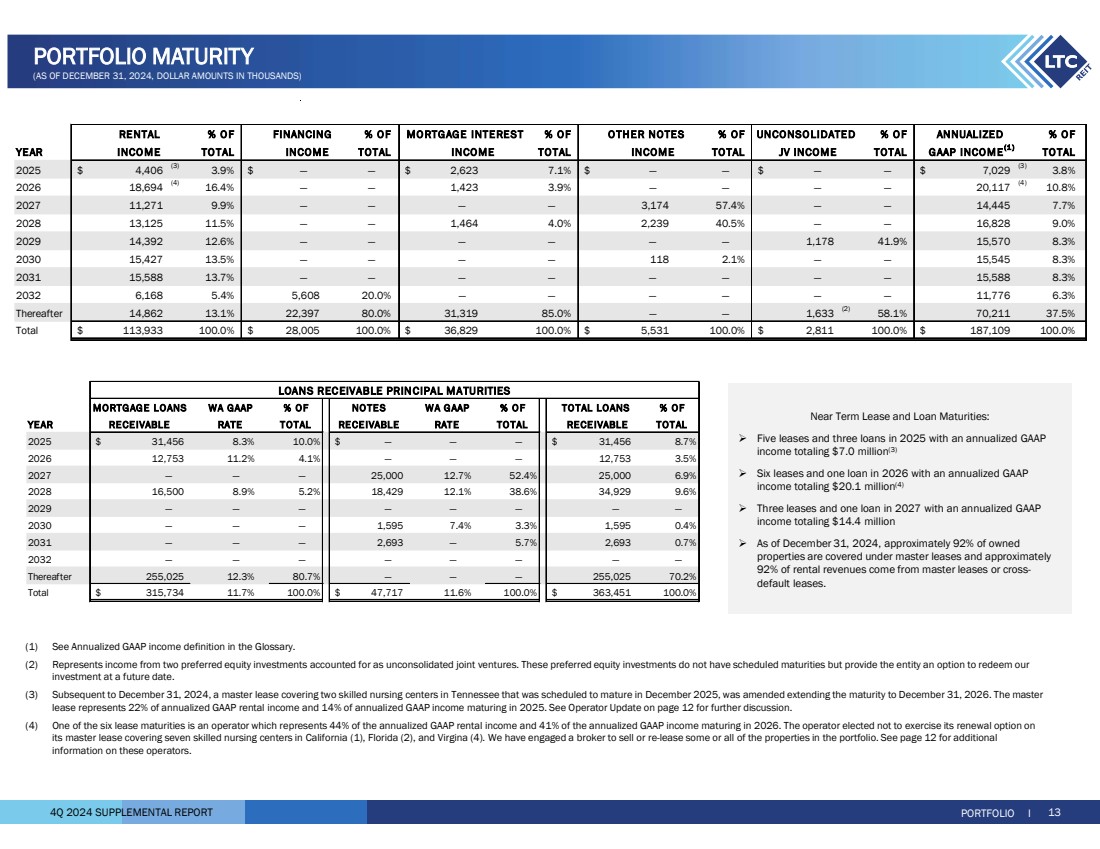
| 4Q 2024 SUPPLEMENTAL REPORT PORTFOLIO MATURITY (AS OF DECEMBER 31, 2024, DOLLAR AMOUNTS IN THOUSANDS) % O F % OF % OF % OF % O F ANNUALIZED % O F YEAR TO TAL TOTAL TOTAL TO TAL TOTAL TO TAL 2025 4,406 $ (3) 3.9% — $ — 2,623 $ 7.1% — $ — — $ — 7,029 $ (3) 3.8% 2026 18,694 (4) 16.4% — — 1,423 3.9% — — — — 20,117 (4) 10.8% 2027 11,271 9.9% — — — — 3,174 57.4% — — 14,445 7.7% 2028 13,125 11.5% — — 1,464 4.0% 2,239 40.5% — — 16,828 9.0% 2029 14,392 12.6% — — — — — — 1,178 41.9% 15,570 8.3% 2030 15,427 13.5% — — — — 118 2.1% — — 15,545 8.3% 2031 15,588 13.7% — — — — — — — — 15,588 8.3% 2032 6,168 5.4% 5,608 20.0% — — — — — — 11,776 6.3% Thereafter 14,862 13.1% 22,397 80.0% 31,319 85.0% — — 1,633 (2) 58.1% 70,211 37.5% Total 113,933 $ 100.0% 28,005 $ 100.0% 36,829 $ 100.0% 5,531 $ 100.0% 2,811 $ 100.0% 187,109 $ 100.0% RENTAL UNCONSO LIDATED INCOME FINANCING O THER NOTES INCOME INCOME MO RTGAGE INTEREST INCO ME JV INCOME GAAP INCOME(1 ) PORTFOLIO I 13 (1) See Annualized GAAP income definition in the Glossary. (2) Represents income from two preferred equity investments accounted for as unconsolidated joint ventures. These preferred equity investments do not have scheduled maturities but provide the entity an option to redeem our investment at a future date. (3) Subsequent to December 31, 2024, a master lease covering two skilled nursing centers in Tennessee that was scheduled to mature in December 2025, was amended extending the maturity to December 31, 2026. The master lease represents 22% of annualized GAAP rental income and 14% of annualized GAAP income maturing in 2025. See Operator Update on page 12 for further discussion. (4) One of the six lease maturities is an operator which represents 44% of the annualized GAAP rental income and 41% of the annualized GAAP income maturing in 2026. The operator elected not to exercise its renewal option on its master lease covering seven skilled nursing centers in California (1), Florida (2), and Virgina (4). We have engaged a broker to sell or re-lease some or all of the properties in the portfolio. See page 12 for additional information on these operators. MORTGAGE LOANS WA GAAP % OF NO TE S WA GAAP % O F % OF YEAR RECEIVABLE RATE TOTAL RECEIVABLE RATE TO TAL TOTAL 2025 31,456 $ 8.3% 10.0% — $ — — 31,456 $ 8.7% 2026 12,753 11.2% 4.1% — — — 12,753 3.5% 2027 — — — 25,000 12.7% 52.4% 25,000 6.9% 2028 16,500 8.9% 5.2% 18,429 12.1% 38.6% 34,929 9.6% 2029 — — — — — — — — 2030 — — — 1,595 7.4% 3.3% 1,595 0.4% 2031 — — — 2,693 — 5.7% 2,693 0.7% 2032 — — — — — — — — Thereafter 255,025 12.3% 80.7% — — — 255,025 70.2% Total 315,734 $ 11.7% 100.0% 47,717 $ 11.6% 100.0% 363,451 $ 100.0% RECE IVABLE TOTAL LOANS LOANS RECEIVABLE PRINCIPAL MATURITIES Near Term Lease and Loan Maturities: Five leases and three loans in 2025 with an annualized GAAP income totaling $7.0 million(3) Six leases and one loan in 2026 with an annualized GAAP income totaling $20.1 million(4) Three leases and one loan in 2027 with an annualized GAAP income totaling $14.4 million As of December 31, 2024, approximately 92% of owned properties are covered under master leases and approximately 92% of rental revenues come from master leases or cross-default leases. |
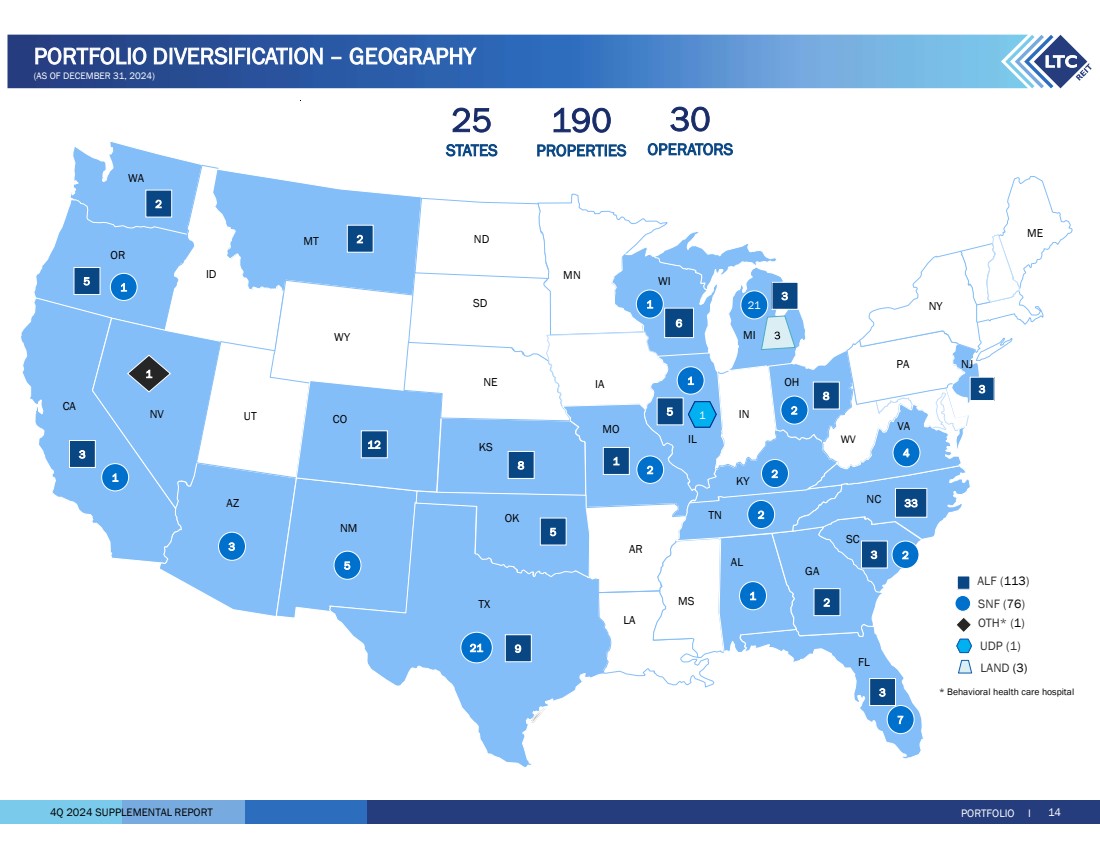
| 4Q 2024 SUPPLEMENTAL REPORT PORTFOLIO I 14 PORTFOLIO DIVERSIFICATION – GEOGRAPHY (AS OF DECEMBER 31, 2024) * Behavioral health care hospital SNF (76) ALF (113) OTH* (1) LAND (3) UDP (1) 25 STATES 190 PROPERTIES 30 OPERATORS CA WA ME NV WY IL AR WV ND NY OR AZ NM TX UT ID MT SD NE KS OK MS MN WI FL AL GA SC TN MO IA IN OH PA NJ NC VA CO KY 7 21 1 1 3 1 2 4 2 1 3 5 9 33 3 8 8 12 5 3 21 2 5 6 1 2 2 5 LA 2 2 3 MI 2 1 1 1 3 |
| 4Q 2024 SUPPLEMENTAL REPORT 46.0% 18.6% 25.6% 7.1% 2.7% 0.0% 50.0% 100.0% MSAs 1-31 MSAs 32-100 MSAs > 100 Cities in Micro-SA Cities not in MSA or Micro-SA 22 years 16 years 0 10 20 30 40 Skilled Nursing Assisted Living Years (1) The MSA rank by population as of July 1, 2023, as estimated by the United States Census Bureau. Approximately 65% of our properties are in the top 100 MSAs. Includes only our real estate investments. (1) As calculated from construction date or major renovation/expansion date. Includes only our real estate investments. GROSS PORTFOLIO BY MSA (1) AVERAGE PORTFOLIO AGE (1) PORTFOLIO I 15 PORTFOLIO DIVERSIFICATION – GEOGRAPHY (25 STATES) (AS OF DECEMBER 31, 2024, DOLLAR AMOUNTS IN THOUSANDS) # OF STATE( 1) PROPERTIES % ALF % SNF % % Texas 30 318,133 $ 15.3% 48,068 $ 4.3% 270,065 $ 28.2% — $ — North Carolina 33 301,468 14.5% 301,468 27.1% — — — — Michigan 24 290,450 13.9% 34,482 3.1% 255,025 26.7% 943 7.9% Ohio 10 144,353 6.9% 90,129 8.1% 54,224 5.7% — — Florida 10 130,174 6.3% 20,706 1.9% 109,468 11.4% — — Illinois 6 106,162 5.1% 89,662 8.0% 16,500 1.7% — — Colorado 12 102,381 4.9% 102,381 9.2% — — — — Wisconsin 7 93,844 4.5% 79,898 7.2% 13,946 1.5% — — California 4 69,717 3.3% 52,085 4.7% 17,632 1.8% — — Kansas 8 60,279 2.9% 60,279 5.4% — — — — All Others(3) 465,935 46 22.4% 234,280 21.0% 220,593 23.0% 11,062 92.1% Total 190 2,082,896 $ 100.0% 1,113,438 $ 100.0% 957,453 $ 100.0% 12,005 $ 100.0% OTH(2) INVESTMENT GROSS GROSS INVESTMENT (1) Due to master leases with properties in various states, revenue by state is not available. Also, working capital notes are provided to certain operators under their master leases covering properties in various states. Therefore, the working capital notes outstanding balance totaling $5,717 is also not available by state. (2) Includes one behavioral health care hospital and three parcels for land held-for-use. (3) Subsequent to December 31, 2024, we sold an assisted living community in Oklahoma for $670. Upon sale, the property was removed from a master lease covering five assisted living properties in Oklahoma and rent under the master lease was not reduced as a result of the sale. |

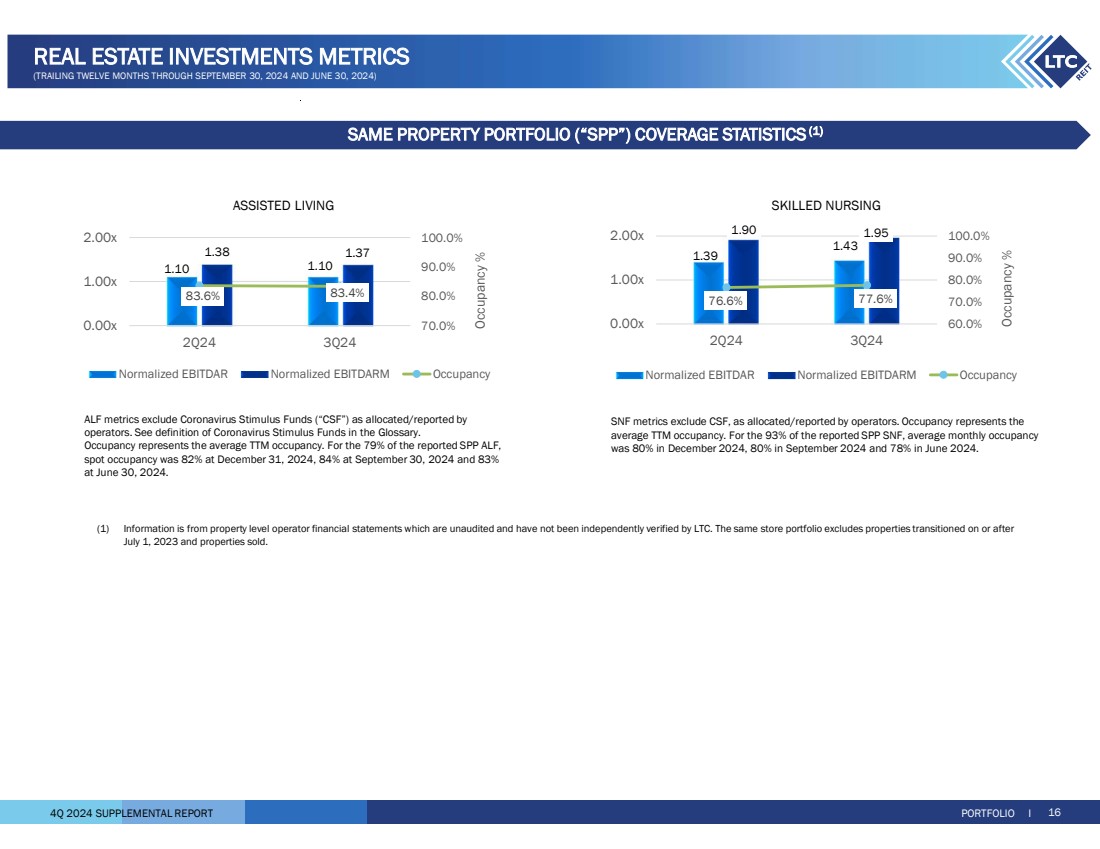
| 4Q 2024 SUPPLEMENTAL REPORT (1) Information is from property level operator financial statements which are unaudited and have not been independently verified by LTC. The same store portfolio excludes properties transitioned on or after July 1, 2023 and properties sold. ASSISTED LIVING SKILLED NURSING 1.39 1.43 1.90 1.95 76.6% 77.6% 60.0% 70.0% 80.0% 90.0% 100.0% 0.00x 1.00x 2.00x 2Q24 3Q24 Occupancy % Normalized EBITDAR Normalized EBITDARM Occupancy 1.10 1.10 1.38 1.37 83.6% 83.4% 70.0% 80.0% 90.0% 100.0% 0.00x 1.00x 2.00x 2Q24 3Q24 Occupancy % Normalized EBITDAR Normalized EBITDARM Occupancy SNF metrics exclude CSF, as allocated/reported by operators. Occupancy represents the average TTM occupancy. For the 93% of the reported SPP SNF, average monthly occupancy was 80% in December 2024, 80% in September 2024 and 78% in June 2024. ALF metrics exclude Coronavirus Stimulus Funds (“CSF”) as allocated/reported by operators. See definition of Coronavirus Stimulus Funds in the Glossary. Occupancy represents the average TTM occupancy. For the 79% of the reported SPP ALF, spot occupancy was 82% at December 31, 2024, 84% at September 30, 2024 and 83% at June 30, 2024. PORTFOLIO I 16 REAL ESTATE INVESTMENTS METRICS (TRAILING TWELVE MONTHS THROUGH SEPTEMBER 30, 2024 AND JUNE 30, 2024) SAME PROPERTY PORTFOLIO (“SPP”) COVERAGE STATISTICS(1) |
| 4Q 2024 SUPPLEMENTAL REPORT DECEMBER 31, 2024 Revolving line of credit - WA rate 6.0% (1) $ 144,350 Term loans, net of debt issue costs - WA rate 2.6% (2) 99,808 Senior unsecured notes, net of debt issue costs - WA rate 4.2% (3) 440,442 Total debt - WA rate 4.3% 684,600 30.3% No. of shares Closing Price Common stock 45,510,754 34.55 $ (4) 69.7% 1,572,397 Total Market Value 1,572,397 2,256,997 100.0% Add: Non-controlling interest 92,378 Less: Cash and cash equivalents (9,414) $ 2,339,961 Debt to Enterprise Value 29.3% Debt to Annualized Adjusted EBITDAre (5) 4.3x TOTAL VALUE ENTE RPRISE VALUE 12/31/24 CAPITALIZATION DEBT EQUITY FINANCIAL I 17 ENTERPRISE VALUE (AMOUNTS IN THOUSANDS, EXCEPT PER SHARE AMOUNTS AND NUMBER OF SHARES) (1) Subsequent to December 31, 2024, we borrowed $15,000 under our unsecured revolving line of credit. Accordingly, we have $159,350 outstanding with $265,650 available for borrowing. (2) Represents outstanding balance of $100,000, net of debt issue costs of $192. (3) Represents outstanding balance of $441,500, net of debt issue costs of $1,058. Subsequent to December 31, 2024, we repaid $7,000 in scheduled principal paydown on our senior unsecured notes. (4) Closing price of our common stock as reported by the NYSE on December 31, 2024, the last trading day of 4Q24. (5) See page 21 for Reconciliation of Annualized Adjusted EBITDAre. |

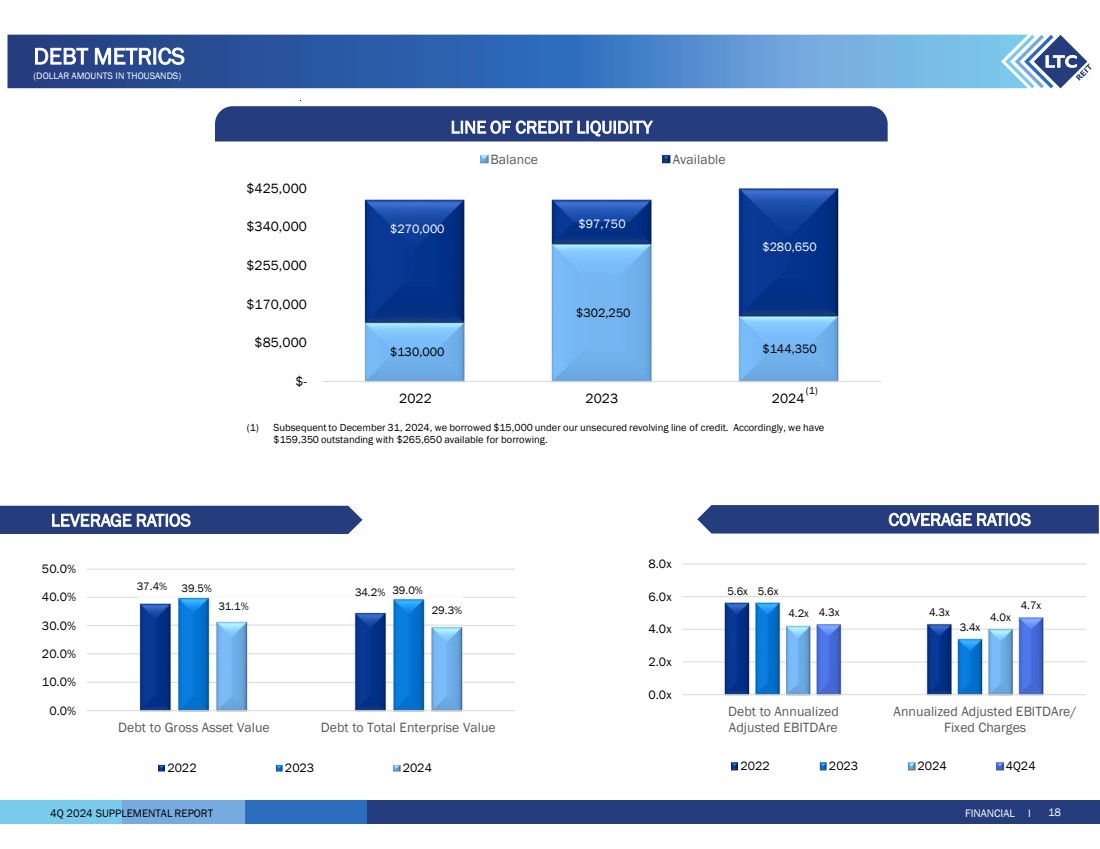
| 4Q 2024 SUPPLEMENTAL REPORT LEVERAGE RATIOS COVERAGE RATIOS LINE OF CREDIT LIQUIDITY FINANCIAL I 18 DEBT METRICS (DOLLAR AMOUNTS IN THOUSANDS) $130,000 $302,250 $144,350 $270,000 $97,750 $280,650 $- $85,000 $170,000 $255,000 $340,000 $425,000 2022 2023 2024 Balance Available 37.4% 34.2% 39.5% 39.0% 31.1% 29.3% 0.0% 10.0% 20.0% 30.0% 40.0% 50.0% Debt to Gross Asset Value Debt to Total Enterprise Value 2022 2023 2024 5.6x 4.3x 5.6x 3.4x 4.2x 4.0x 4.3x 4.7x 0.0x 2.0x 4.0x 6.0x 8.0x Debt to Annualized Adjusted EBITDAre Annualized Adjusted EBITDAre/ Fixed Charges 2022 2023 2024 4Q24 (1) Subsequent to December 31, 2024, we borrowed $15,000 under our unsecured revolving line of credit. Accordingly, we have $159,350 outstanding with $265,650 available for borrowing. (1) |
| 4Q 2024 SUPPLEMENTAL REPORT Senior Unsecured Notes 64.4% Term Loans 14.6% Revolving Line of Credit 21.0% $144,350 $50,000 $49,500 $50,000 $51,500 $54,500 $55,000 $63,000 $67,000 $56,000 $35,000 $10,000 $- $100,000 $200,000 $300,000 $400,000 2025 2026 2027 2028 2029 2030 2031 2032 Thereafter Revolving Line of Credit Term Loans Senior Unsecured Notes DEBT STRUCTURE (2) FINANCIAL I 19 DEBT MATURITY (AS OF DECEMBER 31, 2024, DOLLAR AMOUNTS IN THOUSANDS) REVOLVING SENIOR LINE OF TERM UNSECURED % OF YEAR CREDIT LO ANS(2 ) NOTES(2 ) TOTAL TOTAL 2025 — $ 50,000 $ 49,500 $ 99,500 $ 14.5% 2026 144,350 (1) 51,500 50,000 245,850 35.8% 2027 — 54,500 54,500 7.9% 2028 — — 55,000 55,000 8.0% 2029 — — 63,000 63,000 9.2% 2030 — — 67,000 67,000 9.8% 2031 — — 56,000 56,000 8.2% 2032 — — 35,000 35,000 5.1% Thereafter — — 10,000 10,000 1.5% Total 144,350 $ 100,000 $ (3) $ 441,500 (3) $ 100.0% 685,850 (1) Subsequent to December 31, 2024, we borrowed $15,000 under our unsecured revolving line of credit. Accordingly, we have $159,350 outstanding with $265,650 available for borrowing. (2) Reflects scheduled principal payments. (3) Excludes debt issue costs which are netted against the principal outstanding in the term loans and senior unsecured notes balance on our Consolidated Balance Sheets shown on page 23. Subsequent to December 31, 2024, we repaid $7,000 in scheduled principal paydown on our senior unsecured notes. |

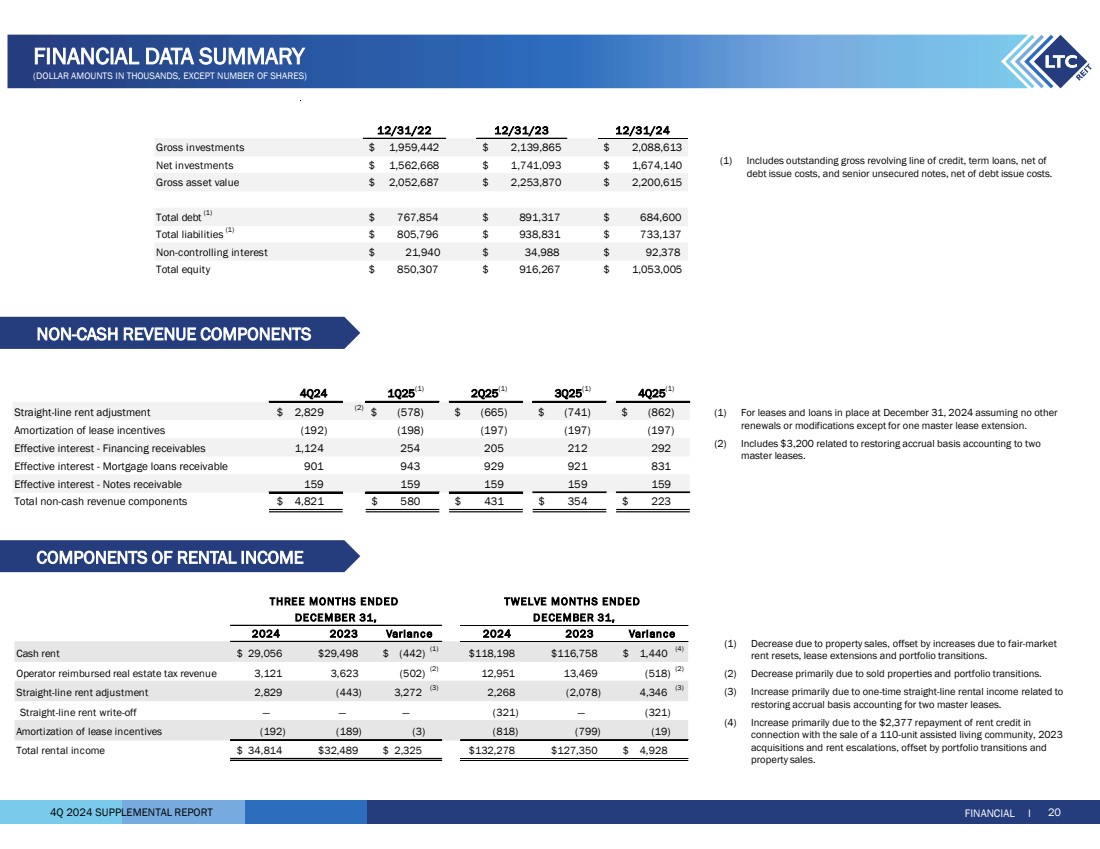
| 4Q 2024 SUPPLEMENTAL REPORT (1) For leases and loans in place at December 31, 2024 assuming no other renewals or modifications except for one master lease extension. (2) Includes $3,200 related to restoring accrual basis accounting to two master leases. (1) Decrease due to property sales, offset by increases due to fair-market rent resets, lease extensions and portfolio transitions. (2) Decrease primarily due to sold properties and portfolio transitions. (3) Increase primarily due to one-time straight-line rental income related to restoring accrual basis accounting for two master leases. (4) Increase primarily due to the $2,377 repayment of rent credit in connection with the sale of a 110-unit assisted living community, 2023 acquisitions and rent escalations, offset by portfolio transitions and property sales. COMPONENTS OF RENTAL INCOME FINANCIAL I 20 FINANCIAL DATA SUMMARY (DOLLAR AMOUNTS IN THOUSANDS, EXCEPT NUMBER OF SHARES) 12/31/22 12/31/23 12/31/24 Gross investments $ 1,959,442 $ 2,139,865 $ 2,088,613 Net investments $ 1,562,668 $ 1,741,093 $ 1,674,140 Gross asset value $ 2,052,687 $ 2,253,870 $ 2,200,615 Total debt (1) $ 767,854 $ 891,317 $ 684,600 Total liabilities (1) $ 805,796 $ 938,831 $ 733,137 Non-controlling interest $ 21,940 $ 34,988 $ 92,378 Total equity $ 850,307 $ 916,267 $ 1,053,005 Cash rent 29,056 $ 29,498 $ (442) $ (1) $ 116,758 118,198 $ 1,440 $ (4) Operator reimbursed real estate tax revenue 3,121 3,623 (502) (2) 12,951 13,469 (518) (2) Straight-line rent adjustment 2,829 (443) 3,272 (3) 2,268 (2,078) 4,346 (3) Straight-line rent write-off — — — (321) — (321) Amortization of lease incentives (192) (189) (3) (818) (799) (19) Total rental income 34,814 $ 32,489 $ 2,325 $ 132,278 $ 127,350 $ 4,928 $ 2024 2023 2024 2023 Varianc e Variance THREE MONTHS ENDED TWELVE MONTHS ENDED DECEMBER 31, DECEMBER 31, (1) Includes outstanding gross revolving line of credit, term loans, net of debt issue costs, and senior unsecured notes, net of debt issue costs. NON-CASH REVENUE COMPONENTS 4Q24 1Q25(1) 2Q25(1) 3Q25(1) 4Q25(1) $ 2,829 (2) $ (665) (578) $ (741) $ (862) $ (198) (192) (197) (197) (197) 254 1,124 205 212 292 943 901 929 921 831 159 159 159 159 159 $ 580 4,821 $ 431 $ 354 $ 223 $ Effective interest - Mortgage loans receivable Effective interest - Notes receivable Straight-line rent adjustment Amortization of lease incentives Effective interest - Financing receivables Total non-cash revenue components |
| 4Q 2024 SUPPLEMENTAL REPORT RECONCILIATION OF ANNUALIZED ADJUSTED EBITDAre AND FIXED CHARGES FINANCIAL I 21 FINANCIAL DATA SUMMARY (DOLLAR AMOUNTS IN THOUSANDS) 12/31/24 Net income 100,584 $ 91,462 $ 94,879 $ 19,590 $ Less: Gain on sale of real estate, net (37,830) (37,296) (7,979) (1,097) Add: Impairment loss 3,422 15,775 6,953 6,953 Add: Interest expense 31,437 47,014 40,336 8,365 Add: Depreciation and amortization 37,496 37,416 36,367 9,194 EBITDAre 154,371 135,109 170,556 43,005 Add/less: Non-recurring items 824 (1) 3,823 (2) (8,907) (3) (3,379) (3) Adjusted EBITDAre $ 158,194 135,933 $ 161,649 $ 39,626 $ Interest expense 31,437 $ 47,014 $ 40,336 $ 8,365 $ Fixed charges 31,437 $ 47,014 $ 40,336 $ 8,365 $ Annualized Adjusted EBITDAre $ 158,504 Annualized Fixed Charges 33,460 $ Debt (net of debt issue costs) 767,854 $ 891,317 $ 684,600 $ 684,600 $ Debt to Annualized Adjusted EBITDAre 5.6x 5.6x 4.2x 4.3x Annualized Adjusted EBITDAre to Fixed Charges(4) 4.3x 3.4x 4.0x 4.7x FO R THE YEAR ENDED THREE MONTHS ENDED 12/31/22 12/31/23 12/31/24 (1) Represents a lease incentive balance write-off of $173 related to a closed property, a $1,332 provision for credit losses reserve related to the acquisition of three skilled nursing centers accounted for as a financing receivable, two mortgage loans and a mezzanine loan, and a lease termination fee of $500 paid to a former operator of 12 assisted living communities, offset by lease termination fee income of $1,181 received in connection with the sale of an assisted living community. (2) Includes the $3,561 note receivable write-off related to the sale and transition of 10 assisted living communities and $1,832 of provision for credit losses related to the acquisition of 11 assisted living communities accounted for as a financing receivable and two mortgage loan originations, offset by the $1,570 exit IRR and prepayment fee received in 2023 in connection to the payoff of two mezzanine loans. (3) See the reconciliation of non-recurring items on page 25 for further detail. (4) Given we do not have preferred stock, our fixed charge coverage ratio and interest coverage ratio are the same. |

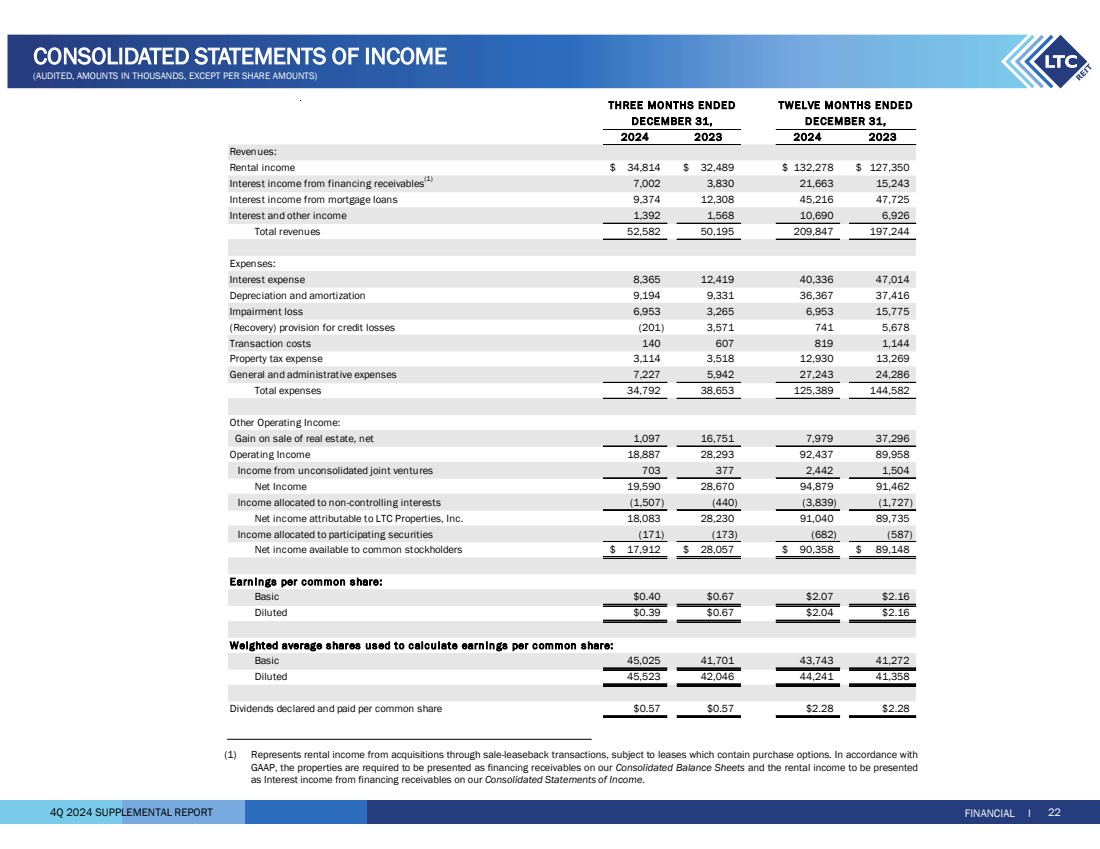
| 4Q 2024 SUPPLEMENTAL REPORT FINANCIAL I 22 CONSOLIDATED STATEMENTS OF INCOME (AUDITED, AMOUNTS IN THOUSANDS, EXCEPT PER SHARE AMOUNTS) 2024 2023 2024 2023 Revenues: Rental income 34,814 $ 32,489 $ 132,278 $ 127,350 $ Interest income from financing receivables(1) 7,002 3,830 21,663 15,243 Interest income from mortgage loans 9,374 12,308 45,216 47,725 Interest and other income 1,392 1,568 10,690 6,926 Total revenues 52,582 50,195 209,847 197,244 Expenses: Interest expense 8,365 12,419 40,336 47,014 Depreciation and amortization 9,194 9,331 36,367 37,416 Impairment loss 6,953 3,265 6,953 15,775 (Recovery) provision for credit losses (201) 3,571 741 5,678 Transaction costs 140 607 819 1,144 Property tax expense 3,114 3,518 12,930 13,269 General and administrative expenses 7,227 5,942 27,243 24,286 Total expenses 34,792 38,653 125,389 144,582 Other Operating Income: Gain on sale of real estate, net 1,097 16,751 7,979 37,296 Operating Income 18,887 28,293 92,437 89,958 Income from unconsolidated joint ventures 703 377 2,442 1,504 Net Income 19,590 28,670 94,879 91,462 Income allocated to non-controlling interests (1,507) (440) (3,839) (1,727) Net income attributable to LTC Properties, Inc. 18,083 28,230 91,040 89,735 Income allocated to participating securities (171) (173) (682) (587) Net income available to common stockholders 17,912 $ 28,057 $ 90,358 $ 89,148 $ Earn ings per common s hare: Basic $0.40 $0.67 $2.07 $2.16 Diluted $0.39 $0.67 $2.04 $2.16 Weighted average shares us ed to c alc ulate earn in gs per c ommon share: Basic 45,025 41,701 43,743 41,272 Diluted 45,523 42,046 44,241 41,358 Dividends declared and paid per common share $0.57 $0.57 $2.28 $2.28 THREE MONTHS ENDED DE CEMBER 31, DECEMBER 31, TWELVE MONTHS ENDED (1) Represents rental income from acquisitions through sale-leaseback transactions, subject to leases which contain purchase options. In accordance with GAAP, the properties are required to be presented as financing receivables on our Consolidated Balance Sheets and the rental income to be presented as Interest income from financing receivables on our Consolidated Statements of Income. |
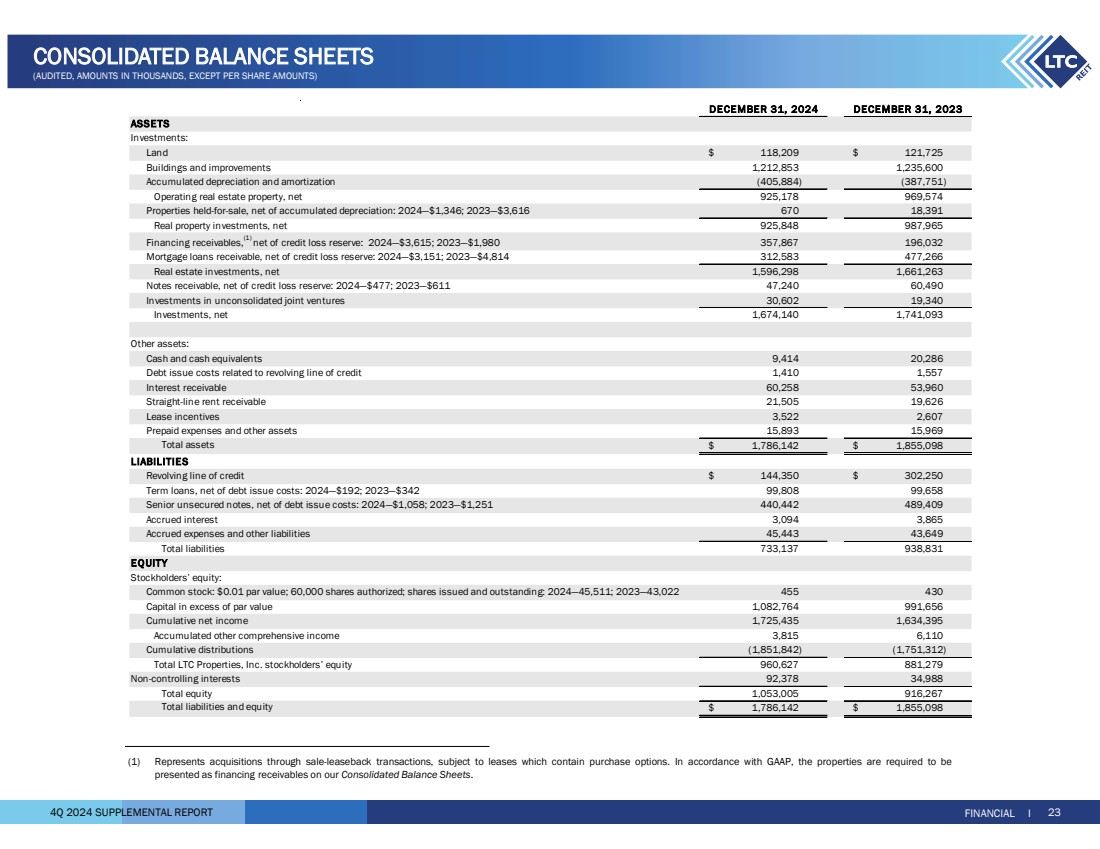
| 4Q 2024 SUPPLEMENTAL REPORT FINANCIAL I 23 CONSOLIDATED BALANCE SHEETS (AUDITED, AMOUNTS IN THOUSANDS, EXCEPT PER SHARE AMOUNTS) ASSETS Investments: Land $ 118,209 $ 121,725 Buildings and improvements 1,212,853 1,235,600 Accumulated depreciation and amortization (405,884) (387,751) Operating real estate property, net 925,178 969,574 Properties held-for-sale, net of accumulated depreciation: 2024—$1,346; 2023—$3,616 670 18,391 Real property investments, net 925,848 987,965 Financing receivables,(1) net of credit loss reserve: 2024—$3,615; 2023—$1,980 357,867 196,032 Mortgage loans receivable, net of credit loss reserve: 2024—$3,151; 2023—$4,814 312,583 477,266 Real estate investments, net 1,596,298 1,661,263 Notes receivable, net of credit loss reserve: 2024—$477; 2023—$611 47,240 60,490 Investments in unconsolidated joint ventures 30,602 19,340 Investments, net 1,674,140 1,741,093 Other assets: Cash and cash equivalents 9,414 20,286 Debt issue costs related to revolving line of credit 1,410 1,557 Interest receivable 60,258 53,960 Straight-line rent receivable 21,505 19,626 Lease incentives 3,522 2,607 Prepaid expenses and other assets 15,893 15,969 Total assets $ 1,786,142 $ 1,855,098 LIABILITIES Revolving line of credit $ 144,350 $ 302,250 Term loans, net of debt issue costs: 2024—$192; 2023—$342 99,808 99,658 Senior unsecured notes, net of debt issue costs: 2024—$1,058; 2023—$1,251 440,442 489,409 Accrued interest 3,094 3,865 Accrued expenses and other liabilities 45,443 43,649 Total liabilities 733,137 938,831 EQ UITY Stockholders’ equity: Common stock: $0.01 par value; 60,000 shares authorized; shares issued and outstanding: 2024—45,511; 2023—43,022 455 430 Capital in excess of par value 1,082,764 991,656 Cumulative net income 1,725,435 1,634,395 Accumulated other comprehensive income 3,815 6,110 Cumulative distributions (1,851,842) (1,751,312) Total LTC Properties, Inc. stockholders’ equity 960,627 881,279 Non-controlling interests 92,378 34,988 Total equity 1,053,005 916,267 Total liabilities and equity $ 1,786,142 $ 1,855,098 DECEMBER 31, 2024 DECEMBER 31, 2023 (1) Represents acquisitions through sale-leaseback transactions, subject to leases which contain purchase options. In accordance with GAAP, the properties are required to be presented as financing receivables on our Consolidated Balance Sheets. |
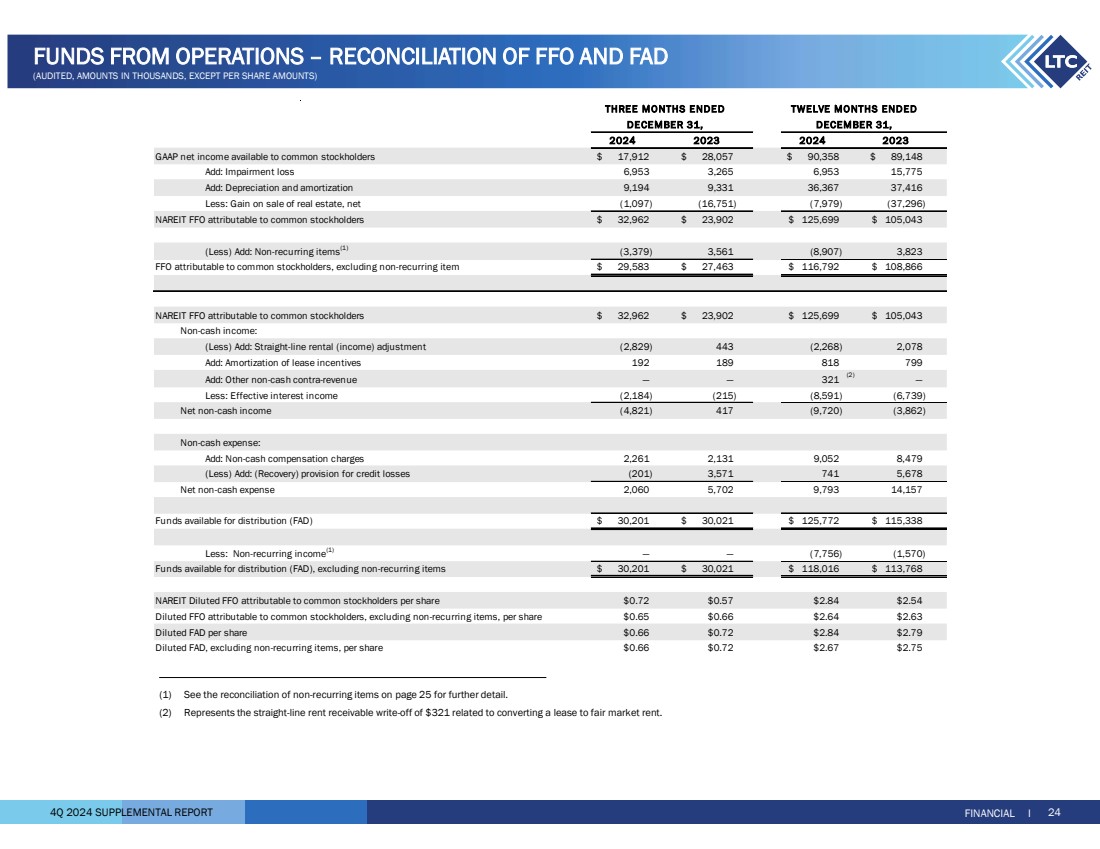
| 4Q 2024 SUPPLEMENTAL REPORT FINANCIAL I 24 FUNDS FROM OPERATIONS – RECONCILIATION OF FFO AND FAD (AUDITED, AMOUNTS IN THOUSANDS, EXCEPT PER SHARE AMOUNTS) 2024 2023 2024 2023 GAAP net income available to common stockholders 17,912 $ 28,057 $ 90,358 $ 89,148 $ Add: Impairment loss 6,953 3,265 6,953 15,775 Add: Depreciation and amortization 9,194 9,331 36,367 37,416 Less: Gain on sale of real estate, net (1,097) (16,751) (7,979) (37,296) NAREIT FFO attributable to common stockholders 32,962 $ 23,902 $ 125,699 $ 105,043 $ (Less) Add: Non-recurring items(1) 3,561 (3,379) (8,907) 3,823 $ 27,463 29,583 $ 116,792 $ 108,866 $ NAREIT FFO attributable to common stockholders 32,962 $ 23,902 $ 125,699 $ 105,043 $ Non-cash income: (Less) Add: Straight-line rental (income) adjustment (2,829) 443 (2,268) 2,078 Add: Amortization of lease incentives 192 189 818 799 Add: Other non-cash contra-revenue — — 321 (2) — Less: Effective interest income (2,184) (215) (8,591) (6,739) Net non-cash income (4,821) 417 (9,720) (3,862) Non-cash expense: Add: Non-cash compensation charges 2,261 2,131 9,052 8,479 (Less) Add: (Recovery) provision for credit losses (201) 3,571 741 5,678 Net non-cash expense 2,060 5,702 9,793 14,157 Funds available for distribution (FAD) 30,201 $ 30,021 $ 125,772 $ 115,338 $ Less: Non-recurring income(1) — — (7,756) (1,570) Funds available for distribution (FAD), excluding non-recurring items 30,201 $ 30,021 $ 118,016 $ 113,768 $ $0.72 $0.57 $2.84 $2.54 $0.65 $0.66 $2.64 $2.63 $0.66 $0.72 $2.84 $2.79 $0.66 $0.72 $2.67 $2.75 NAREIT Diluted FFO attributable to common stockholders per share Diluted FFO attributable to common stockholders, excluding non-recurring items, per share Diluted FAD per share Diluted FAD, excluding non-recurring items, per share FFO attributable to common stockholders, excluding non-recurring item THREE MONTHS ENDED TWELVE MONTHS ENDED DECEMBER 31, DECEMBER 31, (1) See the reconciliation of non-recurring items on page 25 for further detail. (2) Represents the straight-line rent receivable write-off of $321 related to converting a lease to fair market rent. |
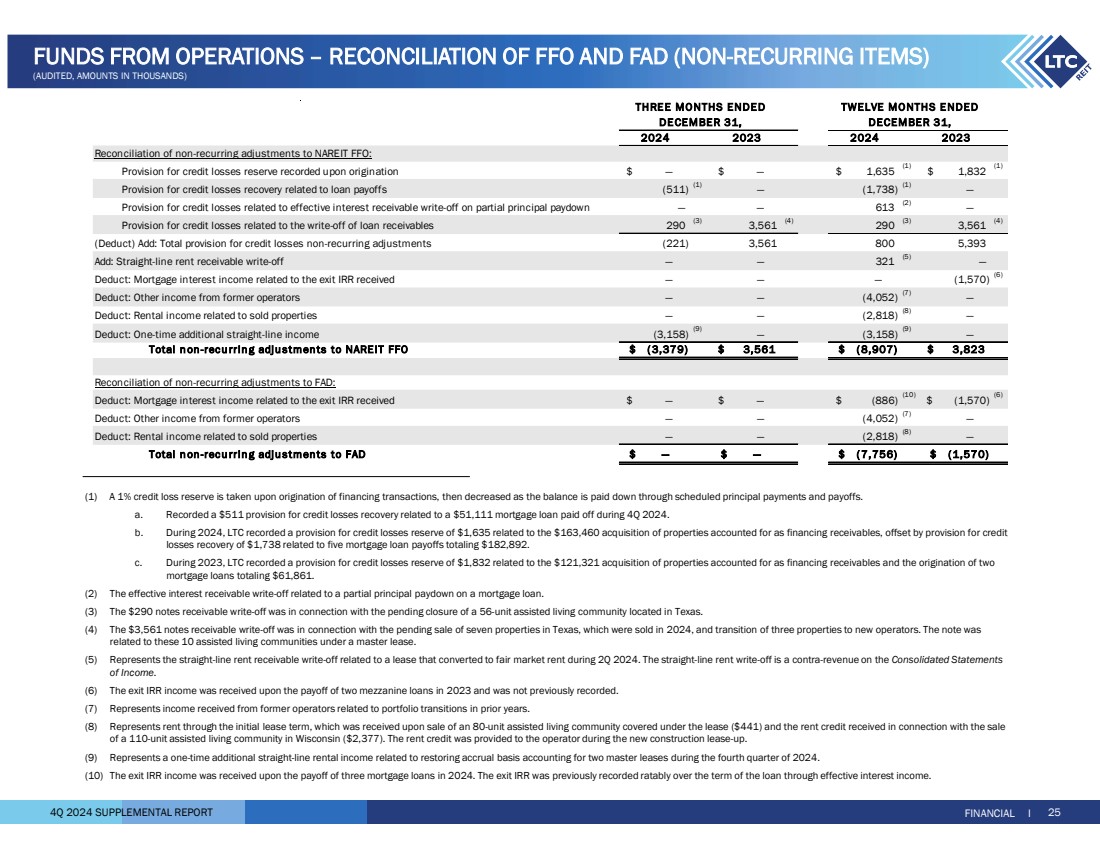
| 4Q 2024 SUPPLEMENTAL REPORT 2024 2023 2024 2023 Reconciliation of non-recurring adjustments to NAREIT FFO: Provision for credit losses reserve recorded upon origination — $ — $ 1,635 $ (1) $ 1,832 (1) Provision for credit losses recovery related to loan payoffs (511) (1) (1,738) — (1) — — — 613 (2) — Provision for credit losses related to the write-off of loan receivables 290 (3) 3,561 (4) 290 (3) 3,561 (4) (Deduct) Add: Total provision for credit losses non-recurring adjustments (221) 3,561 800 5,393 Add: Straight-line rent receivable write-off — — 321 (5) — Deduct: Mortgage interest income related to the exit IRR received — — — (1,570) (6) Deduct: Other income from former operators — — (4,052) (7) — Deduct: Rental income related to sold properties — — (2,818) (8) — Deduct: One-time additional straight-line income (3,158) (9) (3,158) — (9) — Total n on-recu rrin g adju stments to NAREIT FFO ( 3,379) $ 3,561 $ ( 8,907) $ 3,823 $ Reconciliation of non-recurring adjustments to FAD: Deduct: Mortgage interest income related to the exit IRR received — $ — $ (886) $ (10) $ (1,570) (6) Deduct: Other income from former operators — — (4,052) (7) — Deduct: Rental income related to sold properties — — (2,818) (8) — Total n on-recu rrin g adju stments to FAD — $ — $ ( 7,756) $ (1,570) $ Provision for credit losses related to effective interest receivable write-off on partial principal paydown DECEMBER 31, THRE E MONTHS ENDED TWELVE MONTHS E NDED DE CEMBER 31, FINANCIAL I 25 FUNDS FROM OPERATIONS – RECONCILIATION OF FFO AND FAD (NON-RECURRING ITEMS) (AUDITED, AMOUNTS IN THOUSANDS) (1) A 1% credit loss reserve is taken upon origination of financing transactions, then decreased as the balance is paid down through scheduled principal payments and payoffs. a. Recorded a $511 provision for credit losses recovery related to a $51,111 mortgage loan paid off during 4Q 2024. b. During 2024, LTC recorded a provision for credit losses reserve of $1,635 related to the $163,460 acquisition of properties accounted for as financing receivables, offset by provision for credit losses recovery of $1,738 related to five mortgage loan payoffs totaling $182,892. c. During 2023, LTC recorded a provision for credit losses reserve of $1,832 related to the $121,321 acquisition of properties accounted for as financing receivables and the origination of two mortgage loans totaling $61,861. (2) The effective interest receivable write-off related to a partial principal paydown on a mortgage loan. (3) The $290 notes receivable write-off was in connection with the pending closure of a 56-unit assisted living community located in Texas. (4) The $3,561 notes receivable write-off was in connection with the pending sale of seven properties in Texas, which were sold in 2024, and transition of three properties to new operators. The note was related to these 10 assisted living communities under a master lease. (5) Represents the straight-line rent receivable write-off related to a lease that converted to fair market rent during 2Q 2024. The straight-line rent write-off is a contra-revenue on the Consolidated Statements of Income. (6) The exit IRR income was received upon the payoff of two mezzanine loans in 2023 and was not previously recorded. (7) Represents income received from former operators related to portfolio transitions in prior years. (8) Represents rent through the initial lease term, which was received upon sale of an 80-unit assisted living community covered under the lease ($441) and the rent credit received in connection with the sale of a 110-unit assisted living community in Wisconsin ($2,377). The rent credit was provided to the operator during the new construction lease-up. (9) Represents a one-time additional straight-line rental income related to restoring accrual basis accounting for two master leases during the fourth quarter of 2024. (10) The exit IRR income was received upon the payoff of three mortgage loans in 2024. The exit IRR was previously recorded ratably over the term of the loan through effective interest income. |
| 4Q 2024 SUPPLEMENTAL REPORT FOR THE THREE MO NTHS ENDED DECEMBER 31, FFO/FAD attributable to common stockholders 32,962 $ 23,902 $ 30,201 $ 30,021 $ Non-recurring one-time items(1) 3,561 (3,379) — — FFO/FAD attributable to common stockholders excluding non-recurring items 29,583 27,463 30,201 30,021 Effect of dilutive securities: Participating securities 171 — 171 173 Diluted FFO/FAD excluding non-recurring items 29,754 $ 27,463 $ 30,372 $ 30,194 $ 41,701 45,025 45,025 41,701 Effect of dilutive securities: Performance-based stock units 498 86 498 86 Participating securities 301 — 301 259 Shares for diluted FFO/FAD per share 45,824 41,787 45,824 42,046 FOR THE TWELVE MO NTHS ENDED DECEMBER 31, FFO/FAD attributable to common stockholders 125,699 $ 105,043 $ 125,772 $ 115,338 $ Non-recurring one-time items(1) 3,823 (8,907) (7,756) (1,570) FFO/FAD attributable to common stockholders excluding non-recurring items 116,792 108,866 118,016 113,768 Effect of dilutive securities: Participating securities 682 587 682 587 Diluted FFO/FAD excluding non-recurring items 117,474 $ 109,453 $ 118,698 $ 114,355 $ 41,272 43,743 43,743 41,272 Effect of dilutive securities: Performance based stock units 498 86 498 86 Participating securities 296 256 296 256 Shares for diluted FFO/FAD per share 44,537 41,614 44,537 41,614 FAD 2024 2023 2024 2023 Shares for basic FFO/FAD per share 2024 2023 2023 Shares for basic FFO/FAD per share FFO FAD 2024 FFO FINANCIAL I 26 FUNDS FROM OPERATIONS – RECONCILIATION OF FFO PER SHARE (AUDITED, AMOUNTS IN THOUSANDS) (1) See the reconciliation of non-recurring items on page 25 for further detail. |

| 4Q 2024 SUPPLEMENTAL REPORT Annualized Actual Cash Income: Represents annualized cash rental income includes cash rent (excluding real estate tax reimbursement), interest income from financing receivables, mortgage loans, mezzanine loans and working capital notes, and income from unconsolidated joint ventures received for the month of December 2024 for investments as of December 31, 2024. Annualized Contractual Cash Income: Represents annualized contractual cash rental income prior to abatements & deferred rent repayment (excluding real estate tax reimbursement), interest income from financing receivables, mortgage loans, mezzanine loans and working capital notes, and income from unconsolidated joint ventures for the month of December 2024 for investments as of December 31, 2024. Annualized GAAP Income: Represents annualized GAAP rent which includes contractual cash rent, straight-line rent and amortization of lease incentives (excluding real estate tax reimbursement), GAAP interest income from financing receivables, mortgage loans, mezzanine loans and working capital notes, and income from unconsolidated joint ventures for the month of December 2024 for investments as of December 31, 2024. Assisted Living Communities (“ALF”): The ALF portfolio consists of assisted living, independent living, and/or memory care properties. (See Independent Living and Memory Care) Assisted living properties are seniors housing properties serving elderly persons who require assistance with activities of daily living, but do not require the constant supervision skilled nursing properties provide. Services are usually available 24 hours a day and include personal supervision and assistance with eating, bathing, grooming and administering medication. The facilities provide a combination of housing, supportive services, personalized assistance and health care designed to respond to individual needs. Contractual Lease Rent: Rental revenue as defined by the lease agreement between us and the operator for the lease year. Coronavirus Stimulus Funds (“CSF”): CSF includes funding from various state and federal programs to support healthcare providers in dealing with the challenges of the coronavirus pandemic. Included in CSF are state-specific payments identified by operators as well as federal payments connected to the Paycheck Protection Program and the Provider Relief Fund. CSF is self-reported by operators in unaudited financial statements provided to LTC. Specifically excluded from CSF are the suspension of the Medicare sequestration cut, and increases to the Federal Medical Assistance Percentages (FMAP), both of which are reflected in reported coverage both including and excluding CSF. Earnings Before Interest, Tax, Depreciation and Amortization for Real Estate (“EBITDAre”): As defined by the National Association of Real Estate Investment Trusts (“NAREIT”), EBITDAre is calculated as net income (computed in accordance with GAAP) excluding (i) interest expense, (ii) income tax expense, (iii) real estate depreciation and amortization, (iv) impairment write-downs of depreciable real estate, (v) gains or losses on the sale of depreciable real estate, and (vi) adjustments for unconsolidated partnerships and joint ventures. Financing Receivables: Properties acquired through a sale-leaseback transaction with an operating entity being the same before and after the sale-leaseback, subject to a lease contract that contains a purchase option. In accordance with GAAP, the purchased assets are required to be presented as Financing Receivables on our Consolidated Balance Sheets and the rental income to be presented as Interest income from financing receivables on our Consolidated Statements of Income. Funds Available for Distribution (“FAD”): FFO excluding the effects of straight-line rent, amortization of lease costs, effective interest income, provision for credit losses, non-cash compensation charges and non-cash interest charges. Funds From Operations (“FFO”): As defined by NAREIT, net income available to common stockholders (computed in accordance with U.S. GAAP) excluding gains or losses on the sale of real estate and impairment write-downs of depreciable real estate plus real estate depreciation and amortization, and after adjustments for unconsolidated partnerships and joint ventures. GAAP Lease Yield: GAAP rent divided by the sum of the purchase price and transaction costs. GAAP Rent: Total rent we will receive as a fixed amount over the initial term of the lease and recognized evenly over that term. GAAP rent recorded in the early years of a lease is higher than the cash rent received and during the later years of the lease, the cash rent received is higher than GAAP rent recognized. GAAP rent is commonly referred to as straight-line rental income. Gross Asset Value: The carrying amount of total assets after adding back accumulated depreciation and loan loss reserves, as reported in the company’s consolidated financial statements. Gross Investment: Original price paid for an asset plus capital improvements funded by LTC, without any deductions for depreciation or provision for credit losses. Gross Investment is commonly referred to as undepreciated book value. Independent Living Communities (“ILF”): Seniors housing properties offering a sense of community and numerous levels of service, such as laundry, housekeeping, dining options/meal plans, exercise and wellness programs, transportation, social, cultural and recreational activities, on-site security and emergency response programs. Many offer on-site conveniences like beauty/barber shops, fitness facilities, game rooms, libraries and activity centers. ILFs are also known as retirement communities or seniors apartments. Interest Income: Represents interest income from mortgage loans and other notes. Licensed Beds/Units: The number of beds and/or units that an operator is authorized to operate at seniors housing and long-term care properties. Licensed beds and/or units may differ from the number of beds and/or units in service at any given time. Memory Care Communities (“MC”): Seniors housing properties offering specialized options for seniors with Alzheimer’s disease and other forms of dementia. These facilities offer dedicated care and specialized programming for various conditions relating to memory loss in a secured environment that is typically smaller in scale and more residential in nature than traditional assisted living facilities. These facilities have staff available 24 hours a day to respond to the unique needs of their residents. Metropolitan Statistical Areas (“MSA”): Based on the U.S. Census Bureau, MSA is a geographic entity defined by the Office of Management and Budget (OMB) for use by Federal statistical agencies in collecting, tabulating, and publishing Federal statistics. A metro area contains a core urban area of 50,000 or more population. MSAs 1 to 31 have a population of 19.8M – 2.2M. MSAs 32 to 100 have a population of 2.2M – 0.6M. MSAs greater than 100 have a population of 0.6M – 59K. Cities in a Micro-SA have a population of 223K – 12K. Cities not in a MSA has population of less than 100K. GLOSSARY I 27 GLOSSARY |
| 4Q 2024 SUPPLEMENTAL REPORT Mezzanine: In certain circumstances, the Company strategically allocates a portion of its capital deployment toward mezzanine loans to grow relationships with operating companies that have not typically utilized sale-leaseback financing as a component of their capital structure. Mezzanine financing sits between senior debt and common equity in the capital structure, and typically is used to finance development projects, value-add opportunities on existing operational properties, partnership buy-outs and recapitalization of equity. We seek market-based, risk-adjusted rates of return typically between 9% to 14% with the loan term typically between three to 10 years. Security for mezzanine loans can include all or a portion of the following credit enhancements; secured second mortgage, pledge of equity interests and personal/corporate guarantees. Mezzanine loans can be recorded for GAAP purposes as either a loan or joint venture depending upon specifics of the loan terms and related credit enhancements. Micropolitan Statistical Areas (“Micro-SA”): Based on the U.S. Census Bureau, Micro-SA is a geographic entity defined by the Office of Management and Budget (OMB) for use by Federal statistical agencies in collecting, tabulating, and publishing Federal statistics. A micro area contains an urban core of at least 10,000 population. Mortgage Loan: Mortgage financing is provided on properties based on our established investment underwriting criteria and secured by a first mortgage. Subject to underwriting, additional credit enhancements may be required including, but not limited to, personal/corporate guarantees and debt service reserves. When possible, LTC attempts to negotiate a purchase option to acquire the property at a future time and lease the property back to the borrower. Net Real Estate Assets: Gross real estate investment less accumulated depreciation. Net Real Estate Asset is commonly referred to as Net Book Value (“NBV”). Non-cash Revenue: Straight-line rental income, amortization of lease inducement and effective interest. Non-cash Compensation Charges: Vesting expense relating to stock options and restricted stock. Normalized EBITDAR Coverage: The trailing twelve month’s earnings from the operator financial statements adjusted for non-recurring, infrequent, or unusual items and before interest, taxes, depreciation, amortization, and rent divided by the operator’s contractual lease rent. Management fees are imputed at 5% of revenues. Normalized EBITDARM Coverage: The trailing twelve month’s earnings from the operator financial statements adjusted for non-recurring, infrequent, or unusual items and before interest, taxes, depreciation, amortization, rent, and management fees divided by the operator’s contractual lease rent. Occupancy: The weighted average percentage of all beds and/or units that are occupied at a given time. The calculation uses the trailing twelve months and is based on licensed beds and/or units which may differ from the number of beds and/or units in service at any given time. Operator Financial Statements: Property level operator financial statements which are unaudited and have not been independently verified by us. Payor Source: LTC revenue by operator underlying payor source for the period presented. LTC is not a Medicaid or a Medicare recipient. Statistics represent LTC's rental revenues times operators' underlying payor source revenue percentage. Underlying payor source revenue percentage is calculated from property level operator financial statements which are unaudited and have not been independently verified by us. Private Pay: Private pay includes private insurance, HMO, VA, and other payors. Purchase Price: Represents the fair value price of an asset that is exchanged in an orderly transaction between market participants at the measurement date. An orderly transaction is a transaction that assumes exposure to the market for a period prior to the measurement date to allow for marketing activities that are usual and customary for transactions involving such assets; it is not a forced transaction (for example, a forced liquidation or distress sale). Real Estate Investments: Represents our investments in real property, financing receivables and mortgage loans receivable. Rental Income: Represents GAAP rent net of amortized lease inducement cost. Same Property Portfolio (“SPP”): Same property statistics allow for the comparative evaluation of performance across a consistent population of LTC’s leased property portfolio and the Prestige Healthcare mortgage loan portfolio. Our SPP is comprised of stabilized properties occupied and operated throughout the duration of the quarter-over-quarter comparison periods presented (excluding assets sold and assets held-for-sale). Accordingly, a property must be occupied and stabilized for a minimum of 15 months to be included in our SPP. Each property transitioned to a new operator has been excluded from SPP and will be added back to SPP for the SPP reporting period ending 15 months after the date of the transition. Skilled Nursing Properties (“SNF”): Seniors housing properties providing restorative, rehabilitative and nursing care for people not requiring the more extensive and sophisticated treatment available at acute care hospitals. Many SNFs provide ancillary services that include occupational, speech, physical, respiratory and IV therapies, as well as sub-acute care services which are paid either by the patient, the patient’s family, private health insurance, or through the federal Medicare or state Medicaid programs. Stabilized: Properties are generally considered stabilized upon the earlier of achieving certain occupancy thresholds (e.g. 80% for SNFs and 90% for ALFs) and, as applicable, 12 months from the date of acquisition/lease transition or, in the event of a de novo development, redevelopment, major renovations or addition, 24 months from the date the property is first placed in or returned to service, or properties acquired in lease-up. Trailing Twelve Months Revenues: For the owned portfolio, rental income includes cash rent, straight-line rent and amortization of lease incentives and excludes real estate tax reimbursement, straight-line rent write-off and rental income from properties sold during the trailing twelve months. Financing receivables revenue includes cash interest income and effective interest from financing receivables during the trailing twelve months. Mortgage loans revenue includes cash interest income and effective interest from mortgage loans and construction loans and excludes loan payoffs during the trailing twelve months. Notes receivables revenue includes cash interest income and effective interest from mezzanine loans and working capital notes and excludes loan payoffs during the trailing twelve months. Unconsolidated JV revenue includes income from our investments in joint ventures during the trailing twelve months. Under Development Properties (“UDP”): Development projects to construct seniors housing properties. GLOSSARY I 28 GLOSSARY |
