Exhibit 99.3
OFFERING CIRCULAR EXCERPTS
OFFERING CIRCULAR SUMMARY
This summary contains basic information about FTI Consulting, Inc. It likely does not contain all the information that is important to you. You should read the entire offering circular, including the consolidated financial statements and related notes thereto, before making an investment decision. Except as otherwise indicated herein, or as the context may otherwise require, the references to “FTI,” “we,” “us” and “our” refer to FTI Consulting, Inc., a Maryland corporation, and its subsidiaries after giving effect to the transactions described in this offering circular. Various financial terms, including “EBITDA” and “Adjusted EBITDA,” have the meanings set forth under “Summary Consolidated Financial Data and Other Operating Information.”
Our Company
We are a leading provider of forensic/litigation/technology (“forensic”), corporate finance/restructuring (“corporate finance”) and economic consulting services in the United States. Our experienced team of professionals, many of whom are widely recognized as experts in their respective fields, provide high-caliber consulting services to a broad range of clients. We began operations in 1982 as a consulting firm focused on providing forensic investigation, scientific and trial support services, and have evolved through internal growth and strategic acquisitions. We believe clients retain us because of our recognized expertise and capabilities in highly specialized areas, as well as our reputation for satisfying clients’ needs. During 2004, we staffed large and complex assignments for our clients which include 95 of the top 100 U.S. law firms, 20 of the 25 largest U.S. commercial banks and 181 corporate clients in the Fortune 500. Representative clients to date include Wyeth, Tower Automotive and the U.S. Departments of Justice and the Interior.
Our professionals have experience providing testimony in many areas, including: fraud, damages, lost profits, valuation, accountant’s liability and malpractice, contract disputes, patent infringement, price fixing, purchase price disputes, solvency and insolvency, fraudulent conveyance, preferences, disclosure statements, trademark and copyright infringement and the financial impact of government regulations. We have strong capabilities in highly specialized industries, including telecommunications, health care, transportation, utilities, chemicals, energy, commercial and investment banking, pharmaceuticals, tobacco, retail and information technology. As of June 30, 2005, we had 1,197 total employees, including 888 revenue-generating consultants, across 24 U.S. cities, London, England and Melbourne, Australia.
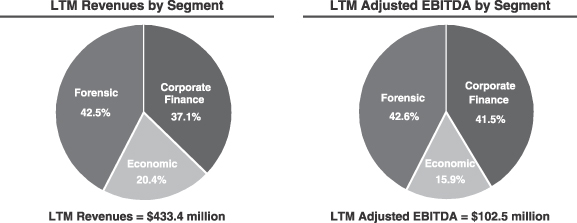
For the twelve months ended March 31, 2005 (the “LTM Period”), our total revenues were $433.4 million and our Adjusted EBITDA was $102.5 million. Revenues and Adjusted EBITDA by segment for the LTM Period are shown below. The adjustments to EBITDA are described in detail in the section titled “Summary Consolidated Financial Data and Other Operating Information” in the chart titled “Reconciliation of Net Income to Adjusted EBITDA.” Adjusted EBITDA percentages by segment are before allocation of corporate overhead expenses.
Forensic Practice
We are a leading provider of forensic consulting services in the United States. Through this practice we provide an extensive range of services to assist clients in all phases of litigation, including pre-filing, discovery, jury selection, trial preparation, expert testimony and other trial support services. Specifically, we help clients assess complex financial transactions, reconstruct events from incomplete and/or corrupt data, uncover vital evidence, identify potential claims and assist in the pursuit of financial recoveries and settlements. We also provide asset tracing and fraud investigation services. Through the use of proprietary information technology, we have demonstrated our ability to help control litigation costs, expedite the trial process and provide our clients with the ability to readily organize and access case-related data. Our repository services offer clients a secure extranet and web-hosting service for critical information. Our graphics services at trial and technology and electronic evidence experts assist clients in preparing for and presenting their cases in court. Beginning on February 28, 2005, through the acquisition of the Ringtail Solutions Group (“Ringtail”), a leading developer of litigation support and knowledge management technologies for law firms, Fortune 500 corporate legal departments, government agencies and courts, we are the direct provider of Ringtail services.
As of June 30, 2005, we had 423 revenue-generating consultants in our forensic practice.
Corporate Finance Practice
We believe we are the largest corporate finance consulting practice in the United States. We analyze, recommend and implement strategic alternatives for our corporate finance clients, offering services such as interim management in turnaround situations, rightsizing infrastructure, assessing long-term enterprise viability and business strategy consulting. We assist underperforming companies as they make decisions to improve their financial condition and operations. We lead and manage the financial aspects of in-court restructuring processes by offering services that include an assessment of the impact of a bankruptcy filing on the client’s financial condition and operations. We also assist our clients in planning for a smooth transition into and out of bankruptcy, facilitating the sale of assets and arranging debtor-in-possession financing. Our acquisition of Cambio Health Solutions (“Cambio”), a leading provider of management change solutions for hospital and health systems, in May of 2005, greatly enhanced our industry expertise in health care management and finance.
As of June 30, 2005, we had 310 revenue-generating consultants in our corporate finance practice.
Economic Consulting
We are a leading provider of economic consulting services in the United States and deliver sophisticated economic analysis and modeling of issues arising in mergers and acquisitions and other complex commercial and securities litigation. Our 2003 acquisition of the Lexecon business, a leading provider of economic consulting services in the United States, has greatly enhanced our market position within this practice and our ability to provide complex economic consulting services. Our statistical and economic experts help companies evaluate issues such as the economic impact of deregulation on a particular industry or the amount of commercial damages suffered by a business. We have deep industry experience in such areas as commercial and investment banking, telecommunications, energy, transportation and pharmaceuticals. Our professionals regularly provide expert testimony on damages, rates and prices, valuations, merger effects, intellectual property disputes in antitrust cases, regulatory proceedings and valuations.
As of June 30, 2005, we had 155 revenue-generating consultants in our economic consulting practice.
2
Industry Overview
We compete in the global consulting services industry, focusing on providing forensic, corporate finance and economic consulting services. There are a number of factors that drive demand for our services:
| | • | | Regulatory Complexity, Public Scrutiny and Increased Litigation.We believe that heightened focus on corporate mismanagement, fraud-related investigations, ongoing regulatory activity, such as SEC rulemaking, corporate governance scrutiny and increasing complexity in financial reporting requirements, including requirements under the Sarbanes-Oxley Act, drive demand for our services. We believe that increasing litigation costs require businesses to focus on better managing risks and the litigation process, particularly in large, complex, multi-jurisdiction cases and mass tort claims. |
| | • | | Increasing Need for Independent Expertise. We believe that as a result of increased public scrutiny, regulatory complexity and litigation, businesses, their creditors and other institutional stakeholders increasingly engage consulting firms to provide objective and independent expertise. This is particularly true in highly complex and sophisticated areas such as restructurings, bankruptcies, economic consulting, forensic accounting and high-stakes regulatory and legal proceedings. The emerging trend toward hiring consulting firms unaffiliated with company auditors represents a fundamental shift in the demand for our services and has benefited independent consulting firms such as ourselves. |
| | • | | Trends in Corporate Debt and Debt Default Rates. We believe that corporate debt levels and related default rates are important indicators of the potential need for restructuring, turnaround, bankruptcy and related consulting services. Both U.S. and international companies have increasingly relied on debt to finance acquisitions, growth initiatives and working capital requirements, as evidenced by the fact that 2004 saw more high yield issuances than any prior year. Demand for FTI’s services is particularly strong in sectors such as automotive, airline and retail, all of which rely on corporate debt and continue to exhibit sector weakness. |
| | • | | Strong Economy and Growing Merger and Acquisition Activity. We believe that the overall strength of the economy and the growth in merger and acquisition activity are important drivers for our economic consulting services. The United States has seen improving economic conditions, as evidenced by Gross Domestic Product growth of 4.4% from 2003 to 2004. Additionally, according toThomson Financial, announced U.S. merger and acquisition volume increased by 11% year-over-year for the first quarter of 2005. We believe there is more complex, high-stakes litigation and regulatory activity during strong economic conditions. During periods of increased merger and acquisition activity, we experience increased use of our economic consulting services driven by growing areas such as antitrust regulation, intellectual property disputes and breaches of contract. |
Our Competitive Strengths
We compete primarily on the basis of institutional and individual reputations, ability to immediately staff a significant engagement, performance record, quality of work, range of services provided and existing client relationships. We attribute our success and distinction to a combination of long-standing advantages, including:
| | • | | Premium Brand Name with Leading Market Positions.We believe that we are one of the most recognized brand names in the corporate finance consulting services industry. In addition, we believe we have leading market positions in both forensic and economic consulting practices based on revenues for those segments. The strength of our brand name and market positions are enhanced by the stellar reputation of our well-recognized consultants, |
3
| | many of whom are leading members of their respective fields. We have benefited from our strategy of acquiring the leading practitioners in each practice. Our acquisitions, in select cases, allow us the continued use of the brand names of the acquired companies, either independently or coupled with the FTI brand, such as Lexecon, Ten Eyck, Ringtail and Cambio. |
| | • | Diversified Revenue Source.We have created a balanced portfolio of services organized into three practice segments: forensic, corporate finance and economic consulting. Our strategy is to continue to maintain such diversification. We believe that our broad service offerings and diversity of our revenues insulate us from fluctuations in market conditions in any one of our practices. |
| | • | Diversified Portfolio of Elite Clients.We provide services for a diverse group of clients, many of whom are blue-chip corporations, financial institutions, law firms and private equity firms. In 2004, we performed work for approximately 1,300 clients on about 3,200 matters across multiple industries, including: |
| | • | | approximately 490 law firms, 95 of which were ranked among the top 100 U.S. law firms (based on 2004 U.S. revenues as measured byThe American Lawyer magazine); |
| | • | | 20 of the 25 largest U.S. commercial banks; |
| | • | | 181 corporate clients that were among the Fortune 500 in 2004; and |
| | • | | a broad range of federal, state and local government agencies. |
In 2004, our top 10 clients accounted for 17% of our total revenues, with no single client accounting for more than 3% of our total revenues and no single matter accounting for more than 1.8% of total revenues. Among these top 10 clients in 2004 were six nationally recognized law firms, each of whom represented multiple clients and matters.
| | • | High Level of Repeat and Referral Business.We derive a substantial portion of our revenues from repeat clients or referrals. In 2004, approximately 80% of our revenues was derived from repeat or referral business. Many of our client relationships are long-standing and include multiple contact points within each organization, increasing the depth and continuity of these relationships. We cultivate our critical relationships with financial institutions and law firms, which have served as entry points into significant, high-profile and reputation enhancing engagements. |
| | • | Strong Free Cash Flow.For the LTM Period, we generated revenues of $433.4 million and Adjusted EBITDA of $102.5 million. Our business model has several characteristics that produce strong cash flows including high margins, low capital expenditures and low working capital requirements. Our consistently strong free cash flow supports our acquisition and growth strategies and our ability to service our indebtedness. |
Our Business Strategy
The following are key elements of our business strategy:
| | • | Attract and Retain Highly Qualified Professionals.We have assembled a staff of 888 revenue-generating consultants, many of whom have established and widely recognized names in their respective practice areas. To attract and retain highly qualified professionals, we offer significant compensation opportunities, including incentive bonus and equity compensation, along with a competitive benefits package and the chance to work on challenging engagements. We have written employment arrangements with substantially all of our senior managing directors that include noncompetition and nonsolicitation clauses. |
4
| | • | | Optimize Utilization and Billing Rates of Our Professionals.We carefully monitor our utilization rates on a weekly, monthly and annual basis and have maintained average annual utilization rates between 77% and 88% for each of the last three years (based on approximately 2,024 available hours per year). Our goal is to manage growth in a way that maintains our current utilization rates. In addition, the nature of our services generally allows us to bill our professionals at premium rates, which enhances our profitability. |
| | • | | Leverage Our Relationships and Expertise.We believe that the strength of our existing client relationships and the quality of our reputation across our industry, coupled with our recognized industry expertise, successful track record and size, are the most critical elements in a decision to retain us. We strive to build client relationships on a company-wide basis and encourage cross-selling among our practices. By successfully leveraging our reputation, experience and broad client base, we expect to continue to obtain engagements from both existing and new clients. |
| | • | | Expand the Breadth of Our Services and Geographic Presence.We strive to offer our clients comprehensive solutions to their most complex problems, wherever they are in the world. Increasingly, our clients demand expertise across multiple markets and continents. To meet this demand, we provide our clients with a complete suite of services across all three practices. As we continue to grow, we plan to broaden our industry expertise and expand our electronic evidence and electronic repository services. We also intend to explore opportunities to increase our European presence to better serve our clients and to capitalize on what we believe are favorable market conditions. |
| | • | | Selectively Acquire Companies and Integrate Our New Professionals and Capabilities.We follow a disciplined approach to executing and integrating acquisitions, targeting those that complement our business strategy or operate in an attractive specialized niche. Since January of 1998, we have completed nine acquisitions that have greatly enhanced our practices. We intend to continue to selectively pursue strategic acquisitions. We seek to integrate acquisitions in a way that fosters organic growth and provides synergies or cross-practice sales opportunities. We also aim to structure our acquisitions to ensure that key individuals from the acquired company are retained and integrated after the transaction is executed. |
5
Summary Consolidated Financial Data and Other Operating Information
We have derived the following summary historical consolidated income statement, cash flow and other financial data for the years ended December 31, 2002, 2003 and 2004 from our consolidated financial statements, which have been audited by Ernst & Young LLP, an independent registered public accounting firm. We derived the summary historical consolidated income statement, cash flow and other financial data for the three months ended March 31, 2004 and 2005 and the summary consolidated balance sheet data as of March 31, 2005 from our unaudited consolidated financial statements. We prepared the summary unaudited interim financial data on a basis consistent with the audited consolidated financial statements as of and for the year ended December 31, 2004. In management’s opinion, the unaudited interim consolidated financial information reflects all adjustments that are necessary for a fair presentation of the results for the interim periods presented. All adjustments made were normal and recurring accruals. You should not expect the results of operations for the interim periods to necessarily be an indication of the results for a full year or any future period.
We have prepared the following summary unaudited pro forma consolidated income statement data for the year ended December 31, 2004 and for the three months ended March 31, 2005 giving effect to the Transactions, as if they had occurred on January 1, 2004. The unaudited pro forma condensed consolidated income statement data for the twelve months ended March 31, 2005, was derived by (1) combining our historical consolidated statement of income for the year ended December 31, 2004, with (2) our historical consolidated statement of income for the three months ended March 31, 2005 and (3) subtracting our consolidated statement of income for the three months ended March 31, 2004. The pro forma income statement data for the LTM Period gives effect to the Transactions as if they occurred on April 1, 2004.
As of March 31, 2005, the as adjusted consolidated balance sheet data reflects the Transactions as if they had occurred on March 31, 2005, but does not reflect the Call Spread.
For purposes of both income statement and balance sheet data, we have assumed a price of $21.00 per share for all common stock repurchased.
We have presented the unaudited pro forma financial data for informational purposes only. You should not consider the pro forma consolidated income statement and balance sheet data to be indicative of what the actual results would have been had the transactions described above been completed on the dates indicated nor should you expect the pro forma results to be an indication of the results of operations or financial condition as of any future date or for any future period. You should read the following data in conjunction with “Selected Financial Data,” “Unaudited Pro Forma Condensed Consolidated Financial Information,” “Management’s Discussion and Analysis of Financial Condition and Results of Operations” and the consolidated financial statements and related notes thereto included elsewhere in this offering circular.
EBITDA.We define EBITDA as net income before net interest, taxes, litigation settlements, depreciation and amortization. Our measure of EBITDA may not be similar to EBITDA measures of other companies. EBITDA is not a measurement under accounting principles generally accepted in the United States and should be considered in addition to, but not as a substitute for, the information contained in our income statement. EBITDA is a common alternative performance measure used by investors, analysts and credit rating agencies to evaluate and compare the operating performance and value of companies within our industry. We believe that EBITDA is useful to investors because it is an indicator of the strength and performance of our ongoing business operations, including our ability to fund capital expenditures and service debt. While depreciation and amortization are considered operating costs under generally accepted accounting principles, these expenses primarily represent
6
the non-cash current period allocation of costs associated with long-lived assets acquired or constructed in prior periods. We use EBITDA to evaluate and compare the operating performance of our segments and it is one of the primary measures we use to determine employee bonuses. We also use EBITDA to value businesses we consider acquiring. In addition, we believe that EBITDA is also indicative of our capacity to incur and service debt and thereby provides additional useful information to investors regarding our financial condition and results of operations.
Adjusted EBITDA.Adjusted EBITDA represents EBITDA excluding certain gains, losses and other charges that do not relate to the ongoing operations of our business. Adjusted EBITDA as defined above may not be similar to adjusted EBITDA measures of other companies. Adjusted EBITDA is not a measurement under accounting principles generally accepted in the United States and should be considered in addition to, but not as a substitute for, the information contained in our income statement. We believe that Adjusted EBITDA is useful to investors because it allows investors to evaluate our operating results and related financial performance for different periods on a more comparable basis by excluding items that do not relate to the ongoing operations of our business.
Total Debt to Adjusted EBITDA. For the three month periods, the total debt to adjusted EBITDA ratio is calculated by dividing long-term debt outstanding as of the end of the period by adjusted EBITDA for the three months then ended multiplied by four to approximate an annualized adjusted EBITDA.
Ratio of Earnings to Fixed Charges. For the purpose of computing the ratio of earnings to fixed charges, earnings consist of income from continuing operations, before income taxes plus fixed charges. Fixed charges consist of:
| | • | | interest on all indebtedness and amortization of deferred financing costs; and |
| | • | | the portion of rental expense that we believe is representative of interest. |
Our ratio of earnings to fixed charges on a pro forma basis for the year ended December 31, 2004, the three months ended March 31, 2005 and the LTM Period gives effect to the Transactions as if they occurred on January 1, 2004.
7
| | | | | | | | | | | | | | | | | | | | | | | | | | | | | | | | |
| | | | | | | | | Pro Forma
| |
| | | Year Ended December 31,
| | | Three Months Ended
| | | Year Ended December 31,
2004
| | | Three Months
Ended March 31,
2005
| | | LTM Period
Ended
March 31,
2005
| |
| | | 2002
| | | 2003
| | | 2004
| | | March 31,
2004
| | | March 31,
2005
| | | | |
| | | (dollars in thousands, except per share and average billable rate data) | |
| | | | | | | | | | | | (unaudited) | | | | | | (unaudited) | | | | |
INCOME STATEMENT DATA: | | | | | | | | | | | | | | | | | | | | | | | | | | | | | | | | |
Revenues | | $ | 224,113 | | | $ | 375,695 | | | $ | 427,005 | | | $ | 110,240 | | | $ | 116,614 | | | $ | 427,005 | | | $ | 116,614 | | | $ | 433,379 | |
Direct cost of revenues | | | 108,104 | | | | 176,429 | | | | 234,970 | | | | 61,898 | | | | 64,345 | | | | 234,970 | | | | 64,345 | | | | 237,417 | |
Selling, general and administrative expense | | | 51,647 | | | | 78,701 | | | | 102,060 | | | | 25,726 | | | | 28,457 | | | | 102,060 | | | | 28,457 | | | | 104,791 | |
Other operating expenses | | | 1,033 | | | | 6,740 | | | | 11,506 | | | | 1,721 | | | | 749 | | | | 11,506 | | | | 749 | | | | 10,534 | |
| | |
|
|
| |
|
|
| |
|
|
| |
|
|
| |
|
|
| |
|
|
| |
|
|
| |
|
|
|
Operating income | | | 63,329 | | | | 113,825 | | | | 78,469 | | | | 20,895 | | | | 23,063 | | | | 78,469 | | | | 23,063 | | | | 80,637 | |
Interest and other expenses, net | | | (4,717 | ) | | | (4,196 | ) | | | (6,086 | ) | | | (1,407 | ) | | | (1,555 | ) | | | (22,696 | ) | | | (5,240 | ) | | | (22,687 | ) |
Litigation settlement gains, net | | | — | | | | — | | | | 1,672 | | | | — | | | | — | | | | 1,672 | | | | — | | | | 1,672 | |
| | |
|
|
| |
|
|
| |
|
|
| |
|
|
| |
|
|
| |
|
|
| |
|
|
| |
|
|
|
Income from continuing operations before income tax provision | | | 58,612 | | | | 109,629 | | | | 74,055 | | | | 19,488 | | | | 21,508 | | | | 57,445 | | | | 17,823 | | | | 59,622 | |
Income tax provision | | | 23,704 | | | | 44,838 | | | | 31,177 | | | | 7,971 | | | | 9,033 | | | | 24,184 | | | | 7,485 | | | | 25,270 | |
| | |
|
|
| |
|
|
| |
|
|
| |
|
|
| |
|
|
| |
|
|
| |
|
|
| |
|
|
|
Income from continuing operations | | | 34,908 | | | | 64,791 | | | | 42,878 | | | | 11,517 | | | | 12,475 | | | | 33,261 | | | | 10,338 | | | | 34,352 | |
Income (loss) from discontinued operations | | | 2,254 | | | | (5,322 | ) | | | — | | | | — | | | | — | | | | — | | | | — | | | | — | |
| | |
|
|
| |
|
|
| |
|
|
| |
|
|
| |
|
|
| |
|
|
| |
|
|
| |
|
|
|
Net income | | $ | 37,162 | | | $ | 59,469 | | | $ | 42,878 | | | $ | 11,517 | | | $ | 12,475 | | | $ | 33,261 | | | $ | 10,338 | | | $ | 34,352 | |
| | |
|
|
| |
|
|
| |
|
|
| |
|
|
| |
|
|
| |
|
|
| |
|
|
| |
|
|
|
Earnings per common share—net income | | | | | | | | | | | | | | | | | | | | | | | | | | | | | | | | |
Basic | | $ | 1.16 | | | $ | 1.45 | | | $ | 1.02 | | | $ | 0.27 | | | $ | 0.29 | | | $ | 0.89 | | | $ | 0.28 | | | $ | 0.91 | |
| | |
|
|
| |
|
|
| |
|
|
| |
|
|
| |
|
|
| |
|
|
| |
|
|
| |
|
|
|
Diluted | | $ | 1.09 | | | $ | 1.41 | | | $ | 1.01 | | | $ | 0.27 | | | $ | 0.29 | | | $ | 0.88 | | | $ | 0.27 | | | $ | 0.90 | |
| | |
|
|
| |
|
|
| |
|
|
| |
|
|
| |
|
|
| |
|
|
| |
|
|
| |
|
|
|
CASH FLOW DATA: | | | | | | | | | | | | | | | | | | | | | | | | | | | | | | | | |
Net cash provided by (used in) operating activities | | $ | 80,657 | | | $ | 100,177 | | | $ | 58,443 | | | $ | (20,195 | ) | | $ | (15,509 | ) | | $ | 58,443 | | | $ | (15,509 | ) | | $ | 63,129 | |
Net cash used in investing activities | | | (156,386 | ) | | | (231,741 | ) | | | (13,693 | ) | | | (2,508 | ) | | | (18,636 | ) | | | (13,693 | ) | | | (18,636 | ) | | | (29,821 | ) |
Net cash provided by (used in) financing activities | | | 72,779 | | | | 127,423 | | | | (24,811 | ) | | | 19,831 | | | | 12,213 | | | | 22,689 | | | | 59,712 | | | | 15,071 | |
OTHER FINANCIAL DATA: | | | | | | | | | | | | | | | | | | | | | | | | | | | | | | | | |
EBITDA | | $ | 68,662 | | | $ | 123,537 | | | $ | 94,418 | | | $ | 24,716 | | | $ | 26,413 | | | $ | 94,418 | | | $ | 26,413 | | | $ | 96,115 | |
Adjusted EBITDA | | | 68,662 | | | | 123,537 | | | | 100,760 | | | | 24,716 | | | | 26,413 | | | | 100,760 | | | | 26,413 | | | | 102,457 | |
Capital expenditures | | | 8,777 | | | | 10,612 | | | | 11,939 | | | | 2,798 | | | | 4,025 | | | | 11,939 | | | | 4,025 | | | | 13,166 | |
SELECTED OPERATING INFORMATION: | | | | | | | | | | | | | | | | | | | | | | | | | | | | | | | | |
Revenue-generating professionals | | | 610 | | | | 827 | | | | 745 | | | | 737 | | | | 785 | | | | | | | | | | | | | |
Utilization rates | | | 88 | % | | | 83 | % | | | 77 | % | | | 80 | % | | | 81 | % | | | | | | | | | | | | |
Average billing rate per hour | | $ | 311 | | | $ | 363 | | | $ | 354 | | | $ | 357 | | | $ | 341 | | | | | | | | | | | | | |
CREDIT STATISTICS: | | | | | | | | | | | | | | | | | | | | | | | | | | | | | | | | |
Adjusted EBITDA to cash interest expense | | | 16.8 | x | | | 34.8 | x | | | 20.3 | x | | | 19.7 | x | | | 19.0 | x | | | 5.2 | x | | | 5.4 | x | | | 5.0 | x |
Total debt to Adjusted EBITDA | | | 1.4 | x | | | 1.0 | x | | | 1.0 | x | | | 1.4 | x | | | 1.2 | x | | | 3.0 | x | | | 2.8 | x | | | 2.9 | x |
Ratio of earnings to fixed charges | | | 9.2 | x | | | 14.3 | x | | | 8.3 | x | | | 5.6 | x | | | 8.0 | x | | | 3.1 | x | | | 3.6 | x | | | 3.2 | x |
| | | | | | |
| | | March 31, 2005
|
| | | Actual
| | As Adjusted
|
| | | (in thousands) |
| | | (unaudited) |
BALANCE SHEET DATA: | | | | | | |
Cash and cash equivalents | | $ | 3,772 | | $ | 51,272 |
Working capital | | | 70,907 | | | 161,485 |
Total assets | | | 743,128 | | | 819,251 |
Long-term debt, including current portion | | | 122,500 | | | 300,000 |
Stockholders’ equity | | | 520,453 | | | 419,654 |
8
Reconciliation of Net Income to Adjusted EBITDA
| | | | | | | | | | | | | | | | | | | | | |
| | | Year Ended December 31,
| | | Three Months Ended
| | Pro Forma LTM Period
| |
| | | 2002
| | | 2003
| | 2004
| | | March 31,
2004
| | March 31,
2005
| |
| | | (in thousands) | |
Reconciliation of Net Income to Adjusted EBITDA: | | | | | | | | | | | | | | | | | | | | | |
Net income | | $ | 37,162 | | | $ | 59,469 | | $ | 42,878 | | | $ | 11,517 | | $ | 12,475 | | $ | 43,836 | |
(Income) loss from discontinued operations | | | (2,254 | ) | | | 5,322 | | | — | | | | — | | | — | | | — | |
Income tax provision | | | 23,704 | | | | 44,838 | | | 31,177 | | | | 7,971 | | | 9,033 | | | 32,239 | |
Litigation settlement gains, net | | | — | | | | — | | | (1,672 | ) | | | — | | | — | | | (1,672 | ) |
Discount on note receivable(1) | | | — | | | | — | | | 475 | | | | — | | | — | | | 475 | |
Interest and other expenses, net | | | 4,717 | | | | 4,196 | | | 5,611 | | | | 1,407 | | | 1,555 | | | 5,759 | |
| | |
|
|
| |
|
| |
|
|
| |
|
| |
|
| |
|
|
|
EBIT | | | 63,329 | | | | 113,825 | | | 78,469 | | | | 20,895 | | | 23,063 | | | 80,637 | |
Depreciation and other amortization | | | 5,333 | | | | 9,712 | | | 15,949 | | | | 3,821 | | | 3,350 | | | 15,478 | |
| | |
|
|
| |
|
| |
|
|
| |
|
| |
|
| |
|
|
|
EBITDA | | | 68,662 | | | | 123,537 | | | 94,418 | | | | 24,716 | | | 26,413 | | | 96,115 | |
Loss from subleases | | | — | | | | — | | | 4,670 | | | | — | | | — | | | 4,670 | |
Litigation settlement gains, net | | | — | | | | — | | | 1,672 | | | | — | | | — | | | 1,672 | |
| | |
|
|
| |
|
| |
|
|
| |
|
| |
|
| |
|
|
|
Adjusted EBITDA | | $ | 68,662 | | | $ | 123,537 | | $ | 100,760 | | | $ | 24,716 | | $ | 26,413 | | | 102,457 | |
| | |
|
|
| |
|
| |
|
|
| |
|
| |
|
| |
|
|
|
| (1) | For the year ended December 31, 2004, interest expense, net, includes a $475,000 discount on a note receivable due from the purchaser of one of our former subsidiaries. We discounted this note by $475,000 in exchange for payment of the note ahead of its maturity in 2010. We received this prepayment in January 2005. |
9
UNAUDITED PRO FORMA CONDENSED CONSOLIDATED FINANCIAL INFORMATION
The following unaudited pro forma condensed consolidated financial statements have been derived by the application of pro forma adjustments to our historical consolidated financial statements. The unaudited pro forma condensed consolidated balance sheet as of March 31, 2005 gives effect to the Transactions as if they had occurred as of March 31, 2005. The unaudited pro forma condensed consolidated income statements for the year ended December 31, 2004 and the three months ended March 31, 2005 give effect to the Transactions (as defined below) as if they had occurred as of January 1, 2004. The unaudited pro forma condensed consolidated financial statements do not purport to represent what our results of operations or financial position would have been as if the Transactions had occurred on the dates indicated and are not intended to project our results of operations or financial position for any future period or date.
The term “Transactions” means, collectively:
| | • | | the repayment of all outstanding term loan borrowings under our senior secured credit facility; |
| | • | | repurchases of shares of our common stock in the amount of $100.0 million in connection with the Offerings; and |
| | • | | our payment of estimated fees and expenses incurred in connection with the foregoing. |
When we use the term “Transactions,” we assume that the initial purchasers will not exercise their option to purchase additional convertible notes and the Call Spread will not be entered into.
The unaudited pro forma adjustments are based on preliminary estimates, available information and certain assumptions that we believe are reasonable and may be revised as additional information becomes available. The pro forma adjustments and primary assumptions are described in the accompanying notes. You should read our unaudited pro forma condensed consolidated financial statements and the related notes hereto in conjunction with our historical consolidated financial statements and the related notes thereto and other information contained in “Use of Proceeds,” “Capitalization,” “Selected Financial Data,” “Management’s Discussion and Analysis of Financial Condition and Results of Operations” and the consolidated financial statements and related notes thereto included elsewhere in this offering circular.
10
FTI CONSULTING, INC.
UNAUDITED PRO FORMA CONDENSED CONSOLIDATED BALANCE SHEET
AS OF MARCH 31, 2005
| | | | | | | | | |
| | | Historical
| | Adjustments
| | | Pro
Forma
|
| | | (in thousands) |
| | | |
Assets | | | | | | | | | |
Current assets | | | | | | | | | |
Cash and cash equivalents | | $ | 3,772 | | 290,000 | (a) | | $ | 51,272 |
| | | | | | (142,500 | )(b) | | | |
| | | | | | (100,000 | )(d) | | | |
Cash held for debt repayment | | | — | | 20,000 | (b) | | | 20,000 |
Accounts receivable, net | | | 129,912 | | | | | | 129,912 |
Prepaid expenses and other current assets | | | 11,866 | | | | | | 11,866 |
Deferred income taxes | | | 6,002 | | | | | | 6,002 |
| | |
|
| | | | |
|
|
Total current assets | | | 151,552 | | | | | | 219,052 |
Property and equipment, net | | | 24,720 | | | | | | 24,720 |
Goodwill | | | 535,083 | | | | | | 535,083 |
Other intangible assets, net | | | 17,329 | | | | | | 17,329 |
Other assets | | | 14,444 | | 10,000 | (a) | | | 23,067 |
| | | | | | (1,377 | )(c) | | | |
| | |
|
| | | | |
|
|
Total assets | | $ | 743,128 | | | | | $ | 819,251 |
| | |
|
| | | | |
|
|
| | | |
Liabilities and Stockholders’ Equity | | | | | | | | | |
Current liabilities | | | | | | | | | |
Accounts payable, accrued expenses and other | | $ | 17,347 | | (578 | )(c) | | $ | 16,769 |
Accrued compensation | | | 31,276 | | | | | | 31,276 |
Current portion of long-term debt | | | 22,500 | | (22,500 | )(b) | | | — |
Billings in excess of services provided | | | 9,522 | | | | | | 9,522 |
| | |
|
| | | | |
|
|
Total current liabilities | | | 80,645 | | | | | | 57,567 |
| | | |
Term loans, net of current portion | | | 77,500 | | (77,500 | )(b) | | | — |
Revolving credit facility | | | 22,500 | | (22,500 | )(b) | | | — |
Senior notes | | | — | | 175,000 | (a) | | | 175,000 |
Convertible notes | | | — | | 125,000 | (a) | | | 125,000 |
Deferred rent, capital lease obligations and other, net of current portion | | | 13,086 | | | | | | 13,086 |
Deferred income taxes | | | 28,944 | | | | | | 28,944 |
Stockholders’ equity | | | 520,453 | | (799 | )(c) | | | 419,654 |
| | | | | | (100,000 | )(d) | | | |
| | |
|
| | | | |
|
|
Total liabilities and stockholders’ equity | | $ | 743,128 | | | | | $ | 819,251 |
| | |
|
| | | | |
|
|
See accompanying notes to unaudited pro forma condensed consolidated financial statements.
11
FTI CONSULTING, INC.
UNAUDITED PRO FORMA CONDENSED CONSOLIDATED INCOME STATEMENTS
| | | | | | | | | | | | | | | | | | | | | | |
| | | Year Ended December 31, 2004
| | | Three Months Ended March 31, 2005
| |
| | | Historical
| | | Adjustments
| | | Pro
Forma
| | | Historical
| | | Adjustments
| | | Pro
Forma
| |
| | | (in thousands, except per share data) | |
INCOME STATEMENT DATA | | | | | | | | | | | | | | | | | | | |
Revenues | | $ | 427,005 | | | | | | $ | 427,005 | | | $ | 116,614 | | | | | | $ | 116,614 | |
Direct cost of revenues | | | 234,970 | | | | | | | 234,970 | | | | 64,345 | | | | | | | 64,345 | |
Selling, general and administrative expense | | | 102,060 | | | | | | | 102,060 | | | | 28,457 | | | | | | | 28,457 | |
Loss on abandoned facilities | | | 4,670 | | | | | | | 4,670 | | | | — | | | | | | | — | |
Amortization of other intangibles | | | 6,836 | | | | | | | 6,836 | | | | 749 | | | | | | | 749 | |
| | |
|
|
| | | | |
|
|
| |
|
|
| | | | |
|
|
|
Operating income | | | 78,469 | | | | | | | 78,469 | | | | 23,063 | | | | | | | 23,063 | |
Interest and other expenses, net | | | (6,086 | ) | | (20,802 | )(e) | | | (22,696 | ) | | | (1,555 | ) | | (5,200 | )(e) | | | (5,240 | ) |
| | | | | | | 4,192 | (f) | | | | | | | | | | 1,515 | (f) | | | | |
Litigation settlement gains, net | | | 1,672 | | | | | | | 1,672 | | | | — | | | | | | | — | |
| | |
|
|
| | | | |
|
|
| |
|
|
| | | | |
|
|
|
Income from operations, before income tax provision | | | 74,055 | | | | | | | 57,445 | | | | 21,508 | | | | | | | 17,823 | |
Income tax provision | | | 31,177 | | | (6,993 | )(g) | | | 24,184 | | | | 9,033 | | | (1,548 | )(g) | | | 7,485 | |
| | |
|
|
| | | | |
|
|
| |
|
|
| | | | |
|
|
|
Net income | | $ | 42,878 | | | | | | $ | 33,261 | | | $ | 12,475 | | | | | | $ | 10,338 | |
| | |
|
|
| | | | |
|
|
| |
|
|
| | | | |
|
|
|
Earnings per common share—net income | | | | | | | | | | | | | | | | | | | | | | |
Basic | �� | $ | 1.02 | | | | | | $ | 0.89 | | | $ | 0.29 | | | | | | $ | 0.28 | |
| | |
|
|
| | | | |
|
|
| |
|
|
| | | | |
|
|
|
Diluted | | $ | 1.01 | | | | | | $ | 0.88 | | | $ | 0.29 | | | | | | $ | 0.27 | |
| | |
|
|
| | | | |
|
|
| |
|
|
| | | | |
|
|
|
Weighted average number of common shares outstanding | | | | | | | | | | | | | | | | | | | | | | |
Basic | | | 42,099 | | | (4,762 | )(d) | | | 37,337 | | | | 42,319 | | | (4,762 | )(d) | | | 37,557 | |
| | |
|
|
| | | | |
|
|
| |
|
|
| | | | |
|
|
|
Diluted(h) | | | 42,512 | | | (4,762 | )(d) | | | 37,750 | | | | 42,741 | | | (4,762 | )(d) | | | 37,979 | |
| | |
|
|
| | | | |
|
|
| |
|
|
| | | | |
|
|
|
See accompanying notes to unaudited pro forma condensed consolidated financial statements.
12
NOTES TO UNAUDITED PRO FORMA CONDENSED CONSOLIDATED INCOME STATEMENTS
Adjustments to the unaudited pro forma condensed consolidated balance sheet as of March 31, 2005 and income statements for the year ended December 31, 2004 and the three months ended March 31, 2005 are presented below:
| | (a) | Adjustment to record the issuance of $175.0 million in senior notes and $125.0 million in convertible notes and the payment of related fees and expenses that we estimate will be $10.0 million, of which we attribute $5.4 million to the senior notes and $4.6 million to the convertible notes. Assumes that the initial purchasers’ option to purchase additional convertible notes is not exercised. |
| | (b) | In connection with the Transactions, we intend to use the net proceeds from the Offerings to repay the entire amount outstanding under our senior secured credit facility, including $100.0 million in term loans and $22.5 million of borrowings under our revolving line of credit that were outstanding as of March 31, 2005 and $20.0 million of net incremental borrowings drawn subsequent to that date. The $20.0 million of net incremental borrowings are not reflected in our balance sheet as of March 31, 2005, therefore we have classified the net proceeds that will be used to repay these borrowings as cash held for debt repayment in the pro forma balance sheet. |
| | (c) | Adjustment to record the write-off of the deferred financing costs related to the prepayment of the term loans in the amount of $1.4 million, net of income taxes of $0.6 million which we computed using our effective tax rate of 42.0%. In April 2005, we amended our senior secured credit facility and incurred $0.7 million of debt financing costs. We intend to apply $142.5 million of net proceeds from the Offerings toward repayment of all outstanding term loan borrowings under our senior secured credit facility. At that time, we will write-off approximately $1.8 million of deferred financing costs. |
| | (d) | Represents the repurchase of $100.0 million of our common stock at an assumed price of $21.00 per share. |
| | (e) | Adjustment represents pro forma interest expense on $175.0 million in senior notes and on $125.0 million in convertible notes, all of which are outstanding for each period presented. In addition the adjustment includes amortization of deferred financing costs of $5.4 million related to the senior notes over an eight-year period and $4.6 million related to the convertible notes over a seven-year period. |
| | (f) | Represents the elimination of interest expense due to repayment of amounts due under our senior secured credit facility and term loans, including the amortization of deferred financing costs attributable to our term loans. See note (c). |
| | (g) | Represents the income tax effect of the pro forma adjustments described in notes (e) and (f) calculated at our effective tax rate which was 42.1% for the year ended December 31, 2004 and 42.0% during the three-months ended March 31, 2005. |
| | (h) | The convertible notes will have a dilutive effect on earnings per share in any period in which, on the last day of such period, the market price of our common stock exceeds the conversion price for the convertible notes even if the convertible notes are not convertible. |
13