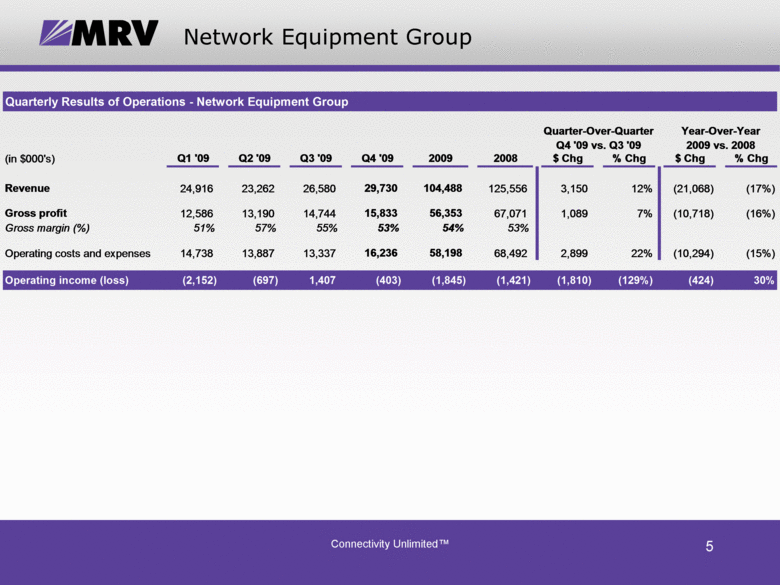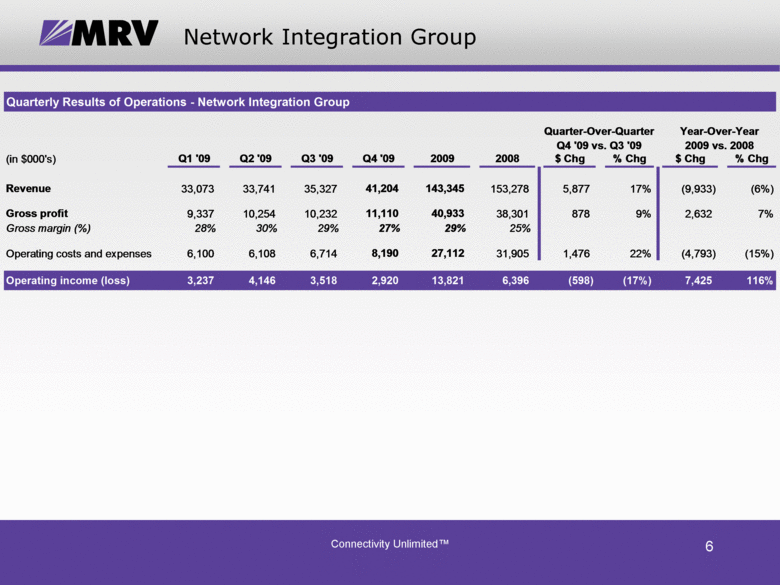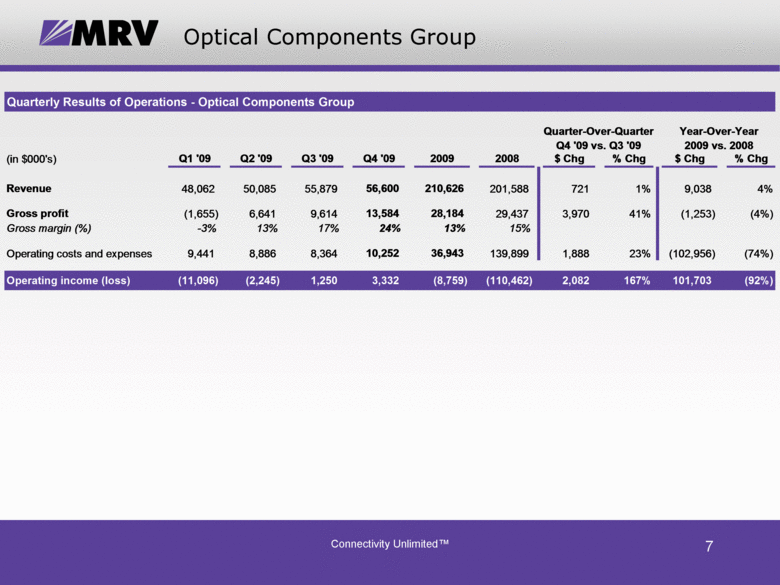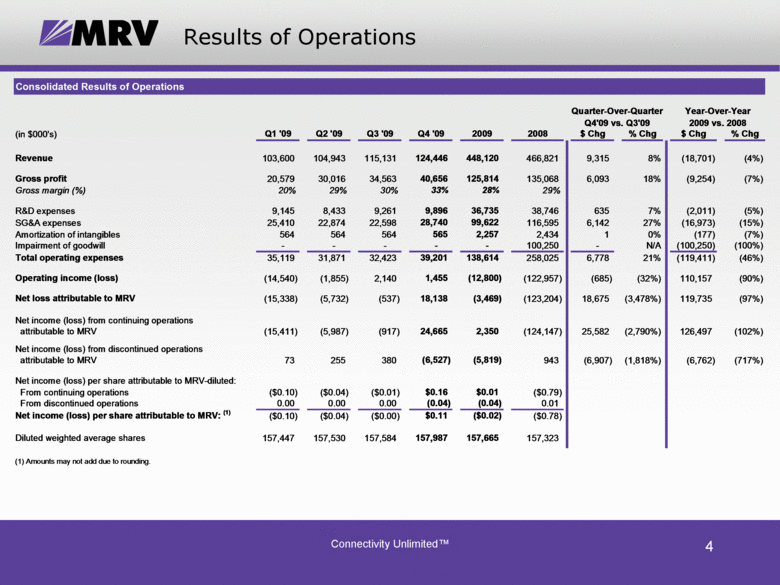
| Results of Operations Consolidated Results of Operations (in $000's) Q1 '09 Q2 '09 Q3 '09 Q4 '09 2009 2008 $ Chg % Chg $ Chg % Chg Revenue 103,600 104,943 115,131 124,446 448,120 466,821 9,315 8% (18,701) (4%) Gross profit 20,579 30,016 34,563 40,656 125,814 135,068 6,093 18% (9,254) (7%) Gross margin (%) 20% 29% 30% 33% 28% 29% R&D expenses 9,145 8,433 9,261 9,896 36,735 38,746 635 7% (2,011) (5%) SG&A expenses 25,410 22,874 22,598 28,740 99,622 116,595 6,142 27% (16,973) (15%) Amortization of intangibles 564 564 564 565 2,257 2,434 1 0% (177) (7%) Impairment of goodwill - - - - - 100,250 - N/A (100,250) (100%) Total operating expenses 35,119 31,871 32,423 39,201 138,614 258,025 6,778 21% (119,411) (46%) Operating income (loss) (14,540) (1,855) 2,140 1,455 (12,800) (122,957) (685) (32%) 110,157 (90%) Net loss attributable to MRV (15,338) (5,732) (537) 18,138 (3,469) (123,204) 18,675 (3,478%) 119,735 (97%) Net income (loss) from continuing operations attributable to MRV (15,411) (5,987) (917) 24,665 2,350 (124,147) 25,582 (2,790%) 126,497 (102%) Net income (loss) from discontinued operations attributable to MRV 73 255 380 (6,527) (5,819) 943 (6,907) (1,818%) (6,762) (717%) Net income (loss) per share attributable to MRV-diluted: From continuing operations ($0.10) ($0.04) ($0.01) $0.16 $0.01 ($0.79) From discontinued operations 0.00 0.00 0.00 (0.04) (0.04) 0.01 Net income (loss) per share attributable to MRV: (1) ($0.10) ($0.04) ($0.00) $0.11 ($0.02) ($0.78) Diluted weighted average shares 157,447 157,530 157,584 157,987 157,665 157,323 (1) Amounts may not add due to rounding. Q4'09 vs. Q3'09 Year-Over-Year 2009 vs. 2008 Quarter-Over-Quarter |
